trancep: predicting the substrate class of transmembrane
TRANSCRIPT

RESEARCH ARTICLE
TranCEP: Predicting the substrate class of
transmembrane transport proteins using
compositional, evolutionary, and positional
information
Munira AlballaID1,2, Faizah AplopID
3, Gregory ButlerID1,4*
1 Department of Computer Science and Software Engineering, Concordia University, Montreal, Quebec,
Canada, 2 College of Computer and Information Sciences, King Saud University, Riyadh, Saudi Arabia,
3 School of Informatics and Applied Mathematics, Universiti Malaysia Terengganu, Malaysia, 4 Centre for
Structural and Functional Genomics, Concordia University, Montreal, Quebec, Canada
Abstract
Transporters mediate the movement of compounds across the membranes that separate
the cell from its environment and across the inner membranes surrounding cellular compart-
ments. It is estimated that one third of a proteome consists of membrane proteins, and
many of these are transport proteins. Given the increase in the number of genomes being
sequenced, there is a need for computational tools that predict the substrates that are trans-
ported by the transmembrane transport proteins. In this paper, we present TranCEP, a pre-
dictor of the type of substrate transported by a transmembrane transport protein. TranCEP
combines the traditional use of the amino acid composition of the protein, with evolutionary
information captured in a multiple sequence alignment (MSA), and restriction to important
positions of the alignment that play a role in determining the specificity of the protein. Our
experimental results show that TranCEP significantly outperforms the state-of-the-art pre-
dictors. The results quantify the contribution made by each type of information used.
Introduction
Transmembrane proteins are gates that organize a variety of vital cellular functions including
cell signaling, trafficking, metabolism, and energy production. It is estimated that, on average,
one in every three proteins in a cell is a membrane protein [1, 2]. Any defective or misregu-
lated membrane protein can disturb the organism’s functioning, giving rise to disease [3].
About one-half of the drug targets today are membrane proteins, such as transporters or
related receptors [4]. While the amino acid sequence of many membrane proteins is available,
they are among the least characterized proteins in terms of their structure and function. For
example, only 3% of the structures in the Protein Data Bank [5] are transmembrane proteins.
Numerous genome projects have produced an abundance of protein sequences, many of
which remain uncharacterized. Transmembrane proteins are among the least characterized
PLOS ONE | https://doi.org/10.1371/journal.pone.0227683 January 14, 2020 1 / 23
a1111111111
a1111111111
a1111111111
a1111111111
a1111111111
OPEN ACCESS
Citation: Alballa M, Aplop F, Butler G (2020)
TranCEP: Predicting the substrate class of
transmembrane transport proteins using
compositional, evolutionary, and positional
information. PLoS ONE 15(1): e0227683. https://
doi.org/10.1371/journal.pone.0227683
Editor: Alexandre G. de Brevern, UMR-S1134,
INSERM, Universite Paris Diderot, INTS, FRANCE
Received: April 12, 2019
Accepted: December 26, 2019
Published: January 14, 2020
Copyright: © 2020 Alballa et al. This is an open
access article distributed under the terms of the
Creative Commons Attribution License, which
permits unrestricted use, distribution, and
reproduction in any medium, provided the original
author and source are credited.
Data Availability Statement: All software and data
is available at https://github.com/bioinformatics-
group/TranCEP.
Funding: The author(s) received no specific
funding for this work.
Competing interests: The authors have declared
that no competing interests exist.

proteins, because experimental characterization of their structure and function is exception-
ally difficult, owing to their hydrophobic surfaces and their lack of conformational stability.
Consequently, there is an urgent need for computational approaches in which the available
data is used to distinguish and characterize transmembrane proteins. Yet, this area of
research is still in its early stages, and the researchers are far from finding a definitive
solution.
Existing tools for the annotation of transporters that predict the substrate of the transport
reaction lag behind tools for other kinds of proteins such as enzymes for metabolic reactions.
Most tools predict the type of substrates [6–10], chosen from a small subset of substrate types,
without attempting to predict the specific substrate, or predict the family or subfamily [9, 11–
13] of the protein within the transporter classification (TC) [14–16], and again without
attempting to predict the specific substrate. For network modeling in systems biology [17, 18],
we require tools to process the complete proteome and predict each transport reaction; this
means identifying the transport protein and the specific substrate.
Many tools rely simply on homology or orthology to predict transporters. This includes
metabolic network tools merlin [19], and Pantograph [20], as well as our system TransATH
[21]. Amongst the tools for de novo prediction of substrate class, the Transporter Substrate
Specificity Prediction (TrSSP) [10] claims to be the state-of-the-art.
Our previous efforts [22] for de novo prediction of specific substrates for sugar transport-
ers in fungi were not successful. However, from it we learned how much depends on very
few residues of the transporter; often three or so residues, and often internal to different
helix transmembrane segments (TMSs) of the transporter [23]. These residues are far apart
in the linear protein sequence, but are close to each other in the three-dimensional structure
of the protein when integrated in the membrane. In looking forward to how we might
improve on approaches that rely on the amino acid composition of the protein, we devel-
oped a roadmap, whereby the composition information would be combined with evolution-
ary information as captured by an MSA, and by positional information [24] about the
residues responsible for determining the specificity of the transporter. This roadmap is a
schema for a large number of possible algorithms due to the many choices for encoding of
amino acid composition, MSA algorithms, and algorithms for specificity determining sites
[25]. We also realized the importance of the alignment preserving the TMS positions, since
the important residue positions seem to be located there. There are a number of such MSA
algorithms [26–29].
We therefore conducted a preliminary study, which indicated that the combination of
information about protein composition, protein evolution, and the specificity determining
positions had a significant impact on our ability to predict the transported substrates. We
chose the methodology and datasets of TrSSP [10] as our baseline, and varied this to illustrate
the impact of each of the factors: compositional, evolutionary, and positional information. Our
best approach, which defines the predictor we call TranCEP (an abbreviation of transporter
substrate prediction using compositional, evolutionary, and positional information), involves
utilizing the pair amino acid composition (PAAC) encoding scheme, the TM-Coffee [27]
MSA algorithm, and the transitive consistency score (TCS) [30] algorithm for determining
informative positions in the MSA, to build a suite of support vector machine (SVM) classifiers,
one for distinguishing between each pair of classes of substrates.
Background
For most of the work done on the prediction of transport proteins [3], there is no available
software, so it is difficult to reproduce the work and to compare the results of different articles.
TranCEP: Predicting the substrate class of transmembrane transport proteins
PLOS ONE | https://doi.org/10.1371/journal.pone.0227683 January 14, 2020 2 / 23

Pathway tools includes the Transport Inference Parser (TIP) [31], which analyses keywords
in a gene annotation to assign gene-protein-reaction associations to transport reactions in
MetaCyc [32].
The Genome-Blast (G-Blast) [33] screens proteins against all the entries in Transporter
Classification Database (TCDB) [34] using Blast to retrieve the top hit, and HMMTOP [35] to
determine the TMS for the query and the hit sequence. It is an integral part of a manual proto-
col of Saier’s lab to predict the transport proteins for a genome [36].
The Zhao Lab has developed three methods: a nearest neighbour approach [37]; Trans-
portTP [12]; and TrSSP [10]. The nearest neighbour approach achieved a balanced accuracy of
67.0%.
The TransportTP [12] is a two-phase algorithm that combines homology and machine
learning to predict the TC family of one or more proteins. For training and cross-validation
testing, TransportTP used the yeast proteome. When testing, it used 10 genomes from the
TransportDB database [38] of annotated prokaryote transporters. As an independent test,
TransportTP was trained on the proteome of A. thaliana and then used to predict the trans-
porters in four other plant proteomes. TransportTP achieved a balanced accuracy of 81.8%.
Compared with the SVM-Prot classifier [39], on the five TC superfamilies and three families
used by SVM-Prot, TransportTP achieved better recall and precision.
The TrSSP [10] is a web server utilized to predict membrane transport proteins and their
substrate category. The substrate categories are: (1) oligopeptide (amino acid), (2) anion, (3)
cation, (4) electron, (5) protein/mRNA, (6) sugar, and (7) other. TrSSP makes a top-level pre-
diction of whether the protein is a transporter, or not. An SVM is applied, with the highest
accuracy being reported when using amino acid index (AAindex) and position-specific scoring
matrix (PSSM) features.
The disc_function system [11] uses amino acid composition and neural networks to dis-
criminate channels/pores, electrochemical and active transporters, with an accuracy of 68%.
When augmented with PSSM profiles and amino acid physicochemical properties it gained
5–10% in discrimination accuracy [13]. They also considered six major families in TCDB [13]
with an average accuracy of 69%.
The TTRBF [7] considers four major classes of substrates: (1) electron, (2) protein/mRNA,
(3) ion, and (4) other. It is an ensemble system combining amino acid composition, dipeptide
composition, physicochemical properties, PSSM profiles and radial basis function (RBF)
networks.
Schaadt et al. [6] used amino acid composition, characteristics of amino acid residues
and conservation to detect transporters based on four classes of substrate: (1) amino acid,
(2) oligopeptide, (3) phosphate, and (4) hexose. The number of characterized transporters
in A. thaliana for the four substrates was from 13 to 17. They constructed a vector for each
protein using various types of amino acid composition, and used Euclidean distance from
the query protein’s vector to the known vectors to rank the substrate categories. They found
that the PAAC performed as well as the more complicated features, yielding an accuracy of
over 90%.
Schaadt and Helms [8] compared the similarity of transporters in the TCDB and annotated
transporters in A. thaliana using amino acid composition and classified the proteins into three
families. By distinguishing the amino acid composition of TMS and non-TMS regions, they
could classify four different families with an accuracy of 80%.
Barghash and Helms [9] performed a comparison of three different approaches (homology,
HMMER, MEME) to predict the substrate category and predicting TC family. They used four
substrate categories, namely metal ions, phosphate, sugar, and amino acid; and the 29 TC
families with the most examples. The datasets were from E. coli, S. cerevisiae, and A. thaliana,
TranCEP: Predicting the substrate class of transmembrane transport proteins
PLOS ONE | https://doi.org/10.1371/journal.pone.0227683 January 14, 2020 3 / 23

consisting of the 155, 158 and 177 proteins, respectively, that had both a substrate annotation
and TC family annotation that were experimentally determined.
The merlin [19] system for the reconstruction of metabolic networks handles eukaryote
genomes, and includes the determination of transport gene-protein-reaction associations, as
well as the localization of reactions across a number of cellular compartments: mitochondrion,
endoplasmic reticulum (ER), and Golgi apparatus. In merlin, transport proteins are predicted
based on the existence of TMS as predicted by TMHMM, and by similarity to entries in the
TCDB using the Smith-Waterman algorithm [40]. The association of transport reactions and
specific substrates for the predicted transport proteins were originally taken from a manually
curated database of some 4,000 TCDB entries originally. It now incorporates Transport Reac-tions Annotation and Generation (TRIAGE) [41], with information for 5,495 TCDB entries.
The merlin software is available as open source Java code (http://www.merlin-sysbio.org).
The Pantograph [20] is designed for the metabolic pathway reconstruction of yeasts such as
Yarrowia lipolytica [42], which accumulates lipids in the peroxisome of the cell. It specifically
models the cellular components and the transport across the membranes in a reference tem-
plate, called the scaffold model. The Pantograph method relies on a database of profile HMMs
for fungal protein families and their annotations, which is maintained at Genolevures in Bor-
deaux. The Pantograph algorithm first assigns gene-protein-reaction associations, and then
decides which compartments and reactions to include in the draft model based on these asso-
ciations. The scaffold model, which is the reference template for Pantograph, was manually
curated to include 421 transport reactions. The associated transport protein families of ortho-
logs were manually identified for Genolevures collection. The Pantograph software, written in
Python, is available at http://pathtastic.gforge.inria.fr/. The distribution includes the scaffold
model in Systems Biology Markup Language (SBML).
The Transporters via Annotation Transfer by Homology (TransATH) [21] is a system that
automates Saier’s protocol based on sequence similarity. The TransATH includes the compu-
tation of subcellular localization and improves the computation of TMSs. The parameters of
TransATH are chosen for optimal performance on a gold standard set of transporters and
non-transporters from S. cerevisiae. A website http://transath.umt.edu.my for TransATH is
available for use.
The SCMMTP [43] has a novel scoring card method (SCM) that utilizes the dipeptide com-
position to identify putative membrane transport proteins. The SCMMTP method first builds
an initial matrix of 400 dipeptides and uses the difference between compositions of positives
and negatives as an initial dipeptide scoring matrix. This matrix is then optimized using a
genetic algorithm. SCMMP achieved an overall accuracy of 76.11% and Matthews correlation
coefficient (MCC) of 0.47 on the independent dataset.
Li et al [44] tool uses an SVM model to predict substrate classes of transmembrane trans-
port proteins by integrating features from PSSM, amino acid composition, biochemical prop-
erties and gene ontology (GO) [45] terms. The tool achieved an overall accuracy of 80.45% on
the independent dataset.
Materials and methods
Datasets
We used the same training dataset and test dataset as TrSSP by Mishra et al. [10] which are
available at http://bioinfo.noble.org/TrSSP. This benchmark dataset was collected from the
Swiss-Prot database (release 2013-03). The dataset initially contained 10,780 transporter, car-
rier, and channel proteins that were well characterized at the protein level and had clear sub-
strate annotations. Then, Mishra et al. removed the transporters with more than two substrate
TranCEP: Predicting the substrate class of transmembrane transport proteins
PLOS ONE | https://doi.org/10.1371/journal.pone.0227683 January 14, 2020 4 / 23

specificities, sequences with biological function annotations based solely on sequence similar-
ity, and sequences with greater than 70% similarity. Mishra et al.’s final transporter dataset
contains 900 transporters divided into seven substrate classes: amino acid, anion, cation, elec-tron, protein/mRNA, sugar, and other. The latter refers to transporters that do not belong to
any of the previous six classes. Table 1 shows the dataset details with the size of each class.
Databases
We used the Swiss-Prot database when searching for similar sequences. When construct-
ing MSAs, we used TM-Coffee [27] with the UniRef50-TM database, which consists of the
entries in UniRef50 that have keyword transmembrane.The TrSSP dataset was derived from the Swiss-Prot database, so we made sure to
remove all entries in dataset from the two databases that we used.
Algorithm
Fig 1 illustrates the steps of TranCEP. The sequence (a) in this case, according to TM-Coffee,
has four TMSs, as shown by the gray shading. The example focuses on the first TMS, and
abbreviates the middle section of the sequence. Part (b) shows an MSA conserving the TMS
structure constructed by TM-Coffee, where the gray shading indicates the TMS location. Part
(c) shows the colour coding of the reliability index of each column as determined by TCS, and
shows how gaps replace unreliable columns in the filtered MSA. Part (d) shows a part of the
400-dimensional vector of dipeptide frequencies (PAAC) from the filtered MSA.
The template for combining evolutionary, positional, and compositional information is
presented in Algorithm 1. In this work, we used TM-Coffee to compute the MSA that con-
serves the TMSs, and TCS to determine a reliability index for each position (column) in the
MSA. We experimented with three composition schemes: amino acid composition (AAC),
pairwise amino acid composition (PAAC), and pseudo-amino acid composition (PseAAC), as
well as the optional use of TM-Coffee (TMC) and the transitive consistency score (TCS).
Algorithm 1. Template for constructing the composition vector.function COMP_VEC(seq s)// Evolutionary (E) Step, optionalConstruct an MSA from s// Positional (P) Step, optionalDetermine the informative positions (columns) in the MSAFilter the uninformative positions from the MSA// Composition (C) Step, mandatoryreturn vector encoding composition of the filtered MSA
end function
Table 1. The dataset.
Substrate class Training dataset Test dataset
Amino acid 70 15
Anion 60 12
Electron 60 10
Cation 260 36
Protein/mRNA 70 15
Sugar 60 12
Other 200 20
Total 780 120
https://doi.org/10.1371/journal.pone.0227683.t001
TranCEP: Predicting the substrate class of transmembrane transport proteins
PLOS ONE | https://doi.org/10.1371/journal.pone.0227683 January 14, 2020 5 / 23

A template for the algorithm showing the role of evolutionary (E), positional (P), and com-
position (C) information. Note that the use of evolutionary (E) and positional (P) is optional;
and that if positional (P) information is used then it requires evolutionary (E) information in
the form of Multiple Sequence Alignment (MSA). Note that if Step (E) is not done, then Step
(C) encodes the sequence s. Note that if Step (E) is done but Step (P) MSA is not done, then
Step (C) encodes the MSA.
Algorithm 2 shows the composition vectors being used to build a set of classifiers; SVM
classifiers in this case. Algorithm 3 shows the prediction algorithm.
Algorithm 2. Build SVM classifiers.Require: a training set T of sequences labelled with classes C1, . . ., CnEnsure: a set of SVM’s svm(i, j) distinguishing class Ci and Cjprocedure BUILD_SVMS(T: set of seq; svm: set of SVM)for all seq s in T dov(s) COMP_VEC(s)
end forfor all pair (Ci, Cj) of classes dosvm(i, j) SVM.build({v(s): s 2 T \ (Ci [ Cj)})
end forend procedure
Fig 1. Example of steps of TranCEP. The figure illustrates the steps of TranCEP. Note that we abbreviated the middle section of the sequence. Part (a) shows the
sequence the four TMSs in gray shading. Part (b) shows an MSA constructed by TM-Coffee. Gray shading indicates a TMS. Part (c) shows the color coding of the
reliability index of each column as determined by TCS, and shows gaps in unreliable columns in the filtered MSA. Part (d) shows a 400-dimensional PAAC vector
from the filtered MSA.
https://doi.org/10.1371/journal.pone.0227683.g001
TranCEP: Predicting the substrate class of transmembrane transport proteins
PLOS ONE | https://doi.org/10.1371/journal.pone.0227683 January 14, 2020 6 / 23

The algorithm to build a set of SVM classifiers to distinguish between each pair of classes
in the training set. The actual construction of each SVM was done by an SVM package’s build
function.
Algorithm 3. Prediction.Require: test sequence sRequire: a set of SVM’s svm(i, j) distinguishing classes Ci and CjEnsure: result is predicted class Cpfunction PREDICT_CLASS(seq s)v COMP_VEC(s)for all pair (Ci, Cj) of classes doc(i, j) svm(i, j) applied to v
end forp mode of c(i, j) for all pairs (i, j)return Cp
end functionThe prediction algorithm that applies each of the SVMs, and takes the class that is predicted
most often by the set of SVMs.
Encoding amino acid composition
The properties of the amino acids at each position in the protein sequence can be encoded into
vectors that summarize the overall composition of the protein. Three approaches to encoding
amino acid composition were implemented in this study: AAC, PAAC, and PseAAC.
The amino acid composition (AAC) is the normalized occurrence frequency of each amino
acid. The fractions of all 20 natural amino acids are calculated as:
ci ¼FiL
i ¼ ð1; 2; 3; . . . 20Þ ð1Þ
where Fi is the frequency of the ith amino acid in sequence P, and L is the length of the
sequence. The AAC is represented as a vector of size 20:
AACðPÞ ¼ ½c1; c2; c3; . . . ; c20� ð2Þ
where ci is the composition of ith amino acid.
The pair amino acid composition (PAAC) is the normalized frequency of each pair of amino
acids. The PAAC is calculated as
di;j ¼Fi;j
L � 1i; j ¼ ð1; 2; 3; . . . 20Þ ð3Þ
where Fi,j is the frequency of the ith and jth amino acids as a pair (dipeptide) adjacent to each
other in the sequence P, and L is the length of the sequence. The PAAC is represented as a vec-
tor of size 400 as follows:
PAACðPÞ ¼ ½d1;1; d1;2; d1;3; . . . ; d20;20� ð4Þ
where di,j is the dipeptide composition of the ith and jth amino acid.
The pseudo-amino acid composition (PseAAC) [46] combines the 20 components of AAC
with a set of sequence order correlation factors that incorporates some biochemical properties.
Given a protein sequence P = R1R2R3R4. . .RL of length L, a set of descriptors called sequence
TranCEP: Predicting the substrate class of transmembrane transport proteins
PLOS ONE | https://doi.org/10.1371/journal.pone.0227683 January 14, 2020 7 / 23

order-correlated factors are defined as:
y1 ¼1
L � 1
XL� 1
i¼1
YðRi;Riþ1Þ
y2 ¼1
L � 2
XL� 2
i¼1
YðRi;Riþ2Þ
y3 ¼1
L � 3
XL� 3
i¼1
YðRi;Riþ3Þ
:
:
:
yl ¼1
L � l
XL� l
i¼1
YðRi;RiþlÞ
8>>>>>>>>>>>>>>>>>>>>>>>>>>>><
>>>>>>>>>>>>>>>>>>>>>>>>>>>>:
ð5Þ
The parameter λ is chosen such that (λ< L). A correlation function is given by:
YðRi;RjÞ ¼1
3f½H1ðRjÞ � H1ðRiÞ�
2þ ½H2ðRjÞ � H2ðRiÞ�
2þ ½MðRjÞ � MðRiÞ�
2g ð6Þ
where H1(Ri) is the hydrophobicity value, H2(Ri) is the hydrophilicity value, and M(Ri) is the
side chain mass of the amino acid Ri. Those quantities are converted from their original values.
For example, for hydrophobicity, H1(R) is derived from the average hydrophobicity value
H�
1ðRiÞ, as follows:
H1ðRiÞ ¼
H�
1ðRiÞ �
1
20
X20
k¼1
H�
1ðRkÞ
ffiffiffiffiffiffiffiffiffiffiffiffiffiffiffiffiffiffiffiffiffiffiffiffiffiffiffiffiffiffiffiffiffiffiffiffiffiffiffiffiffiffiffiffiffiffiffiffiffiffiffiffiffiffiffiffiffiffiffiffi
X20
y¼1
H�
1ðRyÞ �
1
20
X20
k¼1
H�
1ðRkÞ
" #2
20
vuuuut
ð7Þ
The original hydrophobicity value H�
1ðRiÞ is taken from Tanford [47]. The original hydrophi-
licity value H�
2ðRiÞ for the amino acid Ri is taken from Hopp and Woods [48].
PseAAC is represented as a vector of size (20 + λ) as follows:
PseAACðPÞ ¼ ½s1; . . . ; s20; s21; . . . ; s20þl� ð8Þ
where si is the pseudo-amino acid composition
si ¼
fiP20
r¼1fr þ o
Pl
j¼1yj
1 � i � 20
oyi� 20P20
r¼1fr þ o
Pl
j¼1yj
20 < i � 20þ l
8>>>>>>><
>>>>>>>:
ð9Þ
where fi is the normalized occurrence frequency of the ith amino acid in the protein sequence,
θj is the jth sequence order-correlated factor calculated from Eq 5, and ω is a weight factor for
TranCEP: Predicting the substrate class of transmembrane transport proteins
PLOS ONE | https://doi.org/10.1371/journal.pone.0227683 January 14, 2020 8 / 23

the sequence order effect. The weight factor ω puts weight on the additional PseAAC compo-
nents with respect to the conventional AAC components. Any value from 0.05 to 0.7 can be
selected for the weight factor. The default value given by Chou [46] is 0.05, which we selected
in this study.
Multiple sequence alignment
We adopted the MSA-AAC approach [6] that combines amino acid composition with the evo-
lutionary information available from the MSA. This is done by first retrieving homologous
sequences of each protein sequence in the dataset, then building an MSA for the correspond-
ing protein, and then taking the counts for computing the composition information using all
the residues in the MSA.
In [6], the researchers only utilized the AAC encoding, whereas we also applied the
approach to the PAAC and PseAAC encodings. Another difference was that we made use of
TM-Coffee [27] (Version-11.00.8cbe486) to compute alignments, rather than ClustalW [49] as
done in [6], because we felt it was important to align the TMSs.
Other differences included searching the Swiss-Prot [50] database and retrieving a
maximum of 120 homologous sequences, instead of searching the non-redundant database nrand retrieving 1,000 sequences. This was done to make the computational time more manage-
able, because the TM-Coffee algorithm requires more memory usage and execution time.
Furthermore, all exact hits of the test sequences were removed from the Swiss-Protand UniRef50-TM databases to maintain independence between the MSA and the test data.
Our alignment command was the following:
t_coffee mysequences. fasta −mode psicoffee
−protein_db uniref50 −TM \
−template_file PSITM
where mysequences.fasta is the file that contains the 120 similar sequences retrieved by
Blast search on the Swiss-Prot database.
Positional information
In order to focus on those positions in the protein that determine specificity, we needed a
method to determine those positions, and then to filter our MSA. The MSA was filtered by
setting the entries for all other positions to null, that is, the symbol ‘-’ so that it was ignored
when gathering counts for the amino acid composition.
We applied the transitive consistency score (TCS) algorithm [30] to the alignment to deter-
mine the informative positions. The TCS is a scoring scheme that uses a consistency transfor-
mation to assign a reliability index to every pair of aligned residues, to each individual residue
in the alignment, to each column, andto the overall alignment. This scoring scheme has been
shown to be highly informative with respect to structural predictions based on benchmarking
databases. The reliability index ranges from 0 to 9, where 0 is extremely uncertain and 9 is
extremely reliable. Columns with a reliability index of below 4 were removed using the follow-
ing command:
t_coffee −infile myMSA. aln −evaluate
−output tcs_column_filter4. fasta
where myMSA.aln is the MSA file, tcs_column_filter4.fasta is the filtered file in
FASTA format.
TranCEP: Predicting the substrate class of transmembrane transport proteins
PLOS ONE | https://doi.org/10.1371/journal.pone.0227683 January 14, 2020 9 / 23

Training
Following TrSSP [10], we used a multi-class SVM with RBF kernel, as implemented in the R
e1071 library version 1.6-8, using a one-against-one approach in which 21 = (7 × 6)/2 binary
classifiers were trained. The predicted class was determined through a voting scheme in which
all the binary classifiers were applied and the class that got highest number of votes was the
result. Both the cost and gamma parameters of the RBF kernel were optimized by performing
a grid search using the tune function in the library (range of cost: 2 . . . 16, range of gamma:
2e-5 . . . 1).
Methods
We adopted three approaches to encode the amino acid composition: AAC, PAAC, as done
by TrSSP [10], and PseAAC. This was followed by training using SVM to form the prediction
methods AAC, PAAC, and PseAAC respectively.
By combining the amino acid composition and the evolutionary information obtained
using TM-Coffee, followed by SVM, we implemented the prediction methods: TMC-AAC,
TMC-PAAC, and TMC-PseAAC respectively.
Filtering was incorporated by applying TCS after TM-Coffee, then computing the
amino acid composition vectors, and applying SVM to implement the prediction methods:
TMC-TCS-AAC, TMC-TCS-PAAC, and TMC-TCS-PseAAC respectively.
The method of TranCEP is TMC-TCS-PAAC, the method with the best performance dur-
ing cross-validation.
Performance measurement
Four statistical measures were considered to measure the performance:
sensitivity which is the proportion of positives that are correctly identified:
Sensitivity ¼TP
TP þ FNð10Þ
specificity which is the proportion of negatives that are correctly identified:
Specificity ¼TN
TN þ FPð11Þ
accuracy which is proportion of correct predictions made amongst all the predictions:
Accuracy ¼TP þ TN
TPþ FN þ TN þ FPð12Þ
Matthews correlation coefficient (MCC) which is a single measure taking into account true
and false positives and negatives:
MCC ¼ðTP � TN � FP� FNÞ
ffiffiffiffiffiffiffiffiffiffiffiffiffiffiffiffiffiffiffiffiffiffiffiffiffiffiffiffiffiffiffiffiffiffiffiffiffiffiffiffiffiffiffiffiffiffiffiffiffiffiffiffiffiffiffiffiffiffiffiffiffiffiffiffiffiffiffiffiffiffiffiffiffiffiffiffiffiffiffiffiffiffiffiffiffiffiffiffiffiffiffiffiffiffiffiffiffiffiffiffiffiffiffiðTP þ FPÞ � ðTP þ FNÞ � ðTN þ FPÞ � ðTN þ FNÞ
p ð13Þ
where TP is the number of true positives, TN is the number of true negatives, FP is the number
of false positives, and FN is the number of false negatives.
We used the MCC because it is less influenced by imbalanced data and is arguably the
best single assessment metric in this case [51–53]. The MCC value ranges from 1 to −1,
where 1 indicates a perfect prediction; 0 represent no better than random; and −1 implies total
TranCEP: Predicting the substrate class of transmembrane transport proteins
PLOS ONE | https://doi.org/10.1371/journal.pone.0227683 January 14, 2020 10 / 23

disagreement between prediction and observation. A high MCC value means the predictor has
high accuracy on both positive and negative classes, and also low misprediction on both.
When dealing with multiclass classification, it is often desirable to compute a single aggre-
gate measure that reflects the overall performance. There are two methods to compute the
overall performance, namely micro-averaging and macro-averaging [54]. Macro-averaging
computes a simple average performance of individual classes’ performances. Micro-averaging
computes an overall performance by globally counting the total true positives, false negatives
and false positives. Depending on the class distribution the difference between the two meth-
ods can be large. Macro-averaging gives equal weight to each class, whereas micro-averaging
gives equal weight to each individual classification decision [54]. The overall accuracy of the
tool is often calculated as the fraction of the correct predictions by the total number of predic-
tions as follows:
Accuracyoverall ¼XK
k¼1
TPkN
ð14Þ
where TPk is the number of true positives in class k, K is the number of different classes, and Nis the total number of predictions.
Another way to compute the accuracy is to take the macro-average accuracy of the individ-
ual classes:
Accuracymacro ¼1
K
XK
k¼1
Accuracyk ð15Þ
where Accuracyk is the accuracy of class k, and K is the number of different classes.
Similarly, the overall MCC is calculated in terms of the confusion matrix C of dimension
K × K [55]:
MCCoverall ¼
Pk
Pl
PmCkkClm � CklCmkffiffiffiffiffiffiffiffiffiffiffiffiffiffiffiffiffiffiffiffiffiffiffiffiffiffiffiffiffiffiffiffiffiffiffiffiffiffiffiffiffiffiffiffiffiffiffiffiffiffiffiffiffiffiP
kðP
lCklÞðP
k0 jk0 6¼k
Pl0Ck0 l0 Þ
q ffiffiffiffiffiffiffiffiffiffiffiffiffiffiffiffiffiffiffiffiffiffiffiffiffiffiffiffiffiffiffiffiffiffiffiffiffiffiffiffiffiffiffiffiffiffiffiffiffiffiffiffiffiffiPkðP
lClkÞðP
k0 jk0 6¼k
Pl0Cl0k0 Þ
q ð16Þ
Or as a macro-average MCC:
MCCmacro ¼1
K
XK
k¼1
MCCk ð17Þ
where MCCk is the accuracy of class k, and K is the number of different classes.
Because the number of samples in each class of the dataset is imbalanced, we used the over-
all accuracy as in Eq 14 and overall MCC as in Eq 16 to evaluate and compare different meth-
ods. It is explicitly stated when the macro-average was used.
Experiments
The performance of each method was determined using five-fold cross-validation whereby the
training dataset was randomly partitioned into five equal sized sets. A single set was kept as
the validation data and the remaining four sets were used to train the SVM model. This model
was then tested using the validation set. The cross-validation process was repeated four times;
where each of the sets was used once as the validation data. The performance of each model
was averaged to produce a single estimation and the variation in performances was captured
by computing the standard deviation. In addition, we ran leave-one-out cross-validation
(LOOCV) on different methods to evaluate their robustness and compared the results with
TranCEP: Predicting the substrate class of transmembrane transport proteins
PLOS ONE | https://doi.org/10.1371/journal.pone.0227683 January 14, 2020 11 / 23

those obtained by five-fold cross-validation. Furthermore, the independent dataset was used to
test the final models. The data in the independent dataset was not used, nor considered, during
the training process and completely unknown to the different models.
The performance of TranCEP on the test dataset was compared to the performance of
TrSSP, as reported in their paper [10].
Statistical analysis
In this analysis, the average number of informative residues, as determined by TCS scores,
in different segments of a protein sequence was computed. For each substrate class, pairwise
comparisons between means of important positions in different segments were performed.
Since the sample size of each substrate class is >30, based on the the central limit theorem
[56], the Student t-test (two tailed, paired) was applied. The difference was considered statisti-
cally significant when the Student t-test significance level P (P-value) was less than 0.0001.
Results and discussion
Methods evaluation
The performance of the nine methods was evaluated using five-fold cross-validation. Table 2
presents the overall accuracy and MCC of the SVM models for the nine methods, sorted from
the best to the worst MCC. Details of the performance for each method is available in S1 File;
the comparison between the different methods among the seven classes in MCC, accuracy,
sensitivity, and specificity is presented in Fig 2.
All the SVM models that utilized evolutionary data notably performed better than the SVM
models that did not. In addition, the top two models, TMC-TCS-PAAC and TMC-TCS-
AAC, integrated positional and evolutionary information. The highest MCC was obtained
by TMC-TCS-PAAC, which is the method chosen for our predictor TranCEP. This method
incorporates the use of PAAC with evolutionary data in the form of MSA with positional
information, in which columns that have a reliability below 4 are filtered out. We found that
the performance peaked using this threshold and started to decline when filtering columns
with a higher reliability index. The TMC-TCS-PAAC method yielded an overall MCC of 0.63.
The detailed performance of TMC-TCS-PAAC on five-fold cross-validation is presented in
Table 3, The MCC was 0.82, 0.61, 0.62, 0.58, 0.46, 0.52, and 0.69 for amino acid, anion, cation,
electron, protein/mRNA, sugar, and other, respectively.
Table 2. Overall cross-validation performance of the methods.
Method Accuracy MCC
TMC-TCS-PAAC 69.23± 06.1 0.63±0.122
TMC-TCS-AAC 65.13± 03.2 0.58±0.125
TMC-PAAC 63.33± 04.4 0.51±0.129
TMC-AAC 63.08± 03.6 0.50±0.092
TMC-TCS-PseAAC 63.30± 05.5 0.49±0.129
TMC-PseAAC 61.79± 02.9 0.49±0.131
PseAAC 47.69± 02.4 0.27±0.104
PAAC 45.89± 03.1 0.25±0.101
AAC 45.38± 03.3 0.22±0.099
For each method, the table presents accuracy and MCC as m±d, where m is the mean and d is the standard deviation
across the five runs of the cross-validation.
https://doi.org/10.1371/journal.pone.0227683.t002
TranCEP: Predicting the substrate class of transmembrane transport proteins
PLOS ONE | https://doi.org/10.1371/journal.pone.0227683 January 14, 2020 12 / 23

The performance evaluation using LOOCV and independent testing prediction yielded
similar patterns (available in S2 and S3 Files, respectively). A comparison of the results
obtained by five-fold cross-validation, LOOCV, and the independent testing is presented in
Fig 3.
Fig 2. Performance of different methods. (a) MCC, (b) accuracy, (c) sensitivity, and (d) specificity. The dotted line represent
the performance of TranCEP, which is TCS-TMC-PAAC.
https://doi.org/10.1371/journal.pone.0227683.g002
Table 3. Cross validation performance for TMC-TCS-PAAC.
Class Specificity Sensitivity Accuracy MCC
Amino acid 98.82±00.4 80.84±05.4 96.06±01.7 0.82±0.042
Anion 99.30±00.7 47.89±19.9 93.33±01.4 0.61±0.119
Cation 86.66±02.2 79.70±04.3 81.50±03.9 0.62±0.081
Electron 96.58±03.0 63.13±11.8 92.01±01.9 0.58±0.098
Protein 97.21±01.8 52.00±08.7 90.93±03.1 0.46±0.036
Sugar 98.19±01.9 70.51±10.5 94.39±02.1 0.52±0.192
Other 83.02±03.5 67.23±19.8 76.43±06.8 0.69±0.178
Overall 69.23±06.1 0.63±0.122
The table presents the five-fold cross-validation results for TranCEP, which is TCS-TMC-PAAC. For each substrate class, the table indicates specificity, sensitivity,
accuracy and MCC as m±d, where m is the mean and d is the standard deviation across the five runs of the cross validation.
https://doi.org/10.1371/journal.pone.0227683.t003
TranCEP: Predicting the substrate class of transmembrane transport proteins
PLOS ONE | https://doi.org/10.1371/journal.pone.0227683 January 14, 2020 13 / 23

Table 4 shows the confusion matrix for TranCEP when run on the independent test set.
Most of the confusion occurred between a substrate class and the class other.
Comparison
Table 5 compares the performance of TranCEP to TrSSP [10] on the independent test set.
TranCEP scored higher for all the substrate classes in terms of accuracy, specificity, and MCC.
For the true positive rate as measured by sensitivity, TranCEP performed better on the cationand other classes, and TrSSP either matched or outperformed TranCEP on the other five clas-
ses. In TranCEP, the overall accuracy was computed as in Eq 14, and the MCC as in Eq 16.
The performance of TrSSP was computed as macro-average accuracy and macro-average
MCC. When we adopted the same method as TrSSP, the macro-average accuracy of TranCEP
is 91.23% and the macro-average MCC is 0.69. Interestingly, the MCC score was not effected
when using the overall and the macro-average, which further highlights its robustness when
dealing with imbalanced data.
Fig 3. Methods overall performance. (a) overall accuracy, and (b) overall MCC. The asterisk (�) symbol refers to the performance of TranCEP, which is
TCS-TMC-PAAC.
https://doi.org/10.1371/journal.pone.0227683.g003
Table 4. Confusion matrix for TranCEP.
Actual\Predicted Amino acid Anion Cation Electron Protein Sugar Other Total
Amino acid 9 0 2 0 0 0 4 15
Anion 1 7 1 0 0 0 3 12
Cation 0 0 34 0 1 0 1 36
Electron 0 0 1 8 0 0 1 10
Protein 0 0 3 0 10 0 2 15
Sugar 0 1 0 0 0 8 3 12
Other 1 3 2 0 0 1 13 20
The table presents the number of proteins in an actual substrate class that are predicted by TranCEP to fall in each substrate class. The independent test set is used.
https://doi.org/10.1371/journal.pone.0227683.t004
TranCEP: Predicting the substrate class of transmembrane transport proteins
PLOS ONE | https://doi.org/10.1371/journal.pone.0227683 January 14, 2020 14 / 23

Overall, TranCEP obtained an MCC of 0.69 which is 68% higher than that of TrSSP.
Impact of factors
Table 6 shows the impact of evolutionary information and positional information on the over-
all MCC from the five-fold cross-validation.
The use of evolutionary information in form of MSA on the composition encodings AAC,
PAAC, and PseAAC improved the MCC by an average of 104% with the highest improvement
being on AAC by 127%. The further use of positional information by filtering out the unreli-
able columns from the MSA showed an average improvement of 132% to the baseline compo-
sitions. The impact of positional information over that already achieved by evolutionary
information was an average of 13%. The highest impact is on TMC-PAAC, where the MCC
improved by 24% in TMC-TCS-PAAC.
It is difficult to isolate the exact residues that are key to inferring the substrate class; the
results suggest that evolutionary information, obtained by MSA, is the main source of achiev-
ing high prediction performance. In addition, the TCS informative positions (with TCS
score� 4) can help to filter out the unnecessary noise and get a clearer signal to further
Table 5. Comparing TranCEP and TrSSP.
Class Specificity Sensitivity Accuracy MCC
TrSSP TranCEP TrSSP TranCEP TrSSP TranCEP TrSSP TranCEP
Amino acid 82.42 98.10 93.33 60.00 83.33 91.75 0.49 0.66
Anion 69.05 96.30 75.00 58.33 69.44 90.82 0.23 0.56
Cation 74.31 89.29 75.00 94.44 74.44 89.00 0.41 0.78
Electron 91.78 100.0 80.00 80.00 91.11 97.80 0.50 0.88
Protein 82.42 99.07 93.33 66.67 83.33 93.68 0.49 0.75
Sugar 76.79 99.07 91.67 66.67 77.78 94.68 0.38 0.74
Other 73.13 86.00 60.00 65.00 71.67 80.91 0.23 0.44
Overall NA 74.17 NA 0.69
Macro-average 78.88 91.23 0.41 0.69
The table presents the performance of TranCEP built with the complete training set and run on the independent test set. The corresponding results for TrSSP are taken
from their original paper. The table shows specificity, sensitivity, accuracy and MCC for each of the seven substrate types; the overall accuracy and MCC, and the macro-
average accuracy and MCC. The overall accuracy was calculated by TranCEP as the proportion of correct predictions divided by the total number of predictions, and the
overall MCC was calculated from the confusion matrix as in Eq 16. The TrSSP performance was calculated as the average across the seven classes (macro-average); if we
adopt the same method the macro-average accuracy of TranCEP is 91.23% and the macro-average MCC is 0.69. NA: not available.
https://doi.org/10.1371/journal.pone.0227683.t005
Table 6. Impact of factors on performance.
Encoding MCC TMC-X to X TMC-TCS-X to X TMC-TCS-X to TMC-X
X X TMC-X TMC-TCS-X Delta Percent Delta Percent Delta Percent
AAC 0.22 0.50 0.58 0.28 127% 0.36 164% 0.08 16%
PAAC 0.25 0.51 0.63 0.26 104% 0.38 152% 0.12 24%
PseAAC 0.27 0.49 0.49 0.22 81% 0.22 81% 0.00 0%
Average 0.25 104% 0.32 132% 0.07 13%
The table notes the difference in MCC, the delta, and the percentage improvement in MCC, the percent, of the cross-validation performance for the introduction of
evolutionary information using TM-Coffee, and positional information using TCS. The use of evolutionary information in the form of an MSA on the composition
encodings AAC, PAAC, and PseAAC improved the MCC by an average of 104%. The further use of positional information by filtering out the unreliable columns from
the MSA boosted the MCC of the composition encodings by an average of 132%.
https://doi.org/10.1371/journal.pone.0227683.t006
TranCEP: Predicting the substrate class of transmembrane transport proteins
PLOS ONE | https://doi.org/10.1371/journal.pone.0227683 January 14, 2020 15 / 23
improve the prediction. Using TCS informative positions filtered out an average of (35% ±7%) of the sequence. However, when we tried to filter out more positions (by taking a stricter
the TCS score cut-off), the performance started to deteriorate.
To visualize the informative positions relative to the hydropathy scale of amino acids, the
hydropathy scale proposed by [57] was utilized and the average hydropathy of each column in
the MSA was computed. Higher positive scores indicate that amino acids in that region have
hydrophobic properties and are likely to be located in a transmembrane alpha-helix segment.
The TCS score of each column in the alignment is noted on the hydropathy plot through color
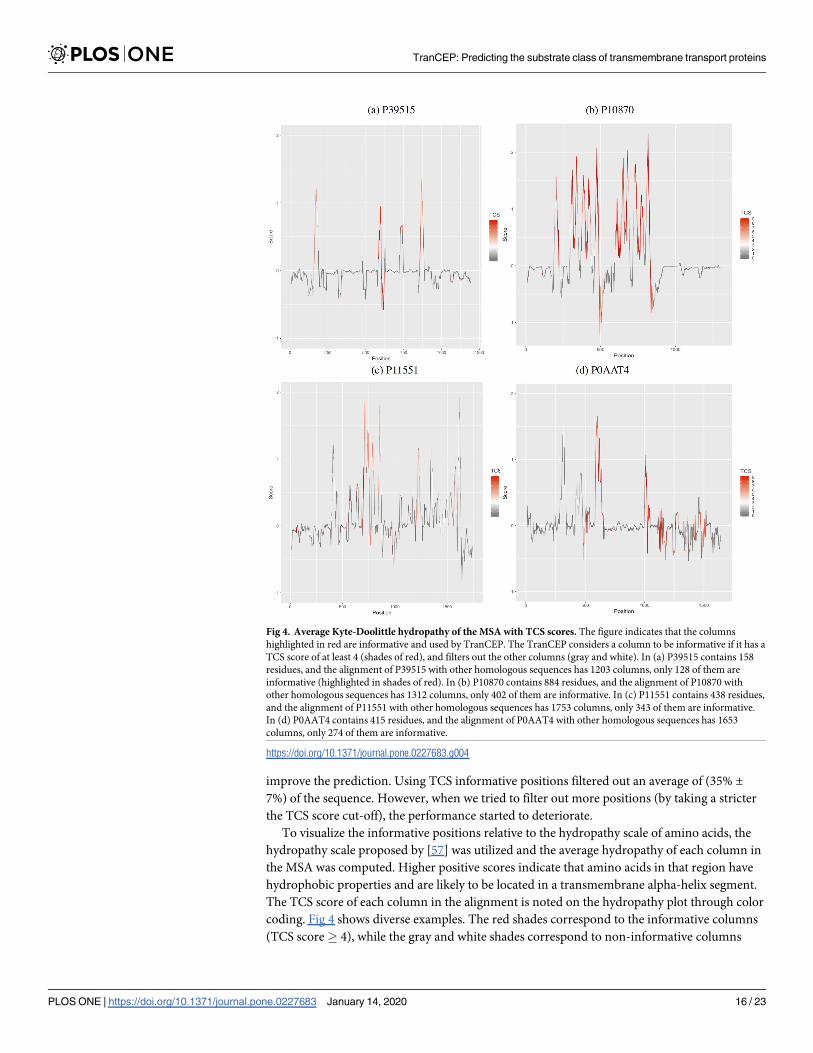
coding. Fig 4 shows diverse examples. The red shades correspond to the informative columns
(TCS score� 4), while the gray and white shades correspond to non-informative columns
Fig 4. Average Kyte-Doolittle hydropathy of the MSA with TCS scores. The figure indicates that the columns
highlighted in red are informative and used by TranCEP. The TranCEP considers a column to be informative if it has a
TCS score of at least 4 (shades of red), and filters out the other columns (gray and white). In (a) P39515 contains 158
residues, and the alignment of P39515 with other homologous sequences has 1203 columns, only 128 of them are
informative (highlighted in shades of red). In (b) P10870 contains 884 residues, and the alignment of P10870 with
other homologous sequences has 1312 columns, only 402 of them are informative. In (c) P11551 contains 438 residues,
and the alignment of P11551 with other homologous sequences has 1753 columns, only 343 of them are informative.
In (d) P0AAT4 contains 415 residues, and the alignment of P0AAT4 with other homologous sequences has 1653
columns, only 274 of them are informative.
https://doi.org/10.1371/journal.pone.0227683.g004
TranCEP: Predicting the substrate class of transmembrane transport proteins
PLOS ONE | https://doi.org/10.1371/journal.pone.0227683 January 14, 2020 16 / 23

that are filtered out by TranCEP. In Fig 4(a) and 4(b), the regions with high positive average
hydropathy values appear to be more informative compared to the ones with lower values.
However, in Fig 4(c) and 4(d), the difference between the informative positions with high and
low hydropathy values is not as clear.
To be able to measure the informative positions relative to different segments of the protein
sequence, we divided the protein sequence positions into those in the TMS and those not in
the TMS. Those in the TMS were divided into the interior one-third positions, and the remain-
ing exterior positions in the TMS. The non-TMS positions were divided into those near a
TMS, that is, within 10 positions, and the remaining positions far from a TMS. The location
of the TMS was predicted using TOPCONS2 [58] to predict the α-helical TMS and PRED-
TMBB2 [59] for β-barrel TMS. Table 7 shows a breakdown of where the informative positions,
as determined by TCS, are located with respect TMS regions.
For instance, in Fig 4(b), 45.47% of the residues of the sequence with UniProt-ID P10970
are informative (i.e., correspond to informative columns in the alignment); thus 54.53% of this
sequence is filtered out. In this case, the residues in the TMSs of this protein are indeed more
informative, where 96.42% of them are informative. On the other hand, only 25% of the resi-
dues on non-TMSs are informative. However, this does not always hold true as in the sequence
with UniProt-ID P0AAT4 in Fig 4(d), for example. Details of the sequences in the figure are
presented in Table 8. Details of all the sequences in all of the examined segments are found in
the open source repository.
Table 9 presents a pairwise comparison between informative positions in TMS and non-
TMS regions. The sequences in amino acid, anion, cation, sugar, and other, substrate classes
have significantly more informative positions in the TMS regions compared with non-TMS
regions. However, the difference is not significant in the sequences that belong to protein/mRNA and electron substrates. This could be because these two classes have fewer TMSs per
sequence, and TCS did not capture their conservation. The same difference in significance
positions close to TMSs and positions far from TMSs is found, as shown in Table 10. In con-
trast, there is no difference between classes for interior and exterior segments of the TMSs, as
presented in Table 11.
Table 7. Positional information.
Class SeqLth TMS TMSLth Positions TMS non-TMS
Num %Seq Num Interior Num Exterior Num Num Close Num Far Num
Amino acid 535 10 214 340 60.91 173 59 114 153 85 68
Anion 632 10 199 480 68.95 180 61 119 278 98 180
Cation 644 7 148 443 61.29 131 44 87 287 72 215
Electron 352 3 57 281 41.59 51 17 34 124 28 96
Protein 592 2 38 350 32.04 26 9 17 136 20 116
Sugar 467 10 215 345 70.37 193 65 128 143 80 63
Other 580 7 155 419 60.23 129 43 86 249 69 180
The table presents information on the sites retained by the TCS filtering step. For each class of substrates in the dataset, the table presents the average sequence length
(SeqLth), the average number of TMS regions (TMS), and the average total number of residues in the TMS regions (TMSLth). It also presents the average of the
number of positions retained by the filtering (Positions:Num), and that number as a percentage of the total sequence length (Positions:%Seq). It notes the total number
of sites that occur in the TMS regions (TMS:Num), and the non-TMS regions (non-TMS:Num). For the TMS regions, it presents the average number of sites that occur
in the interior central one-third of the TMS regions (TMS:Interior:Num), and in the remaining exterior regions outside the central one-third of the TMS regions (TMS:
Exterior:Num). For the non-TMS regions, it presents the average number of sites that occur close to the TMS regions (within 10 positions of the TMS) (non-TMS:
Close:Num), and the remaining sites far from the TMS regions (non-TMS:Far:Num).
https://doi.org/10.1371/journal.pone.0227683.t007
TranCEP: Predicting the substrate class of transmembrane transport proteins
PLOS ONE | https://doi.org/10.1371/journal.pone.0227683 January 14, 2020 17 / 23

Table 8. Examples of the informative residues distribution with respect to TMS and non-TMS.
UniProt-ID SeqLth TMS TMSLth Positions TMS non-TMS
Num %Seq Num %Seq Num %Seq
P39515 158 4 80 113 71.51 73 91.25 40 51.28
P10870 884 12 252 402 45.47 243 96.42 159 25.15
P11551 438 12 252 252 57.53 148 58.73 94 55.91
P0AAT4 415 5 105 208 50.12 41 39.05 167 53.87
The table shows the details of Fig 4 individual sequences. The table presents the sequence length (SeqLth), the number of TMS regions (TMS), and the total number of
residues in the TMS regions (TMSLth). It also presents the number of informative positions retained by the filtering (Positions:Num), and that number as a percentage
of the total sequence length (Positions:%Seq). It notes the total number of informative sites that occur in the TMS regions (TMS:Num), and that number as a
percentage of the total TMS length (TMS:%Seq). In addition, It notes the total number of informative sites that occur in the non-TMS regions (non-TMS:Num), and
that number as a percentage of the total non-TMS length (non-TMS:%Seq).
https://doi.org/10.1371/journal.pone.0227683.t008
Table 9. Statistical analysis of informative position rates in TMS and non-TMS regions.
Class TMS non-TMS P-value
Amino acid 74.61±27.28 50.06±21.61 <0.0001
Anion 82.16±30.35 60.94±26.93 <0.0001
Cation 76.51±34.41 55.71±28.63 <0.0001
Electron 37.62±44.12 41.44±43.56 0.050
Protein 32.66±39.83 30.92±35.30 0.414
Sugar 84.68±23.27 57.24±19.46 <0.0001
Other 67.53±38.21 54.52±31.17 <0.0001
All the data are reported as the sample mean ± the standard deviation (SD). The location of the TMS regions was
predicted using TOPCONS2 [58] for the α-helical TMS and PRED-TMBB2 [59] for β-barrel TMS regions. There are
statistically (P-value <0.0001) significant informative positions in TMS regions compared to non-TMS regions, in
the sequences that belong to amino acid, anion, cation, sugar, and other classes.
https://doi.org/10.1371/journal.pone.0227683.t009
Table 10. Statistical analysis of informative position rates close to TMS regions and far from TMS regions.
Class Close Far P-value
Amino acid 62.59±24.73 39.08±23.08 <0.0001
Anion 72.53±28.28 53.86±28.19 <0.0001
Cation 66.20±32.40 51.35±28.91 <0.0001
Electron 36.67±44.05 41.67±43.76 0.035
Protein 32.38±39.47 29.96±34.54 0.313
Sugar 68.89±19.89 47.30±20.06 <0.0001
Other 62.84±35.31 48.91±30.90 <0.0001
All the data are reported as the sample mean ± the standard deviation (SD). For the non-TMS regions, there are
statistically (P-value <0.0001) significant informative positions that occur close to the TMS regions (within 10
positions of the TMS) compared to other far regions, in the sequences that belong to amino acid, anion, cation, sugar,and other classes.
https://doi.org/10.1371/journal.pone.0227683.t010
TranCEP: Predicting the substrate class of transmembrane transport proteins
PLOS ONE | https://doi.org/10.1371/journal.pone.0227683 January 14, 2020 18 / 23

Conclusion
We have developed a novel method TranCEP for de novo prediction of substrates for mem-
brane transporter proteins that combines information based on amino acid composition,
evolutionary information, and positional information. TranCEP incorporates first, the use of
evolutionary information taking 120 similar sequences and constructing a multiple sequence
alignment using TM-Coffee, second, the use of positional information by filtering to reliable
positions as determined by TCS, and third, the use of pair amino acid composition. TranCEP
achieved an overall MCC of 0.69, which is a 68% improvement over the state-of-the-art
method TrSSP that uses the primary sequence alone. In addition, we evaluated the impact on
performance of each factor: incorporating evolutionary information and filtering the unreli-
able positions. We observed that using amino acid composition alone does not obtain strong
performance. The enhanced performance came mainly from incorporating evolutionary and
positional information. We learned that certain positions in the alignment have greater signifi-
cance, and identifying them helped to boost the performance.
Supporting information
S1 File. Five-fold cross-validation performance details.
(PDF)
S2 File. Leave-one-out cross-validation performance details.
(PDF)
S3 File. Independent testing performance details.
(PDF)
S1 Table. Manuscript tables (.xlsx).
(XLSX)
S2 Table. Training data (.xlsx).
(XLSX)
S3 Table. Testing data (.xlsx).
(XLSX)
Author Contributions
Conceptualization: Munira Alballa, Faizah Aplop, Gregory Butler.
Table 11. Statistical analysis of informative position rates in the interior TMS regions and exterior TMS regions.
Class Interior Exterior P-value
Amino acid 75.92±27.55 74.35±27.31 0.007
Anion 82.67±30.70 82.25±30.33 0.290
Cation 77.18±35.50 76.40±34.22 0.028
Electron 37.69±44.51 37.70±44.17 0.983
Protein 31.99±40.55 33.12±40.10 0.278
Sugar 86.16±24.51 84.37±22.96 0.011
Other 67.88±38.48 67.51±38.31 0.317
All the data are reported as the sample mean ± the standard deviation (SD). For the TMS regions, there is no
difference between the informative positions in the interior central one-third of the TMS regions and the remaining
exterior regions, in all sequences that belong to all substrate classes.
https://doi.org/10.1371/journal.pone.0227683.t011
TranCEP: Predicting the substrate class of transmembrane transport proteins
PLOS ONE | https://doi.org/10.1371/journal.pone.0227683 January 14, 2020 19 / 23

Formal analysis: Munira Alballa, Gregory Butler.
Investigation: Munira Alballa.
Methodology: Munira Alballa, Faizah Aplop, Gregory Butler.
Project administration: Gregory Butler.
Software: Munira Alballa.
Supervision: Gregory Butler.
Validation: Munira Alballa.
Visualization: Munira Alballa.
Writing – original draft: Munira Alballa, Gregory Butler.
Writing – review & editing: Munira Alballa, Faizah Aplop, Gregory Butler.
References1. Buehler L. The Structure of Membrane Proteins. Cell Membranes. Garland Science; 2015.
2. Kozma D, Simon I, Tusnady GE. PDBTM: Protein Data Bank of transmembrane proteins after 8 years.
Nucleic Acids Research. 2013; 41(D1):D524–D529. https://doi.org/10.1093/nar/gks1169
3. Gromiha M, Ou Y. Bioinformatics approaches for functional annotation of membrane proteins. Briefings
in Bioinformatics. 2014; 15(2):155–168. https://doi.org/10.1093/bib/bbt015
4. Butt AH, Rasool N, Khan YD. A treatise to computational approaches towards prediction of membrane
protein and its subtypes. The Journal of Membrane Biology. 2017; 250(1):55–76. https://doi.org/10.
1007/s00232-016-9937-7 PMID: 27866233
5. Berman HM, Battistuz T, Bhat TN, Bluhm WF, Bourne PE, Burkhardt K, Feng Z, Gilliland GL, Iype L,
Jain S, Fagan P. The protein data bank. Acta Crystallographica Section D: Biological Crystallography.
2002; 58(6):899–907. https://doi.org/10.1107/S0907444902003451
6. Schaadt NS, Christoph J, Helms V. Classifying substrate specificities of membrane transporters from
Arabidopsis thaliana. Journal of Chemical Information and Modeling. 2010; 50(10):1899–1905. https://
doi.org/10.1021/ci100243m PMID: 20925375
7. Chen S, Ou Y, Lee T, Gromiha MM. Prediction of transporter targets using efficient RBF networks with
PSSM profiles and biochemical properties. Bioinformatics. 2011; 27(15):2062–2067. https://doi.org/10.
1093/bioinformatics/btr340 PMID: 21653515
8. Schaadt N, Helms V. Functional classification of membrane transporters and channels based on filtered
TM/non-TM amino acid composition. Biopolymers. 2012; 97(7):558–567. https://doi.org/10.1002/bip.
22043 PMID: 22492257
9. Barghash A, Helms V. Transferring functional annotations of membrane transporters on the basis of
sequence similarity and sequence motifs. BMC Bioinformatics. 2013; 14(1):343. https://doi.org/10.
1186/1471-2105-14-343 PMID: 24283849
10. Mishra NK, Chang J, Zhao PX. Prediction of membrane transport proteins and their substrate specifici-
ties using primary sequence information. PLoS One. 2014; 9(6):1–14. https://doi.org/10.1371/journal.
pone.0100278
11. Gromiha MM, Yabuki Y. Functional discrimination of membrane proteins using machine learning tech-
niques. BMC Bioinformatics. 2008; 9(1):135. https://doi.org/10.1186/1471-2105-9-135 PMID:
18312695
12. Li H, Benedito VA, Udvardi MK, Zhao PX. TransportTP: A two-phase classification approach for mem-
brane transporter prediction and characterization. BMC Bioinformatics. 2009; 10(418):1–13.
13. Ou YY, Chen SA, Gromiha MM. Classification of transporters using efficient radial basis function net-
works with position-specific scoring matrices and biochemical properties. Proteins: Structure, Function,
and Bioinformatics. 2010; 78(7):1789–1797.
14. Busch W, Saier M Jr. The IUBMB-endorsed transporter classification system. Methods in Molecular
Biology. 2003; 227:21. https://doi.org/10.1385/1-59259-387-9:21 PMID: 12824641
TranCEP: Predicting the substrate class of transmembrane transport proteins
PLOS ONE | https://doi.org/10.1371/journal.pone.0227683 January 14, 2020 20 / 23

15. Saier MH Jr, Tran CV, Barabote RD. TCDB: the Transporter Classification Database for membrane
transport protein analyses and information. Nucleic Acids Research. 2006; 34(suppl_1):D181–D186.
https://doi.org/10.1093/nar/gkj001
16. Saier MH Jr, Reddy VS, Tsu BV, Ahmed MS, Li C, Moreno-Hagelsieb G. The transporter classification
database (TCDB): recent advances. Nucleic Acids Research. 2016; 44(D1):D372–D379. https://doi.
org/10.1093/nar/gkv1103 PMID: 26546518
17. Thiele I, Palsson BØ. A protocol for generating a high-quality genome-scale metabolic reconstruction.
Nature protocols. 2010; 5(1):93–121. https://doi.org/10.1038/nprot.2009.203 PMID: 20057383
18. Sahoo S, Aurich MK, Jonsson JJ, Thiele I. Membrane transporters in a human genome-scale metabolic
knowledgebase and their implications for disease. Frontiers in Physiology. 2014; 5:91. https://doi.org/
10.3389/fphys.2014.00091 PMID: 24653705
19. Dias O, Rocha M, Ferreira EC, Rocha I. Reconstructing genome-scale metabolic models with
merlin. Nucleic Acids Research. 2015; 43(8):3899–3910. https://doi.org/10.1093/nar/gkv294 PMID:
25845595
20. Loira N, Zhukova A, Sherman DJ. Pantograph: A template-based method for genome-scale metabolic
model reconstruction. Journal of Bioinformatics and Computational Biology. 2015; 13(02):1550006.
https://doi.org/10.1142/S0219720015500067 PMID: 25572717
21. Aplop F, Butler G. TransATH: transporter prediction via annotation transfer by homology. ARPN Journal
of Engineering and Applied Sciences. 2017; 12(2).
22. Aplop F. Computational approaches to improving the reconstruction of metabolic pathway. Concordia
University; 2016.
23. Farwick A, Bruder S, Schadeweg V, Oreb M, Boles E. Engineering of yeast hexose transporters to
transport D-xylose without inhibition by D-glucose. Proceedings of the National Academy of Sciences.
2014; 111(14):5159–5164. https://doi.org/10.1073/pnas.1323464111
24. Teppa E, Wilkins AD, Nielsen M, Buslje CM. Disentangling evolutionary signals: conservation, specific-
ity determining positions and coevolution. Implication for catalytic residue prediction. BMC Bioinformat-
ics. 2012; 13(1):235. https://doi.org/10.1186/1471-2105-13-235 PMID: 22978315
25. Chakraborty A, Chakrabarti S. A survey on prediction of specificity-determining sites in proteins. Brief-
ings in Bioinformatics. 2014; 16(1):71–88. https://doi.org/10.1093/bib/bbt092 PMID: 24413183
26. Pirovano W, Feenstra KA, Heringa J. PRALINE™: a strategy for improved multiple alignment of trans-
membrane proteins. Bioinformatics. 2008; 24(4):492–497. https://doi.org/10.1093/bioinformatics/
btm636 PMID: 18174178
27. Chang JM, Di Tommaso P, Taly JF, Notredame C. Accurate multiple sequence alignment of transmem-
brane proteins with PSI-Coffee. BMC Bioinformatics. 2012; 13(Suppl 4):S1. https://doi.org/10.1186/
1471-2105-13-S4-S1 PMID: 22536955
28. Floden EW, Tommaso PD, Chatzou M, Magis C, Notredame C, Chang JM. PSI/TM-Coffee: a web
server for fast and accurate multiple sequence alignments of regular and transmembrane proteins
using homology extension on reduced databases. Nucleic Acids Research. 2016; 44(W1):W339–
W343. https://doi.org/10.1093/nar/gkw300 PMID: 27106060
29. Bhat B, Ganai NA, Andrabi SM, Shah RA, Singh A. TM-Aligner: Multiple sequence alignment tool for
transmembrane proteins with reduced time and improved accuracy. Scientific reports. 2017; 7
(1):12543. https://doi.org/10.1038/s41598-017-13083-y PMID: 28970546
30. Chang JM, Di Tommaso P, Notredame C. TCS: a new multiple sequence alignment reliability measure
to estimate alignment accuracy and improve phylogenetic tree reconstruction. Molecular Biology and
Evolution. 2014; p. 1625–1637. https://doi.org/10.1093/molbev/msu117 PMID: 24694831
31. Lee TJ, Paulsen I, Karp P. Annotation-based inference of transporter function. Critical Reviews in Bio-
chemistry and Molecular Biology. 2008; 24:i259–i267.
32. Karp PD, Riley M, Paley SM, Pellegrini-Toole A. The MetaCyc database. Nucleic Acids Research.
2002; 30(1):59–61. https://doi.org/10.1093/nar/30.1.59 PMID: 11752254
33. Reddy VS, Saier MH. BioV Suite—a collection of programs for the study of transport protein evolution.
FEBS Journal. 2012; 279(11):2036–2046. https://doi.org/10.1111/j.1742-4658.2012.08590.x PMID:
22568782
34. Saier MH Jr, Tran CV, Barabote RD. TCDB: the Transporter Classification Database for membrane
transport protein analyses and information. Nucleic Acids Research. 2006; 34(suppl_1):D181–6.
https://doi.org/10.1093/nar/gkj001
35. Tusnady GE, Simon I. The HMMTOP transmembrane topology prediction server. Bioinformatics. 2001;
17(9):849–50. https://doi.org/10.1093/bioinformatics/17.9.849 PMID: 11590105
36. Paparoditis P, Vastermark Å, Le AJ, Fuerst JA, Saier MH. Bioinformatic analyses of integral membrane
transport proteins encoded within the genome of the planctomycetes species, Rhodopirellula baltica.
TranCEP: Predicting the substrate class of transmembrane transport proteins
PLOS ONE | https://doi.org/10.1371/journal.pone.0227683 January 14, 2020 21 / 23

Biochimica et Biophysica Acta (BBA)-Biomembranes. 2014; 1838(1):193–215. https://doi.org/10.1016/
j.bbamem.2013.08.007
37. Li H, Dai X, Zhao X. A nearest neighbor approach for automated transporter prediction and categoriza-
tion from protein sequences. Bioinformatics. 2008; 24(9):1129–1136. https://doi.org/10.1093/
bioinformatics/btn099 PMID: 18337257
38. Ren Q, Chen K, Paulsen IT. TransportDB: a comprehensive database resource for cytoplasmic mem-
brane transport systems and outer membrane channels. Nucleic Acids Research. 2007; 35:D274–
D279. https://doi.org/10.1093/nar/gkl925 PMID: 17135193
39. Lin H, Han L, Cai C, Ji Z, Chen Y. Prediction of transporter family from protein sequence by support vec-
tor machine approach. Proteins: Structure, Function, and Bioinformatics. 2006; 62(1):218–231. https://
doi.org/10.1002/prot.20605
40. Smith TF, Waterman MS. Identification of common molecular subsequences. Journal of Molecular Biol-
ogy. 1981; 147(1):195–7. https://doi.org/10.1016/0022-2836(81)90087-5 PMID: 7265238
41. Dias O, Gomes D, Vilaca P, Cardoso J, Rocha M, Ferreira EC, et al. Genome-wide semi-automated
annotation of transporter systems. IEEE/ACM Transactions on Computational Biology and Bioinformat-
ics. 2017; 14(2):443–456. https://doi.org/10.1109/TCBB.2016.2527647 PMID: 26887005
42. Loira N, Dulermo T, Nicaud JM, Sherman DJ. A genome-scale metabolic model of the lipid-accumulat-
ing yeast Yarrowia lipolytica. BMC Systems Biology. 2012; 6(1):35. https://doi.org/10.1186/1752-0509-
6-35 PMID: 22558935
43. Liou YF, Vasylenko T, Yeh CL, Lin WC, Chiu SH, Charoenkwan P, et al. SCMMTP: identifying and char-
acterizing membrane transport proteins using propensity scores of dipeptides. BMC Genomics. 2015;
16(12):S6. https://doi.org/10.1186/1471-2164-16-S12-S6 PMID: 26677931
44. Li L, Li J, Xiao W, Li Y, Qin Y, Zhou S, et al. Prediction the substrate specificities of membrane transport
proteins based on support vector machine and hybrid features. IEEE/ACM Transactions on Computa-
tional Biology and Bioinformatics. 2016; 13(5):947–953. https://doi.org/10.1109/TCBB.2015.2495140
PMID: 26571537
45. Gene Ontology Consortium. The Gene Ontology (GO) database and informatics resource. Nucleic
Acids Research. 2004; 32(suppl_1):D258–61. https://doi.org/10.1093/nar/gkh036 PMID: 14681407
46. Chou KC. Prediction of protein cellular attributes using pseudo-amino acid composition. Proteins: Struc-
ture, Function, and Bioinformatics. 2001; 43(3):246–255. https://doi.org/10.1002/prot.1035
47. Tanford C. Contribution of hydrophobic interactions to the stability of the globular conformation of pro-
teins. Journal of the American Chemical Society. 1962; 84(22):4240–4247. https://doi.org/10.1021/
ja00881a009
48. Hopp TP, Woods KR. Prediction of protein antigenic determinants from amino acid sequences. Pro-
ceedings of the National Academy of Sciences. 1981; 78(6):3824–3828. https://doi.org/10.1073/pnas.
78.6.3824
49. Thompson JD, Higgins DG, Gibson TJ. CLUSTAL W: improving the sensitivity of progressive multiple
sequence alignment through sequence weighting, position-specific gap penalties and weight matrix
choice. Nucleic Acids Research. 1994; 22(22):4673–4680. https://doi.org/10.1093/nar/22.22.4673
PMID: 7984417
50. Boeckmann B, Bairoch A, Apweiler R, Blatter MC, Estreicher A, Gasteiger E, et al. The SWISS-PROT
protein knowledgebase and its supplement TrEMBL in 2003. Nucleic Acids Research. 2003; 31(1):365–
370. https://doi.org/10.1093/nar/gkg095 PMID: 12520024
51. Ding Z. Diversified ensemble classifiers for highly imbalanced data learning and their application in bio-
informatics. Georgia State University; 2011.
52. Weiss GM, Provost F. Learning when training data are costly: The effect of class distribution on tree
induction. Journal of Artificial Intelligence Research. 2003; 19:315–354. https://doi.org/10.1613/jair.
1199
53. Bekkar M, Djemaa HK, Alitouche TA. Evaluation measures for models assessment over imbalanced
data sets. Journal of Information Engineering and Applications. 2013; 3(10).
54. Manning C, Raghavan P, Schutze H. Introduction to information retrieval. Natural Language Engineer-
ing. 2010; 16(1):280–3.
55. Gorodkin J. Comparing two K-category assignments by a K-category correlation coefficient. Computa-
tional Biology and Chemistry. 2004; 28(5):367–374. https://doi.org/10.1016/j.compbiolchem.2004.09.
006 PMID: 15556477
56. Kwak SG, Kim JH. Central limit theorem: the cornerstone of modern statistics. Korean Journal of Anes-
thesiology. 2017; 70(2):144–156. https://doi.org/10.4097/kjae.2017.70.2.144 PMID: 28367284
57. Kyte J, Doolittle RF. A simple method for displaying the hydropathic character of a protein. Journal of
Molecular Biology. 1982; 157(1):105–32. https://doi.org/10.1016/0022-2836(82)90515-0 PMID: 7108955
TranCEP: Predicting the substrate class of transmembrane transport proteins
PLOS ONE | https://doi.org/10.1371/journal.pone.0227683 January 14, 2020 22 / 23

58. Tsirigos KD, Peters C, Shu N, Kall L, Elofsson A. The TOPCONS web server for consensus prediction
of membrane protein topology and signal peptides. Nucleic Acids Research. 2015; 43(W1)W401–
W407. https://doi.org/10.1093/nar/gkv485 PMID: 25969446
59. Tsirigos KD, Elofsson A, Bagos PG. PRED-TMBB2: improved topology prediction and detection of
beta-barrel outer membrane proteins. Bioinformatics. 2016; 32(17):i665–i671. https://doi.org/10.1093/
bioinformatics/btw444 PMID: 27587687
TranCEP: Predicting the substrate class of transmembrane transport proteins
PLOS ONE | https://doi.org/10.1371/journal.pone.0227683 January 14, 2020 23 / 23