trans mountain expansion project -final … mountain expansion project -final report- prepared for:...
TRANSCRIPT
TRANS MOUNTAIN EXPANSION PROJECT
-FINAL REPORT-
PREPARED FOR: NATURAL RESOURCES CANADA PREPARED BY: NIELSEN, DELANEY + ASSOCIATES AND PUBLIVATE
NOVEMBER 1, 2016
ii | P a g e
TABLE OF CONTENTS
Executive Summary ........................................................................................ 1
Background ................................................................................................ 1
Methodology ............................................................................................. 1
Key Findings ............................................................................................... 2
Snapshot of Participants ................................................................................ 3
General Overview .......................................................................................... 5
Background ................................................................................................ 5
Methodology ............................................................................................. 5
Reporting Notes ......................................................................................... 7
Detailed Findings ........................................................................................... 8
Views on the TMX project ........................................................................... 8
Views about potential impacts that were not addressed in the NEB review process or the ECCC’s assessment of upstream greenhouse gases ..................................................................................... 12
Views about potential impacts that were not addressed in the NEB review process or ECCC’s assessment of upstream greenhouse gases by Category .................................................................. 16
Profile of Participants ............................................................................... 25
Familiarity of Participants with the Trans Mountain Expansion Project ..................................................................................................... 27
Sources of Information ............................................................................. 34
1 | P a g e
EXECUTIVE SUMMARY
Background
On December 16, 2013, Trans Mountain ULC, a wholly owned subsidiary of Kinder Morgan, filed an
application with the National Energy Board (NEB) to twin the existing Trans Mountain oil pipeline and
expand the Westridge Marine Terminal. The existing pipeline, built in 1953, runs from Edmonton, AB, to
the Westridge Marine Terminal and the Chevron refinery in Burnaby, BC. The pipeline continues on to
four refineries in Puget Sound, Washington, and is currently the only pipeline that provides west coast
access to Alberta oil producers.
If the proposed Trans Mountain Expansion Project (the TMX project) is approved, 980 kilometres of new
pipeline would be built between Edmonton, AB, and Burnaby, BC, increasing the existing pipeline’s
capacity from 300,000 barrels/day to 890,000 barrels/day. The Westridge Marine Terminal would also
be expanded. New pipeline segments would be added between Edmonton, AB, and Hinton, AB, and
Hargreaves, BC, and Darfield, BC, and Black Pines, BC, and Burnaby, BC. Some existing, but currently
deactivated pipeline segments, totalling 193 kilometres, would be reactivated.
In line with the interim measures for pipeline reviews announced in January 2016 and as a complement
to the NEB review process, an online questionnaire was made available to allow Canadians, including
Indigenous peoples and affected communities, to provide their input.
The Government’s final decision is expected on or before December 19, 2016, and will take into
consideration the NEB recommendation report, Crown consultations with Indigenous peoples, the
assessment of upstream greenhouse gas emissions and public input from the Ministerial Panel on TMX,
who will be informed by the online questionnaire results presented in this report.
Methodology
OVERVIEW AND SAMPLING
The research covered in this report consisted of a national questionnaire focused on the TMX Project.
The questionnaire was made available on Natural Resources Canada’s website in both official languages
to Canadians from June 30 to September 30, 2016.
Findings are not statistically projectable to a broader population and no estimates of sampling error can
be calculated. The questionnaire included questions for classification, such as demographic questions
with yes/no answers, and open-ended responses. Questionnaire participants were self-selected, inviting
any Canadians with an interest to choose to take part on their own accord.
In total, 35,258 people responded to the online questionnaire, 27,616 of which completed it. The
questionnaire took an average of 6 minutes and 44 seconds to complete.
2 | P a g e
Key Findings
One third of participants (35%) noted explicitly their support for the TMX project and indicated they
have no concerns with the expansion project. These participants did not substantiate their views and
limited their responses to general statements of support, approval of oil transportation by pipeline and
suggestions to proceed immediately with the project.
Of those participants that expressed substantiated views regarding the TMX project, 77% were positive
submissions, while 21% were negative. Positive submissions (77%) mention the positive impact of the
TMX project on the economy (78%), pipelines as a safe mode of transporting oil (53%) and the need to
export oil (51%). Negative submissions (21%) mention concerns around safety (73%), general opposition
to the project (29%) and recommend that the TMX project be rejected in favour of a focus on green
energy (24%). Participants living outside of Alberta and British Columbia (84%) were more inclined to
provide positive submissions than those directly affected by the pipeline, similar to industry members
(87%) and business members (83%).
Similarly, of those participants that expressed substantiated views regarding issues related to potential
project impacts not addressed in the National Energy Board review process or Environment and Climate
Change Canada’s assessment, 24% were negative submissions, while 75% were positive. Positive
submissions (75%) mention environmental concerns being overrated (36%), and the safeness of
pipelines (22%). Negative submissions (24%) mention concerns around safety (45%) and lack of
confidence in the project proponent and the National Energy Board review process. Participants living
outside of Alberta and British Columbia (86%) were more inclined to provide positive submissions than
those directly affected by the pipeline, similar to industry members (87%) and NGOs (83%).
Furthermore, of those participants that expressed substantiated views regarding potential impacts from
the TMX project to their land or community, 57% were positive submissions, while 43% were negative.
Positive submissions (57%) mention that pipelines are a safe mode of transportation (40%) and foster
job creation (30%). Negative submissions (43%) mention tanker traffic damaging water ways and marine
life (51%) and negative environmental impacts (23%). Participants living outside of British Columbia and
Alberta (65%) were slightly more inclined to provide positive submissions than those directly affected by
the pipeline, as were industry members (80%) and business members (74%).
While there was notable support for the project in both provinces, there were also some key differences
in opinion from participants located in Alberta versus those located in British Columbia, with Alberta
more likely to provide positive submissions throughout the questionnaire when asked about views on
the TMX project, potential impacts that were not addressed in the NEB review process or Environment
and Climate Change Canada’s assessment of upstream greenhouse gases and views related to potential
project impacts to the land or community.
3 | P a g e
is report also includes a qualitative analysis of themes mentioned by questionnaire respondents. With
regards to the economy, questionnaire respondents viewed the pipeline as a boost to the economy by
generating revenue and creating jobs, while also considering the negative impact that an increase in
tanker traffic might have. Concerns surrounding public safety, health risks and dangers to the
environment were mentioned by respondents, who also considered pipelines as a safer, less disruptive
and more environmentally friendly mode of oil transportation. Similarly, there was mention of concerns
surrounding marine life, wildlife and environmental damage. Participants viewed green energy as a
necessary focus (moving away from fossil fuels), and noted the overall need to export oil to new markets
to avoid being landlocked or bottlenecked. Both confidence and distrust in the pipeline proponent were
noted.
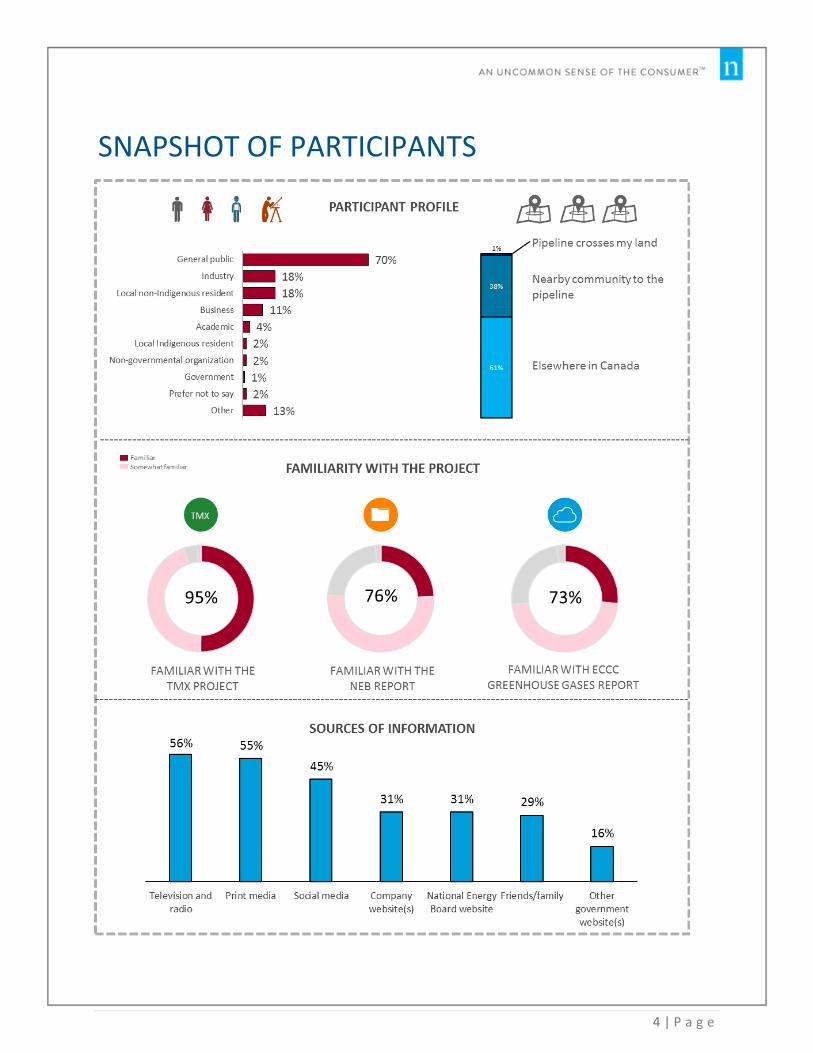
The majority of participants identified themselves as part of the general public (70%), followed by
industry members (18%), local non-Indigenous residents (18%) and business persons (11%), with two in
five living in areas directly affected by the TMX project.
Familiarity with the Trans Mountain Expansion Project is high (with nine in ten familiar), with higher
familiarity among those living close to the pipeline. In comparison, familiarity with Environment and
Climate Change Canada’s assessment is slightly lower (73%). In all cases, familiarity is higher among
those living near the pipeline.
The primary sources used to find information on the project cited by participants are television and
radio (56%), closely followed by print media (55%) and social media (45%). Proximity to the pipeline did
not alter these most frequently mentioned sources of information. For most groups of participants, print
media, television and radio, and social media were the primary sources of information. Business persons
and industry members also used company websites as a primary source to find information, while
government used the NEB website in addition to print media, social media, television and radio as
primary sources of information.
4 | P a g e
SNAPSHOT OF PARTICIPANTS
5 | P a g e
GENERAL OVERVIEW
Background
On December 16, 2013, Trans Mountain ULC, a wholly owned subsidiary of Kinder Morgan, filed an
application with the National Energy Board (NEB) to twin the existing Trans Mountain oil pipeline and
expand the Westridge Marine Terminal. The existing pipeline, built in 1953, runs from Edmonton, AB, to
the Westridge Marine Terminal and the Chevron refinery in Burnaby, BC. The existing pipeline continues
on to four refineries in Puget Sound, Washington, and is currently the only pipeline that provides west
coast access to Alberta oil producers.
If the proposed Trans Mountain Expansion Project (the TMX project) is approved, 980 kilometres of new
pipeline would be built between Edmonton and Burnaby increasing the existing pipeline’s capacity from
300,000 barrels/day to 890,000 barrels/day. The Westridge Marine Terminal would also be expanded.
New pipeline segments would be added between Edmonton, AB and Hinton, AB, and Hargreaves, BC,
and Darfield, BC and Black Pines, BC, and Burnaby. Some existing, but currently deactivated pipeline
segments, totalling 193 kilometres, would be reactivated.
In line with the interim measures for pipeline reviews announced in January 2016 and as a complement
to the NEB review process, an online questionnaire was made available to Canadians, including
Indigenous peoples and affected communities, to provide their input.
The Government’s final decision is expected on or before December 19, 2016, and will take into
consideration the NEB recommendation report, Crown consultations with Indigenous peoples,
comments received on the draft assessment of upstream greenhouse gas emissions and public input
from the Ministerial Panel, who will be informed by the online questionnaire results presented in this
report.
Methodology
OVERVIEW
This research consisted of a national questionnaire for the TMX project, which was fielded from June 30
to September 30, 2016. The questionnaire was made available to Canadians on Natural Resources
Canada’s website during the aforementioned period. This report aggregates and analyses input obtained
through this online questionnaire on the TMX project.
SAMPLE DESIGN AND SELECTION
Findings are not statistically projectable to a broader population and no estimates of sampling error can
be calculated. The sample of questionnaire responses included questions for classification, such as
demographic questions with yes/no answers, and open-ended responses. Questionnaire participants
were self-selected, inviting any interested Canadian to choose to take part on their own accord.
6 | P a g e
In total, more than 35,000 Canadians responded to the online questionnaire with 35,258 participants
starting the questionnaire and 27,616 completing it.
QUESTIONNAIRE DESIGN
Natural Resources Canada designed the questionnaire in both official languages.
QUESTIONNAIRE ADMINISTRATION
Canadians were invited to complete the TMX project questionnaire online from June 30 to September
30, 2016. The questionnaire took an average of 6 minutes and 44 seconds to complete.1
Natural Resources Canada informed Canadians participating in the questionnaire of the purpose of the
questionnaire and how their information would be used and protected under the Privacy Act.
DATA ANALYSIS
Upon completion of data collection, Natural Resources Canada provided Nielsen with final CSV file for
the TMX questionnaire. Nielsen cleaned and prepared the data file as necessary. Nielsen’s data analysis
procedures are outlined below:
Data Validity and Integrity Checks: Nielsen’s custom system immediately identifies cases where the
response length is unrealistically short. As a result, Nielsen can determine whether a case should be
excluded from the final qualitative analysis if necessary. All of these checks are performed manually and
cleaned out of the data in the back end of the project. Nielsen uses a checklist to ensure all data that is
delivered to the client has gone through a rigorous quality control process.
Data Analysis: Nielsen prepared an analysis plan that included key banner breaks as required. Once the
questionnaire data was collected and cleaned, Nielsen ran a series of data tables that provided results
for all questions in the questionnaire, both overall and broken down by selected “banners.” This
permitted the comparison of qualitative results from various sub-group segments of interest based on
demographic questions. The analysis plan included banners for the key demographic segments asked in
the questionnaire, such as region, rural/urban divisions, etc.
1 Some participants took a substantially long time to complete the survey (1 hour and longer), which increased the average
completion time to 21 minutes and 47 seconds. After removing the outliers, the average completion time was 6 minutes and 44
seconds.
7 | P a g e
Reporting Notes
Views analysed throughout this report were collected through an online public consultation. This
approach maximizes the participation of Canadians nationally. However, there are some implications
inherent of conducting an online public consultation that should be taken into account when reading
this report:
Given that no quotas to balance the composition of the sample were set, and that those
participating opted to provide their opinion based on their levels of awareness, engagement,
and personal interest, the results cannot be interpreted as being representative of the Canadian
population;
No sampling margin of error or statistical inferences can be calculated on the data of this public
consultation;
The questionnaire included open-ended questions where participants could express their
opinions and views without any set parameters. Therefore, many of the responses provided do
not directly address the topic presented in each question; and,
While the data has been checked to detect multiple submissions from an individual, it is still
possible that the data may include multiple responses from the same participant.
Taking this information into account, the reader of this report should note the following:
Percentages reported should be interpreted with caution. They are presented as guidelines of
the magnitude of opinions received, but should not be interpreted as being representative of
the total population;
In regards to the qualitative analysis of themes mentioned by questionnaire respondents,
responses have been reported within themes, and not by question order;
All responses have been coded and analysed by Nielsen’s coding department. No software was
used to determine whether a response was positive or negative;
Some differences and similarities across regions have been noted throughout the report. For
this analysis, participants were assigned a region based on the survey platform’s recognition of
their province based on their IP address. If available, a postal code was utilized in the absence of
an IP address. The system provides information only at a provincial level and therefore the
privacy of participants is respected; and,
The report includes some verbatim responses. These responses have been selected given that
they reflect the views of a majority of participants addressing the theme reported.
8 | P a g e
DETAILED FINDINGS
The following sections summarize in detail the response of participants to the Trans Mountain
Expansion Project consultation. Responses are also analyzed by different sub-groups, such as region and
category, to identify similarities and differences in views.
Views on the TMX project
Q3. Do you have any views about the Trans Mountain Expansion Project, based
on what you’ve read, seen or heard?
When asked about their views about the TMX project, one third of participants (35%) noted explicitly
their support. These participants did not substantiate their views and limited their responses to general
statements of support, approval of oil transportation by pipeline and suggestions to proceed
immediately with the project.
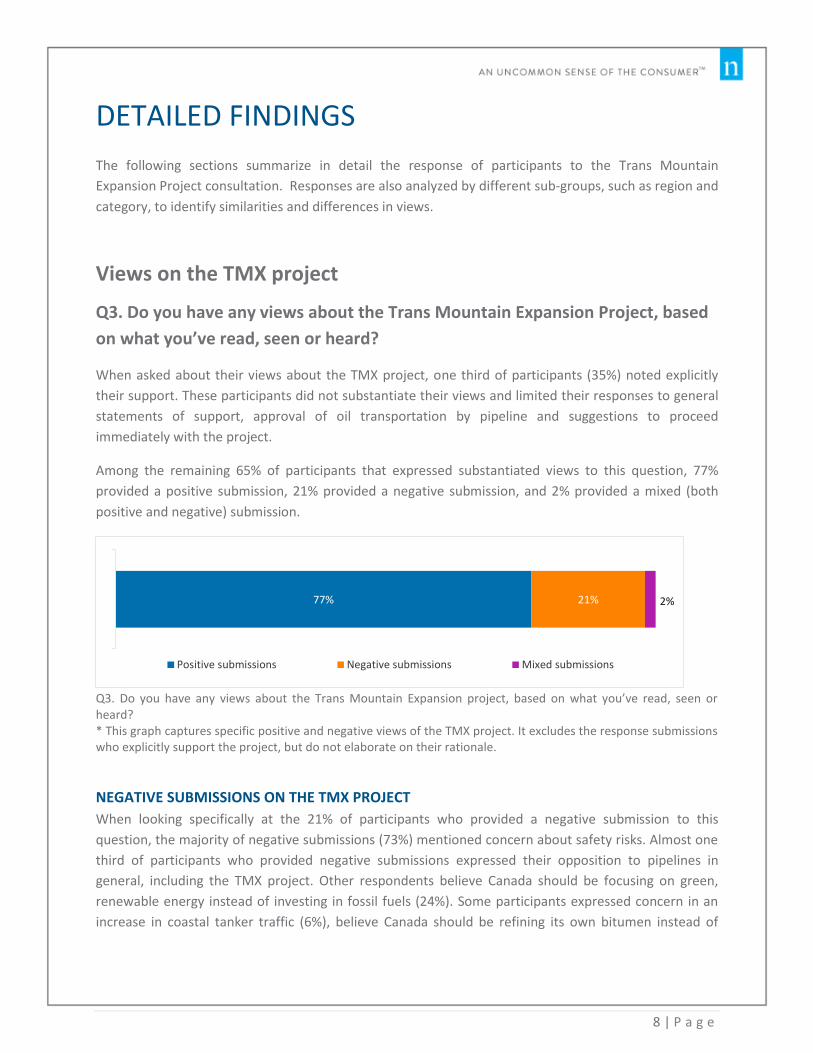
Among the remaining 65% of participants that expressed substantiated views to this question, 77%
provided a positive submission, 21% provided a negative submission, and 2% provided a mixed (both
positive and negative) submission.
Q3. Do you have any views about the Trans Mountain Expansion project, based on what you’ve read, seen or heard? * This graph captures specific positive and negative views of the TMX project. It excludes the response submissions who explicitly support the project, but do not elaborate on their rationale.
NEGATIVE SUBMISSIONS ON THE TMX PROJECT
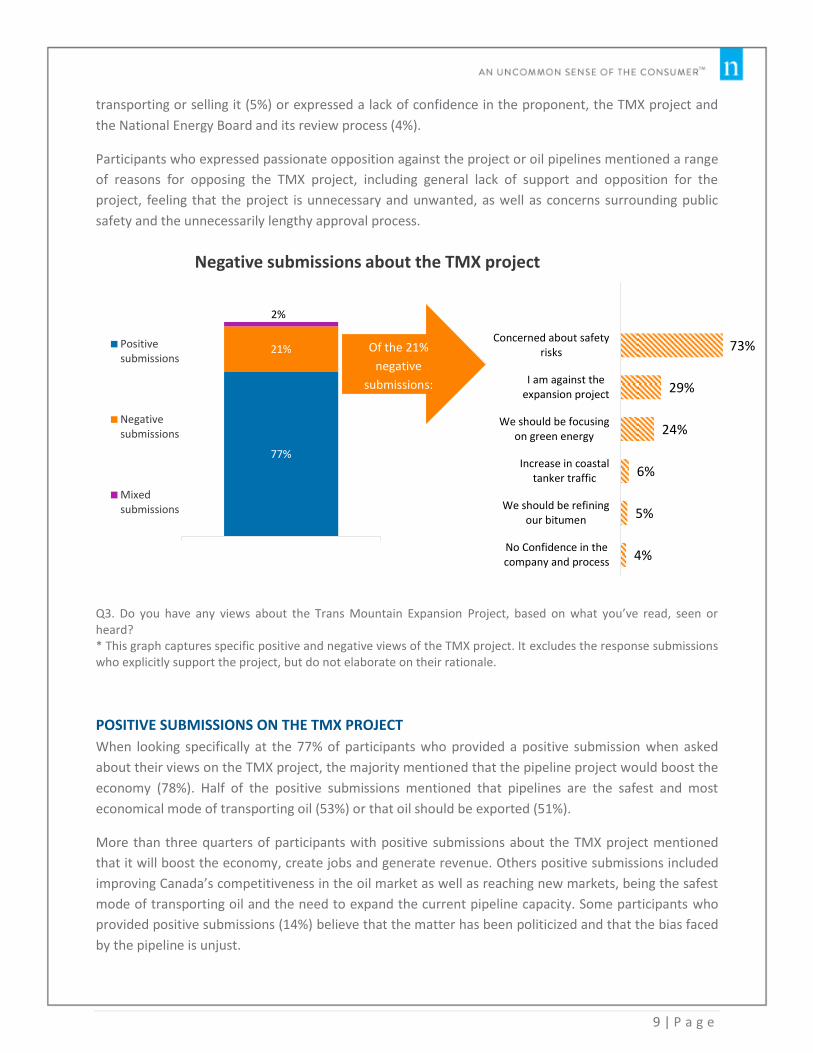
When looking specifically at the 21% of participants who provided a negative submission to this
question, the majority of negative submissions (73%) mentioned concern about safety risks. Almost one
third of participants who provided negative submissions expressed their opposition to pipelines in
general, including the TMX project. Other respondents believe Canada should be focusing on green,
renewable energy instead of investing in fossil fuels (24%). Some participants expressed concern in an
increase in coastal tanker traffic (6%), believe Canada should be refining its own bitumen instead of
77% 21% 2%
Positive submissions Negative submissions Mixed submissions
9 | P a g e
transporting or selling it (5%) or expressed a lack of confidence in the proponent, the TMX project and
the National Energy Board and its review process (4%).
Participants who expressed passionate opposition against the project or oil pipelines mentioned a range
of reasons for opposing the TMX project, including general lack of support and opposition for the
project, feeling that the project is unnecessary and unwanted, as well as concerns surrounding public
safety and the unnecessarily lengthy approval process.
Q3. Do you have any views about the Trans Mountain Expansion Project, based on what you’ve read, seen or heard? * This graph captures specific positive and negative views of the TMX project. It excludes the response submissions who explicitly support the project, but do not elaborate on their rationale.
POSITIVE SUBMISSIONS ON THE TMX PROJECT
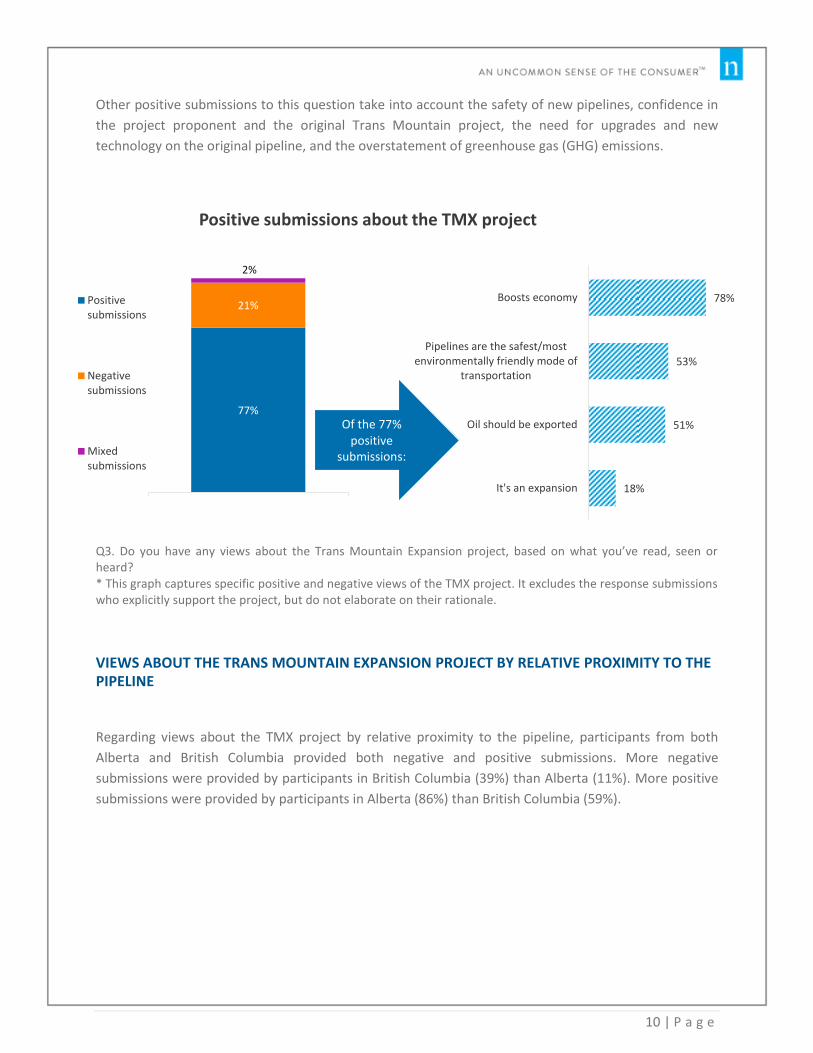
When looking specifically at the 77% of participants who provided a positive submission when asked
about their views on the TMX project, the majority mentioned that the pipeline project would boost the
economy (78%). Half of the positive submissions mentioned that pipelines are the safest and most
economical mode of transporting oil (53%) or that oil should be exported (51%).
More than three quarters of participants with positive submissions about the TMX project mentioned
that it will boost the economy, create jobs and generate revenue. Others positive submissions included
improving Canada’s competitiveness in the oil market as well as reaching new markets, being the safest
mode of transporting oil and the need to expand the current pipeline capacity. Some participants who
provided positive submissions (14%) believe that the matter has been politicized and that the bias faced
by the pipeline is unjust.
77%
21%
2%
Negative submissions about the TMX project
Positivesubmissions
Negativesubmissions
Mixedsubmissions
73%
29%
24%
6%
5%
4%
Concerned about safetyrisks
I am against theexpansion project
We should be focusingon green energy
Increase in coastaltanker traffic
We should be refiningour bitumen
No Confidence in thecompany and process
Of the 21%
negative
submissions:
10 | P a g e
Other positive submissions to this question take into account the safety of new pipelines, confidence in
the project proponent and the original Trans Mountain project, the need for upgrades and new
technology on the original pipeline, and the overstatement of greenhouse gas (GHG) emissions.
Q3. Do you have any views about the Trans Mountain Expansion project, based on what you’ve read, seen or heard? * This graph captures specific positive and negative views of the TMX project. It excludes the response submissions who explicitly support the project, but do not elaborate on their rationale.
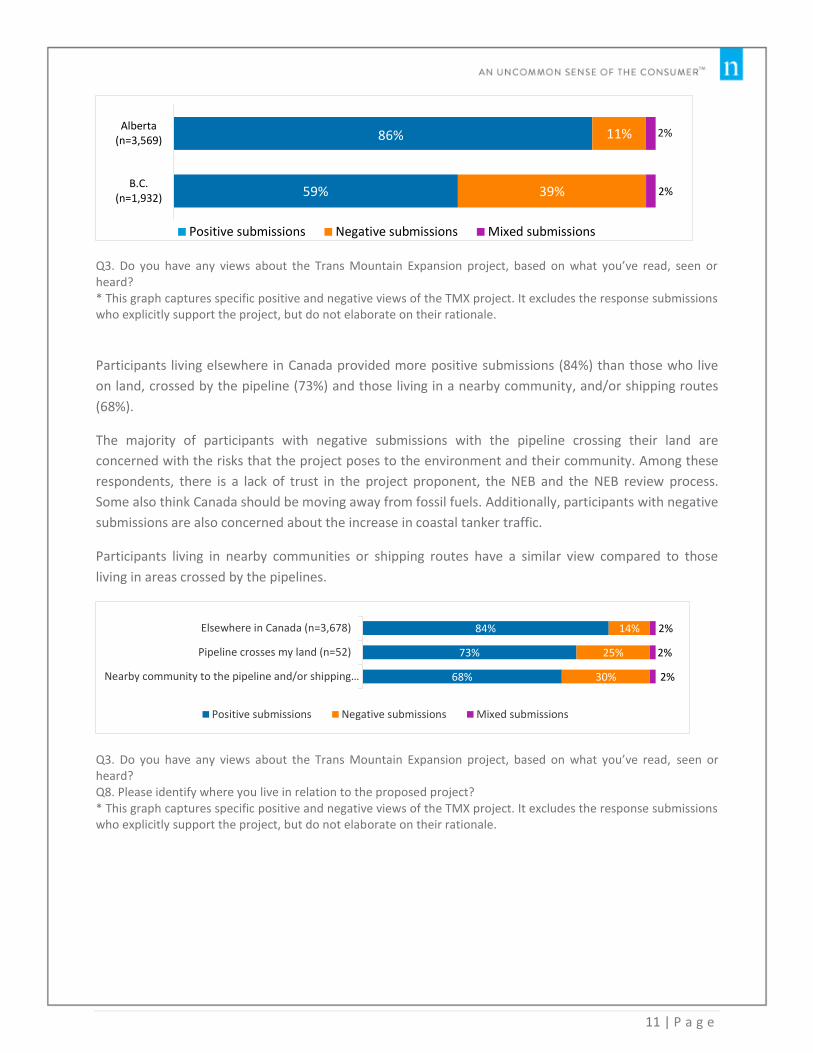
VIEWS ABOUT THE TRANS MOUNTAIN EXPANSION PROJECT BY RELATIVE PROXIMITY TO THE PIPELINE
Regarding views about the TMX project by relative proximity to the pipeline, participants from both
Alberta and British Columbia provided both negative and positive submissions. More negative
submissions were provided by participants in British Columbia (39%) than Alberta (11%). More positive
submissions were provided by participants in Alberta (86%) than British Columbia (59%).
77%
21%
2%
Positive submissions about the TMX project
Positivesubmissions
Negativesubmissions
Mixedsubmissions
78%
53%
51%
18%
Boosts economy
Pipelines are the safest/mostenvironmentally friendly mode of
transportation
Oil should be exported
It's an expansion
Of the 77% positive
submissions:
11 | P a g e
Q3. Do you have any views about the Trans Mountain Expansion project, based on what you’ve read, seen or heard? * This graph captures specific positive and negative views of the TMX project. It excludes the response submissions who explicitly support the project, but do not elaborate on their rationale.
Participants living elsewhere in Canada provided more positive submissions (84%) than those who live
on land, crossed by the pipeline (73%) and those living in a nearby community, and/or shipping routes
(68%).
The majority of participants with negative submissions with the pipeline crossing their land are
concerned with the risks that the project poses to the environment and their community. Among these
respondents, there is a lack of trust in the project proponent, the NEB and the NEB review process.
Some also think Canada should be moving away from fossil fuels. Additionally, participants with negative
submissions are also concerned about the increase in coastal tanker traffic.
Participants living in nearby communities or shipping routes have a similar view compared to those
living in areas crossed by the pipelines.
Q3. Do you have any views about the Trans Mountain Expansion project, based on what you’ve read, seen or heard? Q8. Please identify where you live in relation to the proposed project? * This graph captures specific positive and negative views of the TMX project. It excludes the response submissions who explicitly support the project, but do not elaborate on their rationale.
86%
59%
11%
39%
2%
2%
Alberta(n=3,569)
B.C.(n=1,932)
Positive submissions Negative submissions Mixed submissions
84%
73%
68%
14%
25%
30%
2%
2%
2%
Elsewhere in Canada (n=3,678)
Pipeline crosses my land (n=52)
Nearby community to the pipeline and/or shipping…
Positive submissions Negative submissions Mixed submissions
12 | P a g e
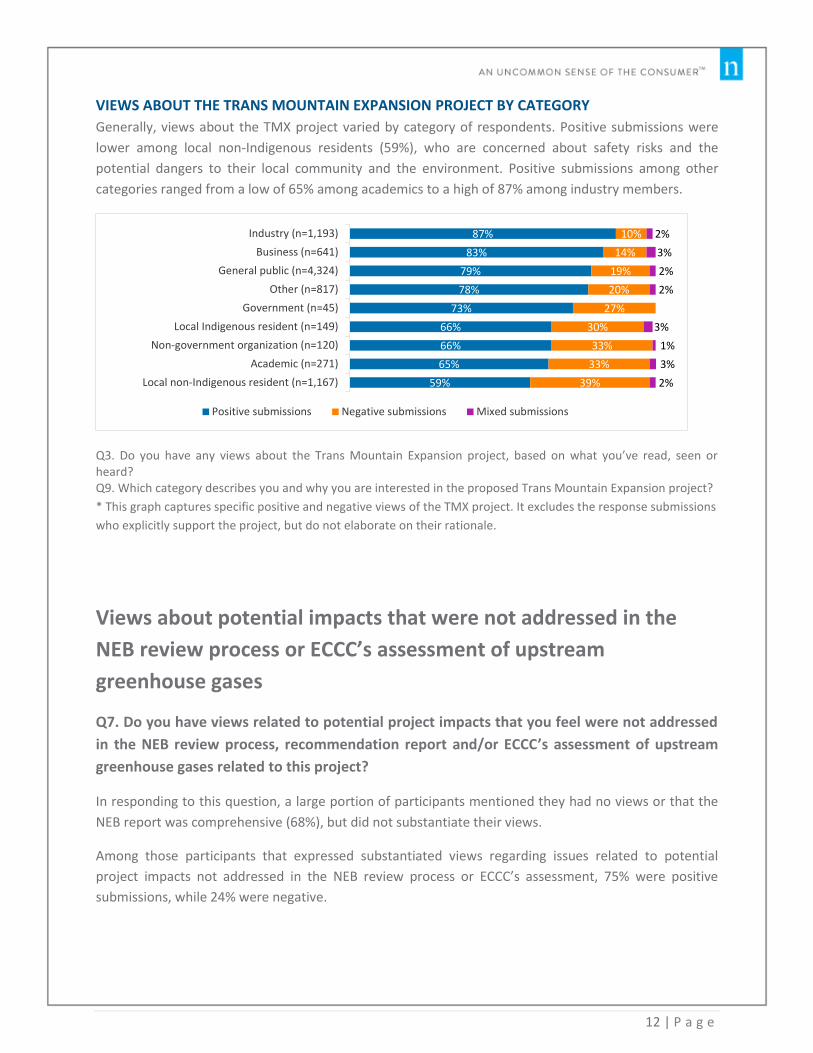
VIEWS ABOUT THE TRANS MOUNTAIN EXPANSION PROJECT BY CATEGORY
Generally, views about the TMX project varied by category of respondents. Positive submissions were
lower among local non-Indigenous residents (59%), who are concerned about safety risks and the
potential dangers to their local community and the environment. Positive submissions among other
categories ranged from a low of 65% among academics to a high of 87% among industry members.
Q3. Do you have any views about the Trans Mountain Expansion project, based on what you’ve read, seen or heard? Q9. Which category describes you and why you are interested in the proposed Trans Mountain Expansion project?
* This graph captures specific positive and negative views of the TMX project. It excludes the response submissions
who explicitly support the project, but do not elaborate on their rationale.
Views about potential impacts that were not addressed in the
NEB review process or ECCC’s assessment of upstream
greenhouse gases
Q7. Do you have views related to potential project impacts that you feel were not addressed
in the NEB review process, recommendation report and/or ECCC’s assessment of upstream
greenhouse gases related to this project?
In responding to this question, a large portion of participants mentioned they had no views or that the
NEB report was comprehensive (68%), but did not substantiate their views.
Among those participants that expressed substantiated views regarding issues related to potential
project impacts not addressed in the NEB review process or ECCC’s assessment, 75% were positive
submissions, while 24% were negative.
87%
83%
79%
78%
73%
66%
66%
65%
59%
10%
14%
19%
20%
27%
30%
33%
33%
39%
2%
3%
2%
2%
3%
1%
3%
2%
Industry (n=1,193)
Business (n=641)
General public (n=4,324)
Other (n=817)
Government (n=45)
Local Indigenous resident (n=149)
Non-government organization (n=120)
Academic (n=271)
Local non-Indigenous resident (n=1,167)
Positive submissions Negative submissions Mixed submissions
13 | P a g e
Q7. Do you have views related to potential project impacts that you feel were not addressed in the NEB review process, recommendation report and/or ECCC’s assessment of upstream greenhouse gases related to this project? * This graph captures specific positive and negative views of the TMX project. It excludes the response submissions who explicitly support the project, but do not elaborate on their rationale.
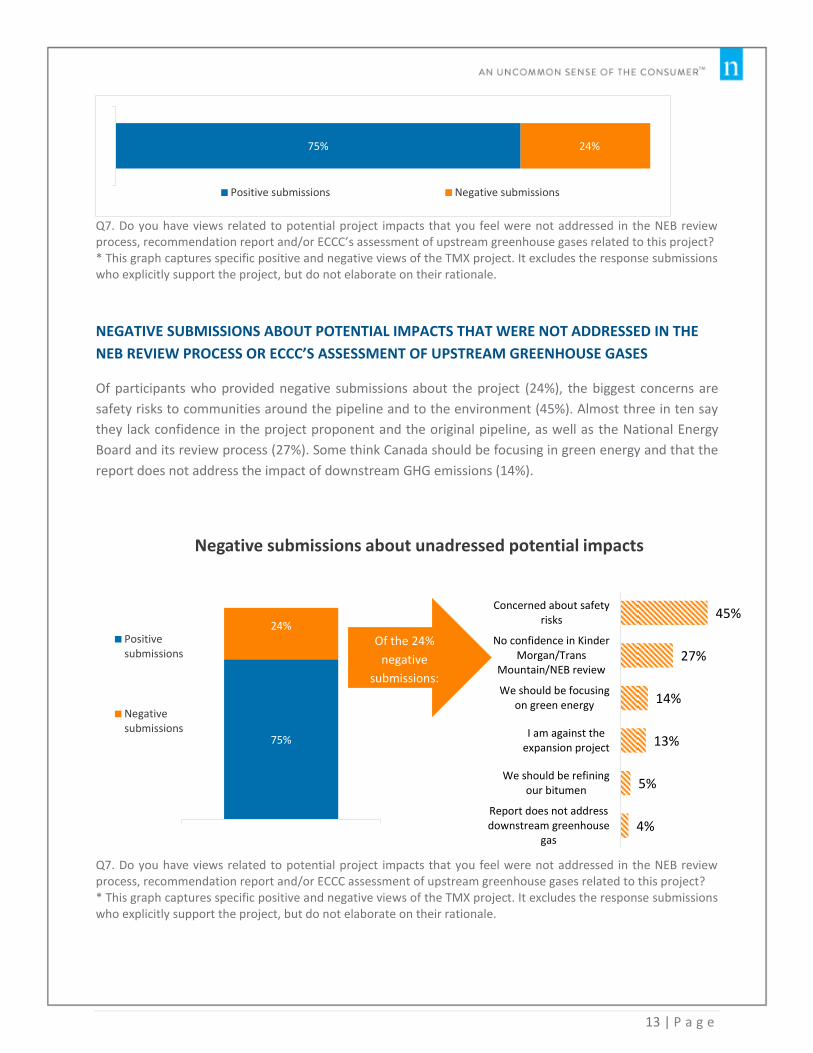
NEGATIVE SUBMISSIONS ABOUT POTENTIAL IMPACTS THAT WERE NOT ADDRESSED IN THE
NEB REVIEW PROCESS OR ECCC’S ASSESSMENT OF UPSTREAM GREENHOUSE GASES
Of participants who provided negative submissions about the project (24%), the biggest concerns are
safety risks to communities around the pipeline and to the environment (45%). Almost three in ten say
they lack confidence in the project proponent and the original pipeline, as well as the National Energy
Board and its review process (27%). Some think Canada should be focusing in green energy and that the
report does not address the impact of downstream GHG emissions (14%).
Q7. Do you have views related to potential project impacts that you feel were not addressed in the NEB review process, recommendation report and/or ECCC assessment of upstream greenhouse gases related to this project? * This graph captures specific positive and negative views of the TMX project. It excludes the response submissions who explicitly support the project, but do not elaborate on their rationale.
75% 24%
Positive submissions Negative submissions
75%
24%
Negative submissions about unadressed potential impacts
Positivesubmissions
Negativesubmissions
45%
27%
14%
13%
5%
4%
Concerned about safetyrisks
No confidence in KinderMorgan/Trans
Mountain/NEB review
We should be focusingon green energy
I am against theexpansion project
We should be refiningour bitumen
Report does not addressdownstream greenhouse
gas
Of the 24%
negative
submissions:

14 | P a g e
POSITIVE SUBMISSIONS ABOUT POTENTIAL IMPACTS THAT WERE NOT ADDRESSED IN THE NEB REVIEW PROCESS OR ECCC’S ASSESSMENT OF UPSTREAM GREENHOUSE GASES
When looking specifically at the 75% of participants who provided a positive submission to this question,
the majority of positive submissions mentioned that GHGs or environmental concerns are overstated
(36%). One in five mentioned pipelines are the safest, most environmentally friendly mode of
transporting oil (22%) and that pipelines boost the economy, generate revenue and create jobs (20%).
Other positive submissions include the economic benefits of the pipeline and confidence in the project
proponent and the original Trans Mountain pipeline.
Q7. Do you have views related to potential project impacts that you feel were not addressed in the NEB review process, recommendation report and/or the ECCC assessment of upstream greenhouse gases related to this project? * This graph captures specific positive and negative views of the TMX project. It excludes the response submissions who explicitly support the project, but do not elaborate on their rationale.
75%
24%
Positive submissions about unaddressed potential impacts
Positivesubmissions
Negativesubmissions
36%
22%
20%
15%
4%
Environmental concerns areoverstated
Pipelines are the safest/mostenvironmentally friendly mode of…
Boosts economy
Bias is unjust/ political
Confidence/trust in Kinder Morgan/ Trans Mountain
Of the 75% positive
submissions:
15 | P a g e
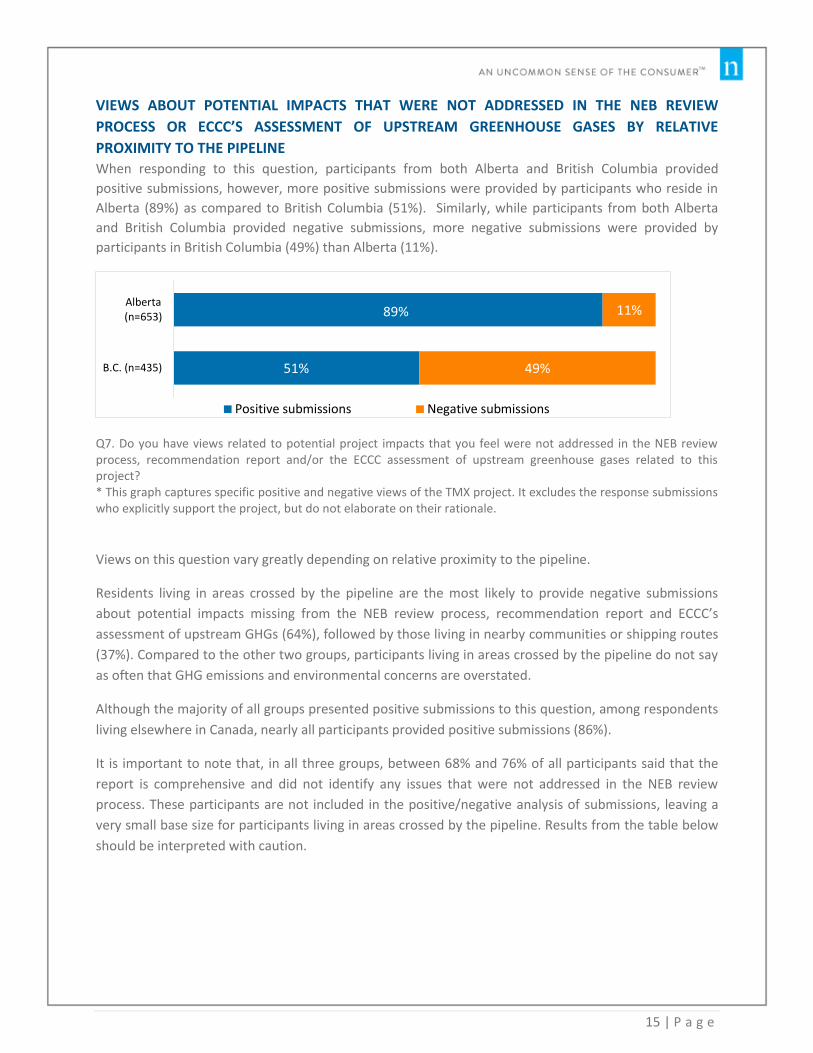
VIEWS ABOUT POTENTIAL IMPACTS THAT WERE NOT ADDRESSED IN THE NEB REVIEW
PROCESS OR ECCC’S ASSESSMENT OF UPSTREAM GREENHOUSE GASES BY RELATIVE
PROXIMITY TO THE PIPELINE
When responding to this question, participants from both Alberta and British Columbia provided
positive submissions, however, more positive submissions were provided by participants who reside in
Alberta (89%) as compared to British Columbia (51%). Similarly, while participants from both Alberta
and British Columbia provided negative submissions, more negative submissions were provided by
participants in British Columbia (49%) than Alberta (11%).
Q7. Do you have views related to potential project impacts that you feel were not addressed in the NEB review process, recommendation report and/or the ECCC assessment of upstream greenhouse gases related to this project? * This graph captures specific positive and negative views of the TMX project. It excludes the response submissions who explicitly support the project, but do not elaborate on their rationale.
Views on this question vary greatly depending on relative proximity to the pipeline.
Residents living in areas crossed by the pipeline are the most likely to provide negative submissions
about potential impacts missing from the NEB review process, recommendation report and ECCC’s
assessment of upstream GHGs (64%), followed by those living in nearby communities or shipping routes
(37%). Compared to the other two groups, participants living in areas crossed by the pipeline do not say
as often that GHG emissions and environmental concerns are overstated.
Although the majority of all groups presented positive submissions to this question, among respondents
living elsewhere in Canada, nearly all participants provided positive submissions (86%).
It is important to note that, in all three groups, between 68% and 76% of all participants said that the
report is comprehensive and did not identify any issues that were not addressed in the NEB review
process. These participants are not included in the positive/negative analysis of submissions, leaving a
very small base size for participants living in areas crossed by the pipeline. Results from the table below
should be interpreted with caution.
89%
51%
11%
49%
Alberta(n=653)
B.C. (n=435)
Positive submissions Negative submissions
16 | P a g e
Q7. Do you have views related to potential project impacts that you feel were not addressed in the NEB review process, recommendation report and/or ECCC assessment of upstream greenhouse gases related to this project? Q8. Please identify where you live in relation to the proposed project? * This graph captures specific positive and negative views of the TMX project. It excludes the response submissions who explicitly support the project, but do not elaborate on their rationale.
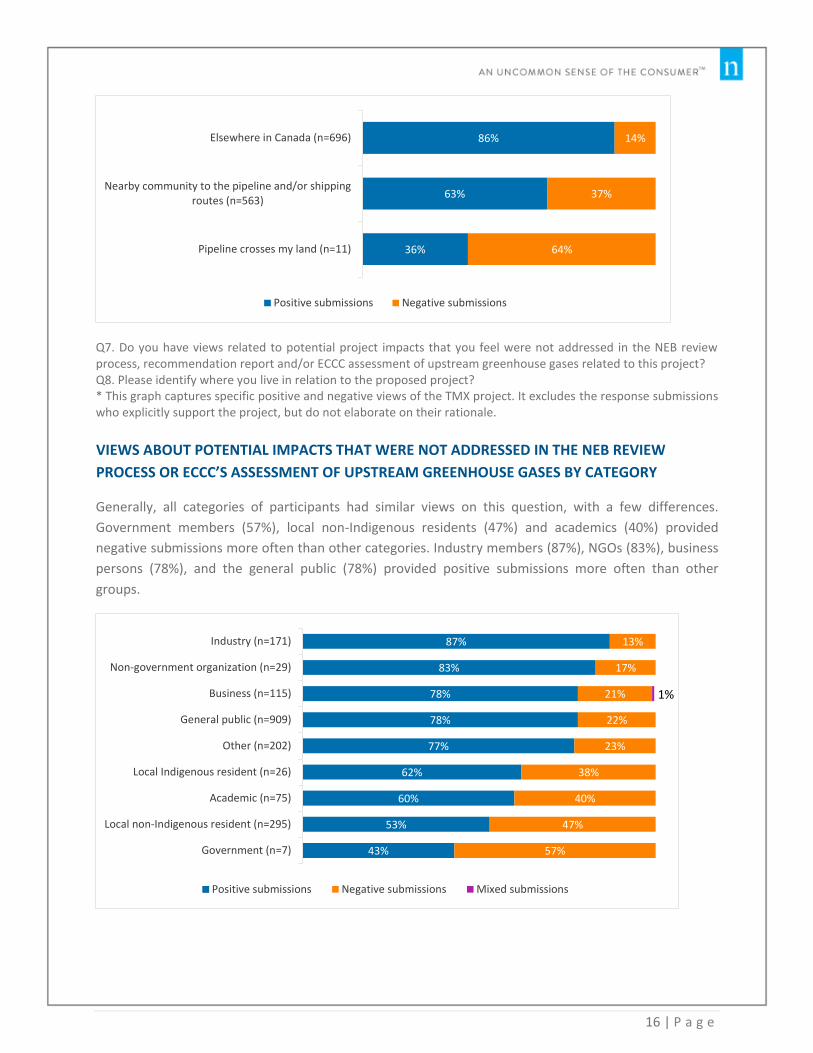
VIEWS ABOUT POTENTIAL IMPACTS THAT WERE NOT ADDRESSED IN THE NEB REVIEW
PROCESS OR ECCC’S ASSESSMENT OF UPSTREAM GREENHOUSE GASES BY CATEGORY
Generally, all categories of participants had similar views on this question, with a few differences.
Government members (57%), local non-Indigenous residents (47%) and academics (40%) provided
negative submissions more often than other categories. Industry members (87%), NGOs (83%), business
persons (78%), and the general public (78%) provided positive submissions more often than other
groups.
86%
63%
36%
14%
37%
64%
Elsewhere in Canada (n=696)
Nearby community to the pipeline and/or shippingroutes (n=563)
Pipeline crosses my land (n=11)
Positive submissions Negative submissions
87%
83%
78%
78%
77%
62%
60%
53%
43%
13%
17%
21%
22%
23%
38%
40%
47%
57%
1%
Industry (n=171)
Non-government organization (n=29)
Business (n=115)
General public (n=909)
Other (n=202)
Local Indigenous resident (n=26)
Academic (n=75)
Local non-Indigenous resident (n=295)
Government (n=7)
Positive submissions Negative submissions Mixed submissions
17 | P a g e
Q7. Do you have views related to potential project impacts that you feel were not addressed in the NEB review process, recommendation report and/or the ECCC assessment of upstream greenhouse gases related to this project? Q9. Which category describes you and why you are interested in the proposed Trans Mountain Expansion project? * This graph captures specific positive and negative views of the TMX project. It excludes the response submissions who explicitly support the project, but do not elaborate on their rationale.
Views related to potential project impacts to your land or
community
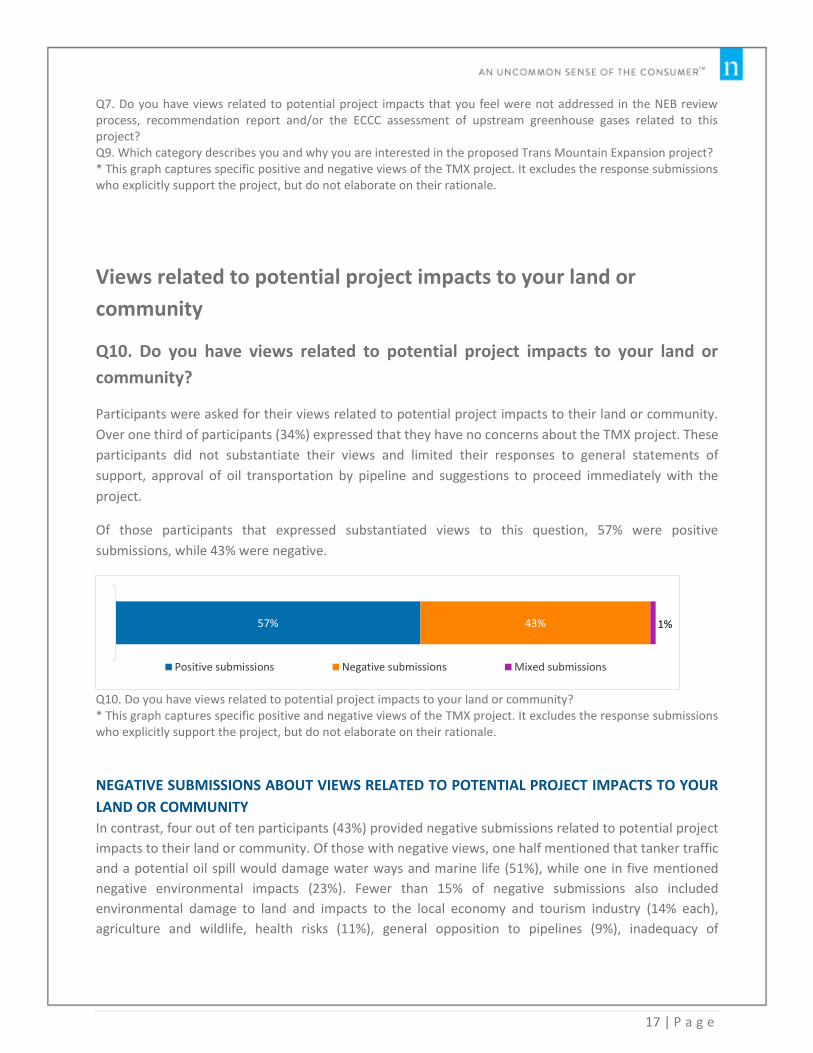
Q10. Do you have views related to potential project impacts to your land or
community?
Participants were asked for their views related to potential project impacts to their land or community.
Over one third of participants (34%) expressed that they have no concerns about the TMX project. These
participants did not substantiate their views and limited their responses to general statements of
support, approval of oil transportation by pipeline and suggestions to proceed immediately with the
project.
Of those participants that expressed substantiated views to this question, 57% were positive
submissions, while 43% were negative.
Q10. Do you have views related to potential project impacts to your land or community? * This graph captures specific positive and negative views of the TMX project. It excludes the response submissions who explicitly support the project, but do not elaborate on their rationale.
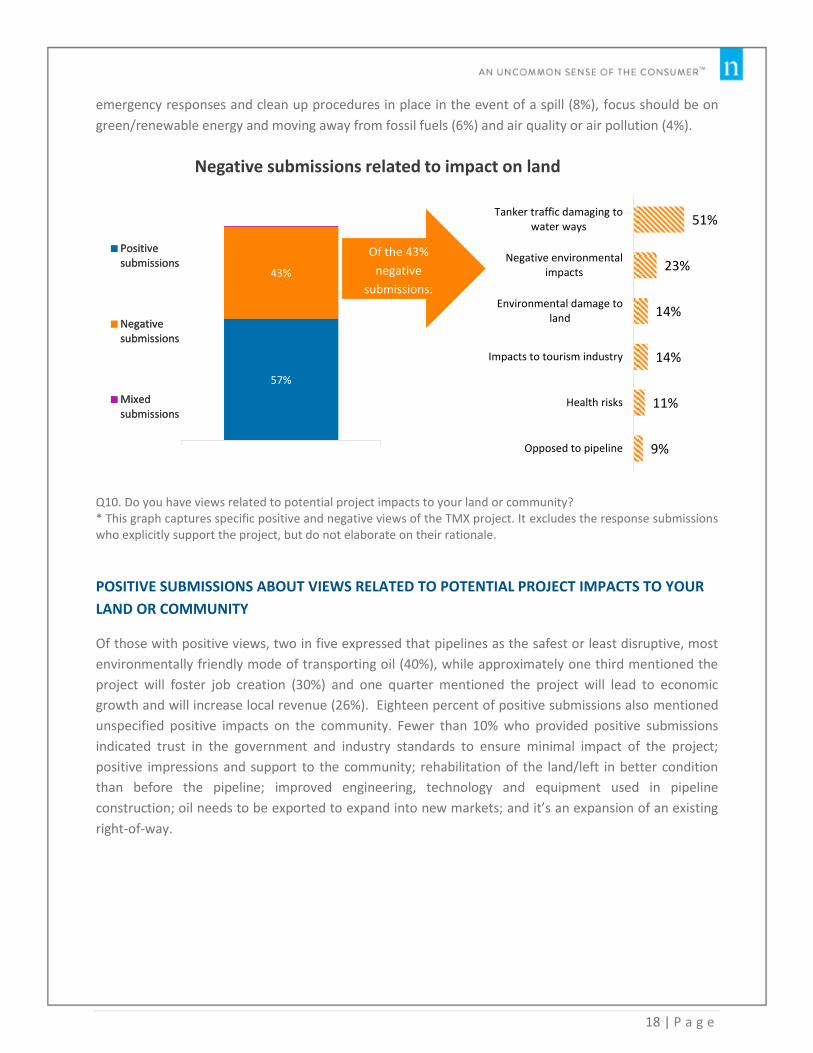
NEGATIVE SUBMISSIONS ABOUT VIEWS RELATED TO POTENTIAL PROJECT IMPACTS TO YOUR
LAND OR COMMUNITY
In contrast, four out of ten participants (43%) provided negative submissions related to potential project
impacts to their land or community. Of those with negative views, one half mentioned that tanker traffic
and a potential oil spill would damage water ways and marine life (51%), while one in five mentioned
negative environmental impacts (23%). Fewer than 15% of negative submissions also included
environmental damage to land and impacts to the local economy and tourism industry (14% each),
agriculture and wildlife, health risks (11%), general opposition to pipelines (9%), inadequacy of
57% 43% 1%
Positive submissions Negative submissions Mixed submissions
18 | P a g e
emergency responses and clean up procedures in place in the event of a spill (8%), focus should be on
green/renewable energy and moving away from fossil fuels (6%) and air quality or air pollution (4%).
Q10. Do you have views related to potential project impacts to your land or community? * This graph captures specific positive and negative views of the TMX project. It excludes the response submissions who explicitly support the project, but do not elaborate on their rationale.
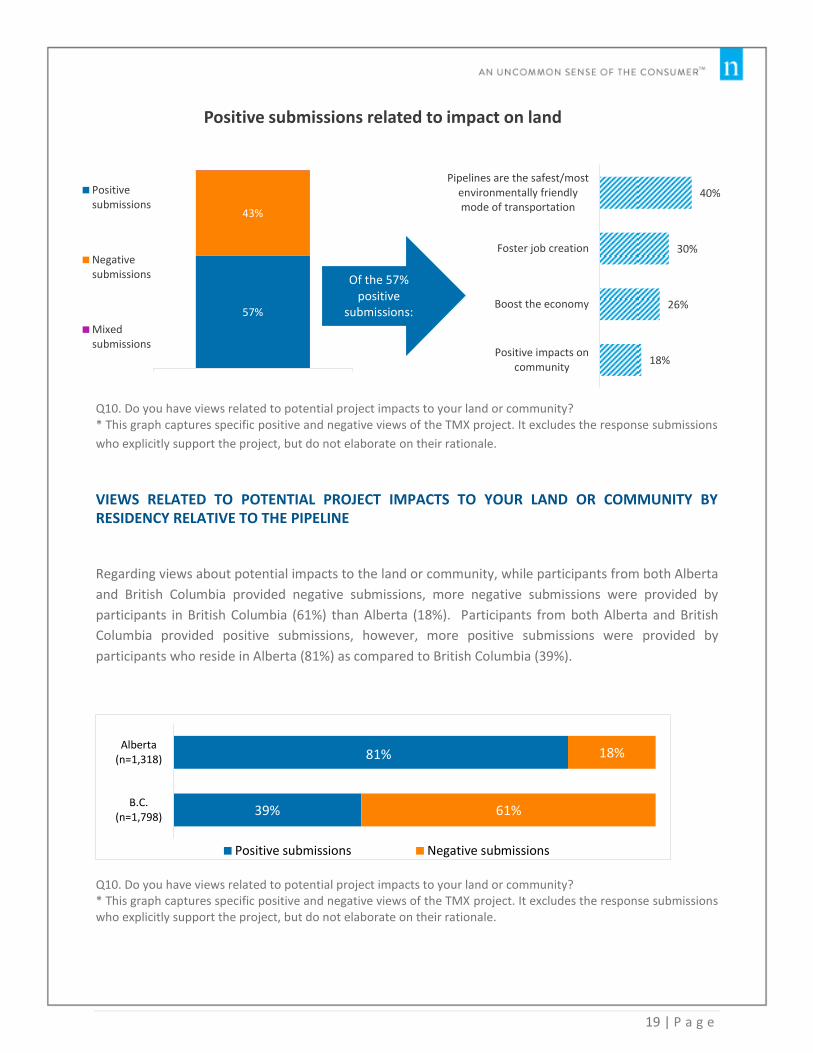
POSITIVE SUBMISSIONS ABOUT VIEWS RELATED TO POTENTIAL PROJECT IMPACTS TO YOUR
LAND OR COMMUNITY
Of those with positive views, two in five expressed that pipelines as the safest or least disruptive, most
environmentally friendly mode of transporting oil (40%), while approximately one third mentioned the
project will foster job creation (30%) and one quarter mentioned the project will lead to economic
growth and will increase local revenue (26%). Eighteen percent of positive submissions also mentioned
unspecified positive impacts on the community. Fewer than 10% who provided positive submissions
indicated trust in the government and industry standards to ensure minimal impact of the project;
positive impressions and support to the community; rehabilitation of the land/left in better condition
than before the pipeline; improved engineering, technology and equipment used in pipeline
construction; oil needs to be exported to expand into new markets; and it’s an expansion of an existing
right-of-way.
57%
43%
Negative submissions related to impact on land
Positivesubmissions
Negativesubmissions
Mixedsubmissions
51%
23%
14%
14%
11%
9%
Tanker traffic damaging towater ways
Negative environmentalimpacts
Environmental damage toland
Impacts to tourism industry
Health risks
Opposed to pipeline
Of the 43%
negative
submissions:
57%
43%
Positivesubmissions
Negativesubmissions
Mixedsubmissions
19 | P a g e
Q10. Do you have views related to potential project impacts to your land or community? * This graph captures specific positive and negative views of the TMX project. It excludes the response submissions
who explicitly support the project, but do not elaborate on their rationale.
VIEWS RELATED TO POTENTIAL PROJECT IMPACTS TO YOUR LAND OR COMMUNITY BY RESIDENCY RELATIVE TO THE PIPELINE
Regarding views about potential impacts to the land or community, while participants from both Alberta
and British Columbia provided negative submissions, more negative submissions were provided by
participants in British Columbia (61%) than Alberta (18%). Participants from both Alberta and British
Columbia provided positive submissions, however, more positive submissions were provided by
participants who reside in Alberta (81%) as compared to British Columbia (39%).
Q10. Do you have views related to potential project impacts to your land or community? * This graph captures specific positive and negative views of the TMX project. It excludes the response submissions who explicitly support the project, but do not elaborate on their rationale.
81%
39%
18%
61%
Alberta(n=1,318)
B.C.(n=1,798)
Positive submissions Negative submissions
57%
43%
Positive submissions related to impact on land
Positivesubmissions
Negativesubmissions
Mixedsubmissions
40%
30%
26%
18%
Pipelines are the safest/mostenvironmentally friendlymode of transportation
Foster job creation
Boost the economy
Positive impacts oncommunity
Of the 57% positive
submissions:
20 | P a g e
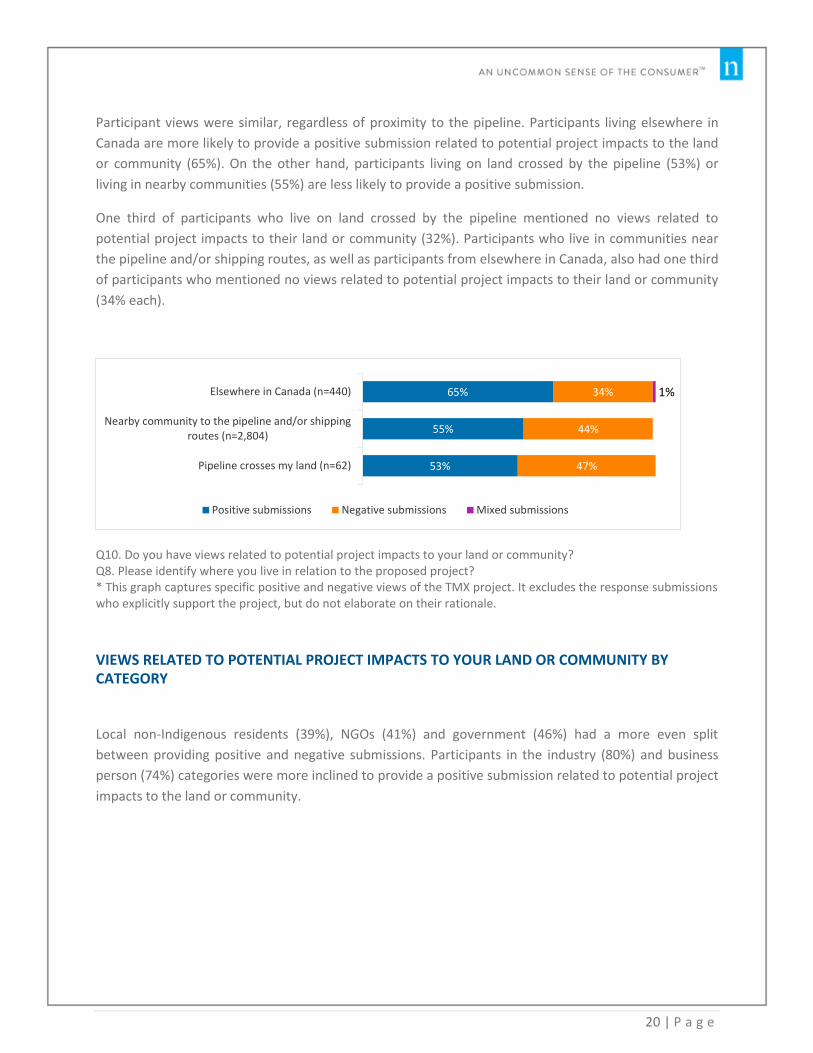
Participant views were similar, regardless of proximity to the pipeline. Participants living elsewhere in
Canada are more likely to provide a positive submission related to potential project impacts to the land
or community (65%). On the other hand, participants living on land crossed by the pipeline (53%) or
living in nearby communities (55%) are less likely to provide a positive submission.
One third of participants who live on land crossed by the pipeline mentioned no views related to
potential project impacts to their land or community (32%). Participants who live in communities near
the pipeline and/or shipping routes, as well as participants from elsewhere in Canada, also had one third
of participants who mentioned no views related to potential project impacts to their land or community
(34% each).
Q10. Do you have views related to potential project impacts to your land or community? Q8. Please identify where you live in relation to the proposed project? * This graph captures specific positive and negative views of the TMX project. It excludes the response submissions who explicitly support the project, but do not elaborate on their rationale.
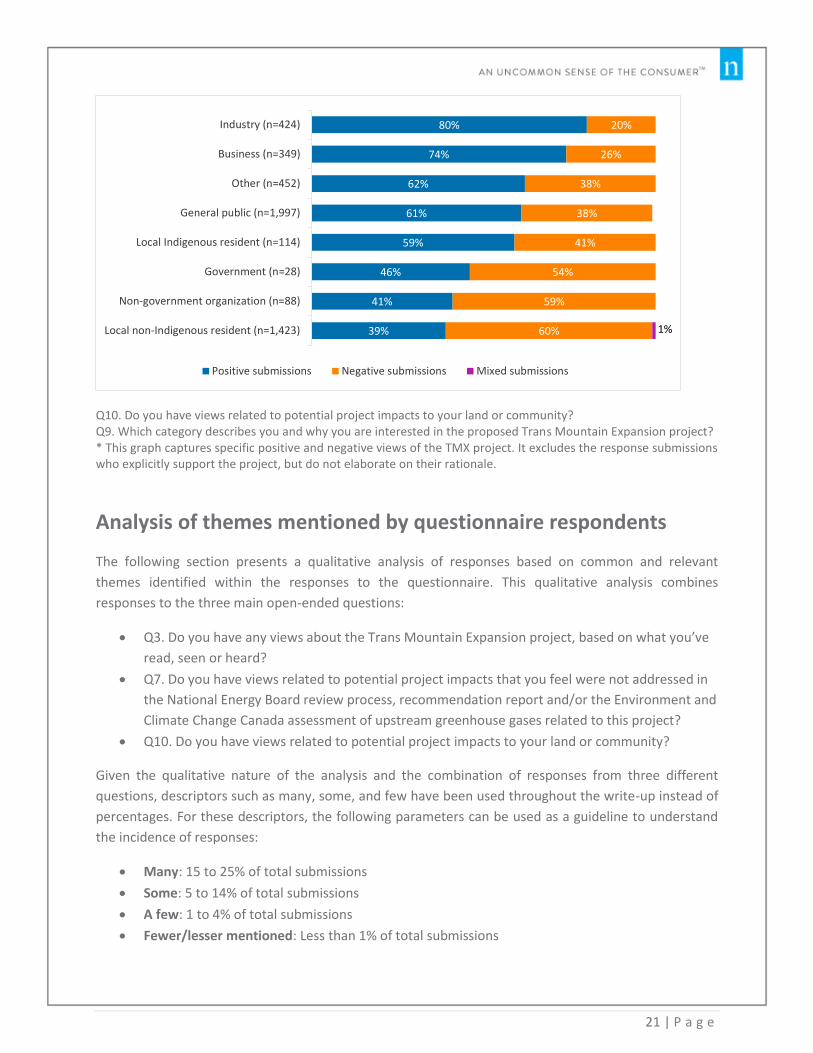
VIEWS RELATED TO POTENTIAL PROJECT IMPACTS TO YOUR LAND OR COMMUNITY BY CATEGORY
Local non-Indigenous residents (39%), NGOs (41%) and government (46%) had a more even split
between providing positive and negative submissions. Participants in the industry (80%) and business
person (74%) categories were more inclined to provide a positive submission related to potential project
impacts to the land or community.
65%
55%
53%
34%
44%
47%
1% Elsewhere in Canada (n=440)
Nearby community to the pipeline and/or shippingroutes (n=2,804)
Pipeline crosses my land (n=62)
Positive submissions Negative submissions Mixed submissions
21 | P a g e
Q10. Do you have views related to potential project impacts to your land or community? Q9. Which category describes you and why you are interested in the proposed Trans Mountain Expansion project? * This graph captures specific positive and negative views of the TMX project. It excludes the response submissions who explicitly support the project, but do not elaborate on their rationale.
Analysis of themes mentioned by questionnaire respondents
The following section presents a qualitative analysis of responses based on common and relevant
themes identified within the responses to the questionnaire. This qualitative analysis combines
responses to the three main open-ended questions:
Q3. Do you have any views about the Trans Mountain Expansion project, based on what you’ve
read, seen or heard?
Q7. Do you have views related to potential project impacts that you feel were not addressed in
the National Energy Board review process, recommendation report and/or the Environment and
Climate Change Canada assessment of upstream greenhouse gases related to this project?
Q10. Do you have views related to potential project impacts to your land or community?
Given the qualitative nature of the analysis and the combination of responses from three different
questions, descriptors such as many, some, and few have been used throughout the write-up instead of
percentages. For these descriptors, the following parameters can be used as a guideline to understand
the incidence of responses:
Many: 15 to 25% of total submissions
Some: 5 to 14% of total submissions
A few: 1 to 4% of total submissions
Fewer/lesser mentioned: Less than 1% of total submissions
80%
74%
62%
61%
59%
46%
41%
39%
20%
26%
38%
38%
41%
54%
59%
60% 1%
Industry (n=424)
Business (n=349)
Other (n=452)
General public (n=1,997)
Local Indigenous resident (n=114)
Government (n=28)
Non-government organization (n=88)
Local non-Indigenous resident (n=1,423)
Positive submissions Negative submissions Mixed submissions
22 | P a g e
VIEWS SURROUNDING THE TMX PROJECT AND THE ECONOMY
While some participants strongly opposed an increase in tanker traffic, a few noted that shipping is an
integral aspect of the economy. Many participants mentioned that, based on their general knowledge of
the issue, the TMX pipeline would benefit the economy by boosting or generating revenue, creating jobs
and prosperity.
“This is an important project for all Canadians and will provide business opportunities not only for the oil
& gas industry but for other industries such as transportation, ship builders, engineering, etc.”
“It is vital to all Canadians economically”
Fewer participants mention other economic benefits of the pipeline to their community, which include
the TMX project leading to economic growth and an increase to local tax revenue, as well as job creation
and the resulting loss of jobs if the pipeline was cancelled. While much less prominent, a few
participants also mentioned the TMX project would promote cost savings within their community, but
did not provide details on how the pipeline will promote savings.
“Projects of this nature create employment”
“…the pipeline has created employment and revenue to our community”
Other lesser mentioned economic benefits described by participants included domestic sourcing with
less reliance on foreign sourcing, that Canadian oil is used to displace corrupt foreign sourcing, that oil
and pipelines are a necessary resource, that pipelines are economical and an effective oil delivery
system.
While there were some economic benefits mentioned by participants, there was also mention of the
economic impacts of the TMX project on the tourism industry by a few participants. Many views
surrounding impacts on the tourism industry were negative, and included general concerns over impacts
to the local economy or tourism industry.
“An oil spill will kill the tourism industry on the west coast”
VIEWS SURROUNDING THE TMX PROJECT AND PUBLIC SAFETY
While public safety was noted as a concern for many participants, there was an overall perception that
pipelines are a safer, less disruptive and more environmentally friendly mode of oil transportation.
However, concerns surrounding increased tanker traffic and oil spills damaging waterways and marine
life were also mentioned by some participants. Public safety risks and dangers to the environment or
local community were mentioned by a few participants. Similarly, a few mentioned negative impacts on
their community or opposition to the pipeline, concerns surrounding health risks and the general safety
of the local population, the environmental damage to land, agriculture and wildlife, as well as air quality
and air pollution.
“It is way safer compared to rail and other means of oil transport”
23 | P a g e
“It needs to be built in a safe and environmentally [friendly] way”
VIEWS ON THE USE OF FOSSIL FUELS
A few participants made mention of their preference for moving away from the use of fossil fuels. These
participants mentioned negative environmental impacts or dangers surrounding potential oil spills, and
that a focus should be placed on green or renewable energy and moving away from fossil fuels.
“Canada needs to move on from fossil fuel”
“In the midst of a climate crisis we need to pivot to renewables”
VIEWS SURROUNDING ACCESS TO WORLD MARKETS THROUGH THE TMX PROJECT
Many participants mentioned the overall need to export oil and expand to new markets to avoid being
landlocked or bottlenecked. However, fewer participants mentioned that Canada should be allowed to
be competitive on the world market and that Canadian oil should be allowed to be sold at market value.
“It is important to get our resources to market”
“Our country needs pipelines to sell our products to the global market”
VIEWS SURROUNDING CONFIDENCE IN THE TMX PROJECT RISK MITIGATION
Many participants expressed no concerns or views regarding the TMX project, the NEB review process,
the NEB recommendation report, ECCC’s assessment of upstream GHGs or project impacts to their land
or community. Many participants expressed a general confidence in the safeness of pipelines.
A few participants mentioned positive impressions of the project proponent as trustworthy, reputable
and supportive to the community and trust that the government and industry regulations have put
safeguards in place to minimize the impact of the TMX project.
“Pipelines in Canada are safe”
On the other hand, a few other participants mentioned a distrust or lack of confidence in the project
proponent and felt that this was not addressed in the NEB process, NEB recommendation report and/or
the Environment and Climate Change assessment of upstream greenhouse gases. Responses mention
suspicion and a lack of trust, regardless of the provided contingencies, reassurances, explanations or
general information regarding the TMX project.
“Based on everything I know about this project - and Kinder Morgan - I have no question that the
expansion should not be allowed to proceed. It is NOT in the interest of our province or our country”
VIEWS ON MARINE AND ENVIRONMENTAL IMPACTS CAUSED BY THE TMX PROJECT
Some participants mentioned concerns surrounding tanker traffic potentially resulting in oil spills, which
would be damaging to the waterways and marine life, with specific regard to the project impacts on
24 | P a g e
their community. In addition, a few participants also mentioned concerns about environmental damage
to the land, to agriculture and to wildlife, and the overall potential risks and impacts of increased tanker
traffic. Not only were there concerns about public safety, but also about the safety of and impact on
local communities, local water and wildlife in the event of a spill.
“…the pipeline expansion and increased tanker traffic will directly impact the quality of my community's
life.”
“Risk to marine life, animal life, human health”
Other concerns raised by fewer participants with respect to the environment included concerns about
safety risks and dangers to the environment and local communities, general negative environmental
impacts or dangers of oil spills, environmental damage to land, agriculture or wildlife, air quality or air
pollution and health risks or safety of the local population. A few participants mentioned that GHG
emissions or environmental concerns are overstated.
“An oil spill would damage land, parks and shorelines in Vancouver and Burnaby”
“I am concerned about the threat to our wildlife”
OTHER VIEWS SURROUNDING THE TMX PROJECT
As mentioned above, many submissions expressed either support or no concerns for the TMX project.
This was mentioned by over one third of participants with regards to the TMX project in general (35%)
or the potential impacts of the project on their community (34%).
“It should be built”
“Fully supportive of the expansion”
Other views regarding the TMX project mentioned by a few participants included the TMX project being
an expansion or twinning of an existing right-of-way, that the project is facing unjust bias and foreign-
funded opposition or that pipelines are being politicized. Fewer participants mentioned improved
technology, equipment or engineering techniques used in the pipeline construction. A few other
participants mentioned that tanker design was not addressed in the NEB review process, NEB
recommendation report and/or ECCC’s assessment of upstream GHGs. Similarly, fewer participants
mentioned that the fact that the rehabilitation of the land would leave the land in a better condition
than before was also not addressed in the above mentioned reports or processes.
“There is already a right of way. Expansion will not be encroaching on new territory”
“The project is just a twinning of an existing pipeline”
25 | P a g e
Profile of Participants
This section reports the profile composition of participants.
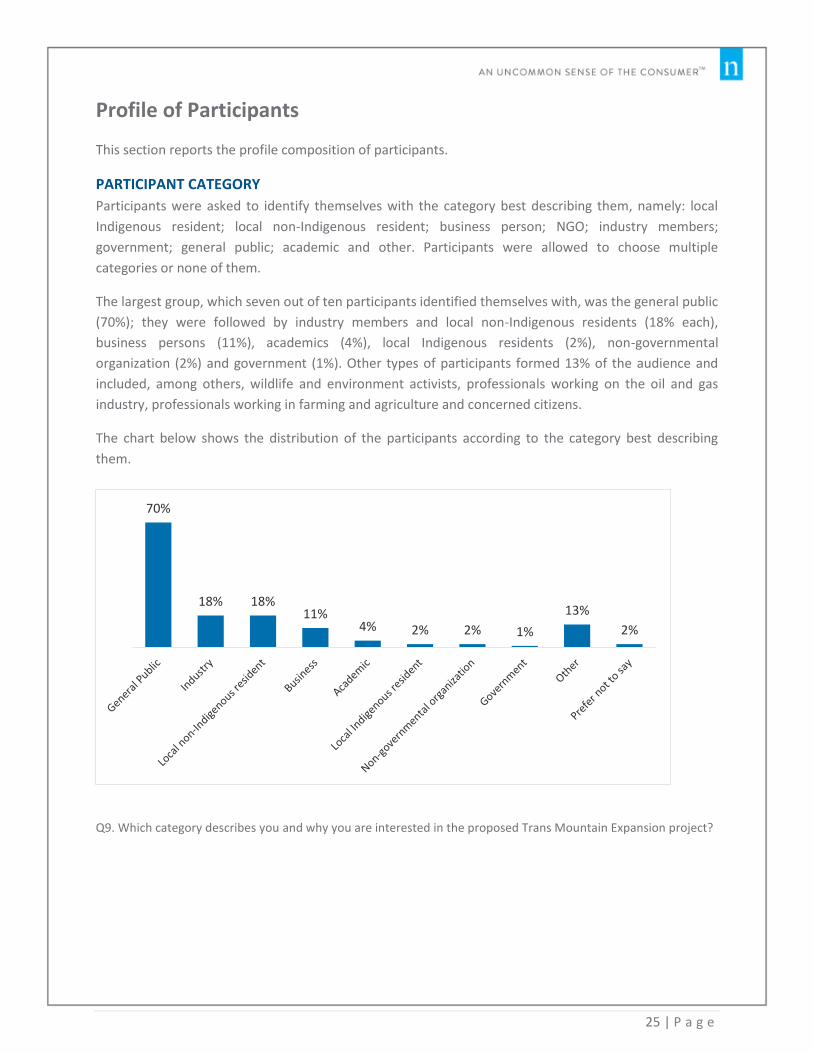
PARTICIPANT CATEGORY
Participants were asked to identify themselves with the category best describing them, namely: local
Indigenous resident; local non-Indigenous resident; business person; NGO; industry members;
government; general public; academic and other. Participants were allowed to choose multiple
categories or none of them.
The largest group, which seven out of ten participants identified themselves with, was the general public
(70%); they were followed by industry members and local non-Indigenous residents (18% each),
business persons (11%), academics (4%), local Indigenous residents (2%), non-governmental
organization (2%) and government (1%). Other types of participants formed 13% of the audience and
included, among others, wildlife and environment activists, professionals working on the oil and gas
industry, professionals working in farming and agriculture and concerned citizens.
The chart below shows the distribution of the participants according to the category best describing
them.
Q9. Which category describes you and why you are interested in the proposed Trans Mountain Expansion project?
70%
18% 18% 11%
4% 2% 2% 1%
13%
2%
26 | P a g e
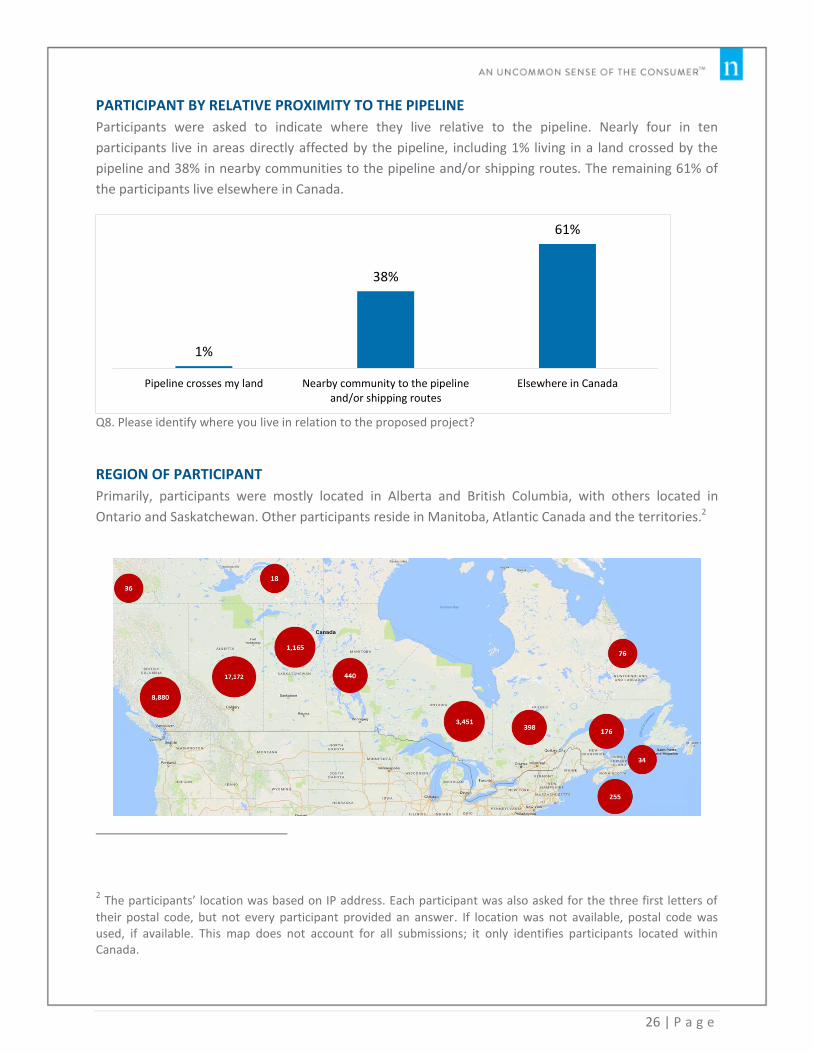
PARTICIPANT BY RELATIVE PROXIMITY TO THE PIPELINE
Participants were asked to indicate where they live relative to the pipeline. Nearly four in ten
participants live in areas directly affected by the pipeline, including 1% living in a land crossed by the
pipeline and 38% in nearby communities to the pipeline and/or shipping routes. The remaining 61% of
the participants live elsewhere in Canada.
Q8. Please identify where you live in relation to the proposed project?
REGION OF PARTICIPANT
Primarily, participants were mostly located in Alberta and British Columbia, with others located in
Ontario and Saskatchewan. Other participants reside in Manitoba, Atlantic Canada and the territories.2
2 The participants’ location was based on IP address. Each participant was also asked for the three first letters of
their postal code, but not every participant provided an answer. If location was not available, postal code was used, if available. This map does not account for all submissions; it only identifies participants located within Canada.
1%
38%
61%
Pipeline crosses my land Nearby community to the pipelineand/or shipping routes
Elsewhere in Canada

27 | P a g e
In addition, participants also provided their feedback from the following locations:
Location Count Africa 8
Asia 21
Australia 13
Bermuda 1
China 3
Dominican Republic 4
Europe 130
Guadeloupe 1
Hong Kong 2
India 2
Japan 11
New Zealand 5
Mexico 24
Middle East 20
Russia 3
South America 22
United Kingdom 49
United States of America 542
Venezuela 2
Unknown 2,294
Familiarity of Participants with the Trans Mountain Expansion
Project
This section summarizes the levels of familiarity of participants with the project.
FAMILIARITY WITH THE TRANS MOUNTAIN EXPANSION PROJECT
The majority of participants (95%) are familiar with the TMX project, with half indicating they are
familiar (50%) and slightly less than half indicating they are somewhat familiar (45%). Only 4% are not
familiar with the project and 1% declined to answer.
28 | P a g e
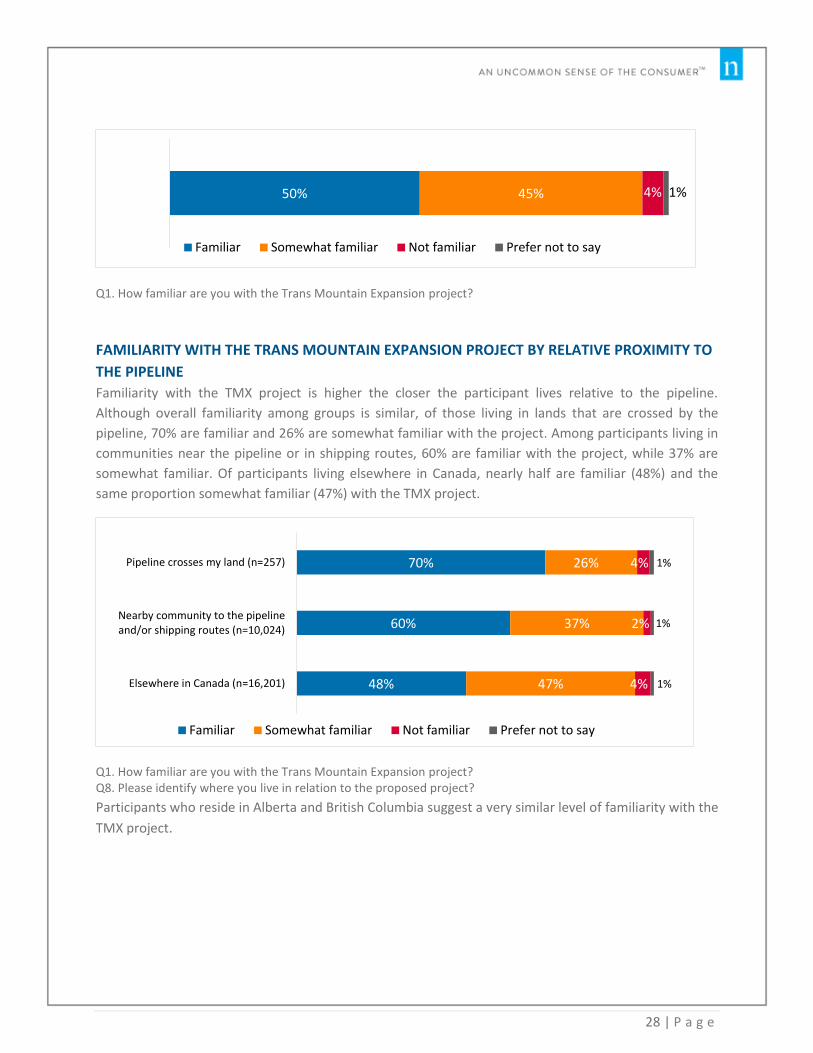
Q1. How familiar are you with the Trans Mountain Expansion project?
FAMILIARITY WITH THE TRANS MOUNTAIN EXPANSION PROJECT BY RELATIVE PROXIMITY TO
THE PIPELINE
Familiarity with the TMX project is higher the closer the participant lives relative to the pipeline.
Although overall familiarity among groups is similar, of those living in lands that are crossed by the
pipeline, 70% are familiar and 26% are somewhat familiar with the project. Among participants living in
communities near the pipeline or in shipping routes, 60% are familiar with the project, while 37% are
somewhat familiar. Of participants living elsewhere in Canada, nearly half are familiar (48%) and the
same proportion somewhat familiar (47%) with the TMX project.
Q1. How familiar are you with the Trans Mountain Expansion project? Q8. Please identify where you live in relation to the proposed project?
Participants who reside in Alberta and British Columbia suggest a very similar level of familiarity with the
TMX project.
50% 45% 4% 1%
Familiar Somewhat familiar Not familiar Prefer not to say
70%
60%
48%
26%
37%
47%
4%
2%
4%
1%
1%
1%
Pipeline crosses my land (n=257)
Nearby community to the pipelineand/or shipping routes (n=10,024)
Elsewhere in Canada (n=16,201)
Familiar Somewhat familiar Not familiar Prefer not to say

29 | P a g e
FAMILIARITY WITH THE TRANS MOUNTAIN EXPANSION PROJECT BY CATEGORY
Familiarity with the project is similar among most categories of participants, ranging from 63% to 66%,
and slightly lower among the general public, industry members and others (50%, 56% and 58%
respectively). There is little variance in overall familiarity (familiar and somewhat familiar).
Q1. How familiar are you with the Trans Mountain Expansion project? Q9. Which category describes you and why you are interested in the proposed Trans Mountain Expansion project?
59%
51%
38%
45%
2%
4%
1%
1%
B.C.(n=8,424)
Alberta(n=16,532)
Prefer not to say
66%
66%
65%
64%
63%
63%
58%
56%
50%
31%
32%
31%
33%
34%
35%
38%
40%
46%
1%
2%
1%
2%
2%
3%
3%
4%
2%
1%
3%
2%
1%
2% 1%
1%
1%
1%
Non-government organization (n=546)
Academic (n=1,204)
Government (n=181)
Local Indigenous resident (n=594)
Business (n=2,898)
Local non-Indigenous resident (n=4,929)
Other (n=3,524)
Industry (n=5027)
General public (n=18,920)
Familiar Somewhat familiar Not familiar Prefer not to say
Familiar Somewhat familiar Not familiar
Q1. How familiar are you with the Trans Mountain Expansion project?
30 | P a g e
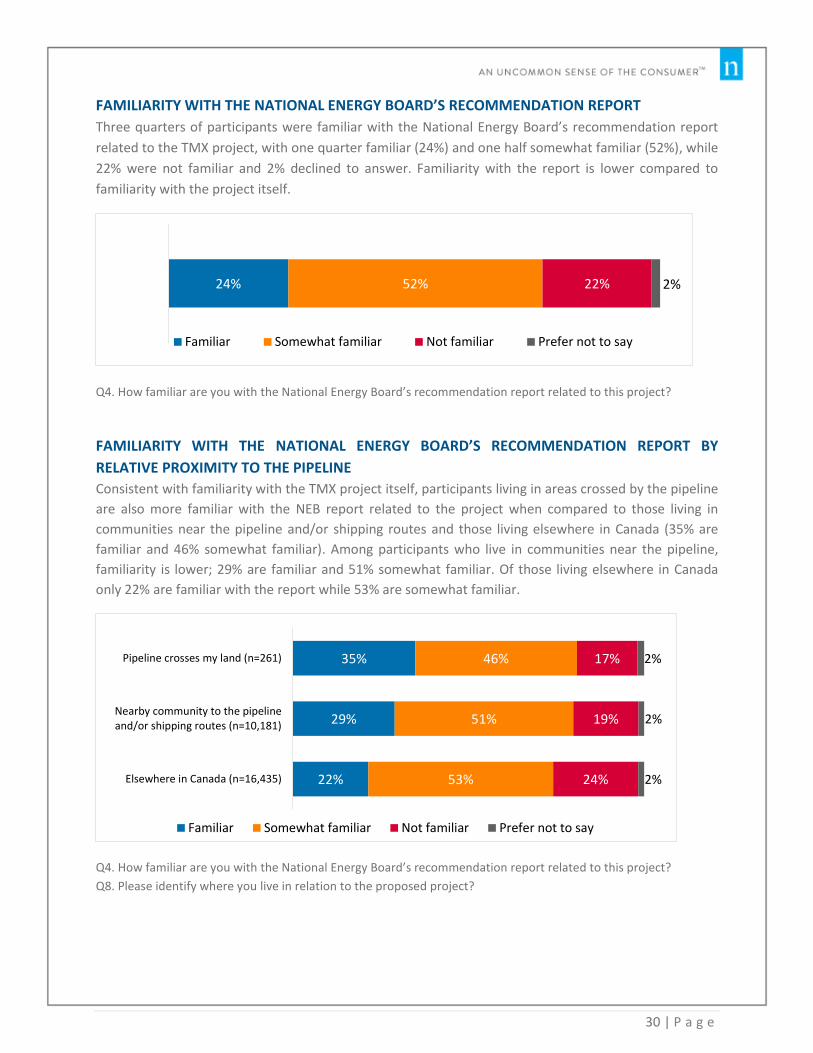
FAMILIARITY WITH THE NATIONAL ENERGY BOARD’S RECOMMENDATION REPORT
Three quarters of participants were familiar with the National Energy Board’s recommendation report
related to the TMX project, with one quarter familiar (24%) and one half somewhat familiar (52%), while
22% were not familiar and 2% declined to answer. Familiarity with the report is lower compared to
familiarity with the project itself.
Q4. How familiar are you with the National Energy Board’s recommendation report related to this project?
FAMILIARITY WITH THE NATIONAL ENERGY BOARD’S RECOMMENDATION REPORT BY
RELATIVE PROXIMITY TO THE PIPELINE
Consistent with familiarity with the TMX project itself, participants living in areas crossed by the pipeline
are also more familiar with the NEB report related to the project when compared to those living in
communities near the pipeline and/or shipping routes and those living elsewhere in Canada (35% are
familiar and 46% somewhat familiar). Among participants who live in communities near the pipeline,
familiarity is lower; 29% are familiar and 51% somewhat familiar. Of those living elsewhere in Canada
only 22% are familiar with the report while 53% are somewhat familiar.
Q4. How familiar are you with the National Energy Board’s recommendation report related to this project?
Q8. Please identify where you live in relation to the proposed project?
24% 52% 22% 2%
Familiar Somewhat familiar Not familiar Prefer not to say
35%
29%
22%
46%
51%
53%
17%
19%
24%
2%
2%
2%
Pipeline crosses my land (n=261)
Nearby community to the pipelineand/or shipping routes (n=10,181)
Elsewhere in Canada (n=16,435)
Familiar Somewhat familiar Not familiar Prefer not to say
31 | P a g e
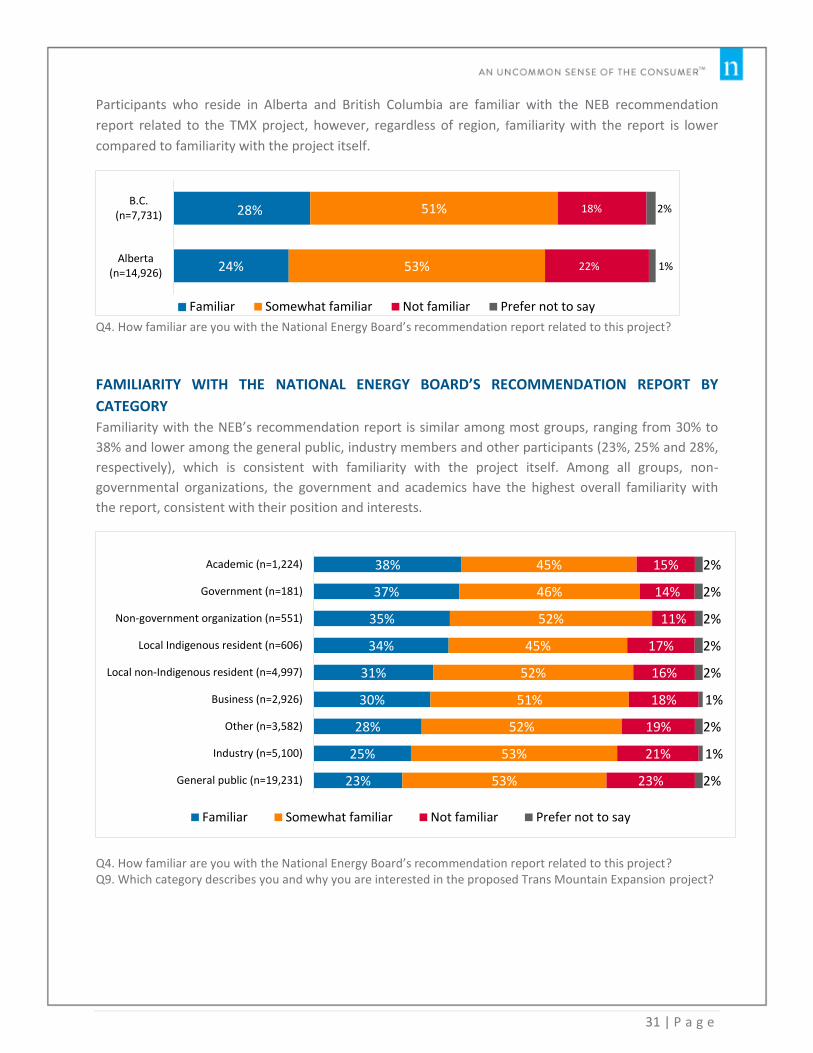
Participants who reside in Alberta and British Columbia are familiar with the NEB recommendation
report related to the TMX project, however, regardless of region, familiarity with the report is lower
compared to familiarity with the project itself.
Q4. How familiar are you with the National Energy Board’s recommendation report related to this project?
FAMILIARITY WITH THE NATIONAL ENERGY BOARD’S RECOMMENDATION REPORT BY
CATEGORY
Familiarity with the NEB’s recommendation report is similar among most groups, ranging from 30% to
38% and lower among the general public, industry members and other participants (23%, 25% and 28%,
respectively), which is consistent with familiarity with the project itself. Among all groups, non-
governmental organizations, the government and academics have the highest overall familiarity with
the report, consistent with their position and interests.
Q4. How familiar are you with the National Energy Board’s recommendation report related to this project? Q9. Which category describes you and why you are interested in the proposed Trans Mountain Expansion project?
28%
24%
51%
53%
18%
22%
2%
1%
B.C.(n=7,731)
Alberta(n=14,926)
Familiar Somewhat familiar Not familiar Prefer not to say
38%
37%
35%
34%
31%
30%
28%
25%
23%
45%
46%
52%
45%
52%
51%
52%
53%
53%
15%
14%
11%
17%
16%
18%
19%
21%
23%
2%
2%
2%
2%
2%
1%
2%
1%
2%
Academic (n=1,224)
Government (n=181)
Non-government organization (n=551)
Local Indigenous resident (n=606)
Local non-Indigenous resident (n=4,997)
Business (n=2,926)
Other (n=3,582)
Industry (n=5,100)
General public (n=19,231)
Familiar Somewhat familiar Not familiar Prefer not to say
32 | P a g e
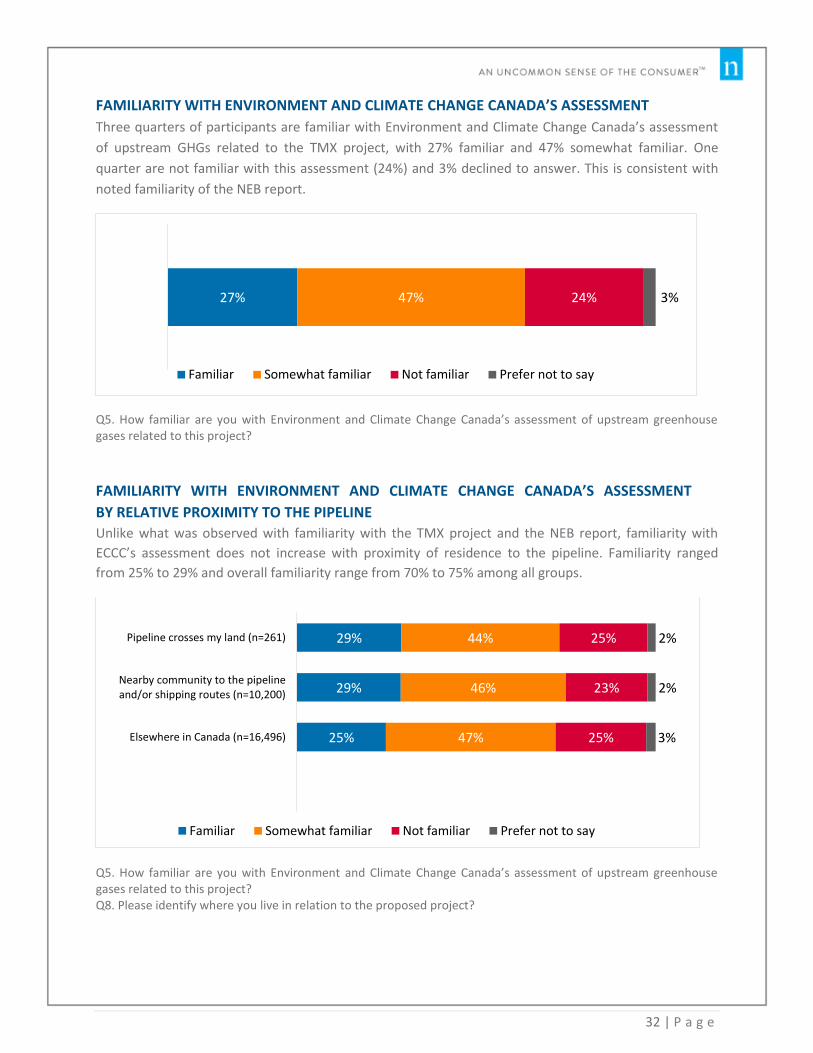
FAMILIARITY WITH ENVIRONMENT AND CLIMATE CHANGE CANADA’S ASSESSMENT
Three quarters of participants are familiar with Environment and Climate Change Canada’s assessment
of upstream GHGs related to the TMX project, with 27% familiar and 47% somewhat familiar. One
quarter are not familiar with this assessment (24%) and 3% declined to answer. This is consistent with
noted familiarity of the NEB report.
Q5. How familiar are you with Environment and Climate Change Canada’s assessment of upstream greenhouse gases related to this project?
FAMILIARITY WITH ENVIRONMENT AND CLIMATE CHANGE CANADA’S ASSESSMENT
BY RELATIVE PROXIMITY TO THE PIPELINE
Unlike what was observed with familiarity with the TMX project and the NEB report, familiarity with
ECCC’s assessment does not increase with proximity of residence to the pipeline. Familiarity ranged
from 25% to 29% and overall familiarity range from 70% to 75% among all groups.
Q5. How familiar are you with Environment and Climate Change Canada’s assessment of upstream greenhouse gases related to this project? Q8. Please identify where you live in relation to the proposed project?
27% 47% 24% 3%
Familiar Somewhat familiar Not familiar Prefer not to say
29%
29%
25%
44%
46%
47%
25%
23%
25%
2%
2%
3%
Pipeline crosses my land (n=261)
Nearby community to the pipelineand/or shipping routes (n=10,200)
Elsewhere in Canada (n=16,496)
Familiar Somewhat familiar Not familiar Prefer not to say
33 | P a g e
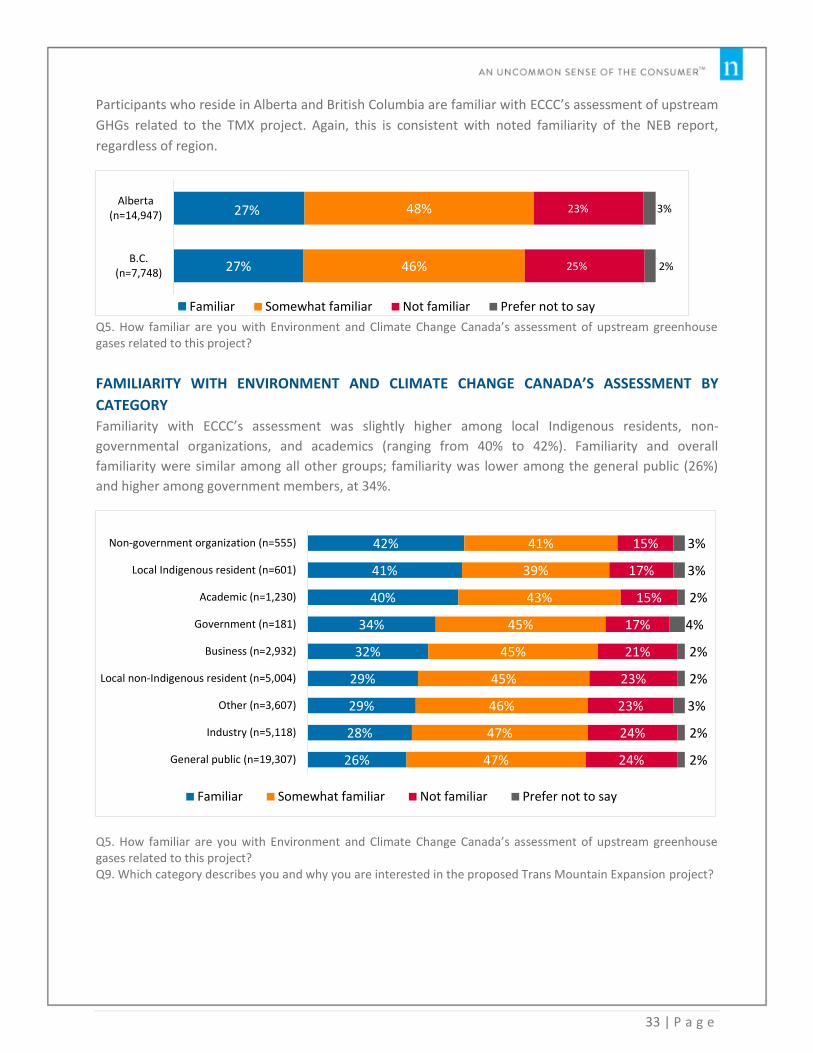
Participants who reside in Alberta and British Columbia are familiar with ECCC’s assessment of upstream
GHGs related to the TMX project. Again, this is consistent with noted familiarity of the NEB report,
regardless of region.
Q5. How familiar are you with Environment and Climate Change Canada’s assessment of upstream greenhouse gases related to this project?
FAMILIARITY WITH ENVIRONMENT AND CLIMATE CHANGE CANADA’S ASSESSMENT BY
CATEGORY
Familiarity with ECCC’s assessment was slightly higher among local Indigenous residents, non-
governmental organizations, and academics (ranging from 40% to 42%). Familiarity and overall
familiarity were similar among all other groups; familiarity was lower among the general public (26%)
and higher among government members, at 34%.
Q5. How familiar are you with Environment and Climate Change Canada’s assessment of upstream greenhouse gases related to this project? Q9. Which category describes you and why you are interested in the proposed Trans Mountain Expansion project?
27%
27%
48%
46%
23%
25%
3%
2%
Alberta(n=14,947)
B.C.(n=7,748)
Familiar Somewhat familiar Not familiar Prefer not to say
42%
41%
40%
34%
32%
29%
29%
28%
26%
41%
39%
43%
45%
45%
45%
46%
47%
47%
15%
17%
15%
17%
21%
23%
23%
24%
24%
3%
3%
2%
4%
2%
2%
3%
2%
2%
Non-government organization (n=555)
Local Indigenous resident (n=601)
Academic (n=1,230)
Government (n=181)
Business (n=2,932)
Local non-Indigenous resident (n=5,004)
Other (n=3,607)
Industry (n=5,118)
General public (n=19,307)
Familiar Somewhat familiar Not familiar Prefer not to say
34 | P a g e
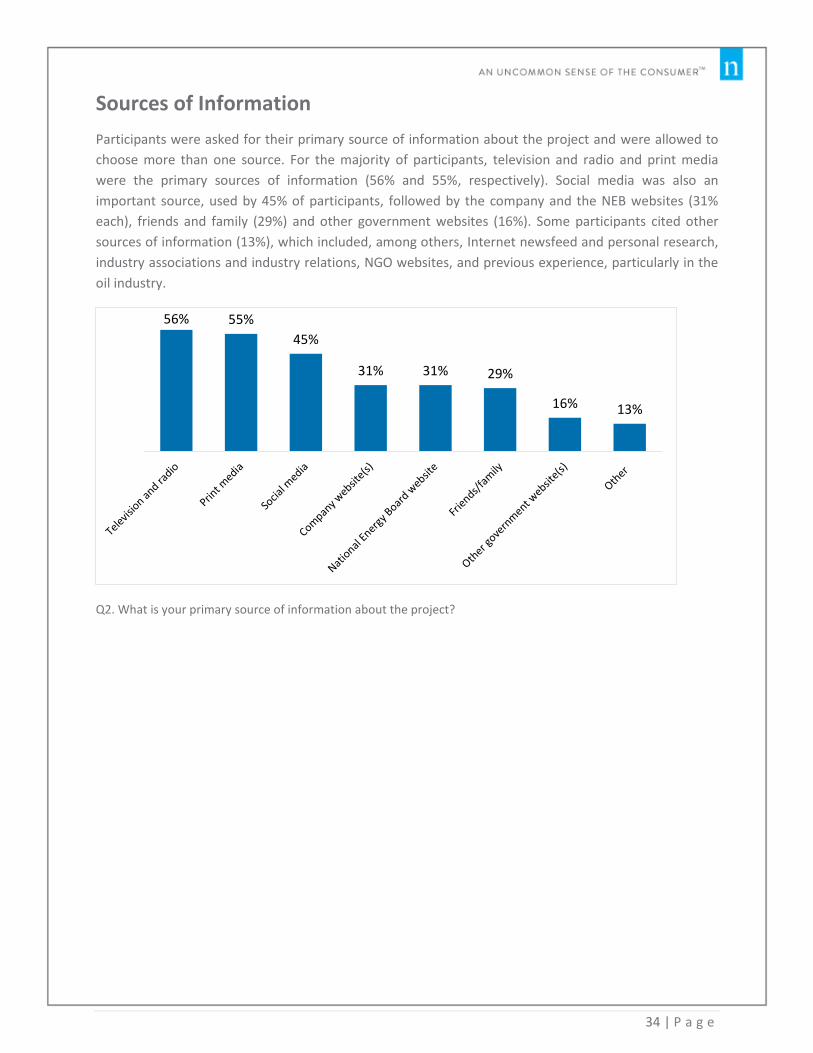
Sources of Information
Participants were asked for their primary source of information about the project and were allowed to
choose more than one source. For the majority of participants, television and radio and print media
were the primary sources of information (56% and 55%, respectively). Social media was also an
important source, used by 45% of participants, followed by the company and the NEB websites (31%
each), friends and family (29%) and other government websites (16%). Some participants cited other
sources of information (13%), which included, among others, Internet newsfeed and personal research,
industry associations and industry relations, NGO websites, and previous experience, particularly in the
oil industry.
Q2. What is your primary source of information about the project?
56% 55%
45%
31% 31% 29%
16% 13%
35 | P a g e
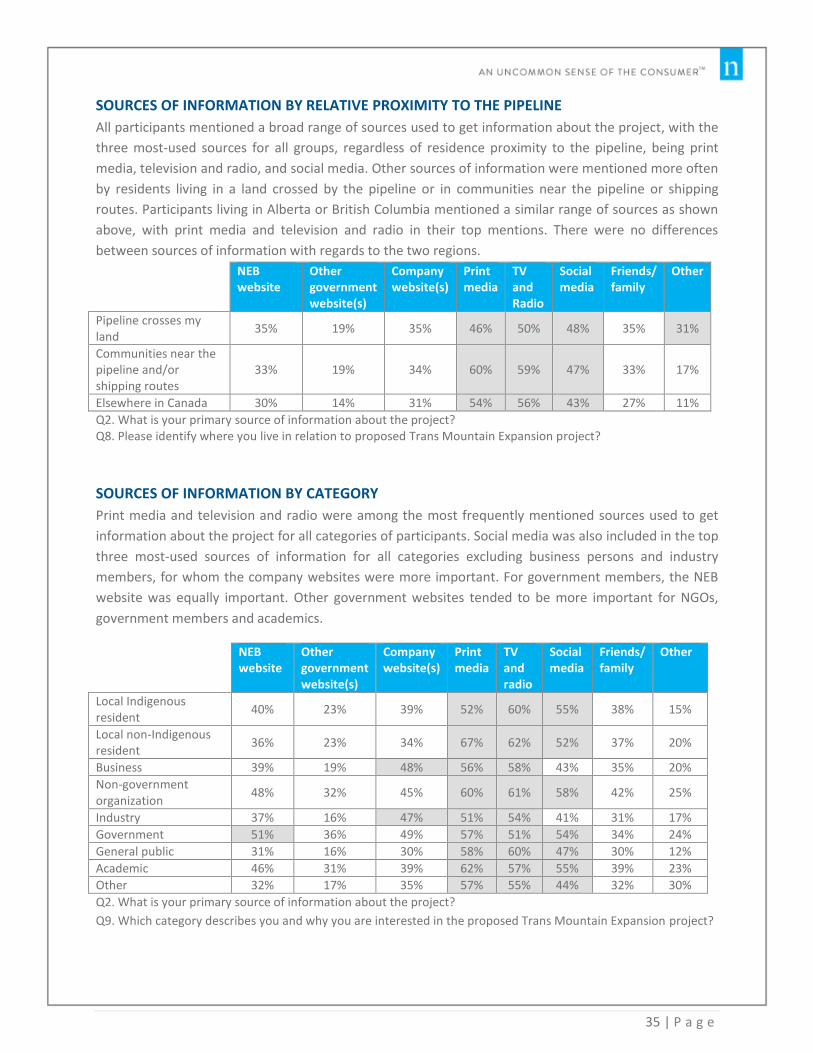
SOURCES OF INFORMATION BY RELATIVE PROXIMITY TO THE PIPELINE
All participants mentioned a broad range of sources used to get information about the project, with the
three most-used sources for all groups, regardless of residence proximity to the pipeline, being print
media, television and radio, and social media. Other sources of information were mentioned more often
by residents living in a land crossed by the pipeline or in communities near the pipeline or shipping
routes. Participants living in Alberta or British Columbia mentioned a similar range of sources as shown
above, with print media and television and radio in their top mentions. There were no differences
between sources of information with regards to the two regions.
NEB website
Other government website(s)
Company website(s)
Print media
TV and Radio
Social media
Friends/ family
Other
Pipeline crosses my land
35% 19% 35% 46% 50% 48% 35% 31%
Communities near the pipeline and/or shipping routes
33% 19% 34% 60% 59% 47% 33% 17%
Elsewhere in Canada 30% 14% 31% 54% 56% 43% 27% 11%
Q2. What is your primary source of information about the project? Q8. Please identify where you live in relation to proposed Trans Mountain Expansion project?
SOURCES OF INFORMATION BY CATEGORY
Print media and television and radio were among the most frequently mentioned sources used to get
information about the project for all categories of participants. Social media was also included in the top
three most-used sources of information for all categories excluding business persons and industry
members, for whom the company websites were more important. For government members, the NEB
website was equally important. Other government websites tended to be more important for NGOs,
government members and academics.
NEB website
Other government website(s)
Company website(s)
Print media
TV and radio
Social media
Friends/ family
Other
Local Indigenous resident
40% 23% 39% 52% 60% 55% 38% 15%
Local non-Indigenous resident
36% 23% 34% 67% 62% 52% 37% 20%
Business 39% 19% 48% 56% 58% 43% 35% 20%
Non-government organization
48% 32% 45% 60% 61% 58% 42% 25%
Industry 37% 16% 47% 51% 54% 41% 31% 17%
Government 51% 36% 49% 57% 51% 54% 34% 24%
General public 31% 16% 30% 58% 60% 47% 30% 12%
Academic 46% 31% 39% 62% 57% 55% 39% 23%
Other 32% 17% 35% 57% 55% 44% 32% 30%
Q2. What is your primary source of information about the project?
Q9. Which category describes you and why you are interested in the proposed Trans Mountain Expansion project?
