transactionalprivacy+ - dimacsdimacs.rutgers.edu/workshops/aspects/slides/chaintreau.pdf ·...
TRANSCRIPT

Transactional Privacy Unknotting the Privacy Tussle w. Economics
Chris Riederer, Philippa Gill, Vijay Erramilli, Pablo Rodriguez, Balachander Krishnamurthy, Dina Papagiannaki
A. Chaintreau (Columbia U.)
1 2/8/2013 @ DIMACS Workshop

Acknowledgment
2 This is a joint work with Chris, Philippa, Vijay, Bala, Pablo & Dina!

* Late 80s … cheap microprocessors, no applications − But had brought millions of pcs to business/home
* Late 90s … end of the dot-‐com boom − But the Internet infrastructure was built for most * Early 2010s … peak of the social boom
− Facebook 3rd “country”, ,
3
Tech Bubbles: what they produce?

What are we building for the next generation?
4
Today
“The best mind of m
y generation are
thinking about
how to make people click a
ds.” J. Hammerbache
r
“This Tech Bubble Is Different.” A. Vance, Businessweek, 04/17/2011

* The next generation could be the one with access to an unprecedented amount of behavioral data * This can solve real problems … not just finding a movie or a restaurant! − ensuring energy efficiency − monitoring our environment − extend access to infrastructure − informing public decision
5
Social Media & Computing

And key to our society’s future!
Who produces this oil? Who owns it? benefits from it?
6
“Data is web’s new oil”
De facto, you are Google’s product!”
S. Vaidhyanathan (2011)
“You think you are Google’s customer?

7
We have a problem …
“Privacy challenges do not an
d must not require us to
forego the benefits of Netw
ork and Information Technolo
gy
(NIT) in addressing national
priorities.
Rather, we need a practical science of
privacy protection,
based on fundamental advance
s in NIT, to provide us with
tools we can use to reconcile privac
y with progress.”
PCAST Report to the Preside
nt and Congress,
Designing a Digital Future

* Transactional Privacy, a primer − Need for alternative economic approach to privacy * Highlights: − Can we practically build TP? − The real reasons why it may not work − Can it be incrementally deployed?
* Concluding remarks
8
This talk

The Privacy Tussle
Online Service Providers, Data Brokers, Aggregators
More monetization of personal information
Users, Associations, Journalists, governments
Stop the erosion of privacy? Regulate?
9

* No limitation on 3rd party tracking − Permission ultimatum (Android, FB, Apple) − Aggregation (Re-‐targering, FB connect, quasi-‐logout) − Reselling (Rapleaf, bluekai, Google DDP)
* Privacy is difficult to perceive and to protect − Behavioral: Immediate gratification, illusion of control − Technical: inference (e.g. differential privacy)
10
What complicates the Tussle

* Privacy preserving techniques − Anonymization: Tor, Obfuscation: TrackMeNot − Self-‐destructing data: Vanish − Monitoring: Dynamic Taint Analysis − Privacy-‐Preserving services: AdNostic, Privad, Repriv
* Not adopted, for 2 reasons: 1. little user incentive, “privacy is not enough” 2. Ignores data’s value, “really socially optimal?”
11
Technical solutions

12
Fix the economy first!
By: You

* Principle 1: A relaxed definition of privacy − Is privacy the state of being free from observation? … or know and control who uses what about you?
− We do not hide data, rather we enforce payment for their commercial use.
* Principle 2: A separation of powers − Who should decide what? − User “what is for sale?” market “what is it worth?”
13
Transactional Privacy in a nutshell

Privacy as usual vs. Transactional Pr.
Goal: free from observation * Adversary: honest but curious
* Hard problem, requires − data through queries − Estimate privacy violation
as negative externalities
* Many source of leakage − reselling − from price and bids
Goal: free from exploitation * Adversary: malicious but rational
* Potentially easier − raw data
works with any algorithm − simpler
* Inference is mostly useless − Brings no additional value
14

1. Provide the right incentive to users − A perception of their data value − Information leakage = market arbitrage
2. Improve the new data economy − More transparent: give user a control − More democratic: let the best tech (not data) win! − More efficient? Avoid public campaigns, more data
15
Economic solution to privacy
Google’s “Good to
know” ~ 10m
Google Lobby +240
% in 2012
The price of free https://github.com/ManConley/Price-‐of-‐Free/
Nice but is it practical?

* Transactional Privacy, a primer − Need for alternative economic approach to privacy * Highlights: − Can we practically build TP? − The real reasons why it may not work − Can it be incrementally deployed?
* Concluding remarks
16
This talk

TP for web-‐browsing 1. Data protection
Mix network anonymize { IP address + cookies }
2. Data to sale+ Pricing unlim. supply auction
3. Revelation
Only those who paid can access the users identity during an impression
17

* We don’t protect to protect, we protect to sell later − Enough to make misbehavior economically inefficient
* What to sell? The really simple user Interface − How much do you value this bit? TOO HARD
− Would you put this bit on the market? A BIT EASIER
− Tune a simple scroll bar
18
1. How to protect data?
Figure 2: Fraction of time spent by user persite (x-axis) vs. Normalized popularity of sites(y-axis)
a high variance in terms of visits; a long-tail, which hasbeen observed before in related data [5]. The power lawfits with exponent 1.5 for mobile browsing passed theKolmogrov-Smirnov test [3].
For every user, we calculate the fraction of time (interms of visits) spent on each of the visited sites. Foreach site she visits, we plot her fraction of time spenton that site versus the global popularity of that site(normalized by the most popular site, facebook.com)in Fig. 2. We posit that high values on the x-axis andlow values on the y-axis relate to sensitive information.For example, we found that URLs occupying this canbe either highly regional, sarbast.net or related to ahealth condition breastcancer.com, pertaining to sen-sitive information [9].
Sample application: Online CouponsCompanies use coupons as a form of price discrim-
ination, that are made more e!ective with access toPII [14]. Online coupon companies like Groupon havebecome highly popular and aggregators have shown in-terests to enter this market9. In order to study a user’spotential revenue as given by the auction, we use thebrowsing data and proceed as follows:
(i) For each user, we categorize the URLs of the sitesthey visited using Alexa.com, which provides the top500 sites for each category. We filter out visits to ad(i.e. Doubleclick, Admob, etc.), analytics, and adultsites to lower any bias.
(ii) We assume that the bidders involved are onlinecoupon vendors and each vendor bids for one category.We found 32 Alexa categories that overlapped with on-line coupon categories.
(iii) We monitored yipit.com, an online coupon ag-gregator, over three days (July 17-20, 2011) to obtainmean value per deal in each category. We then assumethat each user has a likelihood of making a purchase
9Facebook jumps into crowded coupon market,http://goo.gl/oLrJy
in a category proportional to the fraction of time spentbrowsing in that category. Thus, the bid values are themean deal value for a category multiplied by this frac-tion. The categories Travel and Office Products hadthe highest mean values of $844.14 and $207.9.
(iv) For multiple users, we vary the amount of infor-mation they reveal. The disclosure strategy is describedin Sec. 2, where we release sites in order of popularityfrom highest to lowest. We release information in blocksof 1% of the volume each time.
(v) For every release, we calculate a set of bids. Themajority of high bids came from four yipit categories:computers, home, entertainment, kids and teens.
We pick 4 typical users who have high to middle-levelactivity and plot (Fig. 3(a)) the optimal revenue theystand to gain as a function of every information release.We obtain the optimal revenue assuming bidders arehonest about their valuations. For all of these users, weobserve that there is initially a steep increase in rev-enue with a little disclosure of information, followed bydiminishing return as more PII is released. This showsthat sensitive information (as given by popularity) isnot needed for maximizing revenues. To study enforce-ment of truth telling in the auction, we plot (Fig. 3(b))the result of running the auctions for di!erent values of!. Note that smaller values of ! enforce truth-telling.We find that the value of ! has little or no e!ect on theresults (qualitatively).
4. PERSONAL INFORMATIONMARKETFor TP to be e!ective, we develop a system that cur-
tails the leakage of information and prevents identifi-cation while browsing. This system should allow usersaccess to all content without being tracked by aggrega-tors while imposing a minimum overhead; we note thatit would be impossible to prevent all types of informa-tion gathering methods. By raising the bar high enoughfor information aggregators, we believe they will find itcheaper and more convenient to come to the market.
System Description: The full architecture is shownin Fig. 4, with the main additions being a componentresponsible for transactional privacy and anonymizingproxies in the middle, operated by the trusted thirdparty. At the browser end, a lightweight plugin pro-vides the following functionality: (i) opts-out users ofad-networks and activates Do-not-track10, showing in-tent, (ii) provides the user with a mechanism to helpthem decide which URLs they are willing to put on themarket, (iii) prevents leakage (3rd party cookies, supercookies, flash cookies, 1-pixel bugs, etc.) [9], (iv) helpsmanage multiple users accessing the same device – pro-vides profiles with personalized settings for each user.
For an opt-in user Alice, the operations that takeplace for Web browsing are as follows:
(i) Alice with IP address IPreal browses the web.
10http://donottrack.us
4

1. As a function of User’s loss? − Differential privacy + auctions [Ghosh-‐Roth11] − hard to put into practice: bid leaks, users’ assessment
2. As a function of Provider’s benefit? − Can be thought of as a coalition game [Kleinberg01] − Requires truthful revelation of value
* Run an auction (with unlimited supply)
19
2. How to Price Private Data?

* For sale: identifying your browsing in [t;t+1] * Unlimited supply auctions − Sell your personal data to multiple purchasers − Every purchaser indicates a maximum price − User’s revenue
− Run exponential mechanism:
20
The personal data auction in contrast to previous solutions that constrain the ag-gregators to access data through limited variables thatare deemed ‘safe’ to release [4]. Many aggregators runspecialized algorithms on their data sets. Forcing ag-gregators to disclose these algorithms or constrainingthe data they are able to use is a losing proposition.
Here is why we believe that aggregators can computethe value of access to a user accurately: First, aggrega-tors have experience extracting value from PII. Second,they are able to assess revenues on a short-term ba-sis through the sale of goods or ad-space, compared tothe long-term risk a user must calculate in dealing withprivacy. Finally, aggregators typically deal with manycustomers, and can take a little more risk in overesti-mating or underestimating the value of access, as op-posed to users who are more risk averse.
ModelFormally, we denote the set of users by I, and each
user by the index i. The scheme we describe next isgeneral enough to apply to di!erent types of PII. Weintroduce the set of sites J whose elements, denotedby the index j can be either a URL (for web-browsing),or a geographical location (e.g., a longitude and latitudeusing GPS, or a cell in a mobile network). We assumethat users disclose a simple count of their activity ondi!erent sites, denoted by µi(j), which is a vector thatindicates how many visits the user has made to eithera URL or a location. It is possible to apply the samemodel to a more complex vector that would indicatetime, duration, or order of visits. We assume that eachuser indicates a subset Si ! J that contains all the sitesshe is ready to be tracked on. This indicates that anaggregator would be able to uniquely identify this userwhenever she visits these sites, and will also be givenµi(j) for j " Si. This enables the aggregator to build-up a profile over time, to further help with targeting.
Let us denote the set of aggregators by K, each in-dexed by k. Intuitively, aggregator k should be willingto pay to access this information as long as the price toacquire it is smaller than the additional revenue rk itcan make. Note that the good being sold on the marketis access to PII. This good can be sold to multiple ag-gregators with no marginal cost of reproduction, hencethe market can be thought of as having an unlimitedsupply. Extensions for an aggregator to buy exclusiveaccess can be included although beyond the scope ofthis paper. However, there can be strong incentive foraggregators to lie about their valuation.
In order to e!ectively trade such unlimited supplygoods, we rely on the auction mechanism called theexponential mechanism [13] which has the followingproperties: (i) it has been shown to be a truth tellingmechanism; it is in the best interest of the bidders tobe honest about their valuation and (ii) the scheme hasbeen shown to be close to optimal in terms of revenuefor the seller (end-user in our case). We choose this ob-
jective for this paper, while noting that other objectivefunctions (e.g., maximizing revenue for all players in thevalue chain) can be chosen.
In the auction, we assume that each aggregator k inK bids a maximum price pi,k that it is ready to pay toaccess user i. Assuming that the fixed price set is p andall willing bidders pay p, the total revenue is given by:
R ((pi,k)k!K, p) =!
k!K
p # I{p"pi,k} .
When p > maxk!K pi,k, the revenue will be zero, asno one buys the information that is priced too high.
We wish to choose p to maximize this sum. Following[13] we first assign an initial value to p according toa measure ! on R and then we re-weigh this measureto choose the actual price used. To re-weigh, we usean exponential function that puts more weight on highvalue of R, according to a parameter " > 0. Hence thepdf of the chosen price is given by
exp ("R ((pi,k)k!K, p)) !(p)" #0 exp ("R ((pi,k)k!K, s)) !(s)ds
Note that this density is always defined as long as theintegral is finite, and note that the function R is zerofor p su"ciently large. A natural and simple choice isthen to choose the initial distribution of p according tothe Lebesgue measure on R, such that !(p) = 1.
By using ", we have added noise around the valuemaximizing the revenue, given the set of bids. Althoughit seems counter-intuitive to use a suboptimal price, itis shown [13] that this (1) prevents any bidder fromwinning more than a factor exp(") when cheating and(2) still reaches a revenue that is within a good boundof the optimal value, denoted OPT , if the number ofaggregators is large. The expected revenue is at least
OPT $3 ln(e+OPT !2m)!
, where m is the number of buyersin the optimal case. Thus, although the randomizationcauses revenue from a given set of bids to be lower,truthful bidding means the set of bids will be higher,ending up with better revenue than if we allowed bid-ders to cheat.
3. CASE STUDYWe next focus our attention on studying how the rev-
enue of a user changes with varying amounts of infor-mation release via TP. For this, we rely on real dataconsisting of an entire day of browsing behavior on mo-bile phones of several hundred thousand users from alarge European capital, collected during the last weekof Nov. 2010, by a large provider. While mobile brows-ing is inherently di!erent from fixed browsing behavior,we believe the size and the scope of the dataset formsa representative sample of browsing behavior. A sec-ond dataset obtained from FourSquare gave us similarresults, but we omit them for space reasons. We ex-tracted the number of site visits (URLs) and observed
3
in contrast to previous solutions that constrain the ag-gregators to access data through limited variables thatare deemed ‘safe’ to release [4]. Many aggregators runspecialized algorithms on their data sets. Forcing ag-gregators to disclose these algorithms or constrainingthe data they are able to use is a losing proposition.
Here is why we believe that aggregators can computethe value of access to a user accurately: First, aggrega-tors have experience extracting value from PII. Second,they are able to assess revenues on a short-term ba-sis through the sale of goods or ad-space, compared tothe long-term risk a user must calculate in dealing withprivacy. Finally, aggregators typically deal with manycustomers, and can take a little more risk in overesti-mating or underestimating the value of access, as op-posed to users who are more risk averse.
ModelFormally, we denote the set of users by I, and each
user by the index i. The scheme we describe next isgeneral enough to apply to di!erent types of PII. Weintroduce the set of sites J whose elements, denotedby the index j can be either a URL (for web-browsing),or a geographical location (e.g., a longitude and latitudeusing GPS, or a cell in a mobile network). We assumethat users disclose a simple count of their activity ondi!erent sites, denoted by µi(j), which is a vector thatindicates how many visits the user has made to eithera URL or a location. It is possible to apply the samemodel to a more complex vector that would indicatetime, duration, or order of visits. We assume that eachuser indicates a subset Si ! J that contains all the sitesshe is ready to be tracked on. This indicates that anaggregator would be able to uniquely identify this userwhenever she visits these sites, and will also be givenµi(j) for j " Si. This enables the aggregator to build-up a profile over time, to further help with targeting.
Let us denote the set of aggregators by K, each in-dexed by k. Intuitively, aggregator k should be willingto pay to access this information as long as the price toacquire it is smaller than the additional revenue rk itcan make. Note that the good being sold on the marketis access to PII. This good can be sold to multiple ag-gregators with no marginal cost of reproduction, hencethe market can be thought of as having an unlimitedsupply. Extensions for an aggregator to buy exclusiveaccess can be included although beyond the scope ofthis paper. However, there can be strong incentive foraggregators to lie about their valuation.
In order to e!ectively trade such unlimited supplygoods, we rely on the auction mechanism called theexponential mechanism [13] which has the followingproperties: (i) it has been shown to be a truth tellingmechanism; it is in the best interest of the bidders tobe honest about their valuation and (ii) the scheme hasbeen shown to be close to optimal in terms of revenuefor the seller (end-user in our case). We choose this ob-
jective for this paper, while noting that other objectivefunctions (e.g., maximizing revenue for all players in thevalue chain) can be chosen.
In the auction, we assume that each aggregator k inK bids a maximum price pi,k that it is ready to pay toaccess user i. Assuming that the fixed price set is p andall willing bidders pay p, the total revenue is given by:
R ((pi,k)k!K, p) =!
k!K
p # I{p"pi,k} .
When p > maxk!K pi,k, the revenue will be zero, asno one buys the information that is priced too high.
We wish to choose p to maximize this sum. Following[13] we first assign an initial value to p according toa measure ! on R and then we re-weigh this measureto choose the actual price used. To re-weigh, we usean exponential function that puts more weight on highvalue of R, according to a parameter " > 0. Hence thepdf of the chosen price is given by
exp ("R ((pi,k)k!K, p)) !(p)" #0 exp ("R ((pi,k)k!K, s)) !(s)ds
Note that this density is always defined as long as theintegral is finite, and note that the function R is zerofor p su"ciently large. A natural and simple choice isthen to choose the initial distribution of p according tothe Lebesgue measure on R, such that !(p) = 1.
By using ", we have added noise around the valuemaximizing the revenue, given the set of bids. Althoughit seems counter-intuitive to use a suboptimal price, itis shown [13] that this (1) prevents any bidder fromwinning more than a factor exp(") when cheating and(2) still reaches a revenue that is within a good boundof the optimal value, denoted OPT , if the number ofaggregators is large. The expected revenue is at least
OPT $3 ln(e+OPT !2m)!
, where m is the number of buyersin the optimal case. Thus, although the randomizationcauses revenue from a given set of bids to be lower,truthful bidding means the set of bids will be higher,ending up with better revenue than if we allowed bid-ders to cheat.
3. CASE STUDYWe next focus our attention on studying how the rev-
enue of a user changes with varying amounts of infor-mation release via TP. For this, we rely on real dataconsisting of an entire day of browsing behavior on mo-bile phones of several hundred thousand users from alarge European capital, collected during the last weekof Nov. 2010, by a large provider. While mobile brows-ing is inherently di!erent from fixed browsing behavior,we believe the size and the scope of the dataset formsa representative sample of browsing behavior. A sec-ond dataset obtained from FourSquare gave us similarresults, but we omit them for space reasons. We ex-tracted the number of site visits (URLs) and observed
3

* Data obtained through de-‐anonymizer − The purchasers who won the auction are given the associating function IP-‐fake/IP-‐real for this user
− Raw information: could be used for any algorithms − Real time: can be used for immediate action
* Re-‐run the bidding process periodically − Purchasers can infer users’ profile from history − But they can’t use it!
21
3. Reveal

Case Study − Mobile Web browsing
large city, ~200k users − Online Coupon Dealers
crawl yipit.com − Information released by
decreasing popularity
Revenue vs. disclosure: A sweet spot!
22
Confirms previous results on use of personal information to improve click-‐entropy (See [Krause-‐Horvitz 2008]).

* Transactional Privacy, a primer − Need for alternative economic approach to privacy * Highlights: − Can we practically build TP? − The real reasons why it may not work − Can it be incrementally deployed?
* Concluding remarks
23
This talk

“I can resell your information to 1000 people” “wait, I can even sell information about my friends!” − BUT you can’t sell access to info for commercial use!
“To bid, companies need information anyway” − True, but for the same reason they can’t monetize it
“You give away value of statistical information” − Indeed, it becomes a public good. It’s a feature!
“Price discrimination becomes unprofitable” − Is that certain? Is that a bad thing?
24
“This will not work because …

“Tor is too slow anyway, and you can attack it” − Something much lighter, since we only need to raise the bar. Companies care about reputation
“wouldn’t disclosing bulk of data scare users? today’s ecosystem relies on their ignorance”
− Aim at transparency; eventually users should know. “wouldn’t it encourage users to over-‐expose.” − Yes, which is why not all information can be traded
25
“Still this will not work as …

“What if users forge bogus data?” “And get compensated for it, at the limit it means these signals are useless” − still open problem: some data are verifiable
“What if there is there is not enough per user?” “and they won’t bother for 2c a month” − still open problem: (1) we still have to make the math as the pie may grows, (2) we could make it more attractive: lottery, pay with services
26
Why indeed it may not work

* Transactional Privacy, a primer − Need for alternative economic approach to privacy * Highlights: − Can we practically build TP? − The real reasons why it may not work − Can it be incrementally deployed?
* Concluding remarks
27
This talk

* Current choice:
28
“Why Johnny can’t opt-‐out”
P a(a) today
P a(b) user blocks tracking
P a(c) user obfuscates data
impression inferred data explicit datarevenueobfuscated data
P a
(f) mediated marketmP a
(e) direct market
P a
(d) privacy preserving adsD
P a(a) today
P a(b) user blocks tracking
P a(c) user obfuscates data
impression inferred data explicit datarevenueobfuscated data
P a
(f) mediated marketmP a
(e) direct market
P a
(d) privacy preserving adsD
P a(a) today
P a(b) user blocks tracking
P a(c) user obfuscates data
impression inferred data explicit datarevenueobfuscated data
P a
(f) mediated marketmP a
(e) direct market
P a
(d) privacy preserving adsD
P a(a) today
P a(b) user blocks tracking
P a(c) user obfuscates data
impression inferred data explicit datarevenueobfuscated data
P a
(f) mediated marketmP a
(e) direct market
P a
(d) privacy preserving adsD
or

* But this creates initially some revenue loss − is there a deployment that is incentive compatible?
29
Tomorrow possible’s vision P a(a) today
P a(b) user blocks tracking
P a(c) user obfuscates data
impression inferred data explicit datarevenueobfuscated data
P a
(f) mediated marketmP a
(e) direct market
P a
(d) privacy preserving adsD
P a(a) today
P a(b) user blocks tracking
P a(c) user obfuscates data
impression inferred data explicit datarevenueobfuscated data
P a
(f) mediated marketmP a
(e) direct market
P a
(d) privacy preserving adsD
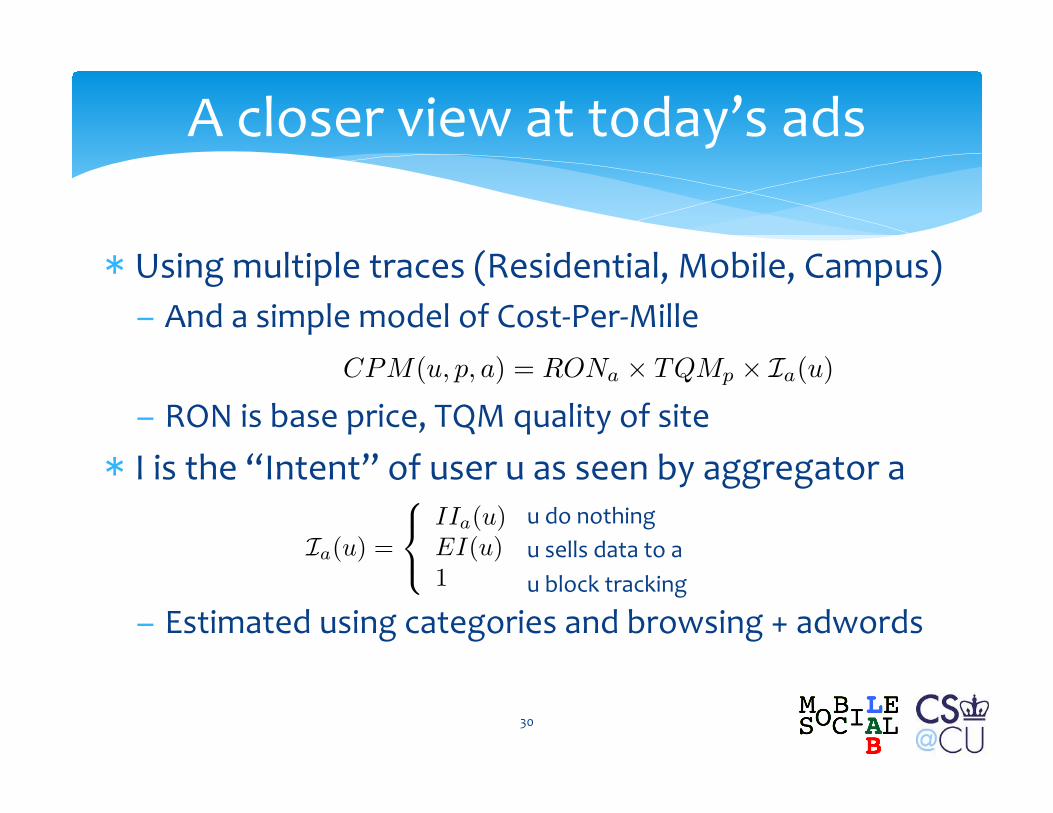
* Using multiple traces (Residential, Mobile, Campus) − And a simple model of Cost-‐Per-‐Mille
− RON is base price, TQM quality of site * I is the “Intent” of user u as seen by aggregator a
− Estimated using categories and browsing + adwords
30
A closer view at today’s ads
a single page view can constitute multiple impressionssold to advertisers by multiple aggregators.
2.3 Revenue for publishers and aggregators.Aggregators and publishers share advertising revenue
generated by displaying ads on Web sites. We assumethe aggregator retains a constant fraction of the adver-tising revenue (↵) and passes the remaining amount onto the publisher. Google AdSense, for instance, keeps↵ ⇠ 0.32 [29]. (We use this value in the paper.)
We consider ad revenue on a “cost-per-mille” (CPM)basis as this is the primary method of purchasing tar-geted display ad and represents the price for 1,000 im-pressions (views) of an ad [21]. The amount an adver-tiser will pay for impressions depends on the user u, adnetwork a and publisher p.
CPM(u, p, a) = RONa ⇥ TQMp ⇥ Ia(u) (1)
Run-of-network (RONa). RONa is the base pricefor an impression in ad network a. It represents theprice for an ad that may be shown on any publisherthat a is a�liated with. A RON ad is a generic ad thatis shown to users about whom little is known or whoare anonymous [9].
Tra�c quality multiplier (TQMp). TQMp is amultiplier of the impression price that captures the qual-ity of the impression based on factors such as the typeof publisher or ad location.
User Intent Ia(u). The value of an impression in-creases as a function of the estimated purchasing intentof the user. Currently, aggregators segment users basedon their interests [8], as inferred through online track-ing. Certain segments are determined to have higherpurchasing intent (e.g., cell phone shoppers) and theseusers’ impressions are worth more.
We use implicit intent IIa(u) to represent the intentvalue an aggregator can infer about a user. It natu-rally depends on the presence of an aggregator on thesites the user visits. We distinguish this from explicitintent EI(u) which is computed with knowledge of all
sites the user visits. Consider the example: user Bobvisits (espn.com, swimming.com, pets.com). Aggre-gator A is present on the first two publishers, whileaggregator B is present on the third one. Implicit in-tent for aggregator A about Bob would be limited toBob being interested in sports, while for aggregator B,it is that Bob is interested in pets. The explicit intentEI(u) is that Bob is interested in sports and pets.
2.4 Overall revenue.The total revenue 2 of the online advertising ecosys-
2Note that this is the estimated revenue; we use ‘revenue’to refer to the estimate
tem is the following:
R =X
u2U
X
p2P
" X
a2A
µu(p)1000
CPM(u, p, a)
!#(2)
In the following sections, we empirically and analyti-cally consider the impact of privacy protection on rev-enue. In the next section, we describe how we extractvalues for di↵erent parameters for our model.
3. DATA ANALYSIS METHODOLOGYWe use traces of HTTP tra�c in multiple networks to
study of advertising and incentives for deploying privacyprotection. While having access to an aggregator or apublisher’s clickstream would aid our study, it wouldprovide only a single point-of-view. In contrast, HTTPtraces give us near complete visibility into the set ofpublishers and aggregators that the user population in-teracts with when they are present in the network. Wealso describe how we assign values to the parametersdescribed in Sec. 2 from the data.
3.1 Data sets.Residential HTTP trace (HTTP) Our first dataset is an anonymized HTTP trace from a residentialneighborhood in a large Western European city. Theusers are DSL subscribers (identified by subscriber ID)and the trace was collected at a DSLAM (serving usersin high thousands) over a day in April, 2011. Therewere close to 40 million HTTP requests over the day.Mobile HTTP trace (mHTTP) Our second dataset is an anonymized HTTP trace of the entire subscriber-base of a mobile network over a Western European coun-try over a day in late Aug. 2011. The number of users(identified by phone numbers) in the trace are in themillions, and account for more than 1.5 billion HTTPtransactions over the day.University HTTP trace (Univ) The last dataset isone month of HTTP traces from a North American uni-versity with thousands of users. To protect user privacy,users within the data set are identified using a unique ID(based on their IP address) that is only valid for one daywhich precludes longitudinal analysis of user behavior.We run our experiments over the entire month, but forsimplicity present results from a single day (9/29/2010).Results are similar over the month-long period.
3.2 Data analysis overview.For each user in the HTTP traces (represented by
anonymized identifiers), we first group their HTTP trans-actions into sessions. Second, we identify publishers andaggregators within each session. This results in a set ofpublishers and aggregators for each user. We use theset of publishers to compute user intent (IIa(u) andEI(u) from Sec. 2). Given the intent values, and values
3
2 4 6 8 100.
00.
10.
20.
30.
40.
5Inferred Intent (II(u,a)
●
●
●
●● ● ● ● ●
● HTTPmHTTPUniv
Figure 5: Distribution of implicit intent, IIa(u).
potential values for Ia(u) in our model:
Ia(u) =
8<
:
IIa(u) u and p do nothingEI(u) u sells and a buys data1 otherwise
(3)
Both implicit intent (IIa(u)) and explicit intent (EI(u))are as described in Sec. 3.3, with the additional under-standing that the user can now sell EI(u) in the infor-mation market. Recall that implicit intent (IIa(u)) iswhat aggregators can infer, while explicit intent (EI(u))can consist of high quality information that the user di-rectly provides. And when the user or publisher blocktracking there is no increase in CPM as a result of in-tent, hence it is set to 1.
5.3 Quantifying the cost of blocking.We use our datasets and the modified model to un-
derstand the change in revenue if users block tracking.Fig. 5 shows how much value is currently derived fromimplicit intent which stands to be lost if users block.The average value of IIa(u) is 4.2 in the HTTP, 3.8 inmHTTP and 3.1 in the Univ traces, respectively. In-deed, when we compute revenue with all users block-ing (i.e., Ia(u) = 1) revenue decreases by a factor of4.2 in the HTTP, 3.8 in mHTTP, and 3.2 in the Univtraces, respectively. A large population of users block-ing – in the worst case, if the Do Not Track (DNT)header [2] became default – would represent a signif-icant threat to advertising revenue. If proposals likeDNT are honored by aggregators this may lead to low-ered quality of service as the publisher will lose outon additional revenues. Blocking also poses the poten-tial to decrease functionality of Web sites for users(e.g.,blocking Javascript via NoScript [30]). Hence, for thesereasons, it can be argued that most users will not takethe extreme step of blocking entirely. However, we findthat even if 5% of the top users (Fig. 2) block, the rev-enue drop is between 35%-60%. With regards to obfus-cation, if we assume that incorrect targeting is worsethan no targeting at all, then the drop in revenues dueto blocking will form a lower bound on revenue loss dueto obfuscation.
6. INFORMATION MARKETPLACESWe have shown that aggregators can accurately esti-
mate user intent and that their revenue naturally dropsas users unilaterally block tracking. The question thenarises – can privacy solutions be economically viablevis-a-vis online advertising?
To answer this question, we consider an informationmarketplaces that is based around users and aggrega-tors cooperating. For cooperation to occur, the usersand aggregators need to fairly share advertising rev-enue so that each party has incentive to participate inthe market. We address this problem by modeling theinformation market as a cooperative game on a per-
impression basis. We use Shapley value [35] to under-stand how revenue should be shared between players.We consider dynamics beyond a single impression usingempirical data in Sec. 7.
6.1 Basic structure of the game.We model each ad impression as a game, where the
revenue generated by the impression depends on theactions of the players: whether or not to join the infor-mation market.Players. We consider users and aggregators. Whilepublishers play a role in online advertising, they do notpurchase or provide data in our market model. We dis-cuss how publishers may create incentives for users andaggregators to join the market in Sec. 6.4. In one formof markets we consider below, a trusted third party ora mediator is also considered a player.Revenue sharing using Shapley value. Since theoutcome (advertising revenue) depends on the combinede↵orts of players in a coalition, a natural question is howto fairly divide the proceeds of the game among players.Compensating players according to their contribution tothe game creates incentives for them to participate inan information market. The Shapley value [35] allowsto do that using a minimum set of axioms (summarizedin Appendix C). Shapley value also has the desirablestability property – that it lies at the core for generalclasses of games (e.g., convex cooperative games). Thismeans that given Shapley value, all players will haveincentive to enter a stable cooperation. As we calcu-late the Shapley value on a per impression basis thatinvolves the user and aggregator, we do not run intocomputational overheads.
We consider two cooperative games representing po-tential embodiments of an information marketplace:1. Direct marketplace. Aggregators purchase datadirectly from users. This may be achieved using a tech-nology such as RePriv [14]; where the aggregator com-pensates the user in exchange for running a mining plug-in in the user’s browser.2. Mediated marketplace. The sale of user data to
7
u do nothing u sells data to a u block tracking

* Deployment under two scenarios: − Let “consented tracking ratio” − r>1 because explicit intent is larger than implicit − relates intuitively to user’s bargaining power * Market deployment as a coalitional game − Prop: In a direct market, distributing revenue according to Shapley value (i.e. under fairness axioms) is incentive compatible iff r>2
− Prop: In a mediated market, it is iff r>3/2
31
Characterizing Deployment
Table 3: Revenue in the direct marketplace.S Ia(u) R(S); IIa(u) ↵RONaTQMpIIa(u)
{ u } 1 ↵RONaTQMp
{ a } IIa(u) ↵RONaTQMpIIa(u){ u, a } EI(u) ↵RONaTQMpEI(u)
aggregators is mediated by a third party. An example isTransactional Privacy (TP) [34] where a (paid) neutralthird party mediates the sale of data. In this setting,we also consider the mediator as a player in the game.
Solutions like Privad [18] do not explicitly discuss thepossibility of monetary compensation to the user, hencethey cannot be considered as forming a market as de-fined above. However, if Privad were to include mone-tary rewards to the user, the presence of an active thirdparty would make it a mediated marketplace.
Assumptions. We make the assumption that if auser decides to use the marketplace her behavior doesnot change. When the user joins a marketplace, themarket must block tracking of this user, otherwise thereis no incentive for aggregators to join the market andpurchase data (and can lead to arbitrage). We as-sume the market implements mechanisms as suggestedby TP [34] or RePriv [14] to preclude tracking by ag-gregators.
6.2 Direct marketplace.In a direct market, there are two players, the user and
aggregator, that may form a coalition. Table 3 presentsthe revenue obtained per-impression depending on theparticipation of the user and aggregator in the coalition(S) in the direct market game. The revenue in today’sstatus quo (S = ;) has an intent coe�cient, Ia(u), ofIIa(u). The revenue remains the same as today if onlythe aggregator joins the market as they can still trackusers not participating in the market. Ia(u) drops to 1when S = {u}, that is when only the user opts into themarket and hence blocks tracking. In contrast, whenall players join the marketplace (S = {u, a}) the intentcoe�cient increases to EI(u).
Direct market game is convex. Our revenue func-tion is supermodular but non-monotone. This propertyis unusual and implies that, as long as the Shapley valuein the grand coalition is positive for each player, it isstable as no smaller subset of players can benefit fromdeviating (proof omitted).
Applying Eq.8 (from Appendix C), we obtain thatthe Shapley value for each player is given by:
'u = ↵RONaTQMp
2 (EI(u)� IIa(u)� (IIa(u)� 1))'a = ↵RONaTQMp
2 (EI(u)� 1) .(4)
The players hence receive whatever their original rev-enue was in the original status quo, plus an average of
their incremental benefit to the system when they jointhe coalition. This compensation accounts for playersincreasing revenue by selling data or decreasing rev-enue by blocking tracking. It has two important conse-quences:(1) On a per-impression basis, aggregators al-ways have incentive to join the direct market.Aggregators maintain the revenue they make today(R({;}) = ↵RONaTQMpIIa(u)) plus their Shapley al-located value. The latter is positive as the value of acoalition never decreases when they join. However, incontrast with today’s status quo, they have to share apart of this additional revenue with the user.(2) It is not always in the user’s interest to jointhe market. The user’s share of advertising rev-enue depends on the incremental quality of the datathey sell (captured through EI(u)� IIa(u)). However,since their contribution to the game can be negative (viablocking), the user’s Shapley value may be negative ifthey do not increase value su�ciently (via EI(u)) too↵set the loss from blocking. In these cases, clearly auser will not join the market in practice. However, wereiterate that while from an economic viewpoint, a userwill not be incentivised to join the market she may joindue to privacy concerns.
We characterize the condition where the user’s rev-enue is positive (i.e., EI(u) is large enough to o↵setthe loss from blocking) with the following “consentedtracking ratio”:
ru,a =EI(u)� 1IIa(u)� 1
.
We observe that ru,a is always positive (since EI(u) andIIa(u) � 2) and that, in the direct market, the user hasincentive to join i↵ 'u > 0. It is easy to see that thisis true i↵ ru,a > 2. Thus, we have shown that a criticalcondition for users to participate in a direct market isru,a > 2.
6.3 Mediated marketplace.We next consider the case where aggregators purchase
user data via neutral (paid) mediator as is proposedin [34]. This has the advantage that the users and ag-gregators need only form an agreement with a single in-termediary. However, the presence of a mediator meansthat revenue must be shared with an additional party.
Table 4 presents per-impression revenue for a threeplayer game where the players are the user, aggregatorand mediator. Unlike the previous game, the user can-not block tracking unless the mediator also participatesand coordinates the market. As a result, the intent co-e�cient decreases to 1 only when S = {u, m}.Mediated market is not convex. Again, this gameis non monotonic but the revenue function is not su-permodular (a condition for convexity). Indeed, therevenue obtained by adding u to S = ; is higher than
8

Distinguishing 1st and 3rd party
Aggregators
* Track users and play ads
* Revenue more skewed
Publishers
* Make impressions
* Largest ≠ more profitable
32
0.0 0.2 0.4 0.6 0.8 1.0
0.0
0.2
0.4
0.6
0.8
1.0
Normalized rank
Cum
ulat
ive re
venu
eHTTP−usersHTTP−aggregatorsmHTTP−usersmHTTP−aggregatorsUniv−usersUniv−aggregators
Figure 2: Cumulative fraction of revenue at-tributed to each aggregator and user.
Table 1: Publishers with the most revenue(mHTTP).
Publisher Frac. Rev. Frac. Users Categoryfacebook.com 0.09 0.15 societygoogle.co.uk 0.04 0.11 computersbbc.co.uk 0.03 0.07 artsfbcdn.net 0.03 0.13 societytwitter.com 0.03 0.04 computersyahoo.com 0.03 0.04 computersgoogle.com 0.02 0.18 computersskysports.com 0.02 0.04 regionalpremierleague.com 0.01 0.01 regionalebay.com 0.01 0.02 shopping
of sessions per user with a correlation (r-value) of 0.64for mHTTP. Unsurprisingly, users who browse more aremore valuable in the impression-based revenue model.Most popular publishers do not necessarily gen-erate most revenue. Table 1 shows the top pub-lishers in the mHTTP dataset. We find that whileGoogle (google.com) is the most visited publisher with18% of users visiting Google as a publisher5, Facebook(facebook.com) actually generates the most revenue:9%. We see Facebook’s CDN fbcdn.net also gener-ating significant revenue since it also serves FacebookWeb pages. Revenue is correlated with the number ofaggregators present on each publisher, in the mHTTPdataset, we find a correlation of 0.61 (r-value) betweennumber of aggregators and revenue per publisher.Google is the top aggregator Table 2 show thetop aggregators in the mHTTP dataset. As in previouswork [25], we observe Google playing an active role asan aggregator. Google is present on significantly morepublishers than the other aggregators, with presence on80% of publishers in the mHTTP dataset. Fig. 2 showsthat advertising revenue is concentrated by a few aggre-gators with the top 5-10% of aggregators getting 90%of the ad revenue.Facebook entering the aggregation game. Inter-5Note that we use domain to identify publishers sogoogle.co.uk and google.com are treated separately. Wecannot sum the fraction of users they are present on becausethere may be overlap in the set of users that visit them.
Table 2: Aggregators with the most revenue(mHTTP ).
Frac. Frac. Frac.Aggregator Rev. Users Pubs.Google 0.18 0.17 0.80Facebook 0.06 0.09 0.23GlobalCrossing (AdMob) 0.04 0.11 0.19AOL 0.03 0.04 0.07Microsoft 0.03 0.04 0.17Omniture 0.03 0.05 0.07Yahoo! (AS42173) 0.03 0.04 0.07Internap (RevSci) 0.02 0.03 0.01Quantcast 0.02 0.03 0.09Yahoo! (AS43428) 0.01 0.03 0.11
0.0 0.2 0.4 0.6 0.8 1.0
0.0
0.2
0.4
0.6
0.8
1.0
II(u,a)/EI(u)
CDF
HTTPmHTTPUniv
Figure 3: CDF of inferred intent (IIa(u)) nor-malized by explicit intent (EI(u)).
estingly, Facebook also ranks highly as an aggregatorreaching 9% of users with presence on 23% of first par-ties in the mHTTP dataset. This is due to the ubiq-uitous Facebook “Like” button that appears on manyWeb pages.
4.2 How much do aggregators know?Most aggregators are able to estimate intent ac-curately. Fig. 3 shows the ratio of explicit to implicitintent for user-aggregator pairs. Recall, that for eachuser, the aggregator infers intent based on the subset ofsites the user visits where the aggregator is present asa third party. Most aggregators are able to accuratelyinfer user intent with more than half of aggregators inall datasets inferring the correct value of EI(u). Thisaccuracy stems from many users visiting sites in a smallnumber of categories with half the users in all datasetsvisiting sites in two or fewer categories in our datasets(figure not shown).Aggregators know most about popular sites. Wepreviously considered the presence of top aggregatorsacross all publishers in our datasets (Table 2). Main-taining presence on many publishers requires aggrega-tors to build and maintain business relationships. Fig. 4shows the fraction of publishers the top four aggrega-tors are present on for varying numbers of top publish-ers. Top aggregators are focusing on popular publisherswith the top aggregators present on more than 70% of
5
0.0 0.2 0.4 0.6 0.8 1.0
0.0
0.2
0.4
0.6
0.8
1.0
Normalized rank
Cum
ulat
ive re
venu
e
HTTP−usersHTTP−aggregatorsmHTTP−usersmHTTP−aggregatorsUniv−usersUniv−aggregators
Figure 2: Cumulative fraction of revenue at-tributed to each aggregator and user.
Table 1: Publishers with the most revenue(mHTTP).
Publisher Frac. Rev. Frac. Users Categoryfacebook.com 0.09 0.15 societygoogle.co.uk 0.04 0.11 computersbbc.co.uk 0.03 0.07 artsfbcdn.net 0.03 0.13 societytwitter.com 0.03 0.04 computersyahoo.com 0.03 0.04 computersgoogle.com 0.02 0.18 computersskysports.com 0.02 0.04 regionalpremierleague.com 0.01 0.01 regionalebay.com 0.01 0.02 shopping
of sessions per user with a correlation (r-value) of 0.64for mHTTP. Unsurprisingly, users who browse more aremore valuable in the impression-based revenue model.Most popular publishers do not necessarily gen-erate most revenue. Table 1 shows the top pub-lishers in the mHTTP dataset. We find that whileGoogle (google.com) is the most visited publisher with18% of users visiting Google as a publisher5, Facebook(facebook.com) actually generates the most revenue:9%. We see Facebook’s CDN fbcdn.net also gener-ating significant revenue since it also serves FacebookWeb pages. Revenue is correlated with the number ofaggregators present on each publisher, in the mHTTPdataset, we find a correlation of 0.61 (r-value) betweennumber of aggregators and revenue per publisher.Google is the top aggregator Table 2 show thetop aggregators in the mHTTP dataset. As in previouswork [25], we observe Google playing an active role asan aggregator. Google is present on significantly morepublishers than the other aggregators, with presence on80% of publishers in the mHTTP dataset. Fig. 2 showsthat advertising revenue is concentrated by a few aggre-gators with the top 5-10% of aggregators getting 90%of the ad revenue.Facebook entering the aggregation game. Inter-5Note that we use domain to identify publishers sogoogle.co.uk and google.com are treated separately. Wecannot sum the fraction of users they are present on becausethere may be overlap in the set of users that visit them.
Table 2: Aggregators with the most revenue(mHTTP ).
Frac. Frac. Frac.Aggregator Rev. Users Pubs.Google 0.18 0.17 0.80Facebook 0.06 0.09 0.23GlobalCrossing (AdMob) 0.04 0.11 0.19AOL 0.03 0.04 0.07Microsoft 0.03 0.04 0.17Omniture 0.03 0.05 0.07Yahoo! (AS42173) 0.03 0.04 0.07Internap (RevSci) 0.02 0.03 0.01Quantcast 0.02 0.03 0.09Yahoo! (AS43428) 0.01 0.03 0.11
0.0 0.2 0.4 0.6 0.8 1.0
0.0
0.2
0.4
0.6
0.8
1.0
II(u,a)/EI(u)
CDF
HTTPmHTTPUniv
Figure 3: CDF of inferred intent (IIa(u)) nor-malized by explicit intent (EI(u)).
estingly, Facebook also ranks highly as an aggregatorreaching 9% of users with presence on 23% of first par-ties in the mHTTP dataset. This is due to the ubiq-uitous Facebook “Like” button that appears on manyWeb pages.
4.2 How much do aggregators know?Most aggregators are able to estimate intent ac-curately. Fig. 3 shows the ratio of explicit to implicitintent for user-aggregator pairs. Recall, that for eachuser, the aggregator infers intent based on the subset ofsites the user visits where the aggregator is present asa third party. Most aggregators are able to accuratelyinfer user intent with more than half of aggregators inall datasets inferring the correct value of EI(u). Thisaccuracy stems from many users visiting sites in a smallnumber of categories with half the users in all datasetsvisiting sites in two or fewer categories in our datasets(figure not shown).Aggregators know most about popular sites. Wepreviously considered the presence of top aggregatorsacross all publishers in our datasets (Table 2). Main-taining presence on many publishers requires aggrega-tors to build and maintain business relationships. Fig. 4shows the fraction of publishers the top four aggrega-tors are present on for varying numbers of top publish-ers. Top aggregators are focusing on popular publisherswith the top aggregators present on more than 70% of
5

* Largest aggregators have specific advantage − Implicit intent: based on what aggregator can infer − Explicit intent ≠ implicit intent * But implicit intent is still not perfectly accurate − Leaving users some bargaining power
33
The power of large aggregators
0.0 0.2 0.4 0.6 0.8 1.0
0.0
0.2
0.4
0.6
0.8
1.0
Normalized rank
Cum
ulat
ive re
venu
e
HTTP−usersHTTP−aggregatorsmHTTP−usersmHTTP−aggregatorsUniv−usersUniv−aggregators
Figure 2: Cumulative fraction of revenue at-tributed to each aggregator and user.
Table 1: Publishers with the most revenue(mHTTP).
Publisher Frac. Rev. Frac. Users Categoryfacebook.com 0.09 0.15 societygoogle.co.uk 0.04 0.11 computersbbc.co.uk 0.03 0.07 artsfbcdn.net 0.03 0.13 societytwitter.com 0.03 0.04 computersyahoo.com 0.03 0.04 computersgoogle.com 0.02 0.18 computersskysports.com 0.02 0.04 regionalpremierleague.com 0.01 0.01 regionalebay.com 0.01 0.02 shopping
of sessions per user with a correlation (r-value) of 0.64for mHTTP. Unsurprisingly, users who browse more aremore valuable in the impression-based revenue model.Most popular publishers do not necessarily gen-erate most revenue. Table 1 shows the top pub-lishers in the mHTTP dataset. We find that whileGoogle (google.com) is the most visited publisher with18% of users visiting Google as a publisher5, Facebook(facebook.com) actually generates the most revenue:9%. We see Facebook’s CDN fbcdn.net also gener-ating significant revenue since it also serves FacebookWeb pages. Revenue is correlated with the number ofaggregators present on each publisher, in the mHTTPdataset, we find a correlation of 0.61 (r-value) betweennumber of aggregators and revenue per publisher.Google is the top aggregator Table 2 show thetop aggregators in the mHTTP dataset. As in previouswork [25], we observe Google playing an active role asan aggregator. Google is present on significantly morepublishers than the other aggregators, with presence on80% of publishers in the mHTTP dataset. Fig. 2 showsthat advertising revenue is concentrated by a few aggre-gators with the top 5-10% of aggregators getting 90%of the ad revenue.Facebook entering the aggregation game. Inter-5Note that we use domain to identify publishers sogoogle.co.uk and google.com are treated separately. Wecannot sum the fraction of users they are present on becausethere may be overlap in the set of users that visit them.
Table 2: Aggregators with the most revenue(mHTTP ).
Frac. Frac. Frac.Aggregator Rev. Users Pubs.Google 0.18 0.17 0.80Facebook 0.06 0.09 0.23GlobalCrossing (AdMob) 0.04 0.11 0.19AOL 0.03 0.04 0.07Microsoft 0.03 0.04 0.17Omniture 0.03 0.05 0.07Yahoo! (AS42173) 0.03 0.04 0.07Internap (RevSci) 0.02 0.03 0.01Quantcast 0.02 0.03 0.09Yahoo! (AS43428) 0.01 0.03 0.11
0.0 0.2 0.4 0.6 0.8 1.0
0.0
0.2
0.4
0.6
0.8
1.0
II(u,a)/EI(u)
CDF
HTTPmHTTPUniv
Figure 3: CDF of inferred intent (IIa(u)) nor-malized by explicit intent (EI(u)).
estingly, Facebook also ranks highly as an aggregatorreaching 9% of users with presence on 23% of first par-ties in the mHTTP dataset. This is due to the ubiq-uitous Facebook “Like” button that appears on manyWeb pages.
4.2 How much do aggregators know?Most aggregators are able to estimate intent ac-curately. Fig. 3 shows the ratio of explicit to implicitintent for user-aggregator pairs. Recall, that for eachuser, the aggregator infers intent based on the subset ofsites the user visits where the aggregator is present asa third party. Most aggregators are able to accuratelyinfer user intent with more than half of aggregators inall datasets inferring the correct value of EI(u). Thisaccuracy stems from many users visiting sites in a smallnumber of categories with half the users in all datasetsvisiting sites in two or fewer categories in our datasets(figure not shown).Aggregators know most about popular sites. Wepreviously considered the presence of top aggregatorsacross all publishers in our datasets (Table 2). Main-taining presence on many publishers requires aggrega-tors to build and maintain business relationships. Fig. 4shows the fraction of publishers the top four aggrega-tors are present on for varying numbers of top publish-ers. Top aggregators are focusing on popular publisherswith the top aggregators present on more than 70% of
5
2 4 6 8 10
0.0
0.1
0.2
0.3
0.4
0.5
Inferred Intent (II(u,a)
●
●
●
●● ● ● ● ●
● HTTPmHTTPUniv
Figure 5: Distribution of implicit intent, IIa(u).
potential values for Ia(u) in our model:
Ia(u) =
8<
:
IIa(u) u and p do nothingEI(u) u sells and a buys data1 otherwise
(3)
Both implicit intent (IIa(u)) and explicit intent (EI(u))are as described in Sec. 3.3, with the additional under-standing that the user can now sell EI(u) in the infor-mation market. Recall that implicit intent (IIa(u)) iswhat aggregators can infer, while explicit intent (EI(u))can consist of high quality information that the user di-rectly provides. And when the user or publisher blocktracking there is no increase in CPM as a result of in-tent, hence it is set to 1.
5.3 Quantifying the cost of blocking.We use our datasets and the modified model to un-
derstand the change in revenue if users block tracking.Fig. 5 shows how much value is currently derived fromimplicit intent which stands to be lost if users block.The average value of IIa(u) is 4.2 in the HTTP, 3.8 inmHTTP and 3.1 in the Univ traces, respectively. In-deed, when we compute revenue with all users block-ing (i.e., Ia(u) = 1) revenue decreases by a factor of4.2 in the HTTP, 3.8 in mHTTP, and 3.2 in the Univtraces, respectively. A large population of users block-ing – in the worst case, if the Do Not Track (DNT)header [2] became default – would represent a signif-icant threat to advertising revenue. If proposals likeDNT are honored by aggregators this may lead to low-ered quality of service as the publisher will lose outon additional revenues. Blocking also poses the poten-tial to decrease functionality of Web sites for users(e.g.,blocking Javascript via NoScript [29]). Hence, for thesereasons, it can be argued that most users will not takethe extreme step of blocking entirely. However, we findthat even if 5% of the top users (Fig. 2) block, the rev-enue drop is between 35%-60%. With regards to obfus-cation, if we assume that incorrect targeting is worsethan no targeting at all, then the drop in revenues dueto blocking will form a lower bound on revenue loss dueto obfuscation.
6. INFORMATION MARKETPLACESWe have shown that aggregators can accurately esti-
mate user intent and that their revenue naturally dropsas users unilaterally block tracking. The question thenarises – can privacy solutions be economically viablevis-a-vis online advertising?
To answer this question, we consider an informationmarketplaces that is based around users and aggrega-tors cooperating. For cooperation to occur, the usersand aggregators need to fairly share advertising rev-enue so that each party has incentive to participate inthe market. We address this problem by modeling theinformation market as a cooperative game on a per-
impression basis. We use Shapley value [34] to under-stand how revenue should be shared between players.We consider dynamics beyond a single impression usingempirical data in Sec. 7.
6.1 Basic structure of the game.We model each ad impression as a game, where the
revenue generated by the impression depends on theactions of the players: whether or not to join the infor-mation market.Players. We consider users and aggregators. Whilepublishers play a role in online advertising, they do notpurchase or provide data in our market model. We dis-cuss how publishers may create incentives for users andaggregators to join the market in Sec. 6.4. In one formof markets we consider below, a trusted third party ora mediator is also considered a player.Revenue sharing using Shapley value. Since theoutcome (advertising revenue) depends on the combinede↵orts of players in a coalition, a natural question is howto fairly divide the proceeds of the game among players.Compensating players according to their contribution tothe game creates incentives for them to participate inan information market. The Shapley value [34] allowsto do that using a minimum set of axioms (summarizedin Appendix C). Shapley value also has the desirablestability property – that it lies at the core for generalclasses of games (e.g., convex cooperative games). Thismeans that given Shapley value, all players will haveincentive to enter a stable cooperation. As we calcu-late the Shapley value on a per impression basis thatinvolves the user and aggregator, we do not run intocomputational overheads.
We consider two cooperative games representing po-tential embodiments of an information marketplace:1. Direct marketplace. Aggregators purchase datadirectly from users. This may be achieved using a tech-nology such as RePriv [13]; where the aggregator com-pensates the user in exchange for running a mining plug-in in the user’s browser.2. Mediated marketplace. The sale of user data to
7

* We need to explore alternative approaches to privacy with an economic angle − Transactional privacy focuses on keeping data in control of which data is used and how
* Encouraging observations − Revenue vs. disclosures exhibits a sweet spot − Data revelation can exhibit mutual benefits
* Not shown today: adoption, location privacy 34
Concluding remarks

Thank you!
Riederer, C., Erramilli, V., Chaintreau, A., Krishnamurty, B., & Rodriguez, P. (2011). For sale : Your Data By : You. Proceedings of ACM SIGCOMM HotNets
Gill, P., Erramilli, V., Chaintreau, A., Krishnamurty, B., Papagiannaki, D. & Rodriguez, P. (2013).
Money for nothing and click for free. Working paper
Riederer, C., Erramilli, V., Chaintreau, A., & Krishnamurty, B. (2013). The price (and the place) is right: an economic solution to location privacy. Working paper
35