transactions of society of actuaries 1989 …...transactions of society of actuaries 1989 vol. 41...
TRANSCRIPT

TRANSACTIONS OF SOCIETY OF ACTUARIES 1989 VOL. 41
MORTALITY TRENDS OF MALES AND FEMALES OVER THE AGES
BARNET N. BERIN, GEORGE J. STOLNITZ,* AND AARON TENENBEIN
ABSTRACT
Mortality trends of males and females are examined from the beginnings of the human species until the present. Data up to the nineteenth century are presented to indicate that male survival rates were higher than female sur- vival rates. Data for the twentieth century indicate that the trends have reversed; reasons for this reversal are discussed. Future projections of mor- tality rates and population sizes for females and males, based on Social Security Administration projections, are presented. The social, political, and economic implications are discussed.
1. INTRODUCTION
Over the last 100-150 years, the balance of survival between the sexes has changed dramatically from patterns that apparently held true for eons. Paleodemographers studying the beginning of our species have long observed that population growth for nearly all of humankind's existence was extremely slow despite effectively uncontrolled ("natural") fertility. The reason has been low life expectancy, accompanied by elevated maternal and infant mortality rates acting with special potency to inhibit population growth. Conversely, women had to conceive early, and often, if populations were to survive under the conditions of severely shortened life expectancy. The result, whether among small or large populations, was that females had little choice but to care full time for the young, a pattern that persisted everywhere for millions of years until recently. To an extent, it is still approximated even today among especially primitive or isolated societies, though such instances have been disappearing rapidly.
The purpose of this paper is to emphasize an aspect of this evolution whose importance tends to be underestimated. Historically, the male tended to survive longer than the female, a situation that appears to have persisted from the origins of our species until well into the modern era. The great risks associated with childbirth since antiquity began to be overcome as a
*George J. Stolnitz, not a member of the Society, is Profcssor of Economics, Indiana University.

10 MORTALITY TRENDS OVER THE AGES
result of medical advances on a broad front, improvements in midwifery, and rising social status of women in general.
The modern era's reversal of male-female mortality differentials has pro- duced political, social and economic effects that, despite their importance, are either ignored, taken for granted, or rationalized for mistaken reasons. Many of these implications are considered below, after the trends themselves have been reviewed.
2. THE HISTORICAL EVIDENCE
In these days of projected life expectancies (a term used here to denote the complete expectations of life at birth unless otherwise indicated) that have increased to 75 or 80 years and continue to rise with rare interruptions in industrially developed societies, it is numbing to consider that such ex- pectancies in the Paleolithic and Mesolithic ages ranged, at most, from about 15 to possibly 20 years, according to best available estimates. Even lower longevity expectations must have been typical as the species initially strug- gled to survive.
For clues about mortality in the eons of prehistory, it is useful to consider a remarkable paper written by the distinguished actuary Shigekazu Hishin- uma [4]. He addresses the subject of prehistoric and early historic longevity patterns on the basis of such secondary data sources as archeological find- ings, skeletal evidence, tombstone inscriptions, and the like, up to modern- day mortality reports. Tracing rates of mortality and life expectancies during the seventeenth to nineteenth and into the twentieth centuries makes it clear that only recently--"yesterday" as evolutionary eras go--has the human species begun to live on average beyond what would today be considered incredibly young ages. The major breakthroughs from this entrenched pattern have only emerged for any region within the past two centuries and for most of the world in this century.
In addition to the paper by Hishinuma, reference is made to an article by the distinguished actuary Barbara J. Lautzenheiser [5]. The latter can be read as a complement to the Hishinuma paper because of its excellent discussion of male-female mortality patterns.
The following table illustrates and approximates the main historical trends.

MORTALITY TRENDS OVER THE AGES 11
Es~irmltcd Expectation Era of Life at Age Zcro, eo
Millions of Years Ago 15 years 1800 3O 1900 50 1980 70M, 77.5F
A graph whose horizontal axis represents time and whose vertical axis represents estimated expectation of life at birth can be interpreted as involv- ing the following main temporal segments: • A prehistoric period of extremely abbreviated longevity; • A doubling of life expectancy from about 15 years to 30 years, achieved
about the year 1800, a trend whose completion required several million years before becoming solidly established in a major region;
• Accelerating increases to 50 years by the year 1900, a quantum jump in the rate of change and as yet concentrated in the industrialized regions of the world;
• Subsequent increases to 70 years for males and 77.5 years for females by the year 1980 in the United States and the industrially advanced regions, and later in a growing number of economically less developed areas.
Although much of this summary is heuristic, approximate methods are necessary because of the nature of prehistoric and early historical data. Mod- ern era patterns are representative of the actual trends during the nineteenth and twentieth centuries, because reliable data are available for today's low or lowest mortality areas. In particular, we know that life expectancy has risen by some 45-50 years from 1800 to recent years in the "industrially developed" countries of North America, Europe, Oceania, and Japan and, since roughly 1950, has improved with unprecedented rapidity in many newly developing countries of Asia and Latin America.
By way of contrast, the earliest period estimate of 15 years (plus or minus a considerable percentage margin of error), being based on archeological skeletal and tombstone studies, has to be considered as open to question. Even for "normal" periods, the sample sizes are small, the evidence from infant and child bones is meager, and the numbers of females are especially small when compared with males. Tables of mortality or life expectancy have had to be extended to the infant or childhood and upper-adult or oldest ages on the basis of educated guesses.

12 MORTALITY TRENDS OVER THE AGES
Further and of special importance here, few tables show separate male and female results, and among these, some tables have to be discarded because of internally inconsistent patterns or apparently inappropriate exten- sions from intermediate ages to the beginning and upper parts of the total life span. At best, what seems consistent and plausible in terms of what we know must be limited to a few areas.
Nevertheless, numerous signs indicate that female mortality exceeded male mortality during most of the history of the human species. In Greece from about 3,500 to 1,150 B.c. and again from 1,200 to 150 B.C., according to Hishinuma [4], male life expectancy was found to be above female levels at all ages from birth through the "upper adult" years of those eras. During the earlier of the two periods, the size of the excess was about three years at age zero, rising to about eight years at age 18 and then decreasing to two years at age 56. During the second period, the excess was again three years at birth, increasing to about eight years at ages 10-18, and then declining before seemingly disappearing at age 56. In both, the peak excess of male over female life expectancy appears to have occurred shortly before or early into the childbearing years, a reflection of the enormous toll of maternal mortality.
An abridged life table of ancient Rome cited by Hishinuma, showing five- year age groups from 15-19 through 80-84 and 85 plus, points to higher male expectancies in all age groups and to especially large differentials during the main years of reproduction. The excess rises from about five years at 15-19 to six years at 20-29 and then decreases steadily to about one year at 80-84. This pattern is obviously related to the facts that female age at marriage in ancient Rome was about 15 years, fertility was early and uncontrolled, and maternal mortality was elevated.
Average ages at death from Roman epitaphs show males having the higher average in ten of the eleven occupational categories considered. Only in the category "Inside Rome--Slaves" is the male average age at death less (by 0.7 years) than the female.
Middle Age measures of expectation of life at age 20 for five locations in Hungary show consistently higher male than female longevities, the max- imum difference being 4.4 years.
The mid-seventeenth century life table for London developed by Graunt (see Chapter 2 of [1]) can be cited with more confidence, but provides no information on sex differentials; for combined sexes, expectation of life at birth was under 20 years. Women in London parishes, according to Graunt, were more likely to suffer ill health but had death rates below those of
MORTALITY TRENDS OVER THE AGES 13
males, a comparison he attributed to the influence of treatments by physi- cians and "intemperate natures" of men. Halley (see Chapter 2 of [1]), using mortality data for the city of Breslau toward the end of the seventeenth century, indicates a life expectancy level of 33 or so years, again for com- bined sexes. In the eighteenth century, for which more mortality tables become available, expectation of life at birth is seen to range from about 25 to 35 years (see pages 35-36 of [12]).
Expectation of life improved markedly in the nineteenth century. Hish- inuma cites vaccination against smallpox (Edward Jenner, 1796) and ad- vances in medicine, such as the rise of bacteriology and the control of contagious and infectious diseases, among the significant causes. By the mid-nineteenth century, when modern-style life tables begin to appear for a significant number of western and northern European populations, expec- tation of life at birth was in the neighborhood of 40--45 years.
By 1900, or shortly thereafter, such expectations were nearing or already well above 50 years in nearly all larger countries in these regions. And everywhere, in the same region, female longevity levels had come to exceed male levels, not only at birth, but also as of the start of female reproductive age span (for example, at age 20). (See Appendix Tables 87 and 88 of [1] and Stolnitz [12] and [13]).
Hishinuma refers to the extraordinary jump in nineteenth-century life ex- pectancies in Europe as "the primary revolution"; the same could be said of the trends in the newly settled lands of "Europeans abroad" in North America, Oceania and a few parts of South America. As the main triggers of this revolution, Hishinuma emphasizes medical advances against plague and smallpox. It is true that the virtual elimination of plague and smallpox by the middle of the nineteenth century was surely a major determinant of overall longevity trends. The differentials by sex are apparent in Hishinuma's paper [4]. Additional factors, not mentioned by Hishinuma, were improve- ments in midwifery (cleanliness and technique) as well as the major contri- bution of Dr. Ignaz Semmelweis, which ended the persistent excess mortality attributed to childbirth by employing sterile conditions during and after de- livery [1].
By 1900 or shortly thereafter, the stage was set for the enormously dif- ferent situation we find today with respect to both levels of life expectancy and their associated male-female differentials. In the industrially most ad- vanced countries of the world (the U.S., Canada, most of Europe, Japan, Australia, and New Zealand), without exception, current female life expec- tancies are found to be well above corresponding male measures at all ages.

14 MORTALITY TRENDS OVER THE AGES
Analogous though typically lower differentials have also come to be char- acteristic of the large majority of less developed countries for which reliable estimates exist. Within a relatively short historical period, therefore, perhaps 100 to 150 years at most, a pattern of sex differentials in life expectancy, which had apparently endured for millions of years in most or all main global regions, reversed itself to its current position. Only parts of South Asia today deviate from an otherwise seemingly universal break with the past, and even here the differentials are minor [18].
3. U.S. MORTALITY IN THE TWENTIETH CENTURY
From the beginning of the twentieth century to the present, two significant trends in U.S. mortality have taken place. First, there has been a very large decrease in the mortality rates at all ages in the general population. Second, the disparity in mortality of females "versus" males has widened. In this section, these two trends are examined and the reasons for the trends dis- cussed. Although the trends are analyzed with reference to U.S. mortality, similar movements have been observed in the mortality experience of all developed countries ([12], [13], [14], [15], [16], and [24]).
Of the many studies of U.S. mortality trends, two are discussed in this paper ([2] and [8]). Further, two measures are used to exhibit the trends; namely, the life expectancy (expectation of life) and mortality rates at se- lected ages, or ex and %, respectively.
Table 1 shows the values of eo for males and females from 1900 to 1980 in ten-year intervals. Both the Social Security Administration [2] and the Public Health Service [8] values are presented. The life expectancy values are about the same for both studies except for the years 1940 and earlier. These disparities have occurred for a variety of reasons. The data sources are different, and smoothing and extrapolatory techniques used by the former source (page 8 of [2]) were not utilized by the latter source. At any rate, the differences are minimal, and these two sources reinforce the increasing trend in the improvement of female-to-male mortality.
Table 2 shows the differences between female and male values of e, for each decade beginning at 1900 to 1980 for the ages 0 (birth), 25, 45, and 65. Table 3 shows the ratio of male-to-female mortality rates for the same ages and periods. Figures 1 and 2 graph the trends tabulated in Tables 2 and 3, respectively. These tables and figures are based on the Social Security Administration study [2}.
These tables and figures exhibit two striking patterns. First, the overall improvement in mortality over the first 80 years of the twentieth century has

TABLE 1 0
EXPECTATION OF LIFE AT BIR'rH (eo)
[ Source A* Source B t
Year Male Female Male Female
1900 1910 1920 1930 1940 1950 1960 1970 1980
46.4 50.1 54.5 58.0 61.4 65.6 66.7 67.2 69.9
49.0 53.6 56.3 61.3 65.7 71.1 73.2 74.9 77.5
46.3 48.4 53.6 58.1 60.8 65.6 66.6 67.1 70.0
48.3 51.8 54.6 61.6 65.2 71.1 73.1 74.7 77.5
*Source A: Faber and Wade [2]. *Source B: "1985 Life Tables," Htal Statistics of the United States [8].
"FABLE 2
DIFFERENCES BETWEEN FEMALE AND MALE OF LIFE AT SELECTED AGES
EXPECTATIONS
Ages
Year
1900 1910 1920 1930 I940 1950 1960 1970 1980
Source:
o 25
2.6 1.2 3.5 2.3 1.8 0,5 3.3 2.3 4.3 3.4 5.5 4.7 6.5 5.7 7.7 [ 6.9 7.6 6.8
Faber and Wadc [2].
45 65
1.1 0.7 1.7 0.7 0.8 0.5 2.0 1.1 3.0 1.5 4.1 2.3 5,1 3.0 6.1 4.0 6.0 4.3
TABLE 3
RATIO OF MALE-TO-FEMALE MORTALITY RATES (q.,.)
Year 0
1900 1.22 1910 1.22 1920 1.27 1930 1.25 1940 1.27 1950 1.29 1960 1.30 1970 1.28 1980 1.24
Source: Faber and Wa&
25
1.oo 1.11 0.87 1.07 i .26 1.74 2.21 2.58 3.09
[2I,
Ages
45 65
1.12 1.13 1.31 1.16 1.07 1.09 1.26 1.23 1.38 1.38 1.56 1.64 1.72 1.88 1.76 2.14 1.89 1.98
15

~f.~
~5
FIGURE 1
TREND OF FEMALE-TO-MALE DIFFERENCES IN THE COMPLETE EXPECTATION OF LIFE
8 Age 0 Age 25 .~ ~ M I
. . . . Age 45 ~ " 6 - Age 65 .--- ~ - ~ - ~ ' - s . . . . . .
s ,S
4 - .,.~., ,'S~"
2 -
0 I I I 1 I I 1 1900 1910 1920 1930 1940 1950 1960 1970 1980
~ a r
FIGURE 2
TREND OF THE RATIO OF MALE TO FEMALE MORTALITY RATES
Age 0 3.0 --] ~ Age 25
] . . . . Age 45 ~ I
2.5
2.0
~ N 1.0
0.5
I i l i I i "r t 1900 1910 1920 1930 1940 1950 1960 1970 1980
Year
16
MORTALITY TRENDS OVER THE AGES 17
been both substantial and sustained. Life expectancy at age O, which rose from 46.4 years to 69.9 years for males and from 49 years to 77.5 years for females over the period, also increased in every decade for each sex. Second, and again most striking, has been the rise in female-male differentials. Table 2 shows that the differential in life expectancy at age 0 rose from 2.6 years to 7.6 years; this translates to an average improvement of 0.63 years per decade. For ages 25, 45, and 65, the average improvements are 0.70, 0.61, and 0.45 per decade, respectively. In terms of ratios of male-to-female mor- tality rates, Table 3 documents dramatic increases of 209 percent at age 25, 69 percent at 45, and 75 percent at 65. Figures 1 and 2 and Tables 2 and 3 show that such relative improvements in female-to-male mortality rate were not increasing over shorter periods. There is an unexplainable dip in this relative improvement in 1920 at ages 0, 25, 45, and 65 in Figure 1 and at ages 25, 45, and 65 in Figure 2. After that year, both the differences in expectancy values and the female-to-male mortality ratios have continued to increase up to 1970 before registering plateau-like behavior in most instances and even a decline in one case, that of the 65 + mortality ratio between 1970 and 1980.
An exception to this trend involved mortality rates at age 0. As can be seen from Figure 2, the ratio of male-to-female mortality rates remained rather flat at an average of 1.26. Further, there is evidence of a different trend at the older ages. Portnoy's [11] research suggests that after age 100, there is a changeover in the relationship of male and female mortality rates. Beyond 100, female mortality rates become higher than the corresponding male mortality rates according to available indications, though the data are open to doubt because of the small sample sizes involved.
Several researchers ([5], [7], [19], [22], and [24]) discuss the reasons for the differences between male and female mortality experiences. They cite genetic and environmental reasons for this difference. From the beginning of the twentieth century to the present, males have not benefited as greatly as females from improvements in health care and other advances. One prob- able reason for this has been the greater prevalence of smokers among men than among women. Only recently has the difference in prevalence rates fallen to 6 percent; in 1986 roughly 26 percent of adult women were smokers as compared to 32 percent for adult men [3]. (It is interesting that the difference in female-to-male mortality flattened out from 1970 to 1980, at the same time as differentials in life expectancy and mortality ratios either decreased or increased very slightly; see Tables 2 and 3).

18 MORTALITY TRENDS OVER THE AGES
An interesting comparison of male and female mortality by Lew and Garfinkel [6] considers differences between female and male life expectan- cies for populations involving combinations of smoking habits and health characteristics. At ages 45 and 65 the differences in life expectancies were estimated to be 6.1 and 4.2 for the entire popuIation, compared to 3.7 years at age 45 and 3.0 years at age 65 among the nonsmoking population. The study also included comparisons involving combinations of general health status and smoking habits. In all cases, the differences between age-specific female and male life expectancy values were at least as high as those among nonsmokers. Removing the smoking variable decreases the differences be- tween female and male mortality levels, though it does not remove them altogether. This implies that the genetic factor is an important contribution to the lower mortality rates enjoyed by women.
Future trends, along with their implications for future male and female populations, are discussed in the next section.
Two important questions arise as a result of the above analysis:
1. What effect do sampling errors and nonsampling errors (measurement and nonresponse errors) have on the comparison of male-to-female mortality?
2. Are the differences between female and male mortality statistically significant?
In any statistical study, both sampling errors and nonsampling errors may occur. Sampling errors occur because the mortality measures used are based on sample data rather than on the entire population. In this case the values of ex and qx, upon which Tables 2 and 3 are based, come from data for the entire population (page 3 of [2]), at least since 1940.
On the other hand, if a scientific study were undertaken to determine whether there is a global or multiregional tendency for males to exhibit higher mortality rates than females, then the mortality experience observed in the U.S. could be considered a large sample from a much larger theoretical population. In any case, the U.S. data, being large, can hardly imply that sampling errors are major.
Response or measurement errors occur as a result of recording mistakes. In this case, these could have involved errors in the recording of age at death or the numbers of people alive by age. Such errors may cancel or compound each other in their effects on the computation of mortality measures.
Nonresponse errors occur as a result of a failure to obtain information on targeted segments of the population. For example, in the 1980 census, the

MORTALITY TRENDS OVER THE AGES 19
U.S. population by age and sex was subject to an undercount. The under- count in males was estimated to be about 1.4 percent, as opposed to 0.4 percent for females (page 61 of [21]). If this were taken into account, the male mortality rates would decrease by a greater percentage than the female mortality rates. The end result would be smaller (probably slightly smaller) life expectancy differentials and smaller ratios of male-to-female mortality rates. The effective question of statistical reliability here turns on whether the differences in female and male mortality can be substantially attributed to sampling plus nonsampling errors.
Sampling errors appear to be very small components of the total error involved, except at very advanced ages. Because nonsampling errors, in- cluding measurement and nonresponse errors, are probably much higher than sampling errors, as has been reported by Stoto [17] with respect to demo- graphic projections, standard tests might erroneously conclude, given the large sample sizes involved, that minor differences between male and female mortality rates are statistically significant.
With all errors duly taken into account, it is nevertheless evident that noteworthy differences between U.S. female and male mortality levels were present at the beginning of the twentieth century and that such differences have attained much higher levels since then. These conclusions are wholly consistent with the factual trends clearly in evidence for all developed coun- tries of the world ([12], [13], [14], [15], [16], and [24]).
4. PAST, PRESENT AND FUTURE TRENDS IN RELATIVE POPULATION SIZES
OF MALES VERSUS FEMALES
Mortality trends during the twentieth century have had a significant effect on the relative numbers of males and females in the U.S. population. Be- cause of the sustained relative improvement of female mortality with respect to male mortality, the percentage of females in the population has risen substantially. Table 4 shows the ratios of males to females in the U.S. population according to the 1900 through 1980 censuses. As can be seen, there have been dramatic decreases in such ratios, especially at the older ages.
The current pattern of ratios by age, based on the 1980 census, is presented in Table 5. Two sets of values are presented. The first is taken from un- adjusted census data (Table 1, page 20 of [21]). Because males were un- dercounted to a greater extent than females, the second set of ratios is, for the most part, larger than the first set except at ages beyond 75, for which biases in reporting may run in the opposite direction.

TABLE 4
NUMBER OF MALES PER 100 FEMALES IN THE U.8 . POPULATION BY YEAR AND AGE GROUP*
Ages
Year All 0-19 2(~44 45-64 65 and over
1900' 104.4 101.3 106.1 111.0 102.0 1920' 104.1 101.3 103.2 114.4 101.7 1940 100.9 102.4 98.5 105.1 95.4 1960' 98.9 104.3 100.7 95.3 80.0 1980' 96.7 104.5 102.3 94.0 67.3
*This table has been assembled by Alice H. Wade of the Social Security Administration and based on census enumeration.
*The values exclude the Armed Forces. *The values are adjusted for undcrcount.
TABLE 5
NUMBER OF MALES PER 100 FEMALES IN THE TOTAL U.S. POPULATION
IN 1980 FOR SELECTED AGE GROUPS (INCLUDING THE ARMED FORCES OVERSEAS)
July l, 1980 April I, 1980 Estimated Unadjusted Census Adjusted
Age Class for Undercount for Undercount
All 94.9 96.7 0-4 5-9
10-14 15-19 20-24 25-29 30-34 35-39 40--44 45~.9 50-54 55-59 60--64 65-69 70-74 75-79 80-84 85 +
104.7 104.7 104.4 103.8 101.7 99.9 98.5 97.3 96.1 94.7 92.4 89.3 86.3 80.1 72.4 62.8 53.2 43.5
104.8 104.8 104.3 104.2 104.3 103.1 101.8 100.8 99.9 98.4 96.0 92.8 88.4 81.1 72.4 62.3 52.0 42.2
Source: U.S. Bureau of the Census, "United States Pop- ulation Estimates by Age, Sex and Race: 1980-1987," pp. 20 and 55 [21].
20

MORTALITY TRENDS OVER THE AGES 21
From this table, several main facts emerge. The ratios of males to females are consistently above unity at the younger ages, owing to the fact that male births exceed female births consistently. In 1985, for example, the ratio of male to female births was 105.2 percent, and similar measures occur with only minor variations year in and year out [9]. The ratio of males to females steadily decreases beyond birth, however, becoming less than unity at about age group 40--44 for the adjusted census data and reaching extremely low levels at the advanced ages. This occurs because of increasingly larger mor- tality differentials between the sexes with advancing age, as indicated in Table 3 and Figure 2.
Forecasts of future trends in population typically follow from separate assumptions about fertility, mortality, and net immigration. For example, the Faber and Wade [2] forecasts for the year 2050 imply that life expectancy would rise to 76.2 years for males and 83.9 years for females, a difference of 7.7 years, virtually the same value as was found in 1980. The implicit forecast, therefore, is that the overall longevity gap between females and males will remain constant. Olshansky [10] has stated that mortality declines have been underestimated in the past by the Society Security Administration, but says nothing about the possible effects on male and female expectancy levels. Verbrugge and Wingrad [22] suggest that several factors, such as improvements in men's health due to exercise coupled with the increased exposure of women to job stresses and cigarette smoking, may cause the gap between female and male mortality to stabilize over time.
Population projections by the Bureau of the Census [20] and the Office of the Actuary of the Social Security Administration [23] assume that the gap between female and male mortality will stabilize as women become increasingly subject to many of the same environmental hazards and social pressures as men. The projections of the relative sizes of the male and female populations for various age groups made by the Office of the Actuary of the Social Security Administration [23] were adjusted for the 1980 net census undercount. Table 6 shows their projected total population to 2080, by sex, using "alternative II" assumptions, which were considered to be middle-of- the-road. Forecasts under tWO other sets of assumptions are presented in [23].
Table 7 shows recent and projected ratios of males to females, along with the size of the numerical differences, under alternative II. Note that the ratios remain fairly stable for the age groups 0-19 and 20-44, where males exceed females. For the age group 45-64, the number of females in 1985 was higher than the number of males, by about 1.275 million, and reductions

22 MORTALITY TRENDS OVER THE AGES
TABLE 6
RECENT AND PROJECTED TOTAL U.S. POPULATION BY SEX ([NCLUDING U.S. TERRITORIES AND ARMED FORCES OVERSEAS)
(000'S OMITFED)
Number Number of Year of Males Females Total
1985 1990 1995 2000 2020 2040 2060 2080
121,617 126,873 131,532 135,660 149,547 154,372 156,369 159,992
125,553 130,895 135,643 139,834 154,151 161,634 163,417 167,049
247,170 257,769 267,175 275,493 303,698 316,005 319,785 327,041
Source: Wade [23]. The projections are based on alternative I1 assumptions.
in this difference are forecast thereafter. The trend leads up to a projected crossover by the year 2080 when, for the first time, more males than females are projected.
TABLE 7 RECENT AND PROJECTED NUMBER OF MALES PER 100 FEMALES AND THE DIFFERENCES
BETWEEN NUMBERS OF FEMALES AND MALES BY AGE GROUP (TOTAL U.8. POPULATION INCLUDING ARMED FORCES OVERSEAS)*
{ Ages
0-19 20M.4 45-64 65 and Over All
Year N ~ D* Y I D . _ N j D ' Y ~ D N D
1985 104.6 -1.661 102.5 i -1"202 94.6 1.275 I 67.9 5.524 96.9 3.936 1990 104.7 - 1.693 103.1 1.563 94.8 ~ 1.3{)0, 68.4 5.978 96.9 4.022 1995 104.7 -1 .707 103.3 I -1.683 95.9 I 1.155 ' 68.8 6.346 97.0 4.111 2000 104.6 - 1.705 103.0 1.463 97.1 0.769 I 68.9 6.572 97.0 4.174 2020 104.7 -1.723 103.1 i 1.488 98.9 i 0 428 75.6 7.387 97.0 4.604 2040 104.7 - 1.743 103.3 i - 1.552 99.5 i 0.174 I 73.9 10.383 95.5 7.262 2060 104.7 - 1.778 103.3 1.616 99.9 0.049 I 74.2 10.393 95.7 7.048 2080 104.7 -1.809 103.4 I 1 .681 100.1 I -0 .047~ 74.8 10.594 95.8 7.057
*Source: Wade [23]. The projections are based on alternative I1 assumptions. *N represents the number of males per 100 females. *D represents the differences between the number of fcmales and the number of males in millions.
The 65-plus age group shows an especially dramatic trend in the numerical differences. While the ratio of males to females is projected to increase, the projected increases in the numbers of both sexes are such that their difference

MORTALITY TRENDS OVER THE AGES 23
in numbers almost doubles, from 5.5 million in 1985 to 10.6 million in 2080. For combined ages, the corresponding difference rises from 3.9 mil- lion in 1985 to 7.1 million in 2080, the largest increase taking place between 2020 and 2040. This trend may be due in part to the baby-boom generation, which enters the elderly population (over 70) between 2020 and 2040.
5. IMPLICATIONS: SOCIAL, ECONOMIC AND POLITICAL
Note that the relative shift in the improvement of female versus male survival rates that took place during the nineteenth and twentieth centuries was coupled with the emergence of the relative importance of the role of females in the society of developed nations. Of course, whether a cause- and-effect relationship exists remains to be demonstrated. However, a pos- sible interpretation is that the higher male survival rates that prevailed his- torically acted significantly to influence male-female differences in conventional social, economic and political roles.
From the very beginning of human existence, group survival must have required maximum attention to childbearing and childrearing, hence, to sex- defined divisions of function. Not only was there the need to conceive, nurse and care for the young, but also women had to be shielded from battle and external threat. Hunter, warrior and communal leadership functions had to be male selective, both for the group as a whole and for its individual elements. It was a small step from these preconditions for group survival and continuity in hostile environments to the emergence of masculine su- periority patterns in family, social and communal relations. As a result, by default, men were to be the "natural" leaders.
Manifold evidences of this generalization can be found both over time and in many different areas of the world. In addition, wives died in childbirth not infrequently. Thus, it is no accident that men notable enough to be recorded by history often had more than one wife. Similarly, despite high infant mortality of both sexes throughout history, few of those recorded in annals emphasize females. (Again, note that male status superiorities are coupled with relatively higher male survival rates; however, as mentioned above, a cause-and-effect relationship remains to be demonstrated). Nor was it a quirk of character, which explains why Queen Elizabeth I, while aware of the use of a politically desirable alliance by marriage, was, nevertheless, dissuaded from marrying by fears of death from childbirth. The fact that males have dominated the arts, sciences, politics, and business until well into this century is surely consistent with the above social roles--mortality

24 MORTALITY TRENDS OVER THE AGES
and social status-mortality linked hypotheses. A number of primitive soci- eties in Africa, Australia and South America suggest the same hypotheses, as did North American Indian societies when first observed by Europeans.
Today, while more males continue to be born than females--for yet unexplained reasons--higher male mortality eliminates the numerical im- balance by about age 40 in the developed countries and by age 60 in the less developed countries. Beyond these ages the opposite imbalance in sex ratios (males per 100 females) emerges and becomes ever more pronounced with increasing age. (See Table 5.) The later reversal of relative male and female numbers in the less developed countries reflects their often smaller mortality differentials and occasional higher female death rates.
In the U.S., the sex ratio for persons aged 65 and over in the native- born population has fallen dramatically from 102 in 1900 to 95.4 in 1940, 80 in 1960, and 67.3 in 1980 (see Table 4).
The downtrend has been influenced by wartime losses. The early-century ratios have been diminished by the Civil War aftereffects and later ratios by the wars of this century. In any event, steadily rising differentials in life expectancy during the past century have been the major cause, by far, of the dramatic transformation of ratios. This can be seen from the fact that the female expectation of life at birth in this country, only about 2.6 years higher than males in 1900, is 7.6 years higher currently, a threefold increase.
Analogous measures for the other industrially advanced, low mortality nations would undoubtedly show similar trends, even after allowance is made for effects of wartime losses.
One may reasonably expect that female struggles to achieve equal status, both within and outside the family, are bound to be much reinforced by their growing numerical superiority in the middle and upper adult ages, the more so since all such ages confer voting rights. Moreover, this expectation should become increasingly apparent as the effects of female mortality advances continue. If males historically could not be challenged in societies that were beset by population-threatening mortality and by needs for survival, today's radically transformed vital rate conditions might indicate ever-rising socio- political and economic potential for women.
Scientific tampering with the basic building blocks of life, some of which is already well under way, could derail this evolutionary prospect. Genetically induced changes, cloning, biological controls favoring male over female births, reversed patterns of sex differentials in mortality--any or all of these could lead to unforeseen sex ratio patterns in the future. However, only such speculative possibilities would appear to be sufficiently strong

MORTALITY TRENDS OVER THE AGES 25
enough to reverse this century's long-run progression, not only in all the economically developed regions, but also increasingly in the developing regions as well.
Derivative questions abound in contemplating the comparative male- female statuses that may lie ahead:
• Will women become increasingly vulnerable to male illness and mortality patterns as they move in ever greater numbers into labor markets and job stress situations?
• Will genetic changes that could significantly affect sex ratios by age be allowed to occur freely, partly, or not at all?
• Will traditional gender roles in the family (breadwinner and homemaker) change as a result of trends in male-female mortality differentials?
• On nondemographic fronts, will women emerge as more effective par- ticipants in labor market, political and bureaucratic contexts than men?
• Will changing sex ratio imbalances become sources of unexpected social problems, for example, with respect to marital patterns and intergener- ational sharing of income?
• Will such questions arise, and eventually be answered, in the less de- veloped regions, where modern-era mortality trends take longer to appear?
• Will increased differences between number of females and males at the older ages have greater social, political, and economic effects?
Underlying all of these is a series of fascinating questions: Why are the current differences in mortality showing females as the main beneficiary? What part of such differences is genetic? What part environmental? What may happen as science looks into the possibility of anti-aging agents?
ACKNOWLEDGMENTS
The authors would like to thank Franscisco Bayo and Alice H. Wade of the Social Security Administration for their input and help in assembling some of the tables in the study.
BIBLIOGRAPHY
1. DUBLIN, LOUIS, LOTKA) ALFRED, AND SPIEGELMAN, MORTIMER. Length of Life. Rev. ed. Ronald Press, 1936.
2. FABER, JOSEPH F. AND WADE, ALICE H. "Life Tables for the United States: 1900- 2050," Actuarial Study No. 89, SSA Publication No. 11-11536. Washington D.C.: U.S. Department of Health and Human Services, December 1983.

26 MORTALITY TRENDS OVER THE AGES
3. FIELDING, JONATHAN E. "Smoking and Women: Tragedy of the Majority," New England Journal of Medicine 317, no. 21 (1987): 1343--45.
4. HISHINUMA, SHIGEKAZU. "Historical Review on the Longevity of the Human Beings," Transactions of the 20th International Congvess of Actuaries in Tokyo 5(1976): 251- 61.
5. LAUTZENHEISER, BARBARA J. "Sex and the Single Table: Equal Retirement Income for the Sexes," Employee Benefits Journal 2, no. 1 (Fall 1976): 8-13, 38-44.
6. LEW, EDWARD A. AND GARFINKEL, LAWRENCE. "Differences in Mortality and Longevity by Sex, Smoking Habits and Health Status," TSA XXXIX (1987): 19- 37.
7. LOPEZ, ALAN D. "Sex Differentials in Mortality," WHO Chronicle 38, no. 5 (1984): 217-24.
8. NATIONAL CENTER FOR HEALTH STATISTICS. "1985 Life Tables," Vital Statistics of the United States, Vol. II, Mortality, 1985, Part A, Section 6. Public Health Service. Washington, D.C.: Government Printing Office.
9. NATIONAL CENTER FOR HEALTH STATISTICS. Vital Statistics of the United States, Vol. I, Natality, 1985, Section 1. Washington, D.C.: Government Printing Office.
10. OLSHANSKY, S. JAY. "On Forecasting Mortality," Milbank Quarterly 66, no. 3 (1988): 482-530.
11. PORTNO¥, ESTHER. "Crossover in Mortality Rates by Sex," TSA XXXVIII (1986): 229-42.
12. STOLNITZ, GEORGE J. " A Century of International Mortality Trends: 1," Population Studies IX, no. 1 (July 1955): 24-55.
I3. STOLNITZ, GEORGE J. "'A Century of International Mortality Trends: II ," Popu- lation Studies X, no. 1 (July 1956): 17-42.
I4. STOLNITZ, GEORGE J. "International Mortality Trends: Some Main Facts and Im- plications." In United Nations, The Population Debate: Dimensions and Perspec- tives: Papers of the World Population Conference, Bucharest 1974, Vol. 1. 1975.
15. STOLNITZ, GEORGE J. "Mortality Trends: Post World War II Trends." In The International Encyclopedia of Population, Vol. Two. New York: The Free Press, 1982.
16. STOLNITZ, GEORGE .l. "Mortality." In The New Palgrave: A Dictionary of Eco- nomics, edited by JOHN EATWELL, ET AL., Vol. 3, 556---60. New York: Stockton Press, 1987.
17. STOTO, MICHAEL A. "Dealing with Uncertainty: Statistics for an Aging Popula- tion," The American Statistician 42, no. 2 (May 1988): 103-10.
18. UNITED NATIONS. World Population Prospects: Estimates and Projections as As- sessed in 1982, Sales Number E.83 XII.5, I985, pp. 143, 145.
19. UNITED NATIONS POPULATION DIVISION. "Are Sex Differences in Life Expectancy on the Increase?" Population Newsletter, no. 44 (December 1987).

MORTALITY TRENDS OVER THE AGES 27
20. U.S. BUREAU OF THE CENSUS. "Projections of the Population of the United States by Age, Sex and Race: 1983-2080," Current Population Reports ser. P-25, no. 952. Washington, D.C.: Government Printing Office, May 1984.
21. U.S. BUREAU OF THE CENSUS. "United States Population Estimates by Age, Sex, and Race: 1980 to 1987," Current Population Reports ser. P-25, no. 1022. Wash- ington, D.C.: Government Printing Office, March 1988.
22. VERBRUGGE, LOtS M. AND WINGRAD, DEBORAH L. "Sex Differentials in Health and Mortality," Health Matrix V, no. 2 (1987): 3-19.
23. WA~E, ALICE. "Social Security Area P~pulation Projections 1987," Actuarial Study No. 99, SSA Publication No. 11-11546. Washington, D.C.: U.S. Department of Health and Human Services, August 1987.
24. WALDRON, INGRID. "What Do We Know about Causes of Sex Differences in Mortality? A Review of the Literature," Population Bulletin of the United Nations, no. 18, (1985): 59-76.

DISCUSSION OF PRECEDING PAPER
ROBERT J. MYERS:
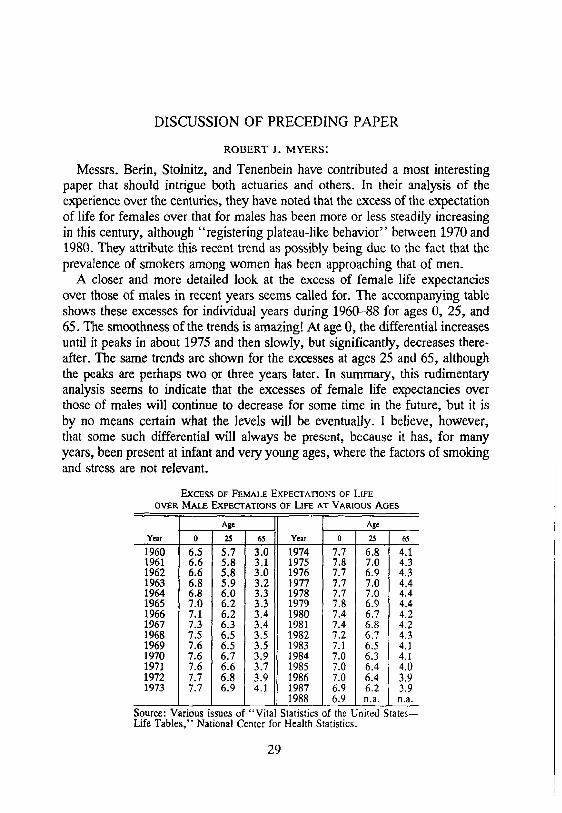
Messrs. Berin, Stolnitz, and Tenenbein have contributed a most interesting paper that should intrigue both actuaries and others. In their analysis of the experience over the centuries, they have noted that the excess of the expectation of life for females over that for males has been more or less steadily increasing in this century, although "registering plateau-like behavior" between 1970 and 1980. They attribute this recent trend as possibly being due to the fact that the prevalence of smokers among women has been approaching that of men.
A closer and more detailed look at the excess of female life expectancies over those of males in recent years seems called for. The accompanying table shows these excesses for individual years during 1960-88 for ages 0, 25, and 65. The smoothness of the trends is amazing! At age 0, the differential increases until it peaks in about 1975 and then slowly, but significantly, decreases there- after. The same trends are shown for the excesses at ages 25 and 65, although the peaks are perhaps two or three years later. In summary, this rudimentary analysis seems to indicate that the excesses of female life expectancies over those of males will continue to decrease for some time in the future, but it is by no means certain what the levels will be eventually. I believe, however, that some such differential will always be present, because it has, for many years, been present at infant and very young ages, where the factors of smoking and stress are not relevant.
EXCESS OF FEMALE EXPECTATIONS OF LIFE OVER MALE EXPECTATIONS OF LIFE AT VARIOUS AGES
Age Age
Year 0 25 65 Year 0 25 65
1960 6.5 5.7 3.0 1974 7.7 6.8 4.1 1961 6.6 5.8 3.1 1975 7.8 7.0 4.3 1962 6.6 5.8 3.0 1976 7.7 6.9 4.3 1963 6.8 5.9 3.2 1977 7.7 7.0 4.4 1964 6.8 6.0 3.3 1978 7.7 7.0 4.4 1965 7.0 6.2 3.3 1979 7.8 6.9 4.4 1966 7.1 6.2 3.4 1980 7.4 6.7 4.2 1967 7.3 6.3 3.4 1981 7.4 6.8 4.2 1968 7.5 6.5 3.5 1982 7.2 6.7 4.3 1969 7.6 6.5 3.5 1983 7.1 6.5 4.1 1970 7.6 6.7 3.9 1984 7.0 6.3 4.1 1971 7.6 6.6 3.7 1985 7.0 6.4 4.0 1972 7.7 6.8 3.9 1986 7.0 6.4 3.9 1973 7.7 6.9 4.1 1987 6.9 6.2 3.9
1988 6.9 n.a. n.a.
Source: Various issues of "Vital Statistics of the United States-- Life Tables," National Center for Health Statistics.
29

30 MORTALITY TRENDS OVER THE AGES
EDWIN HUSTEAD:
The data and analysis in "Mortality Trends of Males and Females over the Ages" neither prove nor disprove the paper's stated hypothesis that there has been a dramatic change in the balance of survival between the sexes. The introduction promises that major "political, social and economic ef- fects" of this change will be considered, but the effects are neither presented nor discussed.
The section on "The Historical Evidence" contains extensive data on trends in mortality, but little of it is split by sex. Evidence of male survival being higher than female survival is very sparse and ancient. Hishinuma did an excellent job of pulling together many scattered and obscure sources to produce a picture of general trends in mortality throughout, and even before, recorded history, but the few pre-modern tables that split male and female mortality are hardly significant enough to provide reliable information on differences in mortality by sex.
The authors accept the commonly held view that modern scientific life tables started with Graunt's tables in the mid-seventeenth century. However, they did not find any evidence in these modern tables that male survival has exceeded female survival. The only accepted tables that differentiate by sex are from this century, and they consistently show females with longer sur- vival than males.
Sections 3 and 4 are an excellent summary and analysis of the data from Social Security, but all the data show females living longer than males.
In Section 5, in contrast to the authors' promises, the effects of the change in survival rates are not presented and discussed. What we have instead is a justification for the inferior role of women in society that is not based on actuarial studies. Without the copious footnotes that have attended the pre- vious sections, we can only assume that the statements are the authors' opinions and do not have any scientific basis.
In the authors' opinion the hunter, warrior and leadership roles had to fall to the stronger males while the women were needed for child-bearing and -rearing. This is a highly controversial statement that should be supported either by reference or through the findings of the study. Presentation of unsupported opinion is disturbing. Unsupported opinion is of particular con- cern when it falls outside of the realm of actuarial knowledge and is very controversial in society at large.

DISCUSSION 31
(AUTHORS' REVIEW OF DISCUSSION)
BARNET N. BER1N, GEORGE J. STOLNITZ, AND AARON TENENBEIN:
Robert J. Myers' table, of the excess of female expectations of life over male expectations of life, 1960-1987, shows that at age 0, the difference of 6.5 years increased 1.3 years to a maximum of 7.8 years (1975, 1979) and then decreased 0.9 years to 6.9 years. At age 25, the difference of 5.7 years increased 1.3 years to a maximum of 7.0 years (1975, 1977-1978) and then decreased 0.8 years to 6.2 years. At age 65, the difference of 3.0 years increased 1.4 years to a maximum of 4.4 years (1977-1979) and then de- creased 0.5 years to 3.9 years.
Although it is too early to determine whether the net increases (1960-- 1979) followed by net decreases (1980-1987) are indications of a trend, the differences in life expectancies bear watching.
Edwin C. Hustead states that there is no evidence that male survival has exceeded female survival from the tables presented. However, Table 4 does provide evidence that this did occur in the nineteenth century. In the year 1900, there were more males than females in the U.S. at all ages. In the older categories (45-64 and 65 and over), the ratios are both greater than one. Of course, male-to-female ratios do depend upon factors other than mortality (such as birth rates and immigration). However, the fact that the ratio was 111 percent at ages 45-64 in 1900, while the birth ratio of males to females was fairly constant at 105 percent, would certainly imply that female mortality exceeded male mortality in the nineteenth century. This occurred in spite of war deaths, which would have the effect of decreasing the male population relative to the female population.
Examples of higher male than female life expectancy at birth are not hard to find, as in South Asia currently and in Sri Lanka some decades ago. More importantly, there are numerous instances of higher female than male mor- tality rates at the reproductive ages among Western populations, before World War I, in reflection of the risks of child-bearing. These differentials neither necessarily nor as a rule implied lower female expectations of life at birth, because other ages affect the latter; they did, however, necessarily imply lower expectations of life between roughly 15 or 20 to 35 or 40. Female- selective infanticide among the Chinese and Japanese, much documented and undisputed, was a "staple feature" in those areas. Undoubted is the fact that differences between higher female and lower male life expectancies at birth increased steadily, from relatively low orders of magnitude about
32 MORTALITY TRENDS OVER THE AGES
World War I or 1920 to high multiples of such magnitudes by, say, 1985, throughout the industrialized world.
It is apparent that the ratio of female to male survival rates has increased throughout the twentieth century quite dramatically. At the turn of the cen- tury the mortality rates at age 25 were the same for males and females. In 1980 the mortality rate for males was more than three times the correspond- ing rate for females (see Table 3).
Throughout his comments, Mr. Hustead refers to the fact that there is unsupported opinion in this study. Section 5 states that proof in terms of demonstrating a cause-and-effect relationship may not be possible. However, the facts presented in the paper raise the interesting premise that as female mortality experience improved, relative to males, the status of women in society changed dramatically.