transcription factor networks play a key role in human brain
TRANSCRIPT
i
Transcription factor networks play a key role in human brain evolution and
disorders
Von der Fakultät für Mathematik und Informatik der Universität Leipzig
eingereichte
Dissertation
zur Erlangung des akademischen Grades
Doctor rerum naturalium (Dr. rer. nat.)
im Fachgebiet
Informatik
vorgelegt von
Stefano Berto
geboren am 24. Juli 1983 in Conegliano (Italien)
Die Annahme Der Dissertation wurde empfohlen von:
1. Professor Dr. Erich Bornberg-Bauer (Universität Münster)
2. Professor Dr. Peter F. Stadler (Universität Leipzig)
Die Verleihung des akademischen Grades erfolgt mit Bestehen
der Verteidigung am 19. Januar 2016 mit dem Gesamtprädikat
magna cum laude

ii

iii
Acknowledgments I would like to thank my supervisor Katja Nowick for her support,
encouragement, and advice throughout my PhD. I am truly thankful to her
also for giving me this amazing opportunity to work in such a dynamic and
inspiring environment. With her discussions, suggestions, and motivations,
I have been able to gain insight into primate and, in particular, brain
evolution. I also feel privileged for being part of her group and its
multicultural environment. I would like to thank Alvaro Perdomo Sabogal,
Maria Beatriz Walter Costa, Sree Rohit Raj Kolora, Sabina Kanton, and all
the undergraduate students Lisa, Sandra, Nadine, Anna, and Cladia for all
their help during discussions and lab meetings. One particular thank you
goes to our lab manager, Katja Jacob, who helped me and followed me
during these past years solving problems in the laboratory and teaching
me the techniques I am currently working with.
I would also like to thank the entire bioinformatic department, with a
special thanks to Mario Fasold, Gero Doose, Steve Hoffman, Daniel
Gerighausen, Lydia Muller, Christian Arnold, and Lydia Hopp for all the
support, help, and suggestions they gave me during my PhD.
Finally, I am heavily thankful to my current supervisor, Genevieve
Konopka, and her laboratory, the Konopka lab, at UT Southwestern
Medical Center in Dallas, for their exceptional support during the last year
with suggestions and help to understand better the molecular mechanisms
of cognition and brain development.
A special thanks also to my friend, Andrea Trevisiol, who has provided me
with an amazing Italian coffee machine, an exceptional support during the
last PhD year.

iv
Dedication
This thesis is dedicated to my wife Arianna Martin and to my parents.
Three amazing and wonderful great apes.
Without their help and support, I would not have reached my goals.
A special dedication also goes to my little Jackie, a silly dog who has put a smile
on my face, even on the most stressed days.
“Darwin wasn't just provocative in saying that we descend from the apes - he
didn't go far enough. We are apes in every way, from our long arms and tailless
bodies to our habits and temperament.”
Frans de Waal, Emory University

v
vi
Abstract Although the human brain has been studied over past decades at
morphological and histological levels, much remains unknown about its
molecular and genetic mechanisms.
Furthermore, when compared with our closest relative the chimpanzee,
the human brain strikingly shows great morphological changes that have
been often associated with our cognitive specializations and skills.
Nevertheless, such drastic changes in the human brain may have arisen
not only through morphological changes but also through changes in the
expression levels of genes and transcripts.
Gene regulatory networks are complex and large-scale sets of protein
interactions that play a fundamental role at the core of cellular and tissue
functions. Among the most important players of such regulatory networks
are transcription factors (TFs) and the transcriptional circuitries in which
TFs are the central nodes.
Over past decades, several studies have focused on the functional
characterization of brain-specific TFs, highlighting their pathways,
interactions, and target genes implicated in brain development and often
disorders. However, one of the main limitations of such studies is the data
collection which is generally based on an individual experiment using a
single TF.
To understand how TFs might contribute to such human-specific cognitive
abilities, it is necessary to integrate the TFs into a system level network to
emphasize their potential pathways and circuitry.
This thesis proceeds with a novel systems biology approach to infer the
evolution of these networks. Using human, chimpanzee, and rhesus
macaque, we spanned circa 35 million years of evolution to infer ancestral
TF networks and the TF-TF interactions that are conserved or shared in
important brain regions.
Additionally, we developed a novel method to integrate multiple TF
networks derived from human frontal lobe next-generation sequencing
data into a high confidence consensus network. In this study, we also
vii
integrated a manually curated list of TFs important for brain function and
disorders. Interestingly, such “Brain-TFs” are important hubs of the
consensus network, emphasizing their biological role in TF circuitry in the
human frontal lobe.
This thesis describes two major studies in which DNA microarray and
RNA-sequencing (RNA-seq) datasets have been mined, directing the TFs
and their potential target genes into co-expression networks in human and
non-human primate brain genome-wide expression datasets.
In a third study we functionally characterized ZEB2, a TF implicated in
brain development and linked with Mowat-Wilson syndrome, using human,
chimpanzee, and orangutan cell lines. This work introduces not only an
accurate analysis of ZEB2 targets, but also an analysis of the evolution of
ZEB2 binding sites and the regulatory network controlled by ZEB2 in great
apes, spanning circa 16 million years of evolution.
In summary, those studies demonstrated the critical role of TFs on the
gene regulatory networks of human frontal lobe evolution and functions,
emphasizing the potential relationships between TF circuitries and such
cognitive skills that make humans unique.

viii
ix
Contents
INTRODUCTION ..................................................................................... 1
1.1 The primate brain: anatomical evolution ..................................... 1
1.2 The primate brain: molecular evolution ....................................... 4
1.3 Transcription factors ..................................................................... 7
1.4 Gene regulation played by transcription factors ........................ 8
1.5 Transcription factors in human .................................................. 10
1.6 Transcription factors and brain development........................... 12
1.7 Transcription factors and networks ........................................... 16
CHAPTERS ............................................................................................ 20
CHAPTER 1 ........................................................................................... 23
Project summary ................................................................................ 23
Introduction ........................................................................................ 24
Results ................................................................................................ 26
Lineage-specific expression pattern changes .......................... 26
TF networks in each species ....................................................... 27
Network evolution ........................................................................ 30
Species differences in the networks of other tissues .............. 33
Expression Changed Sub-Networks ........................................... 35
Discussion .......................................................................................... 38
Methods .............................................................................................. 41
CHAPTER 2 ........................................................................................... 47
Project summary ................................................................................ 47
Introduction ........................................................................................ 48
x
Results ............................................................................................... 51
Transcription factors in cognition, brain development and disorders ................................................................................. 51
Ten different genome-wide TFs co-expression networks .. 53
The consensus network ......................................................... 56
The Brain-TFs and their role in the consensus network .... 58
Discussion ......................................................................................... 62
Methods .............................................................................................. 67
CHAPTER 3 ............................................................................................ 73
Introduction ....................................................................................... 73
Results ............................................................................................... 75
Genomic distribution of ZEB2 binding in three great apes 75
ZEB2 mediated gene expression .......................................... 81
Discussion ......................................................................................... 83
Methods .............................................................................................. 86
Summary, conclusions, and future perspective .................................. 90
TF-TF relationships by co-expression ............................................ 91
ZEB2: a transcription factor important for human brain evolution and functions. .................................................................................... 94
Outlook and future directions ............................................................... 99
APPENDIX ............................................................................................. 101
Bibliography .......................................................................................... 134
Bibliographic Information .................................................................... 151


Introduction
1
INTRODUCTION The human brain is complex organ defined by billions of cells that actively
interacts to control functions, cognitive skills, and behaviors. Gene
regulatory mechanisms have been hypothesized to be an essential
mechanism that regulates such brain complexity and functions. In those
regulatory mechanisms, transcription factors (TF) have a key role to define
the cell type identity, controlling the expression of the genes and the
regulatory mechanism architectures.
To increase the knowledge about TFs, I have explored the TF circuitries in
human brain from both a brain function and evolutionary perspective using
genomic approaches.
In this first chapter, I will introduce the evolution of the brain in primates
and the potential role of the transcription factors in the human cognition
and brain disorder.
This chapter further introduces some aspects of the transcription factors
functions and what has been uncovered. It describes how microarray and
RNA-sequencing platforms have been remarkable tools to infer the human
brain evolution. Finally, an overview of the co-expression network method
and its application to mine the data presented.
1.1 The primate brain: anatomical evolution
What makes humans different from the other hominids and great apes?
This is one of the most intriguing questions that in past decades have
driven several studies, projects, and scientific fields. In the field of
paleoanthropology, it is well described how humans belong to the primate
order, and, since Darwin and his “The Descent of Man, and Selection in
Relation to Sex”, there has been a continuous effort to better understand
the evolution of humans.
The recent discovery of hominid fossils, such as Homo neanderthalensis
and Denisovan, contribute to a better understanding of the history of our
species and of the characters and traits which seem human-specific.
Introduction
2
Although our notions about human anatomy and paleoneurology come
from fossil records, most of the phenotypical changes that happened in
the human lineage are yet uncharacterized.
Humans in general can be distinguished by several important traits. For
example humans are bipedal and their locomotion is significantly different
when compared with other great apes (Spoor et al. 1994). Humans also
have smaller canine teeth due to the drastic changes in their diet during
their evolution (Teaford and Ungar 2000; Dean et al. 2001).
But one important phenotype that drastically changed in the human
lineage is a bigger brain that is linked with some human-specific traits
such as language, tool making, and distinctive sociality (Gibson et al.
1994; Bickerton 1995; Noble 1996; Adolphs 1999; Schoenemann 2006;
Pinker 2010).
Focusing on the brain, there are 350 primate species (Groves 2001)
featuring a large range of brain sizes, going from 2 grams up to 1.5
kilograms. Moreover, primates are characterized by an increased
encephalization (ratio of brain size and body mass) which has remarkably
reached the highest value in the human lineage (Shultz and Dunbar
2010). Furthermore, humans have an even bigger cranial capacity relative
to body size compared with the typical trend of other primates (Hofman
1983), highlighting how strikingly different the human brain is. This rapid
enlargement of the brain in primates, and in particular in the human
lineage, has been associated with cognitive abilities and complex sociality
(Dunbar and Shultz 2007), and humans in fact show specific traits that are
presumably linked with the bigger brain.
For instance, when compared with our closest relatives, chimpanzees and
bonobos, the human brain is approximately 2 times larger (Carroll 2003),
and the neocortex, which corresponds to 80% of the total human brain, is
overdeveloped with a higher number of neurons and glial cells (Herculano-
Houzel 2009), and it is directly linked with cognitive abilities and
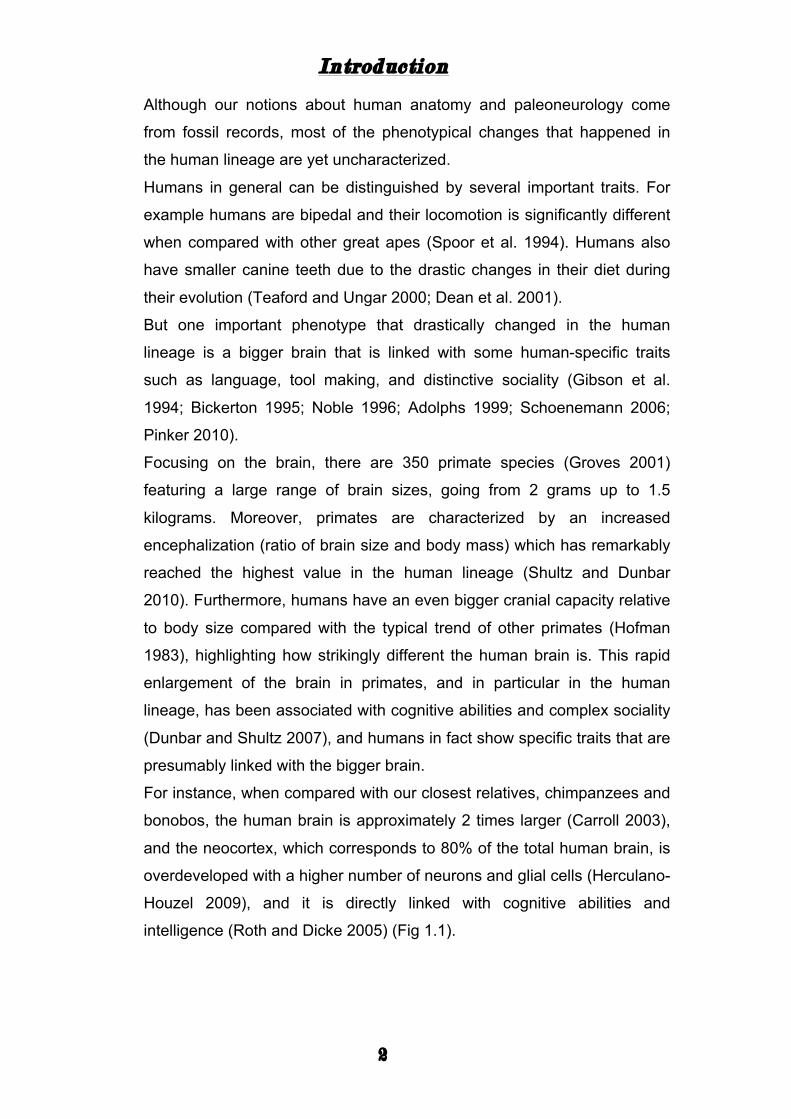
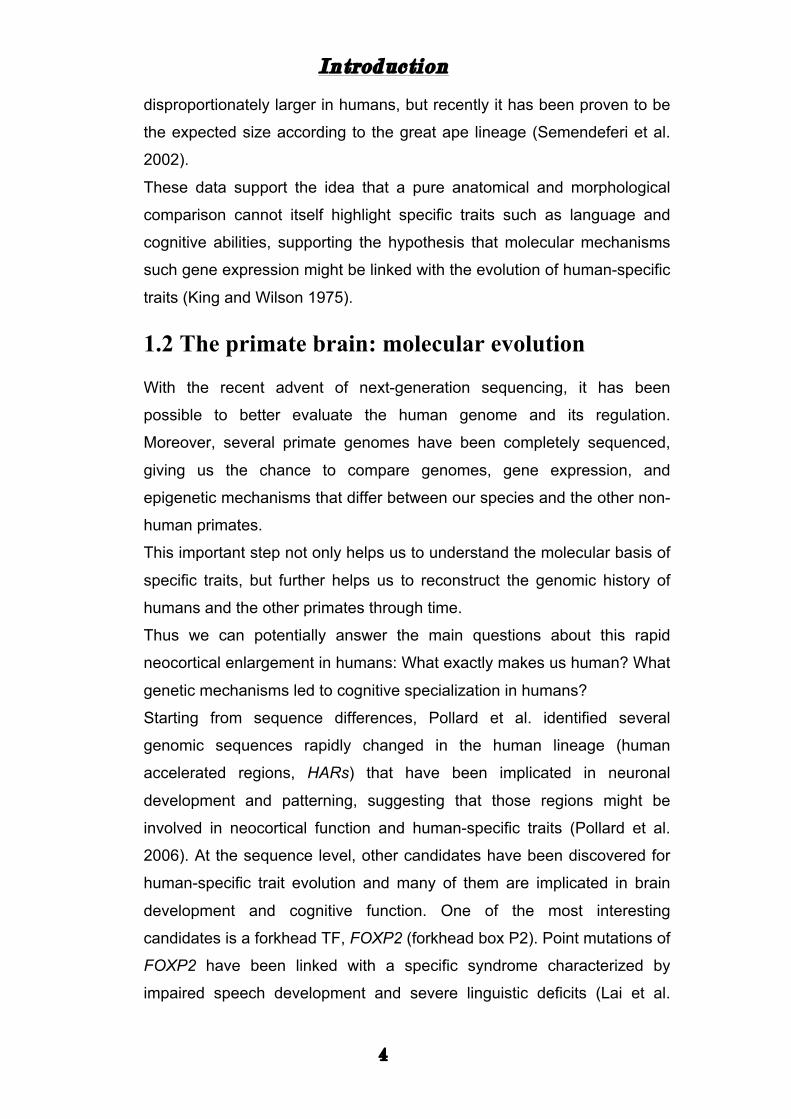
intelligence (Roth and Dicke 2005) (Fig 1.1).
Introduction
3
Figure 1.1: Representation of selected primate brain highlighting differences in volume and cortical topography. Examples: human (Homo sapiens, 1.176 kg), chimpanzee (Pan troglodytes, 273 g), baboon (Papio cynocephalus, 151 g), mandrill (Mandrillus sphinx, 123 g), macaque (Macaca tonkeana, 110 g). Scale: 5 cm. Figure adjusted (DeFelipe 2011).
Moreover, the primate cortex has shown a higher specialization, with
“areas” that have specific functions and are linked with specific behavioral
traits or capabilities. This is common in primates and recent efforts have
been made to compare these areas between humans and other non-
human primates. For instance, Orban et al. compared homologous visual
areas between human and rhesus macaque and showed that some areas
are similar while others are human specific, suggesting again a functional
evolution of cortical areas in the human lineage (Orban et al. 2004).
Another interesting example derives from neuroimaging comparisons of
primate brains. Rilling et al. analyzed primate brains to highlight regions
that are increased in connectivity in humans, but they also indicate that
some asymmetries thought to be related to human uniqueness, such as
language, are actually present also in other great apes (Rilling et al. 2008;
Rilling 2014).
From recent efforts, it has been possible to associate distinct cognitive
and sensory functions to specific areas of the brain, and in particular the
prefrontal cortex (PFC) seems to be a central region of human-specific
traits such as planning, personality, behavior, sociality, and language. For
several years, the anatomy of the PFC has been thought to be
Introduction
4
disproportionately larger in humans, but recently it has been proven to be
the expected size according to the great ape lineage (Semendeferi et al.
2002).
These data support the idea that a pure anatomical and morphological
comparison cannot itself highlight specific traits such as language and
cognitive abilities, supporting the hypothesis that molecular mechanisms
such gene expression might be linked with the evolution of human-specific
traits (King and Wilson 1975).
1.2 The primate brain: molecular evolution
With the recent advent of next-generation sequencing, it has been
possible to better evaluate the human genome and its regulation.
Moreover, several primate genomes have been completely sequenced,
giving us the chance to compare genomes, gene expression, and
epigenetic mechanisms that differ between our species and the other non-
human primates.
This important step not only helps us to understand the molecular basis of
specific traits, but further helps us to reconstruct the genomic history of
humans and the other primates through time.
Thus we can potentially answer the main questions about this rapid
neocortical enlargement in humans: What exactly makes us human? What
genetic mechanisms led to cognitive specialization in humans?
Starting from sequence differences, Pollard et al. identified several
genomic sequences rapidly changed in the human lineage (human
accelerated regions, HARs) that have been implicated in neuronal
development and patterning, suggesting that those regions might be
involved in neocortical function and human-specific traits (Pollard et al.
2006). At the sequence level, other candidates have been discovered for
human-specific trait evolution and many of them are implicated in brain
development and cognitive function. One of the most interesting
candidates is a forkhead TF, FOXP2 (forkhead box P2). Point mutations of
FOXP2 have been linked with a specific syndrome characterized by
impaired speech development and severe linguistic deficits (Lai et al.

Introduction
5
2001; Fisher and Scharff 2009), linking this gene with one of the most
human specific traits: language. Further analysis of FOXP2 has found that
not only is it involved in speech and language, but it is also positively
selected in the human lineage (Enard et al. 2002b; Krause et al. 2007)
(Fig 1.2), and it is important for central nervous system development and
disorders (Spiteri et al. 2007; Konopka et al. 2009; Bowers and Konopka
2012).
Figure 1.2: Silent and replacement nucleotide substitutions mapped on a phylogeny of primates. Bars represent nucleotide changes. Golden bars indicate amino-acid changes (Enard et al. 2002b).
In addition, recent studies have highlighted microcephaly genes that are
linked not only with autosomal recessive microcephaly but also with
human selection (Ponting and Jackson 2005; Thornton and Woods 2009).
In fact, microcephaly genes such as ASPM, MCPH1, CDK5RAP2, and
CENPJ seem to be under accelerated rates of evolution (Zhang 2003;
Mekel-Bobrov et al. 2005; Evans et al. 2006; Rimol et al. 2010;
Montgomery and Mundy 2012), affirming those genes as candidates for
the genetics of human brain evolution and setting the basis for specific
cognitive traits.
Imprinted genes are other recent candidates that have been considered
important for brain development, human behavior, and
neurodevelopmental disorders.
For instance, ZIM2, ZIM3, ZNF264, and KLF14 have been under
accelerated evolution in the human lineage (Kim et al. 2001; Parker-
Katiraee et al. 2007), suggesting again that some genes might have
Introduction
6
specific functions in humans. Other imprinted genes such as GRB10 and
NESP have been implicated in adult behavior and social interactions (Dent
and Isles 2014; Davies et al. 2015) and others such as UBE3A and
SNORD116 have been implicated in neurodevelopmental syndromes such
as Angelman/Prader-Willi syndrome (Wilkinson et al. 2007), suggesting
that imprinted genes might be important factor for human brain
specialization and evolution.
Even though DNA changes are fundamental for downstream changes, the
human genome differs only by 1-2% compared with the chimpanzee
genome and this slight nucleotide sequence difference cannot describe
completely such drastic phenotypical specialization.
Evolutionary biology has argued that major phenotypic changes between
humans and chimpanzees involve gene expression differences. To test
this hypothesis, microarray and RNA-seq studies have been applied to
different primate tissues to identify genes that are drastically changed in
expression. Firstly, a rate of gene expression acceleration has been
found in human-specific brain regions compared with other non-human
primates in multiple studies (Enard et al. 2002a; Khaitovich et al. 2006;
Somel et al. 2009; Somel et al. 2011) suggesting that humans have
evolved a specific gene expression pattern.
Moreover, it has been found that this acceleration signal is more
substantial in the PFC, which is related to cognitive function and several
human-specific disorders such as autism spectrum disorder (ASD) and
schizophrenia.
However, those results have been recently challenged due to the technical
issues of such technologies. For instance, microarrays are usually
designed for model species, such as human or mouse. This leads to
technical artifacts if hybridization is performed between human
microarrays and for instance chimpanzee mRNA. Moreover, those studies
were based on post-mortem brain tissues that can lead to mRNA
degradation, different cell types and different cell-type ratios.
In fact, it is well-known that the glia/neuron ratio in human PFC is higher
compared with chimpanzee (Sherwood et al. 2006) and these data
Introduction
7
suggest that expression analyses of such tissue might be affected simply
by the different numbers of specific cells.
Despite technical artifacts and hypotheses that are awaiting future
directions, it is plausible that gene regulatory mechanisms might have
evolved to control such specific gene expression patterns and to shape
human-specific brain structures. Those mechanisms are comprised of
several trans-regulators such as TFs, RNA binding proteins, non-coding
RNAs, epigenetics, and chromatin modifiers, giving us the opportunity to
study not only DNA changes but also the key players that control gene
regulation.
1.3 Transcription factors
Transcriptional regulation is one of the most important processes in the
gene regulatory mechanisms of a cell. In fact, we can include
transcriptional regulation in a multi-layer gene regulation program that
includes chromatin regulation, epigenetic mechanisms, transcriptional
networks, alternative splicing networks, and translational mechanisms.
Focusing on the transcriptional network, transcription is generally
described as the mechanism to convert the genetic information of DNA
into RNA. It involves several proteins that can be grouped into two main
categories: the basal machinery proteins that include RNA polymerase
and general TFs, and the specific machinery proteins that include specific
TFs which regulate the initiation of transcription, activating or repressing
the expression of target genes.
The basal machinery combines the action of RNA polymerases and the
basal TFs. RNA polymerases are involved in the transcription of rRNA
(RNA pol I), mRNA and microRNA (RNA pol II), and tRNA (RNA pol III).
The basal TFs allow the positioning of RNA polymerases onto the
transcription start sites (TSSs) of genes. The mediator complex bridges
the action of specific TFs with the basal machinery complex.
The specific machinery instead involves the specific TFs, which play a role
in activating or repressing the expression of their target genes. The
specific TFs bind specific DNA sequences, such as cis-regulatory

Introduction
8
elements of circa 6-10 nucleotides, in the flank region of their target genes
defined as the promoter region. They affect specifically the expression of
their targets in a tissue-specific manner or in response to particular stimuli,
activating or repressing mRNA levels. They are also involved in chromatin
remodeling, splicing and differential transcript expression.
Figure 1.3: Representation of the transcriptional machinery with basal TFs, RNA polymerases, mediator complex and specific TFs (Boyle lab, web source).
1.4 Gene regulation played by transcription
factors
In past decades gene expression has been one of the most interesting
fields in research. This complex process involves multiple aspects such as
the TF machinery above mentioned, chromatin remodeling, alternative
splicing events, ncRNAs, copy number variants, and translational
mechanisms.
TFs interact with DNA in specific regions called transcription factor binding
sites (TFBS) which are usually 6-10 nucleotides in length.
Recent efforts have been made to clarify where TFs bind. Genome-wide
studies have shown that TFs can bind not only in the promoter region of
Introduction
9
their target genes but also in intronic or exonic regions, suggesting that
TFs might affect expression at multiple levels (Consortium 2004; Wei et al.
2006; Stergachis et al. 2013; Ballester et al. 2014). They can also act
singularly or cooperatively to enhance or reduce gene expression (Hai and
Curran 1991; Li et al. 2004; Gorbacheva et al. 2005).
As mentioned above, gene expression itself might change due to changes
at the cis-regulatory level. There are basic cis-regulatory elements, such
as TATA-box elements, that are necessary for the binding of the basal
TFs and are present in all the TSSs of coding genes. Instead, the specific
cis-regulatory elements are necessary for the specific TFs and are usually
present in the promoter regions.
Some cis-regulatory elements, such as E-Box elements, might be shared
between TFsand therefore specific TFs might have common target genes.
They can be separated into enhancer or silencer elements according to
the activation or repression role of the specific TFs that can bind the
elements. Another type of element usually present near enhancer or
silencer elements is the insulator element. This element plays a role in
gene expression regulation by blocking transcription when specific TFs
are bound here. TF activity can be modulated by various factors. Histone
modifications, such as acetylation or methylation, play an important role in
the accessibility of TFBSs for the specific TFs and co-factors (Villar et al.
2015). DNA methylation is another important TF activity regulator that
converts cytosine into methyl-cytosine, preventing the binding of TFs and
therefore preventing the upstream regulation of specific target genes
(Eden and Cedar 1994; Jones and Takai 2001).
Another important aspect of TFs is their cooperation. In fact, TFs are
known to interact to regulate the expression pattern of a gene. To do so,
TFBSs are usually clustered in modules called cis-regulatory modules.
This allows multiple TFs to activate or repress specific genes based on the
cell or tissue activity. Example of TF interactions are CLOCK and BAML1
complex that modulate circadian rhythms and activity (Gekakis et al. 1998;
Gorbacheva et al. 2005; Ko and Takahashi 2006). Other examples are the
functional interaction between FOXP1/2/4 that are implicated in multiple
Introduction
10
brain specific functions and disorders, such as speech or intellectual
disability (Li et al. 2004; Hamdan et al. 2010; Bacon and Rappold 2012).
In summary, TFs and their activity depend on complex regulatory
networks composed of TFBS affinities, TF interactions, TFBS modules,
DNA methylation, and chromatin states.
1.5 Transcription factors in human
A common way to classify TFs is based on their structural DNA binding
domains. This has been helpful for understanding how TFs can recognize
DNA motifs, what the potential functions of the TFs are, and what their
evolutionary histories are.
A recent overview of TFs has helped to catalogue them according to what
was previously known and includes a census of human TFs (Matys et al.
2003; Vaquerizas et al. 2009; Chawla et al. 2013).
The TFs are categorized according to their binding domain (TFDBD) as:
• Basic leucin zipper (bZIP)
• Zinc finger (ZNF)
• Homeodomain
• Helix-loop-helix (HLH)
• Other domains (es. Forkhead)
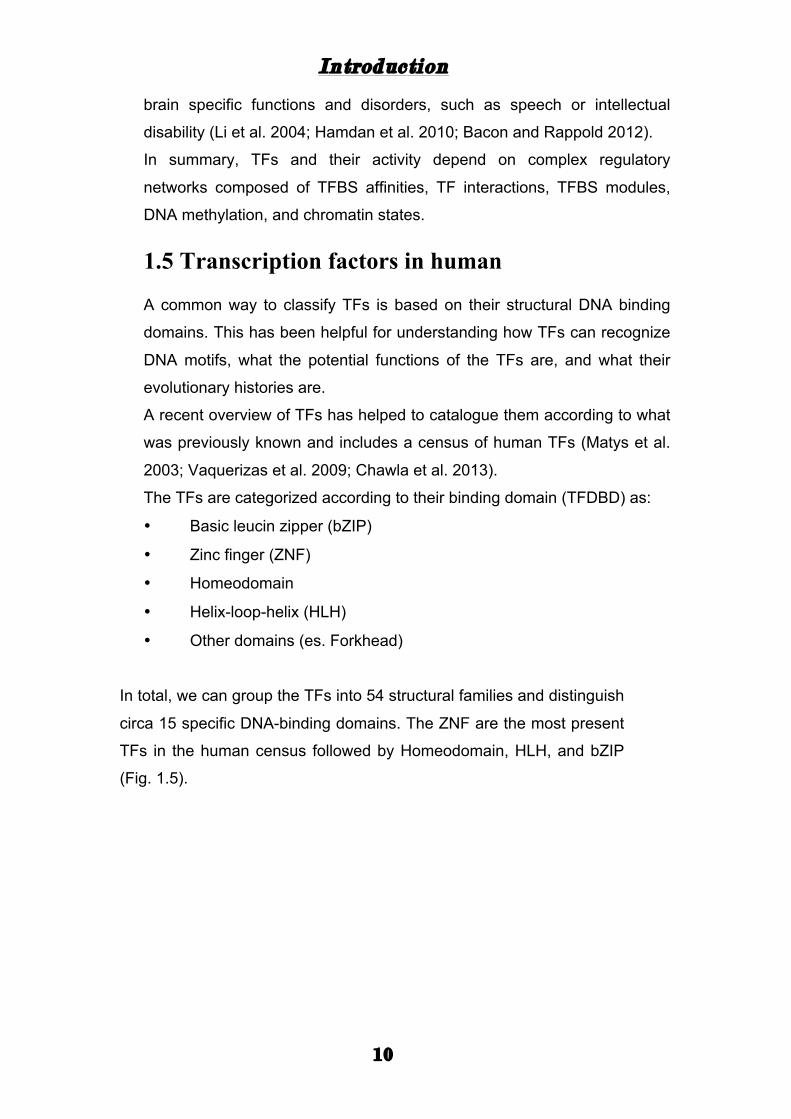
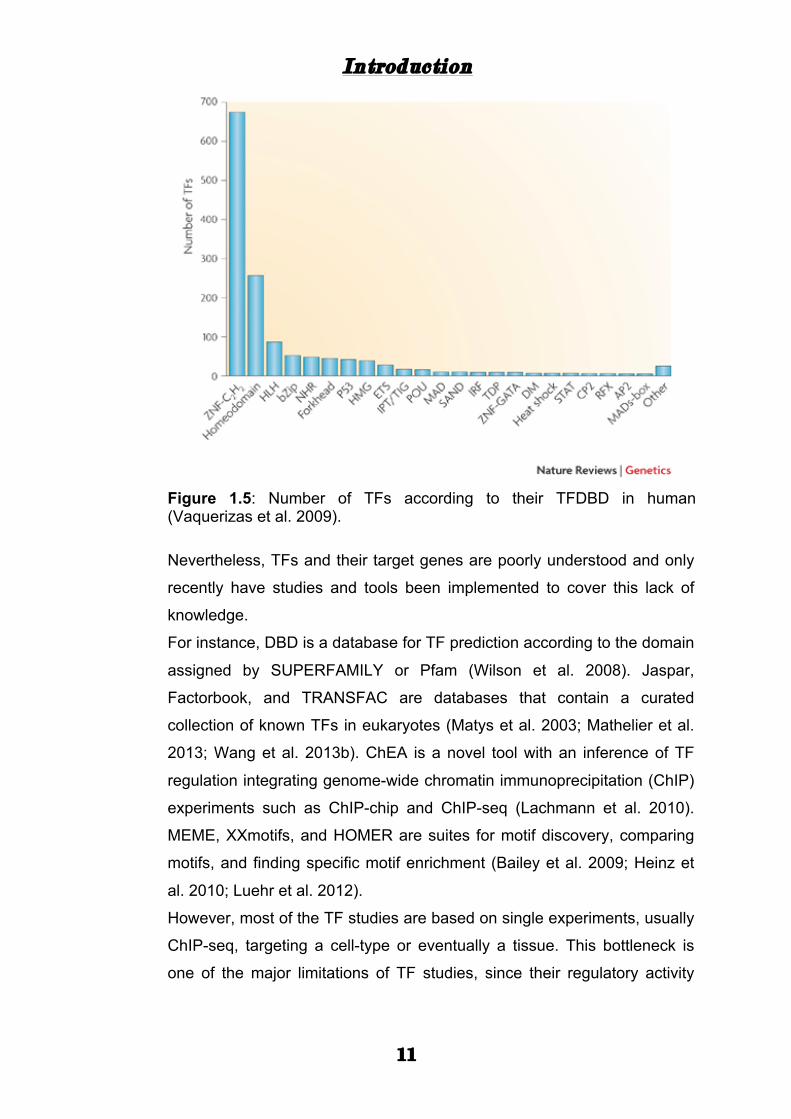
In total, we can group the TFs into 54 structural families and distinguish
circa 15 specific DNA-binding domains. The ZNF are the most present
TFs in the human census followed by Homeodomain, HLH, and bZIP
(Fig. 1.5).
Introduction
11
Figure 1.5: Number of TFs according to their TFDBD in human (Vaquerizas et al. 2009).
Nevertheless, TFs and their target genes are poorly understood and only
recently have studies and tools been implemented to cover this lack of
knowledge.
For instance, DBD is a database for TF prediction according to the domain
assigned by SUPERFAMILY or Pfam (Wilson et al. 2008). Jaspar,
Factorbook, and TRANSFAC are databases that contain a curated
collection of known TFs in eukaryotes (Matys et al. 2003; Mathelier et al.
2013; Wang et al. 2013b). ChEA is a novel tool with an inference of TF
regulation integrating genome-wide chromatin immunoprecipitation (ChIP)
experiments such as ChIP-chip and ChIP-seq (Lachmann et al. 2010).
MEME, XXmotifs, and HOMER are suites for motif discovery, comparing
motifs, and finding specific motif enrichment (Bailey et al. 2009; Heinz et
al. 2010; Luehr et al. 2012).
However, most of the TF studies are based on single experiments, usually
ChIP-seq, targeting a cell-type or eventually a tissue. This bottleneck is
one of the major limitations of TF studies, since their regulatory activity
Introduction
12
depends on different cell states, such as chromatin architecture or
epigenetic mechanisms, which can drastically alter the TF circuitry.
Moreover, we still lack understanding of the complete picture of the TF
circuitries that regulate development, evolution, and disorders of specific
tissues.
Therefore studies at the gene regulatory network level are necessary to
fully understand and predict such TF circuitries in different tissues and
how they might be implicated in the evolution of specific tissues or skills.
A network approach that has been recently developed is the co-
expression network which uses expression correlations to infer common
pathways or potential TF target genes.
1.6 Transcription factors and brain development
Due to the key role of the TFs in the human brain regulatory mechanisms,
we can rephrase the main question in the previous chapter as: “Which TFs
make us human?”
To this end, recent efforts have been directed to understand the complex
mechanisms that regulate brain development and also the associated
functions. In fact, the brain, especially the neocortex, plays a central role
in cognition, sensory and associative functions, and motor activities.
However many of the molecular mechanisms that control those functions
and structures remain undiscovered.
The transcriptional circuitry has been highlighted as the core of the gene
regulatory mechanisms that might be implicated in shaping and controlling
brain function and development (Somel et al. 2014; Nord et al. 2015).
High-throughput sequencing methods such as ChIP-seq and RNA-seq
and animal models such as tissue-specific knock-out mice have helped
researchers uncover and functionally characterize several TFs in a cell- or
tissue-specific way.
For instance, the MEF2 family (A-D) has been widely characterized on a
brain-function level, with high expression during brain development (Leifer
et al. 1994; Flavell et al. 2008; Lyons et al. 2012). MEF2 proteins have
been implicated in several neuronal functions such as differentiation,
Introduction
13
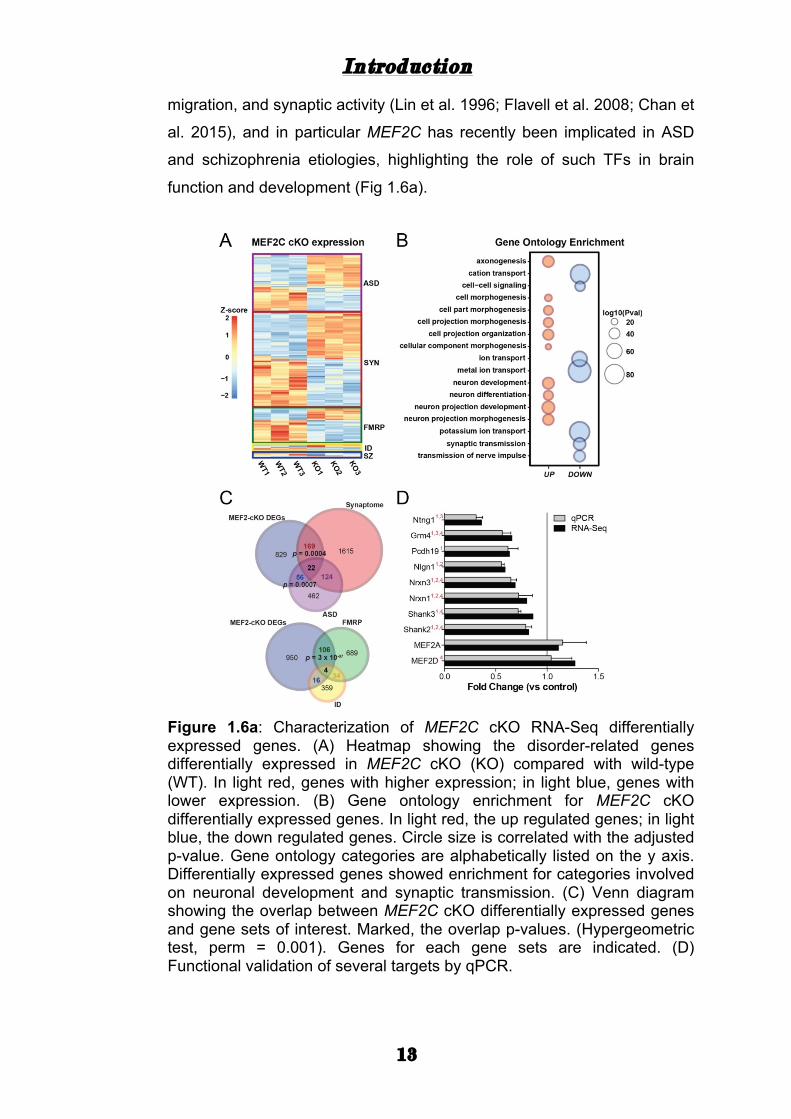
migration, and synaptic activity (Lin et al. 1996; Flavell et al. 2008; Chan et
al. 2015), and in particular MEF2C has recently been implicated in ASD
and schizophrenia etiologies, highlighting the role of such TFs in brain
function and development (Fig 1.6a).
Figure 1.6a: Characterization of MEF2C cKO RNA-Seq differentially expressed genes. (A) Heatmap showing the disorder-related genes differentially expressed in MEF2C cKO (KO) compared with wild-type (WT). In light red, genes with higher expression; in light blue, genes with lower expression. (B) Gene ontology enrichment for MEF2C cKO differentially expressed genes. In light red, the up regulated genes; in light blue, the down regulated genes. Circle size is correlated with the adjusted p-value. Gene ontology categories are alphabetically listed on the y axis. Differentially expressed genes showed enrichment for categories involved on neuronal development and synaptic transmission. (C) Venn diagram showing the overlap between MEF2C cKO differentially expressed genes and gene sets of interest. Marked, the overlap p-values. (Hypergeometric test, perm = 0.001). Genes for each gene sets are indicated. (D) Functional validation of several targets by qPCR.
Introduction
14
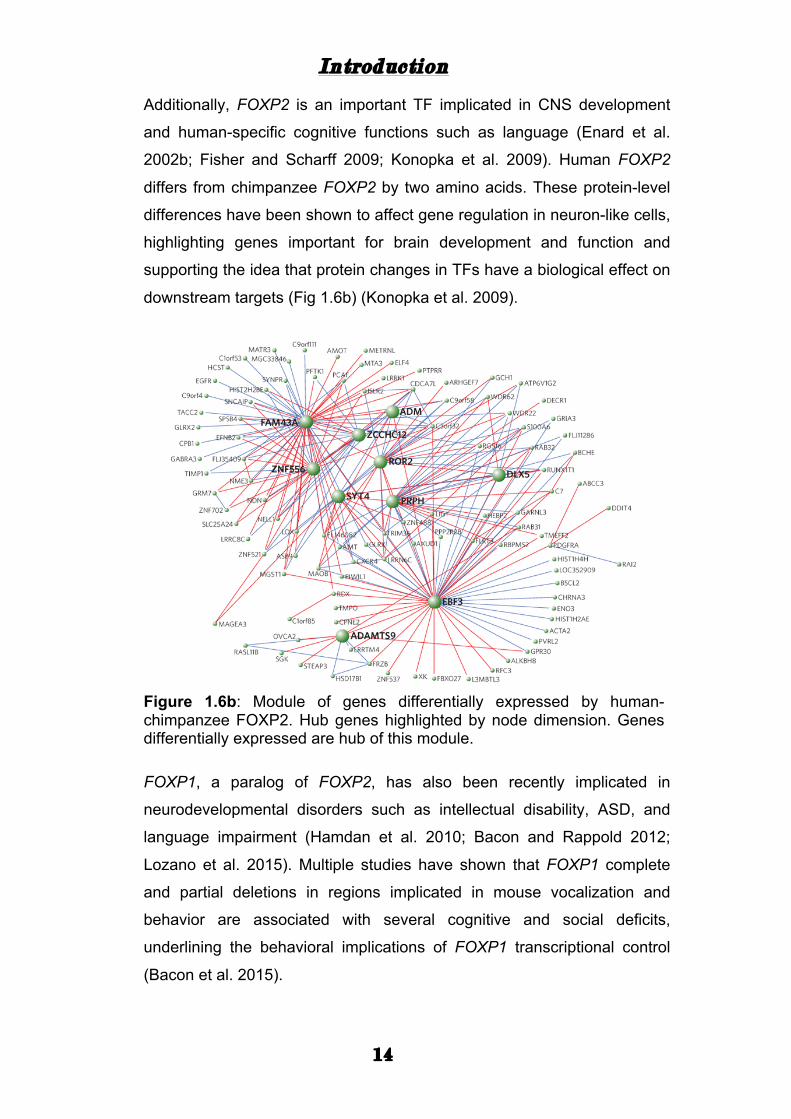
Additionally, FOXP2 is an important TF implicated in CNS development
and human-specific cognitive functions such as language (Enard et al.
2002b; Fisher and Scharff 2009; Konopka et al. 2009). Human FOXP2
differs from chimpanzee FOXP2 by two amino acids. These protein-level
differences have been shown to affect gene regulation in neuron-like cells,
highlighting genes important for brain development and function and
supporting the idea that protein changes in TFs have a biological effect on
downstream targets (Fig 1.6b) (Konopka et al. 2009).
Figure 1.6b: Module of genes differentially expressed by human-chimpanzee FOXP2. Hub genes highlighted by node dimension. Genes differentially expressed are hub of this module.
FOXP1, a paralog of FOXP2, has also been recently implicated in
neurodevelopmental disorders such as intellectual disability, ASD, and
language impairment (Hamdan et al. 2010; Bacon and Rappold 2012;
Lozano et al. 2015). Multiple studies have shown that FOXP1 complete
and partial deletions in regions implicated in mouse vocalization and
behavior are associated with several cognitive and social deficits,
underlining the behavioral implications of FOXP1 transcriptional control
(Bacon et al. 2015).
Introduction
15
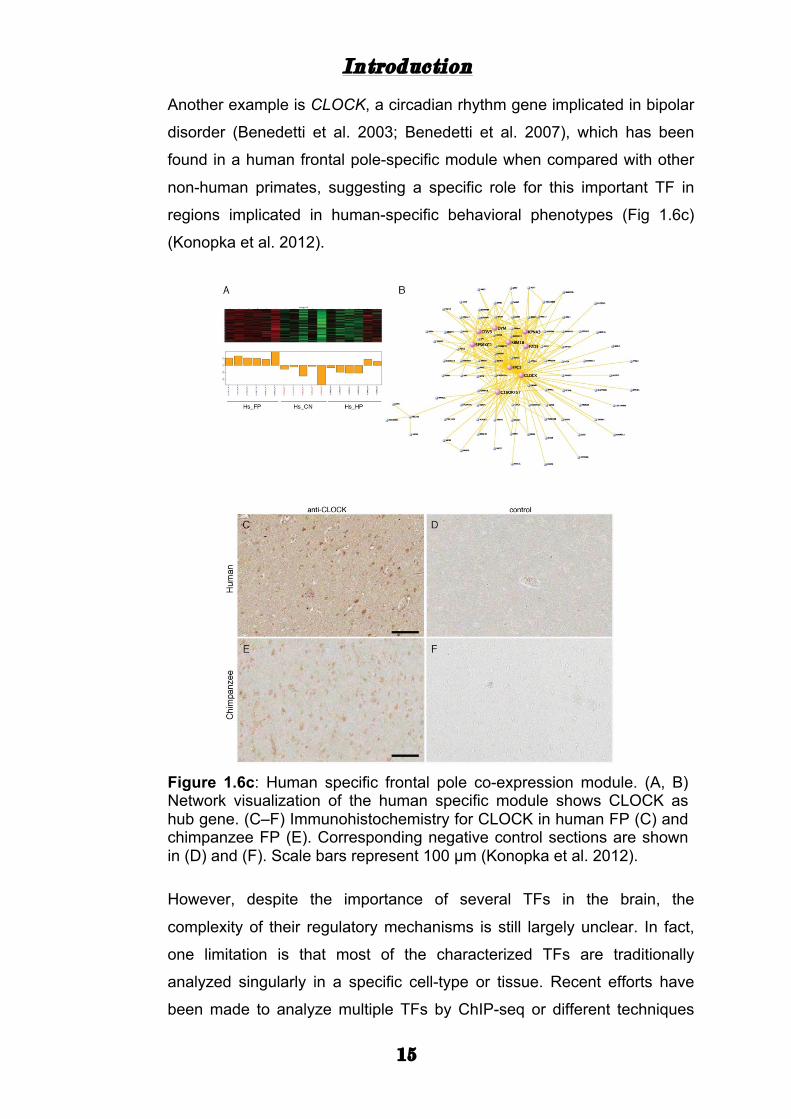
Another example is CLOCK, a circadian rhythm gene implicated in bipolar
disorder (Benedetti et al. 2003; Benedetti et al. 2007), which has been
found in a human frontal pole-specific module when compared with other
non-human primates, suggesting a specific role for this important TF in
regions implicated in human-specific behavioral phenotypes (Fig 1.6c)
(Konopka et al. 2012).
Figure 1.6c: Human specific frontal pole co-expression module. (A, B) Network visualization of the human specific module shows CLOCK as hub gene. (C–F) Immunohistochemistry for CLOCK in human FP (C) and chimpanzee FP (E). Corresponding negative control sections are shown in (D) and (F). Scale bars represent 100 µm (Konopka et al. 2012).
However, despite the importance of several TFs in the brain, the
complexity of their regulatory mechanisms is still largely unclear. In fact,
one limitation is that most of the characterized TFs are traditionally
analyzed singularly in a specific cell-type or tissue. Recent efforts have
been made to analyze multiple TFs by ChIP-seq or different techniques
Introduction
16
deriving transcriptional regulatory networks from a small number of
different TFs (Schmidt et al. 2010; Jolma et al. 2013; Ballester et al. 2014)
and inferring the regulatory interactions using the TF binding sites or their
expression (Shalgi et al. 2007; Nowick et al. 2009; Neph et al. 2012).
Nevertheless, understanding the TF regulatory networks in specific cell-
types or tissues is still in its infancy.
1.7 Transcription factors and networks
With the advent of transcriptomic methods, it has been possible to
uncover molecular systems and gene regulatory networks on a large
scale. Moreover, it has been possible to relate such system-level methods
to development, behavior, health, and disorders such as ASD, intellectual
disability or schizophrenia.
Network helps us to visualize the cellular or tissue gene expression state
on a higher biological level. In such systems, the nodes correspond to
genes of interest while the edges correspond to the relationships between
them. Importantly, edges might be defined as physical interactions (PPi
network), inferred by probability (Bayesian network), or inferred by co-
expression and weights (co-expression network and weighted co-
expression network).
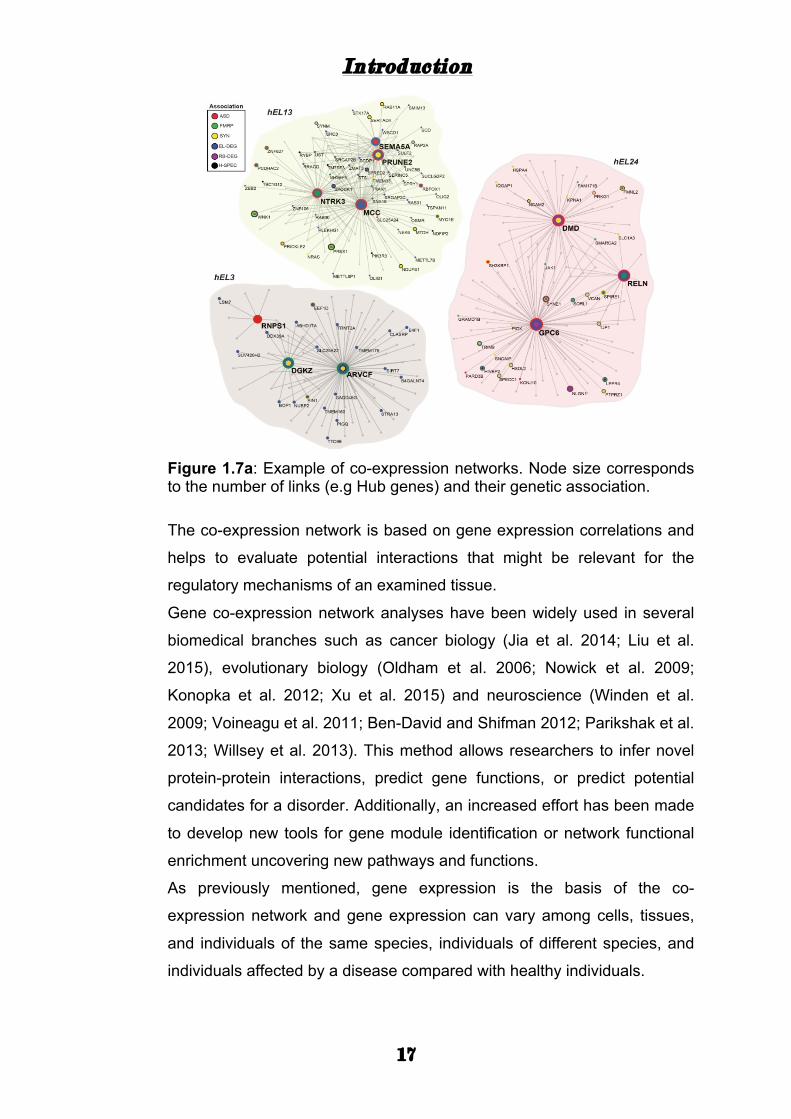
In particular, the co-expression network is one of the network approaches
that enable the combination of genome-wide expression profiles into a
system-level gene expression organization (Figure 1.7a).
Introduction
17
Figure 1.7a: Example of co-expression networks. Node size corresponds to the number of links (e.g Hub genes) and their genetic association.
The co-expression network is based on gene expression correlations and
helps to evaluate potential interactions that might be relevant for the
regulatory mechanisms of an examined tissue.
Gene co-expression network analyses have been widely used in several
biomedical branches such as cancer biology (Jia et al. 2014; Liu et al.
2015), evolutionary biology (Oldham et al. 2006; Nowick et al. 2009;
Konopka et al. 2012; Xu et al. 2015) and neuroscience (Winden et al.
2009; Voineagu et al. 2011; Ben-David and Shifman 2012; Parikshak et al.
2013; Willsey et al. 2013). This method allows researchers to infer novel
protein-protein interactions, predict gene functions, or predict potential
candidates for a disorder. Additionally, an increased effort has been made
to develop new tools for gene module identification or network functional
enrichment uncovering new pathways and functions.
As previously mentioned, gene expression is the basis of the co-
expression network and gene expression can vary among cells, tissues,
and individuals of the same species, individuals of different species, and
individuals affected by a disease compared with healthy individuals.
Introduction
18
Therefore gene expression correlations can drastically change between
different conditions and might reflect a disruption at the regulatory system
level that might be potentially linked with the analyzed case.
The correlation can vary between Pearson correlation coefficient,
Spearman rho coefficient, Kendall’s tau correlation, or biweight
midcorrelation. These parameters defined the interactions according to the
expression between two or multiple genes. However, single gene to gene
correlation might contain several false positives, decreasing the quality of
the interpretation assessment. To avoid the effect of false positive
interactions, an additional method has been developed to increase the
strength of the co-expression approach.
The weighted co-expression method described the correlation patters
among two or multiple genes. In such networks, the nodes represent
genes whereas the links represent the weight calculated using the
correlation of the overlapped genes.
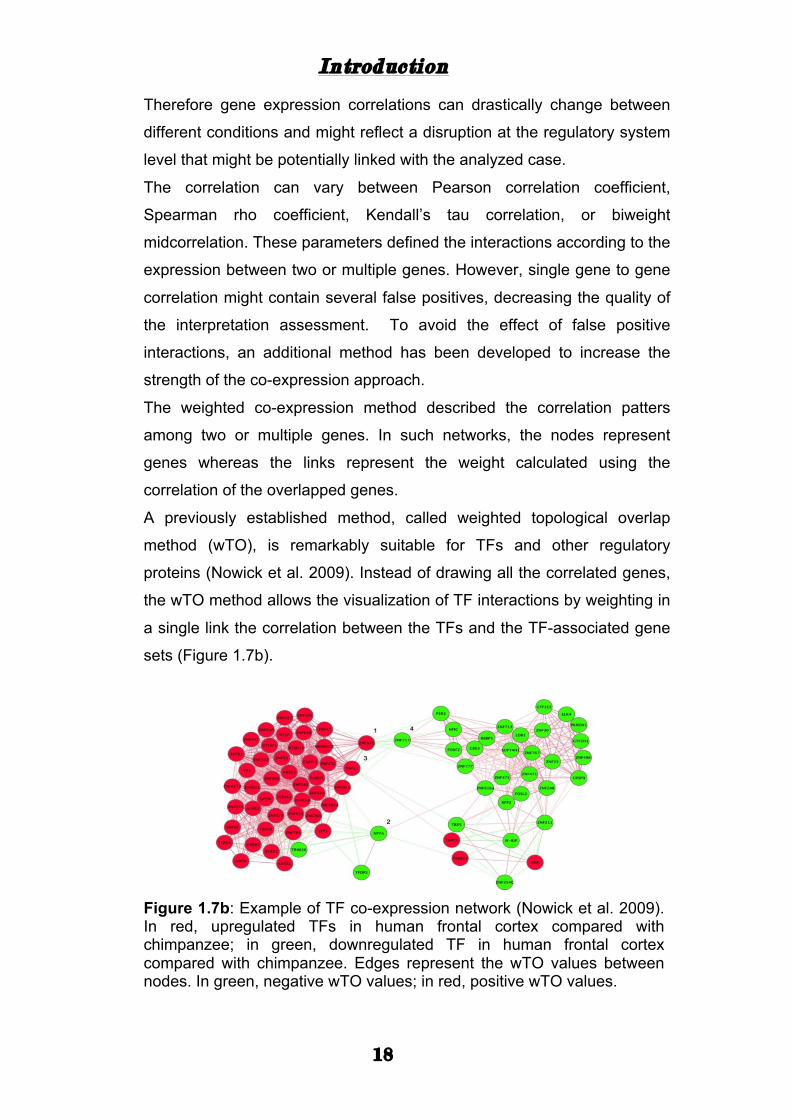
A previously established method, called weighted topological overlap
method (wTO), is remarkably suitable for TFs and other regulatory
proteins (Nowick et al. 2009). Instead of drawing all the correlated genes,
the wTO method allows the visualization of TF interactions by weighting in
a single link the correlation between the TFs and the TF-associated gene
sets (Figure 1.7b).
Figure 1.7b: Example of TF co-expression network (Nowick et al. 2009). In red, upregulated TFs in human frontal cortex compared with chimpanzee; in green, downregulated TF in human frontal cortex compared with chimpanzee. Edges represent the wTO values between nodes. In green, negative wTO values; in red, positive wTO values.
Introduction
19
Furthermore the wTO method uses the Spearman rank correlation, which
is suitable for expression analysis, and the weight is based on both
positive or negative correlation. In fact TFs can act as activators or
repressors of gene expression and therefore the correlation might reflect
the biological function of a TF. A gene that is negatively correlated with a
TF reflects an opposite expression trend and thus the TF might be a
potential repressor of this gene. On the other hand, a gene that is
positively correlated with a TF reflects a similar expression trend and thus
the TF might be a potential activator of this gene.
As previously suggested, this method focuses on TFs and their potential
target genes, mining the potential pathways in which the TFs might be
involved. Remarkably, the wTO method is the most suitable approach to
infer potential TF relationships at a system level using genome-wide
expression profile.
20
CHAPTERS How TFs regulate the expression of multiple genes at the tissue or cell
level is largely unexplored. Moreover, even less is understood about gene
regulation when comparing different species, such as human and non-
human primates.
TFs have a central position in gene regulatory networks due to their key
role in the regulation of gene expression and it seems plausible that TFs
are also important for brain function and related neurodevelopmental or
neuropsychiatric disorders.
This thesis is organized in three major chapters spanning from the
evolution to the functional characterization of a specific TF:
The first chapter describes a co-expression approach to understanding
how a TF co-expression network evolves. In particular, we analyzed
genome-wide expression profiles of the frontal cortex from different
primate species including human, chimpanzee, and rhesus macaque
spanning circa 35 million years of evolution. We first examined potential
candidate TFs with differential expression and we next applied a novel
network approach based on inter-species and intra-species correlation
filtering, followed by wTO calculation to infer how the network evolved. We
moreover analyzed different tissues highlighting a drastic rewiring of brain
TF networks compared with other tissues such as kidney and muscle.
Taken together, these data emphasize the role of TFs in human-specific
brain evolution, development and function.
The second chapter describes an approach to evaluate multiple genome-
wide expression profiles from human PFC. Due to stochastic gene
expression and technical artifacts, we developed a novel approach to
integrate multiple expression datasets into a consensus network,
highlighting only the conserved edges between TFs. We next manually
collected from different sources TFs with known implications on brain
21
function and disorders, giving us the opportunity to create the first list of
“Brain-TFs”. With this novel method and the census of Brain-TFs, we
identified a strong enrichment of such important TFs in the consensus
network. Moreover, we also identified by connectivity novel and well-
characterized TFs (i.e. hub genes) that might be drastically important for
the regulation of gene expression in human frontal cortex, a brain region
implicated in cognitive function and disorders.
The third chapter describes a functional characterization and evolution of
the TF ZEB2 by ChIP-seq and RNA-seq in different great-apes species.
ZEB2 is an important hub gene in a TF co-expression network specifically
upregulated in human PFC compared with chimpanzee PFC.
Furthermore, mutations in the ZEB2 protein have been linked with Mowat-
Wilson syndrome, a severe disorder characterized by intellectual disability
and acute microcephaly, suggesting ZEB2 as an important candidate for
human-specific cognitive functions. However, little is known about the
targets and the species-specific features of ZEB2. Therefore we aimed to
functionally characterize ZEB2 in different human individuals and
understand whether ZEB2 binding sites have undergone evolutionary
pressure during great-apes evolution.
We used 3 different immortalized lymphoblastoid and fibroblast cell-lines
from each human, chimpanzee, and orangutan spanning circa 16 million
years of great-apes evolution. We performed ChIP-seq and ZEB2
knockdown followed by RNA-seq to evaluate the species-specific
transcriptional control played by ZEB2. We found several species-specific
and shared ZEB2-bound regions. Combined with the analysis of
differential gene expression using RNA-seq after ZEB2 knock-down, we
have been able to functionally characterize ZEB2 in different great-apes
species and highlight the several candidates implicated in brain function
and neurodevelopmental disorders.

22
Chapter 1
23
CHAPTER 1
Species-specific changes in a primate transcription
factor network: insights into the molecular
evolution of the primate prefrontal cortex.
Project summary The human prefrontal cortex (PFC) differs from that of other primates with
respect to size, histology, and functional abilities. Here we discovered
evolutionary changes in a transcription factor (TF) network that may
underlie these phenotypic differences. We determined the co-expression
networks of changed TFs including their potential target genes and
interaction partners in the PFC of humans, chimpanzees, and rhesus
macaques using genome wide expression data. Integrating the networks
of all three species allowed us inferring an ancestral network for all three
species, as well as for humans and chimpanzees. All networks are
enriched for genes involved in forebrain development, axonogenesis, and
synaptic transmission. Interestingly, however, we detected strong network
rewiring during primate evolution, with most links gained on the human
lineage. By comparing the network of the PFC to networks derived from
other tissues, we discovered that the human PFC has the most
evolutionary changes. To pinpoint molecular changes underlying species-
specific phenotypes, we analyzed the sub-networks of TFs derived only
from genes with species-specific expression. These sub-networks differed
significantly in structure and function between the human and chimpanzee.
For example, the human specific sub-network is enriched for TFs
implicated in cognitive disorders and for genes involved synaptic plasticity
and functions. Our results suggest evolutionary changes in TF networks
that might have shaped morphological and functional differences between
primate brains, in particular the PFC.
Chapter 1
24
Introduction Understanding why humans have unique cognitive abilities requires the
identification of morphological and molecular aspects that are unique to
the human brain. Unique morphological features of the human brain
include its larger size (Povinelli and Preuss 1995; Koechlin et al. 2003;
Schoenemann 2006; Enard 2015), its cell type compositions (Sherwood et
al. 2006; Oberheim et al. 2009; Spocter et al. 2012), and specific cortical
architectural structures (Buxhoeveden et al. 2006; Smaers et al. 2011). At
the molecular level, there are several genes with brain functions that have
been shown to evolve under positive selection on the human lineage,
making them prime candidates for having contributed to the evolution of
human specific features; for example ASPM (Zhang 2003; Mekel-Bobrov
et al. 2005; Montgomery and Mundy 2012) and MCPH1 (Ponting and
Jackson 2005; Voight et al. 2006; Pulvers et al. 2015), which determine
brain size, and FOXP2, which when mutated causes severe cognitive and
speech deficits (Enard et al. 2002b; Fisher and Scharff 2009; Konopka et
al. 2009). Moreover, evolutionary young KRAB zinc-fingers (ZNFs) genes
have been shown to be preferentially expressed in the human developing
PFC (Zhang et al. 2009) and to evolve rapidly in sequence and expression
in primates (Looman et al. 2002; Nowick et al. 2009; Nowick et al. 2010;
Nowick et al. 2011), suggesting that this gene family has played an
important role during the evolution of the human brain. In line with these
findings, several studies identified expression differences in the human
compared with the chimpanzee brain that might be linked to human
specific traits (Enard et al. 2002a; Cáceres et al. 2003; Somel et al. 2009;
Babbitt et al. 2010; Liu et al. 2012). Since expression changes are often
controlled by TFs that are enhancing or reducing the expression of target
genes it seems likely that TFs are responsible for driving some of the
expression pattern differences and hence morphological differences
between humans and other primates. Nevertheless, only a limited number
of studies so far has focused on evolutionary changes in TFs or TF
networks in primates (Oldham et al. 2006; Nowick et al. 2009; Schmidt et
al. 2010; Schwalie et al. 2013; Ballester et al. 2014). These studies were
Chapter 1
25
limited in that the network analysis was based on ubiquitously expressed
genes (i.e. not being able to reveal brain specific differences) and only
included human and chimpanzee samples (i.e. not being able to
distinguish between changes on the human or chimpanzee lineage).
Moreover, while progress in uncovering the biological cascades that take
place during mammalian brain development has been made, how the
striking morphological and functional differences of the human brain are
determined is still not well-understood. To gain more insights into the gene
regulatory processes that might underlie human specific brain evolution,
we investigate here how a TF co-expression network evolves in the
primate PFC. To do so, we analyzed genome-wide expression data from
PFC samples of humans, chimpanzees and rhesus macaques to first
determine the genes that are specifically changed in each species. In total,
we identified 645 genes coding for TFs that show lineage-specific
expression, among them 134 known to be involved in brain development,
functions, and/or diseases. We then derived weighted topological overlap
(wTO) networks from the changed TFs and their correlated genes and
compare these networks between the three species to infer the ancestral
network and evolutionary network changes in the human and chimpanzee
lineages. To further evaluate which evolutionary changes might be specific
to the brain, we used genome-wide expression data from multiple tissues.
Remarkably, we identified an increased rewiring in brain tissues compared
to other tissues, with higher TF network connectivity in the human
compared to the chimpanzee brain. We further showed that the network of
the human PFC is enriched for TFs implicated in crucial brain functions
and regulates genes with neuronal functions, projection, and
morphogenesis.
Chapter 1
26
Results
Lineage-specific expression pattern changes
To identify species-specific expression patterns we analyzed RNA-Seq
data (Methods), derived from PFC samples of 5 adult human, chimpanzee,
and rhesus macaque individuals. Genes were defined as species-
specifically “changed” if their difference in expression was significant
(Benjamini-Hochberg adjusted p-value < 0.05 and |log2FC| > 0.3) in one
species compared to the other two species, but not significant between the
other two species (Methods).
Due to its distant evolutionary relationship with great apes, we found the
highest number of specifically changed genes in rhesus macaques.
However, when we normalized the number of specifically expressed genes
for divergence time, we found about equal numbers of changes in all three
lineages, suggesting that overall gene expression changes are similar
between lineages. Among the genes with species-specific expression we
found 645 genes coding for TFs, consisting of 103 human specifically
expressed TFs, 81 chimpanzee specifically expressed TFs, and 462
rhesus macaque specifically expressed TFs, highlighting a significant
enrichment of TFs among differentially expressed genes (8%, p-value =
0.02, Chi Squared Test). Moreover, we validated that a significant
proportion of significantly changed TFs has also changed in an
independent genome-wide expression dataset produced with a different
technique (Somel et al. 2011) (116 total changed TFs, p-value = 1.19x10-
58, hypergeometric test; permutation test, p-value = 0.0001).
To conjecture potential impacts of the species-specific TF expression
changes on species differences in brain functions, we first asked how
many of the changed TFs are known to have a role in the brain. Our
literature review discovered 134 changed TFs that are described to have a
function during brain development or are implicated in a brain disease
(Appendix: Table S1.1).
This represents an enrichment of TFs with known brain functions among
the differentially expressed TFs (hypergeometric test; p-value = 1.21x10-55,
Chapter 1
27
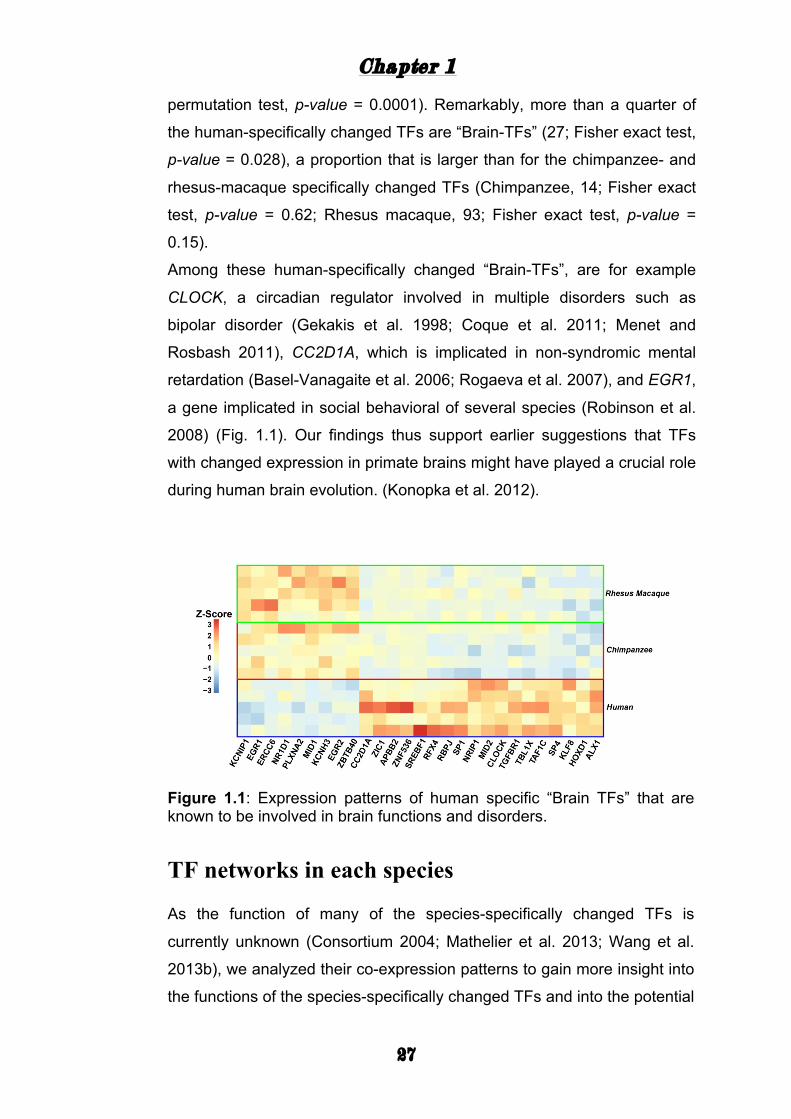
permutation test, p-value = 0.0001). Remarkably, more than a quarter of
the human-specifically changed TFs are “Brain-TFs” (27; Fisher exact test,
p-value = 0.028), a proportion that is larger than for the chimpanzee- and
rhesus-macaque specifically changed TFs (Chimpanzee, 14; Fisher exact
test, p-value = 0.62; Rhesus macaque, 93; Fisher exact test, p-value =
0.15).
Among these human-specifically changed “Brain-TFs”, are for example
CLOCK, a circadian regulator involved in multiple disorders such as
bipolar disorder (Gekakis et al. 1998; Coque et al. 2011; Menet and
Rosbash 2011), CC2D1A, which is implicated in non-syndromic mental
retardation (Basel-Vanagaite et al. 2006; Rogaeva et al. 2007), and EGR1,
a gene implicated in social behavioral of several species (Robinson et al.
2008) (Fig. 1.1). Our findings thus support earlier suggestions that TFs
with changed expression in primate brains might have played a crucial role
during human brain evolution. (Konopka et al. 2012).
Figure 1.1: Expression patterns of human specific “Brain TFs” that are known to be involved in brain functions and disorders.
TF networks in each species
As the function of many of the species-specifically changed TFs is
currently unknown (Consortium 2004; Mathelier et al. 2013; Wang et al.
2013b), we analyzed their co-expression patterns to gain more insight into
the functions of the species-specifically changed TFs and into the potential
Chapter 1
28
phenotypic impact of their expression changes. We reasoned that genes
that are co-expressed with a TF represent potential target genes or
interaction partners of that TF. Further, TFs with similar sets of co-
expressed genes are likely functionally related. We aimed at capturing the
co-expression patterns of the changed TFs and their similarities using a
network approach.
To this end we utilized a third, independently derived, dataset with a high
number of samples to allow for confident co-expression analysis (Liu et al.
2012). We selected from this dataset 12 individuals per each species
matched by sex and age according to their life traits (Methods). For each
of the 645 TF genes we identified the genes with correlated expression
patterns across the individuals of a species (Spearman rank correlation
test, p-value < 0.05). Since TFs can activate or repress the expression of
genes, we calculated positive and negative correlations. To analyze the
overlap in the correlated gene sets between the TFs we calculated the
weighted topological overlap (wTO) using a method we developed
previously that considers both, positive and negative correlations (Nowick
et al. 2009). This allowed us to construct a wTO network for each species
in which the nodes represent the 645 expression changed TFs and the
links the correlations between the TFs including the commonality of the
TFs in their sets of correlated genes. From a biological perspective, TFs
that are linked in the wTO network might cooperatively regulate a
significant set of potential target genes.
Performing permutation tests in which we shuffled for each individual the
expression values of all the genes we demonstrated that the derived wTO
network of each species differs from random expectation independently of
the employed wTO cutoff (supplementary Methods). Since none of the
randomized networks displayed links with |wTO| > 0.3, we applied |wTO| >
0.3 for all further analyses of these human, chimpanzee and rhesus-
macaque PFC networks. Moreover, we found that several of the links we
inferred had been discovered experimentally earlier, such as the
interaction between MEF2C and HIRA (Yang et al. 2011), MEF2C and
HDAC9 (Haberland et al. 2007; Potthoff and Olson 2007), or MYCN and
TRIM24 (Izumi and Kaneko 2014)
Chapter 1
29
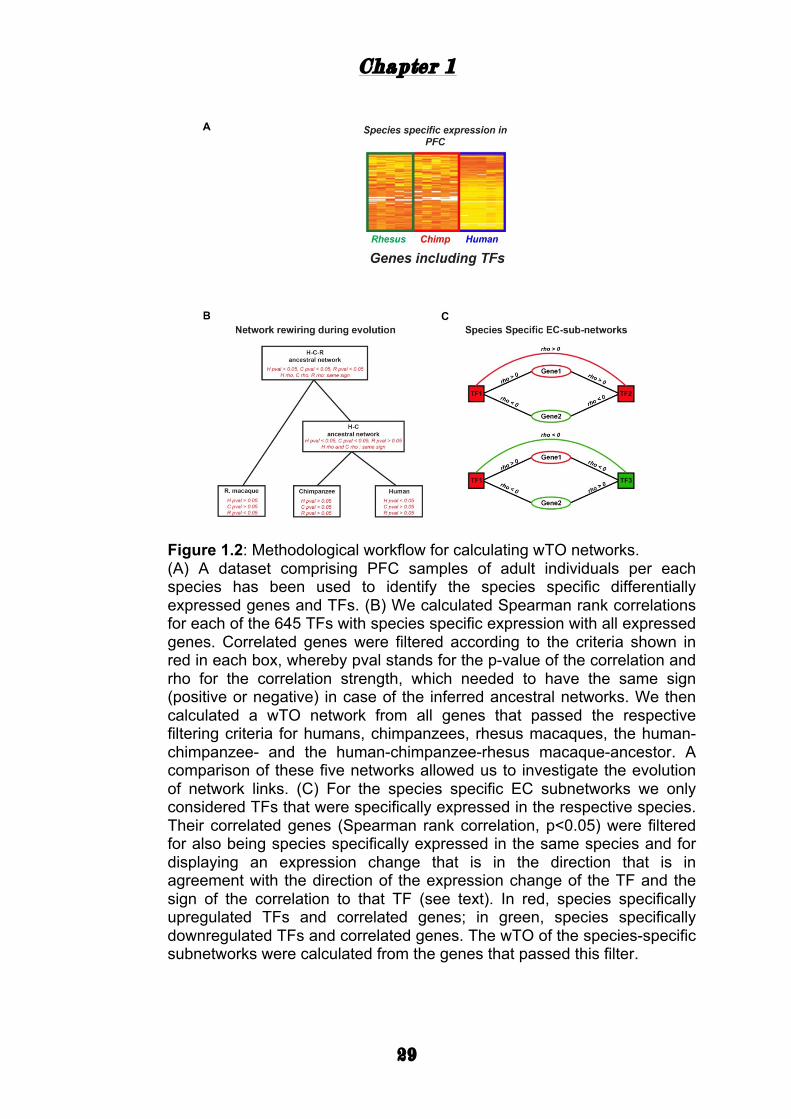
Figure 1.2: Methodological workflow for calculating wTO networks. (A) A dataset comprising PFC samples of adult individuals per each species has been used to identify the species specific differentially expressed genes and TFs. (B) We calculated Spearman rank correlations for each of the 645 TFs with species specific expression with all expressed genes. Correlated genes were filtered according to the criteria shown in red in each box, whereby pval stands for the p-value of the correlation and rho for the correlation strength, which needed to have the same sign (positive or negative) in case of the inferred ancestral networks. We then calculated a wTO network from all genes that passed the respective filtering criteria for humans, chimpanzees, rhesus macaques, the human-chimpanzee- and the human-chimpanzee-rhesus macaque-ancestor. A comparison of these five networks allowed us to investigate the evolution of network links. (C) For the species specific EC subnetworks we only considered TFs that were specifically expressed in the respective species. Their correlated genes (Spearman rank correlation, p<0.05) were filtered for also being species specifically expressed in the same species and for displaying an expression change that is in the direction that is in agreement with the direction of the expression change of the TF and the sign of the correlation to that TF (see text). In red, species specifically upregulated TFs and correlated genes; in green, species specifically downregulated TFs and correlated genes. The wTO of the species-specific subnetworks were calculated from the genes that passed this filter.
Chapter 1
30
Network evolution
To examine how the TF network has evolved, we inferred which links were
likely to have been present already in the human-chimpanzee (HC) and
the human-chimpanzee-rhesus macaque (HCR) ancestor (Fig. 1.2). Using
the rhesus macaque as outgroup, we further determined the network links
that are likely specific to either the human or chimpanzee network.
Strikingly, comparing the ancestral and the species-specific networks,
considerable rewiring is visible. While all three species share only 531
links (the inferred HCR ancestor) and humans and chimpanzees share
only 239 links (the inferred network of HC ancestor), the human network
contains 2238 links that are human specific. Also the chimpanzee and
rhesus macaque have many species-specific links, namely 1113 and 389
links, respectively. To confirm that these stark species differences are not
driven by a few individuals, we performed a “leave-one-out” test
(Methods). All 12 networks per species derived this way clustered
according to species, demonstrating that the observed network divergence
is robust (Appendix: Fig. S1.1).
The human network has significantly higher connectivity (number of links
per nodes; c = 13.2; |wTO| > 0.4) than the chimpanzee network (c = 8.1,
|wTO| > 0.4; Wilcoxon test, p-value = 2.47x10⁻¹⁰) and the rhesus macaque
network (c = 3.9, |wTO| > 0.4; Wilcoxon test, p-value = 2.2x10⁻¹⁶). Taken
together, this indicates that the network complexity increased on the
human lineage. Our data allows us to incrementally follow how the
network architecture has been rewired during evolution. For example,
BBX, is a TF that has many links in the two ancestor and in all three
species specific networks. Fifty three of its links are present in the
ancestor of all three species. In addition to these links, BBX gained 3-11
links on the particular lineages (Fig. 1.4 A). CC2D1A on the other hand,
does not have any links that are conserved between all three species.
Remarkably CC2D1A gained 91 links gained on the human lineage (Fig.
1.4 B). This is fascinating given that CC2D1A is a conserved TF which is,
as mentioned above, associated with intellectual disability in humans
(Basel-Vanagaite et al. 2006; Rogaeva et al. 2007; Zhao 2010).
Chapter 1
31
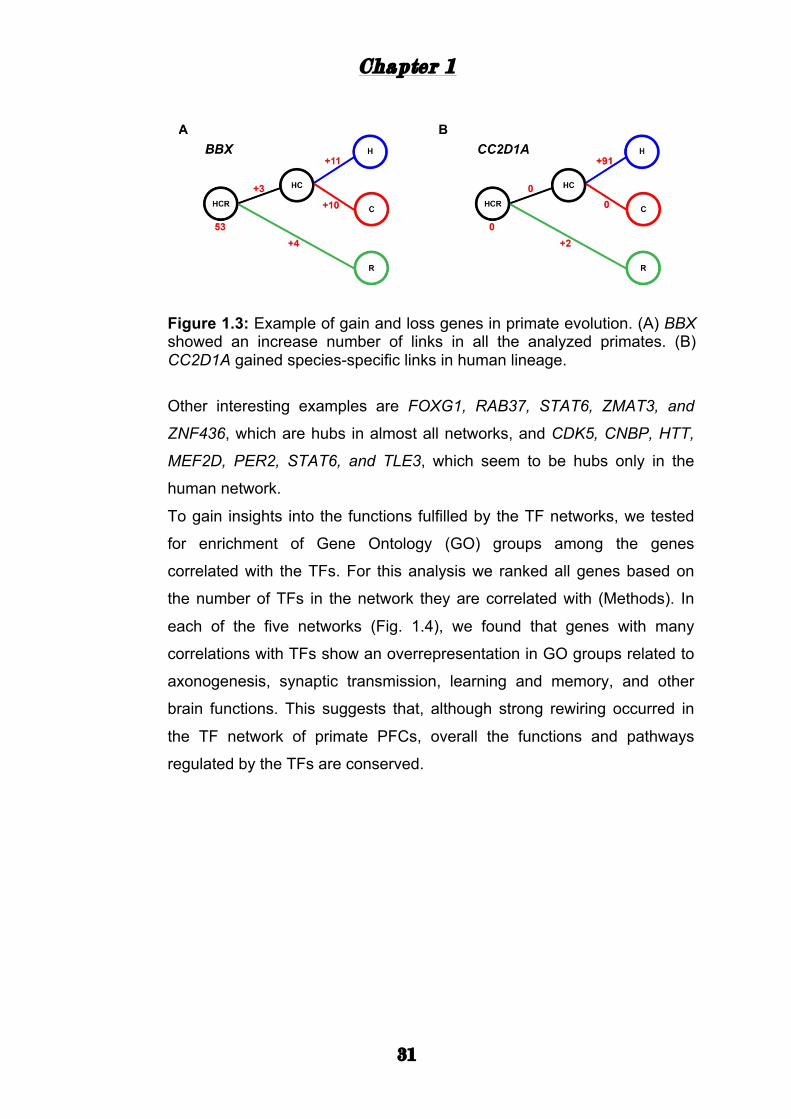
Figure 1.3: Example of gain and loss genes in primate evolution. (A) BBX showed an increase number of links in all the analyzed primates. (B) CC2D1A gained species-specific links in human lineage.
Other interesting examples are FOXG1, RAB37, STAT6, ZMAT3, and
ZNF436, which are hubs in almost all networks, and CDK5, CNBP, HTT,
MEF2D, PER2, STAT6, and TLE3, which seem to be hubs only in the
human network.
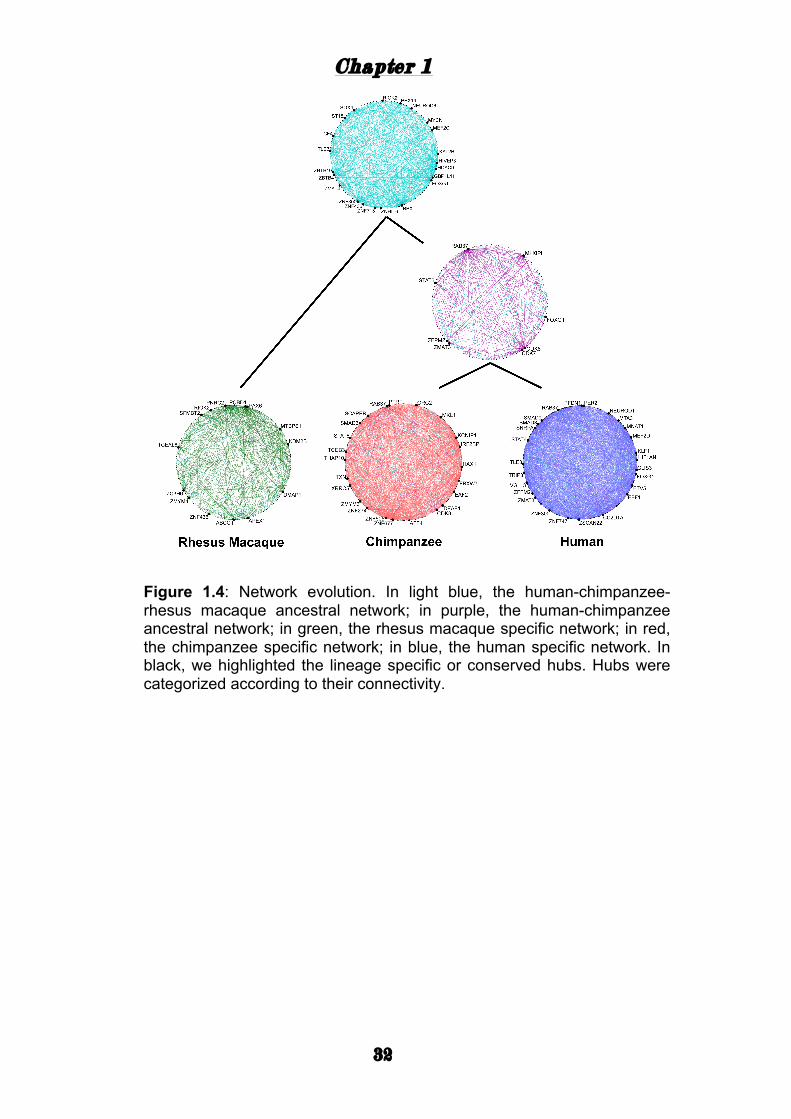
To gain insights into the functions fulfilled by the TF networks, we tested
for enrichment of Gene Ontology (GO) groups among the genes
correlated with the TFs. For this analysis we ranked all genes based on
the number of TFs in the network they are correlated with (Methods). In
each of the five networks (Fig. 1.4), we found that genes with many
correlations with TFs show an overrepresentation in GO groups related to
axonogenesis, synaptic transmission, learning and memory, and other
brain functions. This suggests that, although strong rewiring occurred in
the TF network of primate PFCs, overall the functions and pathways
regulated by the TFs are conserved.
Chapter 1
32
Figure 1.4: Network evolution. In light blue, the human-chimpanzee-rhesus macaque ancestral network; in purple, the human-chimpanzee ancestral network; in green, the rhesus macaque specific network; in red, the chimpanzee specific network; in blue, the human specific network. In black, we highlighted the lineage specific or conserved hubs. Hubs were categorized according to their connectivity.
Chapter 1
33
Species differences in the networks of other tissues
Given the strong rewiring we observed in the life-span PFC, we asked
whether similar extents of rewiring exist also in the adult PFC, in other
brain areas, and in other tissues. We thus built wTO networks for multiple
tissues utilizing samples from adult individuals (Bozek et al. 2015). When
comparing network similarities across species and tissues, there seems to
be a trend for a clustering according to tissues, with a slight separation
between brain and non-brain tissues.
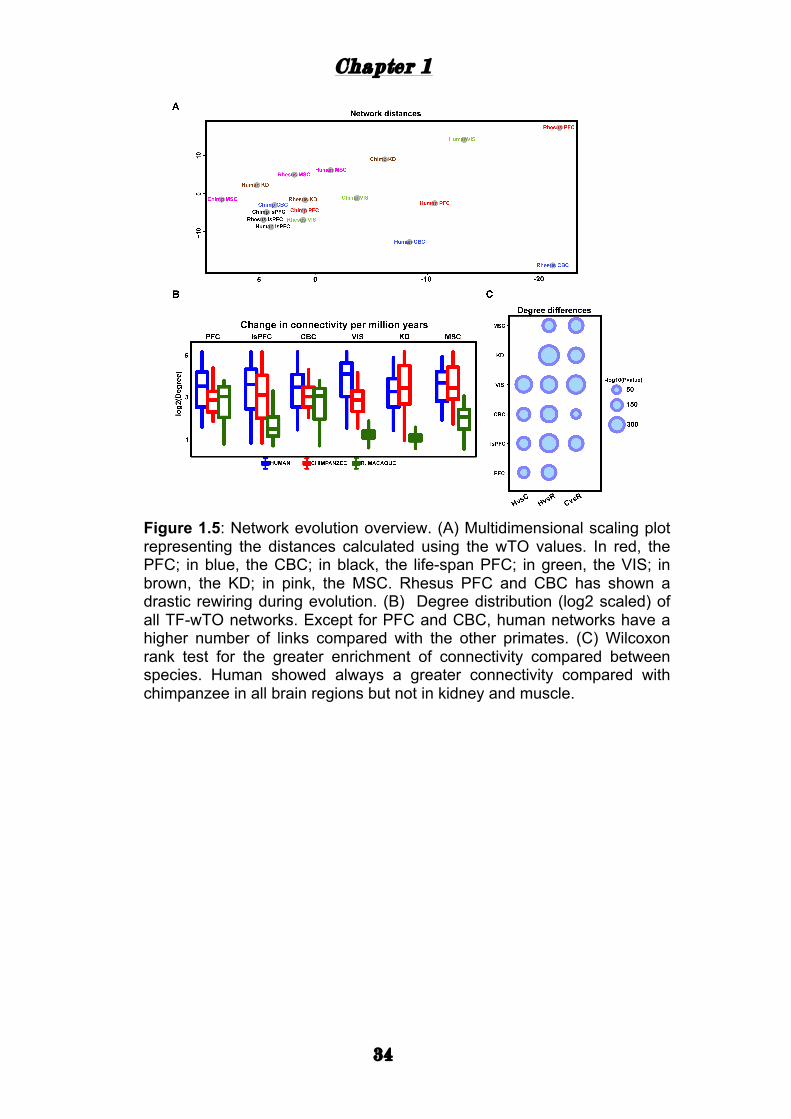
The adult rhesus macaque PFC and CBC are the most distant networks
with higher connectivity than the adult PFC and CBC of humans and
chimpanzees (Fig. 1.5 A). In the networks for kidney and muscle we
observed fewer differences in degree distribution between species than in
the brain tissues. Similarly to the life-span PFC, the human network of the
adult visual cortex also displays an excess of links compared to the other
two species. Interestingly, the wTO networks of human brain tissues
always had a higher number of links compared to the wTO networks of
chimpanzee brains, which is not the case in the muscle and kidney
networks (Fig. 1.5 B and C).
Comparing the networks between different tissues allowed us to pinpoint
links and hubs that are specific to the human PFC. Interestingly, among
the TFs with the most links in the networks of the human adult and life-
span PFC but fewer links in most other networks are three TFs that are
associated with neurodegenerative disorders in which the motor control is
constrained (Appendix: Fig. S1.2).
As seen for the networks derived from the life-span PFC, our GO analysis
of the adult human PFC network also revealed a strong enrichment for
categories related to brain functions such as synapse organization,
learning, and behavior (e.g. locomotory behavior), while such functions
were much less enriched in the adult chimpanzee and rhesus macaque
PFC and in the other tissues (Appendix: Fig. S1.3).
Chapter 1
34
Figure 1.5: Network evolution overview. (A) Multidimensional scaling plot representing the distances calculated using the wTO values. In red, the PFC; in blue, the CBC; in black, the life-span PFC; in green, the VIS; in brown, the KD; in pink, the MSC. Rhesus PFC and CBC has shown a drastic rewiring during evolution. (B) Degree distribution (log2 scaled) of all TF-wTO networks. Except for PFC and CBC, human networks have a higher number of links compared with the other primates. (C) Wilcoxon rank test for the greater enrichment of connectivity compared between species. Human showed always a greater connectivity compared with chimpanzee in all brain regions but not in kidney and muscle.
Chapter 1
35
Expression Changed Sub-Networks
While all TFs in the network have changed in expression, it does not mean
that the genes correlated with these TFs have also changed in expression.
In fact, many of the lineage-specific changes in network wiring could have
evolved to compensate for other mutations to keep the expression of the
associated genes conserved. This notion is supported by our observation
that the enriched GO groups are the same for the PFC networks of all
three species. Since the genes with species-specific expression changes
are most likely to drive phenotypic differences between the three species,
we determined next which TF correlated genes have species-specifically
changed in expression.
We filtered all TF correlated genes requiring that their expression change
is consistent with the expression change of the TF (Methods and Fig. 1.2).
For example, genes that were positively correlated with a TF that was
specifically up-regulated in humans were only retained if they were also
specifically up-regulated in humans. Vice versa, genes that were
negatively correlated with a TF that was specifically up-regulated in
humans were only retained if they were specifically down-regulated in
humans. We proceeded analogously for down-regulated TFs and for the
other species. From the genes assembled this way for each TF we
constructed another TF wTO network for each species. In contrast to the
networks above, these TF wTO networks (EC-sub-networks) contain only
the TFs specifically changed in expression in that species and the
information of their correlated genes that have also changed specifically in
that species.
We validated that the EC-sub-network of each species is different from
random networks with permutation tests and determined a |wTO| cutoff of
> 0.3 as the most suitable wTO cutoff for our further analysis (|wTO| > 0.3;
permutation test, p-value < 0.001) (Methods). To further confirm our
inferred network links, we tested for enrichment of TF binding sites in the
promoters of TF correlated and expression changed genes (Methods). For
the genes contributing to the human EC-sub-network we found for
instance an enrichment for binding sites of several human specifically
Chapter 1
36
changed TFs (e.g CLOCK, EGR1, HNF4A, LMO2, PRDM14, and
SMAD2), lending support for the biological relevance of the inferred EC-
sub-networks.
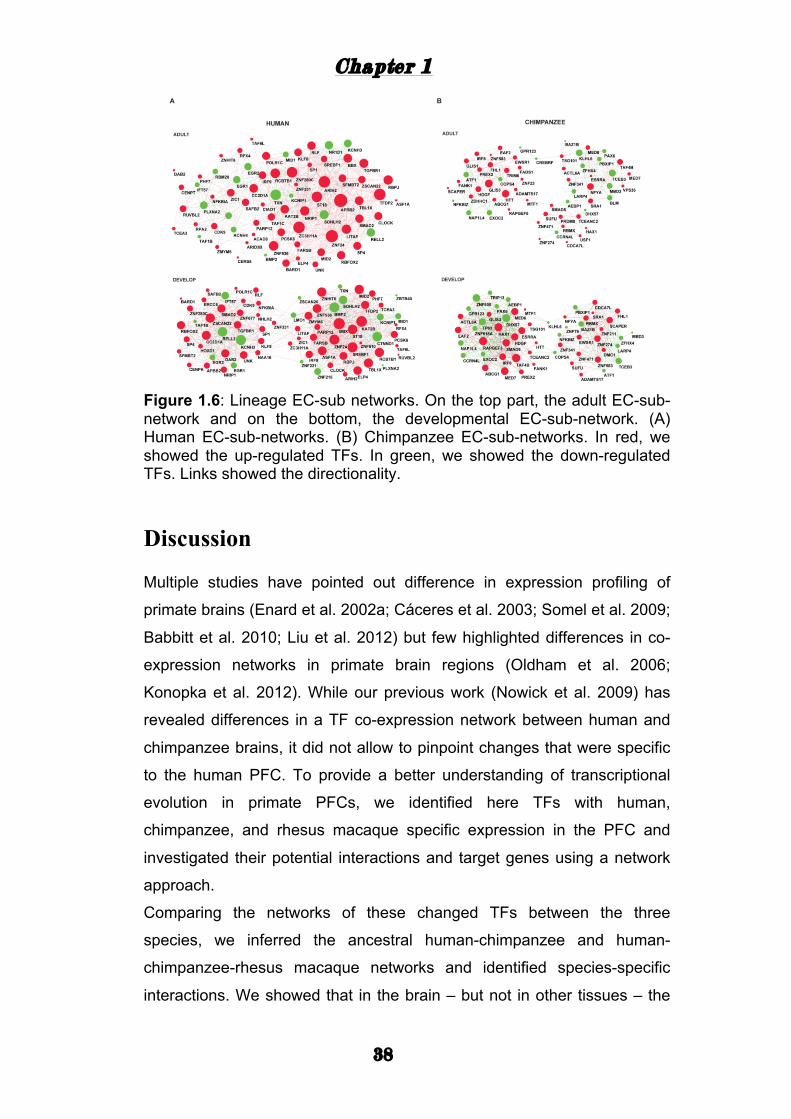
Using the rhesus macaque as outgroup, we focused on the human and
chimpanzee TF network differences in adult and development PFC.
Interestingly, the topology of the networks of the two species (Fig 1.6) is
considerably different. Remarkably, the human life-span EC-sub-network
has significantly higher connectivity (c = 7.8) than the chimpanzee life-
span EC-sub-network (c = 3.4, Wilcoxon test, p = 4.85x10-05). Such higher
connectivity has been also confirmed in the EC-sub networks derived from
the adult PFC data (human c = 15.7, chimpanzee c = 6.8, Wilcoxon test, p
= 3.3x10-09). Strikingly, “Brain TFs” had more links than other TFs in the
adult human EC-sub-networks (adult, Wilcoxon test, p = 0.035;
development, Wilcoxon test, p = 0.12) and also more links in the human
adult EC-sub-network compared with chimpanzee adult EC-sub-network
(adult, Wilcoxon test, p = 1.04x10-05; life-span, Wilcoxon test, p = 0.08),
suggesting a more central role for those “Brain-TFs” in the human PFC
(Appendix: Fig. S1.4).
To identify the most important TFs in the EC-sub-networks, we
investigated, which TFs have the highest numbers of links, i.e. are hubs in
the EC-sub-networks. In line with the higher connectivity, “Brain TFs” are
significantly enriched among the hubs (adult, Fisher’s exact test, p-value =
0.03; development, Fisher’s exact test, p-value = 0.32) only in human adult
EC-sub-network. Examples of hubs in the human EC-sub-networks
(defined as TFs with more than 18 links) are the aforementioned CC2D1A,
and ZNF536, zinc finger protein implicated in maintenance of neural
progenitor cells and neuronal differentiation (Qin et al. 2009).
Besides hubs, nodes with high Betweenness Centrality are also important
for networks. These nodes are characterized by the highest number of
shortest paths passing through them, making them in modular networks
the nodes that are connecting the modules. We found several TFs (e.g.
ZIC1, ZNF24, and ZNF331) that are central node in the network with their
centrality function conserved between adult and life-span PFC. This data
Chapter 1
37
emphasize the central role of some TFs in the molecular pathways of
human PFC.
Moreover, life-span and adult networks of both human and chimpanzee
highlighted variation in TF connectivity (Appendix: Fig. S1.5 and Fig.
S1.6). While TFs such as CC2D1A, RBPJ, and ZNF536 maintained high
connectivity in both human EC-sub-networks, in TFs as APPB2, KCNIP1,
and ZIC1 the connectivity between adult or life-span PFC drastically
changed. This data suggests that several TFs might have a selective hub
role during life-span stages of PFC.
Interestingly, genes correlated with the TFs in the human EC-sub-network
are enriched for genes involved in axon guidance, myelination, and cell
differentiation. Such functions are not overrepresented in the chimpanzee
EC-sub-networks. This is remarkable, given that very similar GO groups
have been enriched in the five networks built from all correlated genes,
indicating that while the overall function of the PFC network seems to be
conserved since the human-chimpanzee-rhesus macaque ancestor, TF
genes with human specific expression seem to particularly change the
expression of genes involved in certain brain functions.
Because the EC-sub-networks are bi-modular, we also tested for GO
enrichment among the genes of each module (Methods). While the
chimpanzee modules did not shown any significant enrichment, the human
right module was enriched for genes involved in cellular differentiation and
morphogenesis. Strikingly, we found that the human left module showed a
significant enrichment within GO groups related to axon guidance,
synaptic plasticity, learning and memory, cognition, and brain
development.
Chapter 1
38
Figure 1.6: Lineage EC-sub networks. On the top part, the adult EC-sub-network and on the bottom, the developmental EC-sub-network. (A) Human EC-sub-networks. (B) Chimpanzee EC-sub-networks. In red, we showed the up-regulated TFs. In green, we showed the down-regulated TFs. Links showed the directionality.
Discussion
Multiple studies have pointed out difference in expression profiling of
primate brains (Enard et al. 2002a; Cáceres et al. 2003; Somel et al. 2009;
Babbitt et al. 2010; Liu et al. 2012) but few highlighted differences in co-
expression networks in primate brain regions (Oldham et al. 2006;
Konopka et al. 2012). While our previous work (Nowick et al. 2009) has
revealed differences in a TF co-expression network between human and
chimpanzee brains, it did not allow to pinpoint changes that were specific
to the human PFC. To provide a better understanding of transcriptional
evolution in primate PFCs, we identified here TFs with human,
chimpanzee, and rhesus macaque specific expression in the PFC and
investigated their potential interactions and target genes using a network
approach.
Comparing the networks of these changed TFs between the three
species, we inferred the ancestral human-chimpanzee and human-
chimpanzee-rhesus macaque networks and identified species-specific
interactions. We showed that in the brain – but not in other tissues – the
Chapter 1
39
human wTO network experienced extraordinary rewiring. Furthermore we
constructed sub-networks of only the TFs and genes with species-specific
expression changes (EC-sub-networks) to pinpoint network components
that might underlie phenotypic differences between species in the PFC.
With this our work not only highlights the complexity of transcriptional
networks in human brain regions with a focus on the PFC, but also adds to
previous findings on human specific morphological changes in the PFC
(Semendeferi et al. 2011; Rilling 2014), and human specific gene
expression changes in the PFC (Somel et al. 2009; Babbitt et al. 2010;
Konopka et al. 2012; Liu et al. 2012), by suggesting candidate TFs and
interactions that might drive these human specific changes. Our study has
several limitations.
For example, our restriction to data from humans, chimpanzees, and
rhesus macaques, does not allow us to determine the exact time window
of when particular network rewiring events took place. Moreover, because
we can only observe links that exist in presently living species, our
ancestral networks do not contain links that have been lost during
evolution. It should also be kept in mind that not all gene expression
changes reflect on the protein level. Nevertheless our work provides
insights into network rewiring process that took place during human and
chimpanzee evolution.
The most intriguing insight from our work is that we demonstrated higher
connectivity and more rewiring in the TF network of the human PFC
compared to the chimpanzee PFC TF network. Importantly, we obtained
this result with data from two independent genome-wide expression
studies of primate PFC samples, Increased network connectivity in the
human compared to chimpanzee and rhesus macaque PFC has also been
described with another study with a different network approach (Konopka
et al. 2012).
In our data, higher connectivity between TFs means that the TFs overlap
more strongly in their putative target genes and interaction partners. This
suggests changes in gene regulatory programs with a more complex
interplay of TFs in the human PFC. Several hubs that experienced strong
rewiring in the human PFC network are known to be involved in important
Chapter 1
40
brain functions, for instance CC2D1A, MEF2D, and PER2. The function of
other hubs with strongly changed links, such as ZNF19, ZNF286A, and
ZNF696, has yet to be discovered. Interestingly, among the most highly
connected TFs in the human EC-sub-network are TFs that have been
implicated in brain development and cognitive diseases. It is possible that
these TFs became risk genes for brain disorders, because they moved
into such central position in the human network. In contrast, we did not
find enrichment for or higher connectivity of “Brain TFs” in the chimpanzee
and rhesus macaque EC-sub-networks, suggesting that human specific
changes in network integration of some “Brain-TFs” might in part be
associated with the evolution of human-specific cognitive abilities.
Our GO analysis showed that already the ancestral PFC TF network
regulates primarily genes involved in brain development and brain
functions. Some of the rewiring that we observed might compensate for
other mutations during primate evolution to keep the expression of genes
in the brain conserved. This implies that in part some molecular pathways
are regulated differentially across different primate species.
To identify the network components that are most likely responsible for
phenotypic differences between the three species, we identified the subset
of TFs and their correlated genes with species-specific expression.
Only on the human lineage, these genes were enriched for genes that are
involved in neuron projection, cell morphogenesis, neuron development,
neuron differentiation, and axonogenesis. This suggests that the TFs of
the human EC-sub-network and the genes they regulate as excellent
candidates for setting the stage for human specific cognitive abilities. For
example, APBB2, associated with Alzheimer’s disease (Li et al. 2005;
Golanska et al. 2008), RBPJ, important for neuronal plasticity and
development (Hanotel et al. 2014; Liu et al. 2014b), and NRIP1, a target of
FMRP and potentially implicated in intellectual disability (Darnell et al.
2011), are hubs in the human EC-sub-networks and strongly interlinked. In
summary, our results suggest that the network of TFs in the PFC has
been heavily rewired during primate evolution. While we noted
considerable rewiring also in other brain regions, we did not observe it in
other tissues We yet have to understand better the complexity of gene
Chapter 1
41
regulatory networks and their phenotypic consequences, but the TF
network changes we identified here might have changed the expression of
gene that are involved in determining human specific traits, such as bigger
brain size, particular cognitive abilities, behavior, and brain disorders.
Methods
Data sets Raw data for microarray and RNA-Seq were downloaded from Gene
Omibus Database (http://www.ncbi.nlm.nih.gov/geo/). For the differential
expression profiling, we used data of the PFC of 5 adult of human,
chimpanzee and rhesus macaque individuals (GSE50782). For the
correlation analyses, we used a two dataset: the multi tissue RNA seq
dataset comprising adult individuals of human, chimpanzee and rhesus
macaque (GSE49379) and an additional microarray dataset of PFC
samples selecting 12 individuals for each species with different ages
(GSE22570). For a comparable age collection, we implemented a linear
model using the specific life traits of each species such as sexual maturity,
first reproduction, age at gestation, litter per year, weaning, and maximum
life expectancy.
Expression profiling RNA-seq and Microarrays were analyzed using the R programming
language and Bioconductor packages. RNA-seq were aligned to primate
genomes (hg19, PanTro3, rheMac3) using seghemel (Hoffmann et al.
2009). Counts and RPKM were calculated using R programming and
multiple library (Lawrence et al. 2013a). We retained expressed genes
with RPKM > 0.5 in at least one species. Counts were further confirmed
using HTSeq (Anders et al. 2014). Orthologous genes were used and
human gene names were selected for further analysis. Differential
expression were calculated using DESeq package (Anders and Huber
2012). Genes were retained differentially expressed for |log2FC| > 0.3 and
FDR < 0.05. For the microarray dataset, we performed a computational
mask procedure using the maskBAD package
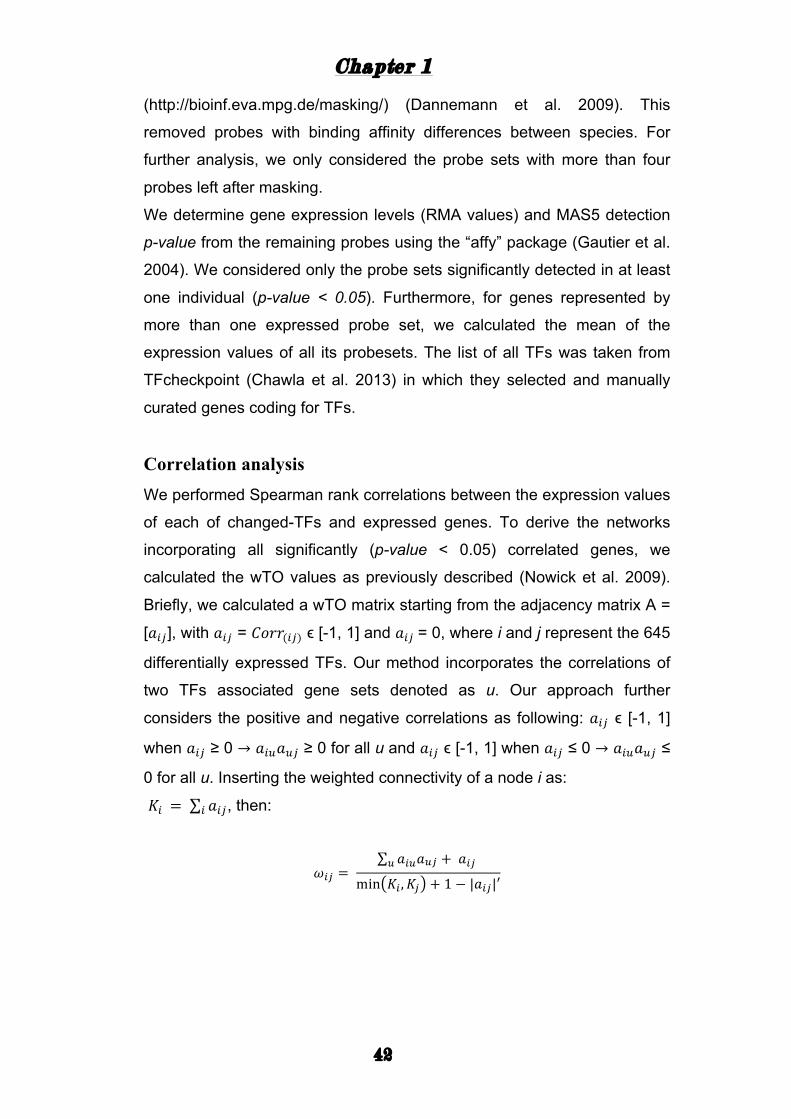
Chapter 1
42
(http://bioinf.eva.mpg.de/masking/) (Dannemann et al. 2009). This
removed probes with binding affinity differences between species. For
further analysis, we only considered the probe sets with more than four
probes left after masking.
We determine gene expression levels (RMA values) and MAS5 detection
p-value from the remaining probes using the “affy” package (Gautier et al.
2004). We considered only the probe sets significantly detected in at least
one individual (p-value < 0.05). Furthermore, for genes represented by
more than one expressed probe set, we calculated the mean of the
expression values of all its probesets. The list of all TFs was taken from
TFcheckpoint (Chawla et al. 2013) in which they selected and manually
curated genes coding for TFs.
Correlation analysis We performed Spearman rank correlations between the expression values
of each of changed-TFs and expressed genes. To derive the networks
incorporating all significantly (p-value < 0.05) correlated genes, we
calculated the wTO values as previously described (Nowick et al. 2009).
Briefly, we calculated a wTO matrix starting from the adjacency matrix A =
[𝑎!"], with 𝑎!" = 𝐶𝑜𝑟𝑟(!") ϵ [-1, 1] and 𝑎!" = 0, where i and j represent the 645
differentially expressed TFs. Our method incorporates the correlations of
two TFs associated gene sets denoted as u. Our approach further
considers the positive and negative correlations as following: 𝑎!" ϵ [-1, 1]
when 𝑎!" ≥ 0 → 𝑎!"𝑎!" ≥ 0 for all u and 𝑎!" ϵ [-1, 1] when 𝑎!" ≤ 0 → 𝑎!"𝑎!" ≤
0 for all u. Inserting the weighted connectivity of a node i as:
𝐾! = 𝑎!"! , then:
𝜔!" = 𝑎!"𝑎!" + 𝑎!" !
min 𝐾! ,𝐾! + 1 − |𝑎!"|′
Chapter 1
43
GO enrichment Gene ontology enrichment were performer using FUNC (Prufer et al.
2007) and additional confirmation with GOstat (Beißbarth and Speed
2004) and GOrilla (Eden et al. 2009). We adapted the Wilcoxon ranked
enrichment ranking the genes based on the number of TFs the genes are
correlated with. We report GO groups with enrichment p-values < 0.05
before and after refinement. For the EC-sub-networks, FUNC was
adapted (Prufer et al. 2007; Huang et al. 2008), performing a similar
Wilcoxon test we used previously. We reported GO categories enrichment
for a p-values < 0.05 before and after refinement. For module enrichment,
we subset the genes correlated with the TF in the modules and adapted a
Wilcoxon ranked enrichment.
TF enrichment
We performed the TF motif enrichment using the Jaspar and TRANSFAC
databases (Matys et al. 2003; Mathelier et al. 2013). We compared the 5
KB upstream promoter regions to three different background data: 5 and 2
KB promoter regions of all human genes and Human CpG islands. To
perform the motif enrichment, we used MEME suite (Bailey et al. 2009).
Motifs enrichment were additionally confirmed using publically available
ChIP data from ENCODE and other sources using ChEA suite (Lachmann
et al. 2010).
Network robustness tests To test the robustness of the networks, we performed two different
methods: Firstly, we performed a permutation test shuffling 1000 times the
expression values of all expressed genes. We then calculated the wTO
values with these randomized expression values. The randomized
networks showed fewer links and high structural differences compared
with the original networks of all species for all tested cutoffs |wTO|= [0.2 ..
0.6], resulting in a p-value of 0.001. None of the randomized networks
Chapter 1
44
displayed edges with |wTO| > 0.3. Subsequently, we applied |wTO| > 0.3
for the PFC developmental data. Due to the high number of edges on the
adult data, we adapted a |wTO| > 0.5 cutoff for a better and consistent
data visualization and analysis.
For the EC-sub-network, we performed 1000 permutation tests. The
structures of the randomized networks were considerably different from
the original network. Since none of the 1000 shuffled networks presented
wTO values higher than 0.3 (p-value = 0.001), we chose |wTO| > 0.3 as
cutoff for the EC-sub-networks.
An additional test for the network evolution of the PFC developmental
dataset has been implemented. To test if this high number of species-
specific links could be an artifact, we recalculated the networks using the
“leave-one-out” method. This resulted in 12 networks per species
constructed from 11 individuals each. All these networks clustered
according to species, demonstrating that the strong divergence in network
links between species is robust.
Other statistics To test the brain-TF enrichment, P-values were calculated with Fisher’s
exact test function in R (alternative = “g”, confidence level = 0.99,
simulated p-value with 1000 replicates). Wilcoxon ranked test was
implemented to evaluate the difference of the connectivity between
species (alternative = “g”, confidence level = 0.99, paired=FALSE).
To test the overlap between independent data, P-values were calculated
with hypergeometric test using a custom made R script. We retained an
independent background for population size (for human, BrainSpan
expressed gene = 15585 genes). P-values were subsequently adjusted for
multiple comparisons using Benjamini-Hochberg FDR procedure. Two-
way permutation test of 10000 was adapted to validate the overlaps. First
we randomize the external gene sets (e.g human DEGs) randomly
selecting the same number of genes from an independent brain expressed
genes list (Brainspan gene set) and subsequently calculating the overlap
P-values with the TF gene set. The second approach randomized the
Chapter 1
45
internal gene sets (e.g. TF gene set) randomly selecting the same number
of TF detected from RNA-seq and subsequently calculating the overlap P-
values. Moreover, we adapted a permutation test to evaluate the detected
DEG, randomizing 1000 times the RNA-seq data and recalculating the
DEG detecting that none of the permuted data showed the same DEG
(data not shown). Analysis for RNA-seq, microarray, and correlation
filtering were performed using custom made R and SQL scripts
implementing functions and adapting statistical designs comprised in the
libraries used. To calculate the correlation and wTO, we developed a
Java-based program.

46
Chapter 2
47
CHAPTER 2
A transcription factor consensus network of the
human frontal lobe: insights into the molecular
mechanisms of human cognitive abilities
Project summary Cognitive abilities, such as memory, learning, language, problem solving,
and planning, involve the frontal lobe and other brain areas. Not much is
known yet about the molecular basis of cognitive abilities, but it seems
clear that cognitive abilities are determined by the interplay of many
genes. One approach to analyze the genetic networks involved in
cognitive functions is to study the co-expression networks of genes with
known importance for proper cognitive functions, such as genes that have
been associated with cognitive disorders like intellectual disability (ID) or
autism spectrum disorders (ASD). Because many of these genes are
transcription factors (TFs) we aimed to provide insights into the gene
regulatory networks active in the human frontal lobe. To this end, we
derived co-expression networks for all TFs including their potential target
genes and interaction partners from 10 independent genome wide
expression studies from different experimental platforms from human
frontal lobe samples. We developed a new statistical method for
integrating multiple independently derived networks into a high confident
consensus network. This consensus network revealed robust TFs
interactions that are conserved across the frontal lobes of different human
individuals. Within this network, we detected a strong central module that
is enriched for TFs known to be involved in brain development and/or
cognitive disorders. Interestingly, also many hub genes in this module are
TFs that have been associated with cognitive disabilities. Our results shed
Chapter 2
48
light on which TF genes play a central role in a regulatory network of the
human frontal lobe.
Introduction
Broadly defined, cognition refers to the biological mechanisms through
which animals perceive, learn and memorize information from the
environment and decide to act upon them (Shettleworth 2009). In humans,
cognitive processes such as language, social behavior, and decision
making have been attributed to the frontal lobe (Duncan et al. 1996;
Chayer and Freedman 2001). Chimpanzees and bonobos share many
intellectual and social capabilities with humans, suggesting a common
evolutionary trajectory in the great-ape lineage. Nevertheless, humans are
distinct from other apes by having for instance more complex social and
communicative skills. These abilities seem to be linked to a larger and
morphologically more complex frontal lobe in humans (Squire and Zola
1996; Boyd et al. 2011; Neubert et al. 2014). Indeed, the human frontal
lobe has a wider spacing between its cortical mini-columns compared to
the other great apes (Buxhoeveden et al. 2006; Semendeferi et al. 2011).
It also shows higher connectivity and a pronounced increase of white
matter during development (Schoenemann et al. 2005; Rilling et al. 2008).
In addition, there is a positive correlation between the expansion of the
neocortex and the measures of social complexity in primates (Dunbar and
Shultz 2007).
These findings suggest that morphological and histological changes in the
human frontal lobe have been involved in the evolution of human specific
cognitive traits. However, the actual molecular mechanisms that underlie
these morphological changes are still not well understood. Candidate
genes that are involved in the molecular mechanisms of cognition can be
identified through biomedical studies on cognitive disorders. For example,
causative mutations point to the genes that should in their wild-type
variants be important for providing for healthy cognitive abilities. Research
on cognitive disorders such as Alzheimer’s disease (AD) (Bullido et al.
1998), intellectual disability (ID) (Kaufman et al. 2010), autism spectrum

Chapter 2
49
disorder (ASD) (Bailey et al. 1996; Voineagu et al. 2011; Berg and
Geschwind 2012; Ecker et al. 2012), schizophrenia (SZ) (Andreasen
1995), circadian rhythm and bipolar disorder (BD) (Scrandis 2014),
Parkinson’s disease (PD) (Polymeropoulos 2000), and several syndromes
or disorders associated with ID or cognitive impairment (SY) (Greydanus
and Pratt 2005) has thus already identified several candidate genes
involved in cognition. Importantly, these studies also revealed that most
cognitive disorders are complex and phenotypically and genetically
heterogeneous (Sebat et al. 2007; Tsankova et al. 2007; Voineagu et al.
2011; Weyn-Vanhentenryck et al. 2014), thus creating challenges for
studying these disorders. Transcriptome and network analyses bear great
potential for overcoming some of these challenges and uncovering the
genetic interactions and molecular mechanisms causing such complex
disorders. For example, recent studies have used network approaches to
identify coexpressed ASD and ID modules implicated in synaptic
development, chromatin remodeling and early transcriptional regulation
(Parikshak et al. 2013; Willsey et al. 2013; De Rubeis et al. 2014).
Several reasons prompted us to especially focus on the investigation of
the role of TFs in co-expression networks of the frontal lobe. First,
because TFs regulate the expression of many genes, they are expected to
be among the most important players in these networks and might provide
important insides about the molecular mechanisms taking place in this
tissue. Second, our previous work (Nowick et al. 2009) showed that TFs of
the family of KRAB-ZNFs, among them many primate specific TFs, are
enriched among the genes showing differential expression patterns
between the human and chimpanzee frontal lobe. In addition, primate
specific KRAB-ZNFs are also enriched among the genes expressed
during frontal lobe development (Nowick et al. 2010), which leads to the
hypothesis that at least some TFs, might contribute to human specific
cognitive abilities. Third, we show here that TFs are enriched among the
candidate genes for ID and ASD, thus suggesting an important role of TFs
in the gene regulatory processes and circuitry of such cognitive disorders.
Taken together, TFs are thus good candidates for providing essential
Chapter 2
50
information about the molecular mechanisms that set the stage for
cognition.
To identify and analyze TFs with potential implications in cognition in more
detail, we performed a comprehensive literature survey and compiled a list
of 515 TFs that are known to be important during human brain
development or that have been associated with cognitive disorders. We
will refer to this set of 515 TFs as “Brain-TFs”. We then derived co-
expression networks, which integrate all TFs and their correlated genes
which are expressed in human frontal lobes. Because co-expression
networks can have many false positive inferences, we calculated weighted
topological overlap (wTO) networks, which significantly reduce the effect
of false positives (Nowick et al. 2009). In addition, to reduce the effect of
individual differences and technical artifacts, we analyzed 10 different
transcriptome datasets from individual human frontal lobe samples, which
have been produced with different platforms (microarrays and RNA-Seq).
We then developed a method for integrating the wTO networks of these
10 different datasets to obtain a consensus network with high confidence
level. Using this consensus network we particularly investigated the
interactions of “Brain-TFs” and their potential target genes.
Chapter 2
51
Results
Transcription factors in cognition, brain development and
disorders
To investigate TFs that are expressed in the frontal lobe more
comprehensively, we used our in-house list of all 3315 human TFs
(Perdomo-Sabogal et al., manuscript in preparation). Note that we are
using the term TF here for transcriptional regulators, which include DNA
binding proteins, cofactors, and chromatin modifiers among others. Within
this list of TFs we identified 515 TFs that are involved in cognitive
functions, brain development, and disorders by using different sources:
Simons Foundations Autism Research Initiative (Banerjee-Basu and
Packer 2010), AutDB database (Basu et al. 2009), PubMed, Online
Mendelian Inheritance in Man (Hamosh et al. 2005), AlzGene (Bertram
2009) PDgene (Lill et al. 2012), SZgene (Allen et al. 2008), and from
multiple publications on genes associated with intellectual disability (Inlow
and Restifo 2004; Ropers 2008; van Bokhoven 2011; Lubs et al. 2012)
(Appendix: Table S1.1).
A prevalence of genes coding for TFs among genes associated with some
cognitive disorders has been observed before (Voineagu et al. 2011;
Parikshak et al. 2013; Willsey et al. 2013). We here tested if this
observation represents a significant overrepresentation of TF genes
among genes implicated in cognitive disorders. Among the 401 genes
implicated in Intellectual Disability (ID), we identified 106 genes coding for
TFs, which represents a highly significant enrichment of TFs among all ID
genes (hypergeometric test, p = 2.03x 10-07) (Fig. 2.1). The AutDB and
SFARI databases (Basu et al. 2009; Banerjee-Basu and Packer 2010)
currently include 667 genes implicated in autism. We identified 141 TFs
among these 667 genes, which demonstrates that there is also a highly
significant overrepresentation of TFs among genes associated with autism
(hypergeometric test, p = 0.0004) (Fig. 2.1). We further investigated
whether TFs are enriched among the target genes of the Fragile-X Mental
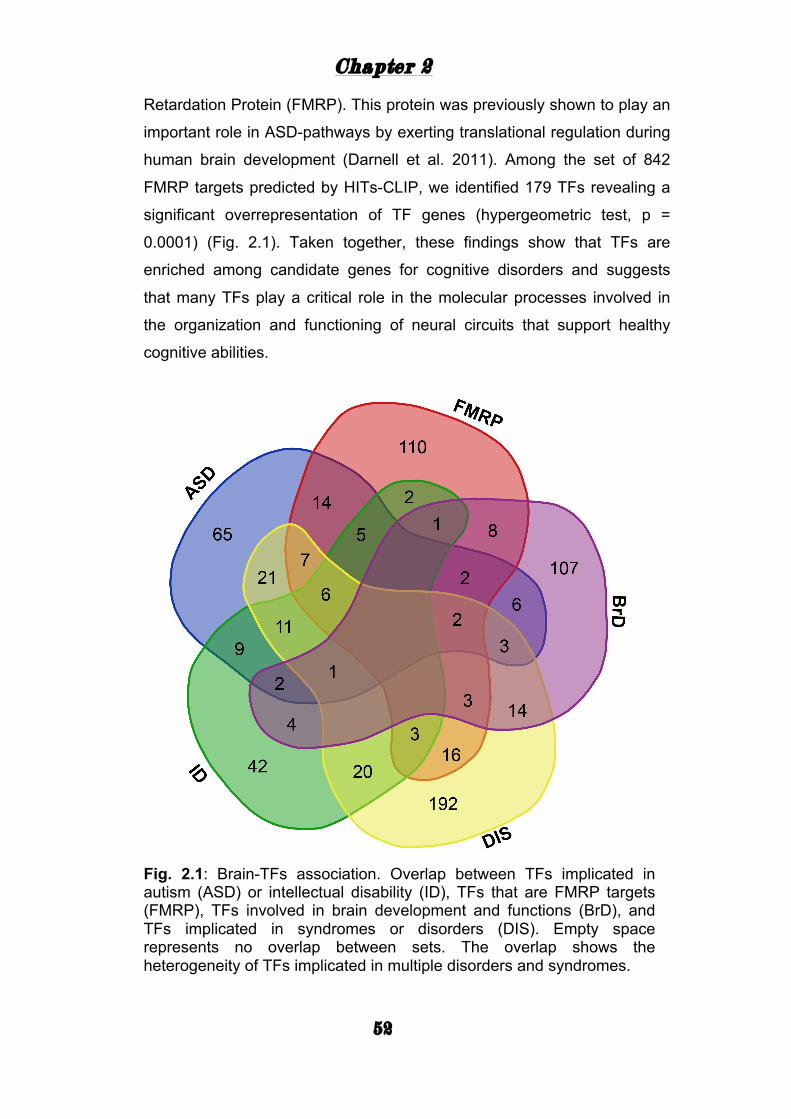
Chapter 2
52
Retardation Protein (FMRP). This protein was previously shown to play an
important role in ASD-pathways by exerting translational regulation during
human brain development (Darnell et al. 2011). Among the set of 842
FMRP targets predicted by HITs-CLIP, we identified 179 TFs revealing a
significant overrepresentation of TF genes (hypergeometric test, p =
0.0001) (Fig. 2.1). Taken together, these findings show that TFs are
enriched among candidate genes for cognitive disorders and suggests
that many TFs play a critical role in the molecular processes involved in
the organization and functioning of neural circuits that support healthy
cognitive abilities.
Fig. 2.1: Brain-TFs association. Overlap between TFs implicated in autism (ASD) or intellectual disability (ID), TFs that are FMRP targets (FMRP), TFs involved in brain development and functions (BrD), and TFs implicated in syndromes or disorders (DIS). Empty space represents no overlap between sets. The overlap shows the heterogeneity of TFs implicated in multiple disorders and syndromes.
Chapter 2
53
Ten different genome-wide TFs co-expression networks
To investigate the roles of all TFs in the frontal lobe, we analyzed ten
genome-wide expression datasets comprised of frontal lobe samples from
individuals of different ages and obtained with different techniques. We
considered these independent dataset as replicates, thus helping us to
alleviate the dependence of our results from a particular set of individuals,
developmental time points, different RNA library preparations, and gene
expression measurement platforms.
From each dataset, we constructed a weighted topological overlap (wTO)
network taking into account all expressed TFs and their coexpressed
genes (Nowick et al. 2009). For constructing this wTO network, we first
identified all genes that are significantly correlated in expression (i.e.
coexpressed) with a particular TF. These genes include putative target
genes and interaction partners of that TF. The wTO of a pair of TFs then
represents the commonality of these two TFs in their sets of coexpressed
genes. Because TFs can function as activators or repressors of gene
expression, we take into account the sign of the correlation when
calculating the wTO. Pairs of TFs with |wTO| values above a certain cutoff
are connected by a link in the wTO network visualization (Methods).
To evaluate the reliability of the 10 networks, we performed permutation
tests by randomizing the expression values for each individual 100 times
and calculating the wTO values for these randomized datasets. For any
tested |wTO| cutoff, the networks obtained from the real datasets had
more links than the networks from the permuted datasets, indicating that
all empirically derived networks are different from random expectation.
Nevertheless, we also noted differences between the 10 networks, for
instance in the distribution of the wTO values and when comparing the
wTO values for particular links between the datasets (Fig. 2.2 A,B). The
differences between the datasets can probably be explained by biological
variation between individuals, but also by technical variations such as in
RNA extraction methods, RIN values, and RNA library preparation
procedures. We performed an outlier analysis of our data, considering the
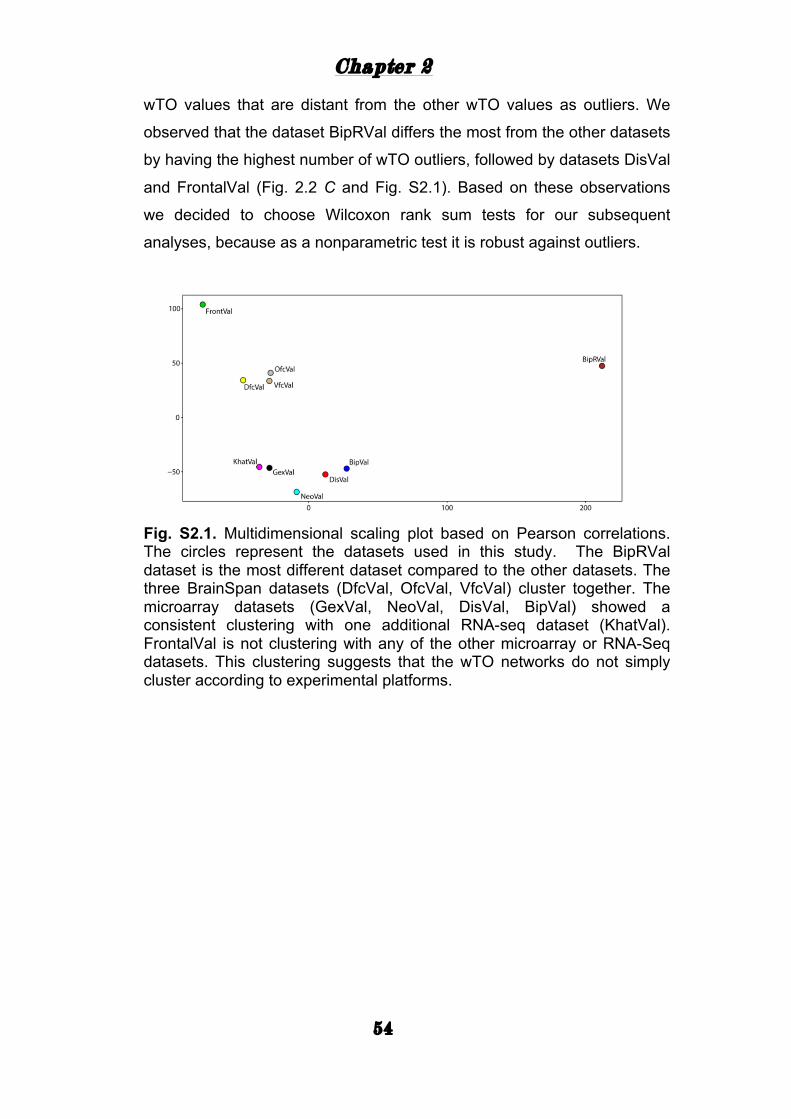
Chapter 2
54
wTO values that are distant from the other wTO values as outliers. We
observed that the dataset BipRVal differs the most from the other datasets
by having the highest number of wTO outliers, followed by datasets DisVal
and FrontalVal (Fig. 2.2 C and Fig. S2.1). Based on these observations
we decided to choose Wilcoxon rank sum tests for our subsequent
analyses, because as a nonparametric test it is robust against outliers.
Fig. S2.1. Multidimensional scaling plot based on Pearson correlations. The circles represent the datasets used in this study. The BipRVal dataset is the most different dataset compared to the other datasets. The three BrainSpan datasets (DfcVal, OfcVal, VfcVal) cluster together. The microarray datasets (GexVal, NeoVal, DisVal, BipVal) showed a consistent clustering with one additional RNA-seq dataset (KhatVal). FrontalVal is not clustering with any of the other microarray or RNA-Seq datasets. This clustering suggests that the wTO networks do not simply cluster according to experimental platforms.
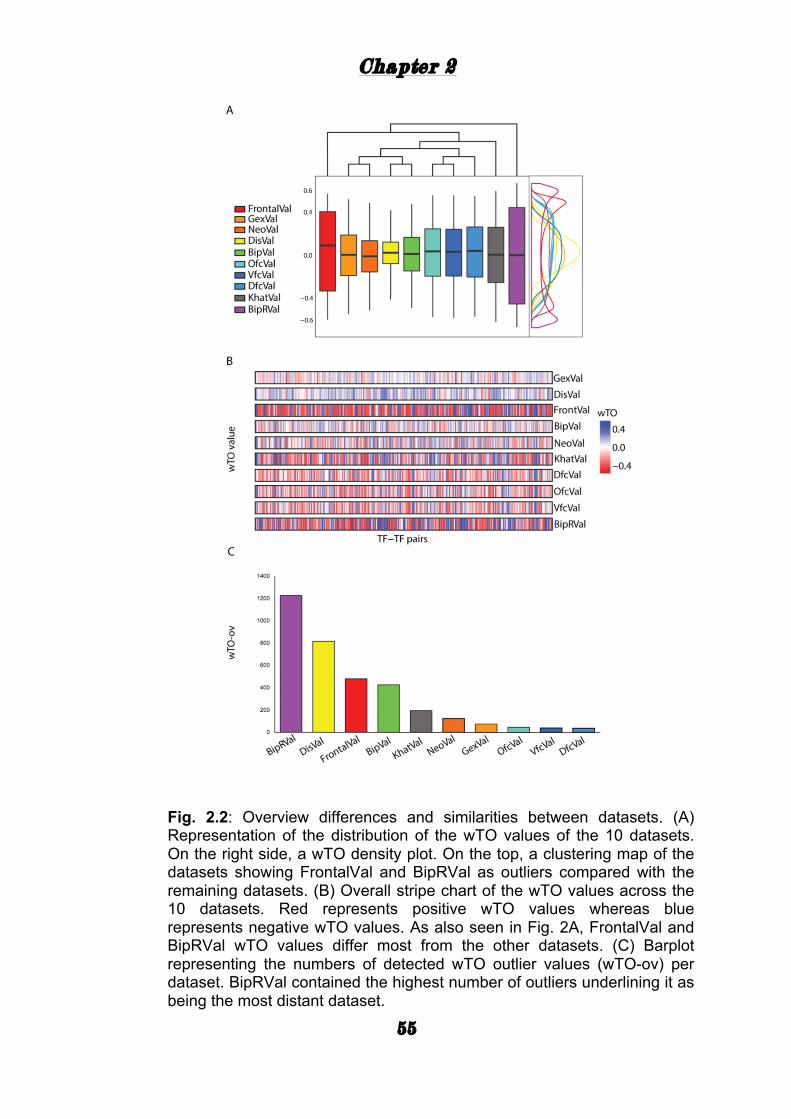
Chapter 2
55
Fig. 2.2: Overview differences and similarities between datasets. (A) Representation of the distribution of the wTO values of the 10 datasets. On the right side, a wTO density plot. On the top, a clustering map of the datasets showing FrontalVal and BipRVal as outliers compared with the remaining datasets. (B) Overall stripe chart of the wTO values across the 10 datasets. Red represents positive wTO values whereas blue represents negative wTO values. As also seen in Fig. 2A, FrontalVal and BipRVal wTO values differ most from the other datasets. (C) Barplot representing the numbers of detected wTO outlier values (wTO-ov) per dataset. BipRVal contained the highest number of outliers underlining it as being the most distant dataset.
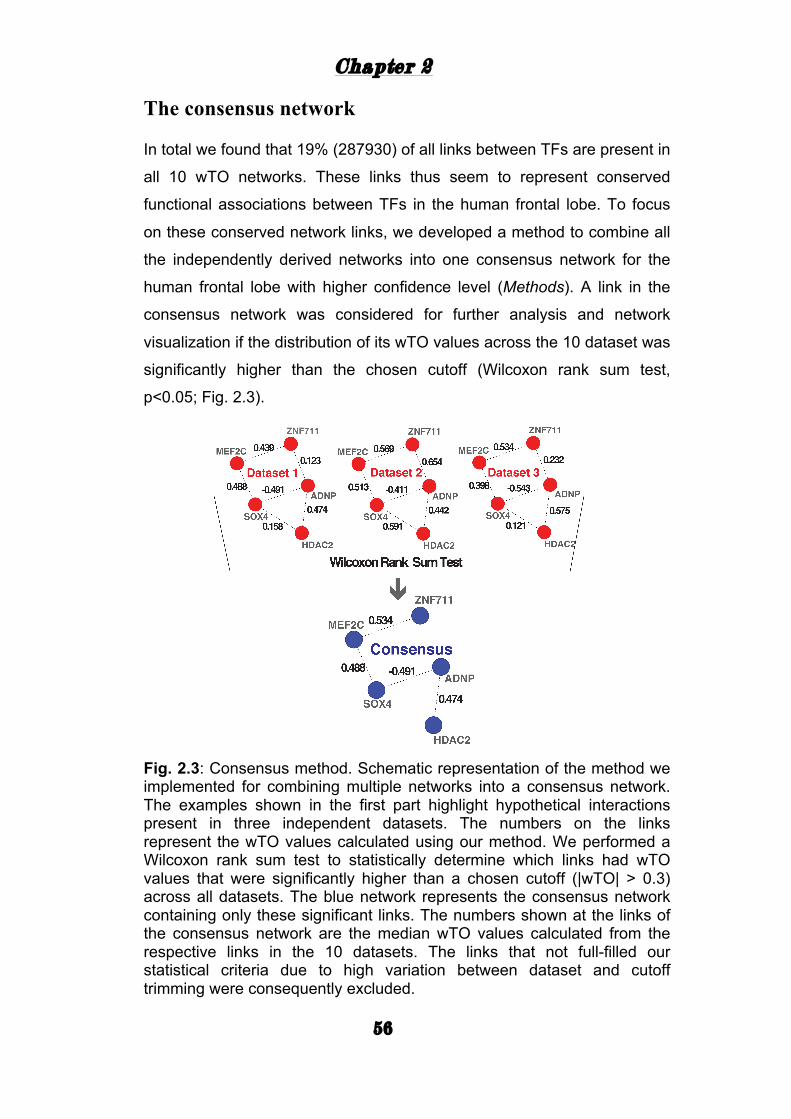
Chapter 2
56
The consensus network
In total we found that 19% (287930) of all links between TFs are present in
all 10 wTO networks. These links thus seem to represent conserved
functional associations between TFs in the human frontal lobe. To focus
on these conserved network links, we developed a method to combine all
the independently derived networks into one consensus network for the
human frontal lobe with higher confidence level (Methods). A link in the
consensus network was considered for further analysis and network
visualization if the distribution of its wTO values across the 10 dataset was
significantly higher than the chosen cutoff (Wilcoxon rank sum test,
p<0.05; Fig. 2.3).
Fig. 2.3: Consensus method. Schematic representation of the method we implemented for combining multiple networks into a consensus network. The examples shown in the first part highlight hypothetical interactions present in three independent datasets. The numbers on the links represent the wTO values calculated using our method. We performed a Wilcoxon rank sum test to statistically determine which links had wTO values that were significantly higher than a chosen cutoff (|wTO| > 0.3) across all datasets. The blue network represents the consensus network containing only these significant links. The numbers shown at the links of the consensus network are the median wTO values calculated from the respective links in the 10 datasets. The links that not full-filled our statistical criteria due to high variation between dataset and cutoff trimming were consequently excluded.
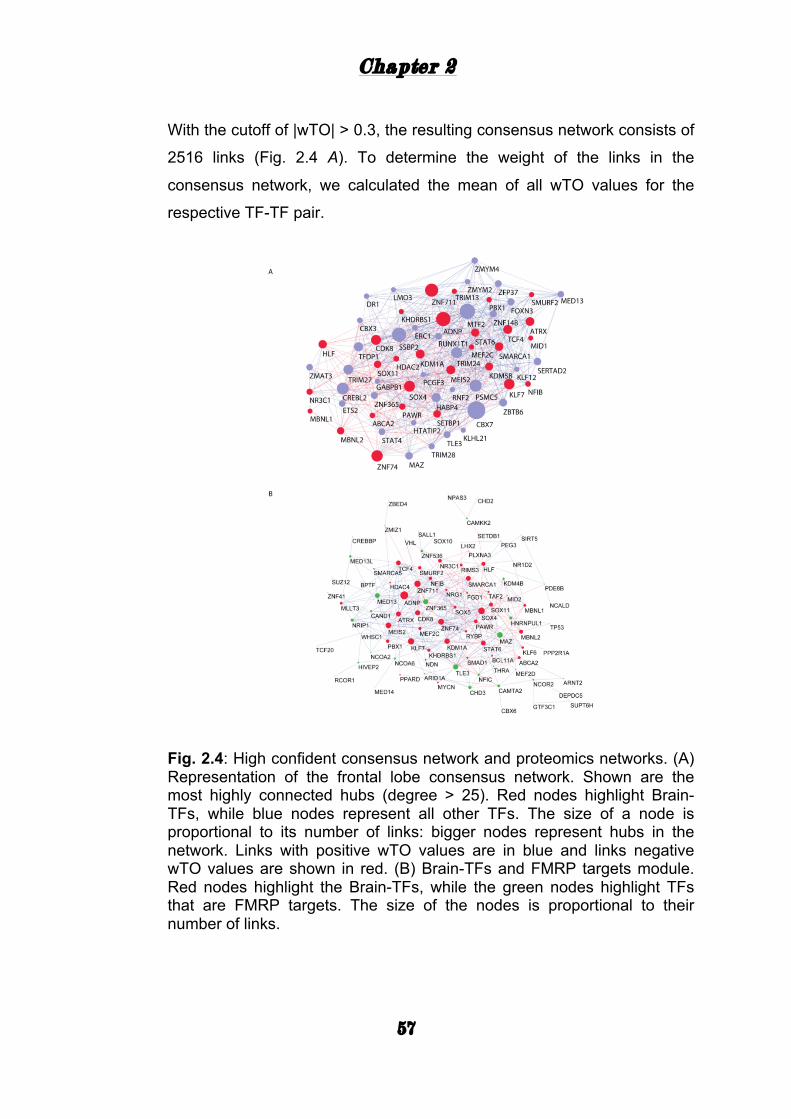
Chapter 2
57
With the cutoff of |wTO| > 0.3, the resulting consensus network consists of
2516 links (Fig. 2.4 A). To determine the weight of the links in the
consensus network, we calculated the mean of all wTO values for the
respective TF-TF pair.
Fig. 2.4: High confident consensus network and proteomics networks. (A) Representation of the frontal lobe consensus network. Shown are the most highly connected hubs (degree > 25). Red nodes highlight Brain-TFs, while blue nodes represent all other TFs. The size of a node is proportional to its number of links: bigger nodes represent hubs in the network. Links with positive wTO values are in blue and links negative wTO values are shown in red. (B) Brain-TFs and FMRP targets module. Red nodes highlight the Brain-TFs, while the green nodes highlight TFs that are FMRP targets. The size of the nodes is proportional to their number of links.
Chapter 2
58
The Brain-TFs and their role in the consensus network
Once generated this high confident consensus network, we analyzed how
the known Brain-TFs are integrated into this network. Of the total of 515
Brain-TFs, 127 are present in the consensus network. Interestingly, this
represents a significant enrichment of Brain-TFs among the 498 TFs of
the consensus network (Fisher exact test, p = 2.32 x 10-09, OR = 2.1).
Remarkably, the group of Brain-TFs has a higher connectivity (number of
links) compared to other TFs in the consensus network (Wilcoxon rank
sum test, p = 0.023). This finding suggests that known Brain-TFs have
stronger functional relationships amongst each other than other TFs in the
frontal lobe.
To investigate whether the TFs are also highly expressed at protein level
in a fetal or adult brain, we superimposed our consensus network with a
proteome map of the human brain at different stages, which was derived
using mass-spectrometry proteomics (Kim et al. 2014). This strategy
allowed us to understand the potential roles of the TFs in the period of
brain development and circuitry formation compared with an adult brain.
Interestingly, overall the TFs of our consensus network have higher
expression and significantly more links in the fetal module compared to
the adult module (Wilcoxon rank sum test, p = 0.006). The known Brain-
TFs are specifically enriched in the fetal module (Fisher exact test, p =
0.03, OR = 1.5) with generally higher number of links in comparison to
other TFs (Wilcoxon rank sum test, p = 0.002) (Fig. S2.2).
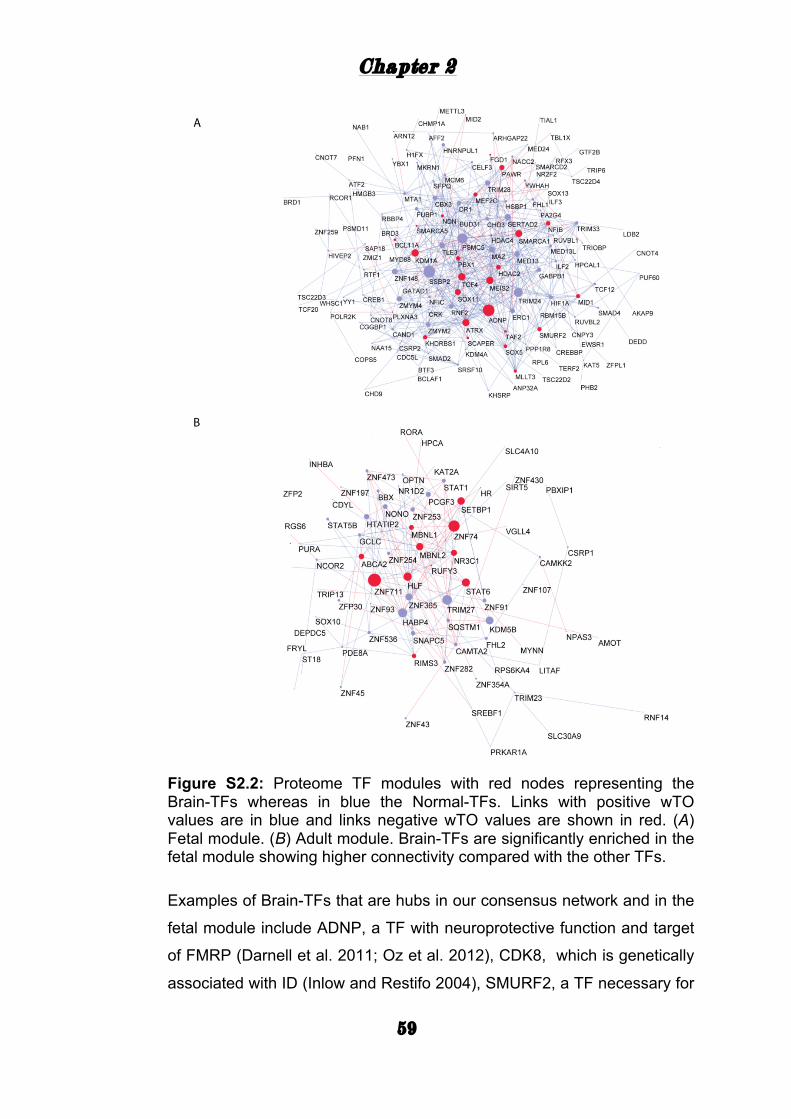
Chapter 2
59
Figure S2.2: Proteome TF modules with red nodes representing the Brain-TFs whereas in blue the Normal-TFs. Links with positive wTO values are in blue and links negative wTO values are shown in red. (A) Fetal module. (B) Adult module. Brain-TFs are significantly enriched in the fetal module showing higher connectivity compared with the other TFs.
Examples of Brain-TFs that are hubs in our consensus network and in the
fetal module include ADNP, a TF with neuroprotective function and target
of FMRP (Darnell et al. 2011; Oz et al. 2012), CDK8, which is genetically
associated with ID (Inlow and Restifo 2004), SMURF2, a TF necessary for
Chapter 2
60
establishing neuronal polarity (Schwamborn et al. 2007), TCF4,
associated with BD and SY (Zweier et al. 2007; Rosenfeld et al. 2009),
and ZNF711, which is associated with X-linked ID (Tarpey et al. 2009).
We next investigated the interactions between known Brain-TFs and
FMRP targets to find new candidate TFs with potential implication on brain
functions (Fig. 2.4 B). We found several FMRP targets that are strongly
connected with known Brain-TFs, such as ZNF365, a KRAB-ZNF that is
highly expressed in brain (Nagase et al. 1998), MED13, a subunit of the
mediator complex (Sato et al. 2004), MAZ, a myc-mediated zing finger
protein potentially implicated in neurodegeneration (Jordan-Sciutto et al.
2000), and TLE3, a member of the Notch signaling pathway (Fig. 2.4 B
and Fig. S2.3). Therefore, TFs like ZNF365, MED13, MAZ, and TLE3
might be crucially involved in controlling gene expression patterns with
importance for brain development and healthy cognitive abilities.
To confirm the transcriptional pathways suggested by our consensus
network, we examined whether there is enrichment of the TF binding sites
in the regulatory sequences of the 5421 genes that are correlated with at
least one of the 498 TFs of the consensus network. To this end, we first
performed a ChIP enrichment analysis (ChEA) using the updated
ENCODE database and a manually curated list of target genes uncovered
by ChIP-Seq, Chip-chip, ChIP-PET, and DamID from multiple studies
(Lachmann et al. 2010). We found that the TFBS of 55 TFs in the
consensus network are significantly enriched among the regulatory
sequences of the 5421 genes (p < 0.05 after Benjamini-Hochberg
correction). Among those 55 TFs, we found for instance a histone
deacetylase (HDAC2) involved in synaptic plasticity and neural circuits
(Guan et al. 2009), an activating transcription factor (ATF2) linked to
neuronal apoptosis and cell migration (Yuan et al. 2009), and a
chromodomain transcription factor (CHD2) implicated in ASD and epilepsy
(Rauch et al. 2012). Secondly, using the Jaspar and Jolma databases, we
found an enrichment of binding sites for 34 additional TFs of the
consensus network within the 2kb region upstream of the transcription
start site of the 5421 genes (Fisher exact test, p < 0.05 after Benjamini-
Chapter 2
61
Hochberg correction) (Jolma et al. 2013; Mathelier et al. 2013). Here, we
found enrichment for binding sites of ARNTL, a transcription factor
important for circadian rhythm associated with BD (Nievergelt et al. 2006),
MEF2D, a myocyte transcription factor involved in neuronal differentiation
and PD (Yang et al. 2009), and MEF2C, another myocyte transcription
factor involved in ASD, ID and epilepsy (Novara et al. 2010) among
others.
Coexpressed genes can also indicate protein interaction partners. Thus,
we next examined protein – protein interactions (PPI) among the 498 TFs
and the 5421 correlated genes utilizing the annotations from BioGRID and
InWeb (Stark et al. 2006; Chatr-Aryamontri et al. 2013). We found that
correlated TF-gene pairs were significantly enriched within the PPI
interactions (Fisher exact test, p = 2.2 x 10-06, OR > 3), thus providing an
additional confirmation of the potential functional interactions between TFs
and their correlated genes.
To infer more about the functions of the potential target genes of the TFs
in the consensus network, we performed a Gene Ontology (GO)
enrichment analysis among the 5421 genes correlated with at least one
TF in all 10 datasets (Methods). For this analysis, we ranked all genes
according to the number of TFs they are correlated with in each dataset
and then summarized the ranks across all datasets. We then tested for
GO enrichment among the genes with high ranked sums. We found
significant enrichment for genes involved in metabolism, signaling,
transport, translation, and RNA splicing (Fig. 2.5 A). Interestingly, these
GO categories seem to be important for several brain functions: for
instance translational mechanisms have been shown to play a role in
memory formation and synaptic plasticity (Richter and Klann 2009) and
RNA splicing mechanisms have been implicated in neuronal development
and ASD (Li et al. 2007; Weyn-Vanhentenryck et al. 2014).
We also specifically tested for GO enrichment of the genes correlated with
three Brain-TFs that are the strongest hubs in the consensus network:
ADNP, ZNF711 and ZNF74. We performed a hypergeometric test for each
dataset using the not-correlated genes as background. We then
Chapter 2
62
summarized the 10 lists of significant GO categories into one single list
per TF. Overall, we found similar GO groups enriched for these hubs like
we did for the consensus network as a whole. However, there were also
hub-specifically enriched GO categories such as brain development,
methylation, and regulation of synaptic transmission, which suggests a
specific role of these three TFs in the regulation of genes important for
these particular brain functions (Fig. 2.5 B, C, D). Our results together
indicate that the hub TFs of the frontal lobe consensus network are likely
to strongly interact to predominantly regulate metabolism, signaling,
splicing, and synaptic transmission in the frontal lobe.
Discussion
Understanding the characteristic complexity of cognitive disorders, such
as ASD and ID, still represents a challenge in neurosciences. In this study,
we specifically compiled a set of 515 “Brain-TF” genes implicated in brain
development and cognitive disorders to gain insights into which gene
regulatory mechanisms these genes may be involved in. We focused on
co-expression patterns in the frontal lobe, one of the main brain regions
associated with cognition and behavior. In particular, we developed a
method for integrating the information from 10 independent datasets
generated from frontal lobe expression studies, which allowed us to infer
TF interactions with statistically high confidence. In the TF consensus
network derived this way, we revealed a significant enrichment of Brain-
TFs, including TFs implicated in ASD, ID, or SY. Many Brain-TFs are
preferentially correlated with genes involved in functions such as
axonogenesis, brain development and synaptic transmission. The
structure and organization of the consensus network we are presenting
here provides insights into regulatory circuits and pathologies of the frontal
lobe.
In order to combine different datasets encompassing various biological
and technical variations we implemented a conservative strategy for
calculating a consensus network. This allowed us to infer consistent
Chapter 2
63
relationships between TFs associated with different functional processes
in human frontal lobes. Despite limitations in the currently available
functional information about TF genes, we validated some of the inferred
relationships. For example, we detected enrichment of TFBS for some
TFs with a known binding motif among the regulatory sequences of their
correlated genes and enrichment of known TF-TF protein interactions
among the links of our consensus network.
Remarkably, we found that Brain-TFs have significantly more links in the
frontal lobe consensus network than other TFs, demonstrating that they
are essential regulators of the molecular networks in the human frontal
lobe. Interestingly we further found that TFs that are involved in cognitive
disorders are among the most connected TFs in the frontal lobe network.
For instance, ZNF711, associated with ID (Tarpey et al. 2009), ADNP, a
neuroprotective protein involved in ID and ASD (Helsmoortel et al. 2014;
Iossifov et al. 2014), and ZNF74, a zinc finger protein involved in ID and
SY (Ravassard et al. 1999) are hubs in this network. The genes correlated
with those hubs are enriched for GO categories such as axon
development, brain development and regulation of synaptic transmission,
thus underlining their likely role in the human frontal cortex development
and functions. Another hub in our TF consensus network is MEF2C, a TF
that is important for synaptic plasticity and has been implicated in ASD
(Ebert and Greenberg 2013). Binding sites for MEF2C are significantly
overrepresented within the 2kb upstream region of the 5421 genes that
are common to all 10 individual networks. MEF2C is also strongly
associated with other Brain-TFs such as ZNF711, SOX11, SOX5, and
PBX1 defining a strongly interconnected module of TFs involved in
regulatory pathways that are controlling cognitive functions (Fig. S2.3).
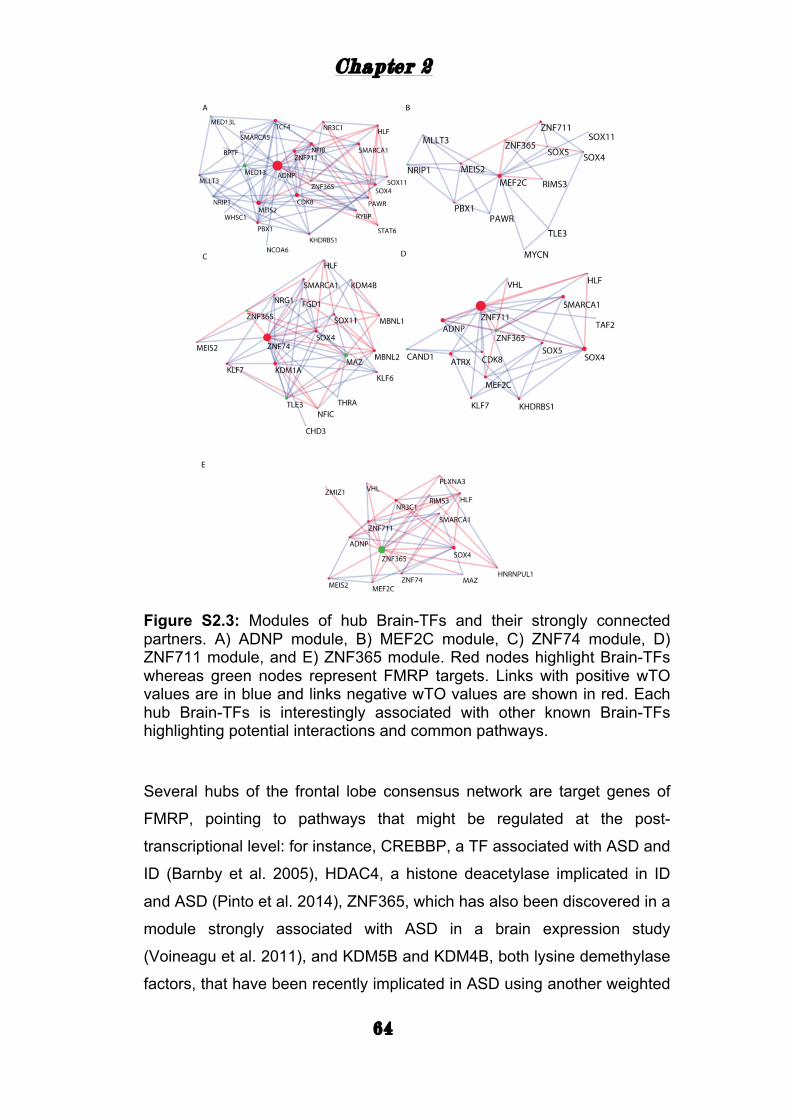
Chapter 2
64
Figure S2.3: Modules of hub Brain-TFs and their strongly connected partners. A) ADNP module, B) MEF2C module, C) ZNF74 module, D) ZNF711 module, and E) ZNF365 module. Red nodes highlight Brain-TFs whereas green nodes represent FMRP targets. Links with positive wTO values are in blue and links negative wTO values are shown in red. Each hub Brain-TFs is interestingly associated with other known Brain-TFs highlighting potential interactions and common pathways.
Several hubs of the frontal lobe consensus network are target genes of
FMRP, pointing to pathways that might be regulated at the post-
transcriptional level: for instance, CREBBP, a TF associated with ASD and
ID (Barnby et al. 2005), HDAC4, a histone deacetylase implicated in ID
and ASD (Pinto et al. 2014), ZNF365, which has also been discovered in a
module strongly associated with ASD in a brain expression study
(Voineagu et al. 2011), and KDM5B and KDM4B, both lysine demethylase
factors, that have been recently implicated in ASD using another weighted
Chapter 2
65
network approach (TADA) (De Rubeis et al. 2014; Iossifov et al. 2014). In
addition to discovering that Brain-TFs are overrepresented among the
hubs of our consensus network, we also found an enrichment of Brain-TFs
in the fetal proteome module, supporting the inference that these TFs
might regulate important processes during brain development (Fig. S2.2).
Given that links identified with our method are of high confidence and that
strong links indicate functional relationships between TFs, we can propose
novel candidate TFs for being important genes in controlling frontal lobe
functions. For example, ZNF365, a zinc finger protein, is a novel strong
candidate because it is strongly linked to many Brain-TFs in our network
and known to be a target of FMRP.
It is plausible that co-regulation between such novel candidates and Brain-
TFs might be implicated in multiple functional processes in the human
brain. Other studies have also suggested some TFs as novel candidates
for brain functions based on the analysis of co-expression modules
implicated in ASD (Voineagu et al. 2011; Parikshak et al. 2013). We are
supporting here several of these suggestions, as some of the same TFs
were detected as hubs in our consensus network: for instance, MAF, a
leucine zipper TF involved in cell differentiation (Blank and Andrews
1997), STAT4, a signal transducer involved in immune system
(Diefenbach et al. 1999), and CREBL2, a cAMP response element binding
protein involved in cell cycle and cell differentiation (Thomson et al. 2008).
Moreover some hub genes of our consensus network have recently been
implicated as ASD risk factors by de novo loss of function mutations (Liu
et al. 2014a), for instance ZMYM2, a zing finger associated with
myeloproliferative disorders (Smedley et al. 1998), and MED13L, a
subunit of the large mediator complex (Sato et al. 2004). Taken together,
we speculate that these TFs, which had not yet firmly been associated
with functions in the human brain, play important roles in the regulation of
frontal lobe functions and might also be involved in ASD and other
cognitive disorders.
A yet unanswered question is how the network that we described for the
human frontal lobe differs from the networks of other brain regions, tissues

Chapter 2
66
or species. We expect that the relevant data for addressing this question
will become available soon. We also expect that more TFs will be
discovered to be involved in brain functions. In future studies similar
strategies as we presented here can then be implemented to enrich our
knowledge about the molecular basis and regulatory networks underlying
cognitive abilities.
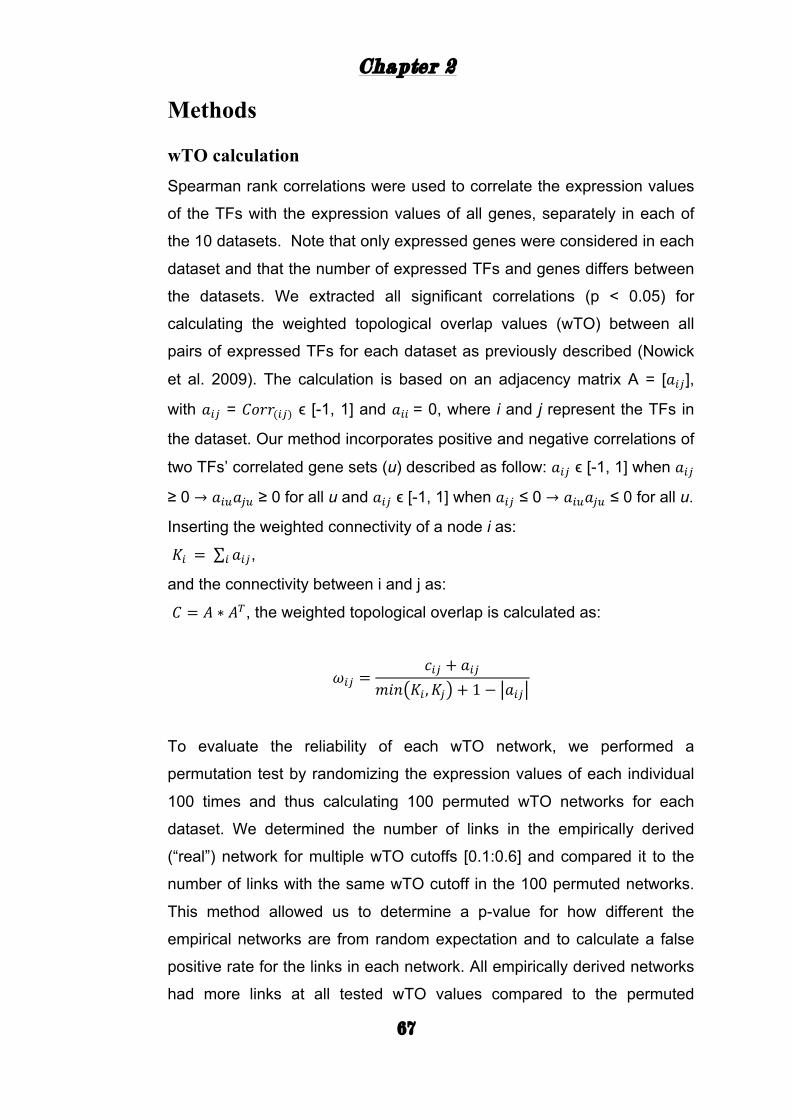
Chapter 2
67
Methods
wTO calculation Spearman rank correlations were used to correlate the expression values
of the TFs with the expression values of all genes, separately in each of
the 10 datasets. Note that only expressed genes were considered in each
dataset and that the number of expressed TFs and genes differs between
the datasets. We extracted all significant correlations (p < 0.05) for
calculating the weighted topological overlap values (wTO) between all
pairs of expressed TFs for each dataset as previously described (Nowick
et al. 2009). The calculation is based on an adjacency matrix A = [𝑎!"],
with 𝑎!" = 𝐶𝑜𝑟𝑟(!") ϵ [-1, 1] and 𝑎!! = 0, where i and j represent the TFs in
the dataset. Our method incorporates positive and negative correlations of
two TFs’ correlated gene sets (u) described as follow: 𝑎!" ϵ [-1, 1] when 𝑎!"
≥ 0 → 𝑎!"𝑎!" ≥ 0 for all u and 𝑎!" ϵ [-1, 1] when 𝑎!" ≤ 0 → 𝑎!!𝑎!" ≤ 0 for all u.
Inserting the weighted connectivity of a node i as:
𝐾! = 𝑎!"! ,
and the connectivity between i and j as:
𝐶 = 𝐴 ∗ 𝐴!, the weighted topological overlap is calculated as:
𝜔!" =𝑐!" + 𝑎!"
𝑚𝑖𝑛 𝐾! ,𝐾! + 1− 𝑎!"
To evaluate the reliability of each wTO network, we performed a
permutation test by randomizing the expression values of each individual
100 times and thus calculating 100 permuted wTO networks for each
dataset. We determined the number of links in the empirically derived
(“real”) network for multiple wTO cutoffs [0.1:0.6] and compared it to the
number of links with the same wTO cutoff in the 100 permuted networks.
This method allowed us to determine a p-value for how different the
empirical networks are from random expectation and to calculate a false
positive rate for the links in each network. All empirically derived networks
had more links at all tested wTO values compared to the permuted
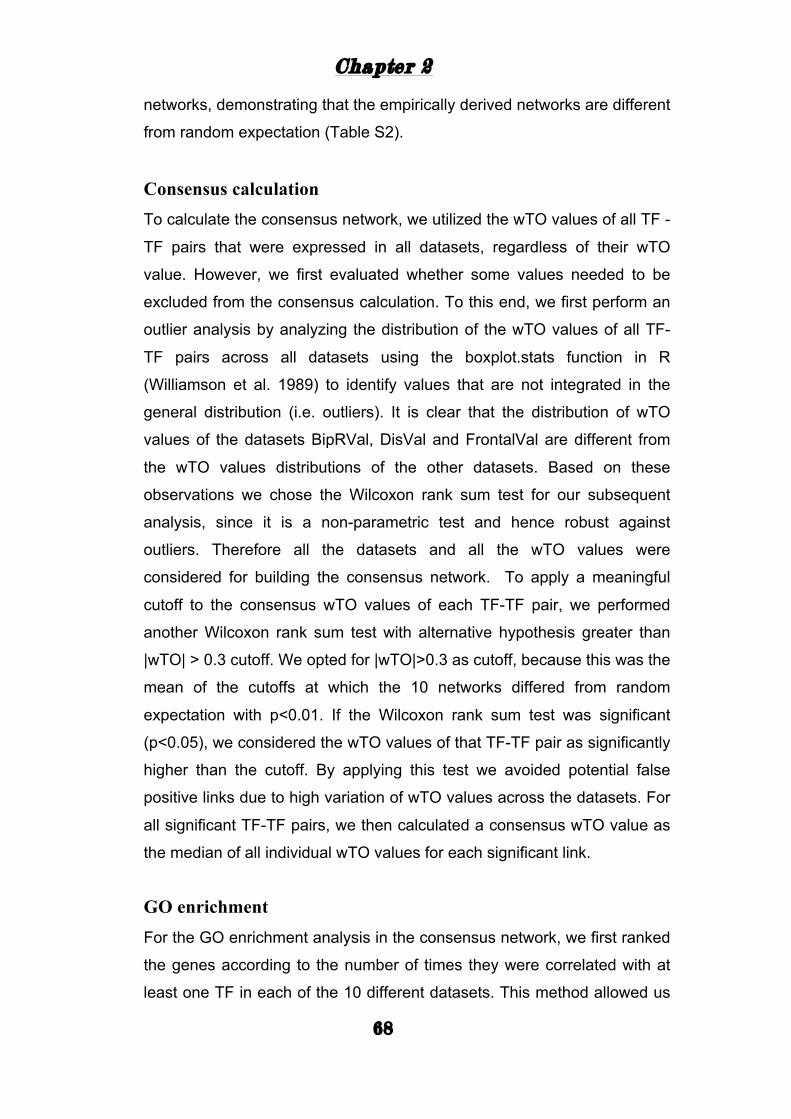
Chapter 2
68
networks, demonstrating that the empirically derived networks are different
from random expectation (Table S2).
Consensus calculation To calculate the consensus network, we utilized the wTO values of all TF -
TF pairs that were expressed in all datasets, regardless of their wTO
value. However, we first evaluated whether some values needed to be
excluded from the consensus calculation. To this end, we first perform an
outlier analysis by analyzing the distribution of the wTO values of all TF-
TF pairs across all datasets using the boxplot.stats function in R
(Williamson et al. 1989) to identify values that are not integrated in the
general distribution (i.e. outliers). It is clear that the distribution of wTO
values of the datasets BipRVal, DisVal and FrontalVal are different from
the wTO values distributions of the other datasets. Based on these
observations we chose the Wilcoxon rank sum test for our subsequent
analysis, since it is a non-parametric test and hence robust against
outliers. Therefore all the datasets and all the wTO values were
considered for building the consensus network. To apply a meaningful
cutoff to the consensus wTO values of each TF-TF pair, we performed
another Wilcoxon rank sum test with alternative hypothesis greater than
|wTO| > 0.3 cutoff. We opted for |wTO|>0.3 as cutoff, because this was the
mean of the cutoffs at which the 10 networks differed from random
expectation with p<0.01. If the Wilcoxon rank sum test was significant
(p<0.05), we considered the wTO values of that TF-TF pair as significantly
higher than the cutoff. By applying this test we avoided potential false
positive links due to high variation of wTO values across the datasets. For
all significant TF-TF pairs, we then calculated a consensus wTO value as
the median of all individual wTO values for each significant link.
GO enrichment For the GO enrichment analysis in the consensus network, we first ranked
the genes according to the number of times they were correlated with at
least one TF in each of the 10 different datasets. This method allowed us
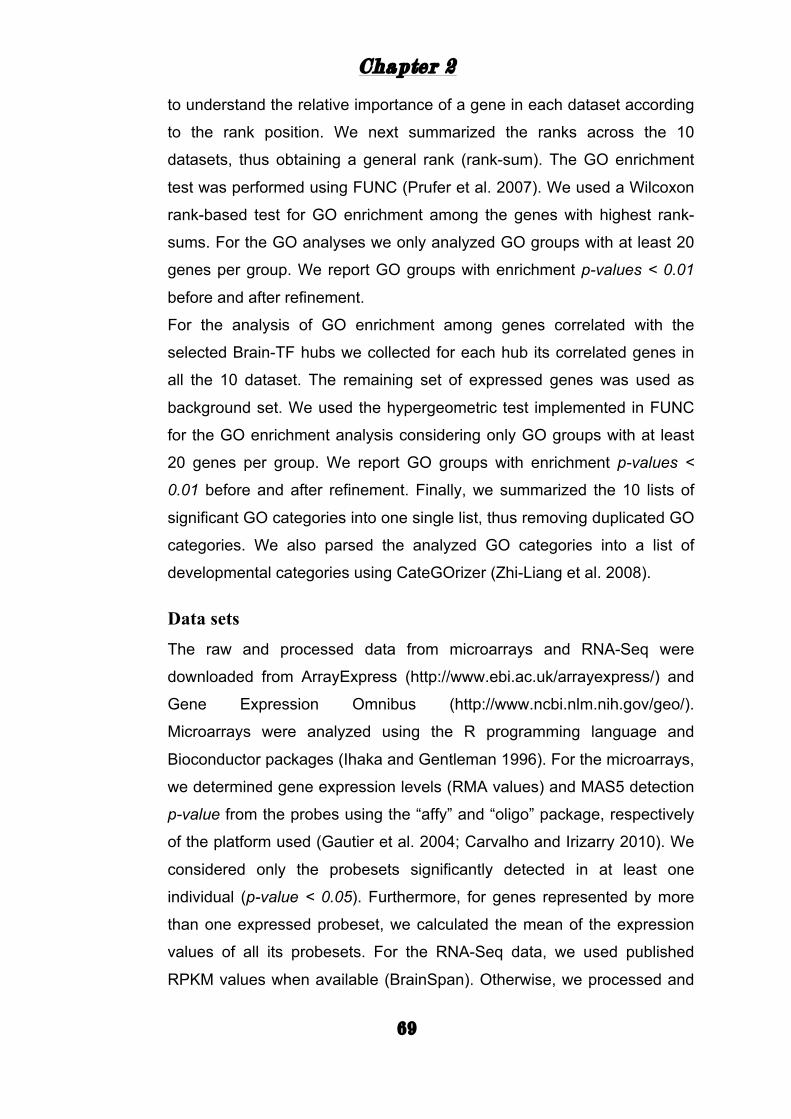
Chapter 2
69
to understand the relative importance of a gene in each dataset according
to the rank position. We next summarized the ranks across the 10
datasets, thus obtaining a general rank (rank-sum). The GO enrichment
test was performed using FUNC (Prufer et al. 2007). We used a Wilcoxon
rank-based test for GO enrichment among the genes with highest rank-
sums. For the GO analyses we only analyzed GO groups with at least 20
genes per group. We report GO groups with enrichment p-values < 0.01
before and after refinement.
For the analysis of GO enrichment among genes correlated with the
selected Brain-TF hubs we collected for each hub its correlated genes in
all the 10 dataset. The remaining set of expressed genes was used as
background set. We used the hypergeometric test implemented in FUNC
for the GO enrichment analysis considering only GO groups with at least
20 genes per group. We report GO groups with enrichment p-values <
0.01 before and after refinement. Finally, we summarized the 10 lists of
significant GO categories into one single list, thus removing duplicated GO
categories. We also parsed the analyzed GO categories into a list of
developmental categories using CateGOrizer (Zhi-Liang et al. 2008). Data sets The raw and processed data from microarrays and RNA-Seq were
downloaded from ArrayExpress (http://www.ebi.ac.uk/arrayexpress/) and
Gene Expression Omnibus (http://www.ncbi.nlm.nih.gov/geo/).
Microarrays were analyzed using the R programming language and
Bioconductor packages (Ihaka and Gentleman 1996). For the microarrays,
we determined gene expression levels (RMA values) and MAS5 detection
p-value from the probes using the “affy” and “oligo” package, respectively
of the platform used (Gautier et al. 2004; Carvalho and Irizarry 2010). We
considered only the probesets significantly detected in at least one
individual (p-value < 0.05). Furthermore, for genes represented by more
than one expressed probeset, we calculated the mean of the expression
values of all its probesets. For the RNA-Seq data, we used published
RPKM values when available (BrainSpan). Otherwise, we processed and
Chapter 2
70
analyzed the raw data by mapping of the reads using segemehl
(Hoffmann et al. 2009) and calculating RPKM values using R
programming language and R libraries such as GenomicRanges,
GenomicFeatures, and Rsamtools (Lawrence et al. 2013b). All the raw
data were mapped to the hg19 genome. All expression values were then
filtered for RPKM values > 0.5 for 90% of the samples. All samples were
used from the following datasets: FrontalVal [GSE25219] (Kang et al.
2011), NeoVal [GSE11512] (Somel et al. 2009), KhatVal [SRA028456]
(Somel et al. 2011), and GexVal [GSE22521] (Liu et al. 2012). Only the
data from the control individuals were selected from the DisVal
[GSE53987], BipRval [GSE53239] (Akula et al. 2014), and BipVal
[GSE5388] (Ryan et al. 2006) datasets. From the BrainSpan dataset we
selected the samples from the frontal lobe regions and subset them such
that individuals with same ages (13 total individuals per dataset) were
used. Network visualization For network visualization, we used Cytoscape 3.0. Node attributes were
used according to our manually curated Brain-TFs list, the Human
Proteome map (Kim et al. 2014), and the FMRP targets from Darnell et al.
(Darnell et al. 2011). TFBS enrichment For the TFBS enrichment, we focused on the 5421 genes that are
expressed in all datasets and correlated with at least one TF in each of the
10 different datasets. To test whether correlated genes might be target
genes of the respective TF, we performed a ChIP Enrichment Analysis
(ChEA) using the ENCODE database and data from Chip-Seq, Chip-Chip,
Chip-PET and DamID experiments (Lachmann et al. 2010). We also
performed a TFBS enrichment analysis using the Jolma and JASPAR
databases (Jolma et al. 2013; Mathelier et al. 2013). We tested for
enrichment of TFBSs included in those databases within the 2 kb
upstream region of the 5421 genes using the MEME algorithm (Bailey and
Elkan 1994). As background, we used the 2 kb upstream regions of the
Chapter 2
71
remaining protein coding genes, CpG islands, and the sequence of a
random chromosome (chromosome 20). Protein-Protein-Interactions enrichment Protein-Protein-Interactions (PPIs) were compiled from BioGRID and
InWeb using the method described in Perikshak et al. (2013). We used the
set of 5421 genes commonly expressed in all 10 datasets. Then we
determined the TF-gene pairs that were called to interact as proteins
according to BioGRID and InWeb (Rossin et al. 2011; Chatr-Aryamontri et
al. 2013). TF-gene pairs that were present in each of the 10 datasets and
were indicated to interact as proteins were then combined to a consensus
PPI network. Fisher’s exact test was used for testing the enrichment of
PPI in Brain-TFs and other TFs.

72
Chapter 3
73
CHAPTER 3
ZEB2 functional characterization: insight into
the evolution of the great-apes
Introduction
There is a strong association between TF and the genetic sequence it
binds and this relationship is essential to understand the difference and
evolution between species (Wray 2007; Wittkopp and Kalay 2012). Chip-
Seq studies have uncovered the evolutionary dynamics of TFs in multiple
species with distant relationship (Schmidt et al. 2010; Schwalie et al.
2013; Ballester et al. 2014) indicating a rapid species-specific gain and
loss of TF binding sites. Furthermore, functional enhancer has recently
emerged as undergoing a distinct evolutionary trajectories compared with
promoter regions, especially in tissues such as heart, liver, and brain
(Visel et al. 2013; Nord et al. 2015; Villar et al. 2015) emphasizing again
the potential changes in TF-DNA interactions between closely and
distantly related species. However the evolution of TF-DNA interactions
remains largely uncovered for most of the mammalian TFs.
Furthermore, comparison between human and non-human primates has
been focused mainly on histone modifications, methylation, and single TF
Chip-seq (Cain et al. 2011; Zeng et al. 2012; Schwalie et al. 2013; Wang
et al. 2015), leaving the majority of TFs largely unexplored in human
evolution.
To understand the evolutionary dynamics of gene regulatory mechanisms
in great apes, we functionally characterized a TF, ZEB2, in two cell-types
of human, chimpanzee and orangutan.
ZEB2 is a highly conserved protein characterized by two cluster of zinc
fingers (ZNF) separated by a homeodomain (Gheldof et al. 2012).
Chapter 3
74
We previously showed that ZEB2 has several human specific interactions
in human prefrontal cortex compared with chimpanzee, suggesting its role
in the human brain and potentially in the evolution of human specific
cognitive abilities (Nowick et al. 2009).
ZEB2 has been also implicated in T-cell differentiation (Chang et al. 2014),
in multiple cancers (Yoshihara et al. 2009; Nam et al. 2012), and neuronal
crest cell migration during embryonic development (Vandewalle et al.
2005; Vandewalle et al. 2009). Mutations and protein alteration of ZEB2
have been linked with Mowat-Wilson syndrome, congenital disease
associated with cranial malformations, microcephaly, and intellectual
disability (Cecconi et al. 2008; El-Kasti et al. 2012; Evans et al. 2012;
Buraniqi and Moodley 2015).
Taking these data together, we hypothesized that the transcriptional
mechanisms controlled by ZEB2 of key genes involved in human
neurodevelopment might have undergone a species-specific evolutionary
trajectory in great apes with changes in cis-regulatory elements bound by
ZEB2.
Due to the technical lack of great apes tissues and cell-types, we tested
this hypothesis by genome-wide binding of ZEB2 using chromatin immune
precipitation (ChIP) followed by sequencing in 3 immortalized
lymphoblastoid cell lines (LCLs) and 1 fibroblast cell line from human,
chimpanzee, and orangutan individuals, spanning 16 myr of great-apes
evolution. To confirm the target genes, we further reduced the expression
of ZEB2 in the same cell-lines via RNAi-mediated knock down and carried
out RNA-sequencing.
Using the combination of ChIP-seq and RNA-seq, we demonstrated that
ZEB2 showed gain and loss of candidate targets in species-specific
manner, highlighting the critical role ZEB2 might have played in human
evolution.
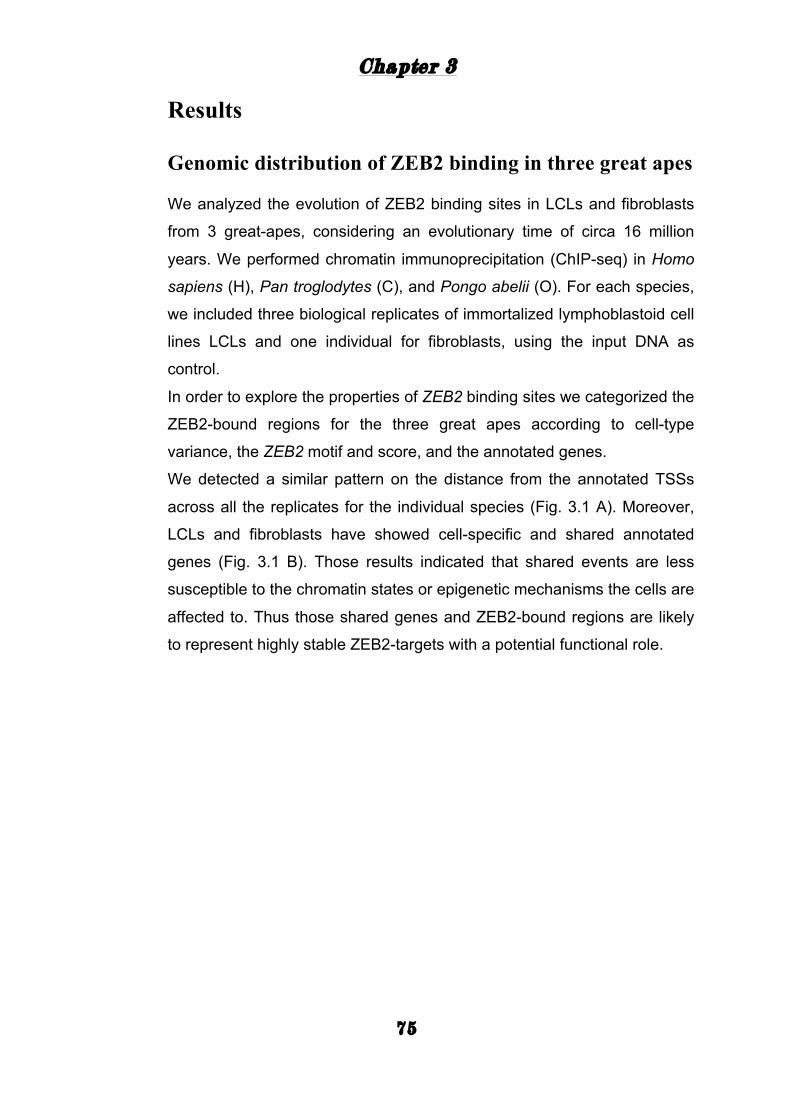
Chapter 3
75
Results
Genomic distribution of ZEB2 binding in three great apes
We analyzed the evolution of ZEB2 binding sites in LCLs and fibroblasts
from 3 great-apes, considering an evolutionary time of circa 16 million
years. We performed chromatin immunoprecipitation (ChIP-seq) in Homo
sapiens (H), Pan troglodytes (C), and Pongo abelii (O). For each species,
we included three biological replicates of immortalized lymphoblastoid cell
lines LCLs and one individual for fibroblasts, using the input DNA as
control.
In order to explore the properties of ZEB2 binding sites we categorized the
ZEB2-bound regions for the three great apes according to cell-type
variance, the ZEB2 motif and score, and the annotated genes.
We detected a similar pattern on the distance from the annotated TSSs
across all the replicates for the individual species (Fig. 3.1 A). Moreover,
LCLs and fibroblasts have showed cell-specific and shared annotated
genes (Fig. 3.1 B). Those results indicated that shared events are less
susceptible to the chromatin states or epigenetic mechanisms the cells are
affected to. Thus those shared genes and ZEB2-bound regions are likely
to represent highly stable ZEB2-targets with a potential functional role.
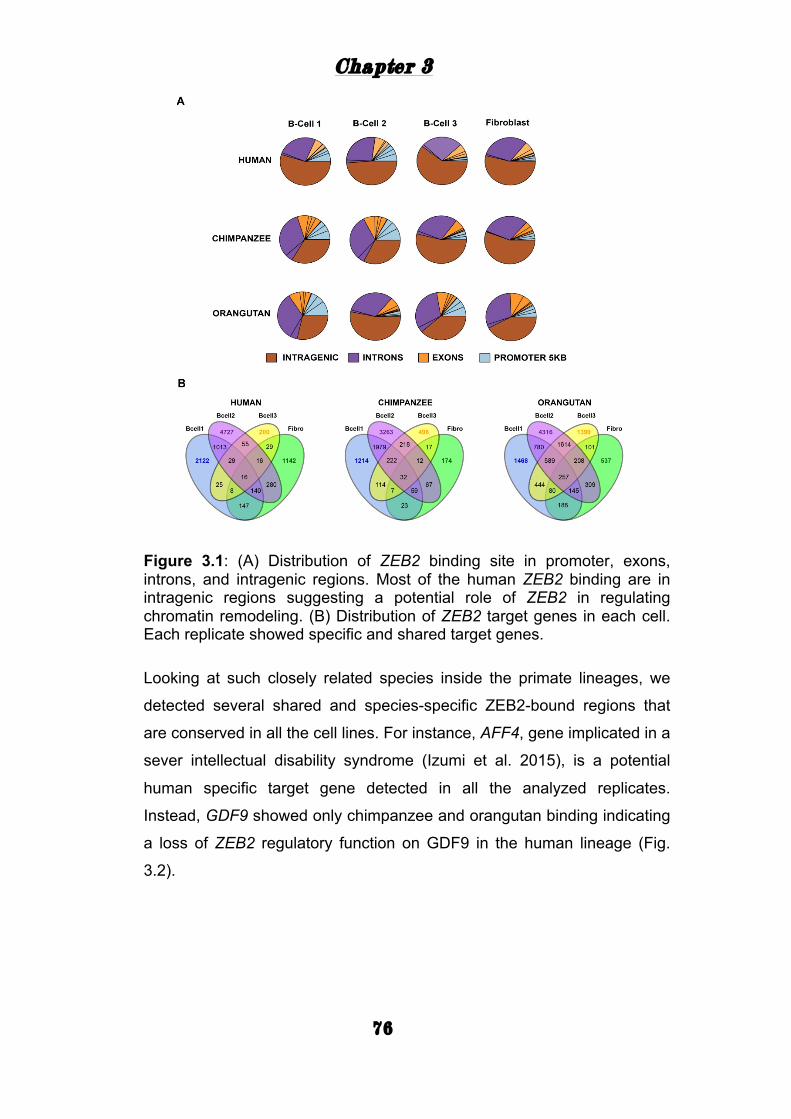
Chapter 3
76
Figure 3.1: (A) Distribution of ZEB2 binding site in promoter, exons, introns, and intragenic regions. Most of the human ZEB2 binding are in intragenic regions suggesting a potential role of ZEB2 in regulating chromatin remodeling. (B) Distribution of ZEB2 target genes in each cell. Each replicate showed specific and shared target genes.
Looking at such closely related species inside the primate lineages, we
detected several shared and species-specific ZEB2-bound regions that
are conserved in all the cell lines. For instance, AFF4, gene implicated in a
sever intellectual disability syndrome (Izumi et al. 2015), is a potential
human specific target gene detected in all the analyzed replicates.
Instead, GDF9 showed only chimpanzee and orangutan binding indicating
a loss of ZEB2 regulatory function on GDF9 in the human lineage (Fig.
3.2).
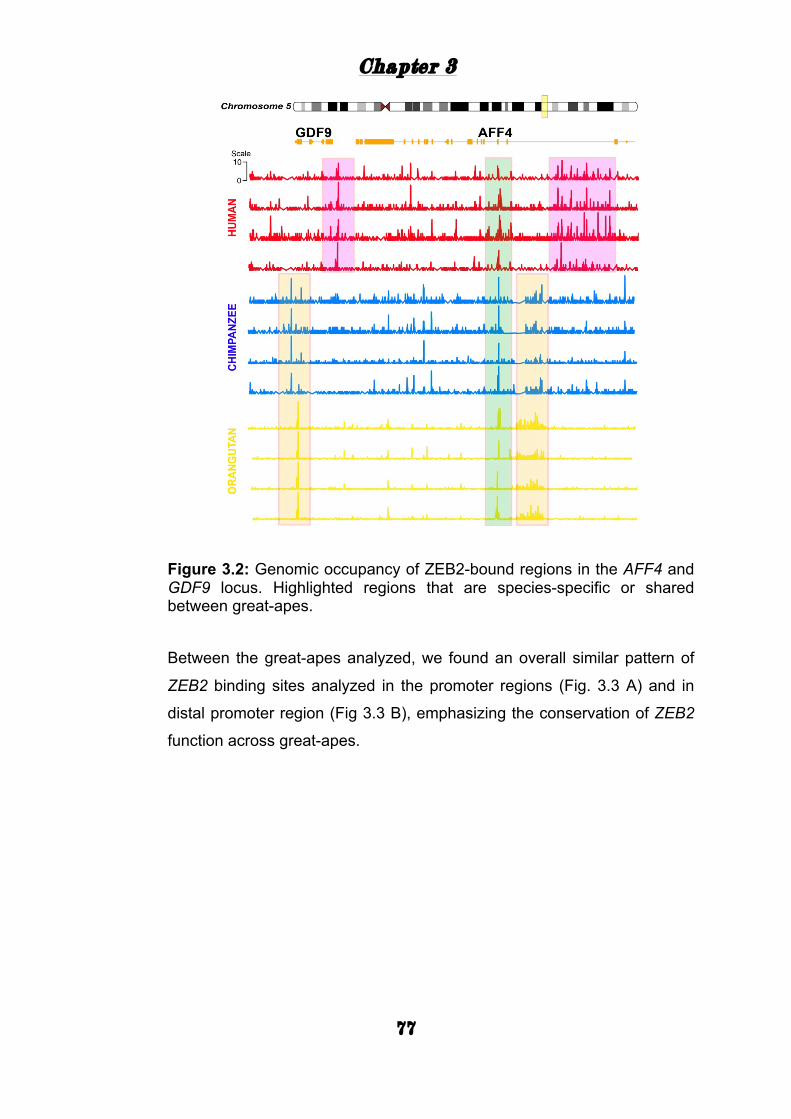
Chapter 3
77
Figure 3.2: Genomic occupancy of ZEB2-bound regions in the AFF4 and GDF9 locus. Highlighted regions that are species-specific or shared between great-apes. Between the great-apes analyzed, we found an overall similar pattern of
ZEB2 binding sites analyzed in the promoter regions (Fig. 3.3 A) and in
distal promoter region (Fig 3.3 B), emphasizing the conservation of ZEB2
function across great-apes.
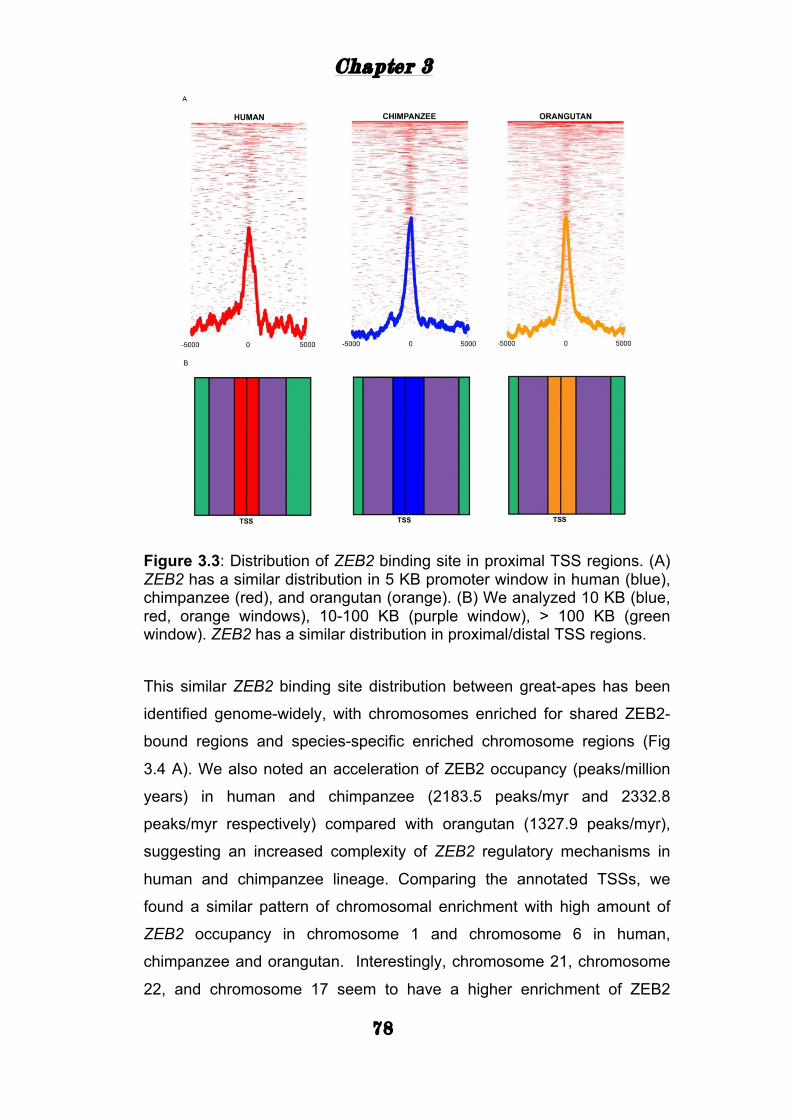
Chapter 3
78
Figure 3.3: Distribution of ZEB2 binding site in proximal TSS regions. (A) ZEB2 has a similar distribution in 5 KB promoter window in human (blue), chimpanzee (red), and orangutan (orange). (B) We analyzed 10 KB (blue, red, orange windows), 10-100 KB (purple window), > 100 KB (green window). ZEB2 has a similar distribution in proximal/distal TSS regions. This similar ZEB2 binding site distribution between great-apes has been
identified genome-widely, with chromosomes enriched for shared ZEB2-
bound regions and species-specific enriched chromosome regions (Fig
3.4 A). We also noted an acceleration of ZEB2 occupancy (peaks/million
years) in human and chimpanzee (2183.5 peaks/myr and 2332.8
peaks/myr respectively) compared with orangutan (1327.9 peaks/myr),
suggesting an increased complexity of ZEB2 regulatory mechanisms in
human and chimpanzee lineage. Comparing the annotated TSSs, we
found a similar pattern of chromosomal enrichment with high amount of
ZEB2 occupancy in chromosome 1 and chromosome 6 in human,
chimpanzee and orangutan. Interestingly, chromosome 21, chromosome
22, and chromosome 17 seem to have a higher enrichment of ZEB2
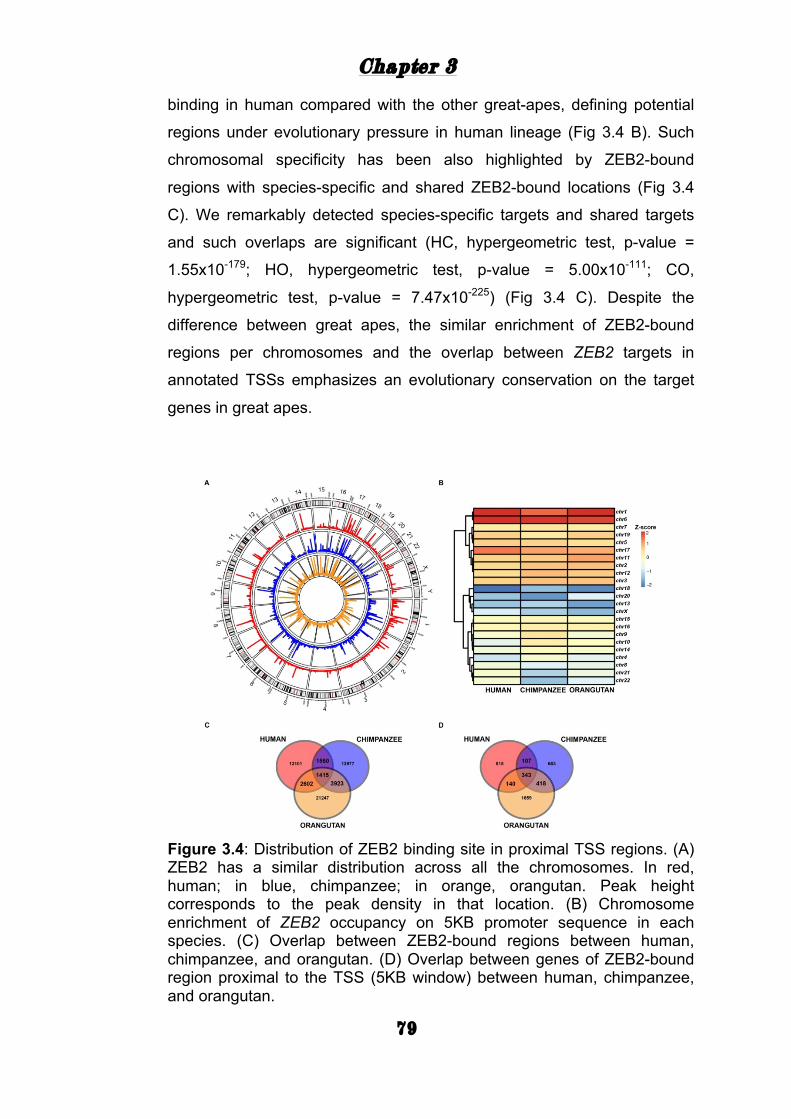
Chapter 3
79
binding in human compared with the other great-apes, defining potential
regions under evolutionary pressure in human lineage (Fig 3.4 B). Such
chromosomal specificity has been also highlighted by ZEB2-bound
regions with species-specific and shared ZEB2-bound locations (Fig 3.4
C). We remarkably detected species-specific targets and shared targets
and such overlaps are significant (HC, hypergeometric test, p-value =
1.55x10-179; HO, hypergeometric test, p-value = 5.00x10-111; CO,
hypergeometric test, p-value = 7.47x10-225) (Fig 3.4 C). Despite the
difference between great apes, the similar enrichment of ZEB2-bound
regions per chromosomes and the overlap between ZEB2 targets in
annotated TSSs emphasizes an evolutionary conservation on the target
genes in great apes.
Figure 3.4: Distribution of ZEB2 binding site in proximal TSS regions. (A) ZEB2 has a similar distribution across all the chromosomes. In red, human; in blue, chimpanzee; in orange, orangutan. Peak height corresponds to the peak density in that location. (B) Chromosome enrichment of ZEB2 occupancy on 5KB promoter sequence in each species. (C) Overlap between ZEB2-bound regions between human, chimpanzee, and orangutan. (D) Overlap between genes of ZEB2-bound region proximal to the TSS (5KB window) between human, chimpanzee, and orangutan.
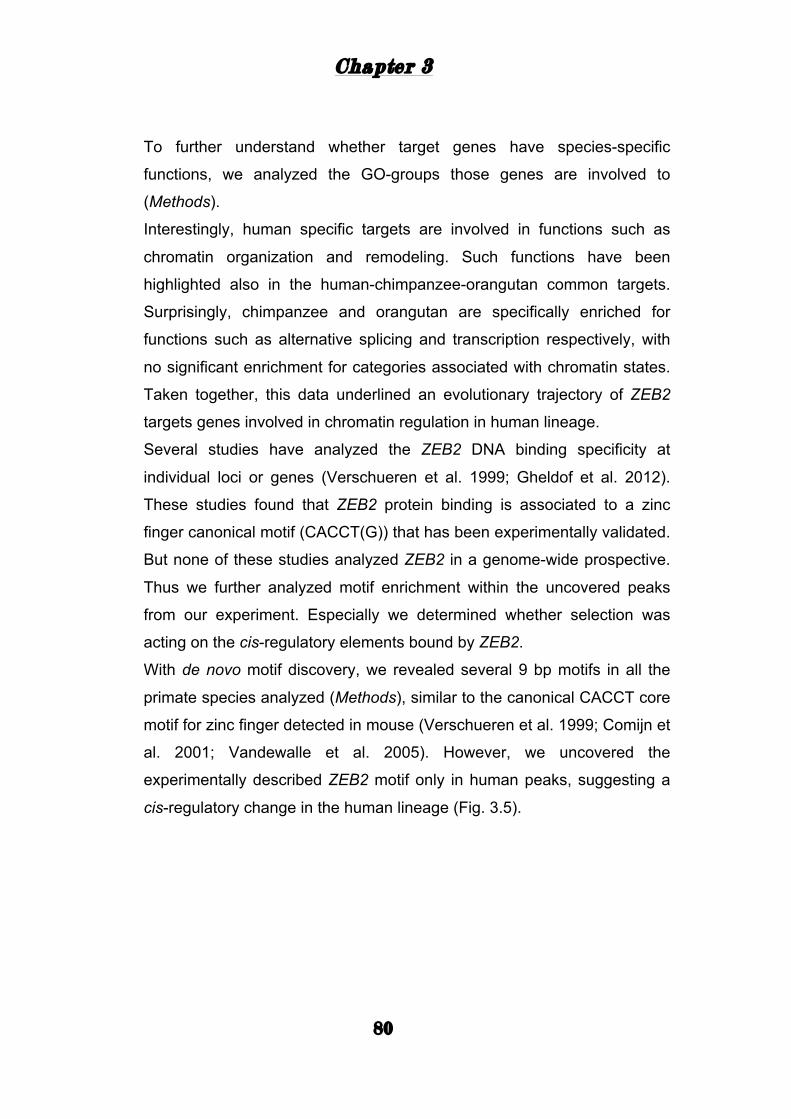
Chapter 3
80
To further understand whether target genes have species-specific
functions, we analyzed the GO-groups those genes are involved to
(Methods).
Interestingly, human specific targets are involved in functions such as
chromatin organization and remodeling. Such functions have been
highlighted also in the human-chimpanzee-orangutan common targets.
Surprisingly, chimpanzee and orangutan are specifically enriched for
functions such as alternative splicing and transcription respectively, with
no significant enrichment for categories associated with chromatin states.
Taken together, this data underlined an evolutionary trajectory of ZEB2
targets genes involved in chromatin regulation in human lineage.
Several studies have analyzed the ZEB2 DNA binding specificity at
individual loci or genes (Verschueren et al. 1999; Gheldof et al. 2012).
These studies found that ZEB2 protein binding is associated to a zinc
finger canonical motif (CACCT(G)) that has been experimentally validated.
But none of these studies analyzed ZEB2 in a genome-wide prospective.
Thus we further analyzed motif enrichment within the uncovered peaks
from our experiment. Especially we determined whether selection was
acting on the cis-regulatory elements bound by ZEB2.
With de novo motif discovery, we revealed several 9 bp motifs in all the
primate species analyzed (Methods), similar to the canonical CACCT core
motif for zinc finger detected in mouse (Verschueren et al. 1999; Comijn et
al. 2001; Vandewalle et al. 2005). However, we uncovered the
experimentally described ZEB2 motif only in human peaks, suggesting a
cis-regulatory change in the human lineage (Fig. 3.5).
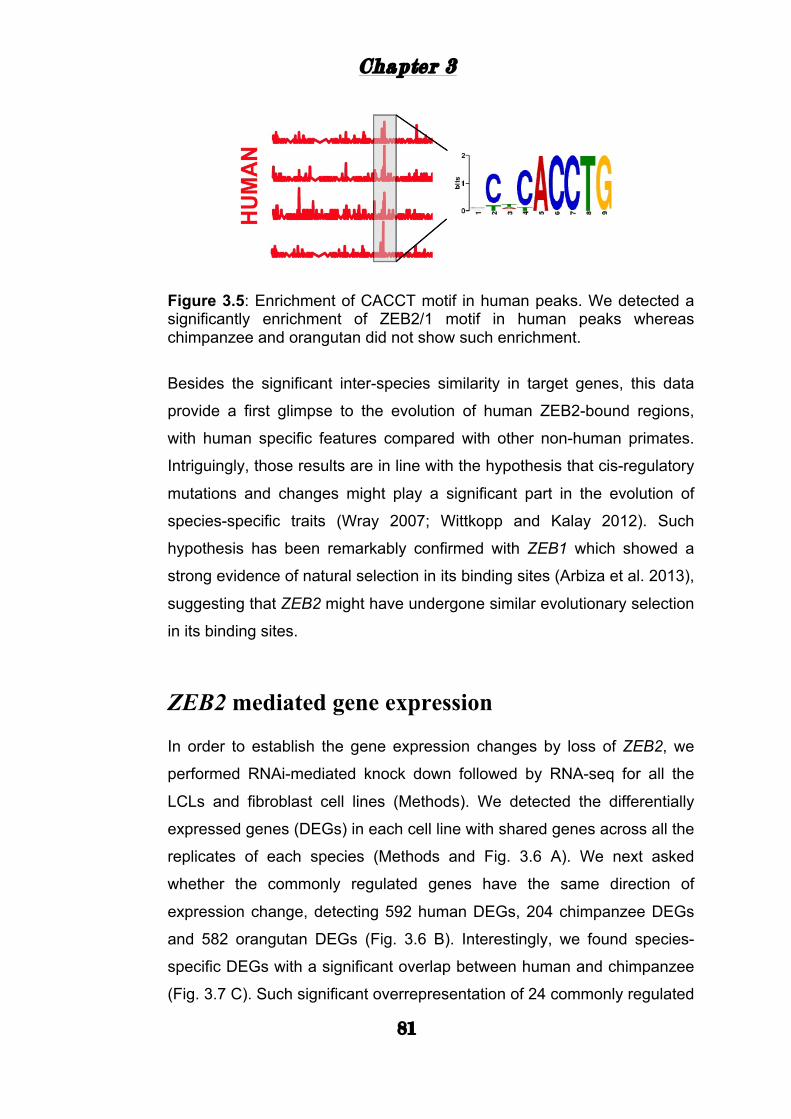
Chapter 3
81
Figure 3.5: Enrichment of CACCT motif in human peaks. We detected a significantly enrichment of ZEB2/1 motif in human peaks whereas chimpanzee and orangutan did not show such enrichment. Besides the significant inter-species similarity in target genes, this data
provide a first glimpse to the evolution of human ZEB2-bound regions,
with human specific features compared with other non-human primates.
Intriguingly, those results are in line with the hypothesis that cis-regulatory
mutations and changes might play a significant part in the evolution of
species-specific traits (Wray 2007; Wittkopp and Kalay 2012). Such
hypothesis has been remarkably confirmed with ZEB1 which showed a
strong evidence of natural selection in its binding sites (Arbiza et al. 2013),
suggesting that ZEB2 might have undergone similar evolutionary selection
in its binding sites.
ZEB2 mediated gene expression
In order to establish the gene expression changes by loss of ZEB2, we
performed RNAi-mediated knock down followed by RNA-seq for all the
LCLs and fibroblast cell lines (Methods). We detected the differentially
expressed genes (DEGs) in each cell line with shared genes across all the
replicates of each species (Methods and Fig. 3.6 A). We next asked
whether the commonly regulated genes have the same direction of
expression change, detecting 592 human DEGs, 204 chimpanzee DEGs
and 582 orangutan DEGs (Fig. 3.6 B). Interestingly, we found species-
specific DEGs with a significant overlap between human and chimpanzee
(Fig. 3.7 C). Such significant overrepresentation of 24 commonly regulated
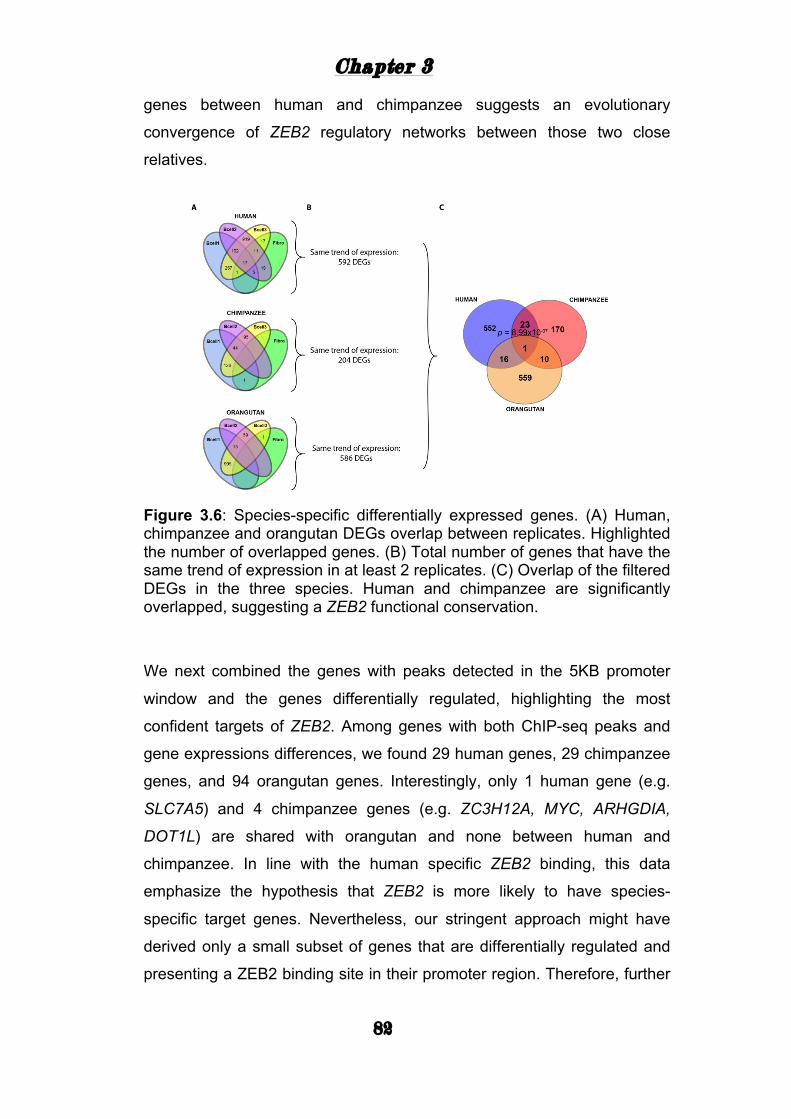
Chapter 3
82
genes between human and chimpanzee suggests an evolutionary
convergence of ZEB2 regulatory networks between those two close
relatives.
Figure 3.6: Species-specific differentially expressed genes. (A) Human, chimpanzee and orangutan DEGs overlap between replicates. Highlighted the number of overlapped genes. (B) Total number of genes that have the same trend of expression in at least 2 replicates. (C) Overlap of the filtered DEGs in the three species. Human and chimpanzee are significantly overlapped, suggesting a ZEB2 functional conservation.
We next combined the genes with peaks detected in the 5KB promoter
window and the genes differentially regulated, highlighting the most
confident targets of ZEB2. Among genes with both ChIP-seq peaks and
gene expressions differences, we found 29 human genes, 29 chimpanzee
genes, and 94 orangutan genes. Interestingly, only 1 human gene (e.g.
SLC7A5) and 4 chimpanzee genes (e.g. ZC3H12A, MYC, ARHGDIA,
DOT1L) are shared with orangutan and none between human and
chimpanzee. In line with the human specific ZEB2 binding, this data
emphasize the hypothesis that ZEB2 is more likely to have species-
specific target genes. Nevertheless, our stringent approach might have
derived only a small subset of genes that are differentially regulated and
presenting a ZEB2 binding site in their promoter region. Therefore, further
Chapter 3
83
tests and approaches are necessary to understand the complexity of
ZEB2 transcriptional regulation.
In human, ZEB2 occupies the regulatory elements near genes
differentially regulated that are implicated in neurodegenerative and
psychiatric disorders. For instance, ZEB2 actively regulate MTHFD1L,
which encodes for an enzyme involved in tetrahydrofolate synthesis in
embryonic stem cells (Christensen et al. 2005). MTHFD1L is upregulated
by loss of ZEB2 (log2FC = 0.48) suggesting ZEB2 as repressor of
MTHFD1L expression. Interestingly, loss and deletion of MTHFD1L are
associated with abnormal neural tube disorder, characterized by
exencephaly, embryonic lethality, and craniofacial defects (Momb et al.
2013; Momb and Appling 2014). Furthermore, knock-down of ZEB2
reduces the expression of PIP4K2A (log2FC = -0.28), a gene implicated in
cell proliferation and schizophrenia (Clarke and Irvine 2013; Kaur et al.
2014; Chan et al. 2015), and LMTK2 (log2FC = - 0.49), a gene coding for
a membrane kinase implicated in neurodegeneration (Rattray 2012).
Together these data indicate that ZEB2 has species-specific target genes
across multiple great-apes. Furthermore, ZEB2 has a dominant role in
human specific targets implicated in neurodevelopmental and
neurodegenerative disorders, indicating the critical role of ZEB2 in neural
functions.
Discussion
Here, we report our identification of ZEB2 targets genome-widely across 3
different great-apes, spanning circa 16 myr of evolution. Conservation of
ZEB2 protein suggests that the sequence/motif of ZEB2 binding sites
might be conserved across vertebrates (Gheldof et al. 2012). Our
interspecies comparison of ZEB2 binding in cell lines from human,
chimpanzee, and orangutan has revealed over 1400 promoter regions that
are shared between great-apes, highlighting highly conserved ZEB2
promoter regions. Despite such ZEB2 occupancy difference, we also
showed that ZEB2 significantly shared multiple annotated genes (5KB
Chapter 3
84
window) between human, chimpanzee, and orangutan. This data
demonstrated that the ZEB2 regulatory mechanisms for multiple genes
are conserved across great-apes. Nevertheless, we also noted multiple
species-specific ZEB2 targets, suggesting that ZEB2 might have a
different functions and regulation of species specific targets.
A recent study suggested that the transcription factor ZEB1 shows the
strongest evidence of natural selection in its binding site in humans
(Arbiza et al. 2013). In line with this, our comparative analysis revealed
species-specific ZEB2 motifs, with a surprising enrichment of the
CACCT(G) ZEB2 motif only in human linage. This data suggest that not
only ZEB1 but also ZEB2 binding sites might have undergone a natural
selection in human compared with other great-apes.
Human also showed specific peaks in the promoter regions for important
genes implicated in autism and intellectual disability. For example, ZEB2
occupancy has been found in promoter regions of human specific
candidate genes such as CNTN3, CNTN4, EPC2, SETD2 and MP2,
highlighting the role of ZEB2 in the transcriptional regulation of genes
implicated in such human specific disorders. Nevertheless, we also found
ZEB2 binding sites in great-apes conserved targets implicated in brain
functions such as ADORA3, EGR2, MEF2C, and SMG6. This data is in
line with the ZEB2 pathways in human brain, suggesting novel candidate
genes for such neurodevelopment function (Rogers et al. 2013; Buraniqi
and Moodley 2015; Hegarty et al. 2015). Our ChIP-seq analysis also
identified peak regions in the TSS of target genes of experimentally
identified ZEB2-targets. For example, ZEB2 peaks have been found in
mir200 promoter region in all the three great-apes. Remarkably, ZEB2 is
known to regulate mir200 during mesenchymal-to-epithelial transition and
neural induction (Xiong et al. 2012; Du et al. 2013; Wang et al. 2013a).
Moreover, ZEB2 binding sites have been detected in the promoter region
of E-cadherin 1 (CDH1) in human, chimpanzee, and orangutan.
Interestingly, CDH1 is a known target of ZEB2, implicated in cell-cell
adhesion and neural tube development and defects (Vandewalle et al.
2005; Goossens et al. 2011; Rogers et al. 2013). Taken together, the
Chapter 3
85
identification of ZEB2 targets strongly support the functional locations we
uncovered in this genome-wide multi-species study.
Due to the transcriptional function of ZEB2 and the lack of functionally
characterized target genes, we also investigated genes with expression
that is mediated by reducing ZEB2 expression. In human, we found
several genes implicated in brain development and functions. For
instance, we detected upregulation of genes such as SYNGAP1,
CC2D1A, FMR1, and DEAF1. Interestingly, CC2D1A has been implicated
in human social skills and intellectual disability (Basel-Vanagaite et al.
2006; Rogaeva et al. 2007; Manzini et al. 2014). FMR1 is an RNA binding
protein involved in mRNA stability, trafficking and splicing. FMR1 has been
also implicated in intellectual disability, affecting the mRNA stability of
genes important for human cognitive skills and brain development (Devys
et al. 1993; Brown et al. 2001; Darnell et al. 2011). These data emphasize
that loss of ZEB2 can affect the transcriptional mechanisms that regulate
important genes for human cognitive skills.
We additionally determined whether genes with ZEB2-bound promoter are
also affected by reducing ZEB2 expression. Interestingly, we found
several species-specific genes and some of them are really interesting. In
human, the promoter of MTHFD1L is bound by ZEB2 and MTHFD1L is
upregulated in decrease of ZEB2. MTHFD1L is a mitochondrial synthetase
highly expressed during embryogenesis in neural tube and developing
brain. Lack of MTHFD1L causes aberrant neural tube closure,
characterized by craniofacial abnormalities and severe exencephaly
(Christensen et al. 2005; Momb et al. 2013), overlapping with the etiology
of Mowat-Wilson syndrome (El-Kasti et al. 2012; Buraniqi and Moodley
2015). We argue that MTHFD1L is directly controlled by ZEB2 in human,
emphasizing their role in pathways involved in brain development and
cause severe pathophenotype if affected.
In summary, ZEB2 bound regions showed highly conserved but also
species-specific regions, suggesting common and different targets
controlled by ZEB2 in human, chimpanzee, and orangutan. Among the
annotated genes, we found novel and well-supported ZEB2 target genes
Chapter 3
86
in three great-apes analyzed. We uncovered genes implicated in human
brain disorder and cognitive skills, emphasizing the implication of ZEB2 in
brain functions. We also provided a first glimpse of ZEB2 binding site
evolution, with human specific ZEB2 binding sites. This data supports the
idea that cis-regulatory elements can drastically vary between closely and
distantly related species (Wray 2007; Wittkopp and Kalay 2012). In
addition, we also detected genes whose expression is mediated by
reducing ZEB2 expression. With this data, we provide novel targets of
ZEB2, several implicated in neuropsychiatric and neurodevelopmental
disorders, suggesting the key role of ZEB2 in human brain evolution and
functions.
Nevertheless, further characterization how those novel candidate targets
fit into the ZEB2 regulatory networks must be evaluated. Our analysis is
limited to cell-types which do not represent a complete tissue or organism.
Therefore, it is necessary to test such novel ZEB2 targets in different cell-
types or tissues to further confirm what we uncovered with this multi-
species study. It is also necessary to evaluate whether epigenetic
mechanisms are affecting the ZEB2 binding in different species.
However, this study serves as first glimpse to understand the
transcriptional mechanism controlled by ZEB2 and how those
transcriptional mechanisms have evolved in great-apes.
Methods
Cell lines Immortalized lymphoblastoid [Corriel instiand fibroblast cell lines were
obtained for 3 different primate species.
Lymphoblastoid cell lines were cultured in RPMI 1640 media [Sigma
Aldrich, cat: R0883] supplemented with 10% fetal bovine serum [Sigma
Aldrich, cat: F1051], 2mM L-glutamine [Sigma Aldrich, cat: G7513], and
5000 U/ml Pen/Strep [Sigma Aldrich, cat: P4333].
Fibroblast cell lines were cultured in DMEM media [Sigma Aldrich, cat:
D5546] supplemented with 10% fetal bovine serum [Sigma Aldrich, cat:
Chapter 3
87
F1051], 2mM L-glutamine [Sigma Aldrich, cat: G7513], 5000 U/ml
Pen/Strep [Sigma Aldrich, cat: P4333]. 1x10⁸ cells were crossed linked
with 1% formaldehyde.
ChIP-seq The ZEB2 antibody [Sigma Aldrich, cat: AV33694] was used for the
chromatin-immunoprecipitation. Chromatin-immunoprecipitation protocol
was adapted according to our conditions. Magnetic beads were used for
the immunoprecipitation. The immune-precipitated materials were end-
paired, A-tailed, ligated to a single-end sequencing adapter, amplified by
18 PCR cycle, and size selected (200-300 bp) followed by a single end
strand specific sequencing on a Illumina genome Analyzer II according to
the manufacturer’s instructions.
siRNA Design and Knockdown Briefly, a total number of three siRNAs sequences targeting ZEB2
transcripts were manually defined according to multi-species alignment:
ZEB2-1: 5`- GGCAUAUGGUGACACACAA - 3`
ZEB2-2: 5`- CUACGUACUUUAAUAGAUU - 3`
ZEB2-3: 5`- GAACAGACAGGCUUACUUA - 3`
50nM of siRNAs were transfected with 5ul DharmaFECT lipid transfection
reagent [LifeScience, cat: T-2001-01] in each cell respectively. RNA was
extracted after 6 hours with Quiagen RNAeasy kit by following the
manufacturer’s instructions. For RNA-seq analysis, we used two siRNAs.
ZEB2 knock-down was confirmed by qPCR.
Computational methods Computational analyses for ChIP-seq and RNA-seq were performed with
Python and R scripts, using packaged available in Bioconductor.
Read mapping and peak detection ChIP-seq and RNA-seq reads from LCL and Fibroblast datasets were
aligned using segemehl 0.2.0 (Hoffmann et al. 2009) to the following
genomes: human hg19, chimpanzee panTro3, and orangutan ponAbe2.
Chapter 3
88
Sequence and genomic annotation were downloaded from UCSC. Aligned
sequences were filtered for duplicates using Picard toolkit. For ChIP-seq
analysis, MACS 1.24 (Zhang et al. 2008) was used to detect the high
enriched peaks after IP. Naked DNA (input) was used as control for the
FDR cutoff. Peaks were merged across the replicates in each organisms
using bedtools (Quinlan and Hall 2010), defining a consensus list of peaks
for each species. Liftover toolkit was used to convert the chimpanzee and
orangutan coordinated to human hg19, due to the lack of annotation for
orangutan. Peaks annotation was performed using HOMER (Heinz et al.
2010).
For RNA-seq analysis, reads were count using own R scripts. Counts
were filtered by RPKM > 0.5 in either the control or treatment. For
differentially expression, we used the DESeq package (Anders and Huber
2012) and a own R script to detect the differentially expressed genes
across all replicates. For filtering, we applied a |log2FC| > 0.3 and FDR <
0.05.
Motif analysis To evaluate the motif enriched within the peaks, we used DREME (Bailey
2011) and XXmotifs (Luehr et al. 2012). Discovered motifs were further
confirmed using MEME (Bailey et al. 2009). Motifs enrichment were
additionally compared with ZEB1 ChIP seq using publically available data
from ENCODE and other sources using ChEA suite (Lachmann et al.
2010).
Functional enrichment Gene ontology enrichment were performer using FUNC (Prufer et al.
2007) and additional confirmation with GOstat (Beißbarth and Speed
2004) and GOrilla (Eden et al. 2009). We report GO groups with
enrichment p-values < 0.05 before and after refinement.

89
Conclusions
90
Summary, conclusions, and
future perspective Although knowledge about TFs is strikingly increasing, most of the TFs
regulatory mechanisms and cascades remain to be investigated,
especially with the respect of cell and tissue differences. Recent studies
have highlighted why TFs are important for cellular states and behavior
(Neph et al. 2012; Jolma et al. 2013; Bass et al. 2015; Nord et al. 2015),
but only a paucity of them focused on the evolution of transcriptional
regulatory mechanisms (Oldham et al. 2006; Nowick et al. 2009; Konopka
et al. 2012). Such lack of knowledge has driven my interests on the TFs
and how they are linked with our increased cognitive skills and brain
functions.
Transcription factors have been described as key elements in gene
regulatory networks in multiple species. Moreover, the understanding the
TF-TF relationships can help to evaluate and uncover potential key
regulators, contributing to highlight TF that are hubs on the complex
transcriptional network. Although the advent of large scale experimental
data such as RNA-seq, DNAase-Seq, and ChIP-seq helped to uncover the
TF-TF relationships (Neph et al. 2012; Jolma et al. 2013), we are still far
from understanding the complex transcriptional regulation and circuitry.
In this PhD thesis, we have developed and implemented a novel approach
to infer how the TFs interacts, how the TF-TF interactions evolve, which
TF is a hub, and how a human specific TF-hub has evolved in great apes.
Hereby, we first summarize the results, describing the three chapter of the
thesis. We then mention existing limitations and potential future direction
and perspective.
Conclusions
91
TF-TF relationships by co-expression
There is very little known behind the regulatory mechanisms the TF are
implicated to. As mentioned, one of the main limitations is due to the
experimental procedures that are directed to single TFs in a single cell-
type or tissue. Furthermore, such approaches are also limited to the
affinity of the antibody or reagents, to the chromatin state of that particular
cell or tissue, and the different activity of TFs in a particular cellular state.
Nevertheless, TF regulatory networks have been implicated in several
aspect of the cell such as chromatin and epigenetic states, imprinting a
particular “memory” to a cell that will affect the subsequent fate. Hence,
TF circuitries of a specific cell type or tissue are often involved in
development (Davidson et al. 2002; Neph et al. 2012; Nord et al. 2015;
Shibata et al. 2015), pluripotency (Chen et al. 2008; Kim et al. 2008;
Kushwaha et al. 2015; Lopez-Pajares et al. 2015), cell differentiation (Lin
et al. 1996; Somasundaram et al. 2015), regulating the expression of
genes implicated in such pathways.
Despite the important function of the TFs in development and gene
regulation, the TFs circuitries are presently poorly characterized, lacking
information on interactions and experimentally confirmed pathways.
Due to those several limitations, we sought here to develop approached to
statistically analyze the TFs co-expression networks in multiple tissues
and species, highlighting the power of co-expression networks from
genome-wide expression data.
As previously described, the first chapter evaluated the TF-TF interactions
on expression data and showed which interactions are conserved across
primate species and which interactions have changed species-specifically.
The interactions were inferred based on a wTO method specifically
developed for TFs and are suitable for any cellular and tissue state the
genome-wide expression data is based on.
The networks we described in the first chapter for the three primate
species provide an extensive description of TF regulatory mechanisms
and dynamics in brain and non-brain tissues, emphasizing the
Conclusions
92
conservation and gain-or-loss of TF-TF interactions. By an inter-species
filtering, we provide an extensive description of the TF circuitry evolution in
PFC, a brain region strongly associated with human specific skills and
cognitive abilities. We also provided an inference of ancestral network,
pointing out which TF-TF interactions are based on identical trend of
correlation between three species. This allowed us to detect not only
species-specific links but also such TF-TF interactions that are strikingly
conserved in primate evolution. Such inter-species approach has
uncovered novel and well-characterized TF-TF interactions, some of them
really interesting. For instance, MEF2C is a TF implicated in memory
formation, synaptic plasticity, and several disorders such as autism and
intellectual disability (Lin et al. 1996; Flavell et al. 2008; Novara et al.
2010; Saitsu et al. 2011). In the provided TF networks, MEF2C interacts
with HIRA, implicated in neural crest cell migration and DiGeorge
syndrome (Wilming et al. 1997; Magnaghi et al. 1998) and HDAC9, a
histone deacetylase involved in developing brain and autism (Sugo et al.
2010; Pinto et al. 2014). Such interactions are strongly conserved in
human and chimpanzee lineage but not in rhesus macaque, emphasizing
an evolutionary trajectory of such TF-TF interaction in great apes.
Furthermore, those interactions have been experimentally characterized in
other tissues (Haberland et al. 2007; Yang et al. 2011), providing novel
pathway and role of such TF-TF interactions in PFC.
We also observed that human networks often have higher connectivity
compared with the other non-human primates, highlighting a rapid gain of
links in the human lineage. Another striking observation is the difference in
connectivity between tissues. Remarkably, we found that TF circuitry have
higher connectivity in brain tissues compare with kidney and muscle.
Remarkably, human showed higher connectivity compared with
chimpanzee in all the brain regions analyzed.
In addition, using the expression changes, we have provided another
important approach to mine such genome-wide expression data from adult
and developing PFC. Briefly, we defined the TF-TF interactions using a
species-specific expression filtering. For instance, we considered the only
Conclusions
93
positive correlation between TF and gene both up or down regulated in
human. On the other hand, we considered only negative correlation where
TF and genes have opposite species-specific expression. We called the
resulting networks EC-sub-networks and we defined only the TF-TF
interactions where TFs can act as activator (TF up – positive correlation –
Gene up) or repressor (TF up – negative correlation – Gene down) of
gene expression. We observed a strong gain of interactions in the human
EC-sub-networks compared with chimpanzee EC-sub-networks.
Furthermore, human networks are uniquely enriched for such TF
important for brain functions (brain-TFs), such as CLOCK, ZNF536,
CC2D1A emphasizing the role of such TFs in TF circuitry that might be
involved on human brain functions and disorders.
Although the network evolution and EC-sub-networks highlighted several
“Brain-TF” significantly enriched in the human PFC networks, it is currently
unclear whether such “brain-TFs” are “master regulators” of human PFC
gene regulatory mechanisms.
To answer this question, in the second chapter we provided a high-
confidence human frontal lobe consensus network to further identify and
analyze TFs with potential implications in cognitive skills and disorders.
The consensus network is based on merely 2516 interactions between
TFs across 10 different genome-wide expression studies of human frontal
lobe, emphasizing differences derived by single and independent data.
Moreover, in this particular study, we aimed to integrate such brain-TFs
and understand whether they have a central role in the consensus
network. To answer this question, we assembled a list of TFs important for
brain function, development, and disorders, screening multiple
independent sources. In total, we found 515 brain-TFs. In addition, we
catalogued the TFs that are targeted by FMRP, important RNA binding
protein implicated in intellectual disability (Darnell et al. 2011), detecting
120 additional TFs.
Interestingly, brain-TFs are enriched in the consensus network and they
have an overall higher connectivity compared with the other TFs,
suggesting a central hub role in the human frontal lobe. In addition, we
Conclusions
94
found that brain-TFs are remarkably crucial for the TF circuitry architecture
during frontal lobe fetal development compared with adult, underlining
what we previously suggested with the human developmental PFC
network. The consensus network provided novel pathways in which brain-
TFs might be involved. For instance, we found that MEF2C is strongly
associated with other brain-TFs such as ZNF711, SOX11, SOX5, and
PBX1. Interestingly, MEF2C is known to interact with SOX transcription
factors family members to activate neurons during development (Chan et
al. 2015). Moreover PBX1 is differentially expressed after MEF2C-shRNA
mediated knock down (Chan et al. 2015). We therefore argued that
MEF2C and the features of the brain-TFs in human frontal lobe consensus
network might be implicated in such regulatory pathways that control brain
and cognitive functions. Since we found that brain-TFs are important for
the human PFC circuitry and evolution, the consensus network further
confirm the central role of such TFs in circuitry and regulation of human
frontal lobe.
The examples provided in this thesis showed how the TF circuitries are
important in brain tissues, particularly the human PFC, and how TF
interactions are conserved or evolved lineage-specifically. We also
provide a first glimpse of the brain-TFs as central hub of the TF circuitries
in human PFC networks. The drastic enrichment of brain-TFs connectivity
provides a novel function of such TFs in the gene regulatory mechanisms.
Thus, we hypothesized that such complex regulatory mechanisms and
pathways controlled by brain-TFs might be remarkably implicated in the
human cognitive skills and disorders.
ZEB2: a transcription factor important for human
brain evolution and functions.
In the first two chapters, we described network and system level
frameworks to infer how TFs have contributed to the evolution of cognitive
skills and brain functions linked with human frontal lobe. In those complex
Conclusions
95
biological networks, we determined TFs that gained species-specific links
and TFs that are central hub in the TF circuitries. Thus, such approaches
offered a relatively big picture of the TF regulatory networks, pointing out
several candidates for human PFC functions. However, for many TFs it is
still not understood the complex transcriptional mechanisms they control,
lacking on experimentally validated target genes and pathways. For
instance, several brain-TFs have been implicated in a patho-phenotype by
single nucleotide polymorphisms or de novo mutations (Ravassard et al.
1999; Basel-Vanagaite et al. 2006; De Rubeis et al. 2014). Therefore,
ChIP-seq and other NGS technologies such as DNAaseI footprints are
necessary to further provide functional targets of brain-TFs that are central
node in TF networks, emphasizing their role in the regulation of important
brain pathways.
Nevertheless, one of the current bottlenecks in studying transcriptional
networks is that prediction from such hub detection using network biology
level (Oldham et al. 2006; Nowick et al. 2009; Konopka et al. 2012;
Parikshak et al. 2013; Bakken et al. 2015) are generally dissociated from
further experimental evaluation.
To fill the gap between network biology predictions and experimental level,
in the third chapter we aimed to functionally characterized one of the most
interesting TF, ZEB2, that gained a significant number of links in human
specific PFC network compared with chimpanzee (Nowick et al. 2009).
Such ZEB2 human specific enriched interactions emphasize pathways
that might have shaped such cognitive skills linked with PFC.
ZEB2 is a TF member of the ZEB family that plays an important role in the
development of mammalian embryos (Goossens et al. 2011). Such
function is directed to the formation and characterization of the neural
cress cells, in which ZEB2 transcriptional program is implicated in
migration and cellular fate (Vandewalle et al. 2005; Vandewalle et al.
2009; Goossens et al. 2011; Ohayon et al. 2015). ZEB2 is a complex
transcription factor, consisting in two clusters of C2H2-type zinc finger
domains with a central homeodomain. It is known that ZEB2 repressed
their target genes binding with the two zing finger clusters to a tandem
Conclusions
96
separated E-box-like sequences (CACCT(G)/CACCANNT(G)) while the
homeodomain is thought to be responsible for protein-protein interactions
(Verschueren et al. 1999; Comijn et al. 2001; Gheldof et al. 2012). Such
ZEB2 zinc finger have a high degree of sequence similarity (circa 90%)
with ZEB1, paralogs of ZEB2, suggesting their similar binding affinity to
the DNA (Gheldof et al. 2012). ZEB2 is known to interact with SMADs
transcription factors by the SDB domain, regulating in the TGF(Beta)
signaling pathway, important for nervous system development, specifically
in neural tube and neural crest (Xiong et al. 2012; Hegarty et al. 2015).
Another important aspect of ZEB2 is its implication in Mowat-Wilson
syndrome, a sever disorder characterized by microcephaly, intellectual
disability, and facial malformations (Cecconi et al. 2008; El-Kasti et al.
2012; Evans et al. 2012; Buraniqi and Moodley 2015).
Nevertheless, the regulatory program controlled by ZEB2 is still far-
understood, lacking in specific target and evolutionary trajectory of the
binding sites. Therefore, we aimed to functionally characterized ZEB2,
using multiple primate species and evaluate the evolutionary pressure in
the cis-regulatory elements bound by ZEB2. Using recent NGS
technologies as ChIP-seq and RNA-seq, we have been capable to
uncover the ZEB2 target genes in human, chimpanzee, and orangutan
biological replicates of LCLs and fibroblasts, spanning circa 16 million
years of evolution.
Interestingly, we identified several ZEB2-bound regions that are shared
and species-specific between great-apes at chromosomal and gene
levels. Such shared regions highlighted great-apes common genes with
ZEB2 occupancy in the promoter regions implicated in histone
modification and plasticity. Intriguingly, human specific targets showed a
similar enriched function, suggesting an evolutionary trajectory in human
lineage. Interestingly, histone modification and plasticity have been linked
to several human specific cognitive skills such as memory, social
behavior, and emotions (Levenson et al. 2004; Guan et al. 2009;
McQuown et al. 2011; Peixoto and Abel 2013), underlining the ZEB2
function in human brain formation and evolution (Vandewalle et al. 2005;
Conclusions
97
Nowick et al. 2009; Buraniqi and Moodley 2015; Hegarty et al. 2015).
Furthermore, the human lineage trajectory has been emphasized also at
TFBS level, with a human specific enrichment of CACCT(G) known ZEB2
motif. Thus, we speculated that such trajectory might be caused by cis-
regulatory difference in the binding sites between human and other great-
apes, confirming the potential role of ZEB2 in human evolution.
Combining the ChIP-seq and the siRNA knock down followed by RNA-
seq, we further defined ZEB2 targets that are also differentially regulated
by decrease of ZEB2 protein expression. Using this approach, we have
been able to functionally characterized novel putative and high confident
target of ZEB2. Among those, we identified MTHFD1L, a human specific
down-regulated target of ZEB2. Interestingly, MTHFD1L is associated with
a human sever brain disorder, characterized by exencephaly, craniofacial
abnormalities, and neural tube defects. Due to the significant overlap
between Mowat-Wilson syndrome and MTHFD1L patho-phenotypes, we
argued that ZEB2-MTHFD1L interplay is strongly linked with human brain
development and functions.
In summary, this is the first known quantitative and qualitative evolutionary
analysis of ZEB2 that identified gain or loss targets during great-apes
evolution. Moreover, this data emphasize the role of ZEB2 in brain
development, detecting novel and well-characterized targets that are
implicated in brain function and disorder. This project has remarkably
contributed to understand the potential implication of TFs in human brain
evolution and cognitive abilities.

98
Outline
99
Outlook and future
directions The importance of species specific TFs as master regulators of cell and
tissue molecular pathways has rapidly increased in the past decades.
Several studies and consortiums have made remarkable advance to
functionally characterizing and cataloguing specific TFs (Consortium 2004;
Neph et al. 2012; Jolma et al. 2013; Wang et al. 2013b). Nevertheless, the
majority of TFs (circa 96%) remains mostly uncharacterized (Chawla et al.
2013; Mathelier et al. 2013), driving the TF research field to develop novel
tools and methods to functionally curate such important key regulators.
Because of that, with this thesis we contributed to understand the function
of such TFs in the human frontal lobe, a region strongly linked with our
cognitive abilities and disorders (Koechlin et al. 2003; Ecker et al. 2012;
Donoso et al. 2014; Domenech and Koechlin 2015). Those projects
provided a detailed glimpse of how the TF networks are implicated in
human brain functions and how a specific TF is an important regulator of
genes implicated in neurodevelopment and disorders. Nevertheless, we
are still far to understand the complexity of TF networks in the regulation
of specific phenotypes. Hence, the next step is to apply such detailed
methods to different tissue and cells to further analyze the role of TFs in
determined tissue. Using the wTO approach, we might define TF circuitry
implicated in other brain regions, neurons, or glia cells, emphasizing the
different role of TF in specific cells or tissues. Furthermore, due to the
lack of functionally characterized TFs (such as KRAB-ZNF), it is important
to continue the functional characterization of TFs by specific bioinformatics
methods. Those approaches serve to determine which TFs play an
important biological role in the TF network (e.g. hubs) and experimental
verify such function in the laboratory. For this, it is necessary to study TFs
not only at the cellular level but also at the tissue level to better infer the
Outline
100
potential implications of the candidate TFs in determining phenotypes, e.g.
behavior. My academic career focus will be on the evolution of TFs and
the relationship between TF regulation and phenotype in a neuroscience
perspective. I aim to study TFs involved in behavior and cognitive skills,
such as CLOCK and FOXP1, to identify using NGS technologies the
transcriptional mechanisms that are regulated by those important TFs and
moreover their function in brain regions. In the end, this thesis highlighted
not only the important role of TFs in brain development but also the power
of such methods to support and help further investigations.
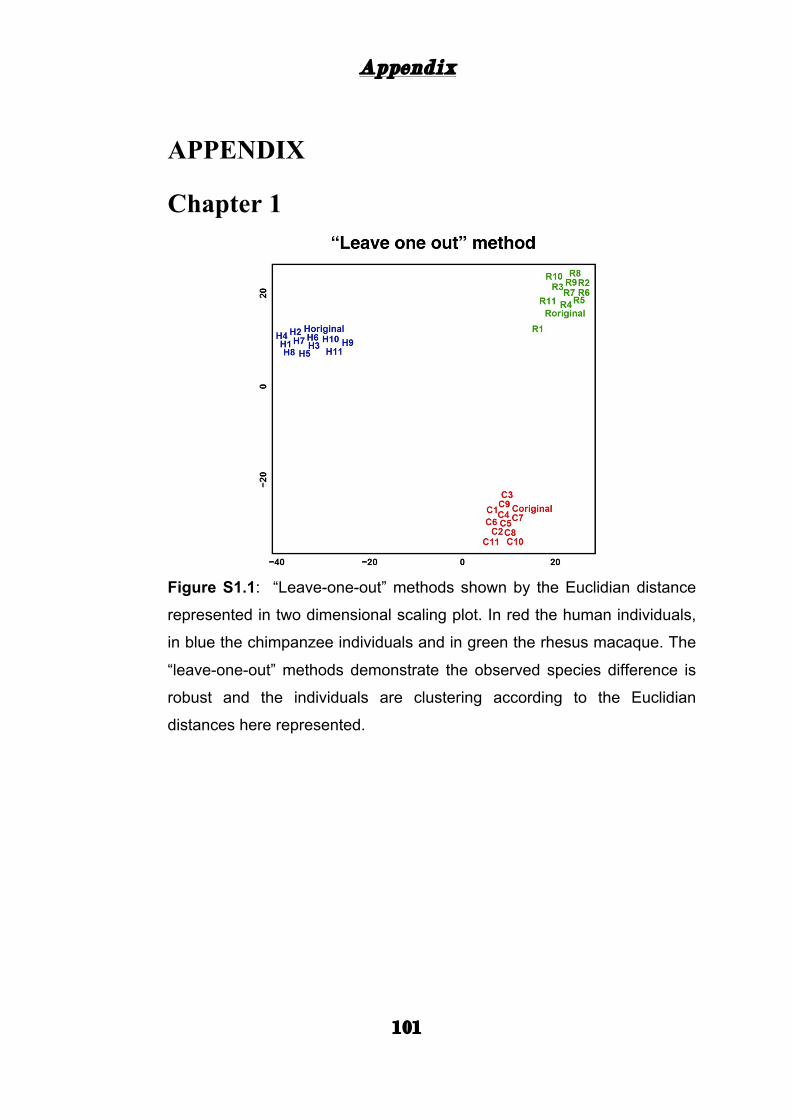
Appendix
101
APPENDIX
Chapter 1
Figure S1.1: “Leave-one-out” methods shown by the Euclidian distance
represented in two dimensional scaling plot. In red the human individuals,
in blue the chimpanzee individuals and in green the rhesus macaque. The
“leave-one-out” methods demonstrate the observed species difference is
robust and the individuals are clustering according to the Euclidian
distances here represented.
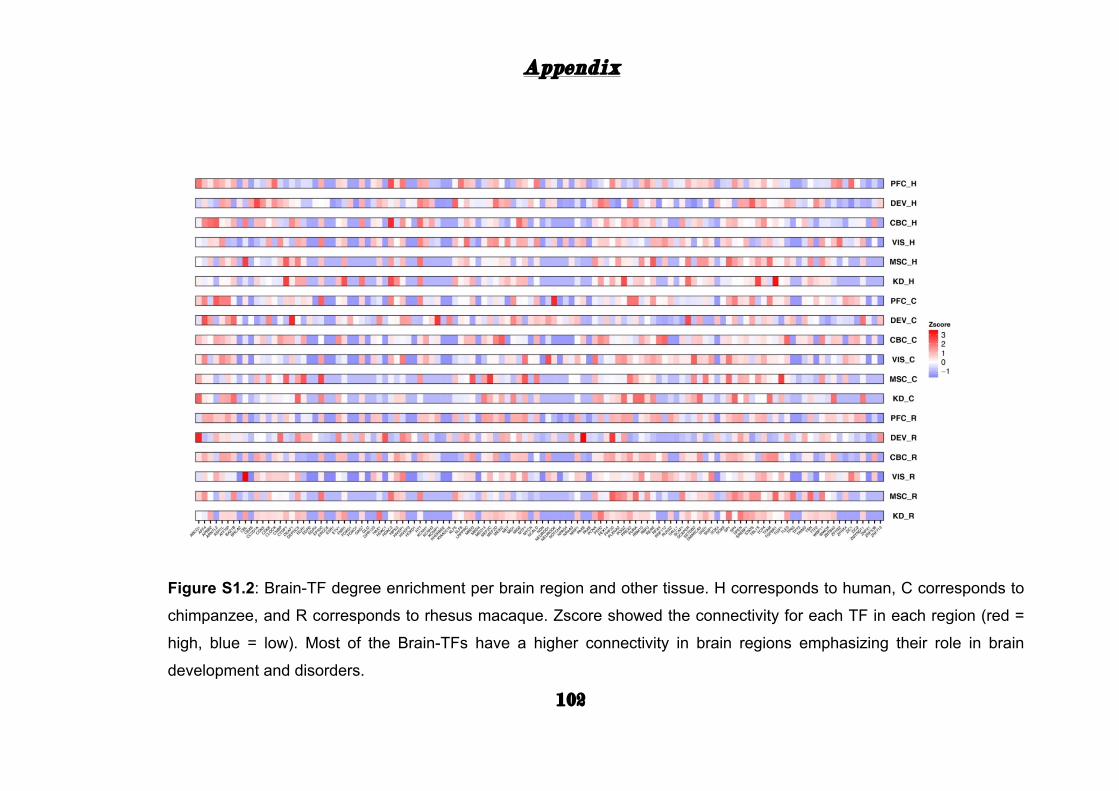
Appendix
102
Figure S1.2: Brain-TF degree enrichment per brain region and other tissue. H corresponds to human, C corresponds to
chimpanzee, and R corresponds to rhesus macaque. Zscore showed the connectivity for each TF in each region (red =
high, blue = low). Most of the Brain-TFs have a higher connectivity in brain regions emphasizing their role in brain
development and disorders.
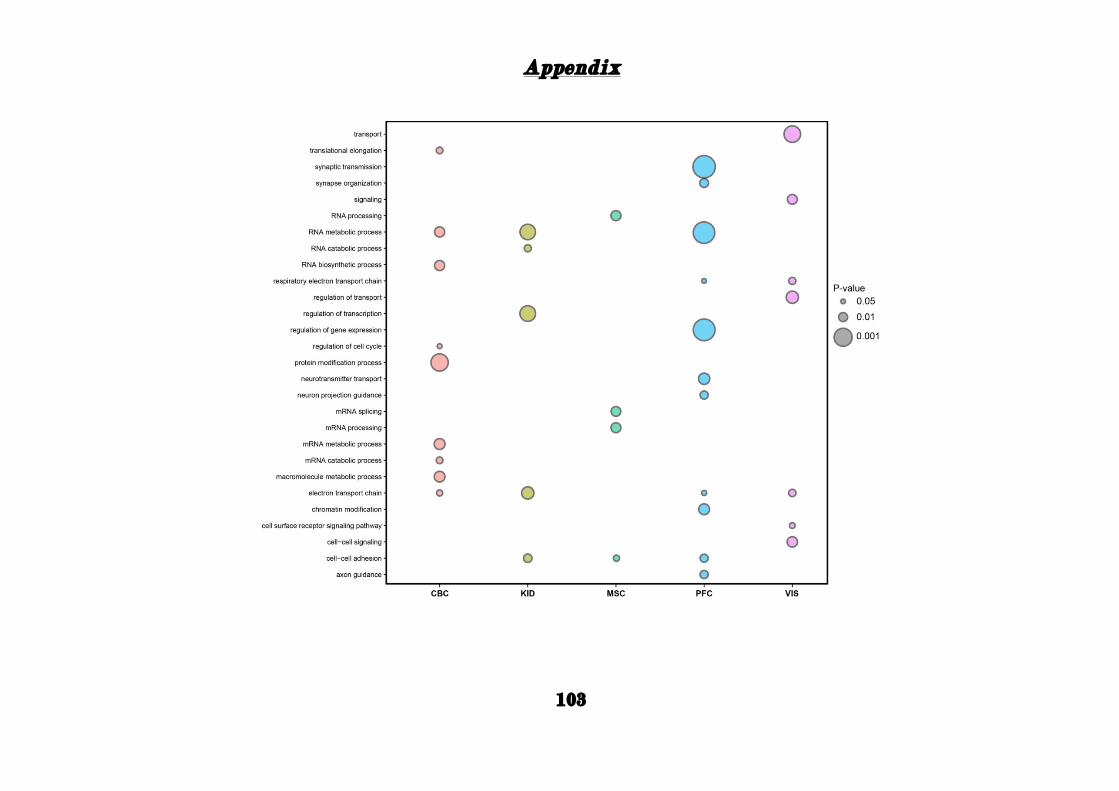
Appendix
103
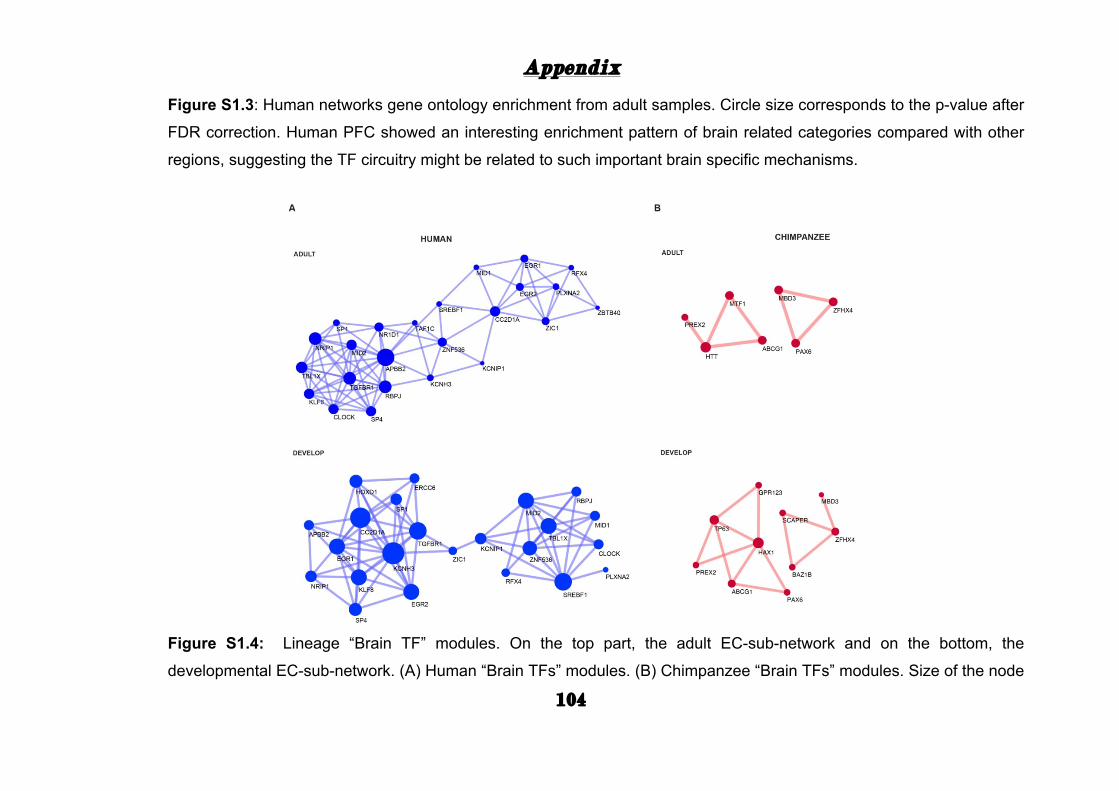
Appendix
104
Figure S1.3: Human networks gene ontology enrichment from adult samples. Circle size corresponds to the p-value after
FDR correction. Human PFC showed an interesting enrichment pattern of brain related categories compared with other
regions, suggesting the TF circuitry might be related to such important brain specific mechanisms.
Figure S1.4: Lineage “Brain TF” modules. On the top part, the adult EC-sub-network and on the bottom, the
developmental EC-sub-network. (A) Human “Brain TFs” modules. (B) Chimpanzee “Brain TFs” modules. Size of the node
Appendix
105
corresponds to the hub function of a TF. Human showed an enrichment of “Brain TFs” interactions compared with
chimpanzee. Several TF-TF interactions are confirmed in both human “Brain TFs” modules, suggesting that such
interaction is maintained during development of human PFC.
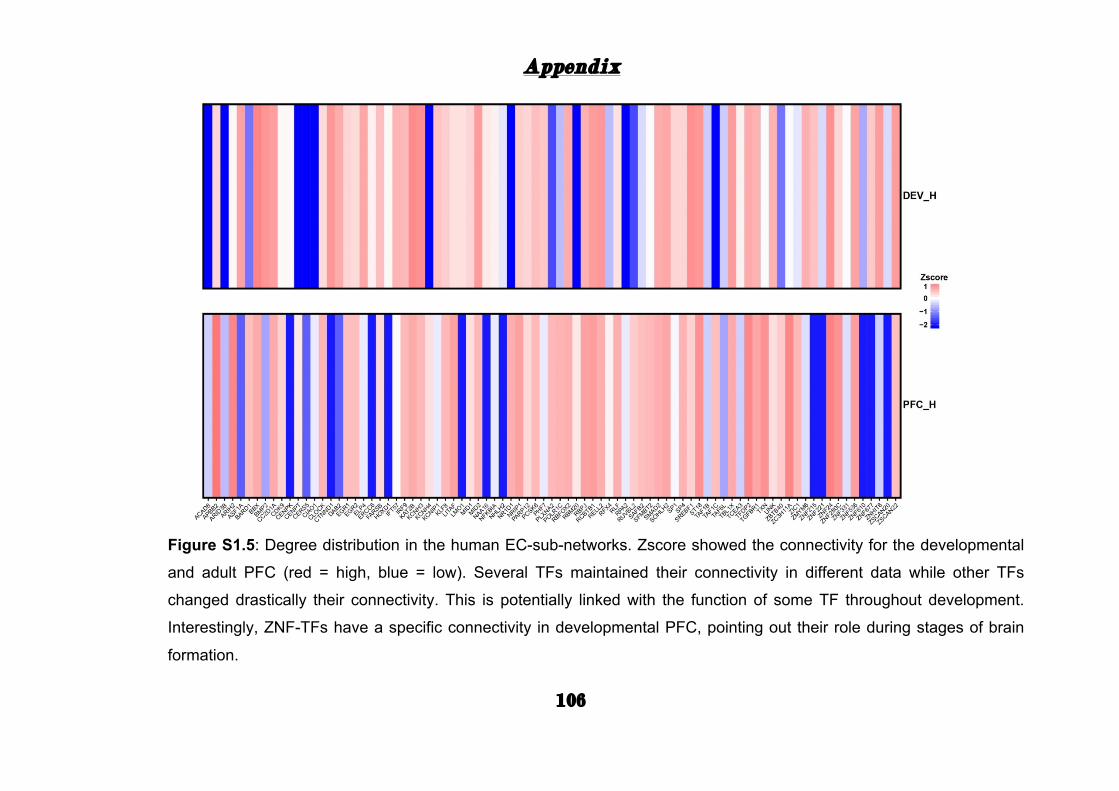
Appendix
106
Figure S1.5: Degree distribution in the human EC-sub-networks. Zscore showed the connectivity for the developmental
and adult PFC (red = high, blue = low). Several TFs maintained their connectivity in different data while other TFs
changed drastically their connectivity. This is potentially linked with the function of some TF throughout development.
Interestingly, ZNF-TFs have a specific connectivity in developmental PFC, pointing out their role during stages of brain
formation.
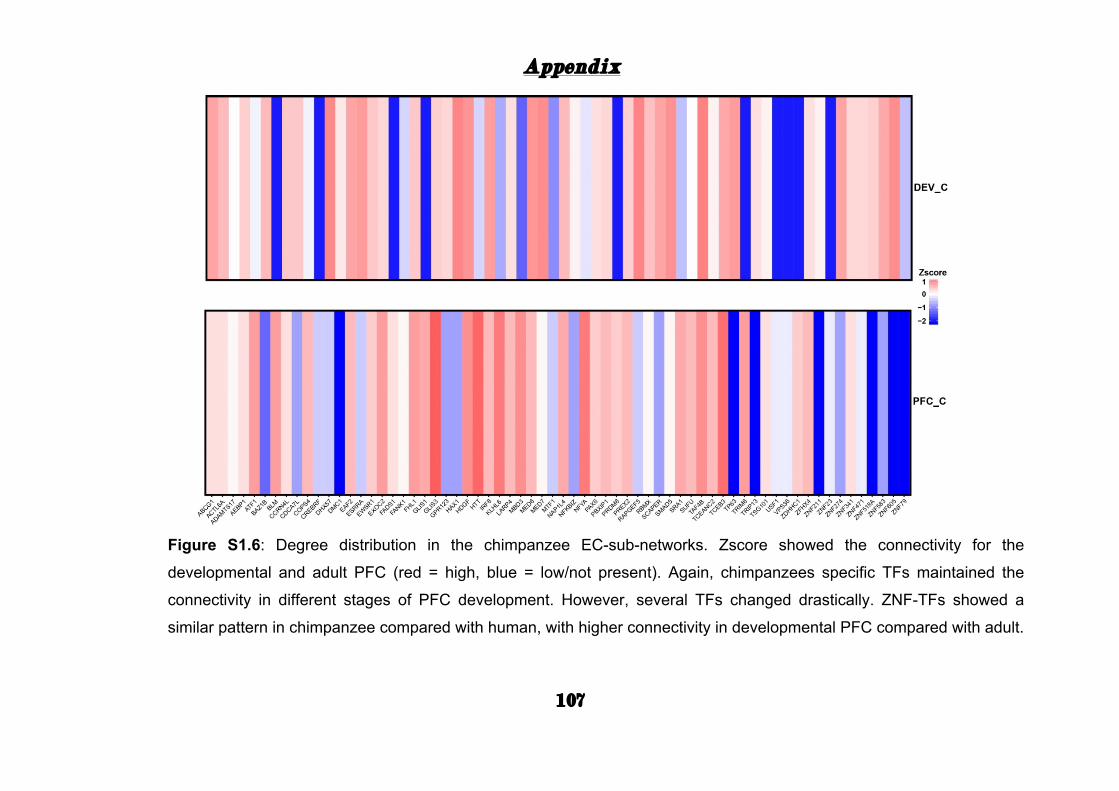
Appendix
107
Figure S1.6: Degree distribution in the chimpanzee EC-sub-networks. Zscore showed the connectivity for the
developmental and adult PFC (red = high, blue = low/not present). Again, chimpanzees specific TFs maintained the
connectivity in different stages of PFC development. However, several TFs changed drastically. ZNF-TFs showed a
similar pattern in chimpanzee compared with human, with higher connectivity in developmental PFC compared with adult.

Appendix
108
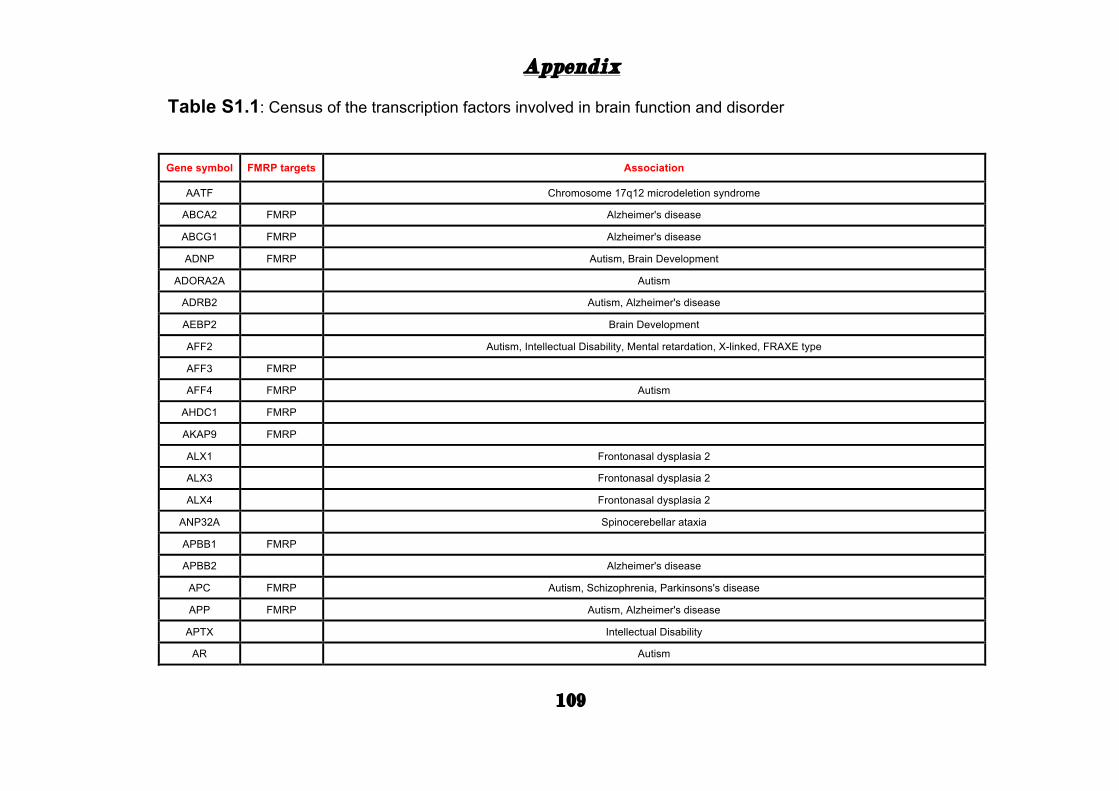
Appendix
109
Table S1.1: Census of the transcription factors involved in brain function and disorder
Gene symbol FMRP targets Association
AATF Chromosome 17q12 microdeletion syndrome
ABCA2 FMRP Alzheimer's disease
ABCG1 FMRP Alzheimer's disease
ADNP FMRP Autism, Brain Development
ADORA2A Autism
ADRB2 Autism, Alzheimer's disease
AEBP2 Brain Development
AFF2 Autism, Intellectual Disability, Mental retardation, X-linked, FRAXE type
AFF3 FMRP AFF4 FMRP Autism
AHDC1 FMRP AKAP9 FMRP ALX1 Frontonasal dysplasia 2
ALX3 Frontonasal dysplasia 2
ALX4 Frontonasal dysplasia 2
ANP32A Spinocerebellar ataxia
APBB1 FMRP APBB2 Alzheimer's disease
APC FMRP Autism, Schizophrenia, Parkinsons's disease
APP FMRP Autism, Alzheimer's disease
APTX Intellectual Disability
AR Autism
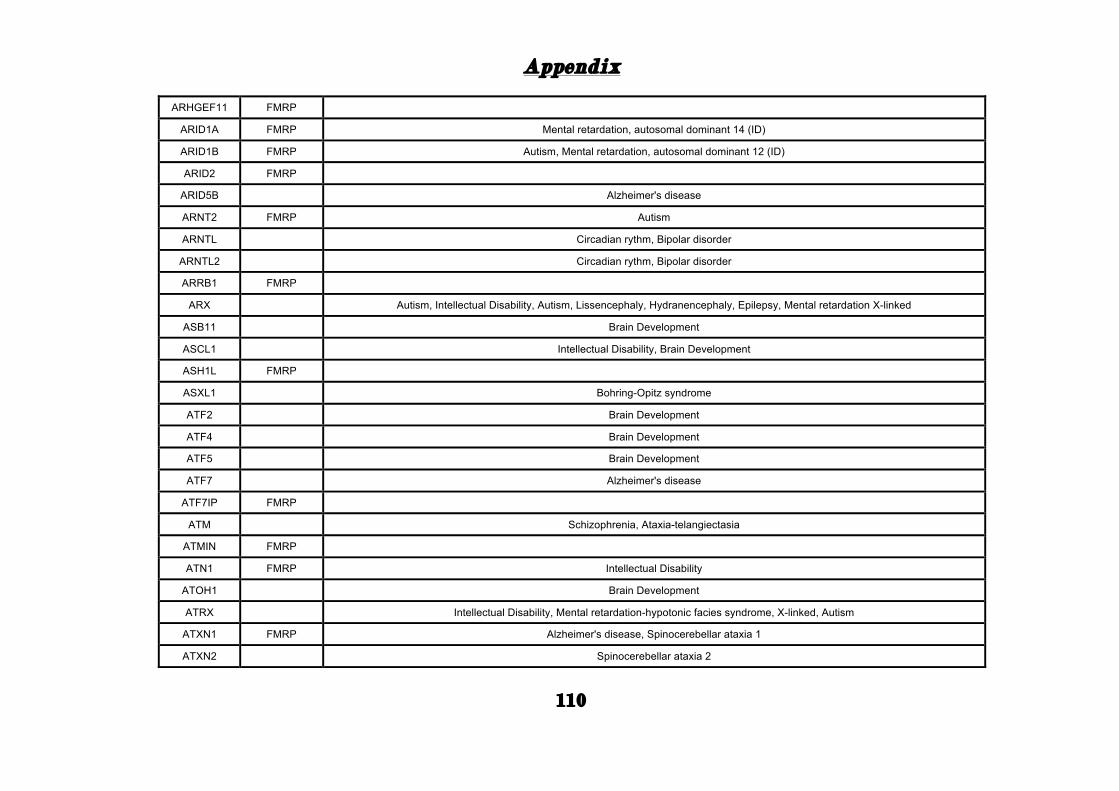
Appendix
110
ARHGEF11 FMRP ARID1A FMRP Mental retardation, autosomal dominant 14 (ID)
ARID1B FMRP Autism, Mental retardation, autosomal dominant 12 (ID)
ARID2 FMRP ARID5B Alzheimer's disease
ARNT2 FMRP Autism
ARNTL Circadian rythm, Bipolar disorder
ARNTL2 Circadian rythm, Bipolar disorder
ARRB1 FMRP ARX Autism, Intellectual Disability, Autism, Lissencephaly, Hydranencephaly, Epilepsy, Mental retardation X-linked
ASB11 Brain Development
ASCL1 Intellectual Disability, Brain Development
ASH1L FMRP ASXL1 Bohring-Opitz syndrome
ATF2 Brain Development
ATF4 Brain Development
ATF5 Brain Development
ATF7 Alzheimer's disease
ATF7IP FMRP ATM Schizophrenia, Ataxia-telangiectasia
ATMIN FMRP ATN1 FMRP Intellectual Disability
ATOH1 Brain Development
ATRX Intellectual Disability, Mental retardation-hypotonic facies syndrome, X-linked, Autism
ATXN1 FMRP Alzheimer's disease, Spinocerebellar ataxia 1
ATXN2 Spinocerebellar ataxia 2
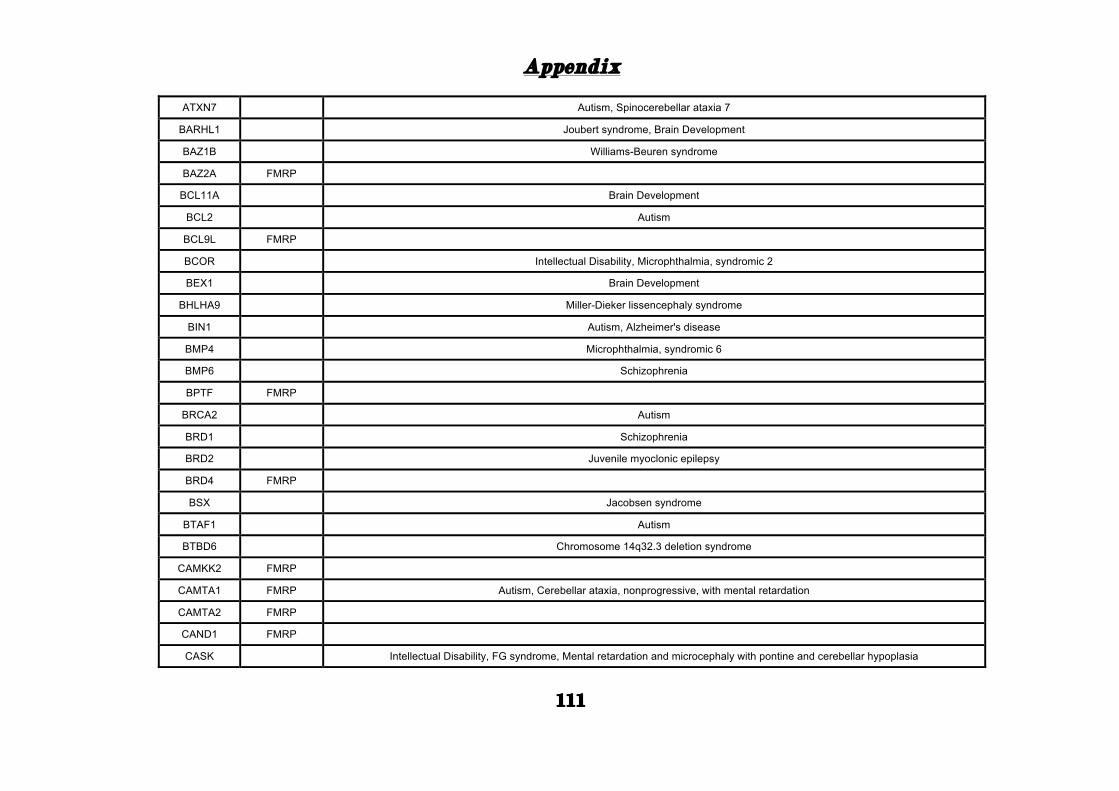
Appendix
111
ATXN7 Autism, Spinocerebellar ataxia 7
BARHL1 Joubert syndrome, Brain Development
BAZ1B Williams-Beuren syndrome
BAZ2A FMRP BCL11A Brain Development
BCL2 Autism
BCL9L FMRP BCOR Intellectual Disability, Microphthalmia, syndromic 2
BEX1 Brain Development
BHLHA9 Miller-Dieker lissencephaly syndrome
BIN1 Autism, Alzheimer's disease
BMP4 Microphthalmia, syndromic 6
BMP6 Schizophrenia
BPTF FMRP BRCA2 Autism
BRD1 Schizophrenia
BRD2 Juvenile myoclonic epilepsy
BRD4 FMRP BSX Jacobsen syndrome
BTAF1 Autism
BTBD6 Chromosome 14q32.3 deletion syndrome
CAMKK2 FMRP CAMTA1 FMRP Autism, Cerebellar ataxia, nonprogressive, with mental retardation
CAMTA2 FMRP CAND1 FMRP CASK Intellectual Disability, FG syndrome, Mental retardation and microcephaly with pontine and cerebellar hypoplasia
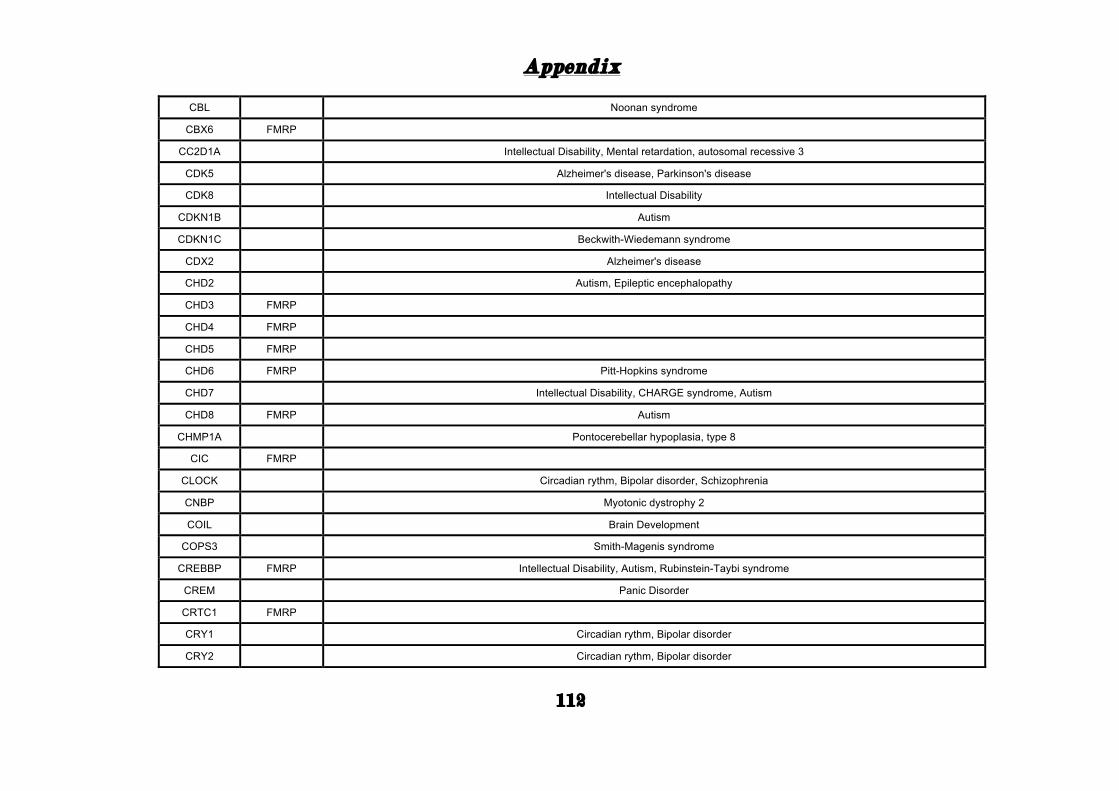
Appendix
112
CBL Noonan syndrome
CBX6 FMRP CC2D1A Intellectual Disability, Mental retardation, autosomal recessive 3
CDK5 Alzheimer's disease, Parkinson's disease
CDK8 Intellectual Disability
CDKN1B Autism
CDKN1C Beckwith-Wiedemann syndrome
CDX2 Alzheimer's disease
CHD2 Autism, Epileptic encephalopathy
CHD3 FMRP CHD4 FMRP CHD5 FMRP CHD6 FMRP Pitt-Hopkins syndrome
CHD7 Intellectual Disability, CHARGE syndrome, Autism
CHD8 FMRP Autism
CHMP1A Pontocerebellar hypoplasia, type 8
CIC FMRP CLOCK Circadian rythm, Bipolar disorder, Schizophrenia
CNBP Myotonic dystrophy 2
COIL Brain Development
COPS3 Smith-Magenis syndrome
CREBBP FMRP Intellectual Disability, Autism, Rubinstein-Taybi syndrome
CREM Panic Disorder
CRTC1 FMRP CRY1 Circadian rythm, Bipolar disorder
CRY2 Circadian rythm, Bipolar disorder
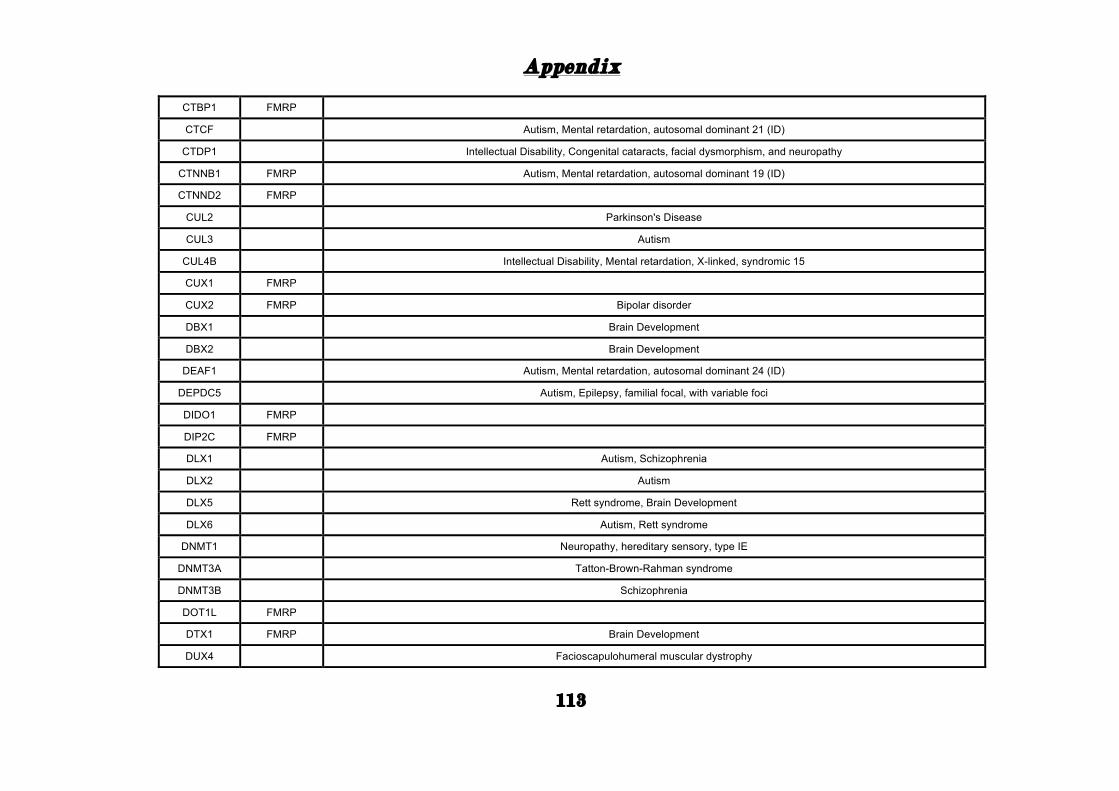
Appendix
113
CTBP1 FMRP CTCF Autism, Mental retardation, autosomal dominant 21 (ID)
CTDP1 Intellectual Disability, Congenital cataracts, facial dysmorphism, and neuropathy
CTNNB1 FMRP Autism, Mental retardation, autosomal dominant 19 (ID)
CTNND2 FMRP CUL2 Parkinson's Disease
CUL3 Autism
CUL4B Intellectual Disability, Mental retardation, X-linked, syndromic 15
CUX1 FMRP CUX2 FMRP Bipolar disorder
DBX1 Brain Development
DBX2 Brain Development
DEAF1 Autism, Mental retardation, autosomal dominant 24 (ID)
DEPDC5 Autism, Epilepsy, familial focal, with variable foci
DIDO1 FMRP DIP2C FMRP DLX1 Autism, Schizophrenia
DLX2 Autism
DLX5 Rett syndrome, Brain Development
DLX6 Autism, Rett syndrome
DNMT1 Neuropathy, hereditary sensory, type IE
DNMT3A Tatton-Brown-Rahman syndrome
DNMT3B Schizophrenia
DOT1L FMRP DTX1 FMRP Brain Development
DUX4 Facioscapulohumeral muscular dystrophy
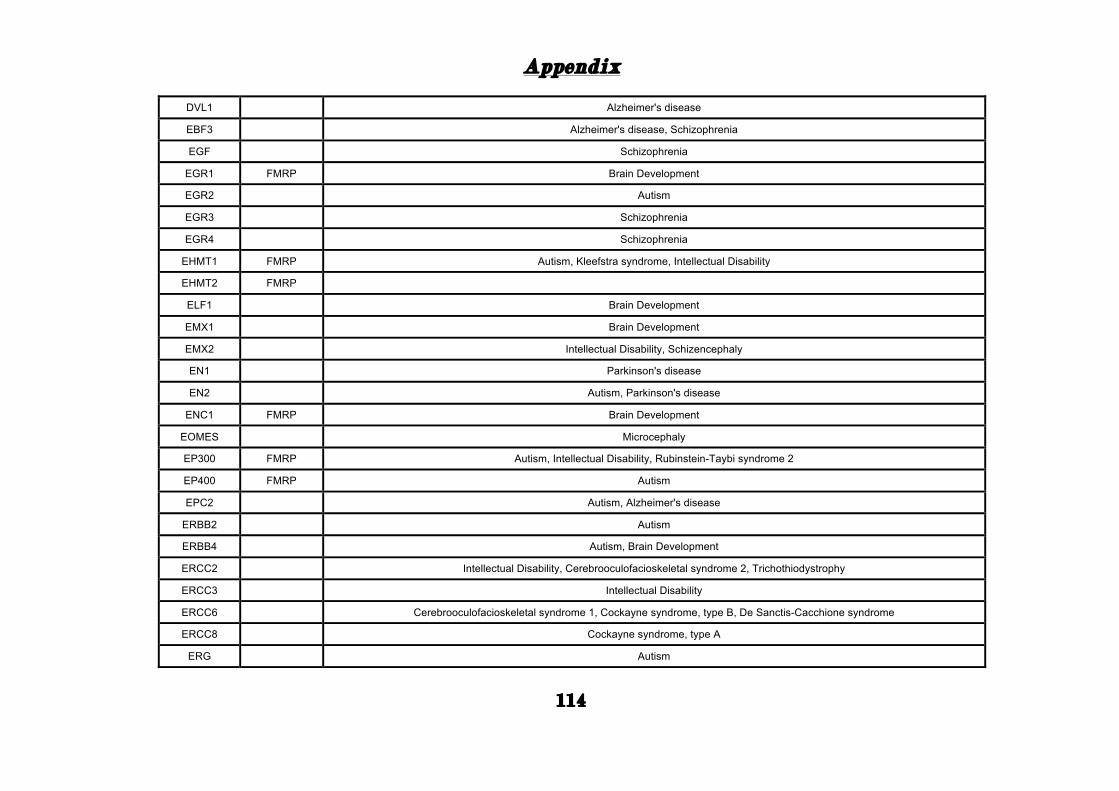
Appendix
114
DVL1 Alzheimer's disease
EBF3 Alzheimer's disease, Schizophrenia
EGF Schizophrenia
EGR1 FMRP Brain Development
EGR2 Autism
EGR3 Schizophrenia
EGR4 Schizophrenia
EHMT1 FMRP Autism, Kleefstra syndrome, Intellectual Disability
EHMT2 FMRP ELF1 Brain Development
EMX1 Brain Development
EMX2 Intellectual Disability, Schizencephaly
EN1 Parkinson's disease
EN2 Autism, Parkinson's disease
ENC1 FMRP Brain Development
EOMES Microcephaly
EP300 FMRP Autism, Intellectual Disability, Rubinstein-Taybi syndrome 2
EP400 FMRP Autism
EPC2 Autism, Alzheimer's disease
ERBB2 Autism
ERBB4 Autism, Brain Development
ERCC2 Intellectual Disability, Cerebrooculofacioskeletal syndrome 2, Trichothiodystrophy
ERCC3 Intellectual Disability
ERCC6 Cerebrooculofacioskeletal syndrome 1, Cockayne syndrome, type B, De Sanctis-Cacchione syndrome
ERCC8 Cockayne syndrome, type A
ERG Autism
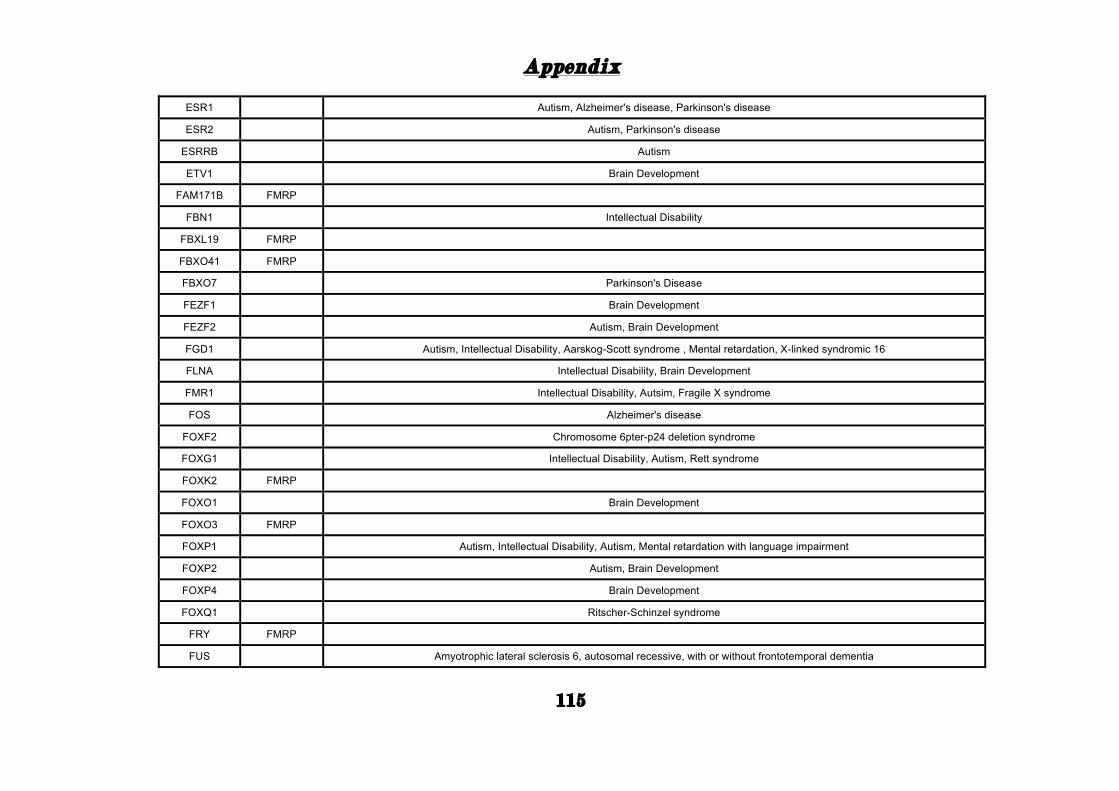
Appendix
115
ESR1 Autism, Alzheimer's disease, Parkinson's disease
ESR2 Autism, Parkinson's disease
ESRRB Autism
ETV1 Brain Development
FAM171B FMRP FBN1 Intellectual Disability
FBXL19 FMRP FBXO41 FMRP FBXO7 Parkinson's Disease
FEZF1 Brain Development
FEZF2 Autism, Brain Development
FGD1 Autism, Intellectual Disability, Aarskog-Scott syndrome , Mental retardation, X-linked syndromic 16
FLNA Intellectual Disability, Brain Development
FMR1 Intellectual Disability, Autsim, Fragile X syndrome
FOS Alzheimer's disease
FOXF2 Chromosome 6pter-p24 deletion syndrome
FOXG1 Intellectual Disability, Autism, Rett syndrome
FOXK2 FMRP FOXO1 Brain Development
FOXO3 FMRP FOXP1 Autism, Intellectual Disability, Autism, Mental retardation with language impairment
FOXP2 Autism, Brain Development
FOXP4 Brain Development
FOXQ1 Ritscher-Schinzel syndrome
FRY FMRP FUS Amyotrophic lateral sclerosis 6, autosomal recessive, with or without frontotemporal dementia
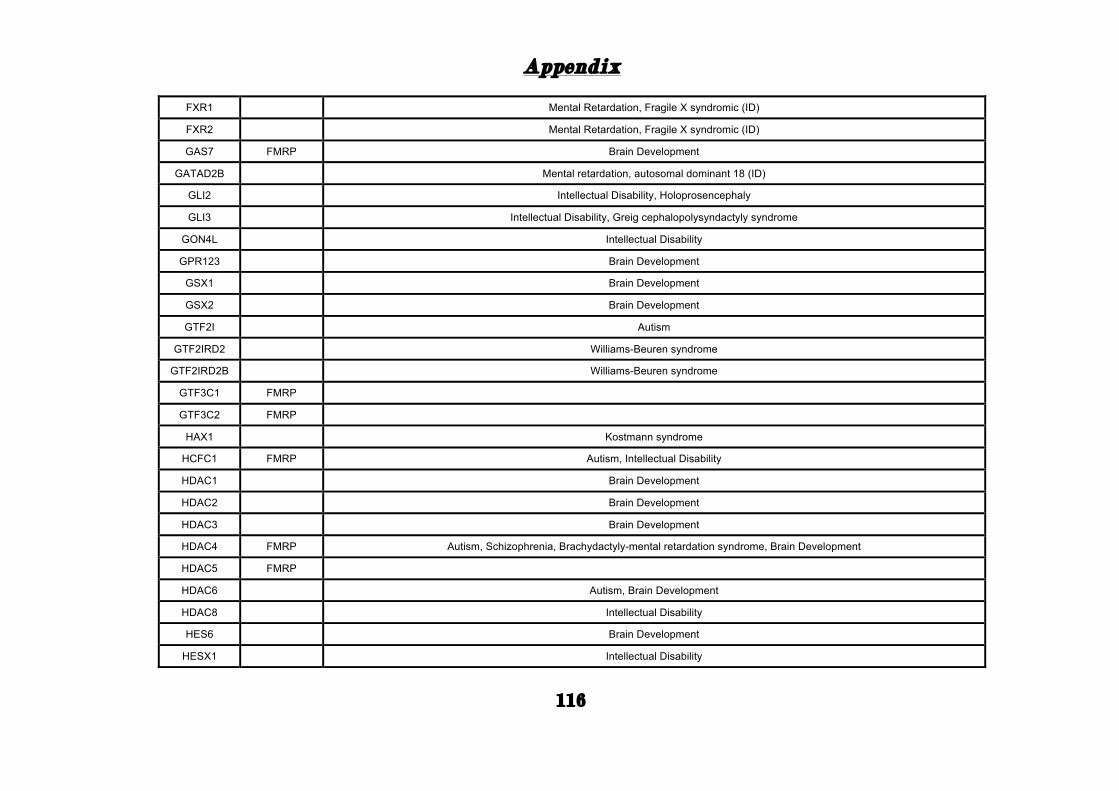
Appendix
116
FXR1 Mental Retardation, Fragile X syndromic (ID)
FXR2 Mental Retardation, Fragile X syndromic (ID)
GAS7 FMRP Brain Development
GATAD2B Mental retardation, autosomal dominant 18 (ID)
GLI2 Intellectual Disability, Holoprosencephaly
GLI3 Intellectual Disability, Greig cephalopolysyndactyly syndrome
GON4L Intellectual Disability
GPR123 Brain Development
GSX1 Brain Development
GSX2 Brain Development
GTF2I Autism
GTF2IRD2 Williams-Beuren syndrome
GTF2IRD2B Williams-Beuren syndrome
GTF3C1 FMRP GTF3C2 FMRP
HAX1 Kostmann syndrome
HCFC1 FMRP Autism, Intellectual Disability
HDAC1 Brain Development
HDAC2 Brain Development
HDAC3 Brain Development
HDAC4 FMRP Autism, Schizophrenia, Brachydactyly-mental retardation syndrome, Brain Development
HDAC5 FMRP HDAC6 Autism, Brain Development
HDAC8 Intellectual Disability
HES6 Brain Development
HESX1 Intellectual Disability
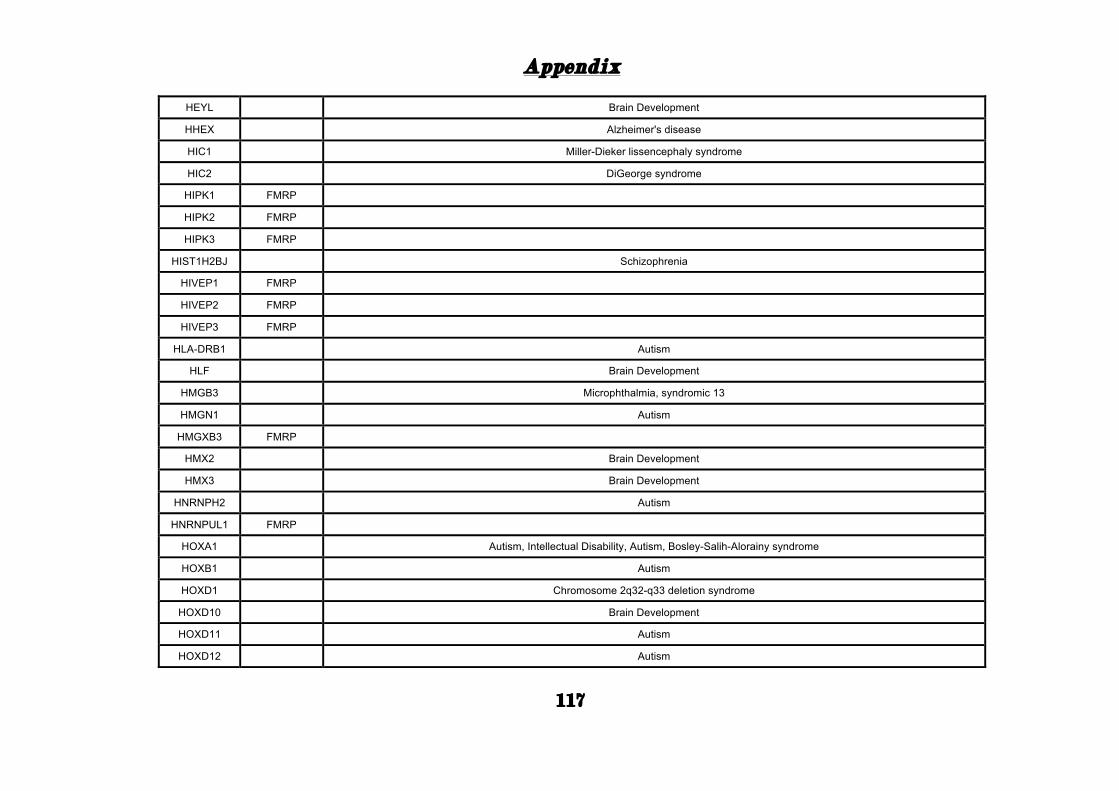
Appendix
117
HEYL Brain Development
HHEX Alzheimer's disease
HIC1 Miller-Dieker lissencephaly syndrome
HIC2 DiGeorge syndrome
HIPK1 FMRP HIPK2 FMRP HIPK3 FMRP
HIST1H2BJ Schizophrenia
HIVEP1 FMRP HIVEP2 FMRP HIVEP3 FMRP
HLA-DRB1 Autism
HLF Brain Development
HMGB3 Microphthalmia, syndromic 13
HMGN1 Autism
HMGXB3 FMRP HMX2 Brain Development
HMX3 Brain Development
HNRNPH2 Autism
HNRNPUL1 FMRP HOXA1 Autism, Intellectual Disability, Autism, Bosley-Salih-Alorainy syndrome
HOXB1 Autism
HOXD1 Chromosome 2q32-q33 deletion syndrome
HOXD10 Brain Development
HOXD11 Autism
HOXD12 Autism
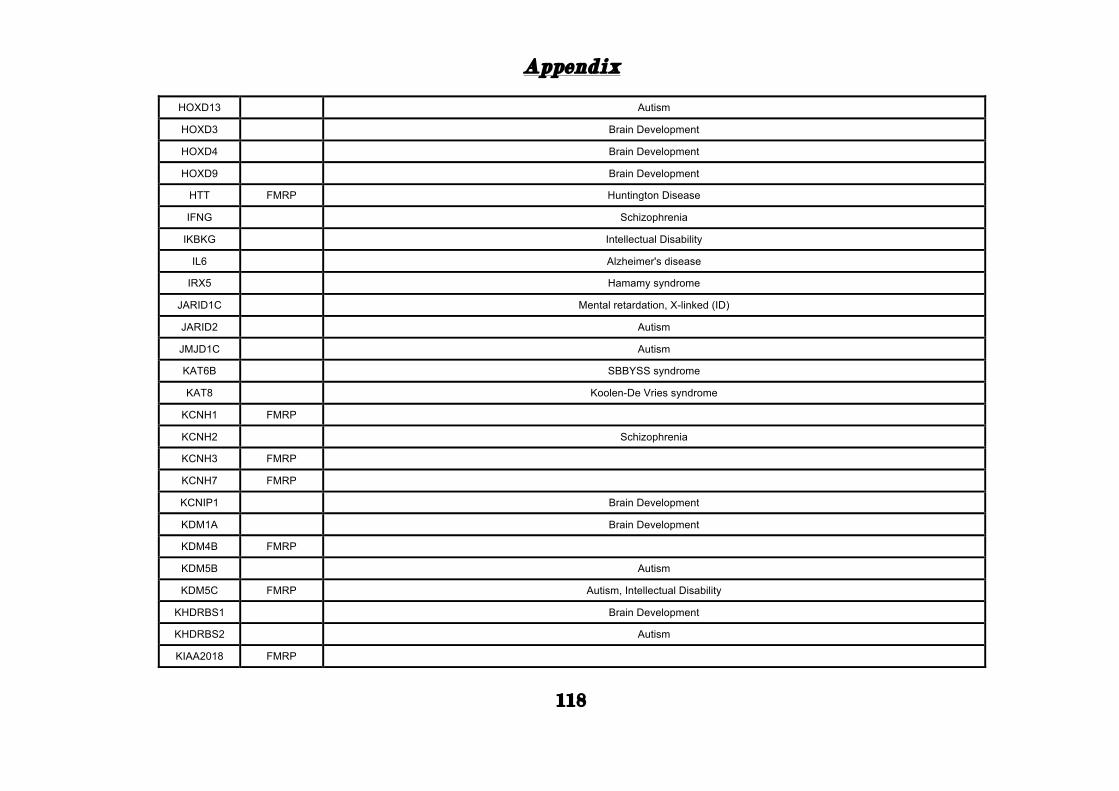
Appendix
118
HOXD13 Autism
HOXD3 Brain Development
HOXD4 Brain Development
HOXD9 Brain Development
HTT FMRP Huntington Disease
IFNG Schizophrenia
IKBKG Intellectual Disability
IL6 Alzheimer's disease
IRX5 Hamamy syndrome
JARID1C Mental retardation, X-linked (ID)
JARID2 Autism
JMJD1C Autism
KAT6B SBBYSS syndrome
KAT8 Koolen-De Vries syndrome
KCNH1 FMRP KCNH2 Schizophrenia
KCNH3 FMRP KCNH7 FMRP KCNIP1 Brain Development
KDM1A Brain Development
KDM4B FMRP KDM5B Autism
KDM5C FMRP Autism, Intellectual Disability
KHDRBS1 Brain Development
KHDRBS2 Autism
KIAA2018 FMRP

Appendix
119
KLF13 Chromosome 15q13.3 deletion syndrome
KLF5 Alzheimer's disease, Schizophrenia
KLF6 Schizophrenia
KLF7 Brain Development
KLF8 Intellectual Disability
LARP7 Intellectual Disability, Alazami syndrome
LAS1L Intellectual Disability
LBX1 Brain Development
LBX2 Brain Development
LHX1 Chromosome 17q12 deletion syndrome
LHX2 Brain Development
LHX3 Pituitary hormone deficiency, combined, 3
LHX4 Pituitary hormone deficiency, combined, 3
LHX6 Brain Development
LHX8 Brain Development
LHX9 Brain Development
LMX1A Schizophrenia, Brain Development
LMX1B Autism, Schizophrenia
LRPPRC Autism, Leigh syndrome, Intellectual Disability
MACF1 FMRP MAFB Multicentric carpotarsal osteolysis syndrome
MAFK Brain Development
MAGED1 FMRP Autism, Brain Development
MAPK1 FMRP Autism
MAPK14 Schizophrenia
MAPK8IP1 FMRP
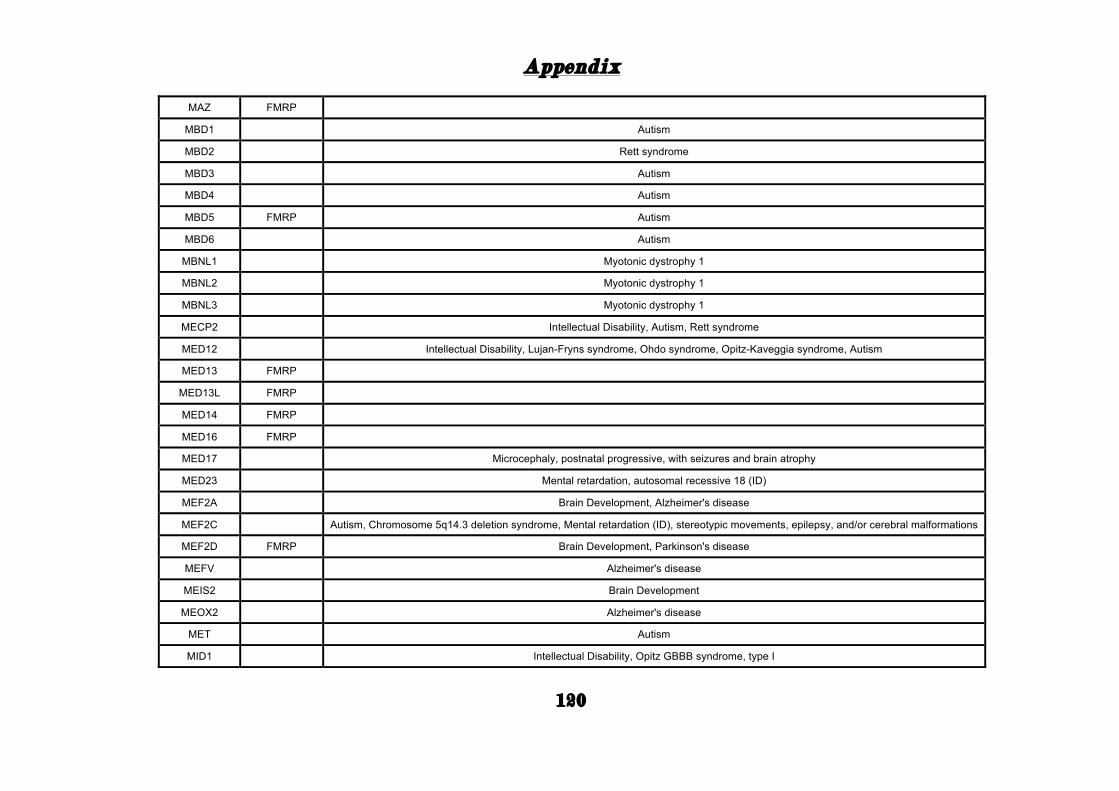
Appendix
120
MAZ FMRP MBD1 Autism
MBD2 Rett syndrome
MBD3 Autism
MBD4 Autism
MBD5 FMRP Autism
MBD6 Autism
MBNL1 Myotonic dystrophy 1
MBNL2 Myotonic dystrophy 1
MBNL3 Myotonic dystrophy 1
MECP2 Intellectual Disability, Autism, Rett syndrome
MED12 Intellectual Disability, Lujan-Fryns syndrome, Ohdo syndrome, Opitz-Kaveggia syndrome, Autism
MED13 FMRP MED13L FMRP MED14 FMRP MED16 FMRP MED17 Microcephaly, postnatal progressive, with seizures and brain atrophy
MED23 Mental retardation, autosomal recessive 18 (ID)
MEF2A Brain Development, Alzheimer's disease
MEF2C Autism, Chromosome 5q14.3 deletion syndrome, Mental retardation (ID), stereotypic movements, epilepsy, and/or cerebral malformations
MEF2D FMRP Brain Development, Parkinson's disease
MEFV Alzheimer's disease
MEIS2 Brain Development
MEOX2 Alzheimer's disease
MET Autism
MID1 Intellectual Disability, Opitz GBBB syndrome, type I

Appendix
121
MID2 Intellectual Disability
MINK1 FMRP MITF Autism
MKL2 FMRP Autism
MLL FMRP Brain Development
MLL2 FMRP Kabuki syndrome 1
MLL3 FMRP MLLT3 Brain Development
MNT Miller-Dieker lissencephaly syndrome
MPRIP FMRP MTF1 Autism
MYCBP2 FMRP MYCN Intellectual Disability, Feingold syndrome
MYRF Brain Development
MYT1L FMRP Autism, Intellectual Disability
NAA15 Autism
NAP1L2 Brain Development
NCALD Brain Development
NCOA1 FMRP NCOA2 FMRP NCOA6 FMRP NCOR1 FMRP NCOR2 FMRP NCS1 FMRP Brain Development
NDN Prader-Willi syndrome
NDNL2 Autism
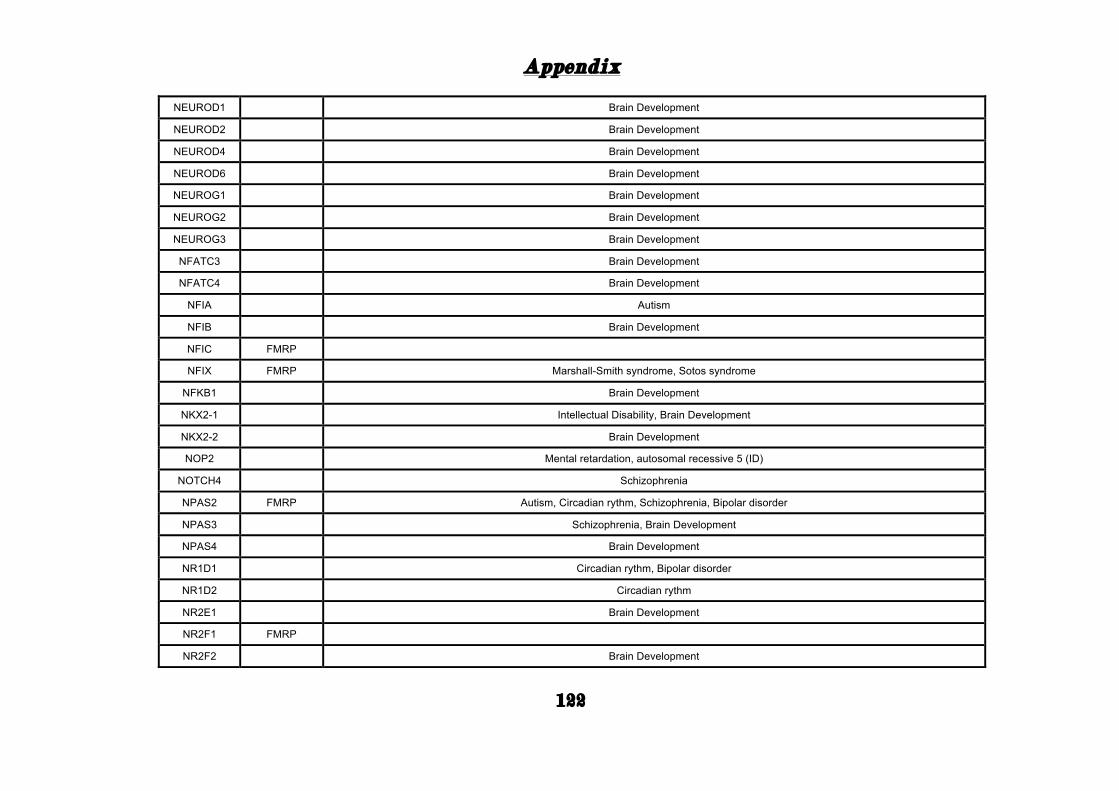
Appendix
122
NEUROD1 Brain Development
NEUROD2 Brain Development
NEUROD4 Brain Development
NEUROD6 Brain Development
NEUROG1 Brain Development
NEUROG2 Brain Development
NEUROG3 Brain Development
NFATC3 Brain Development
NFATC4 Brain Development
NFIA Autism
NFIB Brain Development
NFIC FMRP NFIX FMRP Marshall-Smith syndrome, Sotos syndrome
NFKB1 Brain Development
NKX2-1 Intellectual Disability, Brain Development
NKX2-2 Brain Development
NOP2 Mental retardation, autosomal recessive 5 (ID)
NOTCH4 Schizophrenia
NPAS2 FMRP Autism, Circadian rythm, Schizophrenia, Bipolar disorder
NPAS3 Schizophrenia, Brain Development
NPAS4 Brain Development
NR1D1 Circadian rythm, Bipolar disorder
NR1D2 Circadian rythm
NR2E1 Brain Development
NR2F1 FMRP NR2F2 Brain Development
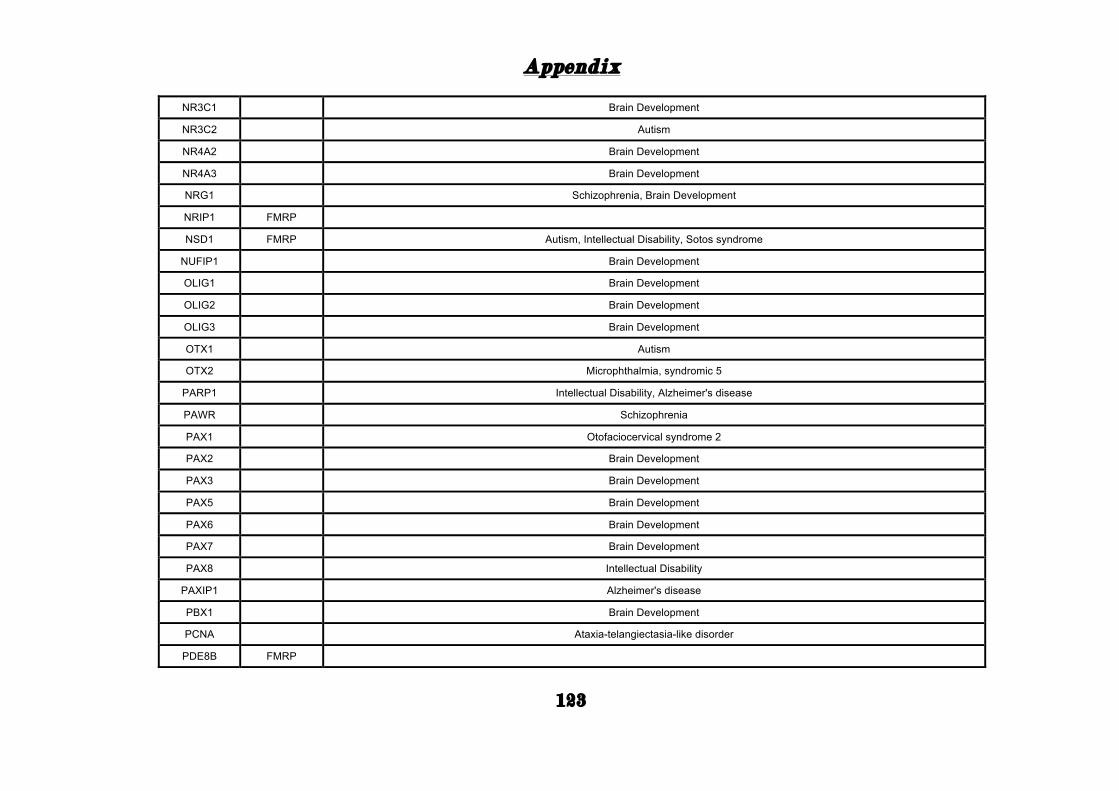
Appendix
123
NR3C1 Brain Development
NR3C2 Autism
NR4A2 Brain Development
NR4A3 Brain Development
NRG1 Schizophrenia, Brain Development
NRIP1 FMRP NSD1 FMRP Autism, Intellectual Disability, Sotos syndrome
NUFIP1 Brain Development
OLIG1 Brain Development
OLIG2 Brain Development
OLIG3 Brain Development
OTX1 Autism
OTX2 Microphthalmia, syndromic 5
PARP1 Intellectual Disability, Alzheimer's disease
PAWR Schizophrenia
PAX1 Otofaciocervical syndrome 2
PAX2 Brain Development
PAX3 Brain Development
PAX5 Brain Development
PAX6 Brain Development
PAX7 Brain Development
PAX8 Intellectual Disability
PAXIP1 Alzheimer's disease
PBX1 Brain Development
PCNA Ataxia-telangiectasia-like disorder
PDE8B FMRP
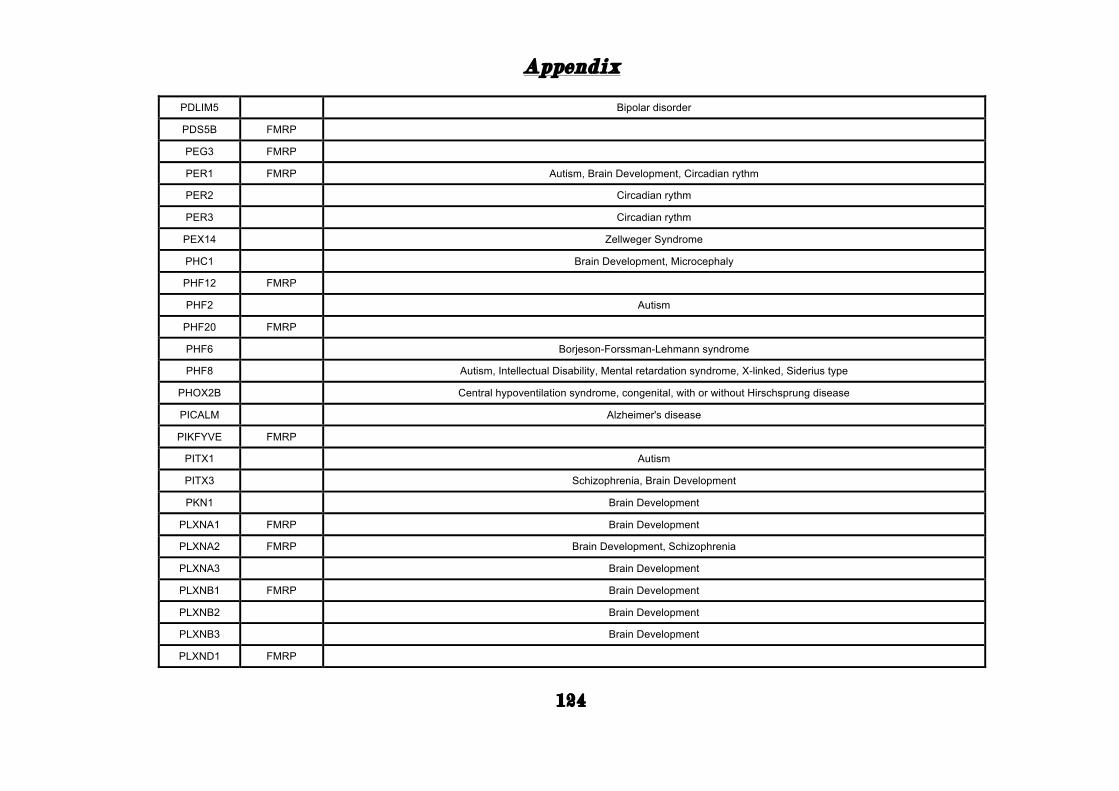
Appendix
124
PDLIM5 Bipolar disorder
PDS5B FMRP PEG3 FMRP PER1 FMRP Autism, Brain Development, Circadian rythm
PER2 Circadian rythm
PER3 Circadian rythm
PEX14 Zellweger Syndrome
PHC1 Brain Development, Microcephaly
PHF12 FMRP PHF2 Autism
PHF20 FMRP PHF6 Borjeson-Forssman-Lehmann syndrome
PHF8 Autism, Intellectual Disability, Mental retardation syndrome, X-linked, Siderius type
PHOX2B Central hypoventilation syndrome, congenital, with or without Hirschsprung disease
PICALM Alzheimer's disease
PIKFYVE FMRP PITX1 Autism
PITX3 Schizophrenia, Brain Development
PKN1 Brain Development
PLXNA1 FMRP Brain Development
PLXNA2 FMRP Brain Development, Schizophrenia
PLXNA3 Brain Development
PLXNB1 FMRP Brain Development
PLXNB2 Brain Development
PLXNB3 Brain Development
PLXND1 FMRP
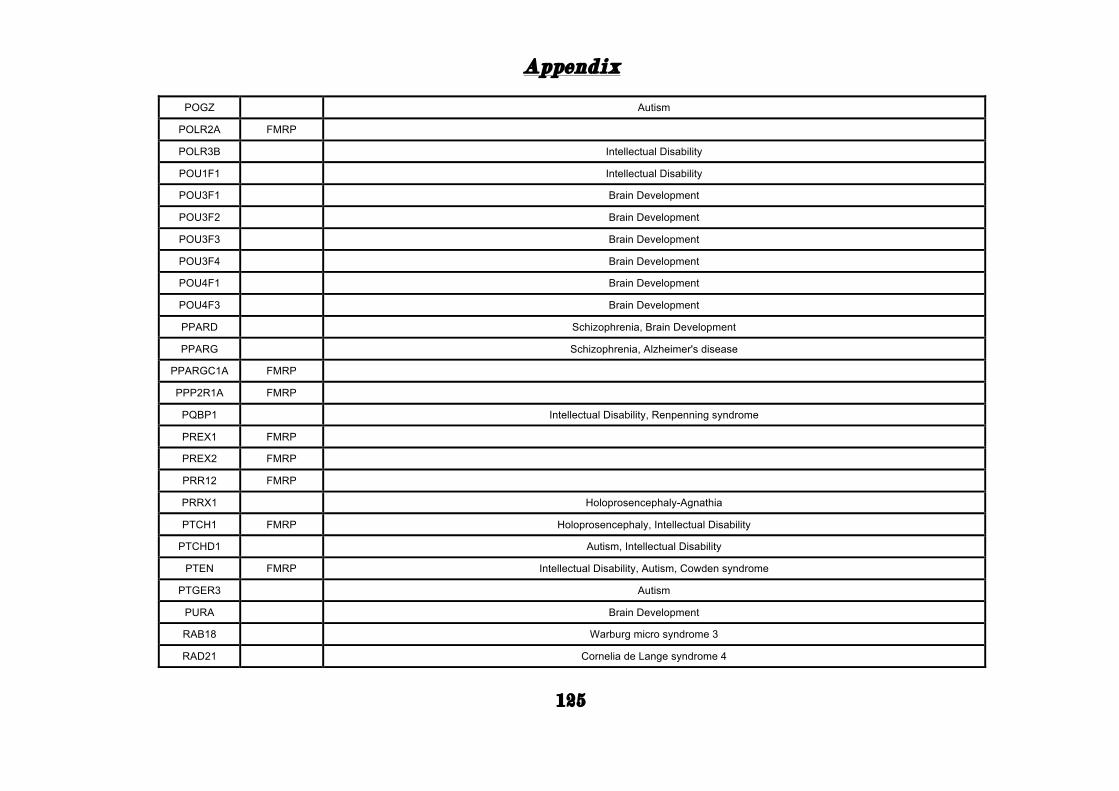
Appendix
125
POGZ Autism
POLR2A FMRP POLR3B Intellectual Disability
POU1F1 Intellectual Disability
POU3F1 Brain Development
POU3F2 Brain Development
POU3F3 Brain Development
POU3F4 Brain Development
POU4F1 Brain Development
POU4F3 Brain Development
PPARD Schizophrenia, Brain Development
PPARG Schizophrenia, Alzheimer's disease
PPARGC1A FMRP PPP2R1A FMRP
PQBP1 Intellectual Disability, Renpenning syndrome
PREX1 FMRP PREX2 FMRP PRR12 FMRP PRRX1 Holoprosencephaly-Agnathia
PTCH1 FMRP Holoprosencephaly, Intellectual Disability
PTCHD1 Autism, Intellectual Disability
PTEN FMRP Intellectual Disability, Autism, Cowden syndrome
PTGER3 Autism
PURA Brain Development
RAB18 Warburg micro syndrome 3
RAD21 Cornelia de Lange syndrome 4
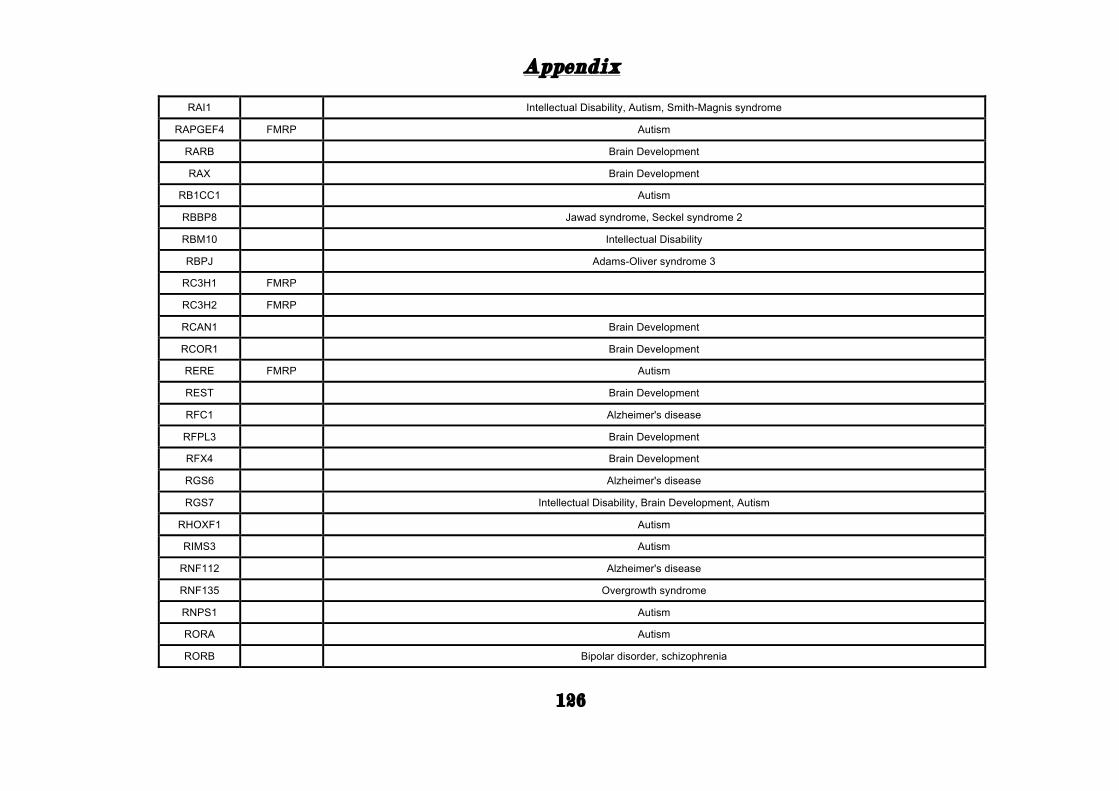
Appendix
126
RAI1 Intellectual Disability, Autism, Smith-Magnis syndrome
RAPGEF4 FMRP Autism
RARB Brain Development
RAX Brain Development
RB1CC1 Autism
RBBP8 Jawad syndrome, Seckel syndrome 2
RBM10 Intellectual Disability
RBPJ Adams-Oliver syndrome 3
RC3H1 FMRP RC3H2 FMRP RCAN1 Brain Development
RCOR1 Brain Development
RERE FMRP Autism
REST Brain Development
RFC1 Alzheimer's disease
RFPL3 Brain Development
RFX4 Brain Development
RGS6 Alzheimer's disease
RGS7 Intellectual Disability, Brain Development, Autism
RHOXF1 Autism
RIMS3 Autism
RNF112 Alzheimer's disease
RNF135 Overgrowth syndrome
RNPS1 Autism
RORA Autism
RORB Bipolar disorder, schizophrenia
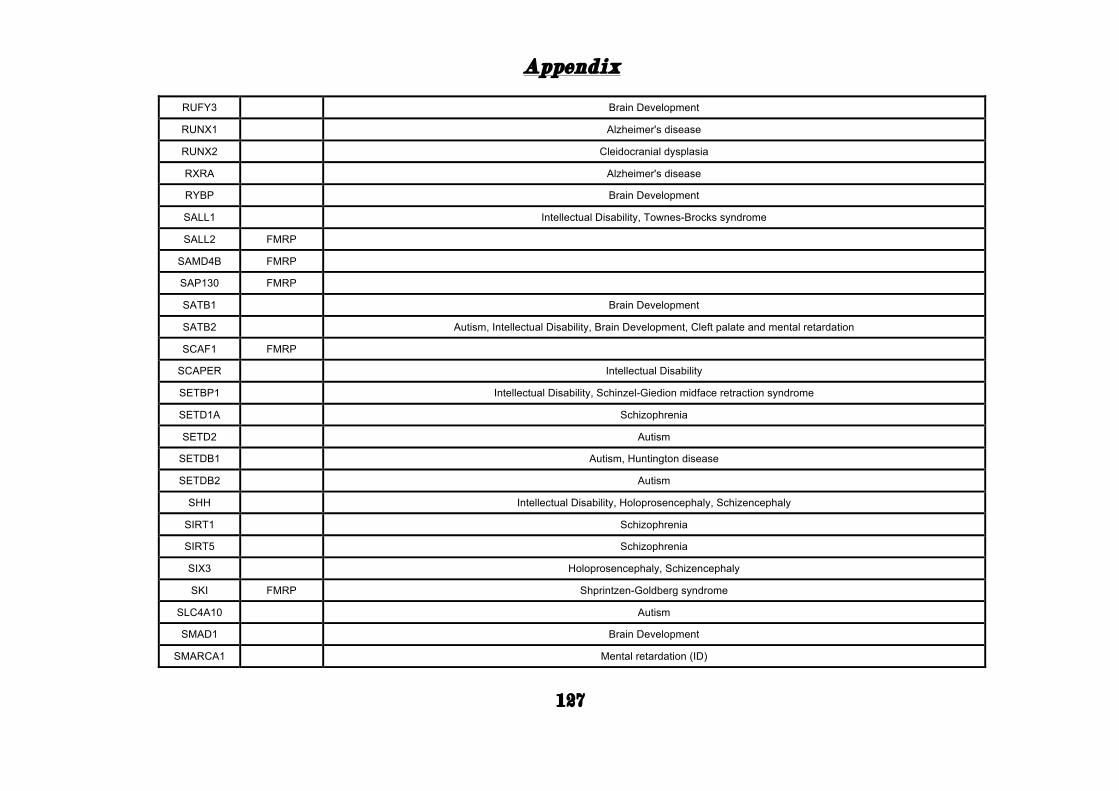
Appendix
127
RUFY3 Brain Development
RUNX1 Alzheimer's disease
RUNX2 Cleidocranial dysplasia
RXRA Alzheimer's disease
RYBP Brain Development
SALL1 Intellectual Disability, Townes-Brocks syndrome
SALL2 FMRP SAMD4B FMRP SAP130 FMRP SATB1 Brain Development
SATB2 Autism, Intellectual Disability, Brain Development, Cleft palate and mental retardation
SCAF1 FMRP SCAPER Intellectual Disability
SETBP1 Intellectual Disability, Schinzel-Giedion midface retraction syndrome
SETD1A Schizophrenia
SETD2 Autism
SETDB1 Autism, Huntington disease
SETDB2 Autism
SHH Intellectual Disability, Holoprosencephaly, Schizencephaly
SIRT1 Schizophrenia
SIRT5 Schizophrenia
SIX3 Holoprosencephaly, Schizencephaly
SKI FMRP Shprintzen-Goldberg syndrome
SLC4A10 Autism
SMAD1 Brain Development
SMARCA1 Mental retardation (ID)
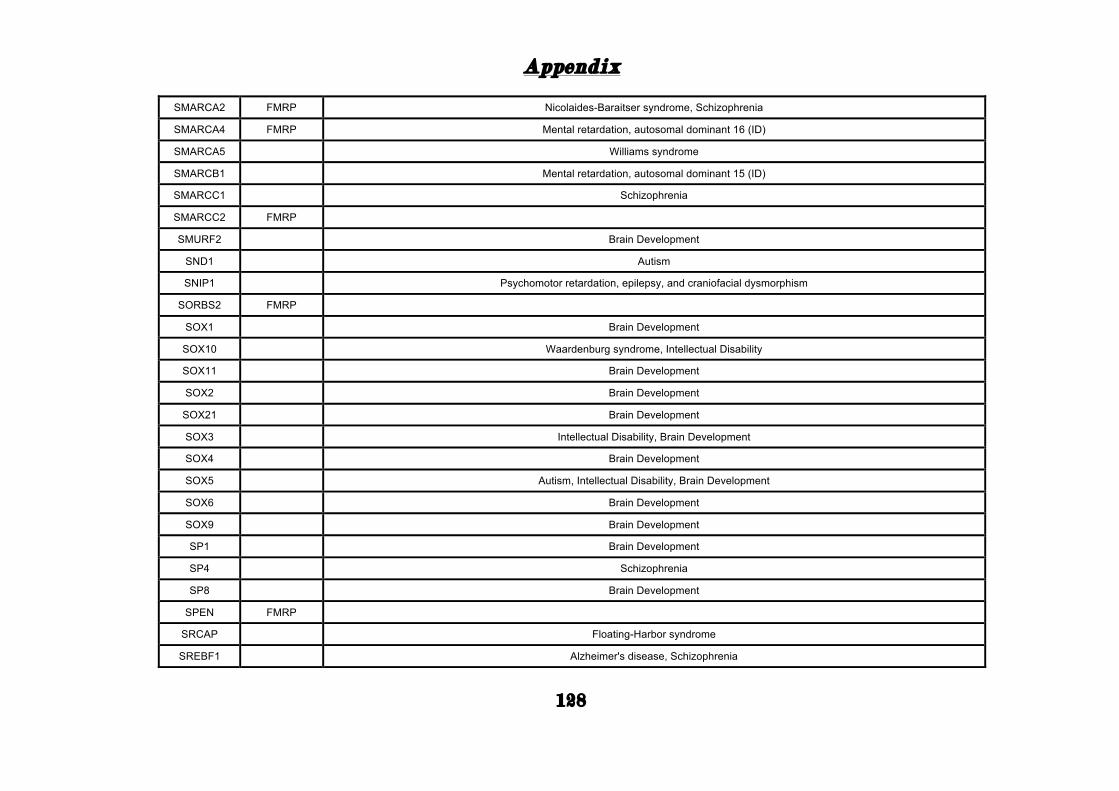
Appendix
128
SMARCA2 FMRP Nicolaides-Baraitser syndrome, Schizophrenia
SMARCA4 FMRP Mental retardation, autosomal dominant 16 (ID)
SMARCA5 Williams syndrome
SMARCB1 Mental retardation, autosomal dominant 15 (ID)
SMARCC1 Schizophrenia
SMARCC2 FMRP SMURF2 Brain Development
SND1 Autism
SNIP1 Psychomotor retardation, epilepsy, and craniofacial dysmorphism
SORBS2 FMRP SOX1 Brain Development
SOX10 Waardenburg syndrome, Intellectual Disability
SOX11 Brain Development
SOX2 Brain Development
SOX21 Brain Development
SOX3 Intellectual Disability, Brain Development
SOX4 Brain Development
SOX5 Autism, Intellectual Disability, Brain Development
SOX6 Brain Development
SOX9 Brain Development
SP1 Brain Development
SP4 Schizophrenia
SP8 Brain Development
SPEN FMRP SRCAP Floating-Harbor syndrome
SREBF1 Alzheimer's disease, Schizophrenia
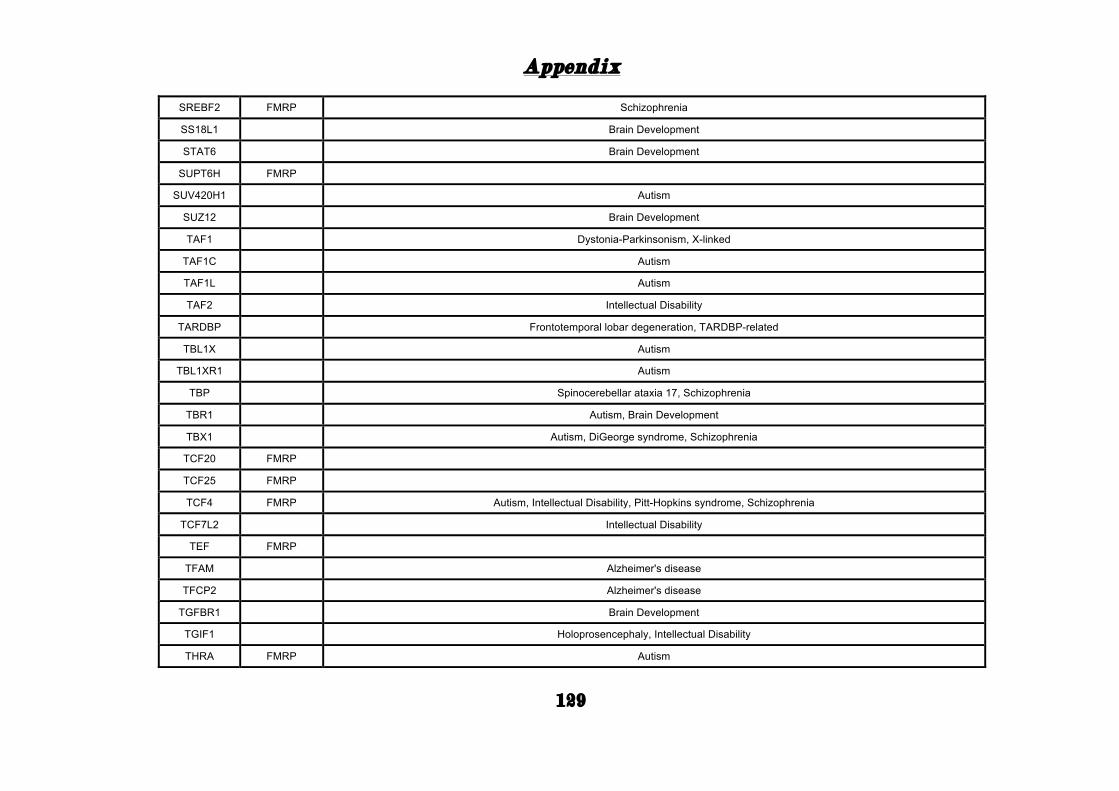
Appendix
129
SREBF2 FMRP Schizophrenia
SS18L1 Brain Development
STAT6 Brain Development
SUPT6H FMRP SUV420H1 Autism
SUZ12 Brain Development
TAF1 Dystonia-Parkinsonism, X-linked
TAF1C Autism
TAF1L Autism
TAF2 Intellectual Disability
TARDBP Frontotemporal lobar degeneration, TARDBP-related
TBL1X Autism
TBL1XR1 Autism
TBP Spinocerebellar ataxia 17, Schizophrenia
TBR1 Autism, Brain Development
TBX1 Autism, DiGeorge syndrome, Schizophrenia
TCF20 FMRP TCF25 FMRP TCF4 FMRP Autism, Intellectual Disability, Pitt-Hopkins syndrome, Schizophrenia
TCF7L2 Intellectual Disability
TEF FMRP TFAM Alzheimer's disease
TFCP2 Alzheimer's disease
TGFBR1 Brain Development
TGIF1 Holoprosencephaly, Intellectual Disability
THRA FMRP Autism
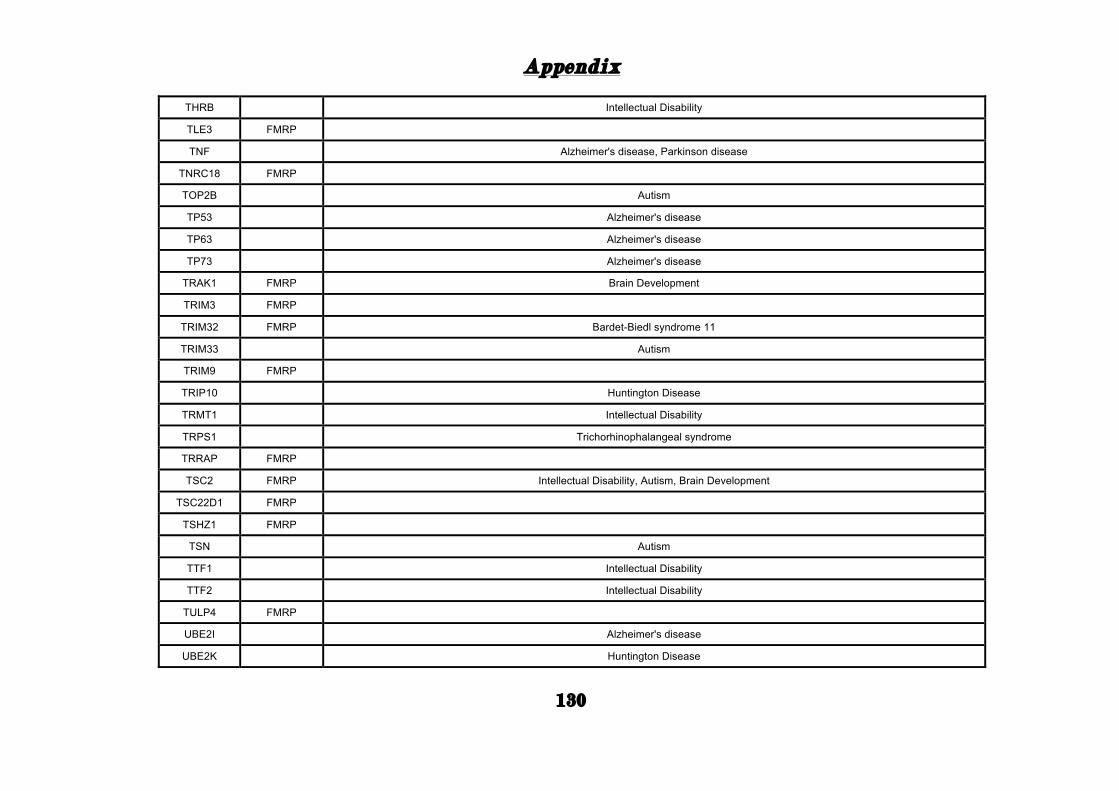
Appendix
130
THRB Intellectual Disability
TLE3 FMRP TNF Alzheimer's disease, Parkinson disease
TNRC18 FMRP TOP2B Autism
TP53 Alzheimer's disease
TP63 Alzheimer's disease
TP73 Alzheimer's disease
TRAK1 FMRP Brain Development
TRIM3 FMRP TRIM32 FMRP Bardet-Biedl syndrome 11
TRIM33 Autism
TRIM9 FMRP TRIP10 Huntington Disease
TRMT1 Intellectual Disability
TRPS1 Trichorhinophalangeal syndrome
TRRAP FMRP TSC2 FMRP Intellectual Disability, Autism, Brain Development
TSC22D1 FMRP TSHZ1 FMRP
TSN Autism
TTF1 Intellectual Disability
TTF2 Intellectual Disability
TULP4 FMRP UBE2I Alzheimer's disease
UBE2K Huntington Disease
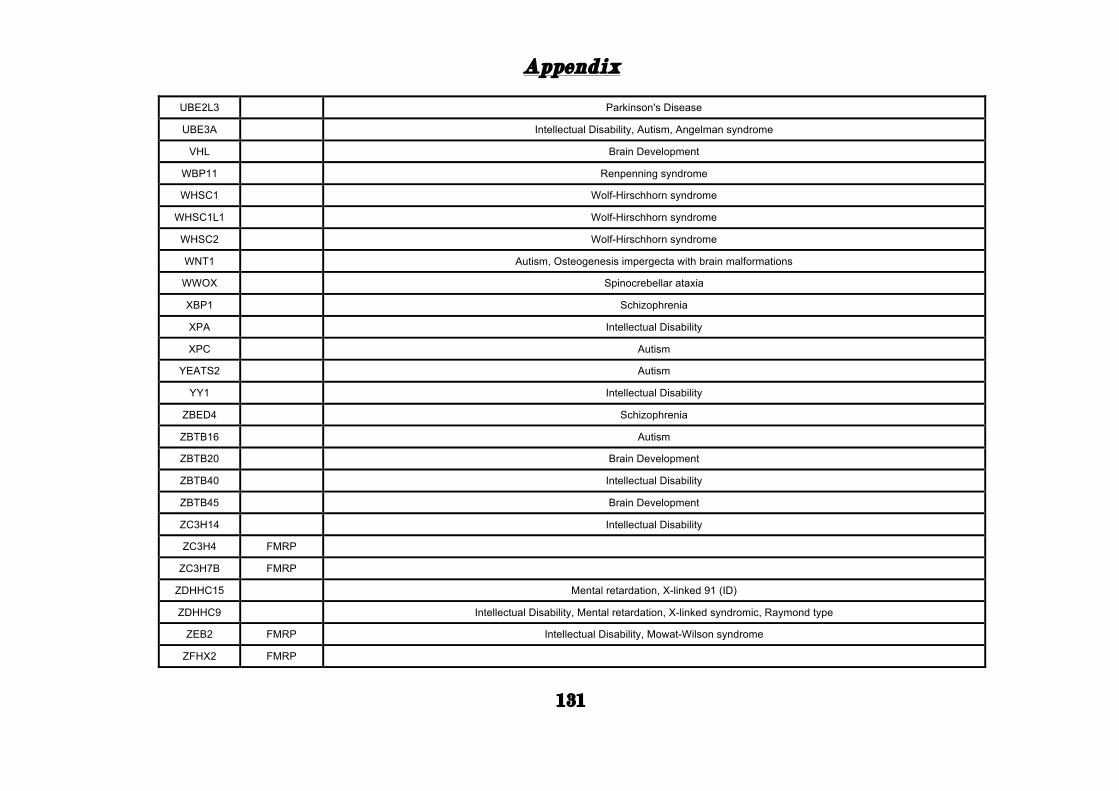
Appendix
131
UBE2L3 Parkinson's Disease
UBE3A Intellectual Disability, Autism, Angelman syndrome
VHL Brain Development
WBP11 Renpenning syndrome
WHSC1 Wolf-Hirschhorn syndrome
WHSC1L1 Wolf-Hirschhorn syndrome
WHSC2 Wolf-Hirschhorn syndrome
WNT1 Autism, Osteogenesis impergecta with brain malformations
WWOX Spinocrebellar ataxia
XBP1 Schizophrenia
XPA Intellectual Disability
XPC Autism
YEATS2 Autism
YY1 Intellectual Disability
ZBED4 Schizophrenia
ZBTB16 Autism
ZBTB20 Brain Development
ZBTB40 Intellectual Disability
ZBTB45 Brain Development
ZC3H14 Intellectual Disability
ZC3H4 FMRP ZC3H7B FMRP
ZDHHC15 Mental retardation, X-linked 91 (ID)
ZDHHC9 Intellectual Disability, Mental retardation, X-linked syndromic, Raymond type
ZEB2 FMRP Intellectual Disability, Mowat-Wilson syndrome
ZFHX2 FMRP
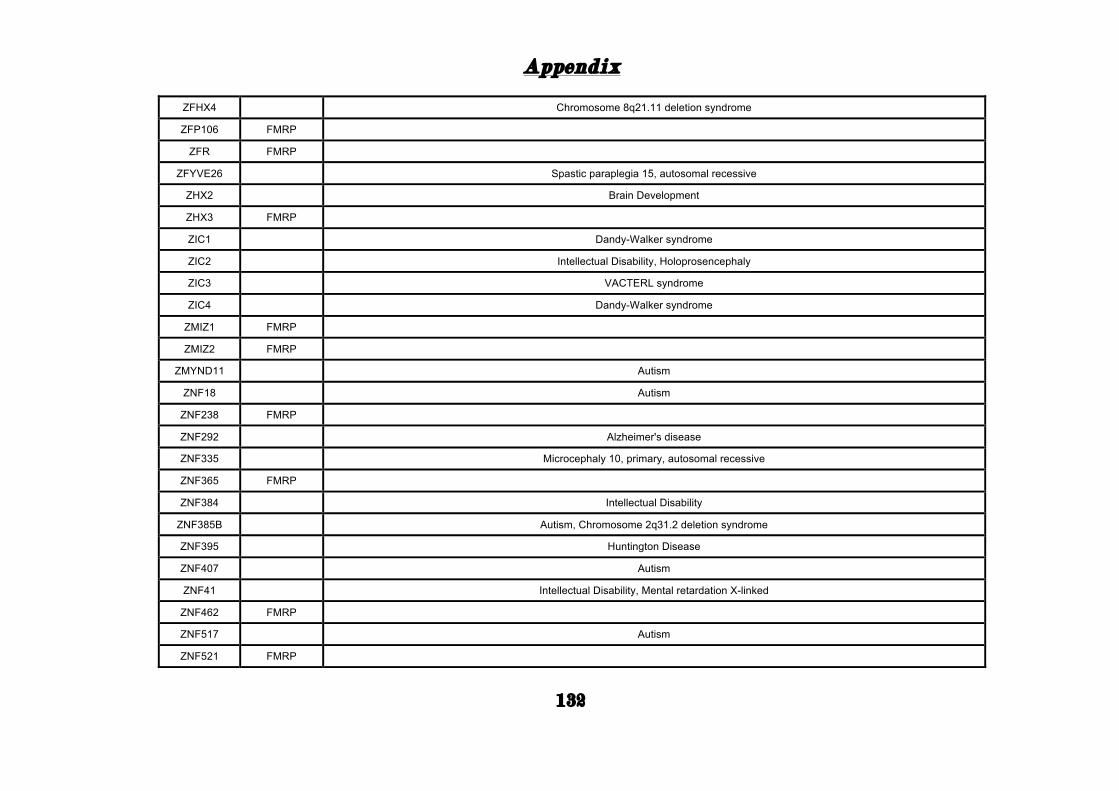
Appendix
132
ZFHX4 Chromosome 8q21.11 deletion syndrome
ZFP106 FMRP ZFR FMRP
ZFYVE26 Spastic paraplegia 15, autosomal recessive
ZHX2 Brain Development
ZHX3 FMRP ZIC1 Dandy-Walker syndrome
ZIC2 Intellectual Disability, Holoprosencephaly
ZIC3 VACTERL syndrome
ZIC4 Dandy-Walker syndrome
ZMIZ1 FMRP ZMIZ2 FMRP
ZMYND11 Autism
ZNF18 Autism
ZNF238 FMRP ZNF292 Alzheimer's disease
ZNF335 Microcephaly 10, primary, autosomal recessive
ZNF365 FMRP ZNF384 Intellectual Disability
ZNF385B Autism, Chromosome 2q31.2 deletion syndrome
ZNF395 Huntington Disease
ZNF407 Autism
ZNF41 Intellectual Disability, Mental retardation X-linked
ZNF462 FMRP ZNF517 Autism
ZNF521 FMRP
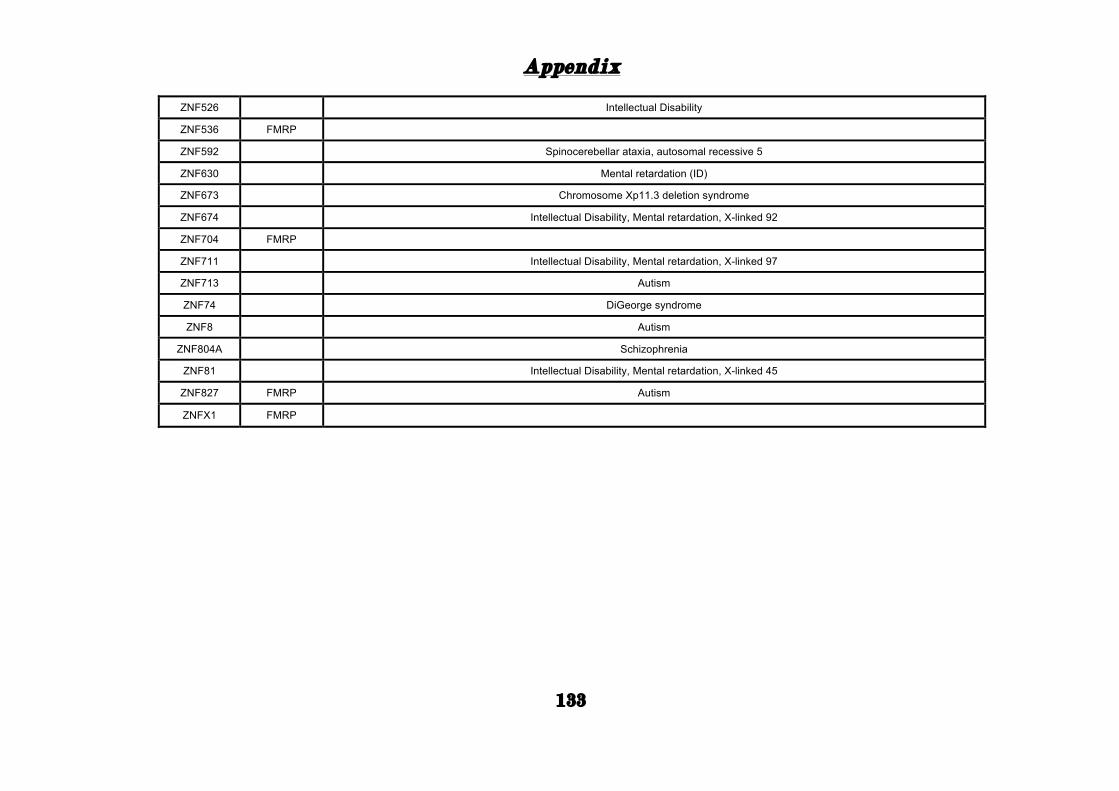
Appendix
133
ZNF526 Intellectual Disability
ZNF536 FMRP ZNF592 Spinocerebellar ataxia, autosomal recessive 5
ZNF630 Mental retardation (ID)
ZNF673 Chromosome Xp11.3 deletion syndrome
ZNF674 Intellectual Disability, Mental retardation, X-linked 92
ZNF704 FMRP ZNF711 Intellectual Disability, Mental retardation, X-linked 97
ZNF713 Autism
ZNF74 DiGeorge syndrome
ZNF8 Autism
ZNF804A Schizophrenia
ZNF81 Intellectual Disability, Mental retardation, X-linked 45
ZNF827 FMRP Autism
ZNFX1 FMRP
Bibliography
134
Bibliography
Adolphs R. 1999. Social cognition and the human brain. Trends in cognitive sciences 3(12): 469-‐479.
Akula N, Barb J, Jiang X, Wendland JR, Choi KH, Sen SK. 2014. RNA-‐sequencing of the brain transcriptome implicates dysregulation of neuroplasticity, circadian rhythms and GTPase binding in bipolar disorder.
Allen NC, Bagade S, McQueen MB, Ioannidis JP, Kavvoura FK, Khoury MJ, Tanzi RE, Bertram L. 2008. Systematic meta-‐analyses and field synopsis of genetic association studies in schizophrenia: the SzGene database. Nat Genet 40(7): 827-‐834.
Anders S, Huber W. 2012. Differential expression of RNA-‐Seq data at the gene level–the DESeq package. Heidelberg, Germany: European Molecular Biology Laboratory (EMBL).
Anders S, Pyl PT, Huber W. 2014. HTSeq–A Python framework to work with high-‐throughput sequencing data. Bioinformatics: btu638.
Andreasen NC. 1995. Symptoms, signs, and diagnosis of schizophrenia. Lancet 346(8973): 477-‐481.
Arbiza L, Gronau I, Aksoy BA, Hubisz MJ, Gulko B, Keinan A, Siepel A. 2013. Genome-‐wide inference of natural selection on human transcription factor binding sites. Nature genetics 45(7): 723-‐729.
Babbitt CC, Fedrigo O, Pfefferle AD, Boyle AP, Horvath JE, Furey TS, Wray GA. 2010. Both noncoding and protein-‐coding RNAs contribute to gene expression evolution in the primate brain. Genome biology and evolution 2: 67-‐79.
Bacon C, Rappold GA. 2012. The distinct and overlapping phenotypic spectra of FOXP1 and FOXP2 in cognitive disorders. Human genetics 131(11): 1687-‐1698.
Bacon C, Schneider M, Le Magueresse C, Froehlich H, Sticht C, Gluch C, Monyer H, Rappold G. 2015. Brain-‐specific Foxp1 deletion impairs neuronal development and causes autistic-‐like behaviour. Molecular psychiatry 20(5): 632-‐639.
Bailey A, Phillips W, Rutter M. 1996. Autism: towards an integration of clinical, genetic, neuropsychological, and neurobiological perspectives. J Child Psychol Psychiatry 37(1): 89-‐126.
Bailey TL. 2011. DREME: motif discovery in transcription factor ChIP-‐seq data. Bioinformatics 27(12): 1653-‐1659.
Bailey TL, Boden M, Buske FA, Frith M, Grant CE, Clementi L, Ren J, Li WW, Noble WS. 2009. MEME SUITE: tools for motif discovery and searching. Nucleic Acids Res 37(Web Server issue): W202-‐208.
Bailey TL, Elkan C. 1994. Fitting a mixture model by expectation maximization to discover motifs in biopolymers. Proceedings / International Conference on Intelligent Systems for Molecular Biology ; ISMB International Conference on Intelligent Systems for Molecular Biology 2: 28-‐36.
Bakken TE, Miller JA, Luo R, Bernard A, Bennett JL, Lee C-‐K, Bertagnolli D, Parikshak NN, Smith KA, Sunkin SM. 2015. Spatiotemporal dynamics of the postnatal developing primate brain transcriptome. Human molecular genetics: ddv166.
Ballester B, Medina-‐Rivera A, Schmidt D, Gonzàlez-‐Porta M, Carlucci M, Chen X, Chessman K, Faure AJ, Funnell AP, Goncalves A. 2014. Multi-‐species, multi-‐transcription factor binding highlights conserved control of tissue-‐specific biological pathways. eLife 3: e02626.
Bibliography
135
Banerjee-‐Basu S, Packer A. 2010. SFARI Gene: an evolving database for the autism research community. Dis Model Mech 3(3-‐4): 133-‐135.
Barnby G, Abbott A, Sykes N, Morris A, Weeks DE, Mott R, Lamb J, Bailey AJ, Monaco AP. 2005. Candidate-‐gene screening and association analysis at the autism-‐susceptibility locus on chromosome 16p: evidence of association at GRIN2A and ABAT. Am J Hum Genet 76(6): 950-‐966.
Basel-‐Vanagaite L, Attia R, Yahav M, Ferland RJ, Anteki L, Walsh CA, Olender T, Straussberg R, Magal N, Taub E. 2006. The CC2D1A, a member of a new gene family with C2 domains, is involved in autosomal recessive non-‐syndromic mental retardation. Journal of medical genetics 43(3): 203-‐210.
Bass JIF, Sahni N, Shrestha S, Garcia-‐Gonzalez A, Mori A, Bhat N, Yi S, Hill DE, Vidal M, Walhout AJ. 2015. Human Gene-‐Centered Transcription Factor Networks for Enhancers and Disease Variants. Cell 161(3): 661-‐673.
Basu SN, Kollu R, Banerjee-‐Basu S. 2009. AutDB: a gene reference resource for autism research. Nucleic Acids Res 37(Database issue): D832-‐836.
Beißbarth T, Speed TP. 2004. GOstat: find statistically overrepresented Gene Ontologies within a group of genes. Bioinformatics 20(9): 1464-‐1465.
Ben-‐David E, Shifman S. 2012. Networks of neuronal genes affected by common and rare variants in autism spectrum disorders. PLoS genetics 8(3): e1002556.
Benedetti F, Dallaspezia S, Fulgosi MC, Lorenzi C, Serretti A, Barbini B, Colombo C, Smeraldi E. 2007. Actimetric evidence that CLOCK 3111 T/C SNP influences sleep and activity patterns in patients affected by bipolar depression. American Journal of Medical Genetics Part B: Neuropsychiatric Genetics 144(5): 631-‐635.
Benedetti F, Serretti A, Colombo C, Barbini B, Lorenzi C, Campori E, Smeraldi E. 2003. Influence of CLOCK gene polymorphism on circadian mood fluctuation and illness recurrence in bipolar depression. American Journal of Medical Genetics Part B: Neuropsychiatric Genetics 123(1): 23-‐26.
Berg JM, Geschwind DH. 2012. Autism genetics: searching for specificity and convergence. Genome Biol 13(7): 247.
Bertram L. 2009. Alzheimer's disease genetics current status and future perspectives. Int Rev Neurobiol 84: 167-‐184.
Bickerton D. 1995. Language and human behavior. University of Washington Press. Blank V, Andrews NC. 1997. The Maf transcription factors: regulators of differentiation.
Trends in biochemical sciences 22(11): 437-‐441. Bowers JM, Konopka G. 2012. The role of the FOXP family of transcription factors in ASD.
Disease markers 33(5): 251-‐260. Boyd R, Richerson PJ, Henrich J. 2011. The cultural niche: why social learning is essential
for human adaptation. Proc Natl Acad Sci U S A 108 Suppl 2: 10918-‐10925. Bozek K, Wei Y, Yan Z, Liu X, Xiong J, Sugimoto M, Tomita M, Pääbo S, Sherwood CC, Hof
PR. 2015. Organization and Evolution of Brain Lipidome Revealed by Large-‐Scale Analysis of Human, Chimpanzee, Macaque, and Mouse Tissues. Neuron 85(4): 695-‐702.
Brown V, Jin P, Ceman S, Darnell JC, O'Donnell WT, Tenenbaum SA, Jin X, Feng Y, Wilkinson KD, Keene JD. 2001. Microarray identification of FMRP-‐associated brain mRNAs and altered mRNA translational profiles in fragile X syndrome. Cell 107(4): 477-‐487.
Bullido MJ, Artiga MJ, Recuero M, Sastre I, Garcia MA, Aldudo J, Lendon C, Han SW, Morris JC, Frank A et al. 1998. A polymorphism in the regulatory region of APOE associated with risk for Alzheimer's dementia. Nat Genet 18(1): 69-‐71.
Buraniqi E, Moodley M. 2015. ZEB2 Gene Mutation and Duplication of 22q11. 23 in Mowat-‐Wilson Syndrome. Journal of child neurology 30(1): 32-‐36.
Bibliography
136
Buxhoeveden DP, Semendeferi K, Buckwalter J, Schenker N, Switzer R, Courchesne E. 2006. Reduced minicolumns in the frontal cortex of patients with autism. Neuropathol Appl Neurobiol 32(5): 483-‐491.
Cáceres M, Lachuer J, Zapala MA, Redmond JC, Kudo L, Geschwind DH, Lockhart DJ, Preuss TM, Barlow C. 2003. Elevated gene expression levels distinguish human from non-‐human primate brains. Proceedings of the National Academy of Sciences 100(22): 13030-‐13035.
Cain CE, Blekhman R, Marioni JC, Gilad Y. 2011. Gene expression differences among primates are associated with changes in a histone epigenetic modification. Genetics 187(4): 1225-‐1234.
Carroll SB. 2003. Genetics and the making of Homo sapiens. Nature 422(6934): 849-‐857. Carvalho BS, Irizarry RA. 2010. A framework for oligonucleotide microarray
preprocessing. Bioinformatics 26(19): 2363-‐2367. Cecconi M, Forzano F, Garavelli L, Pantaleoni C, Grasso M, Dagna Bricarelli F, Perroni L,
Di Maria E, Faravelli F. 2008. Recurrence of Mowat–Wilson syndrome in siblings with a novel mutation in the ZEB2 gene. American Journal of Medical Genetics Part A 146(23): 3095-‐3099.
Chan SF, Huang X, McKercher SR, Zaidi R, Okamoto S-‐i, Nakanishi N, Lipton SA. 2015. Transcriptional profiling of MEF2-‐regulated genes in human neural progenitor cells derived from embryonic stem cells. Genomics data 3: 24-‐27.
Chang JT, Wherry EJ, Goldrath AW. 2014. Molecular regulation of effector and memory T cell differentiation. Nature immunology 15(12): 1104-‐1115.
Chatr-‐Aryamontri A, Breitkreutz BJ, Heinicke S, Boucher L, Winter A, Stark C, Nixon J, Ramage L, Kolas N, O'Donnell L et al. 2013. The BioGRID interaction database: 2013 update. Nucleic Acids Res 41(Database issue): D816-‐823.
Chawla K, Tripathi S, Thommesen L, Lægreid A, Kuiper M. 2013. TFcheckpoint: a curated compendium of specific DNA-‐binding RNA polymerase II transcription factors. Bioinformatics: btt432.
Chayer C, Freedman M. 2001. Frontal lobe functions. Curr Neurol Neurosci Rep 1(6): 547-‐552.
Chen X, Xu H, Yuan P, Fang F, Huss M, Vega VB, Wong E, Orlov YL, Zhang W, Jiang J. 2008. Integration of external signaling pathways with the core transcriptional network in embryonic stem cells. Cell 133(6): 1106-‐1117.
Christensen KE, Patel H, Kuzmanov U, Mejia NR, MacKenzie RE. 2005. Disruption of the mthfd1 gene reveals a monofunctional 10-‐formyltetrahydrofolate synthetase in mammalian mitochondria. Journal of Biological Chemistry 280(9): 7597-‐7602.
Clarke JH, Irvine RF. 2013. Enzyme activity of the PIP4K2A gene product polymorphism that is implicated in schizophrenia. Psychopharmacology 230(2): 329-‐331.
Comijn J, Berx G, Vermassen P, Verschueren K, van Grunsven L, Bruyneel E, Mareel M, Huylebroeck D, Van Roy F. 2001. The two-‐handed E box binding zinc finger protein SIP1 downregulates E-‐cadherin and induces invasion. Molecular cell 7(6): 1267-‐1278.
Consortium EP. 2004. The ENCODE (ENCyclopedia of DNA elements) project. Science 306(5696): 636-‐640.
Coque L, Mukherjee S, Cao J-‐L, Spencer S, Marvin M, Falcon E, Sidor MM, Birnbaum SG, Graham A, Neve RL. 2011. Specific role of VTA dopamine neuronal firing rates and morphology in the reversal of anxiety-‐related, but not depression-‐related behavior in the ClockΔ19 mouse model of mania. Neuropsychopharmacology 36(7): 1478-‐1488.
Bibliography
137
Dannemann M, Lorenc A, Hellmann I, Khaitovich P, Lachmann M. 2009. The effects of probe binding affinity differences on gene expression measurements and how to deal with them. Bioinformatics 25(21): 2772-‐2779.
Darnell JC, Van Driesche SJ, Zhang C, Hung KYS, Mele A, Fraser CE, Stone EF, Chen C, Fak JJ, Chi SW. 2011. FMRP stalls ribosomal translocation on mRNAs linked to synaptic function and autism. Cell 146(2): 247-‐261.
Davidson EH, Rast JP, Oliveri P, Ransick A, Calestani C, Yuh C-‐H, Minokawa T, Amore G, Hinman V, Arenas-‐Mena C. 2002. A genomic regulatory network for development. science 295(5560): 1669-‐1678.
Davies JR, Dent CL, McNamara GI, Isles AR. 2015. Behavioural effects of imprinted genes. Current Opinion in Behavioral Sciences 2: 28-‐33.
De Rubeis S, He X, Goldberg AP, Poultney CS, Samocha K, Ercument Cicek A, Kou Y, Liu L, Fromer M, Walker S et al. 2014. Synaptic, transcriptional and chromatin genes disrupted in autism. Nature advance online publication.
Dean C, Leakey MG, Reid D, Schrenk F, Schwartz GT, Stringer C, Walker A. 2001. Growth processes in teeth distinguish modern humans from Homo erectus and earlier hominins. Nature 414(6864): 628-‐631.
DeFelipe J. 2011. The evolution of the brain, the human nature of cortical circuits, and intellectual creativity. Frontiers in neuroanatomy 5.
Dent CL, Isles AR. 2014. Brain-‐expressed imprinted genes and adult behaviour: the example of Nesp and Grb10. Mammalian Genome 25(1-‐2): 87-‐93.
Devys D, Lutz Y, Rouyer N, Bellocq JP, Mandel JL. 1993. The FMR-‐1 protein is cytoplasmic, most abundant in neurons and appears normal in carriers of a fragile X premutation. Nat Genet 4(4): 335-‐340.
Diefenbach A, Schindler H, Röllinghoff M, Yokoyama WM, Bogdan C. 1999. Requirement for type 2 NO synthase for IL-‐12 signaling in innate immunity. Science 284(5416): 951-‐955.
Domenech P, Koechlin E. 2015. Executive control and decision-‐making in the prefrontal cortex. Current Opinion in Behavioral Sciences 1: 101-‐106.
Donoso M, Collins AG, Koechlin E. 2014. Foundations of human reasoning in the prefrontal cortex. Science 344(6191): 1481-‐1486.
Du Z-‐W, Ma L-‐X, Phillips C, Zhang S-‐C. 2013. miR-‐200 and miR-‐96 families repress neural induction from human embryonic stem cells. Development 140(12): 2611-‐2618.
Dunbar RI, Shultz S. 2007. Evolution in the social brain. Science 317(5843): 1344-‐1347. Duncan J, Emslie H, Williams P, Johnson R, Freer C. 1996. Intelligence and the Frontal
Lobe: The Organization of Goal-‐Directed Behavior. Cognitive Psychology 30(3): 257-‐303.
Ebert DH, Greenberg ME. 2013. Activity-‐dependent neuronal signalling and autism spectrum disorder. Nature 493(7432): 327-‐337.
Ecker C, Suckling J, Deoni SC, Lombardo MV, Bullmore ET, Baron-‐Cohen S, Catani M, Jezzard P, Barnes A, Bailey AJ et al. 2012. Brain anatomy and its relationship to behavior in adults with autism spectrum disorder: a multicenter magnetic resonance imaging study. Arch Gen Psychiatry 69(2): 195-‐209.
Eden E, Navon R, Steinfeld I, Lipson D, Yakhini Z. 2009. GOrilla: a tool for discovery and visualization of enriched GO terms in ranked gene lists. BMC bioinformatics 10(1): 48.
Eden S, Cedar H. 1994. Role of DNA methylation in the regulation of transcription. Current opinion in genetics & development 4(2): 255-‐259.
El-‐Kasti MM, Wells T, Carter DA. 2012. A novel long-‐range enhancer regulates postnatal expression of Zeb2: implications for Mowat–Wilson syndrome phenotypes. Human molecular genetics 21(26): 5429-‐5442.
Bibliography
138
Enard W. 2015. Human Evolution: Enhancing the Brain. Current Biology 25(10): R421-‐R423.
Enard W, Khaitovich P, Klose J, Zöllner S, Heissig F, Giavalisco P, Nieselt-‐Struwe K, Muchmore E, Varki A, Ravid R. 2002a. Intra-‐and interspecific variation in primate gene expression patterns. Science 296(5566): 340-‐343.
Enard W, Przeworski M, Fisher SE, Lai CS, Wiebe V, Kitano T, Monaco AP, Pääbo S. 2002b. Molecular evolution of FOXP2, a gene involved in speech and language. Nature 418(6900): 869-‐872.
Evans E, Einfeld S, Mowat D, Taffe J, Tonge B, Wilson M. 2012. The behavioral phenotype of Mowat–Wilson syndrome. American Journal of Medical Genetics Part A 158(2): 358-‐366.
Evans PD, Vallender EJ, Lahn BT. 2006. Molecular evolution of the brain size regulator genes CDK5RAP2 and CENPJ. Gene 375: 75-‐79.
Fisher SE, Scharff C. 2009. FOXP2 as a molecular window into speech and language. Trends in Genetics 25(4): 166-‐177.
Flavell SW, Kim T-‐K, Gray JM, Harmin DA, Hemberg M, Hong EJ, Markenscoff-‐Papadimitriou E, Bear DM, Greenberg ME. 2008. Genome-‐wide analysis of MEF2 transcriptional program reveals synaptic target genes and neuronal activity-‐dependent polyadenylation site selection. Neuron 60(6): 1022-‐1038.
Gautier L, Cope L, Bolstad BM, Irizarry RA. 2004. affy-‐-‐analysis of Affymetrix GeneChip data at the probe level. Bioinformatics 20(3): 307-‐315.
Gekakis N, Staknis D, Nguyen HB, Davis FC, Wilsbacher LD, King DP, Takahashi JS, Weitz CJ. 1998. Role of the CLOCK protein in the mammalian circadian mechanism. Science 280(5369): 1564-‐1569.
Gheldof A, Hulpiau P, Van Roy F, De Craene B, Berx G. 2012. Evolutionary functional analysis and molecular regulation of the ZEB transcription factors. Cellular and Molecular Life Sciences 69(15): 2527-‐2541.
Gibson KR, Gibson KR, Ingold T. 1994. Tools, language and cognition in human evolution. Cambridge University Press.
Golanska E, Sieruta M, Gresner SM, Hulas-‐Bigoszewska K, Corder EH, Styczynska M, Peplonska B, Barcikowska M, Liberski PP. 2008. Analysis of APBB2 gene polymorphisms in sporadic Alzheimer’s disease. Neuroscience letters 447(2): 164-‐166.
Goossens S, Janzen V, Bartunkova S, Yokomizo T, Drogat B, Crisan M, Haigh K, Seuntjens E, Umans L, Riedt T. 2011. The EMT regulator Zeb2/Sip1 is essential for murine embryonic hematopoietic stem/progenitor cell differentiation and mobilization. Blood 117(21): 5620-‐5630.
Gorbacheva VY, Kondratov RV, Zhang R, Cherukuri S, Gudkov AV, Takahashi JS, Antoch MP. 2005. Circadian sensitivity to the chemotherapeutic agent cyclophosphamide depends on the functional status of the CLOCK/BMAL1 transactivation complex. Proceedings of the National Academy of Sciences of the United States of America 102(9): 3407-‐3412.
Greydanus DE, Pratt HD. 2005. Syndromes and disorders associated with mental retardation. Indian J Pediatr 72(10): 859-‐864.
Groves CP. 2001. Primate taxonomy. Guan JS, Haggarty SJ, Giacometti E, Dannenberg JH, Joseph N, Gao J, Nieland TJ, Zhou Y,
Wang X, Mazitschek R et al. 2009. HDAC2 negatively regulates memory formation and synaptic plasticity. Nature 459(7243): 55-‐60.
Haberland M, Arnold MA, McAnally J, Phan D, Kim Y, Olson EN. 2007. Regulation of HDAC9 gene expression by MEF2 establishes a negative-‐feedback loop in the
Bibliography
139
transcriptional circuitry of muscle differentiation. Molecular and cellular biology 27(2): 518-‐525.
Hai T, Curran T. 1991. Cross-‐family dimerization of transcription factors Fos/Jun and ATF/CREB alters DNA binding specificity. Proceedings of the National Academy of Sciences 88(9): 3720-‐3724.
Hamdan FF, Daoud H, Rochefort D, Piton A, Gauthier J, Langlois M, Foomani G, Dobrzeniecka S, Krebs M-‐O, Joober R. 2010. De novo mutations in FOXP1 in cases with intellectual disability, autism, and language impairment. The American Journal of Human Genetics 87(5): 671-‐678.
Hamosh A, Scott AF, Amberger JS, Bocchini CA, McKusick VA. 2005. Online Mendelian Inheritance in Man (OMIM), a knowledgebase of human genes and genetic disorders. Nucleic Acids Res 33(Database issue): D514-‐517.
Hanotel J, Bessodes N, Thélie A, Hedderich M, Parain K, Van Driessche B, Brandão KDO, Kricha S, Jorgensen MC, Grapin-‐Botton A. 2014. The Prdm13 histone methyltransferase encoding gene is a Ptf1a–Rbpj downstream target that suppresses glutamatergic and promotes GABAergic neuronal fate in the dorsal neural tube. Developmental biology 386(2): 340-‐357.
Hegarty SV, Sullivan AM, O’Keeffe GW. 2015. Zeb2: A multifunctional regulator of nervous system development. Progress in neurobiology.
Heinz S, Benner C, Spann N, Bertolino E, Lin YC, Laslo P, Cheng JX, Murre C, Singh H, Glass CK. 2010. Simple combinations of lineage-‐determining transcription factors prime cis-‐regulatory elements required for macrophage and B cell identities. Molecular cell 38(4): 576-‐589.
Helsmoortel C, Vulto-‐van Silfhout AT, Coe BP, Vandeweyer G, Rooms L, van den Ende J, Schuurs-‐Hoeijmakers JH, Marcelis CL, Willemsen MH, Vissers LE et al. 2014. A SWI/SNF-‐related autism syndrome caused by de novo mutations in ADNP. Nat Genet 46(4): 380-‐384.
Herculano-‐Houzel S. 2009. The human brain in numbers: a linearly scaled-‐up primate brain. Frontiers in human neuroscience 3.
Hoffmann S, Otto C, Kurtz S, Sharma CM, Khaitovich P, Vogel J, Stadler PF, Hackermuller J. 2009. Fast mapping of short sequences with mismatches, insertions and deletions using index structures. PLoS Comput Biol 5(9): e1000502.
Hofman MA. 1983. Energy metabolism, brain size and longevity in mammals. Quarterly Review of Biology: 495-‐512.
Huang DW, Sherman BT, Lempicki RA. 2008. Systematic and integrative analysis of large gene lists using DAVID bioinformatics resources. Nature protocols 4(1): 44-‐57.
Ihaka R, Gentleman R. 1996. R: a language for data analysis and graphics. Journal of computational and graphical statistics 5(3): 299-‐314.
Inlow JK, Restifo LL. 2004. Molecular and comparative genetics of mental retardation. Genetics 166(2): 835-‐881.
Iossifov I, O/'Roak BJ, Sanders SJ, Ronemus M, Krumm N, Levy D, Stessman HA, Witherspoon KT, Vives L, Patterson KE et al. 2014. The contribution of de novo coding mutations to autism spectrum disorder. Nature 515(7526): 216-‐221.
Izumi H, Kaneko Y. 2014. Trim32 facilitates degradation of MYCN on spindle poles and induces asymmetric cell division in human neuroblastoma cells. Cancer research 74(19): 5620-‐5630.
Izumi K, Nakato R, Zhang Z, Edmondson AC, Noon S, Dulik MC, Rajagopalan R, Venditti CP, Gripp K, Samanich J. 2015. Germline gain-‐of-‐function mutations in AFF4 cause a developmental syndrome functionally linking the super elongation complex and cohesin. Nature genetics 47(4): 338-‐344.
Bibliography
140
Jia X, Miao Z, Li W, Zhang L, Feng C, He Y, Bi X, Wang L, Du Y, Hou M. 2014. Cancer-‐Risk Module Identification and Module-‐Based Disease Risk Evaluation: A Case Study on Lung Cancer. PloS one 9(3): e92395.
Jolma A, Yan J, Whitington T, Toivonen J, Nitta KR, Rastas P, Morgunova E, Enge M, Taipale M, Wei G et al. 2013. DNA-‐binding specificities of human transcription factors. Cell 152(1-‐2): 327-‐339.
Jones PA, Takai D. 2001. The role of DNA methylation in mammalian epigenetics. Science 293(5532): 1068-‐1070.
Jordan-‐Sciutto KL, Dragich JM, Caltagarone J, Hall DJ, Bowser R. 2000. Fetal Alz-‐50 Clone 1 (FAC1) Protein Interacts with the Myc-‐Associated Zinc Finger Protein (ZF87/MAZ) and Alters Its Transcriptional Activity†. Biochemistry 39(12): 3206-‐3215.
Kang HJ, Kawasawa YI, Cheng F, Zhu Y, Xu X, Li M, Sousa AM, Pletikos M, Meyer KA, Sedmak G et al. 2011. Spatio-‐temporal transcriptome of the human brain. Nature 478(7370): 483-‐489.
Kaufman L, Ayub M, Vincent JB. 2010. The genetic basis of non-‐syndromic intellectual disability: a review. J Neurodev Disord 2(4): 182-‐209.
Kaur H, Jajodia A, Grover S, Baghel R, Gupta M, Jain S, Kukreti R. 2014. Genetic variations of PIP4K2A confer vulnerability to poor antipsychotic response in severely ill schizophrenia patients.
Khaitovich P, Enard W, Lachmann M, Pääbo S. 2006. Evolution of primate gene expression. Nature Reviews Genetics 7(9): 693-‐702.
Kim J, Bergmann A, Wehri E, Lu X, Stubbs L. 2001. Imprinting and evolution of two Kruppel-‐type zinc-‐finger genes, ZIM3 and ZNF264, located in the PEG3/USP29 imprinted domain. Genomics 77(1): 91-‐98.
Kim J, Chu J, Shen X, Wang J, Orkin SH. 2008. An extended transcriptional network for pluripotency of embryonic stem cells. Cell 132(6): 1049-‐1061.
Kim M-‐S, Pinto SM, Getnet D, Nirujogi RS, Manda SS, Chaerkady R, Madugundu AK, Kelkar DS, Isserlin R, Jain S et al. 2014. A draft map of the human proteome. Nature 509(7502): 575-‐581.
King M-‐C, Wilson AC. 1975. Evolution at two levels in humans and chimpanzees. Science 188(4184): 107-‐116.
Ko CH, Takahashi JS. 2006. Molecular components of the mammalian circadian clock. Human molecular genetics 15(suppl 2): R271-‐R277.
Koechlin E, Ody C, Kouneiher F. 2003. The architecture of cognitive control in the human prefrontal cortex. Science 302(5648): 1181-‐1185.
Konopka G, Bomar JM, Winden K, Coppola G, Jonsson ZO, Gao F, Peng S, Preuss TM, Wohlschlegel JA, Geschwind DH. 2009. Human-‐specific transcriptional regulation of CNS development genes by FOXP2. Nature 462(7270): 213-‐217.
Konopka G, Friedrich T, Davis-‐Turak J, Winden K, Oldham MC, Gao F, Chen L, Wang G-‐Z, Luo R, Preuss TM. 2012. Human-‐specific transcriptional networks in the brain. Neuron 75(4): 601-‐617.
Krause J, Lalueza-‐Fox C, Orlando L, Enard W, Green RE, Burbano HA, Hublin J-‐J, Hänni C, Fortea J, De La Rasilla M. 2007. The derived FOXP2 variant of modern humans was shared with Neandertals. Current Biology 17(21): 1908-‐1912.
Kushwaha R, Jagadish N, Kustagi M, Tomishima MJ, Mendiratta G, Bansal M, Kim HR, Sumazin P, Alvarez MJ, Lefebvre C. 2015. Interrogation of a Context-‐Specific Transcription Factor Network Identifies Novel Regulators of Pluripotency. Stem Cells 33(2): 367-‐377.
Bibliography
141
Lachmann A, Xu H, Krishnan J, Berger SI, Mazloom AR, Ma'ayan A. 2010. ChEA: transcription factor regulation inferred from integrating genome-‐wide ChIP-‐X experiments. Bioinformatics 26(19): 2438-‐2444.
Lai CS, Fisher SE, Hurst JA, Vargha-‐Khadem F, Monaco AP. 2001. A forkhead-‐domain gene is mutated in a severe speech and language disorder. Nature 413(6855): 519-‐523.
Lawrence M, Huber W, Pages H, Aboyoun P, Carlson M, Gentleman R, Morgan MT, Carey VJ. 2013a. Software for computing and annotating genomic ranges. PLoS computational biology 9(8): e1003118.
Lawrence M, Huber W, Pagès H, Aboyoun P, Carlson M, Gentleman R, Morgan MT, Carey VJ. 2013b. Software for Computing and Annotating Genomic Ranges. PLoS computational biology 9(8): e1003118.
Leifer D, Golden J, Kowall N. 1994. Myocyte-‐specific enhancer binding factor 2C expression in human brain development. Neuroscience 63(4): 1067-‐1079.
Levenson JM, O'Riordan KJ, Brown KD, Trinh MA, Molfese DL, Sweatt JD. 2004. Regulation of histone acetylation during memory formation in the hippocampus. Journal of Biological Chemistry 279(39): 40545-‐40559.
Li Q, Lee J-‐A, Black DL. 2007. Neuronal regulation of alternative pre-‐mRNA splicing. Nat Rev Neurosci 8(11): 819-‐831.
Li S, Weidenfeld J, Morrisey EE. 2004. Transcriptional and DNA binding activity of the Foxp1/2/4 family is modulated by heterotypic and homotypic protein interactions. Molecular and cellular biology 24(2): 809-‐822.
Li Y, Hollingworth P, Moore P, Foy C, Archer N, Powell J, Nowotny P, Holmans P, O'Donovan M, Tacey K. 2005. Genetic association of the APP binding protein 2 gene (APBB2) with late onset Alzheimer disease. Human mutation 25(3): 270-‐277.
Lill CM, Roehr JT, McQueen MB, Kavvoura FK, Bagade S, Schjeide BM, Schjeide LM, Meissner E, Zauft U, Allen NC et al. 2012. Comprehensive research synopsis and systematic meta-‐analyses in Parkinson's disease genetics: The PDGene database. PLoS Genet 8(3): e1002548.
Lin X, Shah S, Bulleit RF. 1996. The expression of MEF2 genes is implicated in CNS neuronal differentiation. Molecular brain research 42(2): 307-‐316.
Liu L, Lei J, Sanders SJ, Willsey AJ, Kou Y, Cicek AE, Klei L, Lu C, He X, Li M et al. 2014a. DAWN: a framework to identify autism genes and subnetworks using gene expression and genetics. Molecular autism 5(1): 22.
Liu R, Cheng Y, Yu J, Lv Q-‐L, Zhou H-‐H. 2015. Identification and validation of gene module associated with lung cancer through co-‐expression network analysis. Gene.
Liu S, Wang Y, Worley PF, Mattson MP, Gaiano N. 2014b. The canonical Notch pathway effector RBP-‐J regulates neuronal plasticity and expression of GABA transporters in hippocampal networks. Hippocampus.
Liu X, Somel M, Tang L, Yan Z, Jiang X, Guo S, Yuan Y, He L, Oleksiak A, Zhang Y et al. 2012. Extension of cortical synaptic development distinguishes humans from chimpanzees and macaques. Genome Res 22(4): 611-‐622.
Looman C, Åbrink M, Mark C, Hellman L. 2002. KRAB zinc finger proteins: an analysis of the molecular mechanisms governing their increase in numbers and complexity during evolution. Molecular biology and evolution 19(12): 2118-‐2130.
Lopez-‐Pajares V, Qu K, Zhang J, Webster DE, Barajas BC, Siprashvili Z, Zarnegar BJ, Boxer LD, Rios EJ, Tao S. 2015. A LncRNA-‐MAF: MAFB Transcription Factor Network Regulates Epidermal Differentiation. Developmental cell 32(6): 693-‐706.
Bibliography
142
Lozano R, Vino A, Lozano C, Fisher SE, Deriziotis P. 2015. A de novo FOXP1 variant in a patient with autism, intellectual disability and severe speech and language impairment. European journal of human genetics.
Lubs HA, Stevenson RE, Schwartz CE. 2012. Fragile X and X-‐linked intellectual disability: four decades of discovery. Am J Hum Genet 90(4): 579-‐590.
Luehr S, Hartmann H, Söding J. 2012. The XXmotif web server for eXhaustive, weight matriX-‐based motif discovery in nucleotide sequences. Nucleic acids research 40(W1): W104-‐W109.
Lyons MR, Schwarz CM, West AE. 2012. Members of the myocyte enhancer factor 2 transcription factor family differentially regulate Bdnf transcription in response to neuronal depolarization. The Journal of Neuroscience 32(37): 12780-‐12785.
Magnaghi P, Roberts C, Lorain S, Lipinski M, Scambler PJ. 1998. HIRA, a mammalian homologue of Saccharomyces cerevisiae transcriptional co-‐repressors, interacts with Pax3. Nature genetics 20(1): 74-‐77.
Manzini MC, Xiong L, Shaheen R, Tambunan DE, Di Costanzo S, Mitisalis V, Tischfield DJ, Cinquino A, Ghaziuddin M, Christian M. 2014. CC2D1A Regulates Human Intellectual and Social Function as well as NF-‐κB Signaling Homeostasis. Cell reports 8(3): 647-‐655.
Mathelier A, Zhao X, Zhang AW, Parcy F, Worsley-‐Hunt R, Arenillas DJ, Buchman S, Chen C-‐y, Chou A, Ienasescu H et al. 2013. JASPAR 2014: an extensively expanded and updated open-‐access database of transcription factor binding profiles. Nucleic Acids Research.
Matys V, Fricke E, Geffers R, Gößling E, Haubrock M, Hehl R, Hornischer K, Karas D, Kel AE, Kel-‐Margoulis OV. 2003. TRANSFAC®: transcriptional regulation, from patterns to profiles. Nucleic acids research 31(1): 374-‐378.
McQuown SC, Barrett RM, Matheos DP, Post RJ, Rogge GA, Alenghat T, Mullican SE, Jones S, Rusche JR, Lazar MA. 2011. HDAC3 is a critical negative regulator of long-‐term memory formation. The Journal of Neuroscience 31(2): 764-‐774.
Mekel-‐Bobrov N, Gilbert SL, Evans PD, Vallender EJ, Anderson JR, Hudson RR, Tishkoff SA, Lahn BT. 2005. Ongoing adaptive evolution of ASPM, a brain size determinant in Homo sapiens. Science 309(5741): 1720-‐1722.
Menet JS, Rosbash M. 2011. When brain clocks lose track of time: cause or consequence of neuropsychiatric disorders. Current opinion in neurobiology 21(6): 849-‐857.
Momb J, Appling DR. 2014. Mitochondrial one-‐carbon metabolism and neural tube defects. Birth Defects Research Part A: Clinical and Molecular Teratology 100(8): 576-‐583.
Momb J, Lewandowski JP, Bryant JD, Fitch R, Surman DR, Vokes SA, Appling DR. 2013. Deletion of Mthfd1l causes embryonic lethality and neural tube and craniofacial defects in mice. Proceedings of the National Academy of Sciences 110(2): 549-‐554.
Montgomery SH, Mundy NI. 2012. Evolution of ASPM is associated with both increases and decreases in brain size in primates. Evolution 66(3): 927-‐932.
Nagase T, Ishikawa K-‐i, Suyama M, Kikuno R, Hirosawa M, Miyajima N, Tanaka A, Kotani H, Nomura N, Ohara O. 1998. Prediction of the coding sequences of unidentified human genes. XII. The complete sequences of 100 new cDNA clones from brain which code for large proteins in vitro. DNA Research 5(6): 355-‐364.
Nam E-‐H, Lee Y, Park Y-‐K, Lee JW, Kim S. 2012. ZEB2 upregulates integrin α5 expression through cooperation with Sp1 to induce invasion during epithelial–mesenchymal transition of human cancer cells. Carcinogenesis: bgs005.
Bibliography
143
Neph S, Stergachis AB, Reynolds A, Sandstrom R, Borenstein E, Stamatoyannopoulos JA. 2012. Circuitry and dynamics of human transcription factor regulatory networks. Cell 150(6): 1274-‐1286.
Neubert FX, Mars RB, Thomas AG, Sallet J, Rushworth MF. 2014. Comparison of human ventral frontal cortex areas for cognitive control and language with areas in monkey frontal cortex. Neuron 81(3): 700-‐713.
Nievergelt CM, Kripke DF, Barrett TB, Burg E, Remick RA, Sadovnick AD, McElroy SL, Keck PE, Schork NJ, Kelsoe JR. 2006. Suggestive evidence for association of the circadian genes PERIOD3 and ARNTL with bipolar disorder. American Journal of Medical Genetics Part B: Neuropsychiatric Genetics 141B(3): 234-‐241.
Noble W. 1996. Human evolution, language and mind: a psychological and archaeological inquiry. CUP Archive.
Nord AS, Pattabiraman K, Visel A, Rubenstein JL. 2015. Genomic Perspectives of Transcriptional Regulation in Forebrain Development. Neuron 85(1): 27-‐47.
Novara F, Beri S, Giorda R, Ortibus E, Nageshappa S, Darra F, Dalla Bernardina B, Zuffardi O, Van Esch H. 2010. Refining the phenotype associated with MEF2C haploinsufficiency. Clinical Genetics 78(5): 471-‐477.
Nowick K, Fields C, Gernat T, Caetano-‐Anolles D, Kholina N, Stubbs L. 2011. Gain, loss and divergence in primate zinc-‐finger genes: a rich resource for evolution of gene regulatory differences between species. PLoS One 6(6): e21553.
Nowick K, Gernat T, Almaas E, Stubbs L. 2009. Differences in human and chimpanzee gene expression patterns define an evolving network of transcription factors in brain. Proc Natl Acad Sci U S A 106(52): 22358-‐22363.
Nowick K, Hamilton AT, Zhang H, Stubbs L. 2010. Rapid sequence and expression divergence suggest selection for novel function in primate-‐specific KRAB-‐ZNF genes. Mol Biol Evol 27(11): 2606-‐2617.
Oberheim NA, Takano T, Han X, He W, Lin JH, Wang F, Xu Q, Wyatt JD, Pilcher W, Ojemann JG. 2009. Uniquely hominid features of adult human astrocytes. The Journal of Neuroscience 29(10): 3276-‐3287.
Ohayon D, Ventéo S, Sonrier C, Lafon P-‐A, Garcès A, Valmier J, Rivat C, Topilko P, Carroll P, Pattyn A. 2015. Zeb Family Members and Boundary Cap Cells Underlie Developmental Plasticity of Sensory Nociceptive Neurons. Developmental cell 33(3): 343-‐350.
Oldham MC, Horvath S, Geschwind DH. 2006. Conservation and evolution of gene co-‐expression networks in human and chimpanzee brains. Proceedings of the National Academy of Sciences 103(47): 17973-‐17978.
Orban GA, Van Essen D, Vanduffel W. 2004. Comparative mapping of higher visual areas in monkeys and humans. Trends in cognitive sciences 8(7): 315-‐324.
Oz S, Ivashko-‐Pachima Y, Gozes I. 2012. The ADNP derived peptide, NAP modulates the tubulin pool: implication for neurotrophic and neuroprotective activities. PLoS One 7(12): e51458.
Parikshak NN, Luo R, Zhang A, Won H, Lowe JK, Chandran V, Horvath S, Geschwind DH. 2013. Integrative functional genomic analyses implicate specific molecular pathways and circuits in autism. Cell 155(5): 1008-‐1021.
Parker-‐Katiraee L, Carson AR, Yamada T, Arnaud P, Feil R, Abu-‐Amero SN, Moore GE, Kaneda M, Perry GH, Stone AC. 2007. Identification of the imprinted KLF14 transcription factor undergoing human-‐specific accelerated evolution. PLoS genetics 3(5): e65.
Peixoto L, Abel T. 2013. The role of histone acetylation in memory formation and cognitive impairments. Neuropsychopharmacology 38(1): 62-‐76.
Bibliography
144
Pinker S. 2010. The cognitive niche: Coevolution of intelligence, sociality, and language. Proceedings of the National Academy of Sciences 107(Supplement 2): 8993-‐8999.
Pinto D Delaby E Merico D Barbosa M Merikangas A Klei L Thiruvahindrapuram B Xu X Ziman R Wang Z et al. 2014. Convergence of genes and cellular pathways dysregulated in autism spectrum disorders. Am J Hum Genet 94(5): 677-‐694.
Pollard KS, Salama SR, Lambert N, Lambot M-‐A, Coppens S, Pedersen JS, Katzman S, King B, Onodera C, Siepel A et al. 2006. An RNA gene expressed during cortical development evolved rapidly in humans. Nature 443(7108): 167-‐172.
Polymeropoulos MH. 2000. Genetics of Parkinson's disease. Ann N Y Acad Sci 920: 28-‐32. Ponting C, Jackson AP. 2005. Evolution of primary microcephaly genes and the
enlargement of primate brains. Current opinion in genetics & development 15(3): 241-‐248.
Potthoff MJ, Olson EN. 2007. MEF2: a central regulator of diverse developmental programs. Development 134(23): 4131-‐4140.
Povinelli DJ, Preuss TM. 1995. Theory of mind: evolutionary history of a cognitive specialization. Trends in neurosciences 18(9): 418-‐424.
Prufer K, Muetzel B, Do HH, Weiss G, Khaitovich P, Rahm E, Paabo S, Lachmann M, Enard W. 2007. FUNC: a package for detecting significant associations between gene sets and ontological annotations. BMC Bioinformatics 8: 41.
Pulvers JN, Journiac N, Arai Y, Nardelli J. 2015. MCPH1: a window into brain development and evolution. Frontiers in cellular neuroscience 9.
Qin Z, Ren F, Xu X, Ren Y, Li H, Wang Y, Zhai Y, Chang Z. 2009. ZNF536, a novel zinc finger protein specifically expressed in the brain, negatively regulates neuron differentiation by repressing retinoic acid-‐induced gene transcription. Molecular and cellular biology 29(13): 3633-‐3643.
Quinlan AR, Hall IM. 2010. BEDTools: a flexible suite of utilities for comparing genomic features. Bioinformatics 26(6): 841-‐842.
Rattray M. 2012. New insights on regulation of LMTK2, a membrane kinase integrating pathways central to neurodegeneration. Journal of neurochemistry 121(3): 327-‐328.
Rauch A, Wieczorek D, Graf E, Wieland T, Endele S, Schwarzmayr T, Albrecht B, Bartholdi D, Beygo J, Di Donato N et al. 2012. Range of genetic mutations associated with severe non-‐syndromic sporadic intellectual disability: an exome sequencing study. The Lancet 380(9854): 1674-‐1682.
Ravassard P, Côté F, Grondin B, amp, x, Bazinet M, Mallet J, Aubry M. 1999. ZNF74, a Gene Deleted in DiGeorge Syndrome, Is Expressed in Human Neural Crest-‐Derived Tissues and Foregut Endoderm Epithelia. Genomics 62(1): 82-‐85.
Richter JD, Klann E. 2009. Making synaptic plasticity and memory last: mechanisms of translational regulation. Genes & development 23(1): 1-‐11.
Rilling JK. 2014. Comparative primate neuroimaging: insights into human brain evolution. Trends in cognitive sciences 18(1): 46-‐55.
Rilling JK, Glasser MF, Preuss TM, Ma X, Zhao T, Hu X, Behrens TE. 2008. The evolution of the arcuate fasciculus revealed with comparative DTI. Nat Neurosci 11(4): 426-‐428.
Rimol LM, Agartz I, Djurovic S, Brown AA, Roddey JC, Kähler AK, Mattingsdal M, Athanasiu L, Joyner AH, Schork NJ. 2010. Sex-‐dependent association of common variants of microcephaly genes with brain structure. Proceedings of the National Academy of Sciences 107(1): 384-‐388.
Robinson GE, Fernald RD, Clayton DF. 2008. Genes and social behavior. science 322(5903): 896-‐900.

Bibliography
145
Rogaeva A, Galaraga K, Albert PR. 2007. The Freud-‐1/CC2D1A family: Transcriptional regulators implicated in mental retardation. Journal of neuroscience research 85(13): 2833-‐2838.
Rogers CD, Saxena A, Bronner ME. 2013. Sip1 mediates an E-‐cadherin-‐to-‐N-‐cadherin switch during cranial neural crest EMT. The Journal of cell biology 203(5): 835-‐847.
Ropers HH. 2008. Genetics of intellectual disability. Curr Opin Genet Dev 18(3): 241-‐250. Rosenfeld JA, Leppig K, Ballif BC, Thiese H, Erdie-‐Lalena C, Bawle E, Sastry S, Spence JE,
Bandholz A, Surti U et al. 2009. Genotype-‐phenotype analysis of TCF4 mutations causing Pitt-‐Hopkins syndrome shows increased seizure activity with missense mutations. Genet Med 11(11): 797-‐805.
Rossin EJ, Lage K, Raychaudhuri S, Xavier RJ, Tatar D, Benita Y, Cotsapas C, Daly MJ. 2011. Proteins encoded in genomic regions associated with immune-‐mediated disease physically interact and suggest underlying biology. PLoS Genet 7(1): e1001273.
Roth G, Dicke U. 2005. Evolution of the brain and intelligence. Trends in Cognitive Sciences 9(5): 250-‐257.
Ryan MM, Lockstone HE, Huffaker SJ, Wayland MT, Webster MJ, Bahn S. 2006. Gene expression analysis of bipolar disorder reveals downregulation of the ubiquitin cycle and alterations in synaptic genes. Mol Psychiatry 11(10): 965-‐978.
Saitsu H, Igarashi N, Kato M, Okada I, Kosho T, Shimokawa O, Sasaki Y, Nishiyama K, Tsurusaki Y, Miyake N. 2011. De novo 5q14. 3 translocation 121.5-‐kb upstream of MEF2C in a patient with severe intellectual disability and early-‐onset epileptic encephalopathy. American Journal of Medical Genetics Part A 155(11): 2879-‐2884.
Sato S, Tomomori-‐Sato C, Parmely TJ, Florens L, Zybailov B, Swanson SK, Banks CA, Jin J, Cai Y, Washburn MP et al. 2004. A set of consensus mammalian mediator subunits identified by multidimensional protein identification technology. Molecular cell 14(5): 685-‐691.
Schmidt D, Wilson MD, Ballester B, Schwalie PC, Brown GD, Marshall A, Kutter C, Watt S, Martinez-‐Jimenez CP, Mackay S. 2010. Five-‐vertebrate ChIP-‐seq reveals the evolutionary dynamics of transcription factor binding. Science 328(5981): 1036-‐1040.
Schoenemann PT. 2006. Evolution of the size and functional areas of the human brain. Annu Rev Anthropol 35: 379-‐406.
Schoenemann PT, Sheehan MJ, Glotzer LD. 2005. Prefrontal white matter volume is disproportionately larger in humans than in other primates. Nat Neurosci 8(2): 242-‐252.
Schwalie PC, Ward MC, Cain CE, Faure AJ, Gilad Y, Odom DT, Flicek P. 2013. Co-‐binding by YY1 identifies the transcriptionally active, highly conserved set of CTCF-‐bound regions in primate genomes. Genome Biol 14(12): R148.
Schwamborn JC, Muller M, Becker AH, Puschel AW. 2007. Ubiquitination of the GTPase Rap1B by the ubiquitin ligase Smurf2 is required for the establishment of neuronal polarity. Embo j 26(5): 1410-‐1422.
Scrandis DA. 2014. Identification and management of bipolar disorder. Nurse Pract. Sebat J, Lakshmi B, Malhotra D, Troge J, Lese-‐Martin C, Walsh T, Yamrom B, Yoon S,
Krasnitz A, Kendall J et al. 2007. Strong Association of De Novo Copy Number Mutations with Autism. Science (New York, NY) 316(5823): 445-‐449.
Semendeferi K, Lu A, Schenker N, Damásio H. 2002. Humans and great apes share a large frontal cortex. Nature neuroscience 5(3): 272-‐276.
Bibliography
146
Semendeferi K, Teffer K, Buxhoeveden DP, Park MS, Bludau S, Amunts K, Travis K, Buckwalter J. 2011. Spatial organization of neurons in the frontal pole sets humans apart from great apes. Cereb Cortex 21(7): 1485-‐1497.
Shalgi R, Lieber D, Oren M, Pilpel Y. 2007. Global and local architecture of the mammalian microRNA-‐transcription factor regulatory network. PLoS Comput Biol 3(7): e131.
Sherwood CC, Stimpson CD, Raghanti MA, Wildman DE, Uddin M, Grossman LI, Goodman M, Redmond JC, Bonar CJ, Erwin JM. 2006. Evolution of increased glia–neuron ratios in the human frontal cortex. Proceedings of the National Academy of Sciences 103(37): 13606-‐13611.
Shettleworth SJ. 2009. Cognition, evolution, and behavior. Oxford University Press. Shibata M, Gulden FO, Sestan N. 2015. From trans to cis: transcriptional regulatory
networks in neocortical development. Trends in Genetics 31(2): 77-‐87. Shultz S, Dunbar R. 2010. Encephalization is not a universal macroevolutionary
phenomenon in mammals but is associated with sociality. Proceedings of the National Academy of Sciences 107(50): 21582-‐21586.
Smaers J, Steele J, Case C, Cowper A, Amunts K, Zilles K. 2011. Primate prefrontal cortex evolution: human brains are the extreme of a lateralized ape trend. Brain Behavior and Evolution 77(2): 67.
Smedley D, Hamoudi R, Clark J, Warren W, Abdul-‐Rauf M, Somers G, Venter D, Fagan K, Cooper C, Shipley J. 1998. The t(8;13)(p11;q11-‐12) rearrangement associated with an atypical myeloproliferative disorder fuses the fibroblast growth factor receptor 1 gene to a novel gene RAMP. Human molecular genetics 7(4): 637-‐642.
Somasundaram R, Prasad M, Ungerbäck J, Sigvardsson M. 2015. Transcription factor networks in B-‐cell differentiation link development to acute lymphoid leukemia. Blood: blood-‐2014-‐2012-‐575688.
Somel M, Franz H, Yan Z, Lorenc A, Guo S, Giger T, Kelso J, Nickel B, Dannemann M, Bahn S et al. 2009. Transcriptional neoteny in the human brain. Proc Natl Acad Sci U S A 106(14): 5743-‐5748.
Somel M, Liu X, Tang L, Yan Z, Hu H, Guo S, Jiang X, Zhang X, Xu G, Xie G et al. 2011. MicroRNA-‐driven developmental remodeling in the brain distinguishes humans from other primates. PLoS Biol 9(12): e1001214.
Somel M, Rohlfs R, Liu X. 2014. Transcriptomic insights into human brain evolution: acceleration, neutrality, heterochrony. Current opinion in genetics & development 29: 110-‐119.
Spiteri E, Konopka G, Coppola G, Bomar J, Oldham M, Ou J, Vernes SC, Fisher SE, Ren B, Geschwind DH. 2007. Identification of the transcriptional targets of FOXP2, a gene linked to speech and language, in developing human brain. The American Journal of Human Genetics 81(6): 1144-‐1157.
Spocter MA, Hopkins WD, Barks SK, Bianchi S, Hehmeyer AE, Anderson SM, Stimpson CD, Fobbs AJ, Hof PR, Sherwood CC. 2012. Neuropil distribution in the cerebral cortex differs between humans and chimpanzees. Journal of Comparative Neurology 520(13): 2917-‐2929.
Spoor F, Wood B, Zonneveld F. 1994. Implications of early hominid labyrinthine morphology for evolution of human bipedal locomotion.
Squire LR, Zola SM. 1996. Memory, memory impairment, and the medial temporal lobe. Cold Spring Harb Symp Quant Biol 61: 185-‐195.
Stark C, Breitkreutz B-‐J, Reguly T, Boucher L, Breitkreutz A, Tyers M. 2006. BioGRID: a general repository for interaction datasets. Nucleic acids research 34(suppl 1): D535-‐D539.
Bibliography
147
Stergachis AB, Haugen E, Shafer A, Fu W, Vernot B, Reynolds A, Raubitschek A, Ziegler S, LeProust EM, Akey JM. 2013. Exonic transcription factor binding directs codon choice and affects protein evolution. Science 342(6164): 1367-‐1372.
Sugo N, Oshiro H, Takemura M, Kobayashi T, Kohno Y, Uesaka N, Song WJ, Yamamoto N. 2010. Nucleocytoplasmic translocation of HDAC9 regulates gene expression and dendritic growth in developing cortical neurons. European Journal of Neuroscience 31(9): 1521-‐1532.
Tarpey PS, Smith R, Pleasance E, Whibley A, Edkins S, Hardy C, O'Meara S, Latimer C, Dicks E, Menzies A et al. 2009. A systematic, large-‐scale resequencing screen of X-‐chromosome coding exons in mental retardation. Nat Genet 41(5): 535-‐543.
Teaford MF, Ungar PS. 2000. Diet and the evolution of the earliest human ancestors. Proceedings of the National Academy of Sciences 97(25): 13506-‐13511.
Thomson DM, Herway ST, Fillmore N, Kim H, Brown JD, Barrow JR, Winder WW. 2008. AMP-‐activated protein kinase phosphorylates transcription factors of the CREB family. Journal of applied physiology 104(2): 429-‐438.
Thornton GK, Woods CG. 2009. Primary microcephaly: do all roads lead to Rome? Trends in genetics 25(11): 501-‐510.
Tsankova N, Renthal W, Kumar A, Nestler EJ. 2007. Epigenetic regulation in psychiatric disorders. Nat Rev Neurosci 8(5): 355-‐367.
van Bokhoven H. 2011. Genetic and epigenetic networks in intellectual disabilities. Annu Rev Genet 45: 81-‐104.
Vandewalle C, Comijn J, De Craene B, Vermassen P, Bruyneel E, Andersen H, Tulchinsky E, Van Roy F, Berx G. 2005. SIP1/ZEB2 induces EMT by repressing genes of different epithelial cell–cell junctions. Nucleic acids research 33(20): 6566-‐6578.
Vandewalle C, Van Roy F, Berx G. 2009. The role of the ZEB family of transcription factors in development and disease. Cellular and molecular life sciences 66(5): 773-‐787.
Vaquerizas JM, Kummerfeld SK, Teichmann SA, Luscombe NM. 2009. A census of human transcription factors: function, expression and evolution. Nature Reviews Genetics 10(4): 252-‐263.
Verschueren K, Remacle JE, Collart C, Kraft H, Baker BS, Tylzanowski P, Nelles L, Wuytens G, Su M-‐T, Bodmer R. 1999. SIP1, a novel zinc finger/homeodomain repressor, interacts with Smad proteins and binds to 5ʹ′-‐CACCT sequences in candidate target genes. Journal of Biological Chemistry 274(29): 20489-‐20498.
Villar D, Berthelot C, Aldridge S, Rayner TF, Lukk M, Pignatelli M, Park TJ, Deaville R, Erichsen JT, Jasinska AJ. 2015. Enhancer evolution across 20 mammalian species. Cell 160(3): 554-‐566.
Visel A, Taher L, Girgis H, May D, Golonzhka O, Hoch RV, McKinsey GL, Pattabiraman K, Silberberg SN, Blow MJ. 2013. A high-‐resolution enhancer atlas of the developing telencephalon. Cell 152(4): 895-‐908.
Voight BF, Kudaravalli S, Wen X, Pritchard JK. 2006. A map of recent positive selection in the human genome. PLoS biology 4(3): e72.
Voineagu I, Wang X, Johnston P, Lowe JK, Tian Y, Horvath S, Mill J, Cantor RM, Blencowe BJ, Geschwind DH. 2011. Transcriptomic analysis of autistic brain reveals convergent molecular pathology. Nature 474(7351): 380-‐384.
Wang F, Yang H, Zhang M, Zhang S. 2015. Rapid Evolution of DNA Methylation in Primates Tend to Occur in Conserved Sequences. Cancer Genetics and Epigenetics 3.
Wang G, Guo X, Hong W, Liu Q, Wei T, Lu C, Gao L, Ye D, Zhou Y, Chen J. 2013a. Critical regulation of miR-‐200/ZEB2 pathway in Oct4/Sox2-‐induced mesenchymal-‐to-‐epithelial transition and induced pluripotent stem cell generation. Proceedings of the National Academy of Sciences 110(8): 2858-‐2863.

Bibliography
148
Wang J, Zhuang J, Iyer S, Lin X-‐Y, Greven MC, Kim B-‐H, Moore J, Pierce BG, Dong X, Virgil D. 2013b. Factorbook. org: a Wiki-‐based database for transcription factor-‐binding data generated by the ENCODE consortium. Nucleic acids research 41(D1): D171-‐D176.
Wei C-‐L, Wu Q, Vega VB, Chiu KP, Ng P, Zhang T, Shahab A, Yong HC, Fu Y, Weng Z. 2006. A global map of p53 transcription-‐factor binding sites in the human genome. Cell 124(1): 207-‐219.
Weyn-‐Vanhentenryck Sebastien M, Mele A, Yan Q, Sun S, Farny N, Zhang Z, Xue C, Herre M, Silver Pamela A, Zhang Michael Q et al. 2014. HITS-‐CLIP and Integrative Modeling Define the Rbfox Splicing-‐Regulatory Network Linked to Brain Development and Autism. Cell Reports 6(6): 1139-‐1152.
Wilkinson LS, Davies W, Isles AR. 2007. Genomic imprinting effects on brain development and function. Nature Reviews Neuroscience 8(11): 832-‐843.
Williamson DF, Parker RA, Kendrick JS. 1989. The box plot: a simple visual method to interpret data. Annals of internal medicine 110(11): 916-‐921.
Willsey AJ, Sanders SJ, Li M, Dong S, Tebbenkamp AT, Muhle RA, Reilly SK, Lin L, Fertuzinhos S, Miller JA et al. 2013. Co-‐expression networks implicate human midfetal deep cortical projection neurons in the pathogenesis of autism. Cell 155(5): 997-‐1007.
Wilming LG, Snoeren CS, Van Rijswijk A, Grosveld F, Meijers C. 1997. The murine homologue of HIRA, a DiGeorge syndrome candidate gene, is expressed in embryonic structures affected in human CATCH22 patients. Human molecular genetics 6(2): 247-‐258.
Wilson D, Charoensawan V, Kummerfeld SK, Teichmann SA. 2008. DBD––taxonomically broad transcription factor predictions: new content and functionality. Nucleic acids research 36(suppl 1): D88-‐D92.
Winden KD, Oldham MC, Mirnics K, Ebert PJ, Swan CH, Levitt P, Rubenstein JL, Horvath S, Geschwind DH. 2009. The organization of the transcriptional network in specific neuronal classes. Molecular systems biology 5(1).
Wittkopp PJ, Kalay G. 2012. Cis-‐regulatory elements: molecular mechanisms and evolutionary processes underlying divergence. Nature Reviews Genetics 13(1): 59-‐69.
Wray GA. 2007. The evolutionary significance of cis-‐regulatory mutations. Nature Reviews Genetics 8(3): 206-‐216.
Xiong M, Jiang L, Zhou Y, Qiu W, Fang L, Tan R, Wen P, Yang J. 2012. The miR-‐200 family regulates TGF-‐β1-‐induced renal tubular epithelial to mesenchymal transition through Smad pathway by targeting ZEB1 and ZEB2 expression. American Journal of Physiology-‐Renal Physiology 302(3): F369-‐F379.
Xu K, Schadt EE, Pollard KS, Roussos P, Dudley JT. 2015. Genomic and network patterns of schizophrenia genetic variation in human evolutionary accelerated regions. Molecular biology and evolution: msv031.
Yang J-‐H, Choi J-‐H, Jang H, Park J-‐Y, Han J-‐W, Youn H-‐D, Cho E-‐J. 2011. Histone chaperones cooperate to mediate Mef2-‐targeted transcriptional regulation during skeletal myogenesis. Biochemical and biophysical research communications 407(3): 541-‐547.
Yang Q, She H, Gearing M, Colla E, Lee M, Shacka JJ, Mao Z. 2009. Regulation of Neuronal Survival Factor MEF2D by Chaperone-‐Mediated Autophagy. Science (New York, NY) 323(5910): 124-‐127.
Yoshihara K, Tajima A, Komata D, Yamamoto T, Kodama S, Fujiwara H, Suzuki M, Onishi Y, Hatae M, Sueyoshi K. 2009. Gene expression profiling of advanced-‐stage
Bibliography
149
serous ovarian cancers distinguishes novel subclasses and implicates ZEB2 in tumor progression and prognosis. Cancer science 100(8): 1421-‐1428.
Yuan Z, Gong S, Luo J, Zheng Z, Song B, Ma S, Guo J, Hu C, Thiel G, Vinson C et al. 2009. Opposing roles for ATF2 and c-‐Fos in c-‐Jun-‐mediated neuronal apoptosis. Mol Cell Biol 29(9): 2431-‐2442.
Zeng J, Konopka G, Hunt BG, Preuss TM, Geschwind D, Soojin VY. 2012. Divergent whole-‐genome methylation maps of human and chimpanzee brains reveal epigenetic basis of human regulatory evolution. The American Journal of Human Genetics 91(3): 455-‐465.
Zhang J. 2003. Evolution of the human ASPM gene, a major determinant of brain size. Genetics 165(4): 2063-‐2070.
Zhang Y, Liu T, Meyer CA, Eeckhoute J, Johnson DS, Bernstein BE, Nusbaum C, Myers RM, Brown M, Li W. 2008. Model-‐based analysis of ChIP-‐Seq (MACS). Genome biology 9(9): R137.
Zhao M. 2010. Biochemical and Genetic Studies on CC2D1A, a new NF-‐κB Activator and a Regulator of Synaptic Functions.
Zhi-‐Liang H, Bao J, Reecy J. 2008. CateGOrizer: a web-‐based program to batch analyze gene ontology classification categories. Online J Bioinformatics 9: 108-‐112.
Zweier C, Peippo MM, Hoyer J, Sousa S, Bottani A, Clayton-‐Smith J, Reardon W, Saraiva J, Cabral A, Gohring I et al. 2007. Haploinsufficiency of TCF4 causes syndromal mental retardation with intermittent hyperventilation (Pitt-‐Hopkins syndrome). Am J Hum Genet 80(5): 994-‐1001.

150
151
Bibliographic Information
Species-specific changes in a primate transcription factor network:
insights into the molecular evolution of the primate prefrontal cortex.
Stefano Berto, Katja Nowick (MBE, re-submitted).
A transcription factor consensus network of the human frontal lobe:
insights into the molecular mechanisms of human cognitive abilities.
Stefano Berto, Alvaro Perdomo Sabogal, Daniel Gerighausen, Jing Qin,
and Katja Nowick (Frontiers, submitted and under review).
Functional characterization and evolution of ZEB2 in great-apes. Stefano Berto and Katja Nowick (Manuscript in preparation).
FoxP1 orchestration of ASD-relevant signaling pathways in the striatum.
Daniel J. Araujo, Ashley G. Anderson, Stefano Berto, Wesley Runnels,
Matthew Harper, Simon Ammanuel, Michael A. Rieger, Hung-Chung
Huang, Kacey Rajkovich, Kris Loerwald, Joseph D. Dekker, Haley O.
Tucker, Joseph D. Dougherty, Jay R. Gibson, and Genevieve Konopka
(Genes & Development, 2015.
MEF2C regulates cortical synaptic transmission and behaviors relevant to
autism and schizophrenia. Adam J. Harrington, Aram Raissi, Kacey
Rajkovich, Stefano Berto, Jaswinder Kumar, Gemma Molinaro, Jonathan
Raduazzo, Yuhong Guo, Kris Loerwald, Genevieve Konopka, Kimberly
Huber, Christopher W. Cowan (Neuron, submitted and under review).
ELAVL2-regulated transcriptional networks in human neurons link
alternative splicing, autism, and human neocortical evolution. Stefano Berto, Genevieve Konopka, and Brent L. Fogel (Human molecular
genetics, submitted and under review).
152
Correspondence between resting state activity and brain gene expression.
Guang-Zhong Wang, T. Grant Belgard, Deng Mao, Leslie Chen, Stefano Berto, Todd M. Preuss, Hanzhang Lu, Daniel H. Geschwind & Genevieve
Konopka. Neuron, 2015.
Region-specific RNA editing events of complex disease related genes in
human brain. Guang-Zhong Wang, Stefano Berto, Genevieve Konopka.
(Manuscript in preparation).
153
Curriculum Vitae
Personal References Last Name: Berto
First Name: Stefano
Gender: Male
Date of Birth: July 24th, 1983
Place of Birth: Conegliano, Treviso.
Citizenship: Italian
Status: Married
Home pages : http://www.nowick-lab.info/
http://www4.utsouthwestern.edu/KonopkaLab/Konopka_Lab/Home.html
Permanent Address: 5720 Forest Park Rd
Dallas, TX 75235
email: [email protected]
email: [email protected]
email: [email protected]
Current Office Address: Konopka Lab
Department of Neuroscience
University of Texas Southwestern Medical Center
5323 Harry Hines Blvd., ND4.300
Dallas, TX 75390-9111
Phone: 214-648-5136 (lab)
FAX: 214-648-5138

154
EDUCATION BACHELOR DEGREE University of Padova, Italy
Bachelor degree in Biology
Thesis theme: Inhibition of metamorphosis in Xenopus laevis exposed to
PBDEs.
Final examination: 86/110
MASTER DEGREE University of Padova, Italy.
Master degree in Evolutionary Biology.
Exchange student at University of Jyvaskyla, Finland (started on 11th
January).
Final examination: 98/110
Language skills
Italian Native language
English Advanced
Research area of interests and skills Biological and molecular evolution
Brain evolution in primates
Evolution of behavior in primates
Evolutionary medicine in Homo sapiens
Expression evolution analysis
Transcription factors evolution
Genomics

155
Bioinformatics skills R: advanced
Bash: advanced
SQL: advanced
Python: basic
Excellent skills with NGS technologies
Excellent skills with evolutionary tools
Molecular techniques and skills PCR/qPCR
siRNA-knockdown
Westernblot
Cloning
RNA-seq
ChIP-seq
HITs-Clip-seq
ICC
FACS/FACs sorting
Cell culturing
Cell culture and brain tissue preparation
Teaching Experience T.A. at Programming for Evolutionary Biology Course (Leipzig 2012)
Conferences TIBE 2012 (Porto, Portugal): Oral presentation
SMBE 2013 (Chicago, USA): Oral presentation
SMBE 2014 (San Juan, USA): Poster session
SMBE 2015 (Wien, Austria): Oral presentation
Leipzig Research Festival (Leipzig, Germany): Poster session
28th TBI Winterseminar (Bled, Slovenia): Oral presentation
156
Herbstseminar Bioinformatik 2011 (Decin, Czech republi): Oral
presentation
JSNP/JSBP 2015 (Tokyo, Japan): Poster session
Publications:
ü Introgression of mitochondrial DNA among Myodes voles:
consequences for energetics? Boratyński Z, Alves PC, Berto S,
Koskela E, Mappes T, Melo-Ferreira. J.BMC Evol Biol. 2011.
ü Molecular and ecological signs of adaptive mitochondria
introgression - a case of study in Myodes rodents Zbyszek
Boratyński, Paulo Célio Alves, Stefano Berto, Esa Koskela, Tapio
Mappes, José Melo- Ferreira, Olli Pentikäinen, Pedro Tarroso and
Mikko Ylilauri. Heredity, 2013.
ü Species-specific changes in a primate transcription factor network:
insights into the molecular evolution of the primate prefrontal
cortex. Stefano Berto, Katja Nowick (MBE, submitted and under
review).
ü A transcription factor consensus network of the human frontal lobe:
insights into the molecular mechanisms of human cognitive
abilities. Stefano Berto, Alvaro Perdomo Sabogal, Daniel
Gerighausen, Jing Qin, and Katja Nowick. (Frontiers, submitted and
under review).
ü FoxP1 orchestration of ASD-relevant signaling pathways in the
striatum. Daniel J. Araujo, Ashley G. Anderson, Stefano Berto,
Wesley Runnels, Matthew Harper, Simon Ammanuel, Michael A.
Rieger, Hung-Chung Huang, Kacey Rajkovich, Kris Loerwald,
Joseph D. Dekker, Haley O. Tucker, Joseph D. Dougherty, Jay R.
Gibson, and Genevieve Konopka. Genes & Development, 2015.
157
ü MEF2C regulates cortical synaptic transmission and behaviors
relevant to autism and schizophrenia. Adam J. Harrington, Aram
Raissi, Kacey Rajkovich, Stefano Berto, Jaswinder Kumar, Gemma
Molinaro, Jonathan Raduazzo, Yuhong Guo, Kris Loerwald,
Genevieve Konopka, Kimberly Huber, Christopher W. Cowan
(Neuron, submitted and under review).
ü ELAVL2-regulated transcriptional networks in human neurons link
alternative splicing, autism, and human neocortical evolution.
Stefano Berto, Genevieve Konopka, and Brent L. Fogel (HMG,
submitted and under review).
ü Correspondence between resting state activity and brain gene
expression. Guang-Zhong Wang, T. Grant Belgard, Deng Mao,
Leslie Chen, Stefano Berto, Todd M. Preuss, Hanzhang Lu, Daniel
H. Geschwind & Genevieve Konopka. Neuron, 2015.
158
Specific References: Katja Nowick, , Ph.D. Universität Leipzig
Bioinformatik
Härtelstrasse 16-18
04107 Leipzig
Germany
Phone: +49 341 97-16684
Fax: +49 341 97-16679
Email: [email protected]
Dr. Peter F. Stadler Universität Leipzig
Bioinformatik
Härtelstrasse 16-18
04107 Leipzig
Germany
E-mail: [email protected]
Genevieve Konopka, Ph.D. Department of Neuroscience
University of Texas Southwestern Medical Center
5323 Harry Hines Blvd., ND4.300
Dallas, TX 75390-9111
Tel: 214-648-5135
Fax: 214-648-5138
Email: [email protected]

159
Selbständigkeitserklärung Hiermit erkläre ich, die vorliegende Dissertation selbständig und ohne
unzulässige fremde Hilfe angefertigt zu haben. Ich habe keine anderen als
die angeführten Quellen und Hilfsmittel benutzt und sämtliche Textstellen,
die wörtlich oder sinngemäßaus veröffentlichten oder unveröffentlichten
Schriften entnommen wurden, und alle Angaben, die auf mündlichen
Auskünften beruhen, als solche kenntlich gemacht. Ebenfalls sind alle von
anderen Personen bereitgestellten Materialen oder erbrachten
Dienstleistungen als solche gekennzeichnet.
Leipzig, den 07. Sept 2015
Stefano Berto