transcriptional knockout of steroidogenic factor 1 in vivo
TRANSCRIPT
Transcriptional knockout of steroidogenic factor 1in vivo in Oreochromis niloticus increased weightand suppressed gonad development usingantisense RNAZhe Cao
Chinese Academy of Fishery Sciences Freshwater Fisheries Research CenterJun Qiang ( [email protected] )
Chinese Academy of Fishery Sciences Freshwater Fisheries Research Center https://orcid.org/0000-0003-4718-6618Jun Zhu
Chinese Academy of Fishery Sciences Freshwater Fisheries Research CenterHong Li
Chinese Academy of Fishery Sciences Freshwater Fisheries Research CenterYi Tao
Chinese Academy of Fishery Sciences Freshwater Fisheries Research CenterJie He
Chinese Academy of Fishery Sciences Freshwater Fisheries Research Centerpao xu
Chinese Academy of Fishery Sciences Freshwater Fisheries Research CenterZai Dong
Chinese Academy of Fishery Sciences Freshwater Fisheries Research CenterJin Bao
Chinese Academy of Fishery Sciences Freshwater Fisheries Research CenterJun Ma
Nanjing Agricultural UniversityMing Li
Nanjing Agricultural University
Article
Keywords: Steroidogenic factor 1 (sf1), Nile tilapia, experimental �sh, gene function, biological breeding
Posted Date: January 4th, 2021

DOI: https://doi.org/10.21203/rs.3.rs-138053/v1
License: This work is licensed under a Creative Commons Attribution 4.0 International License. Read Full License
Transcriptional knockout of steroidogenic factor 1 in vivo in 1
Oreochromis niloticus increased weight and suppressed gonad 2
development using antisense RNA 3
4
Zhe-Ming Cao1*, Jun Qiang1,2*, Jun-Hao Zhu1, Hong-Xia Li1, Yi-Fan Tao1, Jie He1, Pao Xu1,2, Zai-5
Jie Dong1, Jin-Wen Bao1, Jun-Lei Ma2, Ming-Xiao Li2 6
7
1. Key Laboratory of Freshwater Fisheries and Germplasm Resources Utilization, Ministry of 8
Agriculture, Freshwater Fisheries Research Center, Chinese Academy of Fishery Sciences, Wuxi 9
214081, Jiangsu, China 10
2. Wuxi Fisheries College, Nanjing Agricultural University, Wuxi 214081, China 11
12
*These authors contributed equally to this study 13
Corresponding authors. Jun Qiang ([email protected]) and Pao Xu ([email protected]) 14
Steroidogenic factor 1 (sf1) is an important regulator of gonad development and function in mammals. 15
However, study of sf1 in fish is limited to cloning and expression and in vitro experiments. Using 16
antisense RNA we knockout transcription of the sf1 gene in Nile tilapia Oreochromis niloticus, and 17
obtain experimental fish in vivo. We demonstrate that antisense RNA can silence sf1 transcription and 18
protein expression, and report suppression of sf1 transcription to affect gonad development and 19
external genitalia formation in Nile tilapia. We also report disfunction of retinal metabolism and fatty 20
acid metabolism to be important causes of weight gain and gonad abnormality with sf1 suppression. 21
The feasibility of using antisense RNA for gene editing in fish is verified, and a new way of studying 22
gene function and performing biological breeding is presented.23
Recent rapid developments in gene-editing technologies such as the CRISPR/Cas9 system have 24
enabled efficient and precise biological breeding. Experiments on fishes have been conducted mostly 25
on model species such as zebrafish (Danio rerio)1,2 and medaka (Oryzias latipes)3 as opposed to 26
commercially important farmed fishes for two main reasons: 1) eggs of most farmed fishes are small, 27
and an osmotic pressure difference is required when eggs are fertilized; the egg internal pressure is 28
relatively high, and egg yolk is contained within a membrane that is easily broken during 29
microinjection or electroporation, rendering the success rate extremely low and the operation 30
cumbersome. 2) Normally, when a target gene is edited using gene-editing technology (such as 31
CRISPR/Cas9 and zinc finger nuclease technology) in stage I fertilized cells, since the sperm has 32
combined with the egg and fertilization is complete the maternal genetic material begins transcription 33
and translation. Therefore, the P0 generation of experimental fish has a low positive rate and many 34
chimeras. Multiple generations of breeding pairs are required to obtain homozygous individuals with 35
the target gene knocked out, prolonging the experimental period. Many experimental fish for which 36
genes have been knocked out using this editing technology have stagnated at the P0 generation4–6. 37
The low specificity of the insertion site and the high off-target rate also limit application of 38
CRISPR/Cas9 and other gene-editing technologies in farmed fish, hampering commercialization7. 39
Steroidogenic factor 1 (sf1) is a member of the superfamily of nuclear receptors, also referred to 40
as Ad4BP or NR5A1. sf1 is a key regulator of estrogen and androgen synthesis. In vertebrates, almost 41
all steroid synthase genes are target genes regulated by sf18. sf1-deficient mice have abnormal adrenal 42
and gonad development, accompanied by gonadotropin loss and sex reversal (male to female)9. 43
Research on sf1 in fish has focused mostly on cloning and expression and in vitro cell experiments; 44
sf1 has been reported from medaka10, zebrafish11,12, Nile tilapia (Oreochromis niloticus)13, a gobiid 45
fish (Trimma okinawae)14, channel catfish (Ictalurus punctatus)15, black porgy (Acanthopagrus 46
schlegelii)16, and the air-breathing catfish (Clarias gariepinus)17. It is also widely expressed in the 47
brain, hypothalamus, pituitary, head kidney, liver, testis, and ovary tissues of Arctic char (Salvelinus 48
alpinus)18 and zebrafish19. sf1 is mainly expressed in steroid-producing cells in the early stages of 49
gonad development, and prophase and yolk stage cells20,21. The lack of reports of sf1 in bony fish 50
body function can largely be attributed to technical reasons. Using CRISPR/Cas9 technology, Wang's 51
team first studied the mutant Nile tilapia sf1 and analyzed gonadal phenotype and P0 mutant gene 52
expression. Preliminary analysis suggests that sf1 loss in gonad development may cause females to 53
transition to males22. 54
Antisense RNA is a single stranded RNA that is complementary to a protein coding messenger 55
RNA (mRNA) with which it hybridizes, and thereby blocks its translation into protein. By interfering 56
with mRNA translation and post-transport processing of related genes, antisense RNA causes loss of 57
target gene function. Tomizawa et al.23 first used antisense RNA technology to inhibit the 58
enterobactin-producing Col E1 plasmid of Escherichia coli. This technology has been widely used in 59
plants: Oeller et al.24 reported the cauliflower mosaic virus (CaMV) 35S promoter and nopaline 60
synthase (NOS) terminator changed the rate-limiting enzyme in the ethylene biosynthesis pathway—61
synthesis of 1-aminocyclopropanecarboxylic acid, which can inhibit tomato fruit ripening. This 62
technology is mostly used to improve breeding of plant traits25,26. Experiments on animals are limited 63
to cell-based assays27,28, with no reports of live animals being produced using antisense RNA 64
technology. 65
Nile tilapia (Oreochromis niloticus) is an extensively cultured freshwater fish that is farmed in 66
more than 100 countries and regions. It grows fast, reproduces well, and male and female growth 67
obviously differs. Selection of tilapia as a research subject has universal application. Based on the 68
principle of antisense RNA, we pioneered a set of efficient RNA function knockout technology. We 69
first designed an antisense RNA fragment based on the Nile tilapia sf1 gene, designing primers, then 70
constructing, cloning and amplifying the target fragment. We then transfected the target fragment into 71
an egg through a fertilization hole, and added sperm to complete fertilization [technology patents 72
have been applied for in the United States (nos 17/030, 023) and Germany (no 102020126733.9)]. 73
We used this technology to successfully culture three batches of tilapia lacking the sf1 function 74
between 2019 and 2020. The rate of insertion of the target fragment into gonad tissue exceeded 80%, 75
with a good knockout effect on the transcription of sf1. This work mainly reports and analyzes related 76
experimental results. 77
We report changes in gonad characteristics and tissue structure of Nile tilapia. Use qPCR and 78
western blot techniques we identify the level of translational knockout in vivo. Transcriptome and 79
proteomics techniques are used to co-analyze changes in downstream genes and functions caused by 80
sf1 loss. We overcome obstacles in traditional gene editing through introduction of foreign fragments 81
and target site selection, and the P0 generation obtains stable trait performance. Use of this gene-82
editing technology provides a new experimental means to perform biological breeding and target gene 83
research, with strong commercialization prospects. We also provide theoretical support for studying 84
the regulatory mechanism of sf1, which may further overcome obstacles in treatment of sf1 deficiency 85
diseases in humans. 86
87
Results 88
Analysis of positive rate of experimental fish in gonad tissue. To identify the efficiency of 89
antisense RNA introduction, we tested gonad tissues of 17 experimental fishes cultured for 80 d. The 90
target plasmid (about 1000 bp) containing antisense RNA fragments (Fig. 1a, A1–7 and E1–10) was 91
amplified from gonad tissues of 15 fish, with a positive rate of 88.2%. The negative control (NC) 92
group had a target plasmid band of about 900 bp (B1–7 and D1–4). The control group had no band at 93
the position of 900–1000 bp (E1–4). Each sample contained four transfected antisense RNA 94
sequences. 95
Antisense RNA inhibits expression of sf1 mRNA and protein in fish gonad tissue. To analyze the 96
inhibitory effect of antisense RNA on the target gene, we used qRT-PCR and western blot (WB) to 97
detect transcription and protein expression levels in the gonadal sf1 gene. Expression levels of sf1 98
mRNA and the transcript variant X1 mRNA in testis tissue of male fish in the experimental group 99
were (extremely) significantly lower than those in the control and NC groups (P < 0.01) (Fig. 1b). 100
Expression levels of sf1 mRNA and the transcript variant X1 mRNA in ovarian tissues of female fish 101
in the experimental group were also significantly lower than those in the control and NC groups (Fig. 102
1c, P < 0.05). The molecular weight of sf1 protein synthesized in this experiment ranged 55–65 kDa. 103
Obvious protein bands of molecular weight 55–70 kDa occurred (Figs. 1c), indicating the synthesized 104
protein was effective. The expression level of sf1 protein in male (Fig. 1d: b1–4) and female (Fig. 1e: 105
d1–4) fish in the experimental group was significantly lower than in the control (male a1 and a2, and 106
female c1 and c2) and NC (male a3 and a4, and female c3 and c4) groups. The introduced antisense 107
RNA fragment effectively suppressed the transcriptional expression and protein level of the sf1 gene 108
in gonad tissues, and achieved transcription knockout of the sf1 gene. 109
Figure 1 inserted here 110
Knocking out sf1 transcription affects formation of external reproductive organs. To observe 111
changes in fish reproductive organs after sf1 transcription knockout, images of experimental tilapia 112
were taken. Male and female tilapia in the transcription knockout group were more round (Fig. 2a 113
and b), and their body weights were significantly higher than control and NC group fishes (Table 1, 114
P < 0.05). After 180 d culture, control group male and female fish reached sexual maturity, and their 115
genitals were obviously red and convex (Fig. 2a and b). The anus and urogenital opening were clearly 116
visible in males; the urogenital openings had a small cylindrical white protruding tip (Fig. 2a), and a 117
small amount of semen extruded when the abdomen was gently squeezed. Male fish in the sf1 118
transcription knockout group (M-sf1-) had a larger anus and a slightly convex white organ (Fig. 2a), 119
and semen did not extrude when the abdomen was gently squeezed. Control group female fish had an 120
obvious anus and genital and urinary openings; when the abdomen was gently squeezed (Fig. 2b), 121
some individuals discharged eggs. Females in the sf1 transcription knockout group (F-sf1-) had a 122
large anus and slightly convex red organ (Fig. 2b), and their genital and urinary openings could not 123
be distinguished. 124
Knockout of sf1 transcription interfered with development and maturation of testis and ovary 125
tissues. To examine the effect of sf1 transcription knockout on development of gonad tissue, gonads 126
were weighed and tissues were sectioned. Control and NC group male gonad weights were 2.36 g 127
and 2.41 g, respectively, with GSI values of 0.975 and 0.969—significantly higher than 0.51 g and 128
0.157 of transcription knockout group fish (Table 1). Control group testes were thick and long; testes 129
of knockout group fish were thinner (Fig. 2a). After HE staining, control and NC group testis appeared 130
to comprise many seminiferous tubules and intertubular structures, with sperm (Sp) evenly distributed 131
in the lumen center and variably sized seminiferous tubules (Fig. 2c). Each seminiferous tubule 132
contained spermatogenic vesicles at different developmental stages, including spermatogonia (Sg), 133
primary spermatocytes (PS), second spermatocytes (SS), and spermatocytes (St). However, the testis 134
of males in the sf1 knockout group (M-sf1-, Fig. 2c) had decreased numbers of seminiferous vesicles 135
in the spermatogenic tubules, and Sg, PS, SS and St. Additionally, some sperm gathered in the lumen 136
of the seminiferous tubules, severe vacuolation occurred within them, and the voids in the lumen 137
increased significantly. 138
Control and NC group female gonad weights and GSI values (5.30 g, 2.539; 5.48 g, 2.403; 139
respectively), were significantly higher than values for experimental group fish (3.21g and 1.073). In 140
control and NC group ovarian tissues (Fig. 2c), tightly packed oocytes at various (Ⅱ–Ⅴ) stages were 141
clearly visible, with elliptical mature stage Ⅴ oocytes full of large yolk particles. However, ovarian 142
development in the sf1 transcription knockout fishes (F-sf1-, Fig. 2c) was more complicated, with 143
gonads containing many cavities with relatively scattered, low numbers of oocytes of stages II–IV 144
(mainly II). Some follicles are atresia, and oocyte membrane folding occurs. 145
Knockout of sf1 transcription affects serum hormone levels. To identify the effect of sf1 146
transcription knockout on serum hormones, we determined serum T, GnRH, LH, FSH and E2 levels 147
in male (Fig. 2d) and female (Fig. 2e) fish after 180 d culture. In males, sf1 transcription knockout 148
fish (M-sf1-) had significantly lower serum T than control group fish; however, serum GnRH, LH, 149
FSH and E2 levels were significantly higher than in control group fish (P<0.05). There was no 150
significant difference between control and NC groups (P>0.05). In females, serum LH and E2 levels 151
of sf1 transcription knockout fish (F-sf1-) were significantly higher than those of control group fish; 152
however, the serum T and GnRH contents were significantly lower than control group fishes (P<0.05). 153
There was no significant difference in serum FSH content in females among experimental groups 154
(P>0.05). 155
Figure 2 inserted here 156
Knockout of sf1 transcription regulates mRNA profiles in gonad tissue genes. We analyzed 157
changes in transcription levels of sf1 transcription knockout and control group fish gonad tissues. 158
Based on Nile tilapia genome information, we performed comparison and quality identification of 159
transcriptome sequencing results. In males, we sequenced 22,283 genes; 1675 differentially expressed 160
(DE) genes were found between the sf1 transcription knockout and control groups (Fig. 3a), of which 161
509 were up-regulated and 1166 were down-regulated. In females, 22,283 genes were sequenced; 162
1726 DEGs were found in the sf1 transcription knockout and control (Fig. 3b) groups, of which 690 163
were up-regulated and 1036 were down-regulated. 164
Knockout of sf1 transcription regulates protein profiles in gonad tissue genes. For males, 8232 165
proteins and 7557 quantitative proteins were identified (Fig. 3a); 469 differentially abundant (DA) 166
proteins were found in the sf1 transcription knockout and control groups, of which 96 were up-167
regulated and 377 were down-regulated. For females, 6024 proteins and 5534 quantitative proteins 168
were sequenced (Fig. 3b); 636 DA proteins were found in the sf1 transcription knockout and control 169
groups, of which 242 were up-regulated and 394 were down-regulated. 170
Combined transcriptome-proteome analysis of the effects of sf1 transcription knockout on 171
gonad development and metabolism. Based on transcriptome data, we conducted a regulated 172
analysis for DE gene–DA protein pairs. The 44 and 74 DE genes in male (Fig. 3c) and female (Fig. 173
3d) fish showed significant differences from common proteins by integrated analysis of transcriptome 174
and proteome sequencing results, with the criteria for DE gene being P value ≤ 0.05, fold change (FC) 175
≥ 2 or FC ≤ 0.5, and for the DA protein P value ≤ 0.05, FC ≥ 1.2 or FC ≤ 0.833. For males, 18 DE 176
genes and 16 DA proteins were up-regulated (Fig. 3c and e); 13 genes and common proteins were up-177
regulated; 34 DE genes and 36 DA proteins were down-regulated, of which 31 DE genes and common 178
proteins were down-regulated. For females (Fig. 3d and f), 27 DE genes and 34 DA proteins were up-179
regulated, of which 23 DE genes and common proteins were up-regulated; 62 DE genes and 55 DA 180
proteins were down-regulated, with 51 DE genes and common proteins down-regulated. 181
Heatmaps of DE gene–DA protein pairs for both sf1 transcription knockout and control groups 182
are shown in Fig. 3g (male) and Fig. 3h (female). Overall expression patterns of DE genes and 183
common DA proteins in the sf1 transcription knockout group differ from those in the control group. 184
In the sf1 transcription knockout group, most genes and proteins in male fish and female fish were 185
down-regulated (blue band). 186
Figure 3 inserted here 187
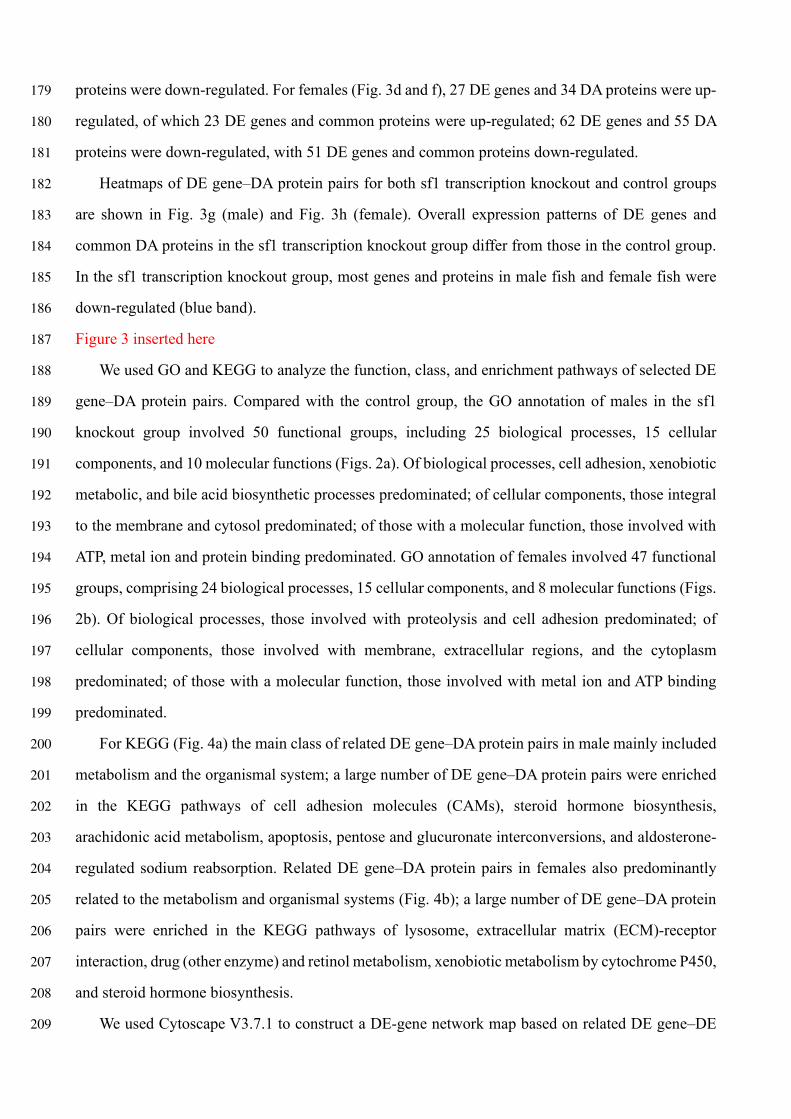
We used GO and KEGG to analyze the function, class, and enrichment pathways of selected DE 188
gene–DA protein pairs. Compared with the control group, the GO annotation of males in the sf1 189
knockout group involved 50 functional groups, including 25 biological processes, 15 cellular 190
components, and 10 molecular functions (Figs. 2a). Of biological processes, cell adhesion, xenobiotic 191
metabolic, and bile acid biosynthetic processes predominated; of cellular components, those integral 192
to the membrane and cytosol predominated; of those with a molecular function, those involved with 193
ATP, metal ion and protein binding predominated. GO annotation of females involved 47 functional 194
groups, comprising 24 biological processes, 15 cellular components, and 8 molecular functions (Figs. 195
2b). Of biological processes, those involved with proteolysis and cell adhesion predominated; of 196
cellular components, those involved with membrane, extracellular regions, and the cytoplasm 197
predominated; of those with a molecular function, those involved with metal ion and ATP binding 198
predominated. 199
For KEGG (Fig. 4a) the main class of related DE gene–DA protein pairs in male mainly included 200
metabolism and the organismal system; a large number of DE gene–DA protein pairs were enriched 201
in the KEGG pathways of cell adhesion molecules (CAMs), steroid hormone biosynthesis, 202
arachidonic acid metabolism, apoptosis, pentose and glucuronate interconversions, and aldosterone-203
regulated sodium reabsorption. Related DE gene–DA protein pairs in females also predominantly 204
related to the metabolism and organismal systems (Fig. 4b); a large number of DE gene–DA protein 205
pairs were enriched in the KEGG pathways of lysosome, extracellular matrix (ECM)-receptor 206
interaction, drug (other enzyme) and retinol metabolism, xenobiotic metabolism by cytochrome P450, 207
and steroid hormone biosynthesis. 208
We used Cytoscape V3.7.1 to construct a DE-gene network map based on related DE gene–DE 209
protein pairs. Only 4 of 44 genes were involved in the regulatory network of male fish, with fewer 210
associations between genes (Figs. 3a). For females, 48 of 74 genes were involved in the regulatory 211
network, of which ephx2, col1a1, col1a2, ctsd, ugt, aldh1a2, and fn1b are closely related to other DE 212
genes (Figs. 3b). Of these, col1a1 is linked to 7 genes, col1a2 and ctsd to 8 genes, and fn1b to 5 genes. 213
Therefore, these DE genes are closely connected with other related DE gene–DE protein pairs, and 214
may be involved in regulation of female growth and development after sf1 transcription knockout. 215
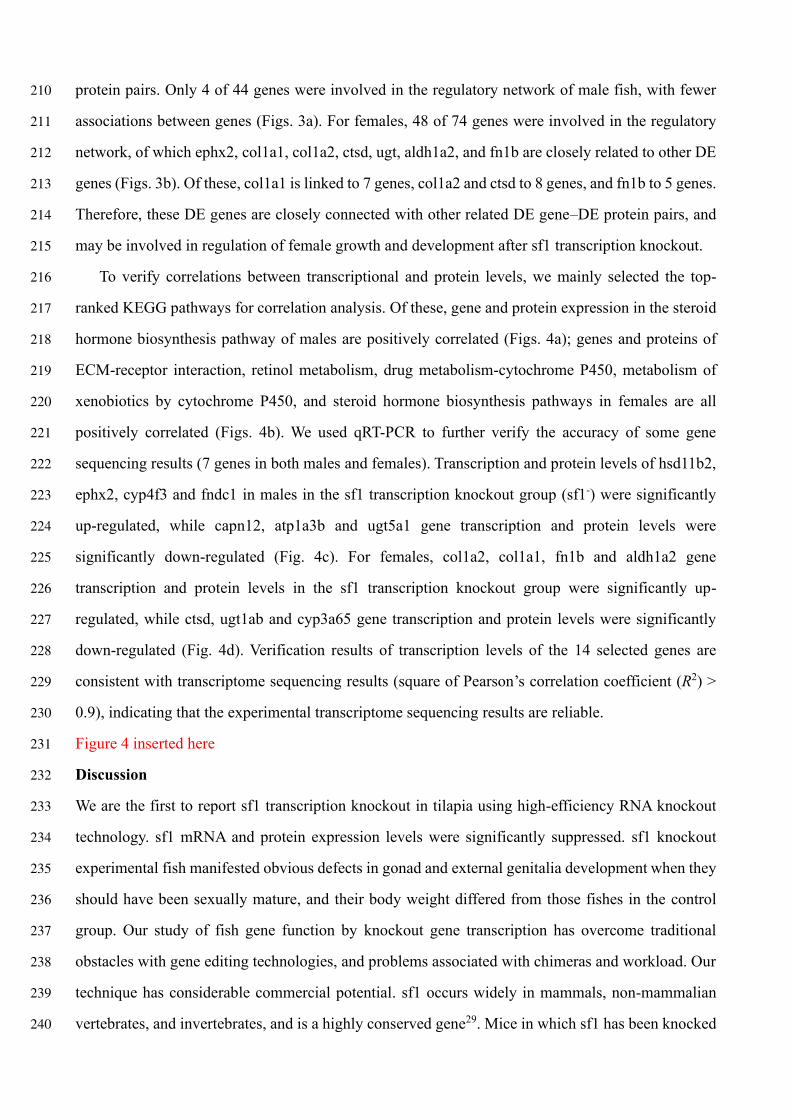
To verify correlations between transcriptional and protein levels, we mainly selected the top-216
ranked KEGG pathways for correlation analysis. Of these, gene and protein expression in the steroid 217
hormone biosynthesis pathway of males are positively correlated (Figs. 4a); genes and proteins of 218
ECM-receptor interaction, retinol metabolism, drug metabolism-cytochrome P450, metabolism of 219
xenobiotics by cytochrome P450, and steroid hormone biosynthesis pathways in females are all 220
positively correlated (Figs. 4b). We used qRT-PCR to further verify the accuracy of some gene 221
sequencing results (7 genes in both males and females). Transcription and protein levels of hsd11b2, 222
ephx2, cyp4f3 and fndc1 in males in the sf1 transcription knockout group (sf1-) were significantly 223
up-regulated, while capn12, atp1a3b and ugt5a1 gene transcription and protein levels were 224
significantly down-regulated (Fig. 4c). For females, col1a2, col1a1, fn1b and aldh1a2 gene 225
transcription and protein levels in the sf1 transcription knockout group were significantly up-226
regulated, while ctsd, ugt1ab and cyp3a65 gene transcription and protein levels were significantly 227
down-regulated (Fig. 4d). Verification results of transcription levels of the 14 selected genes are 228
consistent with transcriptome sequencing results (square of Pearson’s correlation coefficient (R2) > 229
0.9), indicating that the experimental transcriptome sequencing results are reliable. 230
Figure 4 inserted here 231
Discussion 232
We are the first to report sf1 transcription knockout in tilapia using high-efficiency RNA knockout 233
technology. sf1 mRNA and protein expression levels were significantly suppressed. sf1 knockout 234
experimental fish manifested obvious defects in gonad and external genitalia development when they 235
should have been sexually mature, and their body weight differed from those fishes in the control 236
group. Our study of fish gene function by knockout gene transcription has overcome traditional 237
obstacles with gene editing technologies, and problems associated with chimeras and workload. Our 238
technique has considerable commercial potential. sf1 occurs widely in mammals, non-mammalian 239
vertebrates, and invertebrates, and is a highly conserved gene29. Mice in which sf1 has been knocked 240
out have a significant weight gain advantage30. The pituitary-specifically knocked-out sf1 mice 241
significantly reduced the level of pituitary gonadotropin, manifesting severe gonad and external 242
genitalia hypoplasia, a significant reduction in the number of germ cells, and a lack of mature sperm 243
being formed31. Although the expression and function of sf1 have been studied in detail in mammals, 244
there has been limited study of sf1 in non-mammals, especially in bony fishes. For this reason, it has 245
been rarely reported in studies of bony fish gonad development. 246
sf1 transcription knockout reduces the GSI of tilapia and increases body weight. In bony fish a 247
change in GSI is related to maturity stage, and it represents an important indicator of the spawning 248
cycle. We report the weight of male and female fish in the sf1 transcription knockout group to be 1.47 249
× and 1.34 × greater than that of control group fish, but for the gonad weight and GSI to be 0.22 × 250
and 0.15 × (male) and 0.61 × and 0.45 × (female) that of control group fish, respectively. The weight 251
of sf1 knockout gonad-development-deficient mice at 8 weeks age is 2 × the weight of control mice. 252
Obesity is caused mainly by reduced mobility and increased food intake30. Experimental fish with sf1 253
transcription knockout showed significant gonad weight loss and weight gain, which may also be 254
related to a reduction in reproductive energy expenditure. 255
sf1 transcription knockout causes abnormal secretion of sex hormones, causing defects in gonad 256
and genitalia development. In sf1 transcription knockout fish, the serum T content of males was 257
strongly downregulated. After male mammals enter puberty, testicular function gradually develops, 258
T secretion increases, spermatogonia divide and differentiate, spermatogenesis is initiated, and mature 259
sperm are produced32. sf1 coordinately regulates the steroid hydroxylase gene and affects the 260
reproductive axis as an integral mediator of steroid production33. Like mammals, the fish sf1 gene 261
also plays an important role in reproductive regulation of the hypothalamic-pituitary-gonad axis, and 262
is strongly expressed in the pituitary and gonads of common carp (Cyprinus carpio)34. The 5' end of 263
some testosterone-producing enzyme genes has an sf1 binding site upstream of the transcription start 264
point, suggesting that sf1 may be involved in transcriptional regulation of testosterone-producing 265
enzymes, affecting testosterone synthesis35. Therefore, the transcriptional knockout of male fish sf1 266
may reduce secretion of testosterone during the reproductive period, causing suppression of gonad 267
development, introducing barriers to formation of spermatogonia and spermatocytes, leading to an 268
inability to produce mature sperm. We also report sf1 transcription knockout to affect the 269
differentiation and formation of external genitalia, resulting in shorter external genitalia, similar to an 270
sf1 gene abnormality causing penis shortness in children36. 271
T is present in the blood of many female teleost fish. As a precursor of E2 synthesis, T can be used 272
for aromatization in the ovary37. T content is related to oocyte maturation, embryonic development 273
and miscarriage rate in women with polycystic ovary syndrome38. In the flounder Pseudopleuronectes 274
americanus T also plays an important role in oocyte maturation and ovulation in winter39. Therefore, 275
a decline in serum T in female fishes in the sf1 transcription knockout group resulted in reduced 276
development of oocytes and increased follicular atresia. 277
sf1 can promote expression of some steroid-producing enzymes which affect the activity of genes 278
related to gonad development, including GnRH receptor41 and LH β-submit41. sf1 knockout mice 279
cannot regulate expression of LH β-subunit, FSH β-subunit and GnRH receptor genes42. Brown and 280
Mcneilly43 reported sheep luteal and follicular estrous cycle phases and sf1 mRNA levels to positively 281
correlate with expression of LH β-subunit. We report serum LH and E2 contents of male and female 282
sf1 transcription knockout fishes to be significantly higher than those of control group fish during the 283
reproductive period. Our results again confirm that two different sex determination and differentiation 284
systems exist between bony fish and mammals. Changes in sex steroids, temperature and light 285
intensity may promote sex conversion44. Different potential ligands dependent on sf1 may 286
dynamically exchange when sf1 is lacking, activating its transcription pathway to enhance LH and E2 287
activity. 288
GnRH injection can induce a transition from female to male, or male to female at the stage of sex 289
differentiation. GnRH can induce production of gonadotropins, stimulate FSH and LH to enter the 290
peripheral circulation, and act on ovary and testes tissues to regulate follicle formation, ovulation, 291
and sperm and steroid production45. Therefore, up-regulation of GnRH in male sf1 transcription 292
knockout fishes may promote increased serum FSH and LH levels and down-regulate androgen, 293
causing abnormal spermatocyte and sperm development46. However, down-regulation of GnRH in 294
sf1 knockout females may be related to suppression of egg development. 295
sf1 transcription knockout changes regulatory pathways in male and female gonads. We used 296
transcriptomics and proteomics to study gene and protein expression data. The Illumina platform and 297
Q Exactive plus mass spectrometer were used to identify 12 transcriptome and 12 proteome libraries 298
from the sf1 transcription knockout and control group fishes. For the first time, 44 DE gene–DA 299
protein pairs were identified in male fish, and 74 in female fish. 300
Clustering and KEGG pathway enrichment analyses revealed many DE genes to be enriched in 301
retinol metabolism and steroid hormone biosynthesis pathways. Combined with abnormal gonad 302
tissues, we suggest that the retinol signaling pathway plays an important role in fish reproductive 303
development. Deficiency or excess of retinol can cause testicular lesions and spermatogenesis in male 304
animals47,48. Also, in female animals, retinol and its active derivatives can affect ovarian steroid 305
hormone production, oocyte maturation, and early embryonic development49. We report a similar 306
phenomenon, with changes in genes in the retinol metabolism pathway possibly affecting 307
spermatogenesis and oocyte development. Uridine diphosphate glucuronyl transferase (UGT) is an 308
important phase II metabolic enzyme. UGT protein can be regulated by a variety of ligand-dependent 309
or independent transcription factors, including the hepatocyte nuclear factor family and nuclear 310
receptor superfamily (constitutive androstane receptor CAR, and pregnane X receptor PXR). PXR 311
and CAR can form heterodimers with retinoid X receptors to initiate metabolism of various 312
exogenous or endogenous substances such as hydroxysterol, bile acid, and androgen50. Currently, the 313
Ugt5 family is known only from fish and amphibians51. The transcriptional expression pattern is sex-314
related in Ugt1a and Ugt5a of zebrafish, with Ugt1a and Ugt5a1 expression in male gonads 315
significantly higher than in females52. We report transcription and protein levels of ugt5a1 in male 316
and ugt1ab in female Nile tilapia in the sf1 transcription knockout group to be significantly down-317
regulated. sf1 knockout may affect retinol metabolism of fish. Retinol and its metabolic derivatives 318
cannot fully bind to the corresponding ligands, causing down-regulation of transcription levels of 319
ugt5a1 and ugt1ab, leading to insufficient synthesis of steroid and sex hormones. 320
Retinoic acid (RA) is an important biologically active form of vitamin A. It can be oxidized to 321
retinal by retinol dehydrogenase, and then oxidized to all-trans-RA and 9-cis-RA by retinal 322
dehydrogenase. The all-trans-RA is eliminated by CYP1A and CYP3A catabolism, and these 323
synthesis and metabolism processes are regulated by enzymes. When RA synthesis and 324
decomposition disorder occurs, it affects normal body physiological functions, and congenital 325
malformations form more easily, manifested in bone, eye and heart structural abnormalities in 326
zebrafish53,54. We also report sf1 transcription knockout female and male Nile tilapia to have 327
abnormally developed external genitalia, suggesting that changes in the retinol metabolism signaling 328
pathway may be involved in development of fish external genitalia. Early oocyte clustering appeared 329
in the sf1 transcription knockout group, and the proliferation efficiency of early oocytes may be 330
enhanced. During oogenesis, RA regulates the initiation of meiosis; levels of RA are closely related 331
to aldh1α2 (RA synthase) and cyp3A65 (RA degrading enzyme). Studies have shown that insufficient 332
levels of aldh1a2 in fish (which causes a decrease in RA levels) can delay the time it takes for cells 333
to enter meiosis, while a decrease in cyp3A65 levels (which causes an increase in RA levels) can 334
cause cells to enter meiosis early56,57. We report mRNA and protein expression levels of aldh1a2 in 335
female sf1 transcription knockout fish to be significantly up-regulated, cyp3A65 expression levels to 336
be significantly down-regulated, and the ratio of aldh1a2 to cyp3A65 to be significantly up-regulated, 337
indicating that RA levels in experimental group fish may rise, resulting in more oocytes entering the 338
meiotic process earlier. Combined with changes in serum T and GnRH levels (although oocytes in 339
sf1 transcription knockout females entered meiosis early), the lack of hormones promoting follicle 340
formation and maturation, and secretion disorders may inhibit further oocyte development, increasing 341
follicular atresia. 342
As a typical environmental sex determining animal, cortisol plays an important role in the 343
responses of fish to external environmental pressures55. Environmental changes significantly increase 344
levels of cortisol in the body or cells, affecting reproductive growth and sex differentiation in fish58,59. 345
Hydroxysteroid 11-beta dehydrogenase (Hsd11b) belongs to a family of oxidoreductases, which 346
regulate mutual conversion between active cortisol and inactive corticosterone, and also participate 347
in the physiological process of steroid metabolism60. hsd11b2 can reduce the level of cortisol in fish 348
tissues, thereby protecting them from cortisol damage; it is also involved in androgen synthesis61,62. 349
We report male fish in the sf1 transcription knockout group to be involved in the regulation of steroid 350
hormone biosynthesis pathway, significantly up-regulates hsd11b2 expression may increase the 351
conversion of active cortisol to inactive cortisol63, then active the synthesis of androgens. During high 352
temperature-induced male transfer in the silverside Odontesthes bonariensis, cortisol promotes 353
androgen production by regulating high expression of hsd11b2, driving testis development64. 354
However, GnRH, LH, FSH, and E2 serum levels in male sf1 transcription knockout fish were 355
significantly higher than control group fish. Inhibition of sf1 expression may promote the conversion 356
of androgens to estrogen, reducing the effect of male fish androgen, explaining why our male fish 357
gonad tissue had more cavities, and decreased sperm count and gonad weight. 358
Fndc1 has a prominent role in regulating proliferation, apoptosis and migration of prostate cancer 359
in men 65. Loss of Fndc1 expression causes a loss in fibronectin expression, suppressing androgen 360
receptor expression 66. Another important feature of fish for which sf1 transcription has been knocked 361
out is their significant increase in body weight. Androgens play an extremely important role in fat 362
metabolism67. Testosterone concentrations in viscerally obese men and those with related metabolic 363
diseases are lower than normal, which induces atherosclerosis, dyslipidemia and insulin resistance68. 364
We report the expression of Fndc1 and serum T in male fishes in the sf1 transcription knockout group 365
to be significantly down-regulated. Testosterone and its active substances can bind to androgen 366
receptors to activate nuclear gene expression, which is considered to be the main way for androgens 367
to perform their functions64,66. Fish have similar regulatory pathways as mammals. Male fish lacking 368
sf1 inhibited expression of Fndc1, which may reduce the functional effects of testosterone, leading to 369
defects in gonad function and endocrine metabolism disorders. 370
The size of the adrenal glands of sf1 knockout heterozygous mice is reduced, accompanied by 371
damage caused by corticosterone in response to stress69. We report the atp1a3b gene in male fishes in 372
the sf1 transcription knockout group to be significantly down-regulated. The atp1a3 subtype is mainly 373
expressed in the nervous tissue in mammals, the down-regulation of atp1a3b may be related to the 374
lack of sf1 causing kidney damage70. Meanwhile, the lack of sf1 may affect the secretion of 375
aldosterone, thereby affecting the carbohydrate, lipid metabolism and obesity of fish, leading to fish 376
metabolic syndrome. 377
Cathepsin D, a member of the cathepsin superfamily, is a lysosomal aspartic protease which plays 378
an important role in maintaining tissue homeostasis and metabolism. Cathepsin D inhibitors can 379
protect rat cardiomyocytes from apoptosis induced by free radicals71 and inhibit the release of Cyt-c 380
and caspase activation in human fibroblasts, thereby inhibiting the occurrence of apoptosis72. The 381
calpain system plays an important role in maintaining the balance of protein metabolism in the body. 382
Abnormal or imbalanced activation of calpain is often associated with pathological conditions73,74. In 383
the sf1 transcription knockout group, the activities of calpain 12 in male and cathepsin D in female 384
fish were significantly down-regulated, indicating a change in tissue homeostasis or metabolic 385
function. The specific regulation mechanism needs further analysis. Fish muscle toughness is closely 386
related to collagen content. Studies on gilthead sea bream (Sparus aurata) have shown that increased 387
collagen content increases muscle mechanical strength and cohesion75. Both col1a1 and col1a2 in 388
female fish in the sf1 transcription knockout group were significantly up-regulated, which may be 389
related to changes in muscle tissue structure caused by obesity. 390
Polyunsaturated fatty acids in fat and their derivatives, arachidic acid, have physiological 391
functions such as regulating steroid hormone synthesis and lipid metabolism during fish gonad 392
development76. Cholesterol is catalyzed into testosterone with strong activity under the action of 393
steroidogenic acute regulatory protein, 17β hydroxylase, and hsd11b2. Testosterone can be catalyzed 394
by aromatase to form estradiol, and participates in female-related physiological metabolism77. The 395
expression of hsd11b2 in males in the sf1 transcription knockout group was up-regulated, which may 396
increase testosterone synthesis. However, serum testosterone levels in male fish in the knockout group 397
was significantly lower, and the serum estradiol level was significantly higher than that of control 398
fish. Combining the sequencing results, cyp4f3 in the arachidonic acid metabolism pathway of male 399
fish was significantly up-regulated. Whether up-regulation of cyp4f3 can help catalyze the conversion 400
of testosterone to estradiol remains to be verified. 401
Epoxide hydrolase in mammals is a homodimer enzyme that integrates N-terminal phosphatase 402
activity and C-terminal hydrolase activity. It participates in various physiological regulation processes 403
and plays an important role in blood pressure control and hormone regulation78,79. We report the 404
Ephx2 gene and protein levels in males in the sf1 transcription knockout group to be significantly up-405
regulated. Ephx activity in the liver and kidney of male mice was 55% and 283% higher than that of 406
female mice, respectively. Ovariectomy can also increase the activity of Ephx in the liver and kidney 407
of mice80. These studies indicate that the regulation of Ephx involves sex hormones. The deletion of 408
Ephx's variable transcript gene Ephx2C at the N-terminus can cause inactivation of the phosphatase 409
region, with the highest expression level in the luteal phase of the estrous cycle, indicating that 410
Ephx2C phosphatase may play an important role in hormone regulation81. Isoprene phosphate, an 411
intermediate metabolite at the branch point of cholesterol biosynthesis, is the N-terminal universal 412
substrate of Ephx. Therefore, the up-regulated expression of Ephx2 may be involved in sex hormone 413
synthesis of males after sf1 transcription knockout. Male fish lacking sf1 may activate a variety of 414
sex hormone synthesis pathways, mediate the reaction of cholesterol synthesis to sex hormones, and 415
compensate for their lack of male hormones. Our results also found sf1-deficient males retain short 416
external genitalia and gonads with developmental defects. 417
Fibronectin (Fn) is the main adhesion molecule of ECM. In zebrafish, Fn deposition can be seen 418
around the myocardial precursor and in the midline area between the endoderm and the endocardial 419
precursor82. Likewise, antisense morpholino knockdown or gene mutations resulting in the loss of 420
Fn1 can inhibit endothelial invasion and migration of steroid-producing tissues83. We report the Fn1b 421
gene transcription and protein expression in females in the sf1 transcription knockout group to be 422
significantly up-regulated. Although the loss of sf1 caused abnormality in female genitalia, it may 423
accelerate the migration of cells in steroid-producing tissues and promote production of steroid 424
hormones in other tissues, thereby alleviating the imbalanced development and metabolism of the 425
fish body after sf1 knockout. 426
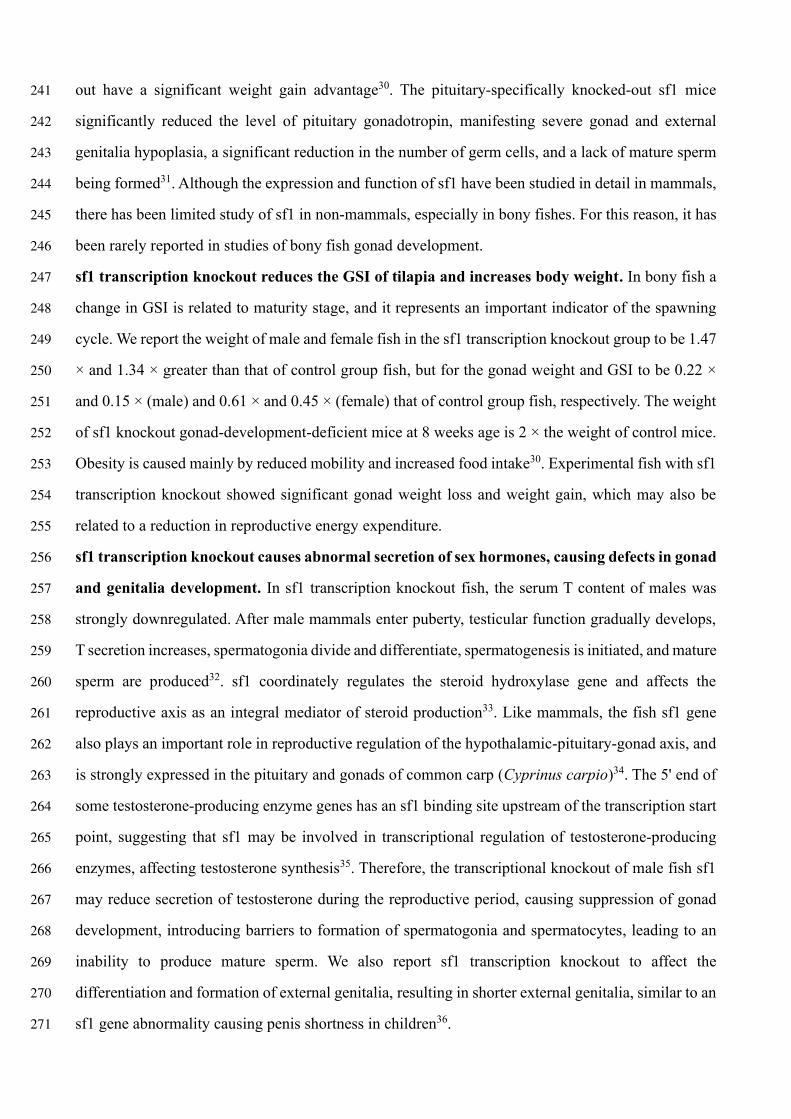
Overall, we reveal that knocking out genes at the transcriptional level can produce living 427
organisms in animals, and that this gene editing technique is efficient. We analyzed the role of sf1 in 428
the development and formation of fish sexual organs; and proved the response mechanisms of a fish 429
organism system and metabolism under sf1 deficiency (Fig. 4e). 430
431
Methods 432
Ethics statement 433
The study protocols and design were approved by the Ethics Committee at the Freshwater Fisheries 434
Research Centre of the Chinese Academy of Fishery Sciences (FFRC, Wuxi, China). The fish were 435
maintained in well-aerated water and treated with 200 mg/L tricaine methanesulfonate (MS-222, 436
Sigma-Aldrich, A5040) for rapid deep anesthesia. The samples were extracted based on the Guide for 437
the Care and Use of Laboratory Animals in China. 438
Experimental fish. We used GIFT (Genetic Improvement of Farmed Tilapia) Nile tilapia from a self-439
bred strain sourced from FFRC. Broodstock were experimental fish farmed to sexual maturity in 2018. 440
Male and female fish with fully developed gonads were held separately in an indoor tank (water 441
temperature 28°C ± 1, pH 7.6 ± 0.2). During the holding period, an aerator continuously inflated and 442
fed extruded feed (30.0% crude protein, 8.0% fat, 15.75% ash, 12.0% moisture) twice daily under a 443
natural light-dark cycle. The feed amount represented 4% of fish body weight. 444
Designing the antisense RNA sequence. Since the sf1 gene of Nile tilapia has two transcript types 445
(sf1: NM_001279560.2 and sf1 transcript variant X1: XM_025911872.1), proteins translated by the 446
two transcript variants of sf1 gene have few differences (Figs. 1a and b). We designed four antisense 447
RNA sequences to inhibit sf1 mRNA and transcript variant X1 mRNA, respectively, according to the 448
exons, introns and 5’-untranslated regions of mRNA precursor. 449
1. Design of the first antisense RNA sequence of sf1-Ⅰ (anti-sf1-Ⅰ) (Fig.5a): 450
5’-CATCTGGTTCAGTCACTTTGCGTAAGCTGACGTCGTTCATGAACCTACAGACACAT 451
ACGGCGGTTGAGTGATTTATTATCCTGCGATATGTTTACTTTTAGATTTTTATTTTT-3.’ 452
The antisense RNA comprised a first intron partial sequence, a first exon partial sequence, and a 5’- 453
non-translated sequence of four bases. The purpose of this design was to interfere with the post-454
transcriptional processing of the sf1 gene and the translation initiation of the sf1 mRNA precursor. 455
456
Design of the second antisense RNA sequence of sf1- II (anti-sf1-II): 457
5’-AATAACTGACAAACTATTCTTAACAATGAAATGTGTTTATAGTTTGTTGTTGTGGTTTT 458
GTTGCTTTCACCTGATCTGACTCGCTGCTGAGTCTCATCTGGTTC-3.’ 459
The antisense RNA comprised a second intron partial sequence, and a first exon partial sequence. The 460
purpose of this design was to interfere with the post-transcriptional processing of the sf1 mRNA 461
precursor. 462
463
2. Design of the first antisense RNA sequence of sf1 transcript variant X1-Ⅰ (anti-sf1 transcript variant 464
X1-Ⅰ) (Fig. 5b): 465
5’-TGCTGTCTATATCGGGGATGCTTTAGGAGCCAGAAGGGCCAATAGAAAGTGTAGTACG 466
ATGATGACCATTCAAGAGCTCAGAGTGAAACTCCTTTCCTTCGC-3.’ 467
The antisense RNA comprised a first intron partial sequence, and a 5’-non-translated sequence of 80 468
bases. The purpose of this design was to interfere with the post-transcriptional processing of the sf1 469
transcript variant X1 mRNA precursor and the translation initiation of the mRNA. 470
471
Design of the first antisense RNA sequence of sf1 transcript variant X1-Ⅱ (anti-sf1 transcript variant 472
X1-Ⅱ): 473
5’-AGGAAAACGGAGGCACTTACCGTGAGCCTTGTCTCCCAACATTTGAGCAGCAGACA 474
GCAGGCAGGCAGTGATGATTGTCTGATGATTAAAACCTGGATGTAG-3.’ 475
The antisense RNA comprised a second intron partial sequence, a first exon sequence, and a 5-476
terminal non-translated sequence of 60 bases. The purpose of this design was to interfere with the 477
translation initiation of the sf1 transcript variant X1 mRNA precursor. 478
The four designed antisense RNA sequences were sent to GENEWIZ Biotechnology Co., Ltd. 479
(Suzhou, China) for sequence synthesis. 480
Figure 5 inserted here 481
PCR amplification. In the experimental group, the four antisense RNA sequences were cloned into 482
the site between Xho I and Xba I in the pcDNA3.1 expression vector (ThermoFisher, K482001) 483
respectively. The cloning product of each antisense RNA was used as a template for subsequent PCR 484
amplification. A pair of specific primers were designed to amplify the template: F1: 485
TTTTGCGCTGCTTCGCGATGTAC, and the reverse primer R1: 486
TCCCCAATCCTCCCCCTTGCTG. The 50 µL reaction system contained 25 μL of 2 × Mastermix, 487
2.5 μL of each primer F1 and R1, 18 μL of ultrapure water, and 2 μL of template. The PCR 488
amplification procedure involved pre-denaturing at 95°C for 2 min, 34 cycles of denaturing at 95°C 489
for 30 s, annealing at 50°C for 30 s, and extending at 72°C for 2 min, and a final extension at 72°C 490
for 5 min. The amplified product contained enhancer, TATA box, CAAT box, and a transcription 491
initiation region, tailed with poly-A. In the negative control group, the blank expression vector was 492
amplified according to the above PCR procedure; the reaction system comprised 50 μL, containing 493
25 μL of 2 × Mastermix, 2.5 μL of each primer F1 and R1, 18 μL of ultrapure water, and 2 μL of 494
template of the blank vector. Except for antisense RNA fragments, the amplified products of the blank 495
vector included enhancer, TATA box, CAAT box, and the transcription initiation region, tailed with 496
poly-A. 497
Transfection reagent preparation. The PCR amplified products (PCR amplified products of each 498
group above were mixed in a volume ratio of 1:1:1:1), blank expression vector amplified products 499
(negative control group), or ultrapure water (control group), and lipofectamine 2000 (Thermo Fisher 500
Scientific, 11668027) were mixed at a ratio of 1:5; the mixture was equilibrated at room temperature 501
for 30 min. 502
Artificial insemination and hatching. A single mature female tilapia with salient, ruddy and slightly 503
open gonads was selected. Water around the genitals was gently wiped off with a dry towel. The 504
abdomen was then gently squeezed to extrude mature eggs, which were placed in 3 clean, dry 505
stainless-steel receptacles (150–200 eggs in each). Experiments were divided into control, negative 506
control (transfected with blank templates), and experimental (transfected with target templates) 507
groups. 508
Into a liter of water, 6 g of sodium chloride, 0.1 g of potassium chloride, 0.1 g of calcium chloride, 509
0.1 g of sodium bicarbonate, 0.1 g of sodium dihydrogen phosphate, and 1.2 g of glucose was 510
dissolved. Into each receptacle, 1.5 mL of this solution was added to promote the opening of 511
fertilization hole, after which 0.8 mL of transfection reagent was added. Receptacles were gently 512
shaken for 15 min to allow the antisense RNA fragment to enter the eggs through the fertilization 513
hole. For the negative control group, 0.8 mL of transfection reagent containing blank vector was 514
added. For the control group, 0.8 mL of transfection reagent containing ultrapure water was added. 515
One male fish with well-developed gonads (genital pores ruddy and salient) was selected, from 516
which 0.2 mL of semen was gently sucked and placed into each receptacle containing eggs using a 517
disposable dropper. The mixture of eggs and sperm was then stirred for 30 s using goose feathers; 2 518
mL of incubation water was added to complete the artificial insemination process. 519
Two further female fish of the same family (time interval 3–8 days) were selected for replication. 520
Eggs were manually squeezed as previously, then divided into 3 treatment groups with 120–180 eggs 521
in each. Three separate males of the same family were used in artificial insemination experiments. 522
Fertilized eggs were placed into three hatching jars, with water temperature held at 29°C, and water 523
flow rate 5 L/min to ensure that fertilized eggs rolled fully. Many fish fry hatched after 92 h, with the 524
hatching rate of fertilized eggs exceeding 85%. 525
Experimental fish farming and management. Newly hatched larvae (50–60) were placed into a 30 526
L water circulating system for 30 d. Larvae were fed (45.0% crude protein, 8.0% fat content) four 527
times daily, 15%–20% their body weight. Larvae (25) were then transferred to each of 4 or 5 × 1.2 528
m3 tanks for culture. Fish were fed (crude protein content 32.0%, fat content 8.0%) twice daily, 5%–529
10% their body weight, for 150 d. Dissolved oxygen was maintained above 5mg·L−1, pH at 7.6 ± 0.2, 530
and ammonia nitrogen and nitrite below 0.02mg·L−1 and 0.03mg·L−1, respectively. 531
Detection of transfection of antisense RNA fragment. When newly hatched larvae were cultured 532
for 80 d, 5 fish were randomly selected from each tank. Following deep anesthesia with MS-222 533
solution (200 mg/L), the gonads of each fish were excised. A MiniBEST Universal Genomic DNA 534
Extraction Kit Ver 5.0 (TakaRa, 9765-1) was used for genomic DNA extraction. The 20 µL reaction 535
included 0.5 μL of each upstream and downstream primer (F1: TTTTGCGCTGCTTCGCGATGTAC; 536
R1: TCCCAATCCTCCCCCTTGCTG, 10 mmol/μL), 1 μL of cDNA, 10 μL of Premix Taq (LA Taq 537
Version 2.0, TAKARA, RR901A), and 8 μL of RNase-free water. The reaction program was 94°C for 538
2 min, followed by 35 cycles at 95°C for 30 s, 50°C for 30 s, and 72°C for 2 min, and finally 72°C 539
for 5 min. We made an agarose gel (0.3 g agarose + 30 ml 1 × TAE) and electrophoresed PCR products 540
for 20 min under 300 v. A DNA gel recovery kit (Axygen, AP-GX-50) was used to recover target 541
fragments. Through cloning and transformation, 15–20 monoclonal colonies were selected from each 542
sample and sent to GENEWIZ Biotechnology Co., Ltd. for sequencing. 543
Sampling. We mainly sampled and analyzed fish from first batch of experiments, using those from 544
second and third batch of experiments as supplements and/or to verify results from the first 545
experiment. Feeding of fish ceased 1 day prior to the end of each experiment. We used MS-222 546
solution (200 mg/L) for deep anesthesia, selected 6 fish from each tank (24–30 fish in total), and took 547
1 ml blood from the tail vein of each fish after weighing using a 2.5 ml sterile syringe; blood was 548
stored in 1.5ml Eppendorf centrifuge tubes. After standing for 2 h at 4°C, the sample was centrifuged 549
at 8000 g/min for 5 min; the upper serum was separated and stored at −40°C for serum hormone level 550
analysis. The whole gland tissue was dissected, weighed and photographed. A further 5 fish were 551
removed from each tank, and after deep anesthesia, their gonad was excised and divided into 4 parts: 552
3 parts stored in cryopreservation tubes and frozen in liquid nitrogen for omics, gene expression and 553
protein level analysis, and 1 part fixed in 4% paraformaldehyde for tissue structure analysis. 554
Gonadosomatic (GSI) index determination. GSI was calculated according to: GSI = [gonad mass 555
(g) / body mass (g)] × 100%. 556
RNA extraction, reverse transcription and quantitative PCR. Total gonad tissue RNA was 557
extracted using a TRIzol kit (Invitrogen, 15596026). cDNA was synthesized with reference to the 558
corresponding PrimeScript RT Master Mix reverse transcription kit instructions (Takara, RR036A); 559
gene expression was detected through SYBR Premix Ex Taq kit operation steps (Takara, RR420). 560
Gene relative expression levels were calculated using β-action as an internal reference. The 561
expression level of related mRNA genes was detected using an ABI QuantStudio 5 Real-Time PCR 562
System. The primer design is presented in Tables 1. The 20 μL of reaction system contained 0.6 μL 563
of each upstream and downstream primer (10 mmol/μL), 1 μL of cDNA, 10 μL of 2 × SYBR Premix 564
Ex Taq II, with sterilized double distilled water added to make up 20 μL. The reaction program was 565
95°C for 5 min, then 40 cycles at 95°C for 15 s and 60°C for 60 s; the dissolution curve program after 566
the reaction was 95°C for 15 s, 60°C for 15 s, and 95°C for 15 s. Each reaction was replicated three 567
times, and each test sample contained a negative control without template to eliminate false positive 568
results. 569
Protein separation, protein quantification and western blot. The protein expression level of target 570
genes in gonad tissue was detected by western blot. A sample of 0.05 g of gonad tissue was selected 571
and crushed with liquid nitrogen and a mortar; 1 mL of platelet aggregation buffer induced by 572
ristomycin (containing 1% 10 mg/mL phenylmethanesulfonyl fluoride) was added; the mixture was 573
then homogenated with Polytron (PT2500E, KINEMATICA, Switzerland) homogenizer at 4°C and 574
15,000 g for 1 min. The protein supernatant was aspirated after being centrifuged at 4°C and 12,000 575
g for 15 min. The supernatant was collected to measure the concentration of protein with the BCA 576
protein assay kit (Sigma-Aldrich, 08168); the final protein concentration in each sample was adjusted 577
to 2 μg/μL. From each sample 20 µg of total protein was taken for SDS-PAGE electrophoresis; 6 × 578
sodium dodecyl sulfate (SDS) protein loading buffer was added. The protein was denatured by 579
heating at 100°C for 10 min, and separated using SDS polyacrylamide gel electrophoresis (SDS-580
PAGE). 581
Protein was transferred onto a polyvinylidene fluoride membrane using a wet transfer method. 582
The membrane was blocked in 5% (w/v) skimmed milk for 3 h, washed with Tris-buffered saline with 583
Tween (TBST), and then incubated with the main target gene antibody (Hua’an, Hangzhou, China) 584
at 4°C overnight. The next day, the membrane was washed with TBST and incubated with the 585
corresponding second antibody: rabbit IgG (Cell Signaling Technology, 3900S) for 1 h at room 586
temperature. The protein on the membrane was colored using ECL and the western blot system 587
(Amersham, 32209). β-action was taken as an internal reference protein. Before the formal 588
experiment, the marker of the target protein was analyzed to detect the target band (Thermo, 26616). 589
Library construction, transcriptome sequencing and analysis. Gonad tissues (from nine male or 590
female fish) were removed from storage at −80°C, cut into two small pieces under liquid nitrogen, 591
and used for transcriptome and proteome sequencing, separately. One piece was added to 1 mL TRIzol 592
reagent and homogenized. The homogenate was left at room temperature for 10 min, centrifuged at 593
12,000g and 4°C for 10 min, and the supernatant transferred to a new RNase-free 1.5 mL centrifuge 594
tube. An RNeasy Micro kit (Qiagen, 74004) was used for RNA extraction and purification. Total RNA 595
quality was tested using an Agilent 2100 instrument. Samples from three fish were combined to 596
construct one sequencing library. Each experimental group was replicated three times. To build 597
separate sequence libraries, male and female tilapia were analyzed separately. A total of 12 598
sequencing libraries were constructed: three control groups of male tilapia (M_con 1–3), three 599
transcription knockout groups of male tilapia (M_sf1-1–3), three control groups of female tilapia 600
(F_con 1–3), and three transcription knockout group of female tilapia (F_ sf1-1–3). 601
We followed standard Illumina Novaseq™ 6000 (LC-Bio Technology CO., Ltd., Hangzhou, 602
China) procedures for library construction and sequencing experiments. The Illumina paired-end 603
RNA-seq method was used to sequence M_con, M_sf1-, F_con and F_ sf1- transcriptomes. We first 604
obtained high-quality valid data using FastQC84 to remove reads with adapters, reads containing > 5% 605
base information that could not be determined, and low-quality reads (the number of bases with 606
quality value Q ≦10 accounting for more than 20% of total reads). Then, HISAT software85 was 607
used to stitch valid data with the reference sequence for subsequent analyses. Comparison of valid 608
data with the reference genome was performed using BLAST. 609
Reads per kilobase of transcript, per million mapped reads (RPKM) were used to measure the 610
abundance of gene transcripts. DE genes were screened on the basis of their fold change and P value. 611
The P value was corrected by a false discovery rate (FDR) in R language86. The selection threshold 612
for DE genes was fold-change ≧ 2 or ≦ 0.5, and corrected P-value of < 0.05. 613
Library construction, proteome sequencing and analysis. We added the proper amount of SDT 614
lysate to gonad tissue, transfer to Lysing Matrix A tube, and use Polytron homogenizer to homogenize 615
and break (6.0 M/S, 30 s, 1–4 times). After sonication, the sample was placed into a boiling waterbath 616
for 10 min, then centrifuged at 14,000 g for 15 min before the supernatant was collected and filtered 617
with a 0.22 µm centrifuge tube; the filtrate was then collected. The BCA method was used for protein 618
quantification. Aliquot samples and store at −20°C. 20 μg of protein from each experimental group 619
was added to 6 × loading buffer, then placed into a boiling waterbath for 5 min; 12% SDS-PAGE 620
electrophoresis (constant voltage 250 v, 40 min), Coomassie Brilliant Blue staining. Samples of each 621
experimental group were taken 200 μg protein solution, added DTT to a final concentration of 100 622
mM, boiling water bath for 5 min, and cooling to room temperature. The extraction and collection of 623
peptides refer to the LC-Bio 's standard procedures. Samples of each experimental group were taken 624
from 100 μg peptides and labelled according to instructions on TMT labelling kits (Thermo Fisher 625
Scientific, 90064). A total of 12 sequencing libraries were constructed: for males, three control 626
(M_con 1–3) and three transcription knockout group (M_sf1- 1–3) groups; and for females, three 627
control (F_con 1–3) and three treatment (F_sf1-1–3) groups. 628
We mixed each group of labelled peptides and used the Agilent 1260 infinity II HPLC system for 629
fractionation. After each sample was separated using the Easy nLC system with a nL flow rate, the Q 630
Exactive plus mass spectrometer was used for analysis. The entire proteomics sequencing work was 631
performed by LC-BIO (Hangzhou, China). We used Proteome Discoverer 2.2 (Thermo Fisher 632
Scientific) software to transform and analyze original map files (raw files) generated by Q Exactive 633
plus. Data were screened according to protein FDR < 0.01 criteria. Proteins with fold change > 1.2 634
and P-values (Student’s t test) < 0.05 were considered to be differentially abundant (DA) proteins. 635
Integrated analysis of related DE gene–DA protein pairs and functional enrichment. All related 636
gene–protein pairs were analyzed and identified based on mRNA sequence results and Universal 637
Protein database (https://www.uniprot.org/). Related DE gene–DA protein pairs were identified as 638
follows: significantly DE gene with P < 0.05, fold-change ≧ 2 or ≦ 0.5; and significantly DA 639
protein with P < 0.05, fold-change ≧ 1.2 or ≦ 0.833. We selected DE gene–DA protein pairs that 640
were both up- or down-regulated for subsequent function and enrichment pathway analysis. We used 641
heatmaps (http://www.heatmapper.ca/expression/)87 to intuitively analyze the distribution of related 642
DE gene–DA protein pairs, and demonstrate quality control and differences in experimental data. 643
According to the associations between DE genes and DA proteins, each small square represents a 644
gene, and the intensity of the color represents its expression level.; the higher the expression level, 645
the darker the color (red is up- and blue is down-regulation). Gene ontology (GO; 646
http://www.geneontology.org) and Kyoto Encyclopedia of Genes and Genomes (KEGG) pathway 647
(http://www.genome.jp/kegg/pathway.html)88 databases were used to assign terms and pathways to 648
the DE mRNA–DA protein pairs to investigate their potential biological functions. 649
Hematoxylin-eosin (HE) staining. Gonad tissues were fixed in 4% paraformaldehyde for 4 d, then 650
washed several times with PBS, dehydrated with an alcohol gradient, cleared with xylene, and soaked 651
and embedded in paraffin. To prepare sections, 5 μm slices were cut using a microtome. Paraffin 652
slices were routinely dewaxed, stained with hematoxylin for 7 min, washed with tap water and then 653
warm water for 1 min, immersed in 1% hydrochloric acid alcohol for about 60 s, and then stained 654
with eosin solution for 5 min. The HE-stained sections were dehydrated with an alcohol gradient, 655
cleared with xylene, and sealed with neutral resin. Gonad sections were observed under a microscope 656
(Leica UB203I, Nussloch, Germany) to detect pathological changes, and photographed. 657
Determination of serum hormone. We used an enzyme-linked immunoassay kit to determine serum 658
gonadotropin releasing hormone (GnRH, Nanjing Jiancheng, H297), follicle stimulating hormone 659
(FSH, Nanjing Jiancheng, H101-1-2), luteinizing hormone (LH, Nanjing Jiancheng, H206-1-2), 660
estradiol (E2, Nanjing Jiancheng, H102), and testosterone (T, Nanjing Jiancheng, H090-1-2) levels in 661
fish, females and males. All kits were purchased from Nanjing Jiancheng Institute of Biological 662
Engineering (Nanjing, China). Hormone concentrations in serum were determined following kit 663
instructions; each sample was repeated three times. Standard kit products were first diluted according 664
to the gradient of 16: 8: 4: 2: 1 to prepare standards of different concentrations for drawing the 665
standard curve. A sample of 40 μL of the serum to be tested was taken and related parameters were 666
determined according to kit operating procedures. Results were read by a Multiskan spectrum 667
microplate spectrophotometer (BioTek Eon, USA). Different hormone concentrations in samples in 668
each group were determined at different wavelengths, and corresponding sample concentrations were 669
calculated according to the linear regression equation of the standard curve. 670
Statistics and reproducibility. The three batches of eggs in the sf1 transcription knockout 671
experiment produced 314 experimental fish in vivo. We mainly report on the first batch of 672
experimental results. Treatment and control group fish contained at least three biological replicates. 673
In transcriptome and proteomics sequencing, three biological replicates were included for each 674
treatment. For detailed information on statistical samples, see respective figure legends. Different 675
statistical methods are used for variance and multiple comparisons; see relevant figure legends for 676
specific statistical techniques. 677
Reporting summary. A detailed experimental design and results are available in the Nature Research 678
Reporting Summary linked to this article, and in supplementary files. 679
Data availability 680
Raw sequencing data in the mRNA library has been assigned the GEO accession number GSE161135 681
(https://www.ncbi.nlm.nih.gov/geo/query/acc.cgi?acc=GSE161135). Mass spectrometry proteomics 682
data have been deposited in the ProteomeXchange Consortium 683
(http://proteomecentral.proteomexchange.org) via the iProX partner repository89 with the dataset 684
identifier PXD022939 (http://proteomecentral.proteomexchange.org/cgi/GetDataset?ID= 685
PXD022939). Source data for Fig 3c–h, 4a, 4b; and Figs 2a, b; 3a, b; 4a, b are provided as Source 686
Data files. 687
Funding 688
The study was supported financially by Central Public-interest Scientific Institution Basal Research 689
Fund, CAFS (NO. 2020JBFM04), and National Natural Science Foundation of China (NO. 690
32002363). The funding body provided played a vital role in the design of this study and collection 691
of samples. 692
Author contributions 693
X.P., C.Z.M and Q.J. conceived and designed the experiment; C.Z.M and Q.J. carried out antisense 694
RNA sequence design and transfection; Q.J., B.J.W. and T.Y.F. extracted RNA and constructed 695
libraries. H.J. and B.J.W. conducted the reproduction experiment. Z.H.J and L.H.X sampled gonad 696
tissues and prepared sections for microscopy. T.Y.F. and B.J.W verified gene mRNA expression by 697
qRT-PCR. L.H.X detected protein expression level by western blot. C.Z.M and Q.J. uploaded 698
experimental data and wrote the paper with contributions from all other authors. All authors have 699
read and approved the final version of the manuscript. 700
Acknowledgements 701
We thank Steve O’Shea, PhD, from Liwen Bianji, Edanz Group China (www.liwenbianji.cn/ac), for 702
editing the English text of various drafts of this manuscript. 703
Competing Interests 704
The authors declare that they have no competing interests. 705

Additional information 706
Correspondence and requests for materials should be addressed to Q.J. or X.P. 707
708

Fig. 1 Detection of transfected efficiency of antisense RNA and regulation of sf1 expression in Nile tilapia 709
gonadal tissue. a Agarose gel electrophoresis chart showing the position of target fragments in gonad tissue for 710
each experimental group. Gonad tissue in the group transfected with antisense RNA sequence shows obvious bands 711
at about 1000 bp (including the plasmid 900 bp + antisense RNA fragment about 100 bp). A1–7 and E1–10 marked 712
with a green box represent the transfection experiment group (n = 17 replicates); B1–7 and D1–4 marked with a red 713
box are the negative control group (n = 11 replicates), of about 900 bp (including the plasmid 900 bp); E1–4 marked 714
with a yellow box represent the control group (n = 4 replicates), with no obvious band at the position of 900–1000 715
bp. b, c Mean ± SE sf1 mRNA and sf1 transcript variant X1 mRNA levels in male and female gonad tissues (n = 716
10–14 replicates). Identification of sf1 mRNA and sf1 transcript variant X1 mRNA levels in antisense RNA 717
transfection, negative control, and control groups using qRT-PCR. M = male, F = female. M-Con and F-Con = M 718
and F fish in control groups; M-NC and F-NC = M and F fish in negative control groups; M-sf1- and F-sf1- = M 719
and F fish in antisense RNA transfection groups. d, e Polyacrylamide gel electrophoresis showing expression levels 720
of sf1 protein in gonad tissues of each experimental group: A1 and A2, and D1 and D2 = M and F fish in control 721
groups; B1 and B2 and E1 and E2 = M and F fish in negative control groups; C1–4 and F1–4 = M and F fish in 722
antisense RNA transfection groups, respectively. Comparisons in b, c were analyzed by one-way ANOVA followed 723
by Tukey’s multiple comparisons test (**P < 0.01, *P<0.05). 724
725
Fig. 2 sf1 transcription knockout inhibits development of sex organs and regulates serum hormones in Nile 726
tilapia. a, b Effect of sf1 transcription knockout on external genitalia and gonad tissues of male and female Nile 727
tilapia. According to characteristics of external genitalia, males in the control group have obviously convex 728
urogenital; the urogenital of males with sf1 transcription knockout are strongly atrophied. Control group female fish 729
had obvious urinary and genital openings, while the urinary and genital openings of females whose sf1 transcription 730
had been knocked out showed severe atrophy of these openings and could not be distinguished urinary or genital 731
opening. c Representative images of HE-stained gonad tissue of male (× 400, scale bar 50 μm) and female (×100, 732
scale bar: 200 μm). M = male, F = female. M-Con and F-Con = M and F fish in control groups; M-NC and F-NC = 733
M and F fish in negative control groups; M-sf1- and F-sf1- = M and F fish in antisense RNA transfection groups. Sp: 734
sperm; Sg: spermatogonia; PS: primary spermatocytes; SS: second spermatocyte; St: spermatocyte. Ⅱ, Ⅲ, Ⅳ, and 735
Ⅴ represent oocytes of stages Ⅱ, Ⅲ, Ⅳ, and Ⅴ, respectively. * represents vacuolation. A green box (##) represents 736
Ⅱ oocyte cluster. A red box (#) represents oocyte membrane folding. d, e Mean ± SE serum sex hormone levels in 737
male and female fish. Serum gonadotropin releasing hormone (GnRH), follicle stimulating hormone (FSH), 738
luteinizing hormone (LH), estradiol (E2) and testosterone (T) contents of control, negative control, and sf1 739
transcription knockout groups were identified using enzyme-linked immunoassay kits. Comparisons in d, e were 740
analyzed by one-way ANOVA followed by Tukey’s multiple comparisons test (*P < 0.05). 741
742
Fig. 3 sf1 transcription knockout regulates gene and protein expression profiles in gonad tissues of Nile tilapia. 743
a, b Quantity of differentially expressed (DE) genes and differentially abundant (DA) proteins in gonad tissues of 744
male and female tilapia in sf1 transcription knockout and control groups by transcriptome and proteome sequencing 745
(n = 3 replicates). Blue represents DE genes, orange represents DA proteins; the abscissa represents quantity. c, e 746
DE gene–DA protein pairs in male gonad tissue between the sf1 transcription knockout and control groups based 747
on results of transcriptome sequencing (n = 3 replicates). c Venn diagram showing DE genes and DA proteins, and 748
their common DE gene–DA protein pairs with up-regulated and down-regulated transcription in males. e DE genes 749
and DA proteins in male fish. Color codes indicate up- or down- regulated DE gene – up- or down-DA protein pairs. 750
g Cluster analysis showing expression signatures of all DE gene–DA protein pairs in male fish. Colors represent 751
different expressions: red shows a significant increase, blue a significant decrease. M = male. Pro_M- sf1- and Pro_ 752
M-Con indicate DA proteins in sf1 transcription knockout and control groups from DE gene–DA protein pairs; 753
Trans_ M- sf1- versus Trans_ M-Con indicates DE genes in both sf1 transcription knockout and control groups from 754
DE gene–DA protein pairs. d, f DE gene–DA protein pairs in gonad tissue of female fish between the sf1 755
transcription knockout and control groups, based on results of transcriptome sequencing (n = 3 replicates). d Venn 756
diagram showing DE genes and DA proteins and their common DE gene–DA protein pairs with up- and down-757
regulated transcription in females. f DE genes and DA proteins in female fish. h Cluster analysis showing expression 758
signatures of all DE gene–DA protein pairs in female fish. F = female. Pro_F-sf1- and Pro_ F-Con indicate DA 759
proteins in both sf1 transcription knockout and control groups from DE gene–DA protein pairs; Trans_ F-sf1- versus 760
Trans_ F-Con indicates DE genes in both sf1 transcription knockout and control groups from DE gene–DA protein 761
pairs. a, b False discovery rate (FDR) used to determine the threshold of P-values in multiple tests, calculated using 762
corrected P-values. Comparisons of DA proteins in a, b were analyzed by Student’s t test. 763
764
Fig. 4 sf1 transcription knockout regulates signal pathway enrichment and differential gene analysis in Nile 765
tilapia gonad tissue. a, b The KEGG enrichment subclass and signal pathway of DE gene–DA protein pairs in 766
gonad tissues of male and female fish after sf1 transcription knockout. Circle diameter is proportional to the quantity 767
of DE gene–DA protein pairs in the corresponding pathway. The circle color represents the P value. The P value is 768
a test of whether the proportion of DE genes between the sf1 transcription knockout and control groups in the 769
number of all genes in this KEGG pathway is greater than the proportion of DE genes in the total number of genes 770
in all KEGG pathway. P values in a, b were analyzed by Student’s t test. c, d qRT-PCR verifies the expression levels 771
of DE genes in males and females, and comparison of trends with DE gene–DA protein pairs. We selected 7 DE 772
genes from male and female fish for qRT-PCR verification. The trend map in c is calculated by Log2Fold change 773
using the formula Log2Fold change (sf1 transcription knockout/control). Comparisons of qRT-PCR results and 774
sequencing results in c, d were analyzed by square of Pearson correlation coefficient. e Schematic diagram of sf1 775
transcription knockout inhibiting male and female Nile tilapia gonad development and regulating weight gain. 776
hsd11b2 = hydroxysteroid (11-beta) dehydrogenase 2; ephx2 = soluble epoxide hydrolase 2; cyp4f3 = cytochrome 777
P450 4f3; fndc1 = fibronectin type III domain-containing protein 1; capn12 = calpain 12; atp1a3b = 778
sodium/potassium-transporting ATPase subunit alpha-3b; ugt5a1 = UDP-glucuronosyltransferase 5a1; col1a2 = 779
collagen type I alpha 2; col1a1 = collagen type I alpha 1; fn1b = fibronectin 1b; aldh1a2 = aldehyde dehydrogenase 780
1 family, member A2; ctsd = cathepsin D; ugt1ab = UDP-glucuronosyltransferase 1ab; cyp3a65 = cytochrome P450 781
3a65. 782
783
Fig. 5 Design and action site of antisense RNA sequence of sf1. a Sequence information and interference sites of 784
the two sf1 antisense RNAs (anti-sf1-Ⅰ and anti-sf1-II). The antisense anti-sf1-Ⅰ sequence is 113 bp; the interference 785
site contains the antisense sequence of a first intron partial sequence, a first exon partial sequence, and a 5'- non-786
translated sequence of four bases of the sf1 mRNA precursor. The antisense anti-sf1-II sequence is 104 bp; the 787
interference site contains the antisense sequence of a second intron partial sequence, and a first exon partial sequence 788
of the sf1 mRNA precursor. b Sequence information and interference sites of the two antisense RNAs (anti-sf1 789
transcript variant X1-Ⅰ and anti-sf1 transcript variant X1-Ⅱ) of sf1 transcript variant X1. The antisense RNA 790
sequence of the anti-sf1 transcript variant X1-Ⅰ is 102 bp in size; the interference site contains the antisense sequence 791
of a first intron partial sequence, and a 5’-non-translated sequence of 80 bases of sf1 transcript variant X1 mRNA 792
precursor. The antisense RNA sequence of the anti-sf1 transcript variant X1-Ⅱ is 102 bp in size, and the interference 793
site contains the antisense sequence of a second intron partial sequence, a first exon sequence, and a 5’-non-794
translated sequence of 60 bases of sf1 transcript variant X1 mRNA precursor. 795
796
References
1. Hruscha A, et al. Efficient CRISPR/Cas9 genome editing with low off-target effects in zebrafish. Development. 140, 4982-
4987 (2013).
2. Hwang WY, et al. Efficient genome editing in zebrafish using a CRISPR-Cas system. Nat. Biotechnol. 31, 227-229 (2013).
3. Yeh YC, et al. Using CRISPR/Cas9-mediated gene editing to further explore growth and trade-off effects in myostatin-
mutated F4 medaka (Oryzias latipes). Sci Rep. 7, 11435 (2017).
4. Yano. A, Nicol. B, Jouanno. E, Quillet. E, Fostier. A. The sexually dimorphic on the Y-chromosome gene (sdY) is a
conserved male-specific Y-chromosome sequence in many salmonids. Evol. Appl. 6, 486–496 (2013).
5. Edvardsen RB, Sven L, Lene K, Ove SK, Anna W, Diego F. Targeted Mutagenesis in Atlantic Salmon (Salmo salar L.)
Using the CRISPR/Cas9 System Induces Complete Knockout Individuals in the F0 Generation. PLoS One. 9, 108622
(2014).
6. Datsomor, A.K., Olsen, R.E., Zic, N. et al. CRISPR/Cas9-mediated editing of Δ5 and Δ6 desaturases impairs Δ8-
desaturation and docosahexaenoic acid synthesis in Atlantic salmon (Salmo salar L.). Sci Rep 9, 16888 (2019).
7. Ran FA, et al. Double Nicking by RNA-Guided CRISPR Cas9 for Enhanced Genome Editing Specificity. Cell. 154, 1380-
1389 (2013).
8. Parker KL, Schimmer BP. Genes essential for early events in gonadal development. Ann. Med. 34, 171-178 (2002).
9. Parker KL, Schimmer BP. The roles of the nuclear receptor steroidogenic factor 1 in endocrine differentiation and
development. Trends Endocrinol. Metab. 7, 203-207 (1996).
10. Watanabe M, Tanaka M, Kobayashi D, Yoshiura Y, Oba Y, Nagahama Y. Medaka (Oryzias latipes) FTZ-F1 potentially
regulates the transcription of P-450 aromatase in ovarian follicles: cDNA cloning and functional characterization. Mol.
Cell. Endocrinol. 149, 221-228 (1999).
11. Lin WW, Wang HW, Sum C, Liu D, Hew CL, Chung BC. Zebrafish ftz-f1 gene has two promoters, is alternatively spliced,
and is expressed in digestive organs. Biochem. J. 348, 439-446 (2000).
12. von Hofsten J, Jones I, Karlsson J, Olsson PE. Developmental expression patterns of FTZ-F1 homologues in zebrafish
(Danio rerio). Gen. Comp. Endocrinol. 121, 146-155 (2001).
13. Yoshiura Y, Senthilkumaran B, Watanabe M, Oba Y, Kobayashi T, Nagahama Y. Synergistic expression of Ad4BP/SF-1
and cytochrome P-450 aromatase (ovarian type) in the ovary of Nile tilapia, Oreochromis niloticus, during vitellogenesis
suggests transcriptional interaction. Biol. Reprod. 68, 1545-1553 (2003).
14. Kobayashi Y, Sunobe T, Kobayashi T, Nakamura M, Suzuki N, Nagahama Y. Molecular cloning and expression of
Ad4BP/SF-1 in the serial sex changing gobiid fish, Trimma okinawae. Biochem. Biophys. Res. Commun. 332, 1073-1080
(2005).
15. Kazeto Y, Goto-Kazeto R, Thomas P, Trant JM. Molecular characterization of three forms of putative membrane-bound
progestin receptors and their tissue-distribution in channel catfish, Ictalurus punctatus. J. Mol. Endocrinol. 34, 781-791
(2005).
16. Choi CY, An KW, Jo PG, Kang DY, Chang YJ. Effects of gonadotropin-releasing hormone analog (GnRHa) on
steroidogenic factor-1 (SF-1) and estrogen receptor beta (ERbeta) gene expression in the black porgy (Acanthopagrus
schlegeli). Comp Biochem Physiol B Biochem Mol Biol. 147, 82-86 (2007).
17. Sridevi P, Dutta-Gupta A, Senthilkumaran B. Molecular Cloning and Expression Analysis of fushi tarazu Factor 1 in the
Brain of Air-Breathing Catfish, Clarias gariepinus. PLoS One. 6, e28867 (2011).
18 von Hofsten J, Karlsson J, Jones I, Olsson PE. Expression and regulation of fushi tarazu factor-1 and steroidogenic genes
during reproduction in arctic char (Salvelinus alpinus). Biol. Reprod. 67, 1297-1304 (2002).
19. von Hofsten. J, Larsson. A, Olsson. PE. Novel steroidogenic factor-1 homolog (ff1d) is coexpressed with anti-Mullerian
hormone (AMH) in zebrafish. Dev. Dyn. 233, 595-604 (2010).
20. Wang D-S, et al. Foxl2 up-regulates aromatase gene transcription in a female-specific manner by binding to the promoter
as well as interacting with Ad4 binding protein/steroidogenic factor 1. Mol. Endocrinol. 21, 712-725 (2007).
21. Nakamoto M, et al. Expression of 3β-hydroxysteroid dehydrogenase (hsd3b), star and ad4bp/sf-1 during gonadal
development in medaka (Oryzias latipes). Gen Comp Endocrinol. 176, 222-230 (2012).
22. Xie Q-P, He X, Sui Y-N, Chen L-L, Sun L-N, Wang D-S. Haploinsufficiency of SF-1 Causes Female to Male Sex Reversal
in Nile Tilapia, Oreochromis niloticus. Endocrinology. 157, 2500-2514 (2016).
23. Tomizawa J, Itoh T, Selzer G, Som T. Inhibition of ColE1 RNA primer formation by a plasmid-specified small RNA.
Proc. Natl. Acad. Sci. U. S. A. 78, 1421-1425 (1981).
24. Oeller PW, Wong LM, Taylor LP, Pike DA, Theologis A. Reversible inhibition of tomato fruit senescence by antisense
RNA. Science. 254, 437-439 (1991).
25. Cuozzo, M., O'Connell, K., Kaniewski, W. et al. Viral Protection in Transgenic Tobacco Plants Expressing the Cucumber
Mosaic Virus Coat Protein or its Antisense RNA. Nat Biotechnol 6, 549–557 (1988).
26. Örvar BL, Ellis BE. Transgenic tobacco plants expressing antisense RNA for cytosolic ascorbate peroxidase show
increased susceptibility to ozone injury. Plant J. 11, 1297-1305(1997).
27. Fish JE, et al. Hypoxia-inducible expression of a natural cis-antisense transcript inhibits endothelial nitric-oxide synthase.
J. Biol. Chem. 282, 15652-15666 (2007).
28. Harshe RP, et al. Endogenous antisense RNA curbs CD39 expression in Crohn's disease. Nat. Commun. 11, 5894-5894
(2020).
29. El-Khairi R, Achermann JC. Steroidogenic Factor-1 and Human Disease. Semin. Reprod. Med. 30, 374-381 (2012).
30. Majdic G, et al. Knockout mice lacking steroidogenic factor 1 are a novel genetic model of hypothalamic obesity.
Endocrinology. 143, 607-614 (2002).
31 Zhao LP, Bakke M, Parker KL. Pituitary-specific knockout of steroidogenic factor 1. Mol. Cell. Endocrinol. 185, 27-
32(2001).
32. Schwetz V, Gumpold R, Graupp M, Hacker N, Obermayer-Pietsch B. Osteocalcin is not a strong determinant of serum
testosterone and sperm count in men from infertile couples. Andrology. 1, 590-594 (2013).
33. Caron KM, Clark BJ, Ikeda Y, Parker KL. Steroidogenic factor 1 acts at all levels of the reproductive axis. Steroids. 62,
53-56 (1997).
34. Tang B, Hu W, Hao J, Zhu Z. Developmental expression of steroidogenic factor-1, cyp19a1a and cyp19a1b from common
carp (Cyprinus carpio). Gen. Comp. Endocrinol. 167, 408-416 (2010).
35. Leers-Sucheta S, Morohashi KI, Mason JI, Melner MH. Synergistic activation of the human type II 3beta-hydroxysteroid
dehydrogenase/delta5-delta4 isomerase promoter by the transcription factor steroidogenic factor-1/adrenal 4-binding
protein and phorbol ester. J. Biol. Chem. 272, 7960-7967 (1997).
36. Brandt T, et al. 46,XY disorder of sex development and developmental delay associated with a novel 9q33.3 microdeletion
encompassing NR5A1. Eur. J. Med. Genet. 56, 619-623 (2013).
37. Guchhait R, Chatterjee A, Mukherjee D, Pramanick K. Seasonal ovarian development in relation to the gonadotropins,
steroids, aromatase and steroidogenic factor 1 (SF-1) in the banded gourami, Trichogaster fasciata. Gen. Comp.
Endocrinol. 268, 40-49 (2018).
38. Dewailly D, Robin G, Peigne M, Decanter C, Pigny P, Catteau-Jonard S. Interactions between androgens, FSH, anti-
Mullerian hormone and estradiol during folliculogenesis in the human normal and polycystic ovary. Hum. Reprod. Update.
22, 709-724 (2016).
39. Nagler JJ, Idler DR. Invitro ovarian estradiol-17-beta and testosterone responses to pituitary extract and corresponding
serum levels during the prespawning to vitellogenic phases of the reproductive-cycle in winter flounder
(pseudopleuronectes-americanus). Comp. Biochem. Physiol. A. 101, 69-75 (1992).
40. Duval DL, Nelson SE, Clay CM. A binding site for steroidogenic factor-1 is part of a complex enhancer that mediates
expression of the murine gonadotropin-releasing hormone receptor gene. Biol. Reprod. 56, 160-168 (1997).
41. Halvorson LM, Kaiser UB, Chin WW. Stimulation of luteinizing hormone beta gene promoter activity by the orphan
nuclear receptor, steroidogenic factor-1. J. Biol. Chem. 271, 6645-6650 (1996).
42. Ingraham HA, et al. The nuclear receptor steroidogenic factor-1 acts at multiple levels of the reproductive axis. Genes
Dev. 8, 2302-2312 (1994).
43. Brown P, McNeilly AS. Steroidogenic factor-1 (SF-1) and the regulation of expression of luteinising hormone and follicle
stimulating hormone b-subunits in the sheep anterior pituitary in vivo. Int. J. Biochem. Cell Biol. 29, 1513-1524 (1997).
44. Devlin RH, Nagahama Y. Sex determination and sex differentiation in fish: an overview of genetic, physiological, and
environmental influences. Aquaculture. 208, 191-364 (2002).
45. Choi CY, An KW, Jo PG, Kang DY, Chang YJ. Effects of gonadotropin-releasing hormone analog (GnRHa) on
steroidogenic factor-1 (SF-1) and estrogen receptor beta (ER beta) gene expression in the black porgy (Acanthopagrus
schlegeli). Comp. Biochem. Physiol. B-Biochem. Mol. Biol. 147, 82-86 (2007).
46 RanjithRamasamy MD, et al. High serum FSH levels in men with nonobstructive azoospermia does not affect success of
microdissection testicular sperm extraction. Fertil. Steril. 92, 590-593(2009)
47. Livera G, Rouiller-Fabre V, Pairault C, Levacher C, Habert R. Regulation and perturbation of testicular functions by
vitamin A. Reproduction. 124, 173-180 (2002).
48. Li H, Palczewski K, Baehr W, Clagett-Dame M. Vitamin A Deficiency Results in Meiotic Failure and Accumulation of
Undifferentiated Spermatogonia in Prepubertal Mouse Testis. Biol. Reprod. 84, 336-341 (2011).
49. Brown JA, Eberhardt DM, Schrick FN, Roberts MP, Godkin JD. Expression of retinol-binding protein and cellular retinol-
binding protein in the bovine ovary. Mol. Reprod. Dev. 64, 261-269 (2003).
50. Buckley DB, Klaassen CD. Induction of Mouse UDP-Glucuronosyltransferase mRNA Expression in Liver and Intestine
by Activators of Aryl-Hydrocarbon Receptor, Constitutive Androstane Receptor, Pregnane X Receptor, Peroxisome
Proliferator-Activated Receptor alpha, and Nuclear Factor Erythroid 2-Related Factor 2. Drug Metab. Dispos. 37, 847-
856 (2009).
51. Huang H, Wu Q. Cloning and Comparative Analyses of the Zebrafish Ugt Repertoire Reveal Its Evolutionary Diversity.
PLoS One. 5, e9144 (2010).
52. Christen V, Fent K. Tissue-, sex- and development-specific transcription profiles of eight UDP-glucuronosyltransferase
genes in zebrafish (Danio rerio) and their regulation by activator of aryl hydrocarbon receptor. Aquat. Toxicol. 150, 93-
102 (2014).
53. Yasuhiko K, Angel R, R Marina R, Concepción R-E, Juan Carlos IB. Retinoic acid signalling links left-right asymmetric
patterning and bilaterally symmetric somitogenesis in the zebrafish embryo. Nature. 435, 165-171 (2005).
54. Smets KJ, Barlow T, Vanhaesebrouck P. Maternal vitamin A deficiency and neonatal microphthalmia: complications of
biliopancreatic diversion? Eur. J. Pediatr. 165, 502-504 (2006).
55. Sadoul B, Geffroy B. Measuring cortisol, the major stress hormone in fishes. J. Fish Biol. 94, 540-555 (2019).
56. Li M, et al. Retinoic acid triggers meiosis initiation via stra8-dependent pathway in Southern catfish, Silurus meridionalis.
Gen. Comp. Endocrinol. 232, 191-198 (2016).
57. Feng R, et al. Retinoic acid homeostasis through aldh1a2 and cyp26a1 mediates meiotic entry in Nile tilapia (Oreochromis
niloticus). Sci Rep. 5, 10131 (2015).
58. Mommsen TP, Vijayan MM, Moon TW. Cortisol in teleosts: dynamics, mechanisms of action, and metabolic regulation.
Rev. Fish. Biol. Fish. 9, 211-268 (1999).
59. Yamaguchi T, Yoshinaga N, Yazawa T, Gen K, Kitano T. Cortisol Is Involved in Temperature-Dependent Sex
Determination in the Japanese Flounder. Endocrinology. 151, 3900-3908 (2010).
60. Zygmunt K. The 11β-hydroxysteroid dehydrogenases: functions and physiological effects. Mol. Cell. Endocrinol. 151,
121-127 (1999).
61. Alderman. SL, Vijayan. MM. 11 -Hydroxysteroid dehydrogenase type 2 in zebrafish brain: a functional role in
hypothalamus-pituitary-interrenal axis regulation. J. Endocrinol. 215, 393 (2012).
62. Tokarz J, Norton W, Moeller G, de Angelis MH, Adamski J. Zebrafish 20 beta-Hydroxysteroid Dehydrogenase Type 2 Is
Important for Glucocorticoid Catabolism in Stress Response. PLoS One. 8, e54851 (2013).
63. Hu YC, Chu K-F, Hwang L-Y, Lee T-H. Cortisol regulation of Na+, K+-ATPase beta 1 subunit transcription via the pre-
receptor 11 beta-hydroxysteroid dehydrogenase 1-like (11 beta-Hsd1L) in gills of hypothermal freshwater milkfish, J.
Steroid Biochem. Mol. Biol. 192, 105381 (2019).
64 Fernandino JI, Hattori RS, Kishii A, Strüssmann CA, Somoza GM. The cortisol and androgen pathways cross talk in high
temperature-induced masculinization: The 11β-hydroxysteroid dehydrogenase as a key enzyme. Endocrinology, 153,
6003-6011(2012)
65. Presley CJ, et al. A new approach to understanding racial disparities in prostate cancer treatment. J. Geriatr. Oncol. 4, 1-
8 (2013).
66. Das DK, et al. miR-1207-3p regulates the androgen receptor in prostate cancer via FNDC1/fibronectin. Exp. Cell Res.
348, 190-200 (2016).
67. Jansen J, Greither T, Behre HM. Androgen-Regulated microRNAs (AndroMiRs) as Novel Players in Adipogenesis. I nt.
J. Mol. Sci. 20, 5767 (2019).
68. Kopelman PG. Obesity as a medical problem. Nature. 404, 635-643 (2000).
69. Bland ML, et al. Haploinsufficiency of steroidogenic factor-1 in mice disrupts adrenal development leading to an impaired
stress response. Proc. Natl. Acad. Sci. U. S. A. 97, 14488-14493 (2000).
70. Blanco G, Mercer RW. Isozymes of the Na-K-ATPase: heterogeneity in structure, diversity in function. Am. J. Physiol.
275, 633-650 (1998).
71. Ollinger K. Inhibition of cathepsin D prevents free-radical-induced apoptosis in rat cardiomyocytes. Arch. Biochem.
Biophys. 373, 346-351 (2000).
72. Johansson AC, Steen H, Ollinger K, Roberg K. Cathepsin D mediates cytochrome c release and caspase activation in
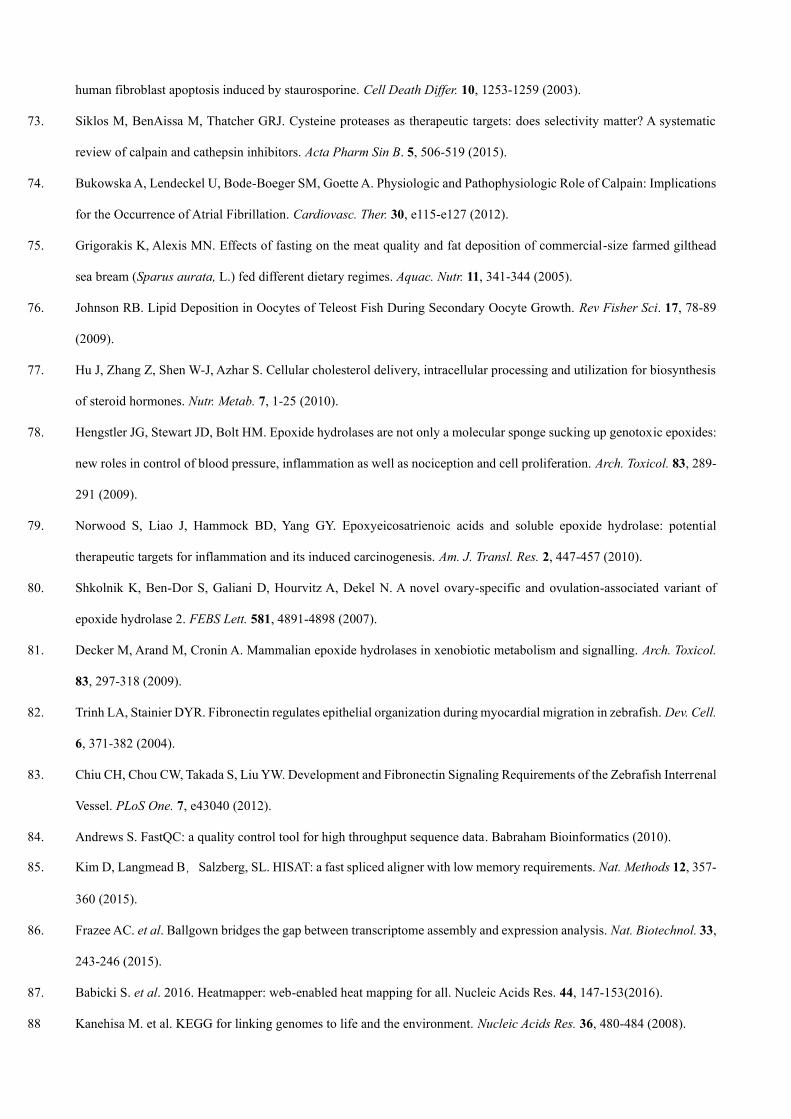
human fibroblast apoptosis induced by staurosporine. Cell Death Differ. 10, 1253-1259 (2003).
73. Siklos M, BenAissa M, Thatcher GRJ. Cysteine proteases as therapeutic targets: does selectivity matter? A systematic
review of calpain and cathepsin inhibitors. Acta Pharm Sin B. 5, 506-519 (2015).
74. Bukowska A, Lendeckel U, Bode-Boeger SM, Goette A. Physiologic and Pathophysiologic Role of Calpain: Implications
for the Occurrence of Atrial Fibrillation. Cardiovasc. Ther. 30, e115-e127 (2012).
75. Grigorakis K, Alexis MN. Effects of fasting on the meat quality and fat deposition of commercial-size farmed gilthead
sea bream (Sparus aurata, L.) fed different dietary regimes. Aquac. Nutr. 11, 341-344 (2005).
76. Johnson RB. Lipid Deposition in Oocytes of Teleost Fish During Secondary Oocyte Growth. Rev Fisher Sci. 17, 78-89
(2009).
77. Hu J, Zhang Z, Shen W-J, Azhar S. Cellular cholesterol delivery, intracellular processing and utilization for biosynthesis
of steroid hormones. Nutr. Metab. 7, 1-25 (2010).
78. Hengstler JG, Stewart JD, Bolt HM. Epoxide hydrolases are not only a molecular sponge sucking up genotoxic epoxides:
new roles in control of blood pressure, inflammation as well as nociception and cell proliferation. Arch. Toxicol. 83, 289-
291 (2009).
79. Norwood S, Liao J, Hammock BD, Yang GY. Epoxyeicosatrienoic acids and soluble epoxide hydrolase: potential
therapeutic targets for inflammation and its induced carcinogenesis. Am. J. Transl. Res. 2, 447-457 (2010).
80. Shkolnik K, Ben-Dor S, Galiani D, Hourvitz A, Dekel N. A novel ovary-specific and ovulation-associated variant of
epoxide hydrolase 2. FEBS Lett. 581, 4891-4898 (2007).
81. Decker M, Arand M, Cronin A. Mammalian epoxide hydrolases in xenobiotic metabolism and signalling. Arch. Toxicol.
83, 297-318 (2009).
82. Trinh LA, Stainier DYR. Fibronectin regulates epithelial organization during myocardial migration in zebrafish. Dev. Cell.
6, 371-382 (2004).
83. Chiu CH, Chou CW, Takada S, Liu YW. Development and Fibronectin Signaling Requirements of the Zebrafish Interrenal
Vessel. PLoS One. 7, e43040 (2012).
84. Andrews S. FastQC: a quality control tool for high throughput sequence data. Babraham Bioinformatics (2010).
85. Kim D, Langmead B,Salzberg, SL. HISAT: a fast spliced aligner with low memory requirements. Nat. Methods 12, 357-
360 (2015).
86. Frazee AC. et al. Ballgown bridges the gap between transcriptome assembly and expression analysis. Nat. Biotechnol. 33,
243-246 (2015).
87. Babicki S. et al. 2016. Heatmapper: web-enabled heat mapping for all. Nucleic Acids Res. 44, 147-153(2016).
88 Kanehisa M. et al. KEGG for linking genomes to life and the environment. Nucleic Acids Res. 36, 480-484 (2008).

89. Ma J, et al. iProX: an integrated proteome resource. Nucleic Acids Res. 47, D1211-D1217(2019).
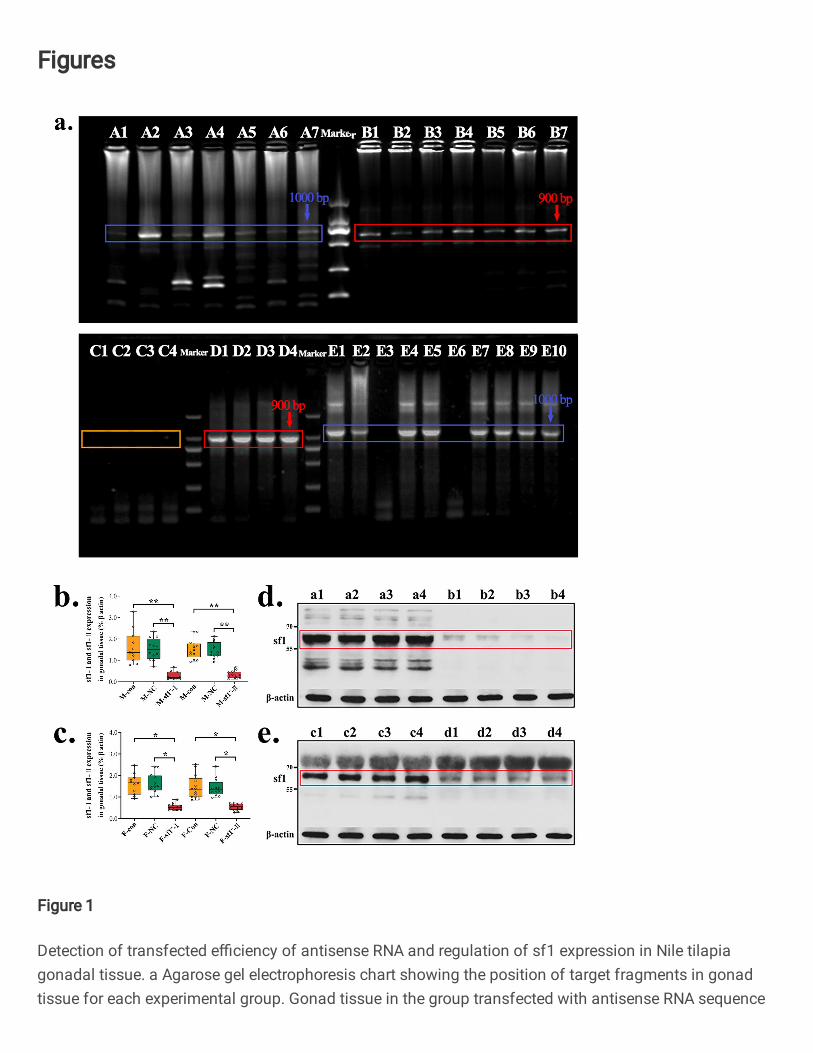
Figures
Figure 1
Detection of transfected e�ciency of antisense RNA and regulation of sf1 expression in Nile tilapiagonadal tissue. a Agarose gel electrophoresis chart showing the position of target fragments in gonadtissue for each experimental group. Gonad tissue in the group transfected with antisense RNA sequence
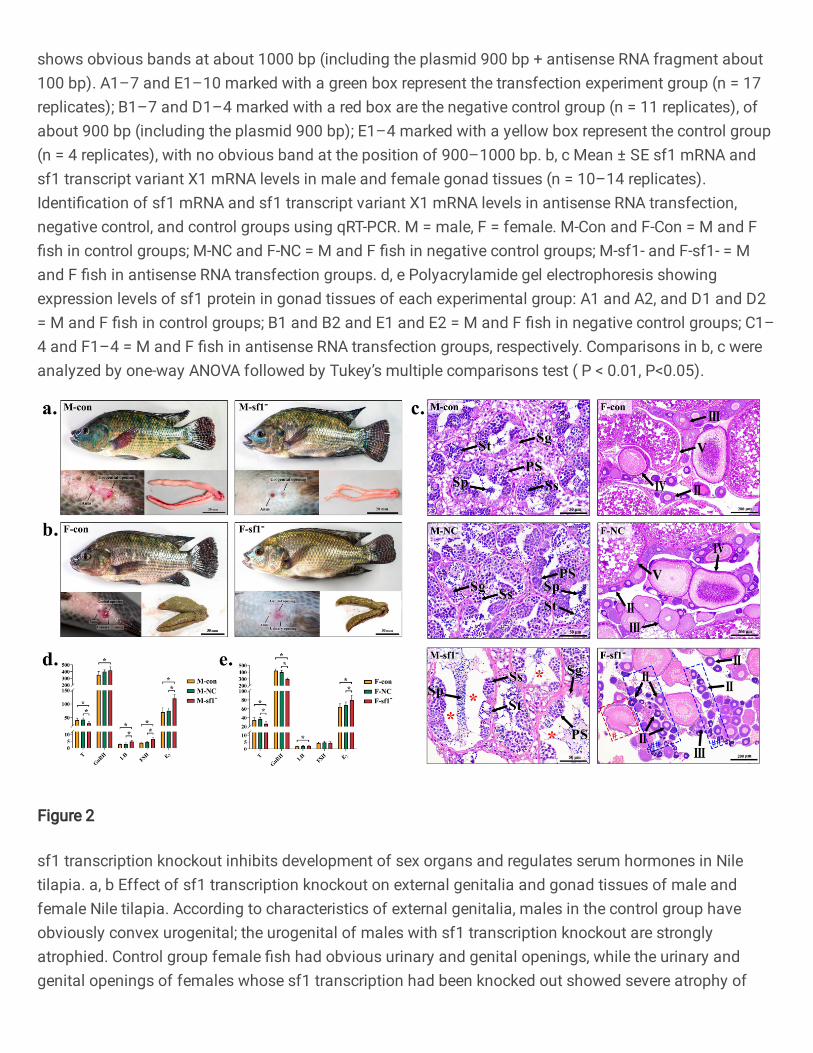
shows obvious bands at about 1000 bp (including the plasmid 900 bp + antisense RNA fragment about100 bp). A1–7 and E1–10 marked with a green box represent the transfection experiment group (n = 17replicates); B1–7 and D1–4 marked with a red box are the negative control group (n = 11 replicates), ofabout 900 bp (including the plasmid 900 bp); E1–4 marked with a yellow box represent the control group(n = 4 replicates), with no obvious band at the position of 900–1000 bp. b, c Mean ± SE sf1 mRNA andsf1 transcript variant X1 mRNA levels in male and female gonad tissues (n = 10–14 replicates).Identi�cation of sf1 mRNA and sf1 transcript variant X1 mRNA levels in antisense RNA transfection,negative control, and control groups using qRT-PCR. M = male, F = female. M-Con and F-Con = M and F�sh in control groups; M-NC and F-NC = M and F �sh in negative control groups; M-sf1- and F-sf1- = Mand F �sh in antisense RNA transfection groups. d, e Polyacrylamide gel electrophoresis showingexpression levels of sf1 protein in gonad tissues of each experimental group: A1 and A2, and D1 and D2= M and F �sh in control groups; B1 and B2 and E1 and E2 = M and F �sh in negative control groups; C1–4 and F1–4 = M and F �sh in antisense RNA transfection groups, respectively. Comparisons in b, c wereanalyzed by one-way ANOVA followed by Tukey’s multiple comparisons test ( P < 0.01, P<0.05).
Figure 2
sf1 transcription knockout inhibits development of sex organs and regulates serum hormones in Niletilapia. a, b Effect of sf1 transcription knockout on external genitalia and gonad tissues of male andfemale Nile tilapia. According to characteristics of external genitalia, males in the control group haveobviously convex urogenital; the urogenital of males with sf1 transcription knockout are stronglyatrophied. Control group female �sh had obvious urinary and genital openings, while the urinary andgenital openings of females whose sf1 transcription had been knocked out showed severe atrophy of
these openings and could not be distinguished urinary or genital opening. c Representative images of HE-stained gonad tissue of male (× 400, scale bar 50 μm) and female (×100, scale bar: 200 μm). M = male, F= female. M-Con and F-Con = M and F �sh in control groups; M-NC and F-NC = M and F �sh in negativecontrol groups; M-sf1- and F-sf1- = M and F �sh in antisense RNA transfection groups. Sp: sperm; Sg:spermatogonia; PS: primary spermatocytes; SS: second spermatocyte; St: spermatocyte. , , , and represent oocytes of stages , , , and , respectively. * represents vacuolation. A green box (##)represents oocyte cluster. A red box (#) represents oocyte membrane folding. d, e Mean ± SE serum sexhormone levels in male and female �sh. Serum gonadotropin releasing hormone (GnRH), folliclestimulating hormone (FSH), luteinizing hormone (LH), estradiol (E2) and testosterone (T) contents ofcontrol, negative control, and sf1 transcription knockout groups were identi�ed using enzyme-linkedimmunoassay kits. Comparisons in d, e were analyzed by one-way ANOVA followed by Tukey’s multiplecomparisons test (*P < 0.05).
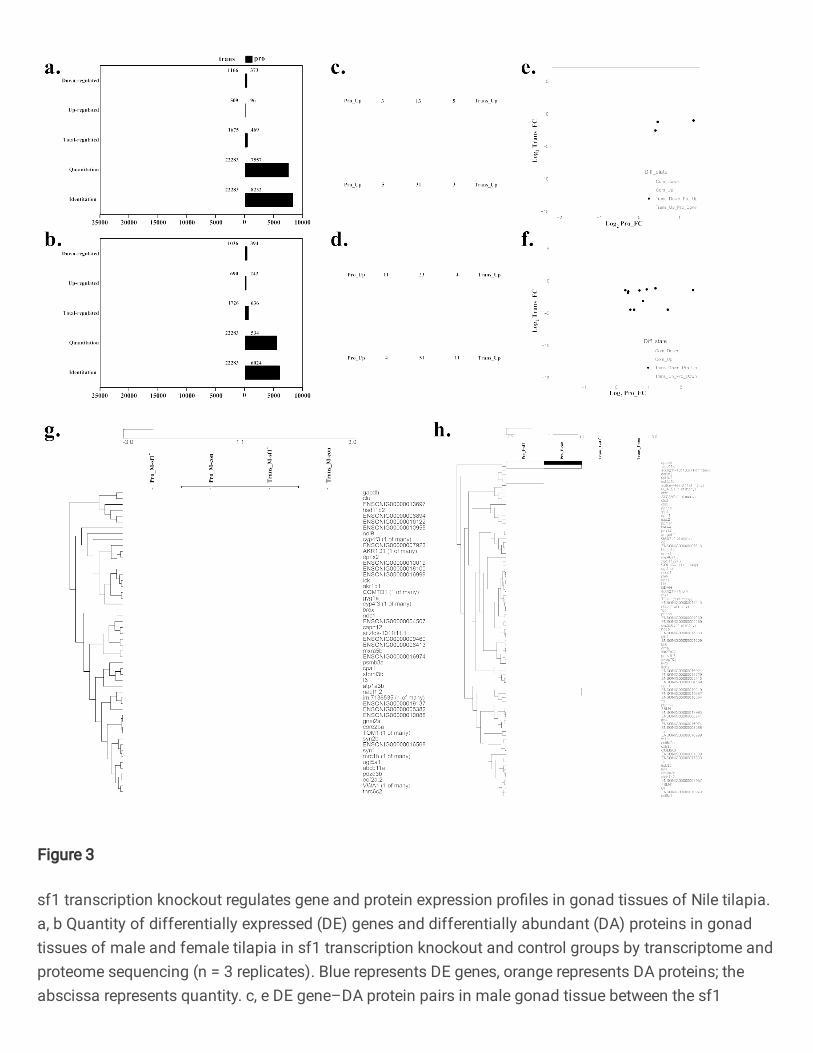
Figure 3
sf1 transcription knockout regulates gene and protein expression pro�les in gonad tissues of Nile tilapia.a, b Quantity of differentially expressed (DE) genes and differentially abundant (DA) proteins in gonadtissues of male and female tilapia in sf1 transcription knockout and control groups by transcriptome andproteome sequencing (n = 3 replicates). Blue represents DE genes, orange represents DA proteins; theabscissa represents quantity. c, e DE gene–DA protein pairs in male gonad tissue between the sf1
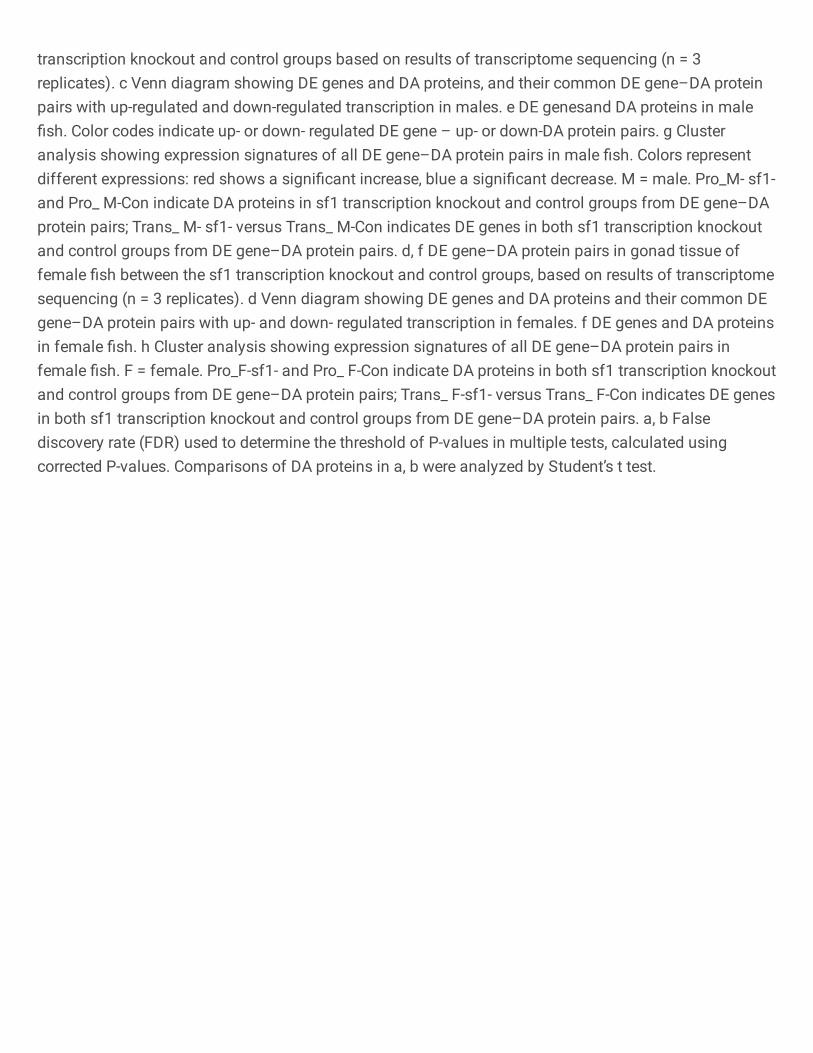
transcription knockout and control groups based on results of transcriptome sequencing (n = 3replicates). c Venn diagram showing DE genes and DA proteins, and their common DE gene–DA proteinpairs with up-regulated and down-regulated transcription in males. e DE genesand DA proteins in male�sh. Color codes indicate up- or down- regulated DE gene – up- or down-DA protein pairs. g Clusteranalysis showing expression signatures of all DE gene–DA protein pairs in male �sh. Colors representdifferent expressions: red shows a signi�cant increase, blue a signi�cant decrease. M = male. Pro_M- sf1-and Pro_ M-Con indicate DA proteins in sf1 transcription knockout and control groups from DE gene–DAprotein pairs; Trans_ M- sf1- versus Trans_ M-Con indicates DE genes in both sf1 transcription knockoutand control groups from DE gene–DA protein pairs. d, f DE gene–DA protein pairs in gonad tissue offemale �sh between the sf1 transcription knockout and control groups, based on results of transcriptomesequencing (n = 3 replicates). d Venn diagram showing DE genes and DA proteins and their common DEgene–DA protein pairs with up- and down- regulated transcription in females. f DE genes and DA proteinsin female �sh. h Cluster analysis showing expression signatures of all DE gene–DA protein pairs infemale �sh. F = female. Pro_F-sf1- and Pro_ F-Con indicate DA proteins in both sf1 transcription knockoutand control groups from DE gene–DA protein pairs; Trans_ F-sf1- versus Trans_ F-Con indicates DE genesin both sf1 transcription knockout and control groups from DE gene–DA protein pairs. a, b Falsediscovery rate (FDR) used to determine the threshold of P-values in multiple tests, calculated usingcorrected P-values. Comparisons of DA proteins in a, b were analyzed by Student’s t test.
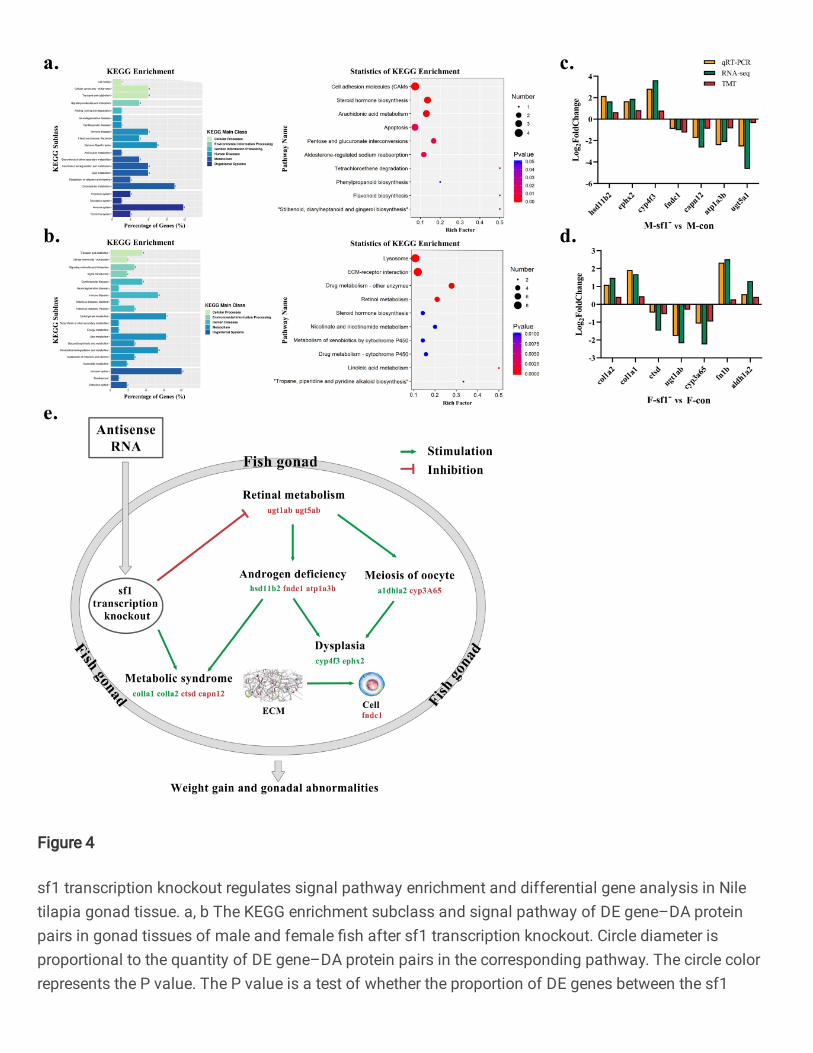
Figure 4
sf1 transcription knockout regulates signal pathway enrichment and differential gene analysis in Niletilapia gonad tissue. a, b The KEGG enrichment subclass and signal pathway of DE gene–DA proteinpairs in gonad tissues of male and female �sh after sf1 transcription knockout. Circle diameter isproportional to the quantity of DE gene–DA protein pairs in the corresponding pathway. The circle colorrepresents the P value. The P value is a test of whether the proportion of DE genes between the sf1
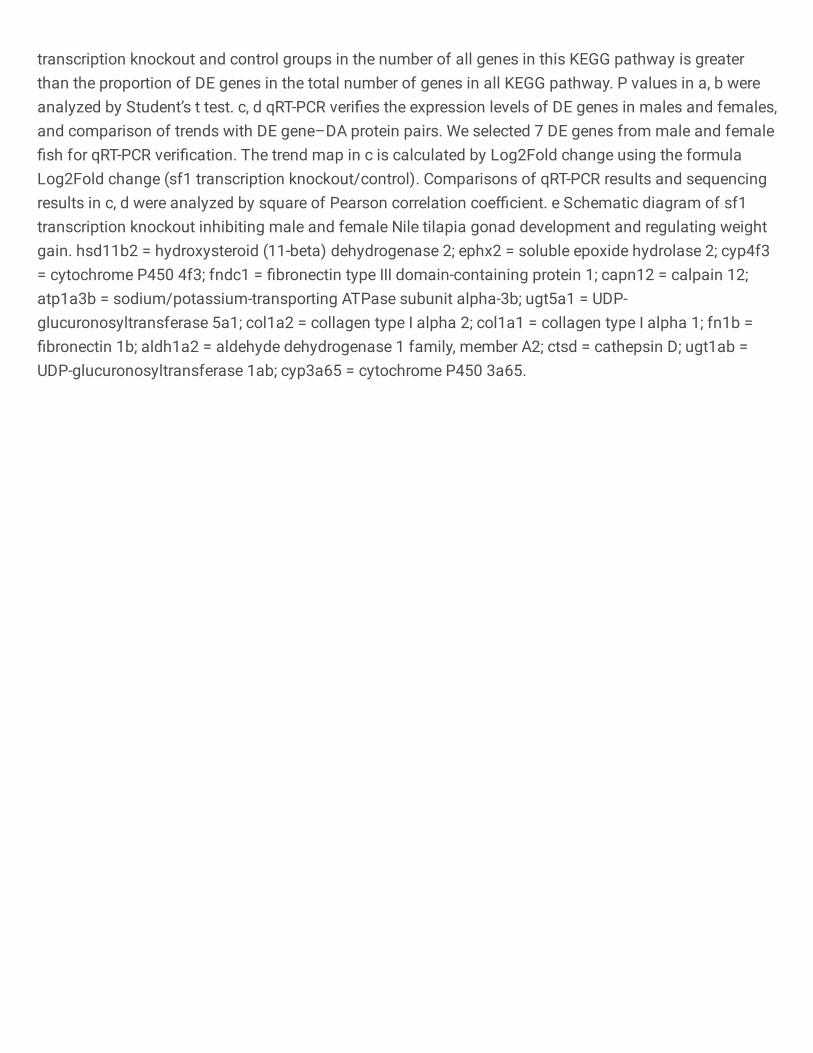
transcription knockout and control groups in the number of all genes in this KEGG pathway is greaterthan the proportion of DE genes in the total number of genes in all KEGG pathway. P values in a, b wereanalyzed by Student’s t test. c, d qRT-PCR veri�es the expression levels of DE genes in males and females,and comparison of trends with DE gene–DA protein pairs. We selected 7 DE genes from male and female�sh for qRT-PCR veri�cation. The trend map in c is calculated by Log2Fold change using the formulaLog2Fold change (sf1 transcription knockout/control). Comparisons of qRT-PCR results and sequencingresults in c, d were analyzed by square of Pearson correlation coe�cient. e Schematic diagram of sf1transcription knockout inhibiting male and female Nile tilapia gonad development and regulating weightgain. hsd11b2 = hydroxysteroid (11-beta) dehydrogenase 2; ephx2 = soluble epoxide hydrolase 2; cyp4f3= cytochrome P450 4f3; fndc1 = �bronectin type III domain-containing protein 1; capn12 = calpain 12;atp1a3b = sodium/potassium-transporting ATPase subunit alpha-3b; ugt5a1 = UDP-glucuronosyltransferase 5a1; col1a2 = collagen type I alpha 2; col1a1 = collagen type I alpha 1; fn1b =�bronectin 1b; aldh1a2 = aldehyde dehydrogenase 1 family, member A2; ctsd = cathepsin D; ugt1ab =UDP-glucuronosyltransferase 1ab; cyp3a65 = cytochrome P450 3a65.
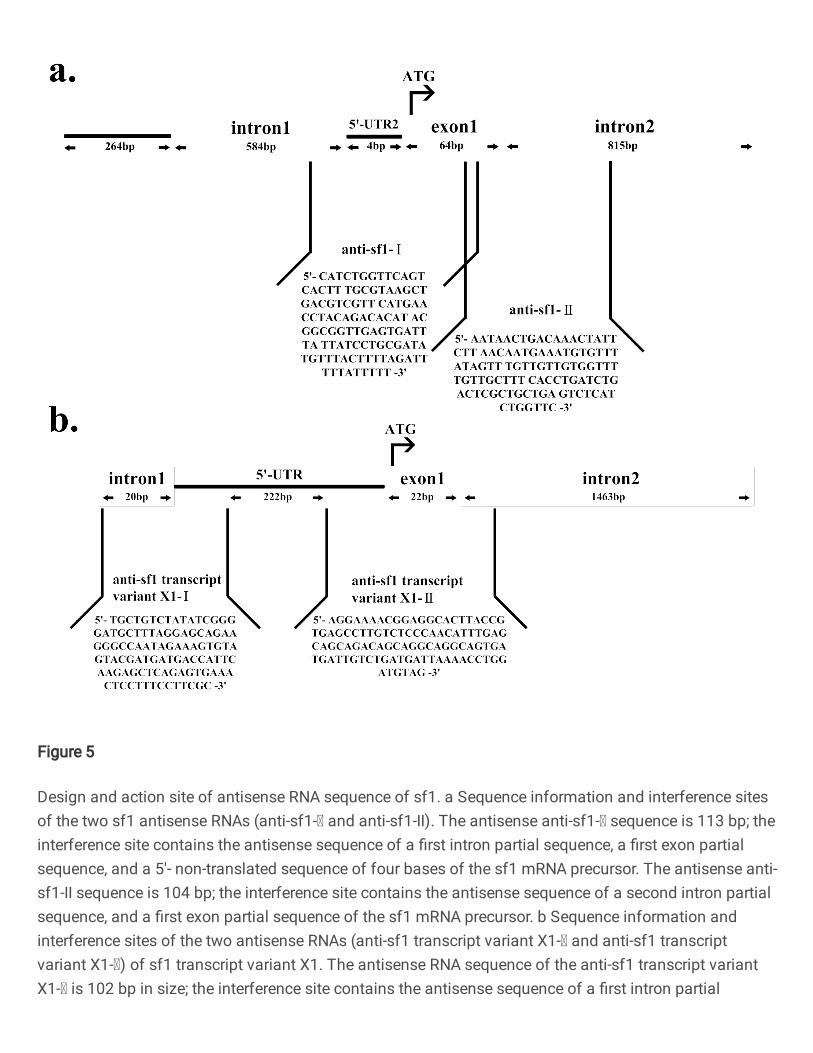
Figure 5
Design and action site of antisense RNA sequence of sf1. a Sequence information and interference sitesof the two sf1 antisense RNAs (anti-sf1- and anti-sf1-II). The antisense anti-sf1- sequence is 113 bp; theinterference site contains the antisense sequence of a �rst intron partial sequence, a �rst exon partialsequence, and a 5'- non-translated sequence of four bases of the sf1 mRNA precursor. The antisense anti-sf1-II sequence is 104 bp; the interference site contains the antisense sequence of a second intron partialsequence, and a �rst exon partial sequence of the sf1 mRNA precursor. b Sequence information andinterference sites of the two antisense RNAs (anti-sf1 transcript variant X1- and anti-sf1 transcriptvariant X1-) of sf1 transcript variant X1. The antisense RNA sequence of the anti-sf1 transcript variantX1- is 102 bp in size; the interference site contains the antisense sequence of a �rst intron partial
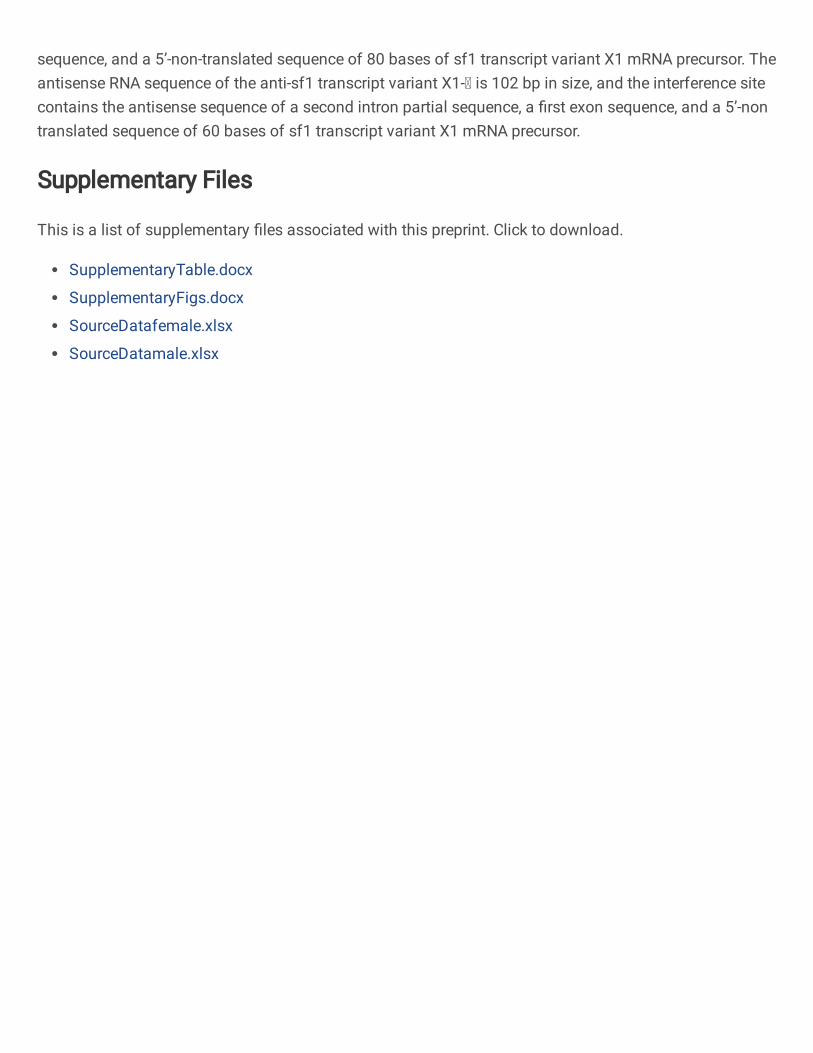
sequence, and a 5’-non-translated sequence of 80 bases of sf1 transcript variant X1 mRNA precursor. Theantisense RNA sequence of the anti-sf1 transcript variant X1- is 102 bp in size, and the interference sitecontains the antisense sequence of a second intron partial sequence, a �rst exon sequence, and a 5’-nontranslated sequence of 60 bases of sf1 transcript variant X1 mRNA precursor.
Supplementary Files
This is a list of supplementary �les associated with this preprint. Click to download.
SupplementaryTable.docx
SupplementaryFigs.docx
SourceDatafemale.xlsx
SourceDatamale.xlsx