transfers and the class of 2002 - ierc.education · pdf fileclass of 2002 jennifer presley ......
TRANSCRIPT
1
Transfers and the Class of 2002
Jennifer Presley(with Brad White and Yuqin Gong)
Illinois Education Research Council
November 14, 2007

2
Overview of the Presentation
• Introduction to the longitudinal study of the Class of 2002
• Who is going to college, and where do they go?
• Transfer and completion status of community college students
• Reverse transfers• Implications for policy and practice

3
The Study• All 113,660 public high school students in the Illinois
Class of 2002.
• Enrollments in institutions of higher education, public and private, in state and out of state, from the National Student Clearinghouse (NSC) each year.
• Certificates and degrees from ICCB and NSC.
• Following the Class for six years. Reporting today on third year results (through 2004-2005), with some fourth year enrollment updates (through 2005-2006).

4
Self-Reported High School GPA<=2.4 2.5-2.9 3.0-3.4 3.5-4.0 Missing
ACT < 20 20% 8% 7% 2% 15%
20-22 3% 4% 5% 3% 4%
23-25 1% 2% 4% 5% 3%
26+ 0% 1% 3% 10% 3%
The Structure of the Illinois College Readiness Index

5
Distribution of the Class of 2002
Percentage Expecting Bachelor’s Degree
or More
Not/Least Ready
Minimally Ready
Somewhat Ready
More Ready
Most Ready
34% 11% 17% 17% 20%
72%
84%
90%
96%
99%
• Roughly a third of the Class of 2002 are not/least ready for college, about a third are partially ready, and about a third are college ready.
• Majority expect to earn a bachelor’s degree.
}}
IERC College Readiness Index

6
Participation Status of the Class of 2002 by the 3rd Year[4th year update] After High School Graduation, by
College Readiness (%)
College ReadinessEnrolled All Three [Four]
YearsNot Enrolled
Any Time N
Not/Least Ready 24 [17] 45 [43] 39,015
Minimally Ready 37 [29] 30 [28] 12,569
Somewhat Ready 52 [44] 22 [20] 19,691
More Ready 66 [60] 13 [11] 19,879
Most Ready 78 [73] 9 [8] 22,506
Total 48 [42] 27 [25] 113,660
• About one in four students overall and one in twelve most-ready students have never enrolled in college by the fourth year after high school graduation.
7
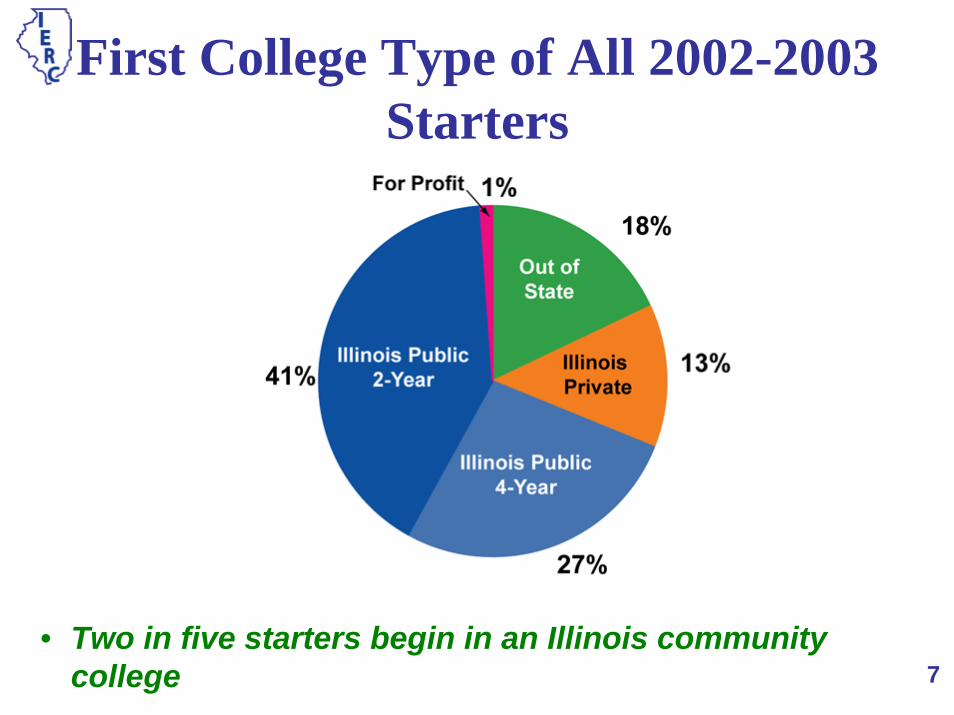
First College Type of All 2002-2003 Starters
• Two in five starters begin in an Illinois community college

8
First College Type of Not/Least-Ready Students
• Overall, 2-year institutions provide access to postsecondary education for almost three quarters of not/least-ready college-goers.
• The pattern for CPS students was different, with half enrolling at the 2-year level, and one quarter enrolling in Illinois public 4-year institutions.

9
First College Type of More/Most-Ready Students
• There are many college-ready students starting in the two-year sector who need support to seek transfer to a four-year institution.
- Remember that almost all college-ready students now expect to complete a bachelor’s degree.

10
College-Choice Patterns of Most-Ready Students by High School Region
• Starting institution is influenced by which colleges are locatedlocally.
• Two year institutions provide a fertile field for recruiting college-ready 4-year transfers.
11
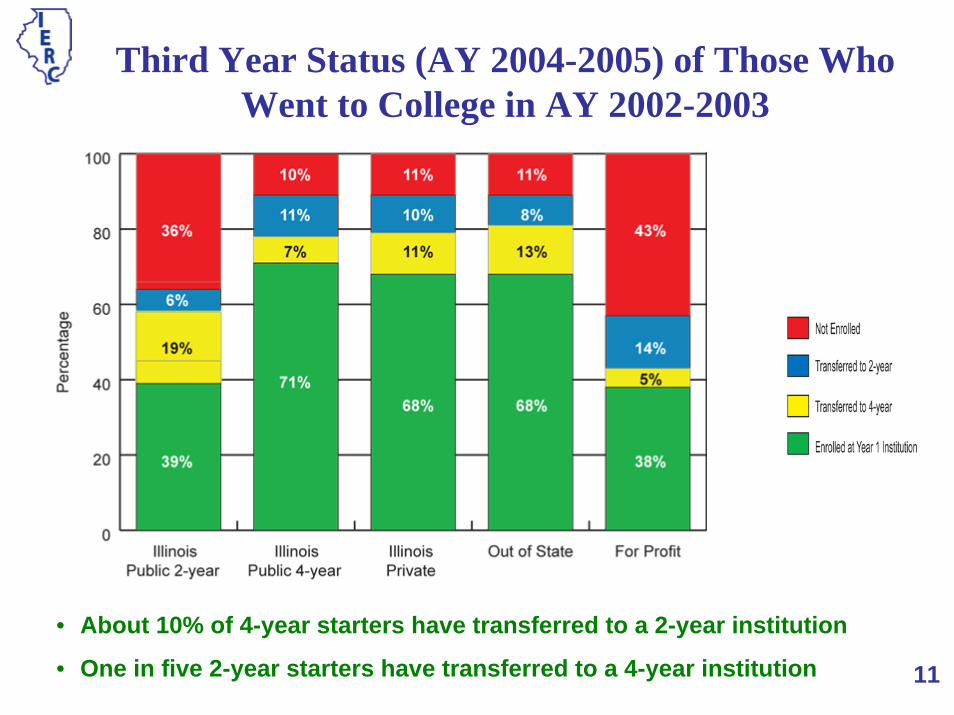
Third Year Status (AY 2004-2005) of Those Who Went to College in AY 2002-2003
• About 10% of 4-year starters have transferred to a 2-year institution
• One in five 2-year starters have transferred to a 4-year institution

12
Third Year Enrollment and Completion Status of Illinois Public Two-Year College Starters
Enrolled at Year 1 Institution Not Enrolled
Transferred to 2-Year Institution
Transferred to 4-Year Institution
Without Degree or Certificate
With Degree or Certificate**
Without Degree or Certificate
With Degree or Certificate
Without Degree or Certificate
With Degree or Certificate
Without Degree or Certificate
With Degree or Certificate N
Not/Least Ready 34% 4% 45% 2% 6% <0.5% 7% 2% 11,798
Minimally Ready 34% 7% 36% 2% 6% <0.5% 10% 4% 4,529
Somewhat Ready 35% 9% 27% 2% 5% 1% 15% 6% 6,391
More Ready 28% 11% 23% 3% 3% 1% 19% 12% 4,730
Most Ready 21% 10% 16% 3% 2% 1% 27% 20% 2,287
Total 32% 7% 34% 2% 5% 1% 13% 6% 29,735*
*Information on level of third year institutions was missing for 26 students. ** Includes degree/certificates awarded in FY2005.
• Overall 16% (7% + 2% + 1% + 6%) of two-year starters have completed some program by the end of the third year.
• Leavers are not completing any type of program• It’s the college-ready students who are transferring

13
Enrolling full-time is very important to persistence —2-Year Starters in Year 3

14
And 4 -Year Starters in Year 3

15
Where students start also matters in persistence– Starting Full-time Only
Third Year Status
Enrolled at Year 1 Institution
Not Enrolled
Transferred to2-Year
Transferred to4-Year
Not/Least ReadyTwo-Year Institutions 43% 36% 8% 13% 5,025
Non/Less Competitive 4Y 52% 26% 16% 7% 1,004
Competitive 4Y 56% 17% 17% 11% 1,578
Very Competitive 4Y 59% 17% 17% 7% 394
Most/Highly Competitive 4Y 73% 11% 8% 7% 83More Ready
Two-Year Institutions 38% 23% 4% 35% 2,770
Non/Less Competitive 4Y 61% 16% 12% 12% 815
Competitive 4Y 70% 8% 11% 11% 4,903
Very Competitive 4Y 72% 8% 9% 10% 2,183
Most/Highly Competitive 4Y 84% 4% 5% 7% 896Most Ready
Two-Year Institutions 27% 19% 3% 50% 1,441
Non/Less Competitive 4Y 75% 9% 7% 10% 578
Competitive 4Y 78% 6% 6% 10% 3,720
Very Competitive 4Y 82% 4% 5% 9% 3,169
Most/Highly Competitive 4Y 90% 3% 2% 5% 5,760
N

16
Reverse Transfer Patterns (4 Yr to 2 YR)
•
Year
03 04 05 06
4 2 2 2 943 18.5 18.5
4 4 2 2 805 15.8 34.3
4 4 4 2 665 13.1 47.4
4 2 623 12.2 59.6
4 2 2 603 11.8 71.5
4 4 2 417 8.2 79.7
4 4 2 184 3.6 83.3
4 2 2 163 3.2 86.5
4 2 2 146 2.9 89.4
4 2 144 2.8 92.2
4 2 134 2.6 94.8
4 2 2 78 1.5 96.3
4 4 2 60 1.2 97.5
4 2 44 0.9 98.4
4 2 41 0.8 99.2
4 2 30 0.6 99.8
4 4 2 12 0.2 100.0
Total Reverse Transfers 5092 100.0
FrequencyPercent of
Reverse Transfers
Cumulative Percent
• 47% of reverse transfer students were enrolled for all four years.
• 48% of reverse transfer students moved to the 2-year sector in their second year of college – so more than half had at least two years at a four-year institution before reverse transferring.

17
Swirl Patterns (change sectors more than once)
• 76% of swirlers start at four-year institutions
• 44% of swirlers return to their original institution
Year
03 04 05 06
4 2 4 4 697 26.5 26.5
4 4 2 4 542 20.6 47.1
4 2 2 4 512 19.5 66.6
2 2 4 2 255 9.7 76.3
2 4 2 2 96 3.7 80.0
4 2 4 2 88 3.3 83.3
4 2 4 78 3.0 86.3
2 4 2 4 70 2.7 89.0
2 4 4 2 66 2.5 91.5
2 4 2 64 2.4 93.9
4 2 4 38 1.4 95.3
4 2 4 36 1.3 96.6
2 4 2 31 1.2 97.8
2 4 2 25 1.0 98.8
4 2 4 18 0.7 99.5
2 4 2 14 0.5 100.0
Total Swirlers 2630 100.0
FrequencyPercent of Swirlers
Cumulative Percent

18
Who are the 4-Year Starters Who Reverse Transfer?
Not/Least Ready
More/Most Ready
% who reverse transfer 22% 8%Low Parent Income 25% 11%High Parent Income 22% 5%Public Institution 22% 6%Private Institution 21% 8%Less/Non Competitive 25% 12%Competitive 22% 10%Very Competitive 18% 8%Most/Highly Selective 8% 3%
Readiness trumps family income.
Not a public/private phenomenon
Selective colleges keep even their not-ready students
Readiness matters

19
Key Findings• The two-year sector provides access to higher education
to 20% of Illinois’ college-ready high school graduates and 41% of all college-going high school graduates in Illinois.
• College readiness matters more to persistence than to starting college.
• Starting full-time matters. Attending full time trumps college readiness as a predictor of persistence.
• Where students start college matters. A more competitive environment helps students at all levels of readiness to persist.
• On-time transfer (within three years) is much more likely for college-ready two-year starters.

20
Recommendations1.All students need to be helped to attend full
time. Teachers, counselors, financial aid advisors, and the higher education community should work together to ensure that students and their parents understand the financial aid resources that are available to them – including loans when needed – as alternatives to extensive employment while attending college.
2.We need to change the image of community colleges in Illinois. There are many well-qualified students attending two-year institutions who can do very well when they transfer to four year institutions.Community colleges serve as many college-ready students as the public four-year sector (excluding UI), as well as the large majority of those who enter postsecondary education not/least ready.

21
3. The 7,000 college-ready traditional-age two-year starters each year (as well as older college-ready students) should be identified and given special support towards transfer to the four year sector, especially to competitive institutions.
4. Four-year institutions must help in the transition from usually small, local environments. Some students will be living away from home for the first time while trying to negotiate a peer group that has had the opportunity to bond and become comfortable with campus life. Transfer students deserve scholarship opportunities, assurance of course transfers and respectful academic advising, and access to appropriate residential housing.

22
BibliographyPresley, J. B. & Gong, Y. (2005). The demographics and academics of
college readiness in Illinois (IERC 2005-3). Edwardsville, IL: Illinois Education Research Council.
Gong, Y. & Presley, J. B. (2006). The demographics and academics of college going in Illinois (IERC 2006-2). Edwardsville, IL: Illinois Education Research Council.
Gong, Y., Presley, J. B., & White, B. R. (2006). Following the Illinois high school class of 2002: Three years into college (IERC 2006-5). Edwardsville, IL: Illinois Education Research Council.

23
http://ierc.siue.edu
1-866-799-IERC (4372)