transform your business - linq transform your business white paper.pdf · no prospect of continuous...
TRANSCRIPT

TRANSFORM YOUR BUSINESS

1: The Problem with Information Technology
CURRENT STATEBLINDNESS
POORPRIORITISATION
PROJECTDISASTER
DECISIONPARALYSIS
? !
Information Technology (IT) presents organisations with a growing challenge. Expectations for digitisation have never been higher but the rate of IT project failure is climbing alarmingly.
In December 2015, the McKinsey Global Institute published a report on the state of Information Technology in the US: “Digital America: A Tale of the Haves and Have-Mores” ¹. This report compares the competitiveness of those organisations that merely have IT versus those that have transformed their business using IT (the “have-mores”). Only 16% of organisations have taken this transformational step; if all organisations transformed, the net gain to annual US GDP would be $2.2 trillion.
The McKinsey report identifies that only a small proportion of organisations are realising the potential economic benefit of digitisation. In reality, the impact of doing IT badly has a profound and negative impact on organisations, including future failure in markets they are currently leaders in as a result of the inability to meet consumer expectations. Having previously been strategic consultants, the LINQ founders had observed four particular symptoms that caused particular damage.
One of the major barriers to transformation is the communication gap that exists between IT experts and non-technical executives.
Few organisations maintain an understanding of the current state of their information ecosystem and even if they do, it is an IT-centric view. The result : No prospect of continuous improvement. The immediate consequence : Damaging realities hidden from Board and Executive view. The long-term effect : Ever-increasing competitive threat as the technology gap widens.
This is experienced:
As Chief Executives struggle to execute transformational strategies.
When Boards are unable to assess or mitigate technology-related risk.
When Chief Financial Officers are unable to contribute to technology investment cases.
In each case, the corporate leadership are forced into a position of being reluctant followers of IT change rather than the drivers of business transformation. They are led by proponents of the complex, systems view of IT.

CURRENT STATEBLINDNESS
POORPRIORITISATION
PROJECTDISASTER
DECISIONPARALYSIS
? !
CURRENT STATEBLINDNESS
POORPRIORITISATION
PROJECTDISASTER
DECISIONPARALYSIS
? !
CURRENT STATEBLINDNESS
POORPRIORITISATION
PROJECTDISASTER
DECISIONPARALYSIS
? !
A non-technical executive has to make a go / no-go decision about a technology project. The language used to describe the decision parameters is highly technical and therefore impenetrable. The decision is deferred, often with a request for more analysis. The result : An expensive delay.
The immediate consequence : Frustration on all sides. The long-term effect : Endless and expensive analysis with no results.
There are always more IT projects than money. For non-technical executives, prioritisation is all too often based on presentation eloquence than factual analysis.
The result : Subjective decisions.
The immediate consequence : Spending on technology, not business.
The long-term effect : Inability to transform the business.
One of the consequences of the endless analysis from the first symptom is that projects are forced to be big to justify the endless analysis. Big projects are risky. The majority of the risks are highly technical in nature and extremely challenging for non-technical executives to control.
The result : Project disaster.
The immediate consequences : Wasted time and money. Lost opportunity.
The long-term effect : Change aversion and more decision paralysis.
These symptoms all have a common cause: the communication gap between IT experts and non-technical executives. Even an executive who attempts to stay current is faced with constantly changing technical descriptions with perplexing depth.
¹ http://www.mckinsey.com/industries/high-tech/our-insights/digital- america-a-tale-of-the-haves-and-have-mores

The traditional way of overcoming this challenge has been to focus on business outcomes. Although this does indeed allow non-technical executives to impose business realities on technology projects, it invariably results in non-transformational outcomes because the tendency is to automate or iterate existing approaches rather than envisaging entirely new ways of doing business.
Even when transformational outcomes are the focus, at some point, technology realities need to be communicated. The existing languages of Business Process Modelling, Enterprise Architecture and Data Modelling have become increasingly technical in nature and increase the communication gap rather than bridging it.
These challenges resonate with organisations of all kinds and there is genuine excitement from Early Adopters as they use LINQ to improve the communication between IT experts and non-technical executives. The non-technical executives recognise that they can then lead transformation change rather than being the reluctant followers of technology-driven change; the IT experts see a way of alleviating their frustration about the unrealised potential of IT.
LINQ bridges the communication gap between the IT experts and the non-technical executives. This is done by describing an information ecosystem in terms of the Information Supply Chains (ISCs) which connect sources of information to decision support outputs. It transpires that both IT experts and non-technical executives have an intuitive appreciation of the nature of these information flows and how to improve inefficiencies and mitigate risk.
2: LINQ - Seeing Information in a New Way
In LINQ, systems and people are shown as enablers of these information flows which removes both complexity and emotion from change discussions. A non-technical executive can lead improvement initiatives by asking IT experts to describe their technical proposals in terms of improved information flows.
LINQ provides organisations with a persistent and authoritative view of the current state of their information ecosystem that is readily understood by Boards and non-technical executives. This is significant for the same reasons that transparency of manufacturing processes led to the revolution of the Toyota Production System; transparency leads to transformational enablement from executive to knowledge worker.
What has proven interesting is just how quickly audiences grasp the implications of LINQ: Boards can understand and mitigate risks; Executives understand and can act upon transformational opportunities.
Technical experts are also enthusiastic about LINQ. Far from threatening their expertise, Enterprise Architects and other senior technical roles are embracing LINQ as a ‘Babel Fish’ that allows them to communicate more effectively to non-technical executives and ensure that the resulting work puts technology to work on behalf of the business.

2.1: The Business Benefits of LINQ
2.1.1: Board of Directors
Summarising the Value PropositionPersistent and Authoritative Current State :The current state of the Information ecosystem is immediately visible. Problems and opportunities for improvement can be acted upon immediately
Decision Enablement : Non-technical decision makers are presented with options with objective risk and opportunity measures. Decisions can be made quickly and in the best interests of the business.
Objective Prioritisation : The value and cost benefit of improvements are immediately visible. Beyond that, it becomes possible to see the transformation opportunity of IT, even for non-technical executives
Project Control :A consequence of all of the above is that projects become smaller, more clearly defined and understood by the governance entities. Project scope is easily managed and decisions based on objective evidence. Project success rates increase.
What does this Value Proposition mean in financial terms? As discussed above, the McKinsey report identifies opportunities of $2.2 trillion per year in the US alone by becoming a digital ‘have more’.
?!
LINQ enables Board members to identify, measure and mitigate the risks that are present in their information ecosystems. They are also better able to judge the objective merits of investment cases to make the necessary improvements. Perhaps most significantly, LINQ allows Board members to understand the transformational potential of digital investment.
A key advantage of LINQ is the improved communication of IT initiatives between the Executive and the Board. The opportunities to improve shareholder value through digital transformation and the competitive risks of not investing can be discussed against the objective backdrop of LINQ.

LINQ enables executive teams to have a new framework for exerting leadership over digital initiatives
Continuous Improvement : LINQ provides a constant visibility into the organisation’s information ecosystem. This is an essential precursor to initiating a continuous improvement strategy for digitisation. Objective basis for IT Decision Making :LINQ provides executives with a non-technical framework which maintains a constant visibility of cost and value across the information ecosystem. Any changes can be objectively measured in terms of business value set against cost savings.
Objective Prioritisation of IT Spend :Any proposed changes can be readily prioritised since LINQ makes the value / cost / improvement transparent to all. The prioritisation is based on an objective measure, ensuring that discussions can be grounded in reality and focused on business outcomes.
Better, Smarter IT Projects :The use of LINQ tends to encourage smaller IT projects because the benefits of small units of change become much easier to define and understand.
Each of these business benefits is significant in its own right. Together they represent significant enablers for digital transformation. In this respect, LINQ is to Enterprise IT today as the Toyota Production System was to manufacturing in the 1980s and Critical Path Programming was to project management in the 1960s.
2.1.2: Executives
2.1.3: IT Experts
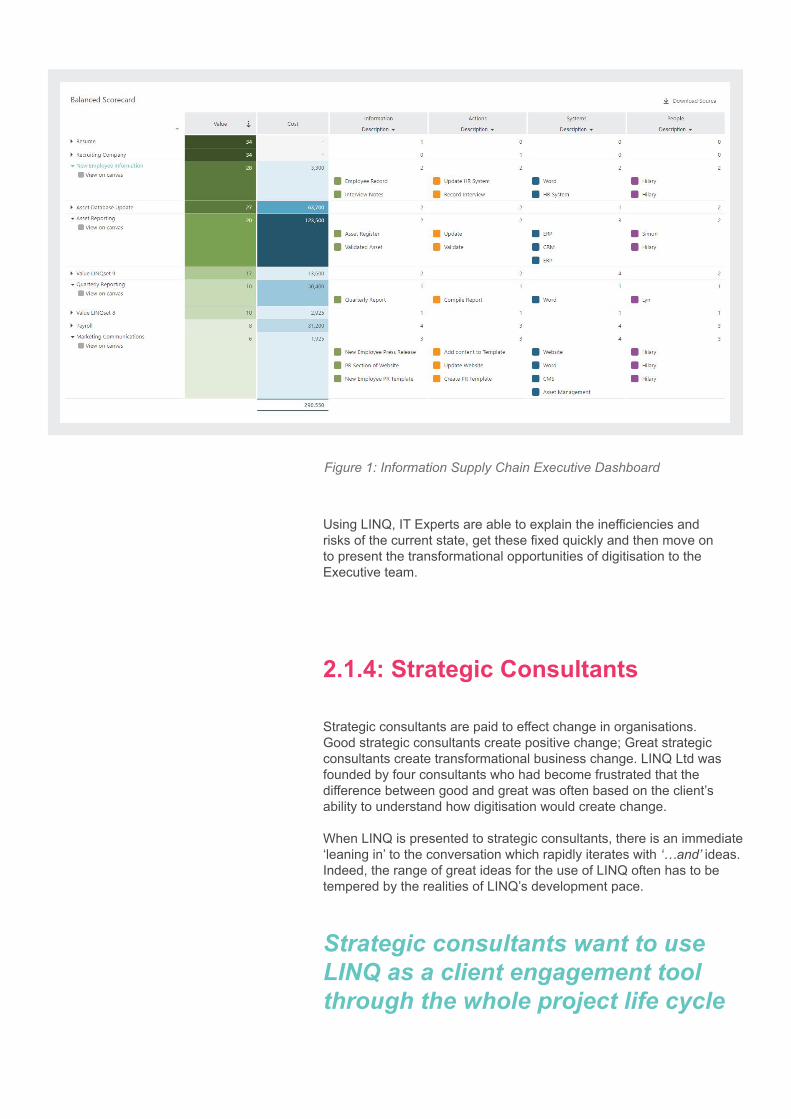
It is in an IT Expert’s interest to have non-technical executives better understand their work; it enables a correct prioritisation of spending on IT. LINQ enables this by presenting dashboards which allow an IT expert to present value-based needs. In Figure 12 below, LINQ provides a ‘balanced scorecard’ dashboard which in this case is being used to explain resilience issues in a way that is accessible to non-technical executives.
2.1.2: Executives
2.1.4: Strategic Consultants
Using LINQ, IT Experts are able to explain the inefficiencies and risks of the current state, get these fixed quickly and then move on to present the transformational opportunities of digitisation to the Executive team.
Figure 1: Information Supply Chain Executive Dashboard
Strategic consultants are paid to effect change in organisations. Good strategic consultants create positive change; Great strategic consultants create transformational business change. LINQ Ltd was founded by four consultants who had become frustrated that the difference between good and great was often based on the client’s ability to understand how digitisation would create change.
When LINQ is presented to strategic consultants, there is an immediate ‘leaning in’ to the conversation which rapidly iterates with ‘…and’ ideas. Indeed, the range of great ideas for the use of LINQ often has to be tempered by the realities of LINQ’s development pace.
Strategic consultants want to use LINQ as a client engagement tool through the whole project life cycle

Business Development : Using LINQ to differentiate their practice to prospective clients
Procurement :Using LINQ to add value to client proposals
Scoping :Using LINQ to scope the extent of the project
Current State Analysis : Using LINQ to capture the client’s current state
Future State Analysis :Using LINQ to show a client how change will benefit the business
Implementation : Using LINQ as a project control mechanism
Post-project :Using LINQ to retain a relationship with the client
This creates value for the practice which is realised at the individual consultant level through improved client engagement. Strategic consultants make up the majority of LINQ’s Early Adopters.
LINQ is based on a very simple concept that can be used to model any scale of information ecosystem from global to small organisation. The model comprises four node types:
3: How LINQ Works
3.1: The LINQ Model
InformationAction (processes)SystemsPeople
An Information Supply Chain (ISC) is based on the notion that an Action creates Information which Supports an Action… Information… Action and so on. Systems and People nodes are added to show how they support the Actions and Information. This is shown in Figure 4.

3.1: The LINQ Model
3.1.1: Removing Complexity and Emotion
Creates Supports
Used By
Creates Supports
System People
This simple model can be used to quickly and successfully describe even the most complex Enterprise IT environment.
Figure 2: LINQ Model
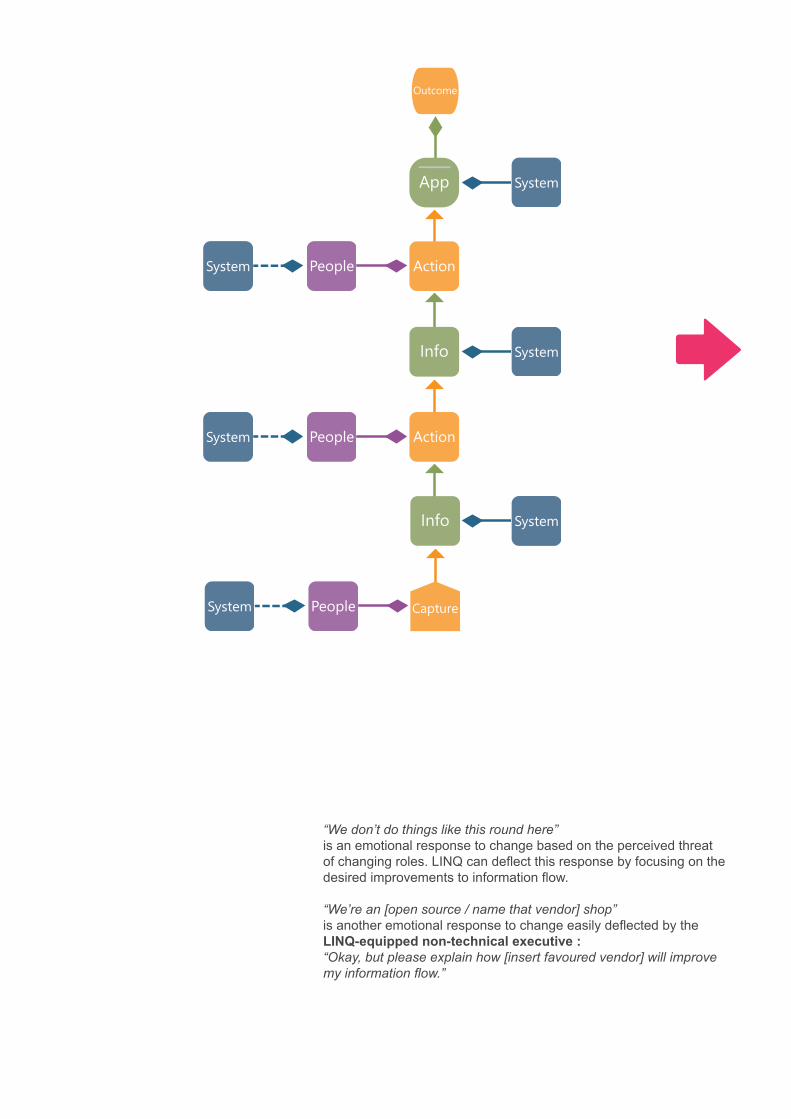
A major barrier to communication is the technical complexity coupled with emotional responses to change. LINQ eliminates this barrier by showing how information flows from a
Capture Action – Source – Action – Information – Action – Output – Business Outcome
as shown in Figure 3 below. Non-technical executives appreciate the concept of an information supply chain because it clearly focuses on information flow as a basis for improvement.
Systems are abstracted away as an enabler of the information flow; the value of people is clear as another enabler of information flow. This approach removes the complexity of a system-centric view and defuses the emotion that often accompanies change.
Outcome
Capture
Info
Info
Action
Info
Action
App
App
System People
System People
System
System
System
System
People
OUTPUT
SOURCE
The Information Supply Chain
Emotion Complexity
Focus for Improvement
SystemsSupporting the
Information Supply Chain
SystemsSupporting the
Information Supply Chain
PeopleSupporting the
Information Supply Chain
“We don’t do things like this round here” is an emotional response to change based on the perceived threat of changing roles. LINQ can deflect this response by focusing on the desired improvements to information flow.
“We’re an [open source / name that vendor] shop” is another emotional response to change easily deflected by the LINQ-equipped non-technical executive :“Okay, but please explain how [insert favoured vendor] will improve my information flow.”

Figure 3: Removing Complexity and Emotion
Outcome
Capture
Info
Info
Action
Info
Action
App
App
System People
System People
System
System
System
System
People
OUTPUT
SOURCE
The Information Supply Chain
Emotion Complexity
Focus for Improvement
SystemsSupporting the
Information Supply Chain
SystemsSupporting the
Information Supply Chain
PeopleSupporting the
Information Supply Chain
3.1.2: Simplicity from Complexity
Figure 4 below depicts a typical Information Supply Chain (ISC). This incorporates three information sources at the bottom with a single decision-support application (output) at top. The ISC is a typical triangular system with many sources at the base supporting a single output at the apex.

Figure 4: Information Supply Chain for a Single Decision Support Application
By focusing on the flow of information several insights are immediately obvious. People and systems involved in the ISC can be identified along with the actions they are performing and the information they are using and where it comes from.
Decision Support Application
Information Source(s)

Figure 5: Overlapping Information Supply Chains
In the example in Figure 5 above, the highlighted nodes support both outputs – so any improvements in this area will realise benefits in both outputs. Logically, this area has enhanced value.
Information Source(s)

Figure 6: Cascading Values
3.1.3: Determining value
LINQ allows the sophisticated modelling of the value created through the reuse of information (and Actions, People and Systems).The start of this process is for the LINQ user to assign a value to each information output – the point in an ISC where business value is supported. The value scale ranges from 0 (no value) to 10 (high value). Although this may seem arbitrary, it provides a consistent measure of value across the organisation and beyond.
LINQ cascades this value ‘upstream’ against the information flow direction and then sums the values where reuse occurs. This can be seen in Figure 6 below where the overlap area is scored at a combined 15 (5 + 10). LINQ groups all nodes of like pedigree so all nodes within the overlap area have this value of 15.
The Routing Application has been given a value of 5
The area of overlap as an aggregated vale of 15
The Siting Application has been given a value of 10

Figure 7: Where are your most valuable Information Supply Chains?
This model of valuing reuse within an Information Supply Chain can be scaled to any size of organisation. In Figure 7 above, four overlapping Information Supply Chains are supplying information outputs in the top row of the diagram. These have been ‘valued’ using the method described earlier with values ranging from: 2 at the left to 10 at the right.
These values cascade down through the Information Supply Chains, aggregating in the overlap areas; the overlap areas representing collapsed LINQsets which might contain several Action, Information, System and People nodes. In this example, one overlap area stands out with high values of 24. This value is calculated based on the reuse across all four Information Supply Chains.
75
2 107 17
2 10
12 247 17
3.1.4: Determining cost
Over 80% of the costs in a typical Information Ecosystem are incurred as People perform Actions. LINQ records the frequency and duration of Actions and the hourly cost of the person performing the Action and calculates an annual expenditure by multiplying these variables.

In this example, Simon’s cost is $150 an hour. He performs an action which takes 2 hours and occurs 220 times a year. Therefore LINQ calculates the annual cost as $150 x 2 x 220 = $66,000. These individual Person – Action costs are aggregated up to the Value overlap level. This then offers insights into areas of operational expenditure (OPEX) for each Action within the overlap areas. This is represented in Figure 9 below. This allows a fast and intuitive understanding of Value / Cost balance.
In this example, the user is drawn to two areas of high cost. The $2.3M cost is associated with the high value area and so may be acceptable; the $3.0M cost is associated with a low value area suggesting that scrutiny may be required to better understand this anomaly.
Figure 9 : Value versus OPEX spend
Customers report that previously they relied on anecdotal evidence or intuition in such areas. LINQ provides the empirical evidence many IT Change Leaders have always desired but struggled to articulate. When it comes to moderating the budget across the organisation, this level of insight becomes instrumental in making the right decisions.
Figure 8 : Cost Calculation in LINQ
LOW VALUE
HIGH VALUE
$3.0M $0.1M $2.3M $0.7M
$2.6M$0.1M $0.5M$0.9M
$0.1M$0.7M $1.5M $0.3M

Figure 10 : Resilience Considerations
LINQ introduces a new methodology for seeing enterprise IT in a new way. One of the key lessons from LINQ Early Adopters is that it can be challenging to ‘think like LINQ’ when building ISC diagrams, especially when users are familiar with other approaches such as Business Process Modelling or Data Flow Diagramming.
3.2: How to Think Like LINQ
LINQ’s focus is on how Information gets transformed from the Capture of an Information Source to an Information Output’s delivery of business value. LINQ helps retain this focus by allowing a fast association of Sources to Outputs. This allows a user to quickly understand the concept of Information Supply Chains.
Figure 10 shows how LINQ’s value/cost model can be used to gain other insights about Information Supply Chains. In this case, flags have been assigned to identify resilience levels across the various areas.
The red flags are identifying where there are resilience concerns. By being able to immediately correlate resilience with value, the user can understand the business impact of the risk.
LINQ automatically creates these areas of like value and then provides an easy measure of costs, resilience and other measures of information flow efficiency and effectiveness. These measures can be compared side by side in order to gain real insight into where the business value lies, driving efficient prioritisation of IT in support of business outcomes.
LOW RESILIENCE
HIGH RESILIENCE
$3.0M $0.1M $2.3M $0.7M
$2.6M$0.1M $0.5M$0.9M
$0.1M$0.7M $1.5M $0.3M

System Action
System People Action
System People Action
ME (1)
From the ‘Me’ Perspective:
1. What Action did I do?2. What Information did I create?3. What Information did I need to perform the Action?4. What System did I need to perform that Action?
From the ‘Information’ Perspective:
1. What Action created this Information?2. Who created this Information?3. What Information inputs did they need to create this Information?4. What System did they need to perform this Information?
From the ‘Action’ Perspective:
1. What Information did the Action create?2. What Information did the Action require?3. Who performed the Action?4. What System was needed to perform this Action?
(1)
(1)
(3)
(3)
(2)
(2)
(2)
(4)
(4)
(3)(4)
The biggest challenge emerges as Information Supply Chains are being densified. Business Analysts who are trained on Business Process Modelling tend to think in terms of chains of Actions rather than the flow of Information.
To ‘think like LINQ’, it is useful to ask these questions:
Figure 11 : Thinking Like LINQ as a Data Modeller
There’s a similar challenge for LINQ users who have a background in data modelling. They tend to think in terms of individual tables and records, rather than in terms of the flow of information along an Information Supply Chain.
To ‘think like LINQ’, it is useful to ask these questions:
Figure 10 : Thinking Like LINQ as Business Analyst
System Action
System People Action
System People Action
ME (1)
From the ‘Me’ Perspective:
1. What Action did I do?2. What Information did I create?3. What Information did I need to perform the Action?4. What System did I need to perform that Action?
From the ‘Information’ Perspective:
1. What Action created this Information?2. Who created this Information?3. What Information inputs did they need to create this Information?4. What System did they need to perform this Information?
From the ‘Action’ Perspective:
1. What Information did the Action create?2. What Information did the Action require?3. Who performed the Action?4. What System was needed to perform this Action?
(1)
(1)
(3)
(3)
(2)
(2)
(2)
(4)
(4)
(3)(4)

Figure 12 : LINQ Gallery
LINQ also assists users to ‘think like LINQ’ by providing a range of starter templates in the LINQ Gallery. These provide typical Information Supply Chains for a variety of scenarios which can be easily adapted to a specific situation.
Each template is accompanied by a video which explains the thinking behind the Information Supply Chain and thoughts about how it can be adapted to a specific user’s situation.
Over time, it is planned that the LINQ Gallery will become a framework for sharing best practice Information Supply Chains.
Insights emerge as soon as Information Supply Chains are captured. Value and Cost are quickly and easily captured; the alignment of cost and value become clear. Inefficiencies are seen clearly and improvements are obvious. These core insights start the communication process as soon as ISC capture commences.
4: LINQ - Insights that Solve Problems

Examples of these core insights include:
Dashboard :The core subscriptions will include level of detail tools that will automatically generalise to the appropriate level of detail. The dashboard extension will provide users with customisable dashboards to display and monitor the efficiency and effectiveness of their spatial infrastructures.
Libraries of Best Practice Information Supply Chains :There are already a number of authoritative supply chains which represent different vendor capabilities in a neutral way. These are extremely valuable in sketching out efficient ‘future state’ diagrams.
Connections to Partner Systems :LINQ has the potential to connect to Enterprise Architect, Spatial Search, Workflow, and Geoprocessing systems. These connections will be offered as separate extensions.
Efficiency Indices : Although it is very easy to see inefficiencies in LINQ diagrams, considerable additional value can be added by calculating efficiency indices that will allow organisations to compare the efficiency of their ISCs against global averages.
Enterprise Interoperability : There are significant advantages in being able to connect LINQ to other enterprise systems such as HR and IT Asset Systems.LINQ’s power is amplified through the use of a range of Solver Packs that allow richer and deeper insights to be gained. These allow a broad range of problems to be identified and then solved.
4.1: LINQ People
People play a critical role in an information ecosystem. People performing actions are a major cost factor and they can also create bottlenecks that impede the flow of information. People are impacted when change is implemented, often in ways that weren’t fully understood during planning.
It can be extremely challenging to understand the relationship between people, the systems they use, the actions they perform and the information they use and create. Using an HR System, a System Design Tool, a Business Process Modelling tool or a data flow diagram creates highly technical descriptions which fail to create a holistic picture.
LINQ People allows the role of people to be clearly understood in the current state and in proposed future states. This is done by pivoting from the standard ISC-centric view to a person-centric view.

4.1: LINQ People
In this case, by clicking on ‘Hilary’ in the LINQ canvas, this diagram is created which shows the Actions that Hilary performs (which provides insight into her real job description), the Systems that Hilary uses (which provides insight into her training needs) and the Business Outputs that Hilary supports. This can be done for the current state and for a variety of future state options.
Figure 13 : LINQ People view
LINQ People also allows insights to be gained about the utilisation of people in the context of the flow of information within the organisation. Flow theory demonstrates that bottlenecks have a profound impact on productivity. Over-utilised people are a major cause of bottlenecks. Improvement must be prioritised at the bottleneck first; any improvements before the bottleneck make the bottleneck worse; any improvements after the bottleneck are wasted.
LINQ People allows teams of people to be created in a Shared Palette which defines the people capacity. As people are dragged onto the LINQ canvas, their utilisation is recorded. Over-utilisation can then be clearly identified. Bottlenecks have the worst impact midway along an Information

4.2: Future Solver Packs
A number of Solver Packs are envisaged for the future. These include:
LINQ Optimise :LINQ can record the specific timings of Actions and then pivot the view into a timeline. This allows the Actions that contribute to peak loadings to be identified and then moved. This can offer significant savings in resources such as people, CPU utilization and concurrent licenses.
LINQ Change : Once a persistent current state is established, LINQ creates an environment where any knowledge worker can propose an Information Supply Chain improvement. This ‘innovation from anyone’ is a critical ingredient in continuous improvement since it creates a ‘social network’ within the organisation which is dedicated to improvement.
LINQ Georisk : LINQ can record location against any node. This location information can be overlaid on a map to show how geographic hazards impact on an organisation’s Information Supply Chains. For example, if a server is located in a tsunami hazard zone, LINQ will show the business outcomes that are impacted by that risk. This allows appropriate disaster resilience planning to mitigate that risk.
LINQ will help your organisation see enterprise IT in a new way. Non-technical executives will be able to effectively lead digitisation initiatives and Board members will be able to better appreciate the balance between risk and reward in IT investments. You will quickly see improvements in efficiency and effectiveness. To start your LINQ journey please visit www.linq.it and send us an e-mail to [email protected].
5: LINQ - Starting Your Journey
Supply Chain (a bottleneck near a source isn’t creating a queue; a bottleneck near an output isn’t affecting the work of other people) and so LINQ makes it easy to gauge the impact of a bottleneck:
What’s the value at the bottleneck?What’s the cost at the bottleneck?What’s the downstream value being impacted?What’s the upstream cost being blocked?What’s the benefit of improving the bottleneck?
© 2016 LINQ Ltd. LINQ is a trademark of LINQ Ltd. All other brands and product names are trademarks of their respective companies. ©2016 LINQ Ltd. LINQ is a registered trademark of LINQ Ltd in New Zealand and the United States of America. All other brands and product names are trademarks of their respective companies.
LINQ Ltd, PO Box 25602, Wellington 6012, New Zealand