transformer model for inrush current calculations
DESCRIPTION
Transformer Model for Inrush Current CalculationTRANSCRIPT
IEEE TRANSACTIONS ON POWER DELIVERY, VOL. 25, NO. 4, OCTOBER 2010 2599
Transformer Model for Inrush Current Calculations:Simulations, Measurements and Sensitivity Analysis
Nicola Chiesa, Bruce A. Mork, Senior Member, IEEE, and Hans Kristian Høidalen, Member, IEEE
Abstract—The modeling of inrush currents that occur uponenergization of a transformer is a challenge for ElectromagneticTransients Programs due to limitations in available transformermodels and the ability to determine and specify initial flux. Theestimation of transformer model parameters is also an issue. Thispaper presents a transformer model for low- and mid-frequencytransient studies with a focus on the behavior in saturation andthe estimation of residual fluxes. The comparison of the simulationresults with analytical calculations and measurements provesthe capability of the model to accurately represent energizationand de-energization transients of a three-legged-core distributiontransformer. A novel property is the ability of auto initializationafter disconnection, made possible by the implementation of ahysteretic core model which properly simulates and remembersresidual flux from the previous de-energization. Special attentionis paid to parameter estimation. Detailed core and winding designdata are not used as they are seldom available from the manu-facturer. Sensitivity analysis is performed to verify the influenceof each parameter on the inrush current envelope curve. It isobserved that the parameter that most influences the currentamplitude is the slope of the magnetization curve at extremesaturation.
Index Terms—Inrush current, nonlinearities, power systemtransients, residual flux, transformer modeling.
I. INTRODUCTION
T RANSFORMERS have the greatest exposure to electricaltransients with the exception of transmission lines [1]. The
standard models used in electromagnetic transient programs topredict their behavior are not always adequate due to a lack ofdata, measurements, and knowledge. The aim of this paper is themodeling of power transformers where inrush current during en-ergization is an issue related to relay settings, inrush mitigationby synchronized switching, voltage harmonic distortion, controlof switching overvoltages, and internal mechanical stress reduc-tion.
The shape, magnitude, and duration of the inrush current de-pends on several factors, such as network topology, transformerconstruction, winding coupling, residual fluxes, and circuitbreaker’s (CB’s) current-chopping characteristic. The highest
Manuscript received December 18, 2009; revised February 11, 2010. Currentversion published September 22, 2010. Paper no. TPWRD-00942-2009.
N. Chiesa and H. K. Høidalen are with the Department of Electric PowerEngineering, The Norwegian University of Science and Technology, Trondheim7491, Norway (e-mail: [email protected]).
B. A. Mork is with the Department of Electrical Engineering, Michigan Tech-nological University, Houghton, MI 49931 USA.
Color versions of one or more of the figures in this paper are available onlineat http://ieeexplore.ieee.org.
Digital Object Identifier 10.1109/TPWRD.2010.2045518
current peak calculated on the basis of the combination of thesefactors and occurring in the first period after the energizationof a transformer is defined as worst-case inrush current. Thiscurrent decays after several periods to reach the steady-statevalue of the magnetization current. Analytical equations existto approximately calculate worst-case inrush current and decayof single-phase transformers [2], [3].
References [4]–[7] present a comprehensive and up-to-datereview of transformer models for electromagnetic transients.Topologically correct models based on the transformer geom-etry should be preferred for transient studies as each individuallimb of the magnetic circuit contributes to the magnetizationcharacteristic. This approach can represent any type of coreso that unbalance operations are accurately reproduced, but re-quire a more detailed set of parameters than the less accuratesingle-phase equivalent transformer models. Standard availablemodels that adopt this approach are the unified magnetic equiv-alent circuit (UMEC) model in PSCAD/EMTDC [8]–[10] andthe hybrid transformer model (XFMR) implemented in ATP-Draw [11]–[14].
The models UMEC and XFMR have limitations related to theaccuracy at extreme saturation and the proper representation ofthe hysteretic behavior of the core. A large variation betweenthe two models in the prediction of an inrush transient is re-ported in [14]. In addition, neither model can retain a residualflux value after de-energization and the manual specification ofinitial residual fluxes is complex. The simulations are thereforerestricted to the case of the zero residual flux initial condition. Toovercome these weak points, the model proposed here is basedon a topologically correct hysteretic core, with special consid-eration of behavior in extreme saturation. The capability of autoinitialization after disconnection of the model overcomes thecommon problem of manually initializing the residual fluxes.Manual initialization of the residual fluxes is also possible.
Section II presents the development and the topology of theproposed transformer model. Section III shows the performanceof the model compared to measurements. Section IV outlinesstandard analytical inrush formulas and relates these to simu-lations. A sensitivity study of the most important parameters isperformed in Section V in order to establish the crucial factorsthat may influence the model performance and to enhance theirestimation procedure.
II. TRANSFORMER MODEL
This new transformer model is developed in a way somewhatequivalent to that of the hybrid model presented in [11] and[12]. The topology of a three-legged two-winding transformeris shown in Fig. 1. The magnetic paths in the iron (nonlinear
0885-8977/$26.00 © 2010 IEEE

2600 IEEE TRANSACTIONS ON POWER DELIVERY, VOL. 25, NO. 4, OCTOBER 2010
Fig. 1. Physical structure of the three-legged transformer with magnetic paths.
Fig. 2. Magnetic circuit of a three-legged transformer.
reluctances) and in air (linear reluctances) are detailed in thefigure. The magnetic circuit of Fig. 2 is then deduced accordingto the physical topology of the transformer. The nonlinear re-luctances (black rectangles) refer to the saturable transformerlimbs . The linear reluctances (white rectangles)account for the main leakage channel between the high- andlow-voltage windings , secondary leakage channels be-tween the inner winding and the core , and the zero-se-quence leakage .
The equivalent electric circuit of Fig. 3 is obtained by dualitytransformation of the magnetic circuit. Ideal transformers ac-count for the winding turns ratio and interface the dual electriccircuit with the external electric network. The winding resis-tances are connected at the transformer terminals. The couplingand phase-shift (e.g., , Y, auto) are achieved by external con-nections of the transformer terminals. The capacitance networkis shown in Fig. 4 and is connected to each end of the windingterminals.
This model is implemented in Alternate Transients Program(ATP)/EMTP and is intended to be a general-purpose modelfor electromagnetic transient studies. It can be easily extendedto five-legged core transformers by modeling the external legswith two additional nonlinear reactances. The development ofa topological multiwinding transformer model is more chal-lenging and is partially addressed in [15]. Model parametersare obtained from standard test data that are usually acquiredat the transformer factory before delivery. If available, a rela-tively small amount of low detail and easily accessible designdata can be used to accurately tune some parameters and greatlyenhance the performance of the transformer model when oper-ating in heavy saturation. The design data used in this modelare limited to the main dimensions of core (cross-sectional areaand limb length) and windings (number of turns, height, in-ternal and external diameter), and are given in Table I. Althoughadditional detailed information is relevant for models targetinghigher frequencies, detailed construction information about core
Fig. 3. Equivalent electric circuit of a three-legged transformer with ideal trans-formers and winding resistances.
Fig. 4. Transformer model: capacitances.
TABLE ICORE AND WINDINGS DESIGN DATA
and winding construction is not usually disclosed by manufac-turers.
Existing models are not capable of retaining residual fluxvalues after ringdown as they commonly use combinations ofparallel R-L sections to represent the core. A single-valued non-

CHIESA et al.: TRANSFORMER MODEL FOR INRUSH CURRENT CALCULATIONS 2601
Fig. 5. Deenergization of a 11.43/0.235-kV, 300-kVA, Yyn transformer. (a)Line current, high-voltage side. (b) Phase voltage, low-voltage side. (c) Flux-linkage, low-voltage side.
linear L fails to reach any residual flux value since no energycan be stored in the core [16]. A more sophisticated core modelis therefore required to predict a deenergization transient. Thisis a natural LC response that appears as the stored magneticand electrostatic energy dissipate when a transformer is de-en-ergized [16], [17]. At the end of a de-energization transient,voltage and current decrease to zero. However, the flux in thecore retains a value defined as residual flux. In the proposedmodel, each section of the core is modeled separately to cor-rectly represent the core topology of the transformer. Each ofthe three main legs and the two outer yokes is modeled witha Jiles–Atherton hysteretic model [18]–[20], capable of pre-dicting the residual fluxes in the core.
In addition to hysteresis, the representation of saturation andair-core inductance is included in the Jiles–Atherton hystereticmodel which is depicted in Fig. 3 as an inductor with a super-imposed hysteresis loop. Eddy current and excessive losses in
the core can also be taken into account by this model [19]. TheJiles–Atherton theory was originally developed as a function ofthe magnetic quantities and has been converted here tobe directly used with electromagnetic quantities [20]. Theimplementation of the Jiles–Atherton model has not been de-tailed in this study and the focus is only on the estimation of themodel parameter that defines the incremental inductancein complete saturation.
A detailed leakage model is required if energization inrushcurrent transients need to be represented. When the magneticcore is highly saturated, the final slope of the core inductanceis determined by the leakage and air-core paths. The ability tomeasure or estimate this parameter limits the detail level of themodel. The magnetic paths in the core and air shown in Fig. 1give the most advantageous discretization level. A higher degreeof discretization of the model would require input data beyondthe short-circuit nameplate data and the main winding and coredimensions. A lower degree of discretization cannot guaranteegood accuracy of the model.
III. VALIDATION OF THE MODEL
A 300-kVA 11.43-0.235-kV Yyn three-legged core trans-former is used as a test object and is energized from the 11-kVside by a vacuum CB. The laboratory setup and test proce-dure are further detailed in [21]. The approach used in thehybrid model for the parameter estimation [11], [14] servesas a starting point, and the numerical values of the parametersused for the verification of the model with measurements arereported in Table II.
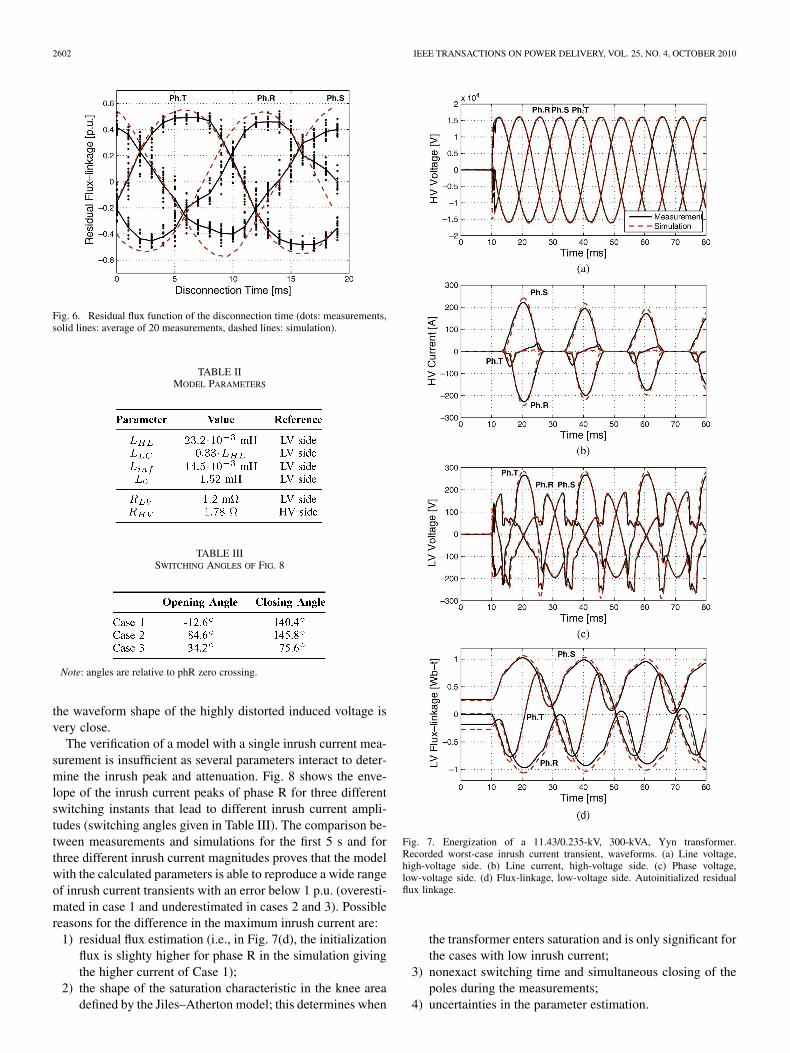
When the model is deenergized from steady state by openingthe CB, the ringdown transient is initiated and the proper level ofresidual flux for each limb is established by the Jiles–Athertonhysteretic core model. Fig. 5 shows the comparison of the mea-sured and simulated waveforms of a deenergization transient ofline current, induced voltage, and flux linkage. The high-fre-quency oscillation at the disconnection instant cannot be accu-rately reproduced in the simulation; however, the main purposehere is to predict the steady-state value of residual fluxes. Fig. 6shows simulated and measured residual fluxes as a function ofthe opening instant of the CB. Considering the large statisticalvariation of the measurements, the model well approximates thetrend of the residual flux values and their correlation in the threephases.
Fig. 7 compares measurements with ATP/EMTP simulationsfor the first few periods of an inrush transient. The appliedvoltage on the HV terminals is shown in Fig. 7(a), the inrushcurrent waveforms measured on the HV terminals are shownin Fig. 7(b), the induced voltage on the LV terminals is shownin Fig. 7(c), and the flux linkage obtained by integration ofthe induced voltage is shown in Fig. 7(d). The residual fluxesof the model are autoinitialized by a deenergization transientsimulation, and the measured residual fluxes are obtained fromthe recording of the transformer’s deenergization preceding theinvestigated energization. For the case shown, the model is ableto reach the inrush current first peak with a 7% difference, and
2602 IEEE TRANSACTIONS ON POWER DELIVERY, VOL. 25, NO. 4, OCTOBER 2010
Fig. 6. Residual flux function of the disconnection time (dots: measurements,solid lines: average of 20 measurements, dashed lines: simulation).
TABLE IIMODEL PARAMETERS
TABLE IIISWITCHING ANGLES OF FIG. 8
Note: angles are relative to phR zero crossing.
the waveform shape of the highly distorted induced voltage isvery close.
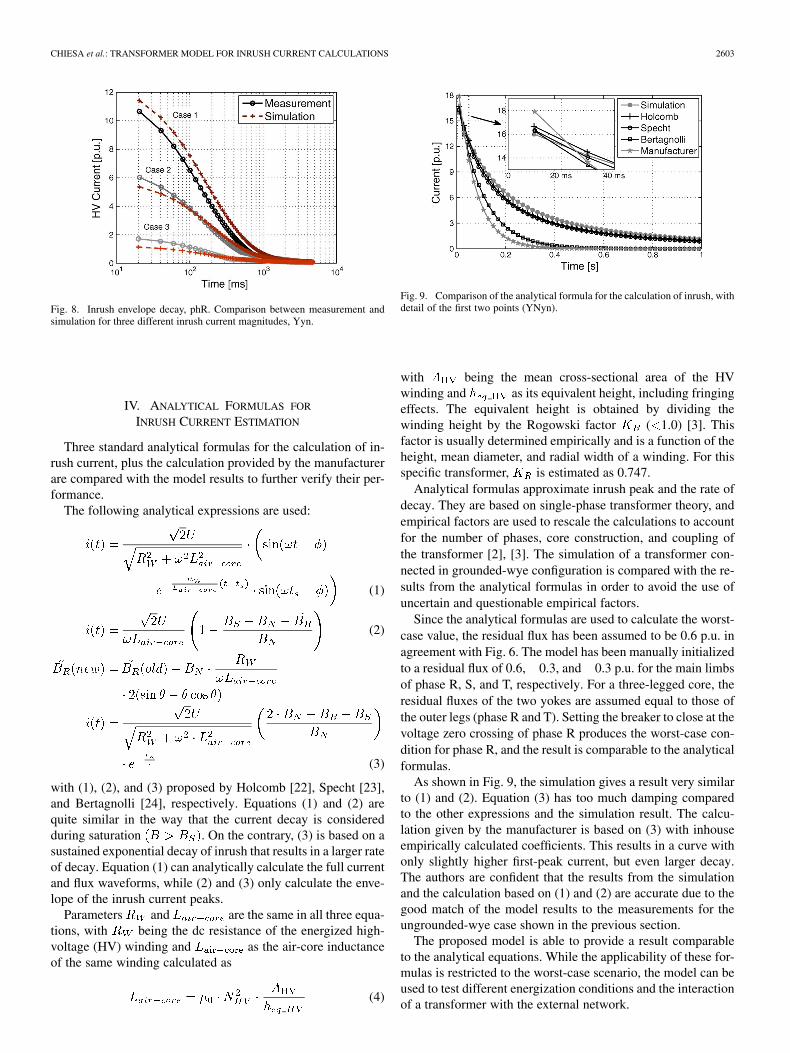
The verification of a model with a single inrush current mea-surement is insufficient as several parameters interact to deter-mine the inrush peak and attenuation. Fig. 8 shows the enve-lope of the inrush current peaks of phase R for three differentswitching instants that lead to different inrush current ampli-tudes (switching angles given in Table III). The comparison be-tween measurements and simulations for the first 5 s and forthree different inrush current magnitudes proves that the modelwith the calculated parameters is able to reproduce a wide rangeof inrush current transients with an error below 1 p.u. (overesti-mated in case 1 and underestimated in cases 2 and 3). Possiblereasons for the difference in the maximum inrush current are:
1) residual flux estimation (i.e., in Fig. 7(d), the initializationflux is slighty higher for phase R in the simulation givingthe higher current of Case 1);
2) the shape of the saturation characteristic in the knee areadefined by the Jiles–Atherton model; this determines when
Fig. 7. Energization of a 11.43/0.235-kV, 300-kVA, Yyn transformer.Recorded worst-case inrush current transient, waveforms. (a) Line voltage,high-voltage side. (b) Line current, high-voltage side. (c) Phase voltage,low-voltage side. (d) Flux-linkage, low-voltage side. Autoinitialized residualflux linkage.
the transformer enters saturation and is only significant forthe cases with low inrush current;
3) nonexact switching time and simultaneous closing of thepoles during the measurements;
4) uncertainties in the parameter estimation.
CHIESA et al.: TRANSFORMER MODEL FOR INRUSH CURRENT CALCULATIONS 2603
Fig. 8. Inrush envelope decay, phR. Comparison between measurement andsimulation for three different inrush current magnitudes, Yyn.
IV. ANALYTICAL FORMULAS FOR
INRUSH CURRENT ESTIMATION
Three standard analytical formulas for the calculation of in-rush current, plus the calculation provided by the manufacturerare compared with the model results to further verify their per-formance.
The following analytical expressions are used:
(1)
(2)
(3)
with (1), (2), and (3) proposed by Holcomb [22], Specht [23],and Bertagnolli [24], respectively. Equations (1) and (2) arequite similar in the way that the current decay is consideredduring saturation . On the contrary, (3) is based on asustained exponential decay of inrush that results in a larger rateof decay. Equation (1) can analytically calculate the full currentand flux waveforms, while (2) and (3) only calculate the enve-lope of the inrush current peaks.
Parameters and are the same in all three equa-tions, with being the dc resistance of the energized high-voltage (HV) winding and as the air-core inductanceof the same winding calculated as
(4)
Fig. 9. Comparison of the analytical formula for the calculation of inrush, withdetail of the first two points (YNyn).
with being the mean cross-sectional area of the HVwinding and as its equivalent height, including fringingeffects. The equivalent height is obtained by dividing thewinding height by the Rogowski factor ( 1.0) [3]. Thisfactor is usually determined empirically and is a function of theheight, mean diameter, and radial width of a winding. For thisspecific transformer, is estimated as 0.747.
Analytical formulas approximate inrush peak and the rate ofdecay. They are based on single-phase transformer theory, andempirical factors are used to rescale the calculations to accountfor the number of phases, core construction, and coupling ofthe transformer [2], [3]. The simulation of a transformer con-nected in grounded-wye configuration is compared with the re-sults from the analytical formulas in order to avoid the use ofuncertain and questionable empirical factors.
Since the analytical formulas are used to calculate the worst-case value, the residual flux has been assumed to be 0.6 p.u. inagreement with Fig. 6. The model has been manually initializedto a residual flux of 0.6, 0.3, and 0.3 p.u. for the main limbsof phase R, S, and T, respectively. For a three-legged core, theresidual fluxes of the two yokes are assumed equal to those ofthe outer legs (phase R and T). Setting the breaker to close at thevoltage zero crossing of phase R produces the worst-case con-dition for phase R, and the result is comparable to the analyticalformulas.
As shown in Fig. 9, the simulation gives a result very similarto (1) and (2). Equation (3) has too much damping comparedto the other expressions and the simulation result. The calcu-lation given by the manufacturer is based on (3) with inhouseempirically calculated coefficients. This results in a curve withonly slightly higher first-peak current, but even larger decay.The authors are confident that the results from the simulationand the calculation based on (1) and (2) are accurate due to thegood match of the model results to the measurements for theungrounded-wye case shown in the previous section.
The proposed model is able to provide a result comparableto the analytical equations. While the applicability of these for-mulas is restricted to the worst-case scenario, the model can beused to test different energization conditions and the interactionof a transformer with the external network.

2604 IEEE TRANSACTIONS ON POWER DELIVERY, VOL. 25, NO. 4, OCTOBER 2010
V. PARAMETER ESTIMATION AND SENSITIVITY ANALYSIS
The estimation of the parameters of the model is discussedin this section with the exception of the hysteretic core model.The Jiles-Atherton model is presented in [18] and [19] and itsimplementation and parameter estimation are discussed in [20].
In parallel to the guidelines for the parameter estimation, asensitivity analysis is performed to verify the influence of eachparameter on the inrush current peak and decay. The most sig-nificant parameters are identified and the methods for estimatingthem are outlined. Figs. 6–8 show that the set of parameters inTable II reproduces the de-energization and energization tran-sients well and, therefore, it is used as the reference point. Thesensitivity analysis is performed for YNyn and Yyn connectionsand the envelope curves of the first 200 ms of the inrush of phaseR are reported. The transformer is initialized to a residual fluxof 0.6, 0.3, 0.3 p.u. for the three phases, respectively, and thebreaker closes at the voltage zero crossing of phase R to simu-late the worst-case condition.
A. Leakage Inductances and
The leakage inductance between the high- and low-voltagewinding is obtained directly from the short-circuit testmeasurement. The leakage inductance between the low-voltagewinding and core cannot be directly measured but is as-sumed to be
(5)
Short-circuit reactances can be calculated from winding dimen-sions with standard equations reported in [3, Ch. 3.1]. Assuminga winding of zero thickness on the core surface, the reactance be-tween the low-voltage winding and core can be estimated fromthe core and winding geometry
(6)
(7)
(8)
with being the area of the Ampere-Turn Diagram, asthe mean diameter, is the radial width of a winding, andrepresents the thickness of the air gap between two windings [3].An initial estimation of 0.5 is proposed in [14] assumingthat:
1) the insulation clearance between core and low-voltagewinding is approximately equal to half the distancebetween low- and high-voltage windings ;
2) the cross-sectional dimensions of low- and high-voltagewindings are similar ( and );
3) the mean winding diameter can be approximated to.
The value calculated with actual winding dimensions is used inthe model and is
(9)
Fig. 10. Parameter sensitivity: � .
Fig. 11. Parameter sensitivity: � .
Fig. 10 shows a mean variation of 12% in the inrush first peakfor a variation of 20% of . According to (5), a variation of
implies a change in as well.Fig. 11 shows the influence of the parameter in the estima-
tion of . A smaller value results in a lower voltage dropon the low voltage to core reactance; thus, there is a higher in-rush current peak.
B. Air-Core Inductance
Air-core theory is based on the concept that once the mag-netic core is fully saturated, it behaves like air with permeability
. The analytical formulas (1)–(3) are based on this conceptand denote “air-core inductance” as the inductance of a windingwithout a magnetic core. Neglecting the effect of the yokes asthe first approximation, the quantity in the transformer modelequivalent to the air-core inductance defined in (4) is the incre-mental inductance at high saturation given by
(10)
where is the slope of the magnetization curve at completesaturation defined by in the Jiles–Atherton model, whichcannot be directly measured, but can be calculated from designdata as
(11)
Reference [25] discusses the importance of the air-core induc-tance and proposes analytical formulas for its calculation; how-ever, these require detailed knowledge of the core and windingstructure.

CHIESA et al.: TRANSFORMER MODEL FOR INRUSH CURRENT CALCULATIONS 2605
Fig. 12. Parameter sensitivity: � . (a) Ungrounded-wye. (b) Grounded-wye.
Numerically, (4) and (10) agree within 5% of the calculatedparameters
mH (12)
mH from (13)
with numerical values of (12) from Table II and rescaled to theHV-side voltage reference for comparison with (4).
accounts for one-third of the total air-core inductance(10), but peak inrush current is highly sensitive to variationsin as seen from Fig. 12. A variation of 20% ofgives a mean variation in the inrush first peak of 45% forungrounded-wye and 26% for grounded-wye.
C. Zero-Sequence Inductance
The flux in the three legs may not sum up to zero during un-balanced operations, generating a zero-sequence flux. Referringto Fig. 1, this flux flows in the zero-sequence paths of the trans-former, for instance, from one leg through the oil and the tankwall and back to the core. Three zero-sequence paths can there-fore be identified, one around each leg of a three-legged trans-former. Although the zero-sequence path includes the tank (nor-mally made of magnetic material), it can be safely assumed thatzero-sequence inductances are linear due to the dominant effectof the oil gap between the core and the tank. The value of thezero-sequence inductances is best found from a zero-sequence
Fig. 13. Parameter sensitivity: � .
test where the three phases of a transformer are energized in par-allel. The total current is measured and the total zero-sequenceinductance is equally split on each of the three phases
(14)
(15)
The variation of the zero-sequence inductance within 20%has no effect on inrush current transients.
D. Winding Resistances and
The winding resistances are concentrated at the terminals ofeach winding. It is common to estimate the winding resistancebased only on a short-circuit measurement and then equally splitthe value on a per-unit basis between high- and low-voltage (LV)resistances.
To achieve higher accuracy, the values here are allocatedbased on dc winding resistance measurements [26]
(16)
(17)
where is the resistance expressed in per unit. The splittingof the ac resistance based on dc resistance measurements usu-ally results in on a per-unit basis. When thetransformer is energized from the HV side (normal situation forpower and distribution transformer), the voltage drop caused bythe winding resistance is smaller than for an equal split, resultingin lower inrush current damping.
Fig. 13 shows how a variation of winding resistance has aminor effect on the inrush-current first peak, while the currentdamping is substantially affected. The inrush-current half valueis reached approximately one period earlier and two periodslater if the high-voltage winding resistance is increased and de-creased by 20%, respectively. Fig. 14 compares the resultinginrush current damping when the winding resistances are splitbased on the per unit and dc resistance methods.

2606 IEEE TRANSACTIONS ON POWER DELIVERY, VOL. 25, NO. 4, OCTOBER 2010
Fig. 14. Parameter sensitivity: � and � splitting.
Fig. 15. Parameter sensitivity: core connection.
E. Core Connection
In order to simplify the model representation, the hybridmodel [11], [14] assumes that the leakage inductances are muchsmaller than the core inductances. This allows concentratingthe core and leakage networks in two distinct and separatemodules. This assumption is correct under normal conditions,but becomes doubtful at high saturation where the incrementalcore inductance approaches the air-core inductance.
The validity of this approximation has been tested on the pro-posed model by connecting the right section of the core model(yoke and zero-sequence representation) in parallel with the legrepresentation. As shown in Fig. 15, the topologically correctcore results in a slightly higher value of inrush current. The ap-proximation in the topology of the hybrid model introduces arelatively small inaccuracy and can be considered reasonable.
F. Residual Flux
After examining the main model parameters, attention turnsto the initial conditions which have a considerable influence inthe determination of the inrush current. The residual flux in thetransformer’s limbs prior to the energization defines the initialmagnetization state and affects the energization transient.
Fig. 16 shows how the inrush current magnitude is relatedto the residual flux amplitude. For a variation of 20% of theresidual fluxes, a mean variation of 9% for ungrounded-wye and14% for grounded-wye is experienced in the inrush first peak.
Fig. 16. Parameter sensitivity: residual flux.
G. Winding and Shunt Capacitances
An accurate estimation of the transformer capacitances is im-portant to extend the validity of the model to higher frequency,and to correctly predict the residual fluxes. The influence ofshunt capacitance on the residual flux has been discussed in [16].
Capacitances are estimated from direct capacitance measure-ments at the transformer terminals. These measurements arehighly susceptible to error and inaccuracy; thus, it is suggestedthat redundant data be acquired to verify the calculated param-eters. The recommended minimum set of measurements is:
• to G
(18)
• LV to
(19)
• HV to
(20)
• to
(21)
• to
(22)
• to
(23)
with // representing a parallel connection and, as an example,“ to ” refers to the measurement of the capacitancebetween all of the terminals of the high- and low-voltage wind-ings connected together and the transformer tank(G).
Measurements (18)–(23), together with, are sufficient to estimate the capacitance
values, while other coupling combinations can be measured inaddition and used to verify the calculations. The capacitance
, , and estimated from solving these equations
CHIESA et al.: TRANSFORMER MODEL FOR INRUSH CURRENT CALCULATIONS 2607
Fig. 17. Parameter sensitivity: capacitances.
Fig. 18. Parameter sensitivity: CB and current chopping.
are total capacitances. Per-phase capacitances with a value of1/3 of the total capacitances have to be used in the model.
The measurements (21)–(23) are used to estimate the asym-metry of the capacitance to ground of the high-voltage windingand can be performed only if the three high-voltage windingsare accessible independently. This is, however, seldom possibleon a power transformer. can be assumed to be equally dis-tributed among the three phases in case of a lack of such mea-surements. Series winding capacitances have been neglected inthe model since they cannot be measured from the bushing ter-minals and their estimation must be based exclusively on highlydetailed winding design information [3], [27].
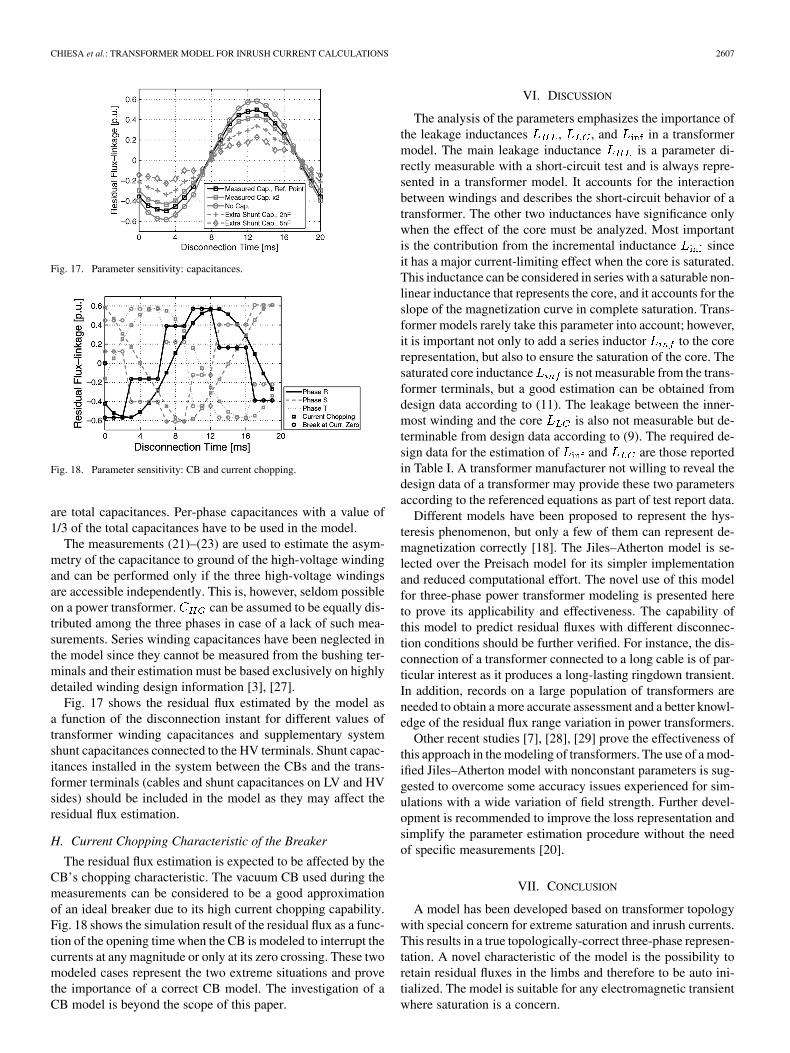
Fig. 17 shows the residual flux estimated by the model asa function of the disconnection instant for different values oftransformer winding capacitances and supplementary systemshunt capacitances connected to the HV terminals. Shunt capac-itances installed in the system between the CBs and the trans-former terminals (cables and shunt capacitances on LV and HVsides) should be included in the model as they may affect theresidual flux estimation.
H. Current Chopping Characteristic of the Breaker
The residual flux estimation is expected to be affected by theCB’s chopping characteristic. The vacuum CB used during themeasurements can be considered to be a good approximationof an ideal breaker due to its high current chopping capability.Fig. 18 shows the simulation result of the residual flux as a func-tion of the opening time when the CB is modeled to interrupt thecurrents at any magnitude or only at its zero crossing. These twomodeled cases represent the two extreme situations and provethe importance of a correct CB model. The investigation of aCB model is beyond the scope of this paper.
VI. DISCUSSION
The analysis of the parameters emphasizes the importance ofthe leakage inductances , , and in a transformermodel. The main leakage inductance is a parameter di-rectly measurable with a short-circuit test and is always repre-sented in a transformer model. It accounts for the interactionbetween windings and describes the short-circuit behavior of atransformer. The other two inductances have significance onlywhen the effect of the core must be analyzed. Most importantis the contribution from the incremental inductance sinceit has a major current-limiting effect when the core is saturated.This inductance can be considered in series with a saturable non-linear inductance that represents the core, and it accounts for theslope of the magnetization curve in complete saturation. Trans-former models rarely take this parameter into account; however,it is important not only to add a series inductor to the corerepresentation, but also to ensure the saturation of the core. Thesaturated core inductance is not measurable from the trans-former terminals, but a good estimation can be obtained fromdesign data according to (11). The leakage between the inner-most winding and the core is also not measurable but de-terminable from design data according to (9). The required de-sign data for the estimation of and are those reportedin Table I. A transformer manufacturer not willing to reveal thedesign data of a transformer may provide these two parametersaccording to the referenced equations as part of test report data.
Different models have been proposed to represent the hys-teresis phenomenon, but only a few of them can represent de-magnetization correctly [18]. The Jiles–Atherton model is se-lected over the Preisach model for its simpler implementationand reduced computational effort. The novel use of this modelfor three-phase power transformer modeling is presented hereto prove its applicability and effectiveness. The capability ofthis model to predict residual fluxes with different disconnec-tion conditions should be further verified. For instance, the dis-connection of a transformer connected to a long cable is of par-ticular interest as it produces a long-lasting ringdown transient.In addition, records on a large population of transformers areneeded to obtain a more accurate assessment and a better knowl-edge of the residual flux range variation in power transformers.
Other recent studies [7], [28], [29] prove the effectiveness ofthis approach in the modeling of transformers. The use of a mod-ified Jiles–Atherton model with nonconstant parameters is sug-gested to overcome some accuracy issues experienced for sim-ulations with a wide variation of field strength. Further devel-opment is recommended to improve the loss representation andsimplify the parameter estimation procedure without the needof specific measurements [20].
VII. CONCLUSION
A model has been developed based on transformer topologywith special concern for extreme saturation and inrush currents.This results in a true topologically-correct three-phase represen-tation. A novel characteristic of the model is the possibility toretain residual fluxes in the limbs and therefore to be auto ini-tialized. The model is suitable for any electromagnetic transientwhere saturation is a concern.

2608 IEEE TRANSACTIONS ON POWER DELIVERY, VOL. 25, NO. 4, OCTOBER 2010
The capability of the model to determine residual flux andcorrectly initialize inrush transients has been validated withmeasurements. The parameters obtained from test report andlimited design data have been utilized to accurately reproducethe inrush current first-peak and decay of energization tran-sients with different current magnitudes.
The model has been compared to analytical formulas andgives similar results. Formulas are limited to the estimation ofthe worst-case scenario and refer to a single-phase-equivalentrepresentation. They are therefore not beneficial to transientstudies. The use of the proposed model is of great advantage forenergization studies where the interaction of the transformerwith other network component needs to be investigated.
Parameter estimation, together with a sensitivity study, is ef-fectively used to identify the most critical parameters. The con-clusion is that the parameter that most influences the inrush cur-rent amplitude is the slope of the magnetization curve at extremesaturation .
ACKNOWLEDGMENT
The research team at NTNU, MTU and SINTEF Energy Re-search acknowledges the Norwegian Research Council, Hafs-lund Nett, Statnett SF, Statkraft Energi AS, NVE, EDF, NynäsPetroleum AB, as well as ABB for their support in the project“Thermal and electromagnetic performance of transformers.”
REFERENCES
[1] A. Greenwood, Electrical Transients in Power Systems, 2nd ed. NewYork: Wiley., 1991.
[2] L. F. Blume, Transformer Engineering: A Treatise on the Theory, Op-eration, and Application of Transformers, 2nd ed. New York: Wiley,1951.
[3] S. V. Kulkarni and S. A. Khaparde, Transformer Engineering: Designand Practice, ser. Power engineering. New York: Marcel Dekker,2004, vol. 25.
[4] F. de Leon and A. Semlyen, “Complete transformer model for elec-tromagnetic transients,” IEEE Trans. Power Del., vol. 9, no. 1, pp.231–239, Jan. 1994.
[5] J. A. Martinez and B. A. Mork, “Transformer modeling for low fre-quency transients—The state of the art,” presented at the Int. Conf.Power Systems Transients, New Orleans, LA, Sep. 2003.
[6] J. A. Martinez and B. A. Mork, “Transformer modeling for low- andmid-frequency transients—A review,” IEEE Trans. Power Del., vol. 20,no. 2, pt. 2, pp. 1625–1632, Apr. 2005.
[7] A. D. Theocharis, J. Milias-Argitis, and T. Zacharias, “Three-phasetransformer model including magnetic hysteresis and eddy currents ef-fects,” IEEE Trans. Power Del., vol. 24, no. 3, pp. 1284–1294, Jul.2009.
[8] W. Enright, O. B. Nayak, G. D. Irwin, and J. Arrillaga, “An electro-magnetic transients model of multi-limb transformers using normal-ized core concept,” in Proc. Int. Conf. Power System Transients, Seattle,WA, Jun. 1997, pp. 93–98.
[9] W. Enright, O. Nayak, and N. Watson, “Three-phase five-limb uni-fied magnetic equivalent circuit transformer models for PSCAD V3,”in Proc. Int. Conf. Power System Transients, Budapest, Hungary, Jul.1999, pp. 462–467.
[10] Y. Zhang, T. Maguire, and P. Forsyth, “UMEC transformer modelfor the real time digital simulator,” presented at the Int. Conf. PowerSystem Transients, Montreal, QC, Canada, Jun. 2005.
[11] B. A. Mork, F. Gonzalez, D. Ishchenko, D. L. Stuehm, and J. Mitra,“Hybrid transformer model for transient simulation: Part I: Develop-ment and parameters,” IEEE Trans. Power Del., vol. 22, no. 1, pp.248–255, Jan. 2007.
[12] B. A. Mork, F. Gonzalez, D. Ishchenko, D. L. Stuehm, and J. Mitra,“Hybrid transformer model for transient simulation: Part II: Laboratorymeasurements and benchmarking,” IEEE Trans. Power Del., vol. 22,no. 1, pp. 256–262, Jan. 2007.
[13] B. A. Mork, D. Ishchenko, F. Gonzalez, and S. D. Cho, “Parameterestimation methods for five-limb magnetic core model,” IEEE Trans.Power Del., vol. 23, no. 4, pp. 2025–2032, Oct. 2008.
[14] H. K. Høidalen, B. A. Mork, F. Gonzalez, D. Ishchenko, and N. Chiesa,“Implementation and verification of the hybrid transformer model inATPDraw,” Electr. Power Syst. Res., vol. 79, no. 3, pp. 454–459, Mar.2009, Special issue: papers from the 7th Int. Conf. Power SystemsTransients (IPST).
[15] T. Henriksen, “Transformer leakage flux modeling,” presented at theInt. Conf. Power System Transients, Rio de Janeiro, Brazil, Jun. 2001.
[16] N. Chiesa, A. Avendaño, H. K. Høidalen, B. A. Mork, D. Ishchenko,and A. P. Kunze, “On the ringdown transient of transformers,” pre-sented at the Int. Conf. Power System Transients, Lyon, France, Jun.2007.
[17] L. M. Ganatra, P. G. Mysore, K. K. Mustaphi, A. Mulawarman, B.A. Mork, and G. Gopakumar, “Application of reclosing schemes inthe presence of capacitor bank ringdown,” in Proc Amer. Power Conf.,1999, vol. 61-2, pp. 967–972.
[18] F. Liorzou, B. Phelps, and D. L. Atherton, “Macroscopic models ofmagnetization,” IEEE Trans. Magn., vol. 36, no. 2, pp. 418–428, Mar.2000.
[19] W. Chandrasena, P. G. McLaren, U. D. Annakkage, R. P. Jayasinghe,D. Muthumuni, and E. Dirks, “Simulation of hysteresis and eddy cur-rent effects in a power transformer,” Elect. Power Syst. Res., vol. 76,no. 8, pp. 634–641, May 2006.
[20] N. Chiesa and H. K. Høidalen, “Hysteretic iron-core inductor for trans-former inrush current modeling in EMTP,” presented at the 16th PowerSystems Computation Conf., Glasgow, U.K., Jul. 2008.
[21] N. Chiesa and H. K. Høidalen, “Systematic switching study of trans-former inrush current: Simulation and measurements,” presented at theInt. Conf. Power System Transients, Kyoto, Japan, Jun. 2009.
[22] J. F. Holcomb, “Distribution transformer magnetizing inrush current,”Trans. Amer. Inst. Elect. Eng.– Part III (Power App. Syst.), vol. 8, no.57, pp. 697–702, Dec. 1961.
[23] T. R. Specht, “Transformer magnetizing inrush current,” AIEE Trans.,vol. 70, pp. 323–328, 1951.
[24] G. Bertagnolli, Short-Circuit Duty of Power Transformers, 2nd reviseded. Legnano, Italy: ABB, 1996.
[25] M. Rioual, T. Guillot, and C. C. , “Determination of the air-core re-actance of transformers by analytical formulae for different topolog-ical configurations and its comparison with an electromagnetic 3D ap-proach,” presented at the IEEE/Power Eng. Soc. General Meeting, Cal-gary, AB, Canada, Jul. 2009.
[26] B. A. Mork, F. Gonzalez, and D. Ishchenko, “Parameter estimationand advancements in transformer models for EMTP simulations. TaskMTU-7: Model performance and sensitivity analysis”. BonnevillePower Admin., Portland, OR, Jun. 2004, Tech. rep.
[27] E. Bjerkan, “High frequency modeling of power transformers,” Ph.D.dissertation, Norwegian Univ. Sci. Technol., Trondheim, Norway,2005.
[28] X. Wang, D. W. P. Thomas, M. Sumner, J. Paul, and S. H. L. Cabral,“Characteristics of Jiles-Atherton model parameters and their applica-tion to transformer inrush current simulation,” IEEE Trans. Magn., vol.44, no. 3, pp. 340–345, Mar. 2008.
[29] M. Toman, G. Stumberger, and D. Dolinar, “Parameter identification ofthe Jiles-Atherton hysteresis model using differential evolution,” IEEETrans. Magn., vol. 44, no. 6, pp. 1098–1101, Jun. 2008.
Nicola Chiesa was born in Italy in 1980. He received the M.Sc. degree in elec-trical engineering from Politecnico di Milano, Milan, Italy, in 2005, and is cur-rently pursuing the Ph.D. degree in electric power engineering at the NorwegianUniversity of Science and Technology, Trondheim, Norway.
Bruce A. Mork (M’82–SM’08) was born in Bismarck, ND, on June 4, 1957. Hereceived the B.S.M.E., M.S.E.E., and Ph.D. degrees from North Dakota StateUniversity, Fargo, in 1979, 1981 and 1992, respectively.
He joined the Department of Electrical Engineering, Michigan TechnologicalUniversity, Houghton, in 1992, where he is currently Professor of ElectricalEngineering, and Director of the Power & Energy Research Center.
Hans Kristian Høidalen (M’05) was born in Norway in 1967. He receivedthe M.Sc. and Ph.D. degrees from the Norwegian University of Science andTechnology, Trondheim, Norway, in 1990 and 1998, respectively.
Currently, he is a Professor at the Norwegian University of Science and Tech-nology with a special interest in electrical stress calculations and modeling.