transformers fault analysis - a … fault analysis - a multidisciplinary approach ... a large solar...
TRANSCRIPT

TRAFOTECH WORKSHOP 2016
1 / 7
TRANSFORMERS FAULT ANALYSIS - A MULTIDISCIPLINARY A PPROACH
Giuseppe Cappai, Bernhard Heinrich, Giuseppe Simiol i, Leonardo Trevisan
Weidmann Electrical Technology AG, Switzerland
Abstract : A large solar plant in Europe has experienced more than twenty transformers failures in less than six months. A multidisciplinary fault analysis was required with the following activities: transformers inspection, on-site measurements, network simulations, transformers manufacturing audit as well as dielectric and water content tests on insulation material taken from failed transformers. The paper describes the multidisciplinary approach utilized for the transformers fault analysis in order to identify the root causes, including those addressable to operations, system integration and transformer manufacturing.
Keywords: solar plant, power system, transformer, fault analysis, transformer inspection, measurements, power system simulation, vacuum circuit breaker, prestrike, restrike, manufacturing audit, dielectric test, water content.
1 INTRODUCTION
Field experience showed over the past years a relatively high number of Solar Plant step-up Transformers (hereinafter SP Transformers) failures or incipient failures. The consequences are clear: unplanned outages, loss of assets, and profit losses (undelivered energy).
A failure analysis becomes of most importance in order to improve the overall reliability of the plant. It has to be considered that a transformer failure may have more than one root cause because of the transformer complexity. However, most failures involve or result from the transformer’s insulation system breakdown. Causes can be different and not only related to factors of electric nature. In fact, faults can be originated by system design, equipment manufacturing and selection.
A 37 MW solar plant in Europe has experienced more than twenty SP transformers failures in less than six months. These transformers passed routine insulation tests and even specific tests before their installation on site. No indication about possible defects before they resulted in failures during operation.
With the scope to ascertain the real causes of the events, a multidisciplinary fault analysis was performed. This analysis was based on the following activities:
• transformers inspection; • on-site measurements (to detect possible
voltage transients); • network simulations (to verify the
measurements and to identify other possible critical events);
• transformers manufacturing audit; • dielectric and water content tests on
insulation material taken from failed and new transformers.
2 TRANSFORMERS MAIN DATA
The main characteristics of the transformers are reported in Table 1.
Table 1 - SP transformers main data Type Oil immersed Three-phase
Transformers
Rated power 630 kVA
Frequency 50 Hz
Primary rated voltage 21 kV ± 2x2.5%
Secondary rated voltage 315 V
Insulation level MV 24 / 50 / 125 kV; LV 3.6 / 10 kV
Cooling method ONAN
Vector group Dy11
3 TRANSFORMERS INSPECTION
The first step of the failure analysis was the inspection of five of the faulted transformers.
In order to have a reference, prior to the visual inspection, special dielectric tests on four new transformers were carried out. The adopted test procedure foresees an induced voltage test with partial discharge (PD) measurement. After that, a lightning impulse test with a sequence of one full wave, two chopped waves and two full waves, a second induced voltage test with PD measurement was applied. At the end, an applied voltage test was performed.

TRAFOTECH WORKSHOP 2016
2 / 7
It is important to point out that these tests are much more severe than the standard routine tests. All the transformers withstood successfully these special tests without showing significant PD activity.
The visual inspection of the faulty five transformers pointed out that all of them showed different degree of damage. In fact, some of them presented only slight puncture signs on the medium voltage (MV) windings while in the others the windings were completely damaged. To be underlined that all the transformers were characterized by the same fault pattern: two-phase passing through the solid inter-phase barriers (see Figure 1). In addition, typical traces of PD in significant quantities were found within the solid inter-phase barriers (see Figure 2).
Figure 1 - Transformers inspection: damaged windings of a SP transformer.
Figure 2 – Heavy partial discharge signs inside an inter-phase barrier.
From the slightly damaged units, it was understood that the dielectric breakdown had its origin inside of the inter-phase barrier, and then spread to the affected windings.
The evident signs of high and diffuse partial discharges in the inter-phase barriers called into question the method of assembly, gluing, impregnation, drying and storage of the materials used.
4 ON-SITE MEASUREMENTS
The aim of the on-site measurements was to characterize the interaction between network and SP transformers, with particular attention to the slow front and fast front overvoltages (including the possible transient due to vacuum circuit breakers VCB maneuvering), and the assessment of the harmonic current injection of the SP inverters in order to verify if critical stresses were present.
A one month measurement campaign was decided as second step of the fault analysis.
The measuring equipment system was connected to the MV and LV terminals of the SP transformer as shown in Figure 3.
Figure 3 - Connection scheme of the measuring equipment.
The following quantities were measured and recorded:
• phase-to-ground voltages on the MV system through the capacitive dividers installed at point 1 (voltage transducers bandwidth up to 300 kHz);
• line currents on the MV system through Rogowski coils installed at point 1 (current transducers bandwidth up to 30 kHz);
• phase-to-ground voltages on the LV system through the existing PTs installed at point 2;
• line currents on the LV system through the existing CTs installed at point 2.
1.
TSP
CA/CC
sMV
sLV
2.
Solar array

TRAFOTECH WORKSHOP 2016
3 / 7
4.1 Recorded events
During the measurement campaign, about 270 events were recorded. Most of them were not relevant for the purposes of the campaign and they were mainly due to four kinds of causes:
• (around 100 events) voltage transients relevant to particular load conditions in which the voltage on the MV busbars was exceeding the 100% of the maximum system voltage, very probably, as a consequence of switching operations on the MV system or on the HV system;
• (14 events) voltage and current transients due to faults happened on the MV system or on the HV system. This kind of events happens several times a week;
• (1 event) inrush transient of the SP transformer due to its re-energization after a fault clearing (a fast front transient due to the VCB closing operation was recorded);
• (about 156 events) current transients due to the ON/OFF operations of the inverter connected to the SP transformer. This kind of events happened many times every day in the morning (just after the sunrise) and in the evening (just before the sunset).
4.2 Significant recorded events
The measurements data showed only five events that were interesting for the objective of the campaign, i.e. events relevant to significant overvoltages transients on the MV terminals of the SP transformer (see Table 2).
Table 2 - Significant recorded events
Type of significant
event
Fault clearing
Condition after the
event
MV max peak
overvoltage [kV]
Two-phase fault
Transformer trip
Transformer out of service
46 (slow front)
Inrush transient No trips Transformer
energization 50 (slow front) 91 (fast front) a
Two-phase fault
External trip Normal operation
62 (slow front)
Three-phase fault External trip
Normal operation 27 (slow front)
VCB opening
operation No fault Transformer
out of service 159 (fast front)
a
a. phase to phase values.
4.3 Analysis of the measurements
The analysis of the measurements highlights the following issues.
Temporary Overvoltages
No temporary overvoltages were recognizable. Most of the recorded overvoltages on the MV system were typical slow front overvoltages characterized by a damped oscillation of about 510 Hz.
Fast Front Overvoltages
The VCBs openings and closing determines fast front overvoltages due to the restrike or prestrike phenomenon respectively (opening and closing of the VCB). The observed values, relevant to the VCB closing, were 48 kV phase to earth and 91 kV phase to phase (see Figure 4), while for the VCB opening, they were 88 kV phase to earth and 159 kV phase to phase.
The relevant fast front overvoltages (FFO) were repetitive, with severe amplitudes and applied to the transformer terminals each time the CB was operated.
Figure 4 - Recorded fast front overvoltages (phase to phase) during the VCB closing event
(about 0.4 ms/div.).
Figure 5 - Currents and voltages recorded during a transformer fault (about 57 ms/div.).

TRAFOTECH WORKSHOP 2016
4 / 7
Slow Front Overvoltage
The most severe events were relevant to double phase faults with multiple re-ignitions (these cases refer to the five failures of transformers in service that occurred during the measurement campaign). The maximum slow front overvoltage peak values recorded were of about 62,5 kV (3,2 p.u.) phase to earth and 112,8 kV (3,33 p.u.) phase to phase.
Harmonics
As far as the harmonics were of concern, no relevant values were recorded to justify a deeper investigation.
5 NETWORK SIMULATIONS
Following the on-site measurements it was decided to perform a dedicated network study to verify the insulation coordination of the MV power system. Several case studies relevant to temporary (TOV), slow front (SFO) and fast front overvoltages (FFO) were analyzed in order to find the worst stresses for the equipment. Lightning overvoltages were not considered taking into account the absence of air insulated equipment.
The events simulated with the software EMTP-RV, were the following:
• HV three-phase, two-phase and single-phase faults and successive successfully reclosing;
• MV three-phase, two-phase and single-phase faults fault;
• MV single-phase to ground fault plus longitudinal fault and successive clearing;
• SP transformer inrush;
• MV single-phase to ground intermittent fault;
• MV single-phase to ground fault plus longitudinal fault;
• SP transformer’s VCB opening and closing operations.
As first result, the simulation have demonstrated a quite good matching with the on-site measurements. In fact, the maximum values of the overvoltage’s statistical distributions were slightly higher than the maximum values recorded on-site.
No dangerous TOV and SFO were detected. Only FFO exceeding the insulation level of the SP transformer were identified, in particular
following the VCB opening operation; see Table 3 and compare FFO with the adopted lightning impulse withstand level, i.e. 125 kV.
Based on the insulation coordination procedure [1] [2] applied to the simulated overvoltages, the selected standard insulation levels for short duration power frequency (50 kV) was deemed suitable while the lighting impulse (125 kV) was not adequate for the purpose when compared with the expected fast front overvoltages (FFO).
Table 3 - Results of network simulations TOV (kV)
SFO (kV)
FFO (kV)
VCB opening VCB closing
p-e p-p p-e p-p p-e p-p p-e p-p
28.4 21.6 61.7 54.3 98.0 172.7 52.3 97.9
6 TRANSFORMERS MANUFACTURING AUDIT
During the workshop quality audit the following processes, storage, production and drying were checked.
Special topics to be checked:
• cleanliness of workplaces, especially where insulation material was involved in a processes;
• storage areas of insulation material and their immediate environment;
• handling of insulation material;
• cutting, milling and converting of insulation material;
• drying process of coils and active parts;
• final drying and oil-filling;
• closing and sealing of the transformers.
No particular issues were carried out unless for one stage of the manufacturing process. In fact, only as examples:
• the assembly of active parts was clean and with proper process;
• the handling of insulation material in winding and assembly process was proper as well;
• the storage area of the pressboard and paper-rolls presented a clean and good separation from the copper bar storage (this is due to avoid contamination with metallic particles).
TRAFOTECH WORKSHOP 2016
5 / 7
However, two details of the manufacturing process were noticed to be critical: the application of glue in the assembly of the inter-phase barriers was carried out with too much glue (glue drops on the pressboard giving rise to a possible risk of voids which are not impregnable with oil) and that the drying procedure was not appropriate in order to remove the moisture in the layers of the inter-phase barriers.
7 DIELECTRIC AND WATER CONTENT TESTS
In addition to the above, dielectric and water content tests were decided to be performed on samples taken from the inter-phase barriers of three different new transformers.
To have a correct measure of the moisture content, the handling of the samples became of most importance. In fact, to avoid any moisture exchange (conservation) in the inter-phase barriers between sample taking and the tests, a suitable handling procedure was adopted. Dedicated transportation tanks were filled with oil from the corresponding transformer; the samples were taken out of the transformer and placed into the tanks; afterwards these were sealed and brought to the laboratory for the planned investigations. In this way, the exposure time of the pieces to air was kept as short as possible.
7.1 Dielectric test
For the electrical investigations, two different geometries of samples were cut out from the inter-phase barriers.
The electrical tests were carried out on the base of [3]. Three different tests were carried out.
For sake of clarity, the results here presented are relevant to only one set of samples taken from the first inter-phase barrier.
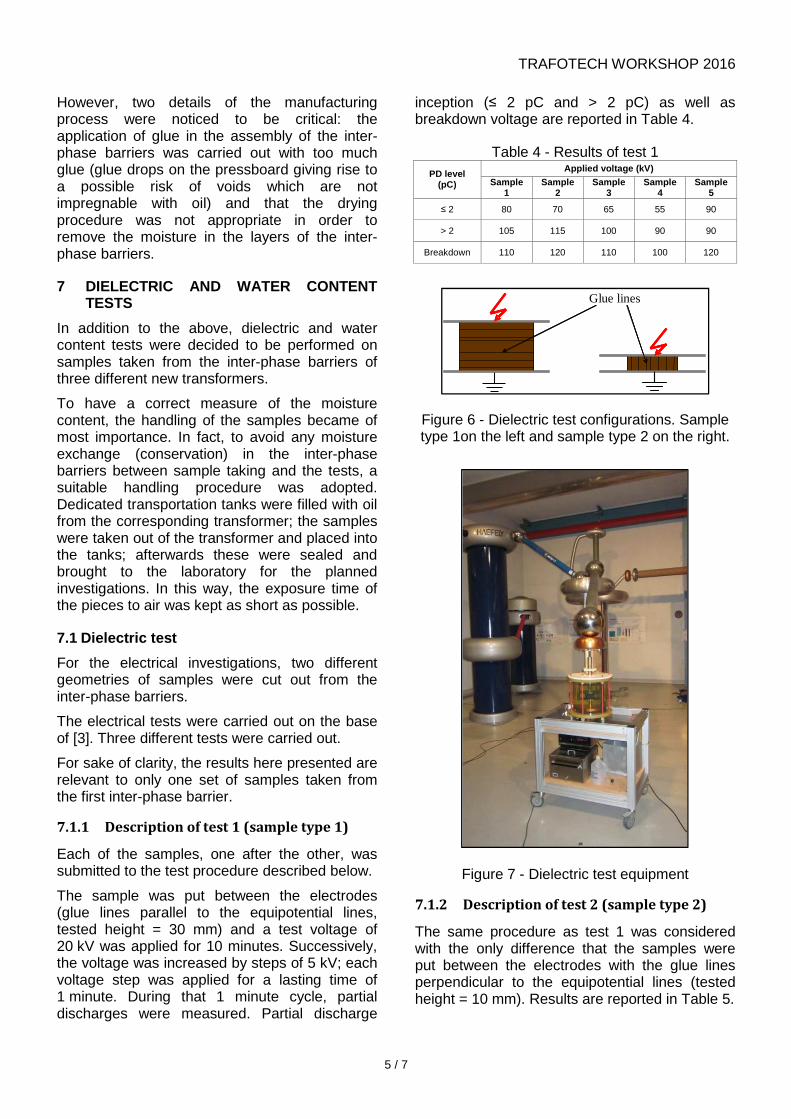
7.1.1 Description of test 1 (sample type 1)
Each of the samples, one after the other, was submitted to the test procedure described below.
The sample was put between the electrodes (glue lines parallel to the equipotential lines, tested height = 30 mm) and a test voltage of 20 kV was applied for 10 minutes. Successively, the voltage was increased by steps of 5 kV; each voltage step was applied for a lasting time of 1 minute. During that 1 minute cycle, partial discharges were measured. Partial discharge
inception (≤ 2 pC and > 2 pC) as well as breakdown voltage are reported in Table 4.
Table 4 - Results of test 1 PD level
(pC)
Applied voltage (kV) Sample
1 Sample
2 Sample
3 Sample
4 Sample
5
≤ 2 80 70 65 55 90
> 2 105 115 100 90 90
Breakdown 110 120 110 100 120
Figure 6 - Dielectric test configurations. Sample type 1on the left and sample type 2 on the right.
Figure 7 - Dielectric test equipment
7.1.2 Description of test 2 (sample type 2)
The same procedure as test 1 was considered with the only difference that the samples were put between the electrodes with the glue lines perpendicular to the equipotential lines (tested height = 10 mm). Results are reported in Table 5.
Glue lines

TRAFOTECH WORKSHOP 2016
6 / 7
Table 5 - Results of test 2 PD level
(pC)
Applied voltage (kV) Sample
1 Sample
2 Sample
3 Sample
4 Sample
5
≤ 2 30 22.5 22.5 25 45
> 2 30 22.5 22.5 25 45
Breakdown 30 25 25 25 50
7.1.3 Description of test 3 (sample type 1)
The idea of this test was to reproduce a similar situation of the barriers inside the transformers.
For the whole testing time a constant voltage of 30 kV (1 kV/mm) was applied. Each test sample was submitted to 2 testing stages:
• 1st stage: 8 hours test at room temperature (about 23°C);
• 2nd stage: 16 hours test; immediately after the voltage application an “indirect” heating system was used to heat up the oil. The final temperature of 75°C was reached after about 2 hours and then kept constant over time.
Test results are in Figure 8.
Figure 8 – Test 3 results
The sample 2 of Figure 9 showed a pattern of traces in the material similar to that one detected in the failed inter-phase barriers, indicating a thermal breakdown due to a very high water content in the pressboard.
7.2 Water content test
The water content from samples taken inside as well as outside of the inter-phase barriers, was measured by means of Karl Fischer method [4].
The water content showed much too high values (4% to up 7%) for a dried transformer ready to be put into operation.
It is important to point out that according to [5] and [6], paper and pressboard insulation of oil immersed transformers should have a water content below 1%.
Figure 9 - Results of test 3. At 23 °C both the samples did not show any PDs, whereas at elevated temperature both samples were
affected by PDs. Even worse, test sample 2 had a breakdown after some hours.
The test on sample 1 was stopped after 24 hours.
8 CONCLUSIONS
The system integration of a transformer has to consider its specific application, proving a design and a manufacturing quality adequate for the purpose. In this particular case, the required insulation level for the solar plant transformers (as resulted from the network simulation and the on-site measurements) was below the high frequency voltage stresses caused by nearby vacuum circuit breakers switching in and off as the on-site measurements and the relevant network studies demonstrated.
It should be pointed out that the standard routine and type tests and even the special tests (more severe than the standard ones), performed in the workshop, did not evidence the deficiencies of the insulating system.
Notwithstanding the possible inadequacy of insulation in case of high frequency events, the cause of the failures was not attributable to FFO, because some of the failed transformers were not subjected to any dangerous fast front overvoltages. However, the inspected transformers presented all the same fault pattern, strengthening the thesis of a defect in the manufacturing of the same transformers.
Inadequate gluing and insufficient drying processes were deemed to be the main causes behind the failures. Consequently, it was recommended to use less adhesive to glue the paper to the sticks and, at the same time, to
0
10
20
30
40
50
60
70
80
0 5 10 15 20 25
Time (hours)
U (
kV);
T (
°C);
PD
-Lev
el (p
C)
Temperature
VoltagePD level sample 1
PD level sample 2

TRAFOTECH WORKSHOP 2016
7 / 7
improve the drying process decreasing the water content in the insulating system.
On this regard, a review of the inter-phase barriers design was performed, in order to make more effective the drying process, keeping safe the electrical and mechanical properties required for the same inter-phase barriers.
Finally, this multidisciplinary analysis has permitted to rank the possible multiple causes of the failures, identifying the main ones so to be able to set up suitable provisions in the workshop, and at the same time to enlarge the critical cases to be considered in the transformer design process.
9 REFERENCES
[1] IEC 60071-1 ed8.1 Consol. with am1 (2011-03) TC/SC 28 Insulation co-ordination - Part 1: Definitions, principles and rules
[2] IEC 60071-2 ed3.0 (1996-12) TC/SC 28 Insulation co-ordination - Part 2: Application guide
[3] IEC 60243-1ed2.0 (1998-01) TC/SC 112 Electrical strength of insulating materials - Test methods - Part 1: Tests at power frequencies
[4] IEC 60814 ed2.0 (1997-08) TC/SC 10 Insulating liquids - Oil-impregnated paper and pressboard - Determination of water by automatic coulometric Karl Fischer titration
[5] IEC 60422 ed3.0 (2005-10) TC/SC 10 Mineral insulating oils in electrical equipment - Supervision and maintenance guidance
[6] CIGRE Brochure 349- Moistrure quilibrium and moisture migration within transformer insulation systems