transforming lives through education… · transforming lives through education navitas has helped...
TRANSCRIPT

T R A N S F O R M I N G L I V E S T H R O U G H E D U C A T I O NN A V I T A S L I M I T E D A N N U A L R E P O R T 2 0 1 7

TRANSFORMING LIVES THROUGH EDUCATIONNavitas has helped generations of learners transform their lives through education. For over 40 years, hundreds of thousands of learners from around the world have graduated from Navitas colleges, having experienced a teaching and learning environment that supports them to harness their talents and achieve their dreams.
Navitas’ success is underpinned by its unparalleled international network, a peerless commitment to student experiences and outcomes, a track record of working in partnership with universities and industry and a passion for discovering new technologies and models of teaching and learning that will improve education now and into the future.
From pre-university and pathway programs to university, to English language and vocational training and undergraduate and postgraduate degrees, Navitas reaches aspirational learners at more than 120 colleges and campuses across its global network each year, powered by a diverse group of talented employees.
Navitas is a proud Australian company that pioneered an innovative university partnership model of education in Perth in 1994. Its entities have delivered education programs across the country since 1976.
Navitas is listed on the Australian Securities Exchange (ASX:NVT) and is part of the S&P/ASX 200 Index.

VISION MISSION
To be one of the most trusted learning
organisations in the world.
Navitas is passionate about creating opportunities through
lifelong learning, and being a global leader in delivering better learning solutions.
Drive to achieve and
advance together.Adventurous
in mind and spirit.Conviction in our
purpose and potential.
Genuine in the way we behave
and deliver.
Rigour to enhance our professional reputation
and credibility.
Respect by celebrating, valuing
and caring for people and the environment.
STRATEGY AND VALUES
Navitas Limited Annual Report 2017 III
TRANSFORMING LIVES THROUGH EDUCATIONANNUAL REPORT 2017CONTENTS
IV Navitas Limited Annual Report 2017

Navitas Limited Annual Report 2017 001
Operating and Financial Review 002
Navitas’ Global Footprint – . Colleges, Campuses and Offices 004
Highlights and Achievements 006
Chairman and Group CEO Report 008
About Navitas 010
Review of Operations 012
About our Businesses 017
Corporate Responsibility 026
Corporate Governance 028
Navitas Leadership Team 030
Directors’ Report 034
Remuneration Report 040
Financial Statements and Notes 056
Consolidated Statement of Profit or Loss . and Other Comprehensive Income 058
Consolidated Statement of Financial Position 059
Consolidated Statement of Cash Flows 060
Consolidated Statement of Changes in Equity 061
Notes to the Financial Statements 062
Directors’ Declaration 098
Independent Auditor’s Report 099
Additional Information 104
Investor Information 105
Glossary 106
Corporate Information 108

002 Navitas Limited Annual Report 2017
OPERATING AND FINANCIAL REVIEW

Navitas Limited Annual Report 2017 003
004 Navitas Limited Annual Report 2017
Mexico
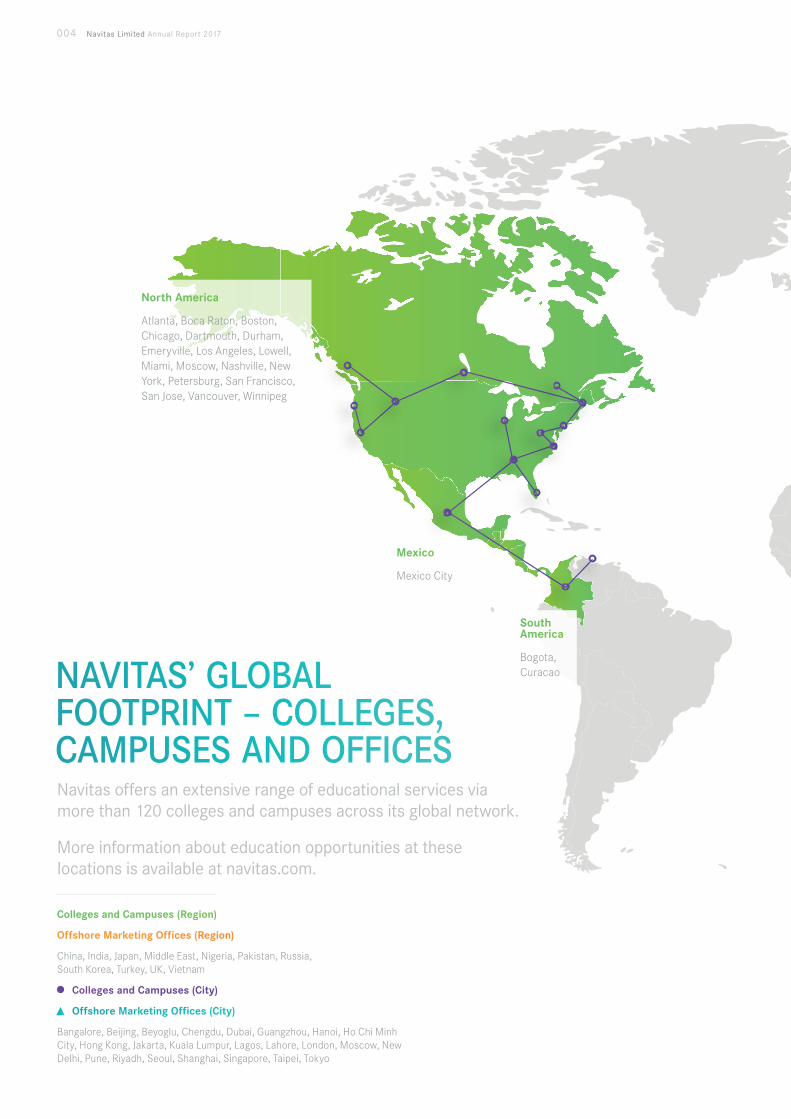
Mexico City
North America
Atlanta, Boca Raton, Boston, Chicago, Dartmouth, Durham, Emeryville, Los Angeles, Lowell, Miami, Moscow, Nashville, New York, Petersburg, San Francisco, San Jose, Vancouver, Winnipeg
South America
Bogota, CuracaoNAVITAS’ GLOBAL
FOOTPRINT – COLLEGES, CAMPUSES AND OFFICESNavitas offers an extensive range of educational services via more than 120 colleges and campuses across its global network.
More information about education opportunities at these locations is available at navitas.com.
Colleges and Campuses (Region)
Offshore Marketing Offices (Region)
China, India, Japan, Middle East, Nigeria, Pakistan, Russia, South Korea, Turkey, UK, Vietnam
Colleges and Campuses (City)
Offshore Marketing Offices (City)
Bangalore, Beijing, Beyoglu, Chengdu, Dubai, Guangzhou, Hanoi, Ho Chi Minh City, Hong Kong, Jakarta, Kuala Lumpur, Lagos, Lahore, London, Moscow, New Delhi, Pune, Riyadh, Seoul, Shanghai, Singapore, Taipei, Tokyo
Navitas Limited Annual Report 2017 005
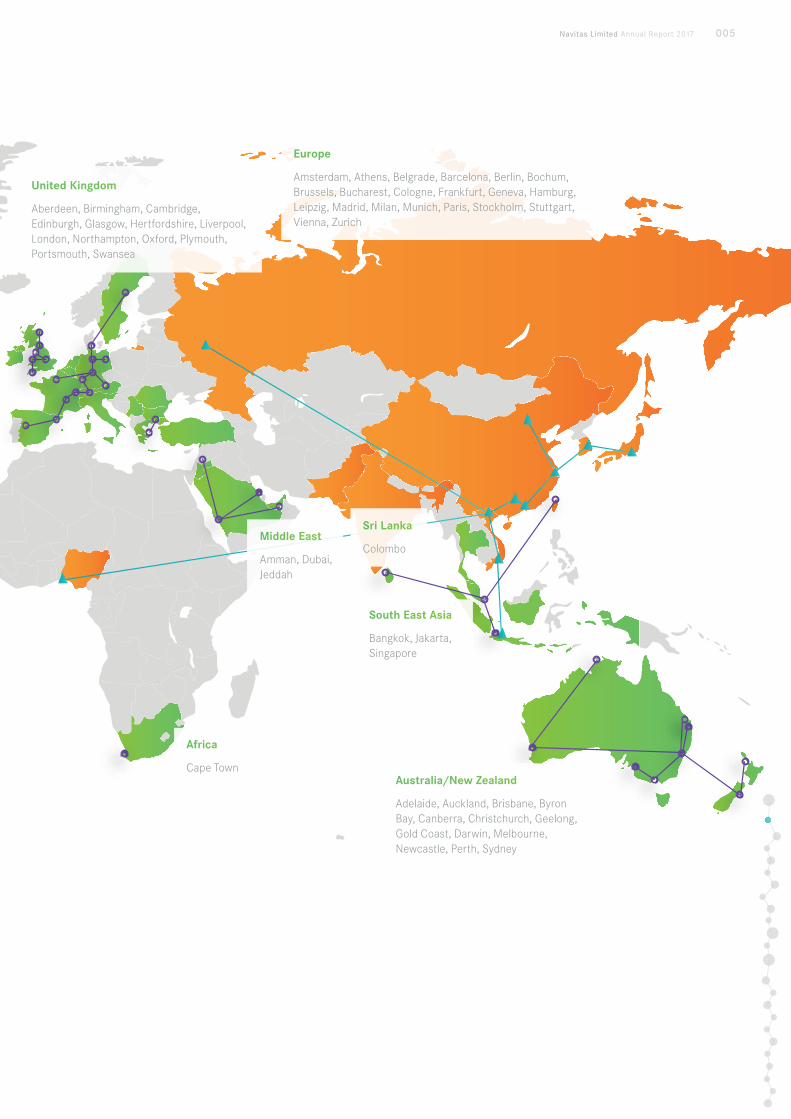
United Kingdom
Aberdeen, Birmingham, Cambridge, Edinburgh, Glasgow, Hertfordshire, Liverpool, London, Northampton, Oxford, Plymouth, Portsmouth, Swansea
Middle East
Amman, Dubai, Jeddah
South East Asia
Bangkok, Jakarta, Singapore
Sri Lanka
Colombo
Africa
Cape Town
Europe
Amsterdam, Athens, Belgrade, Barcelona, Berlin, Bochum, Brussels, Bucharest, Cologne, Frankfurt, Geneva, Hamburg, Leipzig, Madrid, Milan, Munich, Paris, Stockholm, Stuttgart, Vienna, Zurich
Australia/New Zealand
Adelaide, Auckland, Brisbane, Byron Bay, Canberra, Christchurch, Geelong, Gold Coast, Darwin, Melbourne, Newcastle, Perth, Sydney
006 Navitas Limited Annual Report 2017
QUALITY EFFICIENCY GROWTH
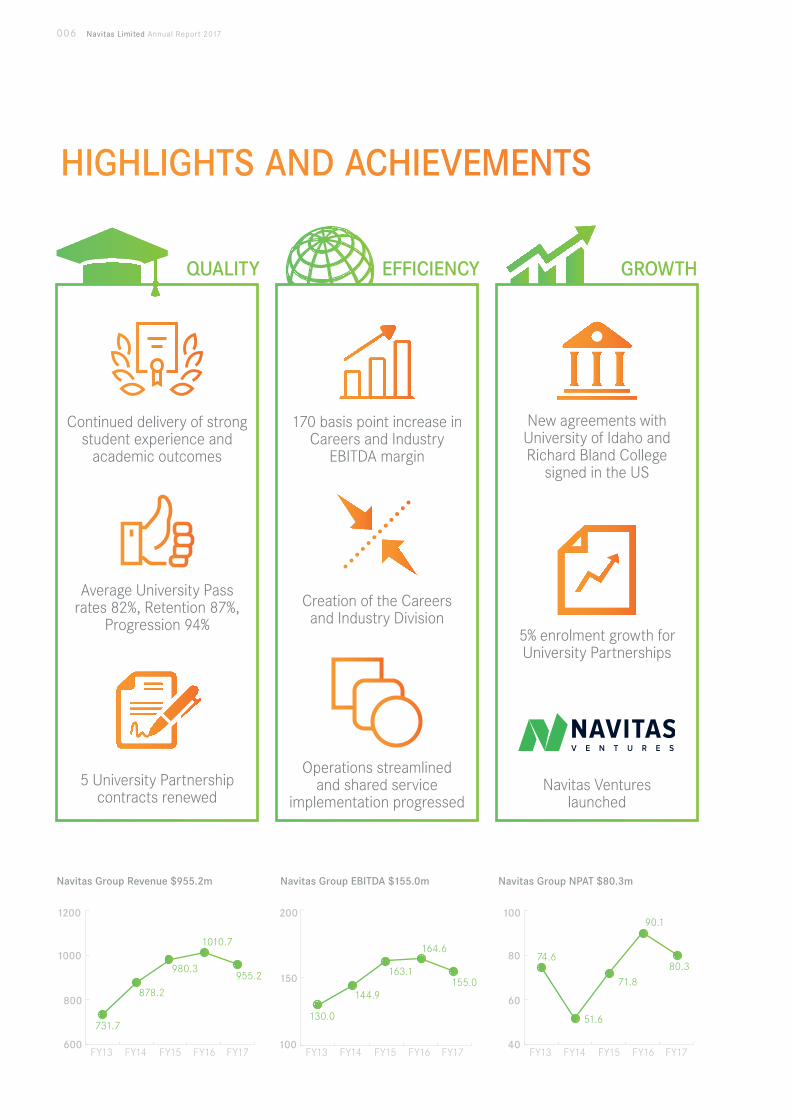
HIGHLIGHTS AND ACHIEVEMENTS
Continued delivery of strong student experience and
academic outcomes
Average University Pass rates 82%, Retention 87%,
Progression 94%
5 University Partnership contracts renewed
170 basis point increase in Careers and Industry
EBITDA margin
Creation of the Careers and Industry Division
Operations streamlined and shared service
implementation progressed
New agreements with University of Idaho and Richard Bland College
signed in the US
5% enrolment growth for University Partnerships
Navitas Ventures launched
130.0
144.9
163.1
164.6
155.0
200
150
100FY13 FY14 FY15 FY16 FY17
Navitas Group EBITDA $155.0m
74.6
51.6
71.8
90.1
80.3
100
80
60
40FY13 FY14 FY15 FY16 FY17
Navitas Group NPAT $80.3m
731.7
878.2
980.3
1010.7
955.2
1200
1000
800
600FY13 FY14 FY15 FY16 FY17
Navitas Group Revenue $955.2m
Navitas Limited Annual Report 2017 007
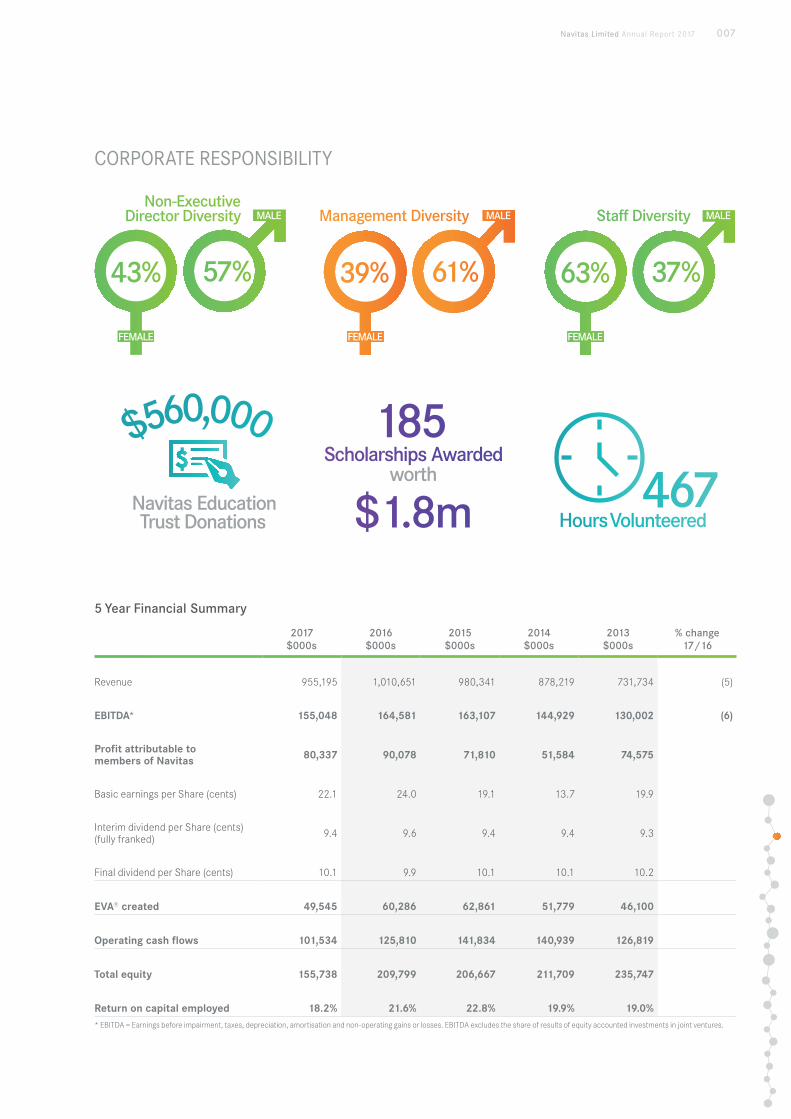
5 Year Financial Summary
2017 $000s
2016 $000s
2015 $000s
2014 $000s
2013 $000s
% change 17/16
Revenue 955,195 1,010,651 980,341 878,219 731,734 (5)
EBITDA* 155,048 164,581 163,107 144,929 130,002 (6)
Profit attributable to members of Navitas 80,337 90,078 71,810 51,584 74,575
Basic earnings per Share (cents) 22.1 24.0 19.1 13.7 19.9
Interim dividend per Share (cents) (fully franked) 9.4 9.6 9.4 9.4 9.3
Final dividend per Share (cents) 10.1 9.9 10.1 10.1 10.2
EVA® created 49,545 60,286 62,861 51,779 46,100
Operating cash flows 101,534 125,810 141,834 140,939 126,819
Total equity 155,738 209,799 206,667 211,709 235,747
Return on capital employed 18.2% 21.6% 22.8% 19.9% 19.0%* EBITDA = Earnings before impairment, taxes, depreciation, amortisation and non-operating gains or losses. EBITDA excludes the share of results of equity accounted investments in joint ventures.
43% 57% 39% 61% 63% 37%
Management DiversityNon-Executive
Director Diversity Staff Diversity
CORPORATE RESPONSIBILITY
185Scholarships Awarded
worth
$1.8mNavitas Education Trust Donations
$560,000
467Hours Volunteered
008 Navitas Limited Annual Report 2017
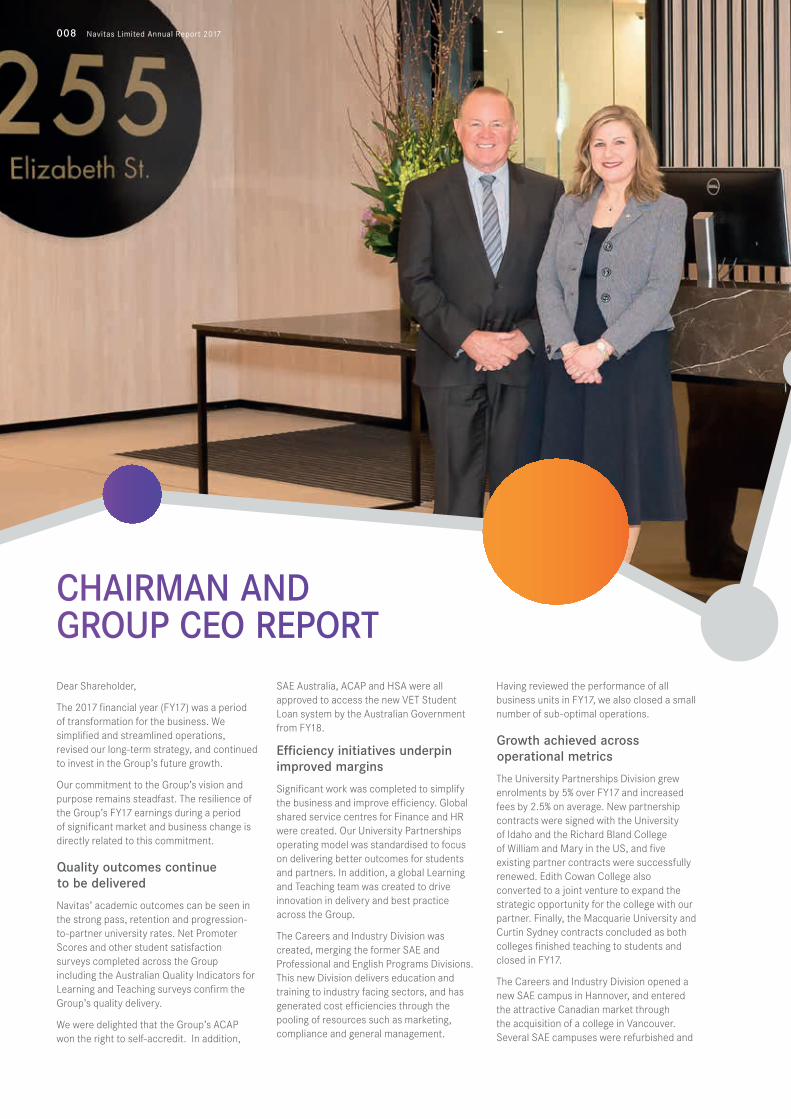
CHAIRMAN AND GROUP CEO REPORTDear Shareholder,
The 2017 financial year (FY17) was a period of transformation for the business. We simplified and streamlined operations, revised our long-term strategy, and continued to invest in the Group’s future growth.
Our commitment to the Group’s vision and purpose remains steadfast. The resilience of the Group’s FY17 earnings during a period of significant market and business change is directly related to this commitment.
Quality outcomes continue to be delivered
Navitas’ academic outcomes can be seen in the strong pass, retention and progression-to-partner university rates. Net Promoter Scores and other student satisfaction surveys completed across the Group including the Australian Quality Indicators for Learning and Teaching surveys confirm the Group’s quality delivery.
We were delighted that the Group’s ACAP won the right to self-accredit. In addition,
SAE Australia, ACAP and HSA were all approved to access the new VET Student Loan system by the Australian Government from FY18.
Efficiency initiatives underpin improved margins
Significant work was completed to simplify the business and improve efficiency. Global shared service centres for Finance and HR were created. Our University Partnerships operating model was standardised to focus on delivering better outcomes for students and partners. In addition, a global Learning and Teaching team was created to drive innovation in delivery and best practice across the Group.
The Careers and Industry Division was created, merging the former SAE and Professional and English Programs Divisions. This new Division delivers education and training to industry facing sectors, and has generated cost efficiencies through the pooling of resources such as marketing, compliance and general management.
Having reviewed the performance of all business units in FY17, we also closed a small number of sub-optimal operations.
Growth achieved across operational metrics
The University Partnerships Division grew enrolments by 5% over FY17 and increased fees by 2.5% on average. New partnership contracts were signed with the University of Idaho and the Richard Bland College of William and Mary in the US, and five existing partner contracts were successfully renewed. Edith Cowan College also converted to a joint venture to expand the strategic opportunity for the college with our partner. Finally, the Macquarie University and Curtin Sydney contracts concluded as both colleges finished teaching to students and closed in FY17.
The Careers and Industry Division opened a new SAE campus in Hannover, and entered the attractive Canadian market through the acquisition of a college in Vancouver. Several SAE campuses were refurbished and

Navitas Limited Annual Report 2017 009
relocated, including Sydney and Berlin, to continue to drive improved student outcomes and enrolments.
Lastly, Navitas Ventures was launched to provide a platform to extend into the next generation of education focused initiatives for growth.
A resilient result given market conditions
Solid growth in student volumes across most operations reduced the impact of the closure of two Australian University Partnerships colleges.
The closures, together with the conversion of a college to a joint venture and significant adverse foreign exchange translation movements in the year, reduced Group revenue by 5% to $955.2m. However, improved operating leverage and increased efficiencies offset the lower revenue, with pro-forma EBITDA2 remaining in line with FY16 at $161.0m.
The Careers and Industry Division was also awarded fewer contract regions via the retender process for the Adult Migrant English Program which will reduce the Division’s performance in FY18.
Updated strategy to drive long-term growth
A strategic review in the second half of FY17 confirmed continued strong growth in demand for both international and tertiary education across many of Navitas’ core markets. An evolving sector will provide extensive growth opportunities for a nimble, well-funded and high-quality education provider like Navitas. Further detail on the updated strategy and progress is outlined in this Annual Report.
Capital management initiatives
Navitas has delivered a fully franked FY17 dividend of 19.5 cents per share. The Dividend Reinvestment Plan will continue.
In addition, Navitas continued its share buy-back program. To date approximately 70% of the buy-back has been completed, and the Company will continue to purchase shares when appropriate, with a focus on value accretion.
Good corporate governance
An overview of our governance and risk management processes is available on page 28 and the full version of our corporate governance statement is at www.navitas.com/organisation/investors. We encourage shareholders to read it in full.
Navitas’ relentless focus on quality outcomes for students and partners has delivered a high ratio of partnership contract extensions over the Company’s 23 year history, with five more renewals occurring in FY17.
Succession planning is also critical to the ongoing success of Navitas and the Board has continued to focus on Director and senior executive capability and renewal during FY17. This has included a change of Chairman of the Board, and the appointment of David Robb as a Non-Executive Director. Succession planning for key roles remains a priority for the Board.
Thank you for your continued support
Navitas has done much to strengthen its platform for long term growth throughout FY17.
The Company’s global operating structures are transforming to provide the best platform to execute our strategy and deliver on growth opportunities. The benefits can already be seen in the continued student growth and improved EBITDA margins for the Group. In addition, we are focused on pursuing a wide array of new opportunities to create value for students, partners and shareholders.
We would like to thank the Board and the entire Navitas team for their contribution to the outcomes achieved in FY17 and their willingness to embrace the changes needed for a successful future. We would also like to thank all our shareholders for their continued support and look forward to delivering continued growth in shareholder returns.
TRACEY HORTON AOChairman
ROD JONESGroup Chief Executive Officer
2 Pro-forma EBITDA includes share of EBITDA from joint ventures and excludes foreign currency translation movements – see page 12
010 Navitas Limited Annual Report 2017
ABOUT NAVITAS
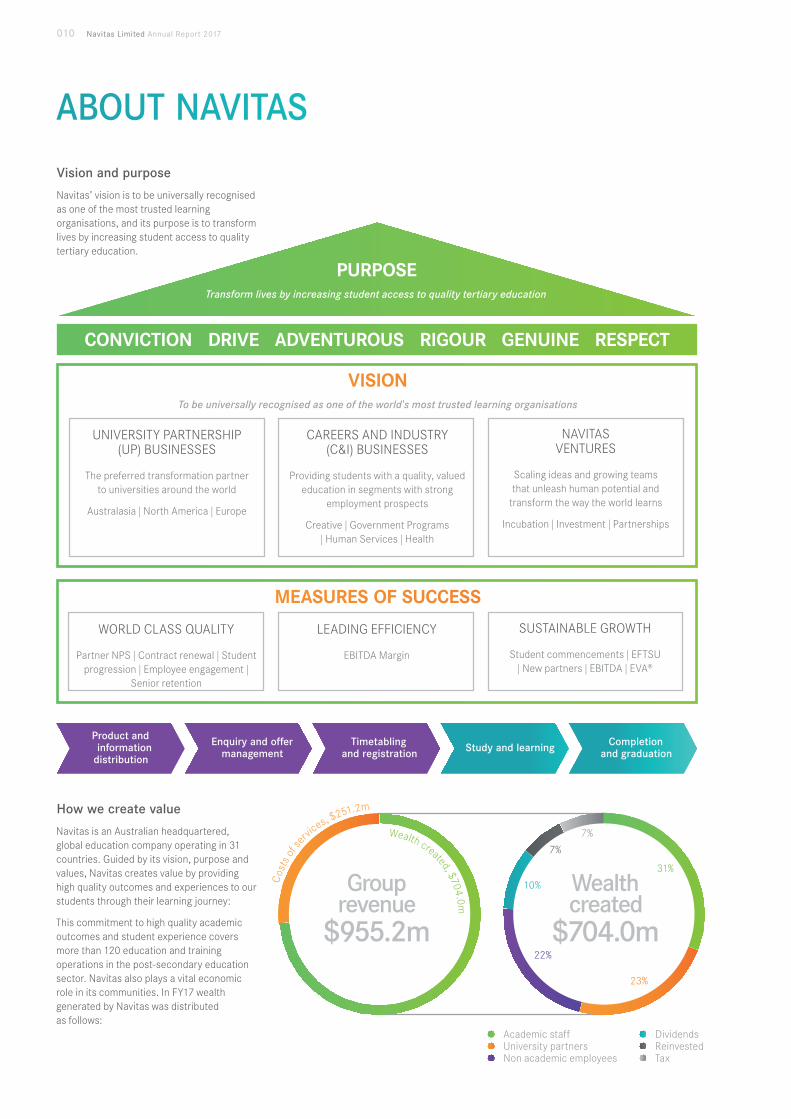
Vision and purpose
Navitas’ vision is to be universally recognised as one of the most trusted learning organisations, and its purpose is to transform lives by increasing student access to quality tertiary education.
PURPOSETransform lives by increasing student access to quality tertiary education
MEASURES OF SUCCESS
UNIVERSITY PARTNERSHIP (UP) BUSINESSES
The preferred transformation partner to universities around the world
Australasia | North America | Europe
CAREERS AND INDUSTRY (C&I) BUSINESSES
Providing students with a quality, valued education in segments with strong
employment prospects
Creative | Government Programs | Human Services | Health
NAVITAS VENTURES
Scaling ideas and growing teams that unleash human potential and
transform the way the world learns
Incubation | Investment | Partnerships
VISIONTo be universally recognised as one of the world's most trusted learning organisations
CONVICTION DRIVE ADVENTUROUS RIGOUR GENUINE RESPECT
How we create value
Navitas is an Australian headquartered, global education company operating in 31 countries. Guided by its vision, purpose and values, Navitas creates value by providing high quality outcomes and experiences to our students through their learning journey:
This commitment to high quality academic outcomes and student experience covers more than 120 education and training operations in the post-secondary education sector. Navitas also plays a vital economic role in its communities. In FY17 wealth generated by Navitas was distributed as follows:
Cos
ts o
f ser
vices, $251.2m
$955.2m
Group revenue
WORLD CLASS QUALITY
Partner NPS | Contract renewal | Student progression | Employee engagement |
Senior retention
LEADING EFFICIENCY
EBITDA Margin
SUSTAINABLE GROWTH
Student commencements | EFTSU | New partners | EBITDA | EVA®
Product and information
distribution
Completion and graduation
Enquiry and offer management
Timetabling and registration Study and learning
31%
23%
22%
10%
7%
7%
$704.0m
Academic staff University partners Non academic employees
Dividends Reinvested Tax
Wealth created
Wealth created, $704.0m
Navitas Limited Annual Report 2017 011
Navitas operates across three main Divisions, supported by a shared corporate function:
• University Partnerships: provides pre-university, managed campus and university pathway programs that increase students’ access to higher education and prepares them for future success;
• Careers and Industry (formed in FY17 by the merger of the former SAE and Professional and English Programs Divisions): delivers vocational and higher education programs in the creative, government services, human services and health sectors; and
• Navitas Ventures: incubates, invests and partners in emerging education innovation and technology to support the development of newly evolving education models and initiatives.
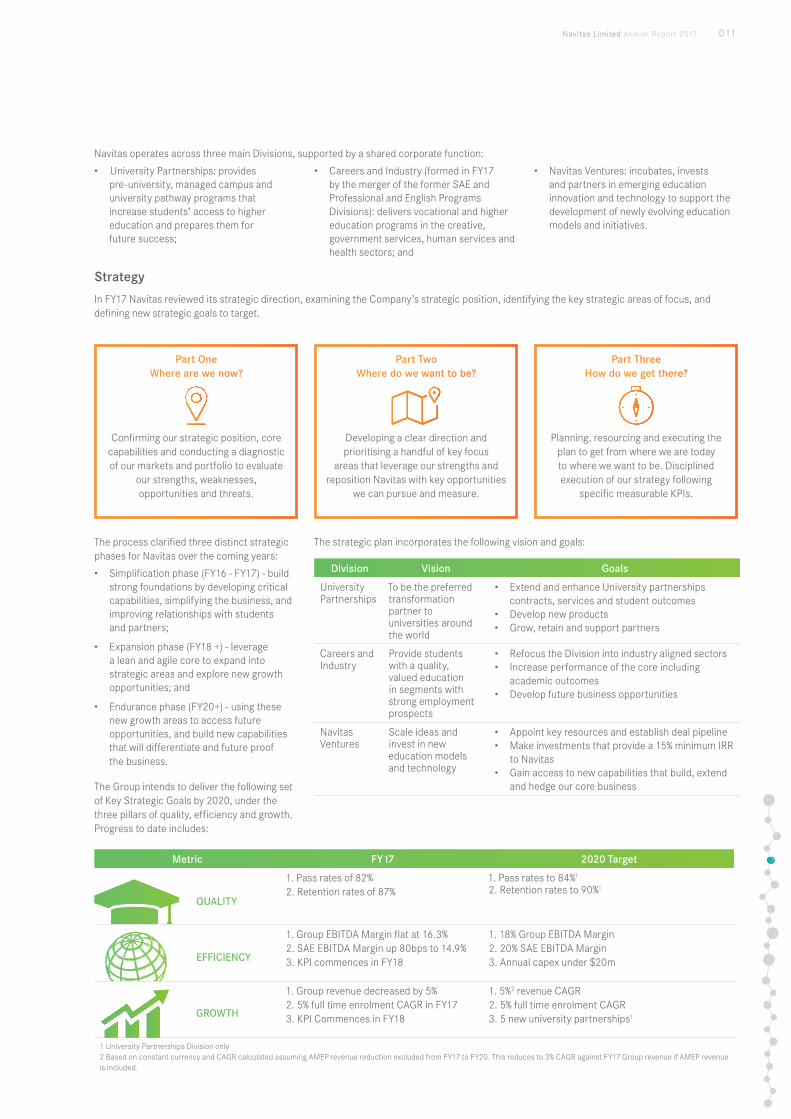
Strategy
In FY17 Navitas reviewed its strategic direction, examining the Company’s strategic position, identifying the key strategic areas of focus, and defining new strategic goals to target.
Part One Where are we now?
Confirming our strategic position, core capabilities and conducting a diagnostic of our markets and portfolio to evaluate
our strengths, weaknesses, opportunities and threats.
Part Two Where do we want to be?
Developing a clear direction and prioritising a handful of key focus
areas that leverage our strengths and reposition Navitas with key opportunities
we can pursue and measure.
Part Three How do we get there?
Planning, resourcing and executing the plan to get from where we are today to where we want to be. Disciplined execution of our strategy following
specific measurable KPIs.
The process clarified three distinct strategic phases for Navitas over the coming years:
• Simplification phase (FY16 - FY17) - build strong foundations by developing critical capabilities, simplifying the business, and improving relationships with students and partners;
• Expansion phase (FY18 +) - leverage a lean and agile core to expand into strategic areas and explore new growth opportunities; and
• Endurance phase (FY20+) - using these new growth areas to access future opportunities, and build new capabilities that will differentiate and future proof the business.
The Group intends to deliver the following set of Key Strategic Goals by 2020, under the three pillars of quality, efficiency and growth. Progress to date includes:
The strategic plan incorporates the following vision and goals:
Division Vision Goals
University Partnerships
To be the preferred transformation partner to universities around the world
• Extend and enhance University partnerships contracts, services and student outcomes
• Develop new products• Grow, retain and support partners
Careers and Industry
Provide students with a quality, valued education in segments with strong employment prospects
• Refocus the Division into industry aligned sectors• Increase performance of the core including
academic outcomes• Develop future business opportunities
Navitas Ventures
Scale ideas and invest in new education models and technology
• Appoint key resources and establish deal pipeline• Make investments that provide a 15% minimum IRR
to Navitas• Gain access to new capabilities that build, extend
and hedge our core business
Metric FY17 2020 Target
1. Pass rates of 82% 2. Retention rates of 87%
1. Pass rates to 84%1 2. Retention rates to 90%1
1. Group EBITDA Margin flat at 16.3% 2. SAE EBITDA Margin up 80bps to 14.9% 3. KPI commences in FY18
1. 18% Group EBITDA Margin 2. 20% SAE EBITDA Margin 3. Annual capex under $20m
1. Group revenue decreased by 5% 2. 5% full time enrolment CAGR in FY17 3. KPI Commences in FY18
1. 5%2 revenue CAGR 2. 5% full time enrolment CAGR 3. 5 new university partnerships1
1 University Partnerships Division only 2 Based on constant currency and CAGR calculated assuming AMEP revenue reduction excluded from FY17 to FY20. This reduces to 3% CAGR against FY17 Group revenue if AMEP revenue is included.
EFFICIENCY
GROWTH
QUALITY
63%10%
9%
8%
6%4%
$955.2m
Australia
US
Canada
UK
EU
ROW
012 Navitas Limited Annual Report 2017
REVIEW OF OPERATIONS
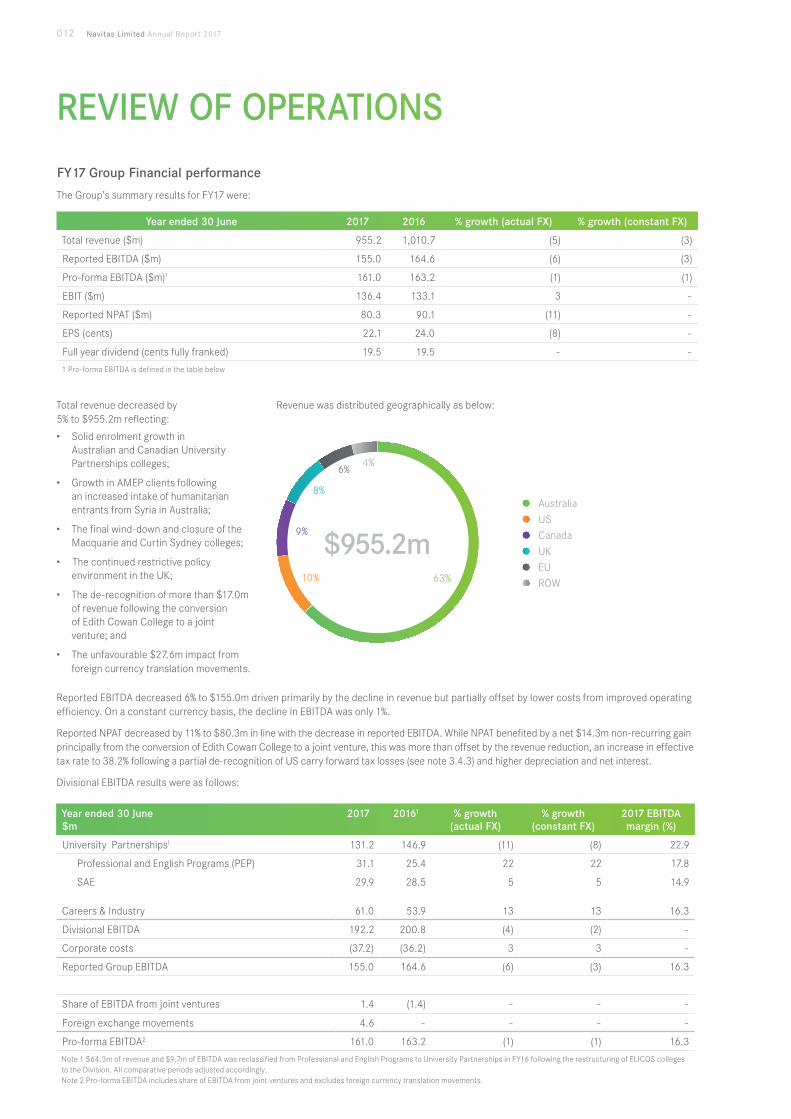
FY17 Group Financial performance
The Group’s summary results for FY17 were:
Year ended 30 June 2017 2016 % growth (actual FX) % growth (constant FX)
Total revenue ($m) 955.2 1,010.7 (5) (3)
Reported EBITDA ($m) 155.0 164.6 (6) (3)
Pro-forma EBITDA ($m)1 161.0 163.2 (1) (1)
EBIT ($m) 136.4 133.1 3 -
Reported NPAT ($m) 80.3 90.1 (11) -
EPS (cents) 22.1 24.0 (8) -
Full year dividend (cents fully franked) 19.5 19.5 - -
1 Pro-forma EBITDA is defined in the table below
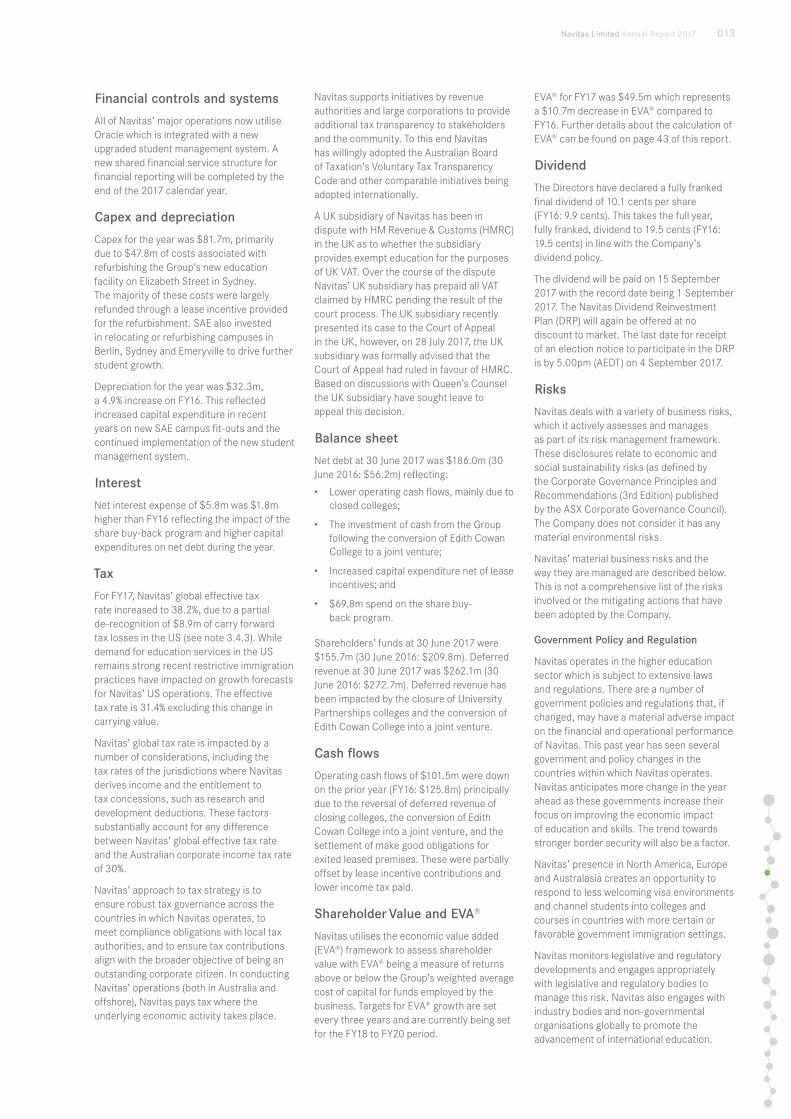
Total revenue decreased by 5% to $955.2m reflecting:
• Solid enrolment growth in Australian and Canadian University Partnerships colleges;
• Growth in AMEP clients following an increased intake of humanitarian entrants from Syria in Australia;
• The final wind-down and closure of the Macquarie and Curtin Sydney colleges;
• The continued restrictive policy environment in the UK;
• The de-recognition of more than $17.0m of revenue following the conversion of Edith Cowan College to a joint venture; and
• The unfavourable $27.6m impact from foreign currency translation movements.
Revenue was distributed geographically as below:
Reported EBITDA decreased 6% to $155.0m driven primarily by the decline in revenue but partially offset by lower costs from improved operating efficiency. On a constant currency basis, the decline in EBITDA was only 1%.
Reported NPAT decreased by 11% to $80.3m in line with the decrease in reported EBITDA. While NPAT benefited by a net $14.3m non-recurring gain principally from the conversion of Edith Cowan College to a joint venture, this was more than offset by the revenue reduction, an increase in effective tax rate to 38.2% following a partial de-recognition of US carry forward tax losses (see note 3.4.3) and higher depreciation and net interest.
Divisional EBITDA results were as follows:
Year ended 30 June$m
2017 20161 % growth (actual FX)
% growth (constant FX)
2017 EBITDA margin (%)
University Partnerships1 131.2 146.9 (11) (8) 22.9
Professional and English Programs (PEP) 31.1 25.4 22 22 17.8
SAE 29.9 28.5 5 5 14.9
Careers & Industry 61.0 53.9 13 13 16.3
Divisional EBITDA 192.2 200.8 (4) (2) -
Corporate costs (37.2) (36.2) 3 3 -
Reported Group EBITDA 155.0 164.6 (6) (3) 16.3
Share of EBITDA from joint ventures 1.4 (1.4) - - -
Foreign exchange movements 4.6 - - - -
Pro-forma EBITDA2 161.0 163.2 (1) (1) 16.3
Note 1 $64.3m of revenue and $9.7m of EBITDA was reclassified from Professional and English Programs to University Partnerships in FY16 following the restructuring of ELICOS colleges to the Division. All comparative periods adjusted accordingly. Note 2 Pro-forma EBITDA includes share of EBITDA from joint ventures and excludes foreign currency translation movements.
Navitas Limited Annual Report 2017 013
Financial controls and systems
All of Navitas’ major operations now utilise Oracle which is integrated with a new upgraded student management system. A new shared financial service structure for financial reporting will be completed by the end of the 2017 calendar year.
Capex and depreciation
Capex for the year was $81.7m, primarily due to $47.8m of costs associated with refurbishing the Group’s new education facility on Elizabeth Street in Sydney. The majority of these costs were largely refunded through a lease incentive provided for the refurbishment. SAE also invested in relocating or refurbishing campuses in Berlin, Sydney and Emeryville to drive further student growth.
Depreciation for the year was $32.3m, a 4.9% increase on FY16. This reflected increased capital expenditure in recent years on new SAE campus fit-outs and the continued implementation of the new student management system.
Interest
Net interest expense of $5.8m was $1.8m higher than FY16 reflecting the impact of the share buy-back program and higher capital expenditures on net debt during the year.
Tax
For FY17, Navitas’ global effective tax rate increased to 38.2%, due to a partial de-recognition of $8.9m of carry forward tax losses in the US (see note 3.4.3). While demand for education services in the US remains strong recent restrictive immigration practices have impacted on growth forecasts for Navitas’ US operations. The effective tax rate is 31.4% excluding this change in carrying value.
Navitas’ global tax rate is impacted by a number of considerations, including the tax rates of the jurisdictions where Navitas derives income and the entitlement to tax concessions, such as research and development deductions. These factors substantially account for any difference between Navitas’ global effective tax rate and the Australian corporate income tax rate of 30%.
Navitas’ approach to tax strategy is to ensure robust tax governance across the countries in which Navitas operates, to meet compliance obligations with local tax authorities, and to ensure tax contributions align with the broader objective of being an outstanding corporate citizen. In conducting Navitas’ operations (both in Australia and offshore), Navitas pays tax where the underlying economic activity takes place.
Navitas supports initiatives by revenue authorities and large corporations to provide additional tax transparency to stakeholders and the community. To this end Navitas has willingly adopted the Australian Board of Taxation’s Voluntary Tax Transparency Code and other comparable initiatives being adopted internationally.
A UK subsidiary of Navitas has been in dispute with HM Revenue & Customs (HMRC) in the UK as to whether the subsidiary provides exempt education for the purposes of UK VAT. Over the course of the dispute Navitas’ UK subsidiary has prepaid all VAT claimed by HMRC pending the result of the court process. The UK subsidiary recently presented its case to the Court of Appeal in the UK, however, on 28 July 2017, the UK subsidiary was formally advised that the Court of Appeal had ruled in favour of HMRC. Based on discussions with Queen's Counsel the UK subsidiary have sought leave to appeal this decision.
Balance sheet
Net debt at 30 June 2017 was $186.0m (30 June 2016: $56.2m) reflecting:
• Lower operating cash flows, mainly due to closed colleges;
• The investment of cash from the Group following the conversion of Edith Cowan College to a joint venture;
• Increased capital expenditure net of lease incentives; and
• $69.8m spend on the share buy-back program.
Shareholders’ funds at 30 June 2017 were $155.7m (30 June 2016: $209.8m). Deferred revenue at 30 June 2017 was $262.1m (30 June 2016: $272.7m). Deferred revenue has been impacted by the closure of University Partnerships colleges and the conversion of Edith Cowan College into a joint venture.
Cash flows
Operating cash flows of $101.5m were down on the prior year (FY16: $125.8m) principally due to the reversal of deferred revenue of closing colleges, the conversion of Edith Cowan College into a joint venture, and the settlement of make good obligations for exited leased premises. These were partially offset by lease incentive contributions and lower income tax paid.
Shareholder Value and EVA®
Navitas utilises the economic value added (EVA®) framework to assess shareholder value with EVA® being a measure of returns above or below the Group’s weighted average cost of capital for funds employed by the business. Targets for EVA® growth are set every three years and are currently being set for the FY18 to FY20 period.
EVA® for FY17 was $49.5m which represents a $10.7m decrease in EVA® compared to FY16. Further details about the calculation of EVA® can be found on page 43 of this report.
Dividend
The Directors have declared a fully franked final dividend of 10.1 cents per share (FY16: 9.9 cents). This takes the full year, fully franked, dividend to 19.5 cents (FY16: 19.5 cents) in line with the Company’s dividend policy.
The dividend will be paid on 15 September 2017 with the record date being 1 September 2017. The Navitas Dividend Reinvestment Plan (DRP) will again be offered at no discount to market. The last date for receipt of an election notice to participate in the DRP is by 5.00pm (AEDT) on 4 September 2017.
Risks
Navitas deals with a variety of business risks, which it actively assesses and manages as part of its risk management framework. These disclosures relate to economic and social sustainability risks (as defined by the Corporate Governance Principles and Recommendations (3rd Edition) published by the ASX Corporate Governance Council). The Company does not consider it has any material environmental risks.
Navitas’ material business risks and the way they are managed are described below. This is not a comprehensive list of the risks involved or the mitigating actions that have been adopted by the Company.
Government Policy and Regulation
Navitas operates in the higher education sector which is subject to extensive laws and regulations. There are a number of government policies and regulations that, if changed, may have a material adverse impact on the financial and operational performance of Navitas. This past year has seen several government and policy changes in the countries within which Navitas operates. Navitas anticipates more change in the year ahead as these governments increase their focus on improving the economic impact of education and skills. The trend towards stronger border security will also be a factor.
Navitas’ presence in North America, Europe and Australasia creates an opportunity to respond to less welcoming visa environments and channel students into colleges and courses in countries with more certain or favorable government immigration settings.
Navitas monitors legislative and regulatory developments and engages appropriately with legislative and regulatory bodies to manage this risk. Navitas also engages with industry bodies and non-governmental organisations globally to promote the advancement of international education.

014 Navitas Limited Annual Report 2017
Licences and Accreditation
If Navitas is unable to secure or retain licences or accreditations for the operation of its courses, colleges or campuses (where required) in the future, or any of its existing licences or accreditations are adversely amended or revoked, this may adversely impact Navitas’ ability to operate its businesses. This risk is mitigated by Navitas’ comprehensive quality and compliance framework which seeks to ensure that operations are conducted to the standards required to retain licences and accreditation.
Impact of Competition and Innovation
Navitas’ core business of running pathway programs is underpinned by a nurturing face-to-face learning environment for international students which provides a range of benefits to integrate students into a foreign country and a university education. However, like many sectors, the higher education sector is subject to increased competition and disruption, requiring a need to innovate to remain a market leader. Navitas must always innovate to stay relevant to prospective and current students and its university and business partners.
Navitas conducts internal reviews of existing service offerings and potential growth markets to maintain competitive advantage and has a dedicated business intelligence function which provides insights and intelligence on higher education trends and growth opportunities. Navitas Ventures also provides a means for Navitas to invest in new income streams, including innovative EduTech.
Protection of Information
Navitas collects, stores and processes student and business partners’ information. Navitas then has the ability to access and transmit that information to and from its students and business partners. In response to the evolving cyber threats which all organisations face nowadays, Navitas has an ongoing, global program of works which is designed to reduce the information risks to our business, our students and our business partners. We continually prioritise this work, but in general, we implement security controls across our people, our processes and our technologies based on highest potential impact.
Market Dependency
There are varying degrees of political, judicial and environmental stability in source countries where our prospective students originate and also the destination countries in which Navitas operates from.
If a major political or natural event occurred, it may limit or restrict for a short to medium period the freedom of movement for students from source countries or into destination countries. One or more of these events could have a negative effect on our ability to source students into our educational programs, as well as the Company’s overall student enrolments and financial results. Navitas utilises a broad network of source country offices and agents to ensure a reliable flow of students across a wide geography is maintained.
Partner Relationships
Navitas works with a variety of partners including industry bodies, regulators, service providers, governments and partner universities for core business operations. All parties maximise the benefits when there is a strong relationship. There are a number of events which could affect the relationship, including: strategic misalignment; student, business and compliance performance; and commercial differences.
Key executives of the Navitas Group and business managers are accountable for the health and management of relationships within their portfolios. Navitas has maintained a consistent management team across its University Partnerships Division and pathway colleges, with many College Director/Principals serving long tenures in the role. The Careers and Industry Division aligns its operations with industry bodies, regulators and governments. Globally operations are supported by a centralised Corporate Affairs team.
Navitas uses a range of formal and informal processes, both internal and external, to monitor, assess, improve and add value to partnerships and relationships. Metrics to measure relationships with key stakeholders and student outcomes are gathered at regular intervals.
Contract Renewal
The core of Navitas operations is based on contractual relationships with University Partners, Commonwealth and State Governments and Industry Partners. Each contract has a fixed term requiring renewal or extension of terms, conditions, the scope and tenure period. From time to time some contracts are not retained, either in full or to the extent they were previously. This was the case with the AMEP and SEE contracts where the new contract allocated fewer hours for content delivery and awarded Navitas fewer contract regions. This will result in a reduction in Navitas revenue generated from this contract. Navitas takes a disciplined approach to contract renewal. Accountability for ongoing partner relationships is assigned to Company executives and regular updates are provided to the Navitas Board.
REVIEW OF OPERATIONS (CONTINUED)

Navitas Limited Annual Report 2017 015

016 Navitas Limited Annual Report 2017
23.6%
22.7%
23.5%23.1%
22.9%
24
23
22
21FY13 FY14 FY15 FY16 FY17
University Partnerships EBITDA Margin 22.9%
111.9
127.3
147.8
146.9
131.3
150
120
90FY13 FY14 FY15 FY16 FY17
474.9
560.6
628.2
635.4
574.1
700
600
500
400FY13 FY14 FY15 FY16 FY17
University Partnerships Revenue $574.1m
Navitas Limited Annual Report 2017 017
QUALITY EFFICIENCY GROWTH
ABOUT OUR BUSINESSES UNIVERSITY PARTNERSHIPS DIVISION
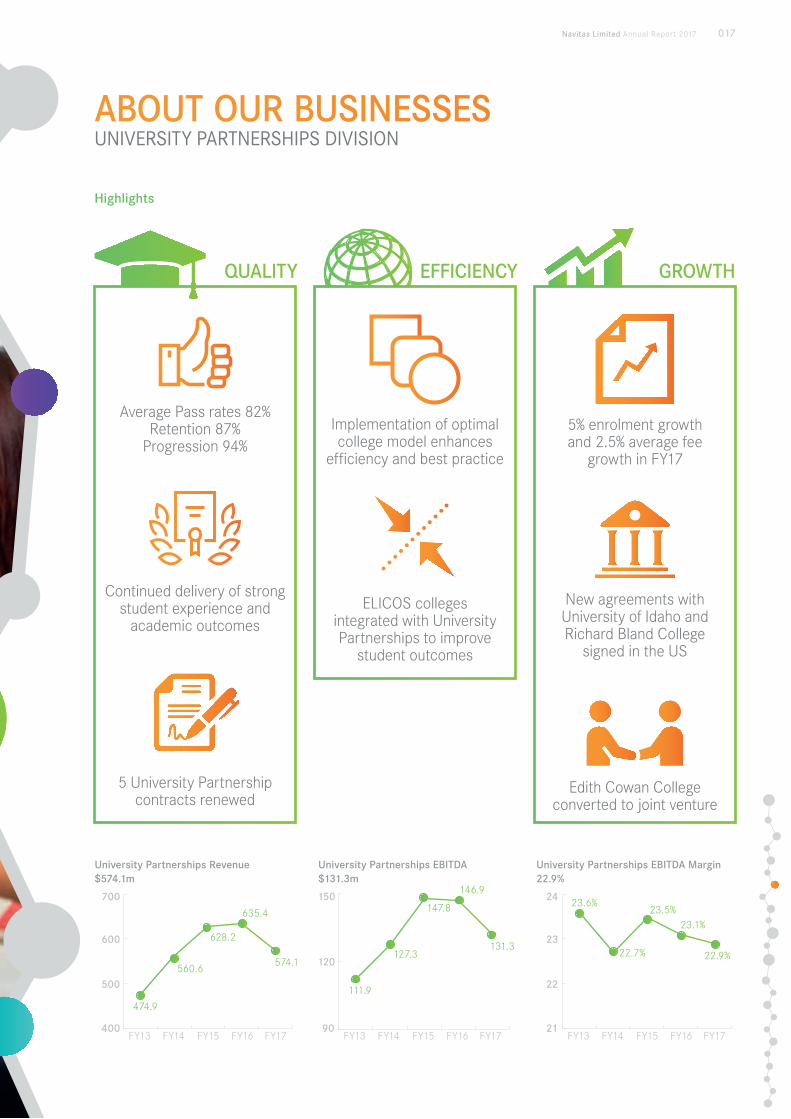
Highlights
ELICOS colleges integrated with University Partnerships to improve
student outcomes
Implementation of optimal college model enhances
efficiency and best practice
Edith Cowan College converted to joint venture
University Partnerships EBITDA $131.3m
Continued delivery of strong student experience and
academic outcomes
Average Pass rates 82% Retention 87%
Progression 94%
5 University Partnership contracts renewed
5% enrolment growth and 2.5% average fee
growth in FY17
New agreements with University of Idaho and Richard Bland College
signed in the US
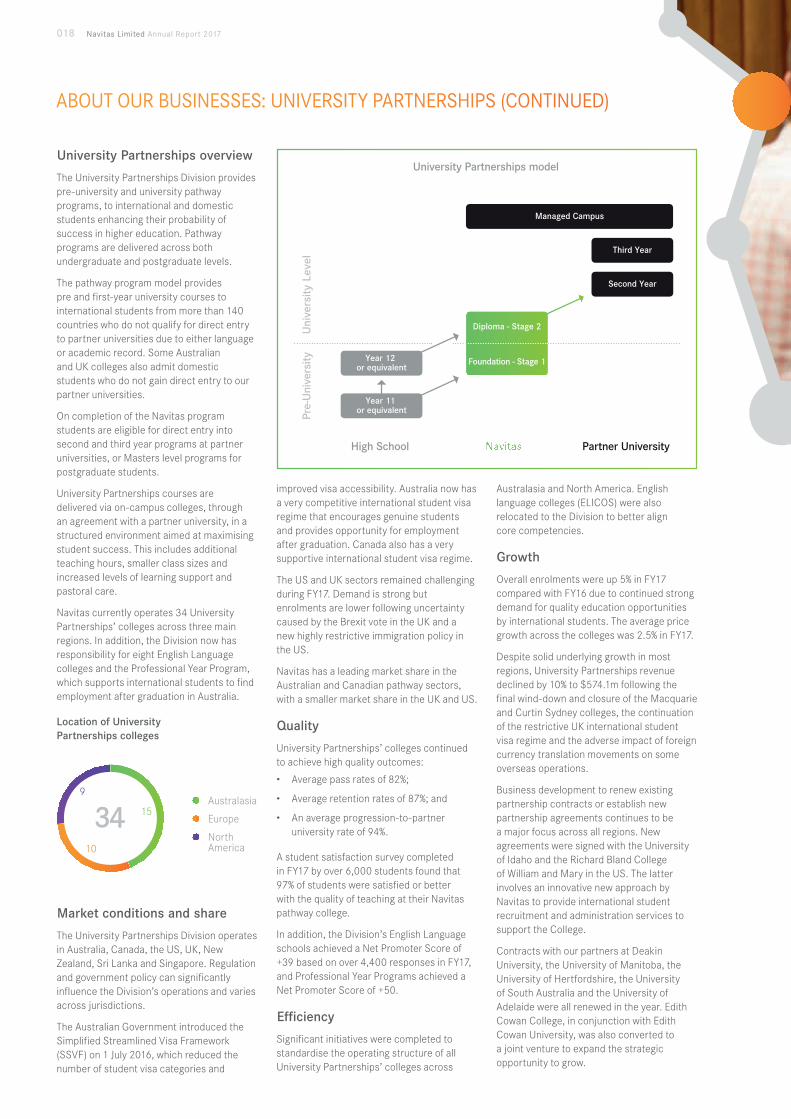
University Partnerships overview
The University Partnerships Division provides pre-university and university pathway programs, to international and domestic students enhancing their probability of success in higher education. Pathway programs are delivered across both undergraduate and postgraduate levels.
The pathway program model provides pre and first-year university courses to international students from more than 140 countries who do not qualify for direct entry to partner universities due to either language or academic record. Some Australian and UK colleges also admit domestic students who do not gain direct entry to our partner universities.
On completion of the Navitas program students are eligible for direct entry into second and third year programs at partner universities, or Masters level programs for postgraduate students.
University Partnerships courses are delivered via on-campus colleges, through an agreement with a partner university, in a structured environment aimed at maximising student success. This includes additional teaching hours, smaller class sizes and increased levels of learning support and pastoral care.
Navitas currently operates 34 University Partnerships’ colleges across three main regions. In addition, the Division now has responsibility for eight English Language colleges and the Professional Year Program, which supports international students to find employment after graduation in Australia.
Location of University Partnerships colleges
Market conditions and share
The University Partnerships Division operates in Australia, Canada, the US, UK, New Zealand, Sri Lanka and Singapore. Regulation and government policy can significantly influence the Division’s operations and varies across jurisdictions.
The Australian Government introduced the Simplified Streamlined Visa Framework (SSVF) on 1 July 2016, which reduced the number of student visa categories and
improved visa accessibility. Australia now has a very competitive international student visa regime that encourages genuine students and provides opportunity for employment after graduation. Canada also has a very supportive international student visa regime.
The US and UK sectors remained challenging during FY17. Demand is strong but enrolments are lower following uncertainty caused by the Brexit vote in the UK and a new highly restrictive immigration policy in the US.
Navitas has a leading market share in the Australian and Canadian pathway sectors, with a smaller market share in the UK and US.
Quality
University Partnerships’ colleges continued to achieve high quality outcomes:
• Average pass rates of 82%;
• Average retention rates of 87%; and
• An average progression-to-partner university rate of 94%.
A student satisfaction survey completed in FY17 by over 6,000 students found that 97% of students were satisfied or better with the quality of teaching at their Navitas pathway college.
In addition, the Division’s English Language schools achieved a Net Promoter Score of +39 based on over 4,400 responses in FY17, and Professional Year Programs achieved a Net Promoter Score of +50.
Efficiency
Significant initiatives were completed to standardise the operating structure of all University Partnerships’ colleges across
Australasia and North America. English language colleges (ELICOS) were also relocated to the Division to better align core competencies.
Growth
Overall enrolments were up 5% in FY17 compared with FY16 due to continued strong demand for quality education opportunities by international students. The average price growth across the colleges was 2.5% in FY17.
Despite solid underlying growth in most regions, University Partnerships revenue declined by 10% to $574.1m following the final wind-down and closure of the Macquarie and Curtin Sydney colleges, the continuation of the restrictive UK international student visa regime and the adverse impact of foreign currency translation movements on some overseas operations.
Business development to renew existing partnership contracts or establish new partnership agreements continues to be a major focus across all regions. New agreements were signed with the University of Idaho and the Richard Bland College of William and Mary in the US. The latter involves an innovative new approach by Navitas to provide international student recruitment and administration services to support the College.
Contracts with our partners at Deakin University, the University of Manitoba, the University of Hertfordshire, the University of South Australia and the University of Adelaide were all renewed in the year. Edith Cowan College, in conjunction with Edith Cowan University, was also converted to a joint venture to expand the strategic opportunity to grow.
Pre-
Uni
vers
ityU
nive
rsity
Lev
el
Foundation - Stage 1
Diploma - Stage 2
High School
Year 12 or equivalent
Year 11 or equivalent
Partner University
Second Year
Managed Campus
Third Year
15
10
9
34 Australasia
Europe
North America
ABOUT OUR BUSINESSES: UNIVERSITY PARTNERSHIPS (CONTINUED)
018 Navitas Limited Annual Report 2017

Navitas Limited Annual Report 2017 019
Progress against strategy
In FY17 Navitas released its revised strategic direction and vision for the University Partnerships Division. Progress to date against that strategy is outlined in the table below.
University Partnerships vision - To be the preferred transformation partner to universities around the world
FY17 progress By 2020
Extend and enhance University partnerships contracts, services and student outcomes
9 High pass, retention and progression-to-university rates maintained
9 SAIBT, Eynesbury, HIBT, ICM and Deakin contracts renewed
9 Optimal College model completed in Australia and North America
9 Sales and Marketing transformation program underway
• Continue to improve/maintain high pass, retention and progression rates
• In FY18 renew all due contracts – Anglia Ruskin University (Nov), Swansea University (Nov), Curtin University (Curtin College - Dec, Singapore - Mar), Brunel (Jan)
• Complete optimal college model in Europe in FY18
• Complete the implementation of Sales and Marketing transformation initiatives including the rollout of an improved student recruitment platform
• Improve Division efficiency and margin
Develop new products 9 New programs in Engineering, Health Sciences and Sports Science
9 English language programs and Internships business now integrated
• Expand new programs and products to partners
• Explore pathways-to-employment offering and work integrated learning
Grow, retain and support partners 9 Signed new agreements with the University of Idaho and the Richard Bland College of William and Mary
9 Strong business development pipeline
9 Edith Cowan College converted to joint venture model
• Sign 5 new university partners by 2020• Maintain strong business development pipeline • Expand suite of pathway solutions • Explore a variety of models to suit different needs of
university partners• Develop and target transformation offerings
for partners

020 Navitas Limited Annual Report 2017
Navitas Limited Annual Report 2017 021
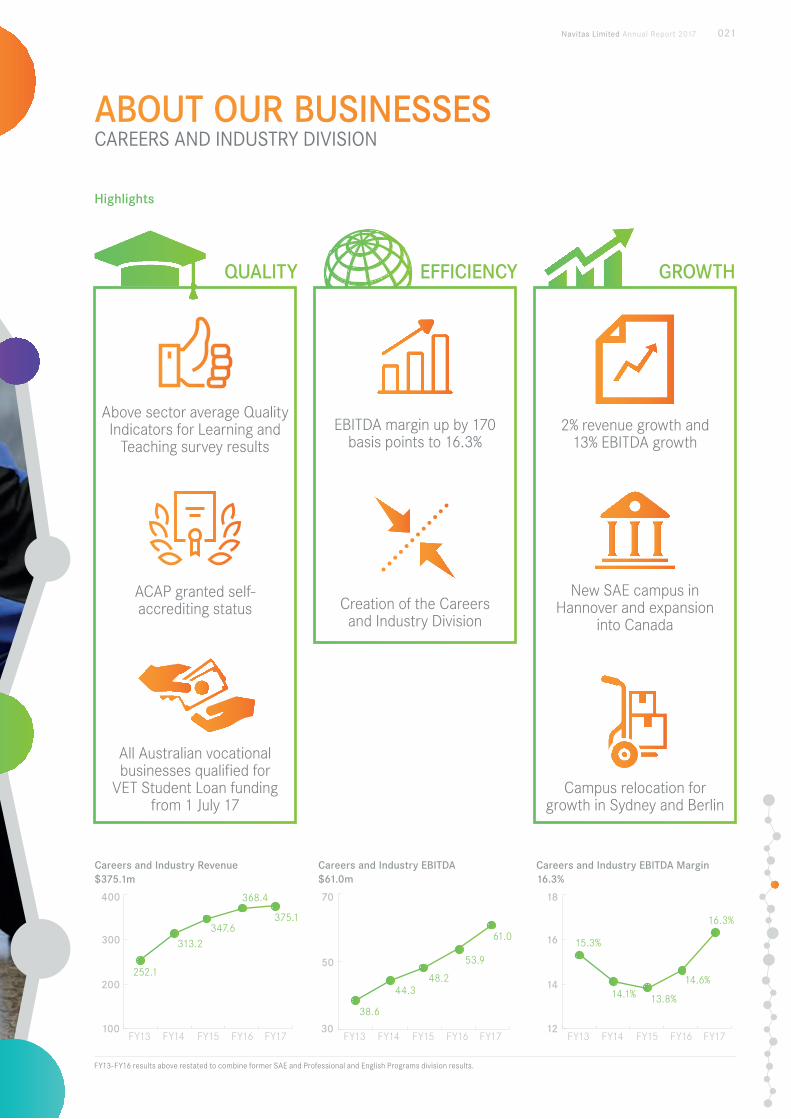
15.3%
14.1% 13.8%
14.6%
16.3%
18
16
14
12FY13 FY14 FY15 FY16 FY17
Careers and Industry EBITDA Margin 16.3%
38.6
44.348.2
53.9
61.0
70
50
30FY13 FY14 FY15 FY16 FY17
252.1
313.2347.6
368.4
375.1
400
300
200
100FY13 FY14 FY15 FY16 FY17
Careers and Industry Revenue $375.1m
QUALITY EFFICIENCY GROWTH
ABOUT OUR BUSINESSES CAREERS AND INDUSTRY DIVISION
Highlights
Creation of the Careers and Industry Division
EBITDA margin up by 170 basis points to 16.3%
Campus relocation for growth in Sydney and Berlin
Careers and Industry EBITDA $61.0m
ACAP granted self-accrediting status
Above sector average Quality Indicators for Learning and
Teaching survey results
All Australian vocational businesses qualified for
VET Student Loan funding from 1 July 17
2% revenue growth and 13% EBITDA growth
New SAE campus in Hannover and expansion
into Canada
FY13-FY16 results above restated to combine former SAE and Professional and English Programs division results.

ABOUT OUR BUSINESSES: CAREERS AND INDUSTRY (CONTINUED)
022 Navitas Limited Annual Report 2017
Careers and Industry overview
Created in January 2017 with the merger of the former SAE and Professional and English Programs Divisions, the Careers and Industry Division delivers tertiary to post graduate level programs across several sectors:
• Creative: delivers a range of predominantly Higher Education programs via the SAE chain of creative media colleges across several major fields of study: audio, film, animation, gaming, design, and web. SAE is one of the world’s largest creative media education companies, with 51 campuses across 26 countries.
• Government services: delivers the Australian Government’s AMEP and the SEE program across Australia.
• Human Services: delivered by the ACAP and the NCPS, courses include diploma to higher education programs in psychology, counselling, social work and criminal justice.
• Health: delivered by HSA including a diploma in Nursing.
All colleges and campuses across the Division are industry orientated with a focus on the delivery of strong employment outcomes and with curricula that are fully owned by Navitas. Students are predominantly domestic students.
Market conditions and share
The Careers and Industry Division operates across multiple jurisdictions, including the UK, US and Europe, though most of its operations are in Australia.
While higher education policy in Australia remained supportive, widespread reforms to Commonwealth vocational education funding were introduced in January 2017. Known as VET Student Loans (VSL), it is likely that these vocational education reforms will continue to impact enrolments in Australian based Careers and Industry businesses in the medium term.
Ongoing reforms to national accrediting bodies in the US have resulted in the need for several US SAE colleges to change accreditors thereby slowing the ongoing approval process for new student programs that are available for launch.
In March 2017, the Commonwealth Department of Education and Training announced that it had awarded Navitas with a significantly reduced number of contract regions to deliver the AMEP from 1 July 2017, following its tender process. It is now anticipated that this reduction will result in a decrease in EBITDA of $14.0m for the Careers and Industry Division in FY18.
SAE UK had its appeal rejected by the Court of Appeal regarding its VAT exemption status and is seeking leave to appeal this decision. However, SAE’s UK colleges were restructured to operate profitably without an exemption ahead of the outcome.
Quality
A commitment to quality outcomes is reflected in high Net Promoter Scores and strong student experience survey results compared to the wider higher education sector.
ACAP and NCPS achieved above-average results in the 2017 Australian Quality Indicators for Learning and Teaching survey in many areas including skills development (+5%), teaching quality (+5%) and graduate satisfaction (+6%).
SAE achieved higher than sector-average scores in the same survey in the areas of student support (+11%), skills development (+4%) and teaching quality (+3%). Additionally over 90% of students surveyed at SAE globally were satisfied with both academic support levels and the relevancy of teaching content to a career in the industry.
Following the changes to vocational funding in Australia, all Careers and Industry businesses gained accreditation to access the new VSL funding regime, meaning that all Australian students can access federal funding to support their studies from 1 July 2017.
Finally ACAP was reaccredited by TEQSA as a Higher Education Provider for the maximum seven years period and was also awarded self-accrediting authority. This gives ACAP the authority to self-accredit courses through to Masters level across a range of
programs, significantly reducing course development timeframes.
Efficiency
The creation of the Careers and Industry Division generated efficiencies that helped contribute to an improved EBITDA margin of 16.3%, 170 basis points higher than FY16. An ongoing focus on cost control and efficiency across all business divisions and improved leverage in some Australian and US campuses also supported the margin improvement. Four sub-scale SAE campuses were closed in FY17 following a detailed portfolio review.
Growth
SAE started construction on a new campus in Hannover, Germany, and relocated or refurbished a number of campuses, including Sydney and Berlin, to allow for greater growth. SAE also acquired a small creative media education business in Vancouver to enter the growing Canadian creative media education sector.
Careers and Industry revenue increased 2% to $375.1m, largely due to a one-off increase in humanitarian entrants into Australia’s Adult Migrant English Program which the Division manages in NSW. SAE revenues continued to grow by 8% in Australia and 6% in the US but these were offset by tougher conditions in its European campuses and by adverse foreign currency translation movements for overseas operations. EBITDA grew by 13% to $61.0m following improved cost control across SAE.
Creative
Brand: SAE
• Global SAE operations• 51 campuses globally• Licensed territories
Government Services
Brand: AMEP, SEE
• Language, Literacy and Numeracy• Employment services
Human Services
Brand: ACAP, NCPS
• Counselling• Psychological
Services• Social Work• Criminal Justice• Youth Work• Community Services
Health
Brand: HSA
• Nursing (Diploma)
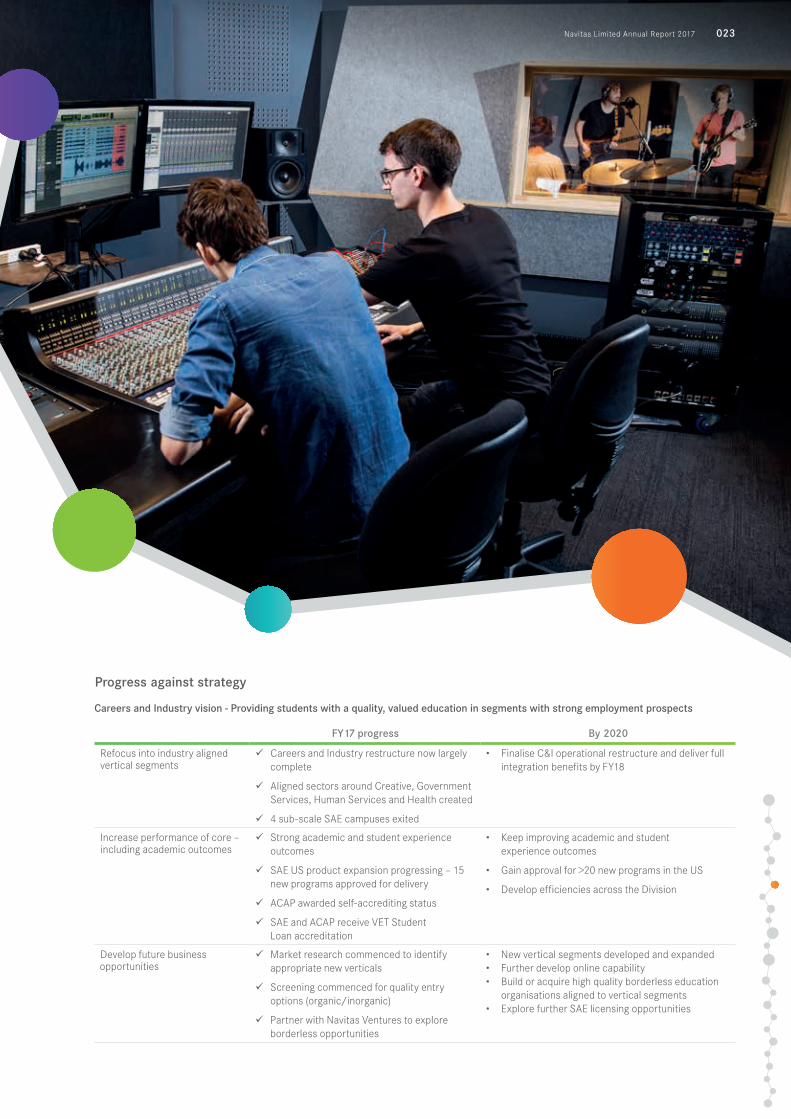
Navitas Limited Annual Report 2017 023
Progress against strategy
Careers and Industry vision - Providing students with a quality, valued education in segments with strong employment prospects
FY17 progress By 2020
Refocus into industry aligned vertical segments
9 Careers and Industry restructure now largely complete
9 Aligned sectors around Creative, Government Services, Human Services and Health created
9 4 sub-scale SAE campuses exited
• Finalise C&I operational restructure and deliver full integration benefits by FY18
Increase performance of core – including academic outcomes
9 Strong academic and student experience outcomes
9 SAE US product expansion progressing – 15 new programs approved for delivery
9 ACAP awarded self-accrediting status
9 SAE and ACAP receive VET Student Loan accreditation
• Keep improving academic and student experience outcomes
• Gain approval for >20 new programs in the US
• Develop efficiencies across the Division
Develop future business opportunities
9 Market research commenced to identify appropriate new verticals
9 Screening commenced for quality entry options (organic/inorganic)
9 Partner with Navitas Ventures to explore borderless opportunities
• New vertical segments developed and expanded• Further develop online capability • Build or acquire high quality borderless education
organisations aligned to vertical segments• Explore further SAE licensing opportunities
024 Navitas Limited Annual Report 2017
ABOUT OUR BUSINESSES NAVITAS VENTURES
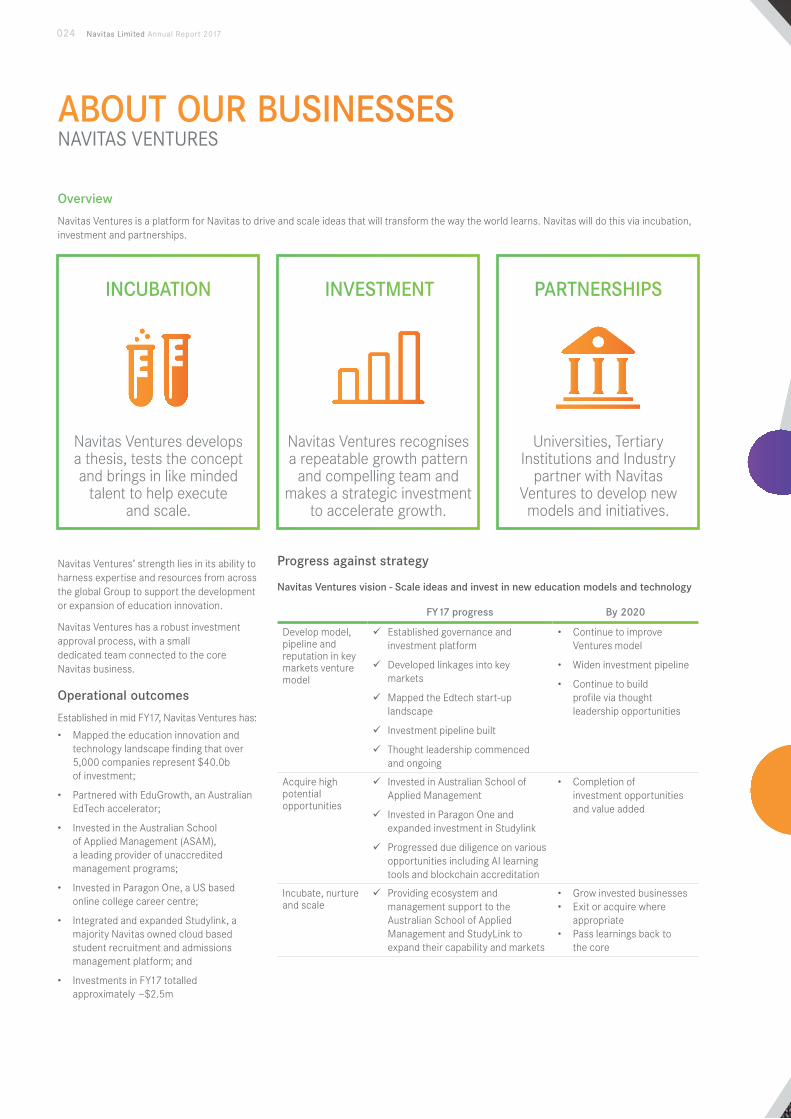
Overview
Navitas Ventures is a platform for Navitas to drive and scale ideas that will transform the way the world learns. Navitas will do this via incubation, investment and partnerships.
Navitas Ventures’ strength lies in its ability to harness expertise and resources from across the global Group to support the development or expansion of education innovation.
Navitas Ventures has a robust investment approval process, with a small dedicated team connected to the core Navitas business.
Operational outcomes
Established in mid FY17, Navitas Ventures has:
• Mapped the education innovation and technology landscape finding that over 5,000 companies represent $40.0b of investment;
• Partnered with EduGrowth, an Australian EdTech accelerator;
• Invested in the Australian School of Applied Management (ASAM), a leading provider of unaccredited management programs;
• Invested in Paragon One, a US based online college career centre;
• Integrated and expanded Studylink, a majority Navitas owned cloud based student recruitment and admissions management platform; and
• Investments in FY17 totalled approximately ~$2.5m
Progress against strategy
Navitas Ventures vision - Scale ideas and invest in new education models and technology
FY17 progress By 2020
Develop model, pipeline and reputation in key markets venture model
9 Established governance and investment platform
9 Developed linkages into key markets
9 Mapped the Edtech start-up landscape
9 Investment pipeline built
9 Thought leadership commenced and ongoing
• Continue to improve Ventures model
• Widen investment pipeline
• Continue to build profile via thought leadership opportunities
Acquire high potential opportunities
9 Invested in Australian School of Applied Management
9 Invested in Paragon One and expanded investment in Studylink
9 Progressed due diligence on various opportunities including AI learning tools and blockchain accreditation
• Completion of investment opportunities and value added
Incubate, nurture and scale
9 Providing ecosystem and management support to the Australian School of Applied Management and StudyLink to expand their capability and markets
• Grow invested businesses• Exit or acquire where
appropriate• Pass learnings back to
the core
INCUBATION INVESTMENT PARTNERSHIPS
Navitas Ventures recognises a repeatable growth pattern
and compelling team and makes a strategic investment
to accelerate growth.
Navitas Ventures develops a thesis, tests the concept and brings in like minded
talent to help execute and scale.
Universities, Tertiary Institutions and Industry
partner with Navitas Ventures to develop new models and initiatives.

Navitas Limited Annual Report 2017 025
026 Navitas Limited Annual Report 2017
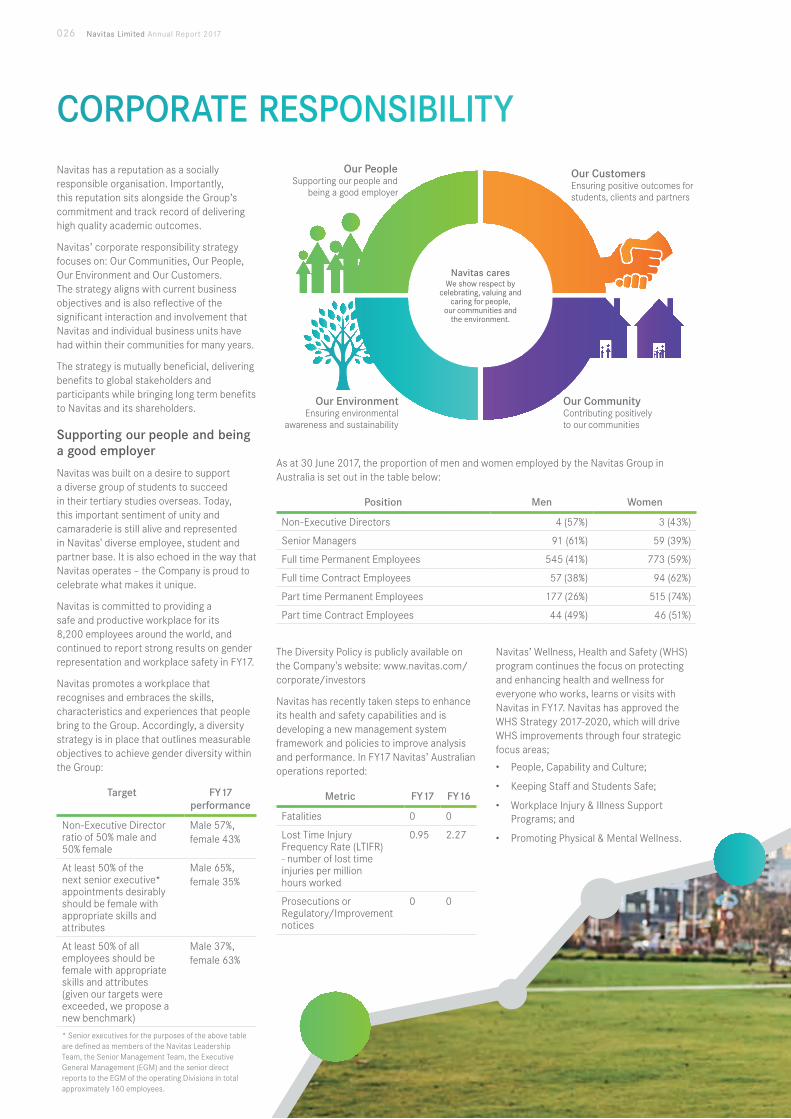
CORPORATE RESPONSIBILITYNavitas has a reputation as a socially responsible organisation. Importantly, this reputation sits alongside the Group’s commitment and track record of delivering high quality academic outcomes.
Navitas’ corporate responsibility strategy focuses on: Our Communities, Our People, Our Environment and Our Customers. The strategy aligns with current business objectives and is also reflective of the significant interaction and involvement that Navitas and individual business units have had within their communities for many years.
The strategy is mutually beneficial, delivering benefits to global stakeholders and participants while bringing long term benefits to Navitas and its shareholders.
Supporting our people and being a good employer
Navitas was built on a desire to support a diverse group of students to succeed in their tertiary studies overseas. Today, this important sentiment of unity and camaraderie is still alive and represented in Navitas' diverse employee, student and partner base. It is also echoed in the way that Navitas operates – the Company is proud to celebrate what makes it unique.
Navitas is committed to providing a safe and productive workplace for its 8,200 employees around the world, and continued to report strong results on gender representation and workplace safety in FY17.
Navitas promotes a workplace that recognises and embraces the skills, characteristics and experiences that people bring to the Group. Accordingly, a diversity strategy is in place that outlines measurable objectives to achieve gender diversity within the Group:
Target FY17 performance
Non-Executive Director ratio of 50% male and 50% female
Male 57%, female 43%
At least 50% of the next senior executive* appointments desirably should be female with appropriate skills and attributes
Male 65%, female 35%
At least 50% of all employees should be female with appropriate skills and attributes (given our targets were exceeded, we propose a new benchmark)
Male 37%, female 63%
* Senior executives for the purposes of the above table are defined as members of the Navitas Leadership Team, the Senior Management Team, the Executive General Management (EGM) and the senior direct reports to the EGM of the operating Divisions in total approximately 160 employees.
As at 30 June 2017, the proportion of men and women employed by the Navitas Group in Australia is set out in the table below:
Position Men Women
Non-Executive Directors 4 (57%) 3 (43%)
Senior Managers 91 (61%) 59 (39%)
Full time Permanent Employees 545 (41%) 773 (59%)
Full time Contract Employees 57 (38%) 94 (62%)
Part time Permanent Employees 177 (26%) 515 (74%)
Part time Contract Employees 44 (49%) 46 (51%)
The Diversity Policy is publicly available on the Company's website: www.navitas.com/corporate/investors
Navitas has recently taken steps to enhance its health and safety capabilities and is developing a new management system framework and policies to improve analysis and performance. In FY17 Navitas’ Australian operations reported:
Metric FY17 FY16
Fatalities 0 0
Lost Time Injury Frequency Rate (LTIFR) - number of lost time injuries per million hours worked
0.95 2.27
Prosecutions or Regulatory/Improvement notices
0 0
Navitas’ Wellness, Health and Safety (WHS) program continues the focus on protecting and enhancing health and wellness for everyone who works, learns or visits with Navitas in FY17. Navitas has approved the WHS Strategy 2017-2020, which will drive WHS improvements through four strategic focus areas;
• People, Capability and Culture;
• Keeping Staff and Students Safe;
• Workplace Injury & Illness Support Programs; and
• Promoting Physical & Mental Wellness.
Our EnvironmentEnsuring environmental
awareness and sustainability
Our PeopleSupporting our people and
being a good employer
Our CommunityContributing positively to our communities
Our CustomersEnsuring positive outcomes for students, clients and partners
Navitas caresWe show respect by
celebrating, valuing and caring for people,
our communities and the environment.
Navitas Limited Annual Report 2017 027
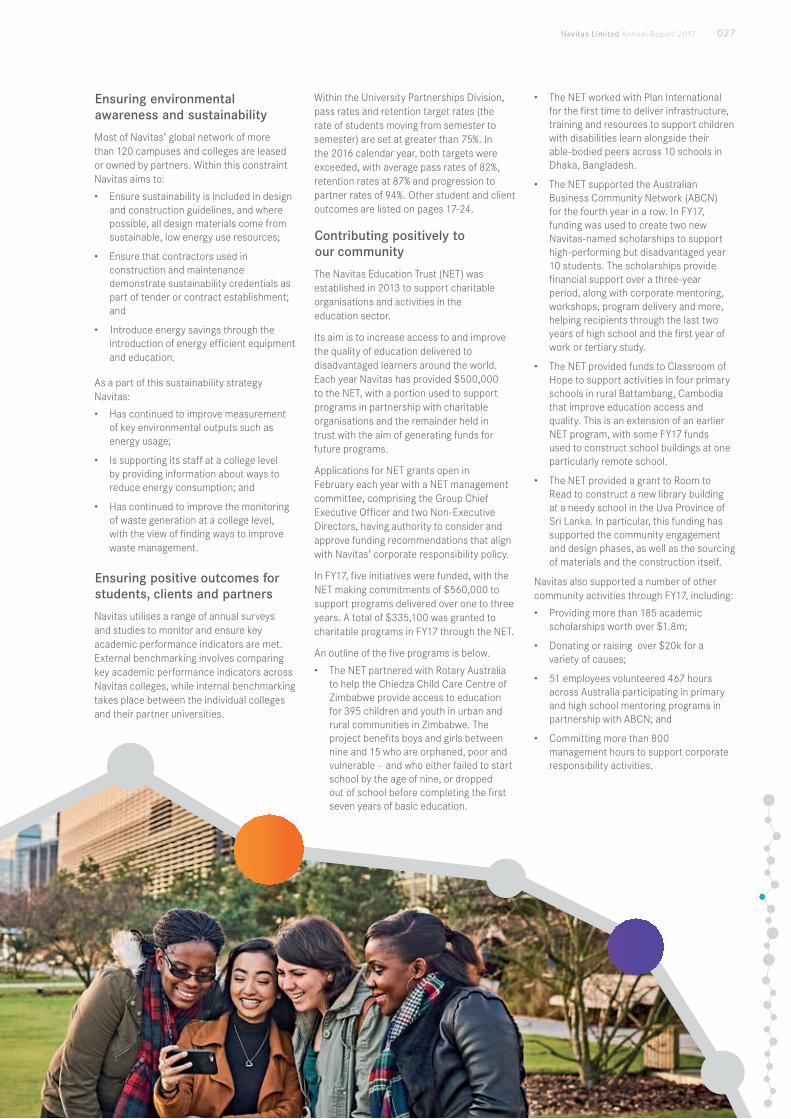
Ensuring environmental awareness and sustainability
Most of Navitas’ global network of more than 120 campuses and colleges are leased or owned by partners. Within this constraint Navitas aims to:
• Ensure sustainability is included in design and construction guidelines, and where possible, all design materials come from sustainable, low energy use resources;
• Ensure that contractors used in construction and maintenance demonstrate sustainability credentials as part of tender or contract establishment; and
• Introduce energy savings through the introduction of energy efficient equipment and education.
As a part of this sustainability strategy Navitas:
• Has continued to improve measurement of key environmental outputs such as energy usage;
• Is supporting its staff at a college level by providing information about ways to reduce energy consumption; and
• Has continued to improve the monitoring of waste generation at a college level, with the view of finding ways to improve waste management.
Ensuring positive outcomes for students, clients and partners
Navitas utilises a range of annual surveys and studies to monitor and ensure key academic performance indicators are met. External benchmarking involves comparing key academic performance indicators across Navitas colleges, while internal benchmarking takes place between the individual colleges and their partner universities.
Within the University Partnerships Division, pass rates and retention target rates (the rate of students moving from semester to semester) are set at greater than 75%. In the 2016 calendar year, both targets were exceeded, with average pass rates of 82%, retention rates at 87% and progression to partner rates of 94%. Other student and client outcomes are listed on pages 17-24.
Contributing positively to our community
The Navitas Education Trust (NET) was established in 2013 to support charitable organisations and activities in the education sector.
Its aim is to increase access to and improve the quality of education delivered to disadvantaged learners around the world. Each year Navitas has provided $500,000 to the NET, with a portion used to support programs in partnership with charitable organisations and the remainder held in trust with the aim of generating funds for future programs.
Applications for NET grants open in February each year with a NET management committee, comprising the Group Chief Executive Officer and two Non-Executive Directors, having authority to consider and approve funding recommendations that align with Navitas’ corporate responsibility policy.
In FY17, five initiatives were funded, with the NET making commitments of $560,000 to support programs delivered over one to three years. A total of $335,100 was granted to charitable programs in FY17 through the NET.
An outline of the five programs is below.
• The NET partnered with Rotary Australia to help the Chiedza Child Care Centre of Zimbabwe provide access to education for 395 children and youth in urban and rural communities in Zimbabwe. The project benefits boys and girls between nine and 15 who are orphaned, poor and vulnerable – and who either failed to start school by the age of nine, or dropped out of school before completing the first seven years of basic education.
• The NET worked with Plan International for the first time to deliver infrastructure, training and resources to support children with disabilities learn alongside their able-bodied peers across 10 schools in Dhaka, Bangladesh.
• The NET supported the Australian Business Community Network (ABCN) for the fourth year in a row. In FY17, funding was used to create two new Navitas-named scholarships to support high-performing but disadvantaged year 10 students. The scholarships provide financial support over a three-year period, along with corporate mentoring, workshops, program delivery and more, helping recipients through the last two years of high school and the first year of work or tertiary study.
• The NET provided funds to Classroom of Hope to support activities in four primary schools in rural Battambang, Cambodia that improve education access and quality. This is an extension of an earlier NET program, with some FY17 funds used to construct school buildings at one particularly remote school.
• The NET provided a grant to Room to Read to construct a new library building at a needy school in the Uva Province of Sri Lanka. In particular, this funding has supported the community engagement and design phases, as well as the sourcing of materials and the construction itself.
Navitas also supported a number of other community activities through FY17, including:
• Providing more than 185 academic scholarships worth over $1.8m;
• Donating or raising over $20k for a variety of causes;
• 51 employees volunteered 467 hours across Australia participating in primary and high school mentoring programs in partnership with ABCN; and
• Committing more than 800 management hours to support corporate responsibility activities.

028 Navitas Limited Annual Report 2017
CORPORATE GOVERNANCEThe Board believes a high level of governance and transparency is critical in fostering a productive corporate culture and business practices. Operating in accordance with high standards is essential to achieving sustainable long-term performance and value-creation.
Role and responsibilities of the Board
Navitas’ Board of Directors is responsible for the corporate governance of Navitas and its subsidiary companies. The Board determines all matters relating to the strategic direction, academic quality and governance, policies, practices, management and operations of Navitas with the aim of protecting the interests of the Company’s shareholders and other stakeholders, including employees, students and partners.
Without limiting this general role, the specific functions and responsibilities of the Board include:
• oversight of the Group, including its educational outcomes, control and accountability systems;
• appointing and removing the CEO (or equivalent), including approving remuneration of the CEO and the remuneration policy and succession plans for the CEO;
• ratifying or approving the appointment and, where appropriate, the removal of the CFO (or equivalent) or Company Secretary;
• final approval of management's development of corporate strategy and performance objectives;
• reviewing and ratifying systems of risk management and internal compliance and control, codes of conduct and legal compliance;
• monitoring senior management's performance and implementation of strategy, and ensuring appropriate resources are available;
• approving and monitoring the progress of major capital expenditure, capital management and acquisitions and divestitures; and
• approving and monitoring financial and other reporting.
Board members
To assist in identifying areas of focus and maintaining an appropriate mix of skills, experience, knowledge and diversity, the People and Remuneration Committee uses a Board skills matrix that is reviewed on a regular basis. It is an important component of the criteria used for Director appointments.
The Board skills matrix contains the mix of skills, experience, knowledge and diversity that the Board currently has and is looking to achieve in its composition. Each of these areas is currently well represented on the Board, recognising that each Director may not necessarily have experience in or fit within all areas. However, the Board benefits from the combination of the Directors’ individual skills, experience, knowledge and diversity.
Independence
A Director is ‘independent’ where he or she is a Non-Executive Director, is not a member of management, and is free of any relationship that could, or could reasonably be perceived to, materially interfere with the independent exercise of their judgement. Seven of eight Directors were independent as at 30 June 2017.
Risk management
The Board is ultimately responsible for risk management, and must satisfy itself that significant risks faced by the Group are being managed appropriately, and that the system of risk management within the Group is robust enough to respond to changes in Navitas' business environment.
The Audit and Risk Committee has the following responsibilities regarding risk management:
• assessing the internal process for determining and managing key risk areas;
• confirming management's risk appetite and tolerance;
• ensuring that the Group has an effective risk management system and that macro risks to the Group are reported at least twice a year to the Board;
• evaluating the process Navitas has in place for assessing and continuously improving internal controls, particularly those related to areas of significant risk;
• assessing whether management has controls in place for unusual types of transactions and/or any potential transactions that may carry more than an acceptable degree of risk; and
• ensuring the continuous development of risk management in the Group and for supervising the implementation of risk management in compliance with the risk management policy and guidelines.
Navitas Limited Annual Report 2017 029
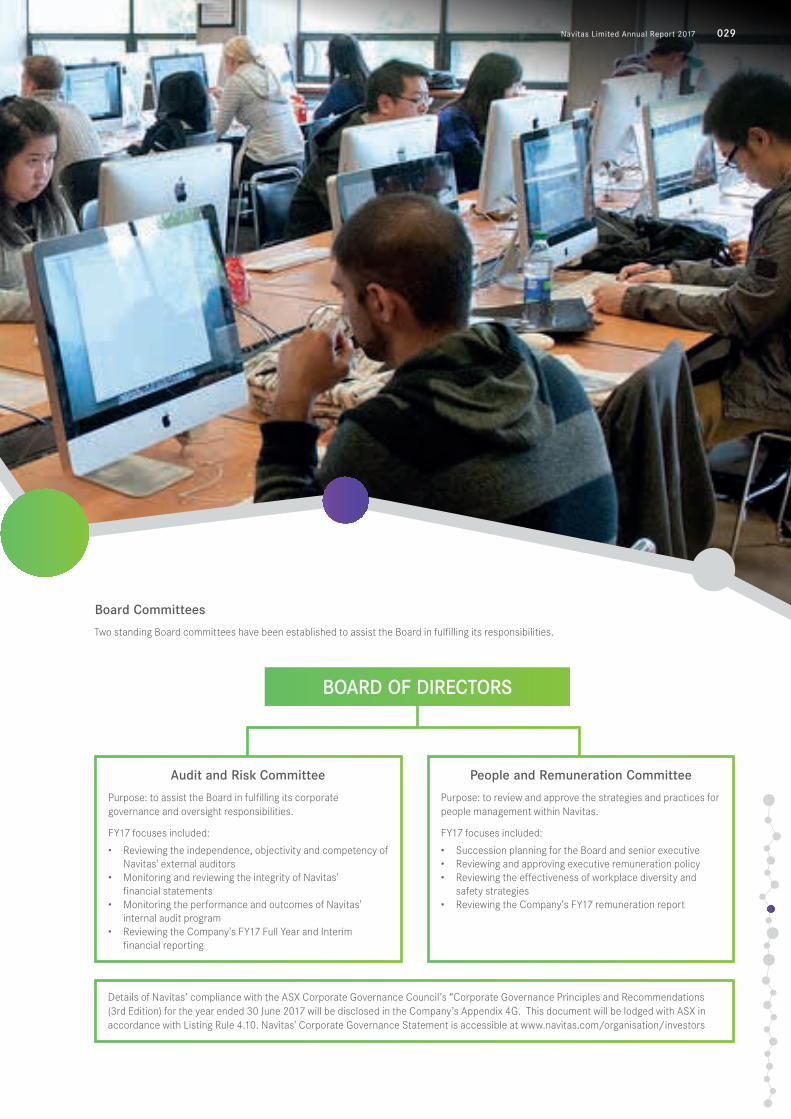
Audit and Risk Committee
Purpose: to assist the Board in fulfilling its corporate governance and oversight responsibilities.
FY17 focuses included:
• Reviewing the independence, objectivity and competency of Navitas' external auditors
• Monitoring and reviewing the integrity of Navitas' financial statements
• Monitoring the performance and outcomes of Navitas' internal audit program
• Reviewing the Company's FY17 Full Year and Interim financial reporting
People and Remuneration Committee
Purpose: to review and approve the strategies and practices for people management within Navitas.
FY17 focuses included:
• Succession planning for the Board and senior executive• Reviewing and approving executive remuneration policy• Reviewing the effectiveness of workplace diversity and
safety strategies• Reviewing the Company's FY17 remuneration report
BOARD OF DIRECTORS
Details of Navitas’ compliance with the ASX Corporate Governance Council’s “Corporate Governance Principles and Recommendations (3rd Edition) for the year ended 30 June 2017 will be disclosed in the Company’s Appendix 4G. This document will be lodged with ASX in accordance with Listing Rule 4.10. Navitas' Corporate Governance Statement is accessible at www.navitas.com/organisation/investors
Board Committees
Two standing Board committees have been established to assist the Board in fulfilling its responsibilities.
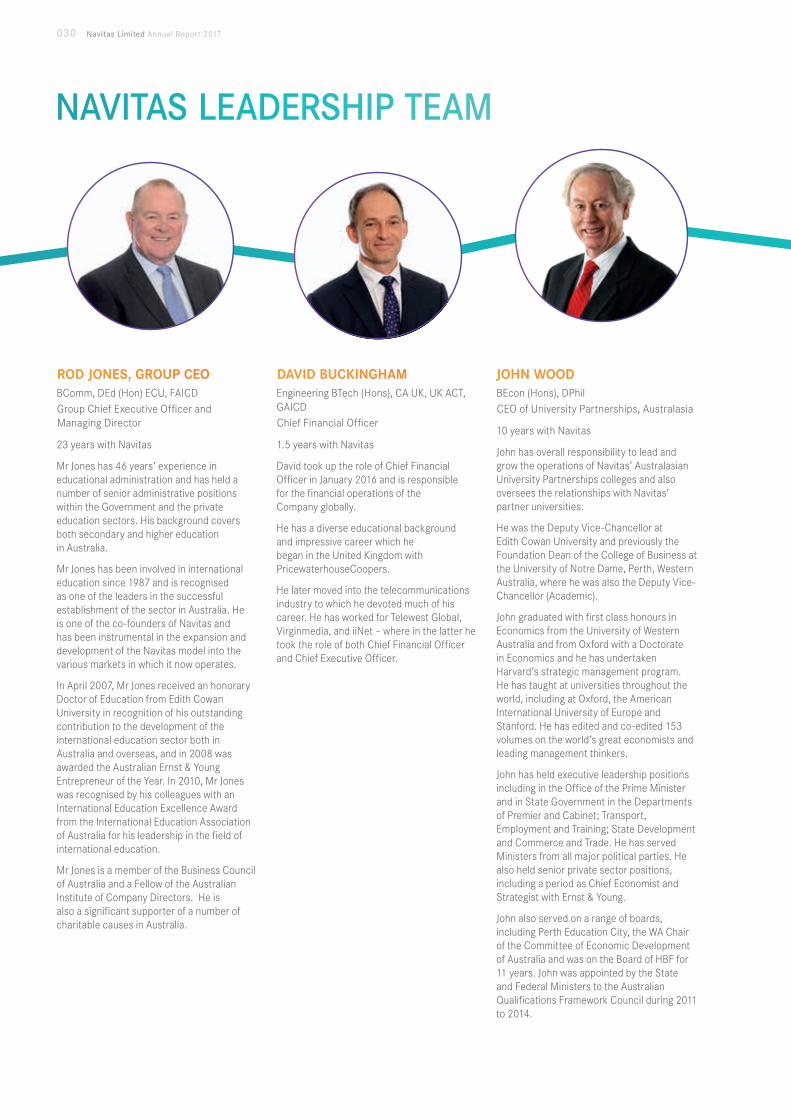
ROD JONES, GROUP CEOBComm, DEd (Hon) ECU, FAICDGroup Chief Executive Officer and Managing Director
23 years with Navitas
Mr Jones has 46 years’ experience in educational administration and has held a number of senior administrative positions within the Government and the private education sectors. His background covers both secondary and higher education in Australia.
Mr Jones has been involved in international education since 1987 and is recognised as one of the leaders in the successful establishment of the sector in Australia. He is one of the co-founders of Navitas and has been instrumental in the expansion and development of the Navitas model into the various markets in which it now operates.
In April 2007, Mr Jones received an honorary Doctor of Education from Edith Cowan University in recognition of his outstanding contribution to the development of the international education sector both in Australia and overseas, and in 2008 was awarded the Australian Ernst & Young Entrepreneur of the Year. In 2010, Mr Jones was recognised by his colleagues with an International Education Excellence Award from the International Education Association of Australia for his leadership in the field of international education.
Mr Jones is a member of the Business Council of Australia and a Fellow of the Australian Institute of Company Directors. He is also a significant supporter of a number of charitable causes in Australia.
DAVID BUCKINGHAMEngineering BTech (Hons), CA UK, UK ACT, GAICDChief Financial Officer
1.5 years with Navitas
David took up the role of Chief Financial Officer in January 2016 and is responsible for the financial operations of the Company globally.
He has a diverse educational background and impressive career which he began in the United Kingdom with PricewaterhouseCoopers.
He later moved into the telecommunications industry to which he devoted much of his career. He has worked for Telewest Global, Virginmedia, and iiNet – where in the latter he took the role of both Chief Financial Officer and Chief Executive Officer.
JOHN WOODBEcon (Hons), DPhilCEO of University Partnerships, Australasia
10 years with Navitas
John has overall responsibility to lead and grow the operations of Navitas’ Australasian University Partnerships colleges and also oversees the relationships with Navitas’ partner universities.
He was the Deputy Vice-Chancellor at Edith Cowan University and previously the Foundation Dean of the College of Business at the University of Notre Dame, Perth, Western Australia, where he was also the Deputy Vice-Chancellor (Academic).
John graduated with first class honours in Economics from the University of Western Australia and from Oxford with a Doctorate in Economics and he has undertaken Harvard’s strategic management program. He has taught at universities throughout the world, including at Oxford, the American International University of Europe and Stanford. He has edited and co-edited 153 volumes on the world’s great economists and leading management thinkers.
John has held executive leadership positions including in the Office of the Prime Minister and in State Government in the Departments of Premier and Cabinet; Transport, Employment and Training; State Development and Commerce and Trade. He has served Ministers from all major political parties. He also held senior private sector positions, including a period as Chief Economist and Strategist with Ernst & Young.
John also served on a range of boards, including Perth Education City, the WA Chair of the Committee of Economic Development of Australia and was on the Board of HBF for 11 years. John was appointed by the State and Federal Ministers to the Australian Qualifications Framework Council during 2011 to 2014.
030 Navitas Limited Annual Report 2017
NAVITAS LEADERSHIP TEAM
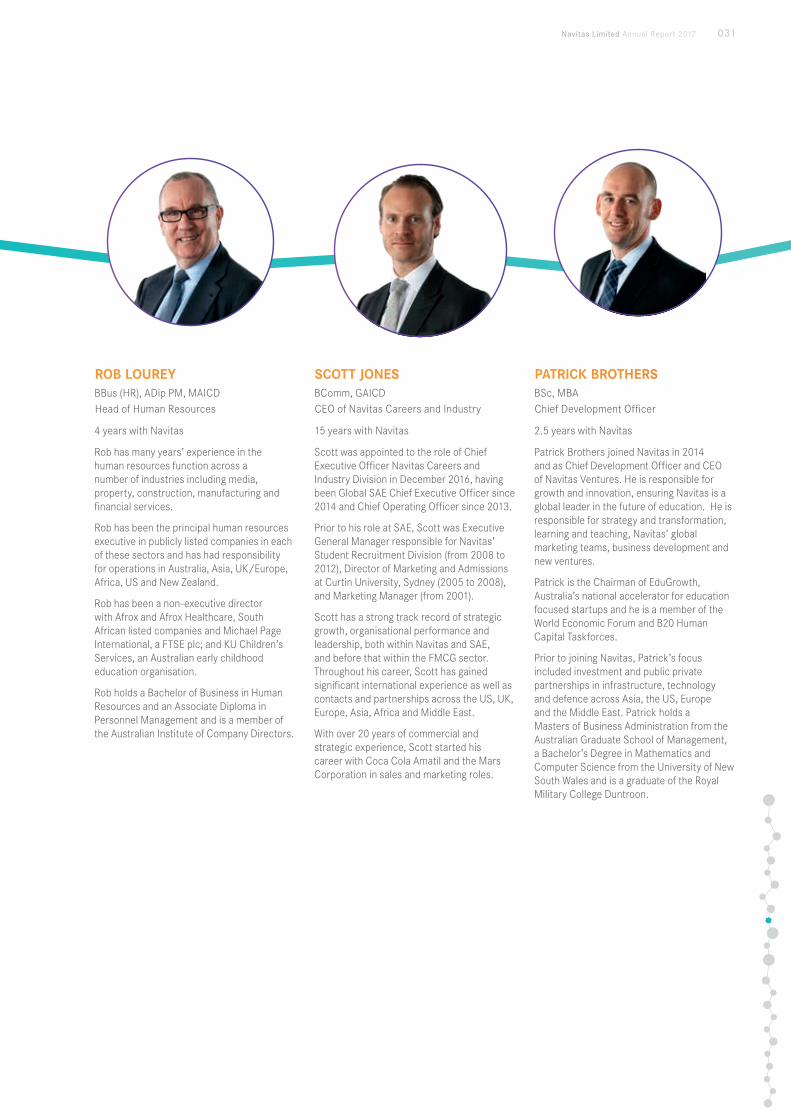
ROB LOUREYBBus (HR), ADip PM, MAICDHead of Human Resources
4 years with Navitas
Rob has many years’ experience in the human resources function across a number of industries including media, property, construction, manufacturing and financial services.
Rob has been the principal human resources executive in publicly listed companies in each of these sectors and has had responsibility for operations in Australia, Asia, UK/Europe, Africa, US and New Zealand.
Rob has been a non-executive director with Afrox and Afrox Healthcare, South African listed companies and Michael Page International, a FTSE plc; and KU Children’s Services, an Australian early childhood education organisation.
Rob holds a Bachelor of Business in Human Resources and an Associate Diploma in Personnel Management and is a member of the Australian Institute of Company Directors.
SCOTT JONESBComm, GAICDCEO of Navitas Careers and Industry
15 years with Navitas
Scott was appointed to the role of Chief Executive Officer Navitas Careers and Industry Division in December 2016, having been Global SAE Chief Executive Officer since 2014 and Chief Operating Officer since 2013.
Prior to his role at SAE, Scott was Executive General Manager responsible for Navitas’ Student Recruitment Division (from 2008 to 2012), Director of Marketing and Admissions at Curtin University, Sydney (2005 to 2008), and Marketing Manager (from 2001).
Scott has a strong track record of strategic growth, organisational performance and leadership, both within Navitas and SAE, and before that within the FMCG sector. Throughout his career, Scott has gained significant international experience as well as contacts and partnerships across the US, UK, Europe, Asia, Africa and Middle East.
With over 20 years of commercial and strategic experience, Scott started his career with Coca Cola Amatil and the Mars Corporation in sales and marketing roles.
PATRICK BROTHERSBSc, MBAChief Development Officer
2.5 years with Navitas
Patrick Brothers joined Navitas in 2014 and as Chief Development Officer and CEO of Navitas Ventures. He is responsible for growth and innovation, ensuring Navitas is a global leader in the future of education. He is responsible for strategy and transformation, learning and teaching, Navitas’ global marketing teams, business development and new ventures.
Patrick is the Chairman of EduGrowth, Australia’s national accelerator for education focused startups and he is a member of the World Economic Forum and B20 Human Capital Taskforces.
Prior to joining Navitas, Patrick’s focus included investment and public private partnerships in infrastructure, technology and defence across Asia, the US, Europe and the Middle East. Patrick holds a Masters of Business Administration from the Australian Graduate School of Management, a Bachelor’s Degree in Mathematics and Computer Science from the University of New South Wales and is a graduate of the Royal Military College Duntroon.
Navitas Limited Annual Report 2017 031
BEV HUDSONBEd, Grad Dip Lang Studies, MEdPresident and CEO of University Partnerships, North America
10 years with Navitas
Bev has been working in international education for thirty years in four countries. The last eleven years have been working for Navitas in North America across a number of roles including: College Director and Principal at Navitas’ first pathway program in North America; Fraser International College; General Manager for Navitas Canada and now as President and Head of University Partnerships, North America. Her current responsibilities are to establish new partnerships and oversee the operations of the Navitas pathway programs in North America.
Bev has been involved in all aspects of international education including curriculum design, student services, faculty and administration. She has developed and implemented the strategic vision for internationalization at several universities including internationalizing the curriculum, international recruitment and marketing, student support, and international partnership development.
Bev received her Master of Education from Edith Cowan University. In 2014 she was awarded the International Education Distinguished Leadership Award from the British Columbia Council for International Education.
MICK CAMPBELLBSc, BSc Statistics (Diploma)Chief Information Officer
1 year with Navitas
Mick joined Navitas in 2016, bringing over 20 years’ experience in IT with him. He is responsible for leading the Group IT function at Navitas across all of the Company’s global divisions.
He has held senior roles in a variety of industries, spanning not-for-profits, healthcare, professional services, IT, banking and finance, and education. His career has seen him work at the likes of AIT, Westpac, Oracle, Ashurst, and Ramsay Healthcare.
Most recently, Mick worked as the CIO of Business Transformation at Cerebral Palsy Alliance, where he was responsible for formulating and executing IT strategy, digitsing the organisation, overseeing IT projects. He held the position of CIO at Ramsay Healthcare for 8 years – a global, ASX-listed hospital group operating over 150 hospital across Australia, France, UK, Indonesia and Malaysia.
Mick is an avid supporter of the Cerebral Palsy Alliance, and in 2011 and 2014 was a significant fundraiser and strategist for raising over $175,000 for cerebral palsy initiatives.
PAUL LOVEGROVELLB(Hons) , MBA, MPhilCEO of University Partnerships, Europe
2 years with Navitas
Paul joined Navitas in 2015 and has overall responsibility for establishing new partnerships and overseeing all University Partnerships operations in Europe. Paul is responsible for determining the strategic direction of the division, overseeing the quality of delivery and ensuring a focus on efficiency.
Paul has a deep and intimate knowledge of international higher education and pathways markets in the United Kingdom gained during his two decades of employment with Study Group in a diverse range of roles. Across his career, Paul worked his way from a teacher to Director of the pathway division, and established trusted and strategic university partnerships with over 18 higher education institutions – 12 of which he personally led the set-up of.
Paul holds a LLB from John Moores University, an MBA in General Management from the University of Brighton and a MA, Research from the University of Brighton.
NAVITAS LEADERSHIP TEAM (CONTINUED)
032 Navitas Limited Annual Report 2017

Navitas Limited Annual Report 2017 033

034 Navitas Limited Annual Report 2017
DIRECTORS’ REPORT

Navitas Limited Annual Report 2017 035
036 Navitas Limited Annual Report 2017
Directors
The names and details of the Company’s directors in office during the financial year and until the date of this report are set out on pages 36 to 38. Directors were in office for this entire period unless otherwise stated.
TRACEY HORTON AOBEcon (Hons) UWA, MBA Stan, Prof Emer, FAICD, FGIANon-Executive Chairman
Appointed as a Director since 13 June 2012 and as Chairman since 16 November 2016
Ms Horton has extensive international business and education experience including as Winthrop Professor and Dean of the University of Western Australia’s Business School. Prior to that she held executive and senior management roles in North America with Bain & Company and across Australia with Poynton and Partners and the Reserve Bank of Australia.
Ms Horton has significant governance experience including past directorships with Skilled Group and Automotive Holdings Group. Ms Horton is a Commissioner for Tourism Western Australia, Chairman of Presbyterian Ladies College and Past President of the Chamber of Commerce and Industry (WA). Ms Horton is also a member of the Australian Takeovers Panel, the national board of the Australian Institute of Company Directors and the Bain & Company Advisory Board.
In 2017, Ms Horton was made an Officer of the Order of Australia for distinguished service to business and business education through a range of leadership and academic roles, and to the arts in Western Australia.
During the past three years Ms Horton has served as a director of the following other listed companies:
• Skilled Group (from 10 February 2011 to 19 October 2015)
• Automotive Holdings Group Limited (from 3 May 2012 to 20 November 2015)
Ms Horton is also a member of the Board’s People and Remuneration Committee.
ROD JONESBComm, DEd (Hon) ECU, FAICDGroup Chief Executive Officer and Managing Director
Appointed 18 June 2004
Mr Jones has 46 years’ experience in educational administration and has held a number of senior administrative positions within the Government and the private education sectors. His background covers both secondary and higher education in Australia.
Mr Jones has been involved in international education since 1987 and is recognised as one of the leaders in the successful establishment of the sector in Australia. He is one of the co-founders of Navitas and has been instrumental in the expansion and development of the Navitas model into the various markets in which it now operates.
In April 2007, Mr Jones received an honorary Doctor of Education from Edith Cowan University in recognition of his outstanding contribution to the development of the international education sector both in Australia and overseas, and in 2008 was awarded the Australian Ernst & Young Entrepreneur of the Year. In 2010, Mr Jones was recognised by his colleagues with an International Education Excellence Award from the International Education Association of Australia for his leadership in the field of international education.
Mr Jones is a member of the Business Council of Australia and the Australian Institute of Company Directors. He is also a significant supporter of a number of charitable causes in Australia.
During the past three years, Mr Jones has not served as a director of any other listed companies.
* Denotes current directorship
DIRECTOR'S REPORT BOARD OF DIRECTORS
Navitas Limited Annual Report 2017 037
TONY CIPA BBus, Grad Dip AccountingNon-Executive Director
Appointed 1 May 2014
Mr Cipa has extensive international business and finance experience including his roles as CFO and Executive Finance Director for CSL Limited, the ASX listed international biopharmaceutical company.
During his time leading the finance function of CSL the company grew from a previously government owned business to a global market leader with over 20 international locations including the USA, UK, Canada and Germany. Mr Cipa was CFO from 1994 to 2000 then served as Executive Finance Director on CSL's Board of Directors from 2000 to 2010.
Mr Cipa is currently the Chairman of the Audit and Risk Committee and a Non-Executive Director of Healthscope Limited. He was previously the Chairman of the Audit and Risk Committee and a Non-Executive Director of Skilled Group.
During the past three years Mr Cipa has served as a director of the following other listed companies:
• Healthscope Limited* (from 28 June 2014 to present)
• Skilled Group (from 4 April 2011 to 19 October 2015)
Mr Cipa is also the Chairman of the Board’s Audit and Risk Committee.
HARVEY COLLINSBBus, FCPA, SFFin, FAICD Non-Executive Director
Appointed 9 November 2004
Mr Collins has extensive executive and board experience in a range of industries. From 1986 to 1996 he held senior management roles in Western Australian regional bank, Challenge Bank Limited, including five years as Chief Financial Officer. From 1997 to 2002, he was an executive director of listed investment company, Chieftain Securities Limited. From May 2009 to September 2012, he was the non-executive Chairman of Bank of Western Australia Limited (Bankwest). From February 2004 to 30 June 2013, he was a non-executive director (Deputy Chairman) of Verve Energy (Electricity Generation Corporation).
Mr Collins has held board appointments in industries as diverse as financial services, health insurance, telecommunications, equipment hire, mining services, electricity and the not-for-profit sector. He is a director of Save the Children Australia, Chairman of Insitor Impact Asia Fund Pte Ltd and is a past member of the WA State Council of the Australian Institute of Company Directors.
During the past three years, Mr Collins has not served as a director of any other listed companies.
Mr Collins is also a member of the Board’s Audit and Risk Committee.
DIANA EILERTBSc Maths & Chemistry, MComm Finance & MarketingNon-Executive Director
Appointed 28 July 2014
Ms Eilert is a professional Non-Executive Director with extensive board and executive experience gained in a 30 year career across a variety of sectors.
Ms Eilert is currently a non-executive director of Super Retail Group (ASX: SUL) and Essential Energy (previously Networks NSW) and was previously a Non-Executive Director of digital business realestate.com.au (ASX: REA), Veda Group Limited (ASX: VED), AMP Life and digital start-ups such as “onthehouse” and OurDeal.
As an executive Ms Eilert has held operational roles as Group Executive for Suncorp’s entire insurance business and later, Group Executive People, Technology, Marketing and Joint Ventures for Suncorp. She had 10 years’ experience with Citibank running retail bank credit and risk, the mortgage business, the retail funds management business, and the Direct Bank, reporting to the Country Head.
In her final executive role, Ms Eilert was Head of Strategy and Corporate Development for News Ltd, where her focus was on digital transformation and emerging business models.
During the past three years Ms Eilert has served as a director of the following other listed companies:
• Super Retail Group* (from 21 October 2015 to present)
• Veda Group Limited (from 18 October 2013 to 26 February 2016)
Ms Eilert is also the Chairman of the Board’s People and Remuneration Committee.
BOARD OF DIRECTORS (CONTINUED)
038 Navitas Limited Annual Report 2017
JAMES KING BComm, FAICDNon-Executive Director
Appointed 9 November 2004
Mr King brings to the Board of Navitas over 30 years of management and board experience with major multinational corporations in Australia and internationally.
Mr King was with Foster's Group Limited and was Managing Director Carlton & United Breweries and Managing Director Foster's Asia. Prior to joining Foster's in 1997, Mr King was President of Kraft Foods (Asia Pacific) and resided in Hong Kong for six years from 1991.
Mr King is currently a non-executive director, and the chairman of the Audit & Risk Committee, of Lovisa Holdings Limited. He was previously on the board of The Trust Company Limited, JB Hi-Fi Limited (where he was also Chairman of its Audit and Risk Committee), Pacific Brands Limited, the Council of Xavier College Melbourne and was also Chairman of the Juvenile Diabetes Research Foundation (Vic).
Mr King is a Fellow of the Australian Institute of Company Directors.
During the past three years, Mr King has served as a director of the following other listed companies:
• Lovisa Holdings Limited* (from 17 May 2016 to present)
• JB Hi-Fi Limited (from 10 May 2004 to 29 October 2015)
• Pacific Brands Limited (from 4 September 2009 to 14 July 2016)
Mr King is also a member of the Board’s Audit and Risk Committee and People and Remuneration Committee.
LISA PAUL AO PSMBA (Hons), FAICD, FACEL, FAIM, FIPAA, FANZSOGNon-Executive Director
Appointed 2 February 2016
Ms Paul has been a Chief Executive in the Australian federal government for 11 years, most recently as the Secretary of the Australian Government Department of Education and Training.
In 2011, Ms Paul was made an Officer of the Order of Australia for distinguished service to public sector leadership. In 2003, she was awarded a Public Service Medal for leading the Australian Government's domestic response to the Bali bombings.
Ms Paul is a fellow of the Australian Institute of Company Directors, a fellow of the Australian Council for Educational Leaders, National Fellow of the Institute of Public Administration Australia, a fellow of the Australian Institute of Management, an Australian National University Public Policy Fellow, a member of Chief Executive Women and a Fellow of the Australian and New Zealand School of Government.
Ms Paul currently serves on the boards of Programmed Group and APM Australia. She is also on the boards of Social Ventures Australia, Australian Schools Plus, Australian Research Alliance for Children and Youth, High Resolves and the Australia American Educational Leadership Foundation Ltd. She is also a member of the Advisory Board to the Melbourne Accelerator Program and was appointed to the Government’s Naval Shipbuilding Advisory Board in January 2017. Ms Paul is Enterprise Professor, Public Policy at the University of Melbourne and is a Councillor of Bond University.
During the past three years Ms Paul has served as a director of the following other listed company:
• Programmed Maintenance Services Limited* (from 3 February 2016 to present)
Ms Paul is also a member of the Board’s People and Remuneration Committee.
DAVID ROBBBSc, GradDip (Personnel Administration), FAIM, FAICDNon-Executive Director
Appointed 9 May 2017
Mr Robb has an extensive corporate background, most recently serving as Managing Director and CEO of Iluka Resources for 10 years. As CEO, he transformed the company’s financial, commercial and human capabilities and drove major achievements in shareholder returns and investment market reputation, in workforce diversity and employee engagement and in corporate sustainability practices. Prior to that, Mr Robb held a number of senior executive positions at Wesfarmers, including Executive Director, and senior roles at BP in Asia, the US, the UK and Australia.
Mr Robb is also currently a Director of the Centre for Independent Studies, a Director of the Melbourne Football Club and Chair of the Dean’s Council of the Faculty of Engineering, Computing and Mathematics at the University of Western Australia. He was previously Chairman of Consolidated Rutile Limited and Deputy Chair of Methodist Ladies College, Perth.
During the past three years Mr Robb has served as a director of the following other listed company:
• Iluka Resources Limited (from 18 October 2006 to 2 September 2016)
* Denotes current directorship

Navitas Limited Annual Report 2017 039
040 Navitas Limited Annual Report 2017
DIRECTOR'S REPORT REMUNERATION REPORT
This Report outlines the remuneration arrangements in place for the key management personnel (KMP) of Navitas Limited. The KMP are the Group Chief Executive Officer and certain Navitas senior executives, together referred to in this Report as ‘executives’, and the non-executive directors. The disclosures are in accordance with the requirements set out in section 300A of the Corporations Act 2001 (Cth).
The Report comprises the following sub sections:
Page number
1. Frequently Asked Questions 40
2. Key Management Personnel (KMP) 42
3. FY17 remuneration outcomes and link with performance 43
4. Executive remuneration objective, structure and review 44
5. Executive statutory remuneration tables 48
6. Non-executive director fees and statutory remuneration table 50
7. Remuneration governance 51
8. Additional required disclosures 52
1. Frequently Asked Questions
This section provides an overview of the key questions Navitas’ shareholders may have in relation to KMP remuneration arrangements.
Remuneration policy
How are executives at Navitas remunerated? Navitas executives are remunerated in two parts:
1) Fixed remuneration, which is used to attract and retain executives with the talent and skills to support the Group’s objectives; and
2) Variable remuneration, which is paid utilising an executive incentive plan, based on Group and individual performance.
How is fixed remuneration determined? Fixed remuneration for each role is set by the Board through the People and Remuneration Committee (PRC) and is based on comparable roles in like companies.
Fixed remuneration is reviewed annually based on individual and Group performance as well as market data. Navitas aims to pay at the 50th percentile of fixed remuneration levels for comparable organisations.
How are variable payments for individual executives set?
A percentage of each executives’ fixed remuneration is set as Target Variable Pay (TVP). This ranges from 40% to 75% of fixed pay depending on the executive’s role and level of responsibility.
Fixed and variable remuneration are set to provide a market competitive total remuneration package.
The policy for this is specified in Navitas’ executive incentive plan.
How are incentives determined for executives working in Group or business unit roles?
Growth targets for the Group and each business unit are set, with Group executives tied to the Group EVA®3 result and business unit executives tied to their business unit and Group EVA® results.
How are incentive payments funded? Incentive payments are funded based on the year-on-year growth in Economic Value Added (EVA®) achieved by the Group or business unit against pre-established targets set by the Board.
How is the executive incentive plan pool determined?
The incentive pool is based on the combined TVP of participants and how well the Group and its business units performed against the EVA® growth targets set by the Board.
If targets are exactly met, the incentive plan pool will be equal to the combined TVP of participants. If targets are not achieved, the pool will be lower, if targets are exceeded, the pool will be higher. The size of the pool is uncapped for achievement above the target.
3 EVA® is a registered trademark of Stern Stewart & Co.
Navitas Limited Annual Report 2017 041
What growth targets are used to determine the incentive pool?
Growth targets are set by the Board for a three-year period, with the three-year target broken down into annual growth targets. Incentive funding is determined each year based on EVA® growth achieved against those annual targets.
We do not disclose the growth targets set by the Board as they are commercially sensitive.
In setting the target for FY15 - FY17, the Board gave consideration to corporate plans, shareholder return expectations, industry developments, as well as comparative performance analysis prepared by independent consultancy Juno Partners of the top 300 Australian listed companies over 2009 – 2013.
What is EVA® and how is it calculated? The executive incentive plan is based on sustained improvements in the financial performance of Navitas, as measured by EVA®. EVA® measures the profit Navitas makes above and beyond what investors could expect to earn, had their funds been invested elsewhere at similar risk.
For EVA® calculations see page 43.
How are incentive payments and the EVA® pool linked?
While the combined TVP of participants and financial performance against pre-set targets determines the maximum size of the pool, the share of that pool that the executive receives is subject to an assessment of their individual performance.
Can incentives be deferred or forfeited? For executives, rewards are uncapped and any amount, positive or negative, may be declared. Amounts between zero ($0) and an executive’s TVP opportunity are settled in the current year. Any amount over their TVP or below zero is settled in three equal parts - the first in the current year and the remainder in the two years that follow.
What happens if EVA® growth declines? If EVA® growth is substantially below target, a negative amount is declared reducing the value of any previously deferred amounts and any future payments under the plan.
What happens to the deferred amount if an executive leaves?
An executive must be in employment at the time the Board approves the incentive payment made under the executive incentive plan to be eligible for the payment.
If an executive ceases employment for any reason before the Board approves the payment, the executive is not eligible for any payment in respect of the period that the executive was in employment or any deferred balances.
Do executives have to maintain a Navitas shareholding?
Executives have to allocate at least 50% of any incentive payment to purchase shares until the executive has established a holding in Navitas equal to the value of their fixed remuneration.
FY17 outcomes
What are the remuneration outcomes for FY17?
Fixed remuneration
Most executives received a fixed remuneration increase, effective 1 October 2016, of 2.0% to reflect market comparability and individual performance. The Chief Executive Officer - SAE received a fixed remuneration increase of 17.7% to recognise additional responsibilities as well as reflecting market comparability.
Variable remuneration
The Group financial performance did not meet minimum EVA® achievement expectations and a negative incentive declaration of minus 0.3x is expected for Group executives, including the Chief Executive Officer and Chief Financial Officer. The Group financial profit performance was impacted by a number of factors including the final impact of the closure of Macquarie and Curtin Sydney Colleges, a slowdown in growth in the UK through the post-Brexit tightening of international student visa regulations and adverse foreign currency translation movements in some overseas businesses.
For business unit executives the expected range of incentive declarations across executives is from minus 0.6x to 0.8x, depending on the EVA® created by each business unit.
This is consistent with the objective of the plan, which is to base variable rewards on sustained growth in EVA® being achieved.
1. Frequently Asked Questions (continued)
Remuneration policy (continued)
REMUNERATION REPORT (CONTINUED)
042 Navitas Limited Annual Report 2017
1. Frequently Asked Questions (continued)
Changes to the remuneration policy for FY18
Are there any changes to fixed remuneration for FY18?
Fixed remuneration will remain unchanged.
Are there any changes to variable remuneration for FY18?
In FY18 there will be an increase in the TVP opportunity for executives. This will move the total target remuneration (that is, fixed remuneration plus variable remuneration) opportunity for these executives more in line with the market, where we aim to pay at the 50th percentile of similar roles.
The individual TVP opportunity for executives will move from a range of 40% to 75% of fixed remuneration, to a range of 60% to 150% of fixed remuneration.
Importantly, with other changes planned, the total TVP pool of the scheme will not increase from FY17 to FY18.
Are there any other changes? Changes to the treatment of individual performance
As noted above, historically the incentive pool was determined based on financial performance and then an executive’s share of the incentive pool was modified up or down based on individual performance.
Beginning in FY18, 40% of an executive’s share of the incentive pool will be subject to individual performance, with this amount only rewarded in full for exceptional individual performance.
This change allows for greater emphasis to be placed on non-financial performance, with targets being set and performance assessed in the context of corporate plans, shareholder return expectations, and industry developments amongst other things, and therefore recognising the importance of strategic non-financial initiatives to the Group’s long term success.
It should be noted that the funding of the incentive pool will not be changed, i.e. rewards will be subject, at first instance, to financial performance against the pre-set targets determined by the Board. If an executive is assessed not to have reached acceptable levels of individual performance, they will not be eligible for any variable rewards.
Increase in weighting of Group performance for financial KPIs
Executives working in business unit roles have historically had rewards weighted 70% to business unit financial performance and 30% to Group financial performance.
Beginning in FY18, this weighting will be amended to 50% business unit performance, 50% Group performance. This will increase focus on Group outcomes and will encourage further collaboration between executives to improve overall performance.
Executives’ deferred incentive element
The amount and method of how executives accrue a Navitas shareholding is currently being reviewed. Further details will be provided in the FY18 report when any changes are finalised.
2. Key Management Personnel (KMP)
The following were KMP at any time during the 2017 financial year and, unless otherwise indicated, were KMP for the entire year.
(i) Non-Executive Directors
Tracey Horton Non-Executive Chairman (appointed as Chairman from Non-Executive Director 16 November 2016)
Tony Cipa Non-Executive Director
Harvey Collins Non-Executive Director (Chairman until 16 November 2016)
Diana Eilert Non-Executive Director
James King Non-Executive Director
Lisa Paul Non-Executive Director
David Robb Non-Executive Director (appointed 9 May 2017)
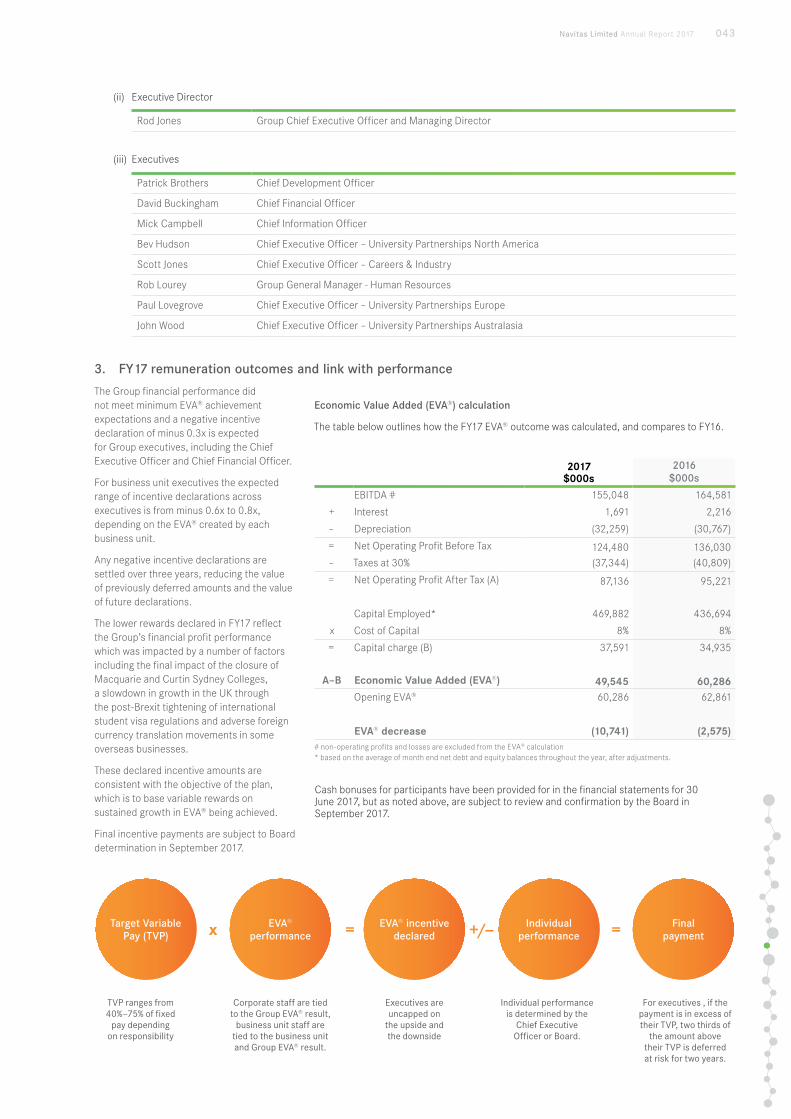
Navitas Limited Annual Report 2017 043
(ii) Executive Director
Rod Jones Group Chief Executive Officer and Managing Director
(iii) Executives
Patrick Brothers Chief Development Officer
David Buckingham Chief Financial Officer
Mick Campbell Chief Information Officer
Bev Hudson Chief Executive Officer – University Partnerships North America
Scott Jones Chief Executive Officer – Careers & Industry
Rob Lourey Group General Manager - Human Resources
Paul Lovegrove Chief Executive Officer – University Partnerships Europe
John Wood Chief Executive Officer – University Partnerships Australasia
3. FY17 remuneration outcomes and link with performance
The Group financial performance did not meet minimum EVA® achievement expectations and a negative incentive declaration of minus 0.3x is expected for Group executives, including the Chief Executive Officer and Chief Financial Officer.
For business unit executives the expected range of incentive declarations across executives is from minus 0.6x to 0.8x, depending on the EVA® created by each business unit.
Any negative incentive declarations are settled over three years, reducing the value of previously deferred amounts and the value of future declarations.
The lower rewards declared in FY17 reflect the Group’s financial profit performance which was impacted by a number of factors including the final impact of the closure of Macquarie and Curtin Sydney Colleges, a slowdown in growth in the UK through the post-Brexit tightening of international student visa regulations and adverse foreign currency translation movements in some overseas businesses.
These declared incentive amounts are consistent with the objective of the plan, which is to base variable rewards on sustained growth in EVA® being achieved.
Final incentive payments are subject to Board determination in September 2017.
Economic Value Added (EVA®) calculation
The table below outlines how the FY17 EVA® outcome was calculated, and compares to FY16.
2017 $000s
2016 $000s
EBITDA # 155,048 164,581
+ Interest 1,691 2,216
– Depreciation (32,259) (30,767)
= Net Operating Profit Before Tax 124,480 136,030– Taxes at 30% (37,344) (40,809)
= Net Operating Profit After Tax (A) 87,136 95,221
Capital Employed* 469,882 436,694
x Cost of Capital 8% 8%
= Capital charge (B) 37,591 34,935
A–B Economic Value Added (EVA®) 49,545 60,286Opening EVA® 60,286 62,861
EVA® decrease (10,741) (2,575)# non-operating profits and losses are excluded from the EVA® calculation * based on the average of month end net debt and equity balances throughout the year, after adjustments.
Cash bonuses for participants have been provided for in the financial statements for 30 June 2017, but as noted above, are subject to review and confirmation by the Board in September 2017.
Target Variable Pay (TVP)
EVA® performance
EVA® incentive declared
Individual performance
Final payment
TVP ranges from 40%—75% of fixed
pay depending on responsibility
Corporate staff are tied to the Group EVA® result,
business unit staff are tied to the business unit and Group EVA® result.
Executives are uncapped on
the upside and the downside
Individual performance is determined by the
Chief Executive Officer or Board.
For executives , if the payment is in excess of their TVP, two thirds of
the amount above their TVP is deferred at risk for two years.
x +/— ==
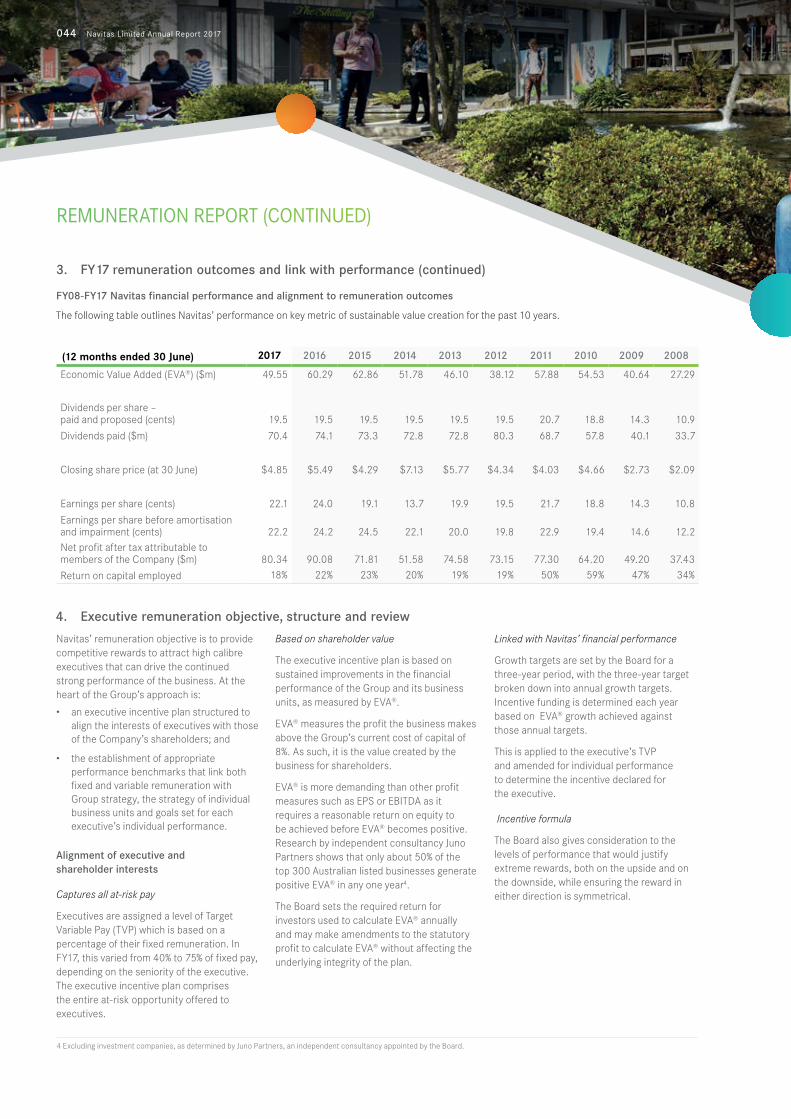
REMUNERATION REPORT (CONTINUED)
3. FY17 remuneration outcomes and link with performance (continued)
FY08-FY17 Navitas financial performance and alignment to remuneration outcomes
The following table outlines Navitas’ performance on key metric of sustainable value creation for the past 10 years.
(12 months ended 30 June) 2017 2016 2015 2014 2013 2012 2011 2010 2009 2008
Economic Value Added (EVA®) ($m) 49.55 60.29 62.86 51.78 46.10 38.12 57.88 54.53 40.64 27.29
Dividends per share – paid and proposed (cents) 19.5 19.5 19.5 19.5 19.5 19.5 20.7 18.8 14.3 10.9
Dividends paid ($m) 70.4 74.1 73.3 72.8 72.8 80.3 68.7 57.8 40.1 33.7
Closing share price (at 30 June) $4.85 $5.49 $4.29 $7.13 $5.77 $4.34 $4.03 $4.66 $2.73 $2.09
Earnings per share (cents) 22.1 24.0 19.1 13.7 19.9 19.5 21.7 18.8 14.3 10.8
Earnings per share before amortisation and impairment (cents) 22.2 24.2 24.5 22.1 20.0 19.8 22.9 19.4 14.6 12.2Net profit after tax attributable to members of the Company ($m) 80.34 90.08 71.81 51.58 74.58 73.15 77.30 64.20 49.20 37.43
Return on capital employed 18% 22% 23% 20% 19% 19% 50% 59% 47% 34%
4. Executive remuneration objective, structure and review
Navitas’ remuneration objective is to provide competitive rewards to attract high calibre executives that can drive the continued strong performance of the business. At the heart of the Group’s approach is:
• an executive incentive plan structured to align the interests of executives with those of the Company’s shareholders; and
• the establishment of appropriate performance benchmarks that link both fixed and variable remuneration with Group strategy, the strategy of individual business units and goals set for each executive’s individual performance.
Alignment of executive and shareholder interests
Captures all at-risk pay
Executives are assigned a level of Target Variable Pay (TVP) which is based on a percentage of their fixed remuneration. In FY17, this varied from 40% to 75% of fixed pay, depending on the seniority of the executive. The executive incentive plan comprises the entire at-risk opportunity offered to executives.
Based on shareholder value
The executive incentive plan is based on sustained improvements in the financial performance of the Group and its business units, as measured by EVA®.
EVA® measures the profit the business makes above the Group’s current cost of capital of 8%. As such, it is the value created by the business for shareholders.
EVA® is more demanding than other profit measures such as EPS or EBITDA as it requires a reasonable return on equity to be achieved before EVA® becomes positive. Research by independent consultancy Juno Partners shows that only about 50% of the top 300 Australian listed businesses generate positive EVA® in any one year4.
The Board sets the required return for investors used to calculate EVA® annually and may make amendments to the statutory profit to calculate EVA® without affecting the underlying integrity of the plan.
Linked with Navitas’ financial performance
Growth targets are set by the Board for a three-year period, with the three-year target broken down into annual growth targets. Incentive funding is determined each year based on EVA® growth achieved against those annual targets.
This is applied to the executive’s TVP and amended for individual performance to determine the incentive declared for the executive.
Incentive formula
The Board also gives consideration to the levels of performance that would justify extreme rewards, both on the upside and on the downside, while ensuring the reward in either direction is symmetrical.
4 Excluding investment companies, as determined by Juno Partners, an independent consultancy appointed by the Board.
044 Navitas Limited Annual Report 2017
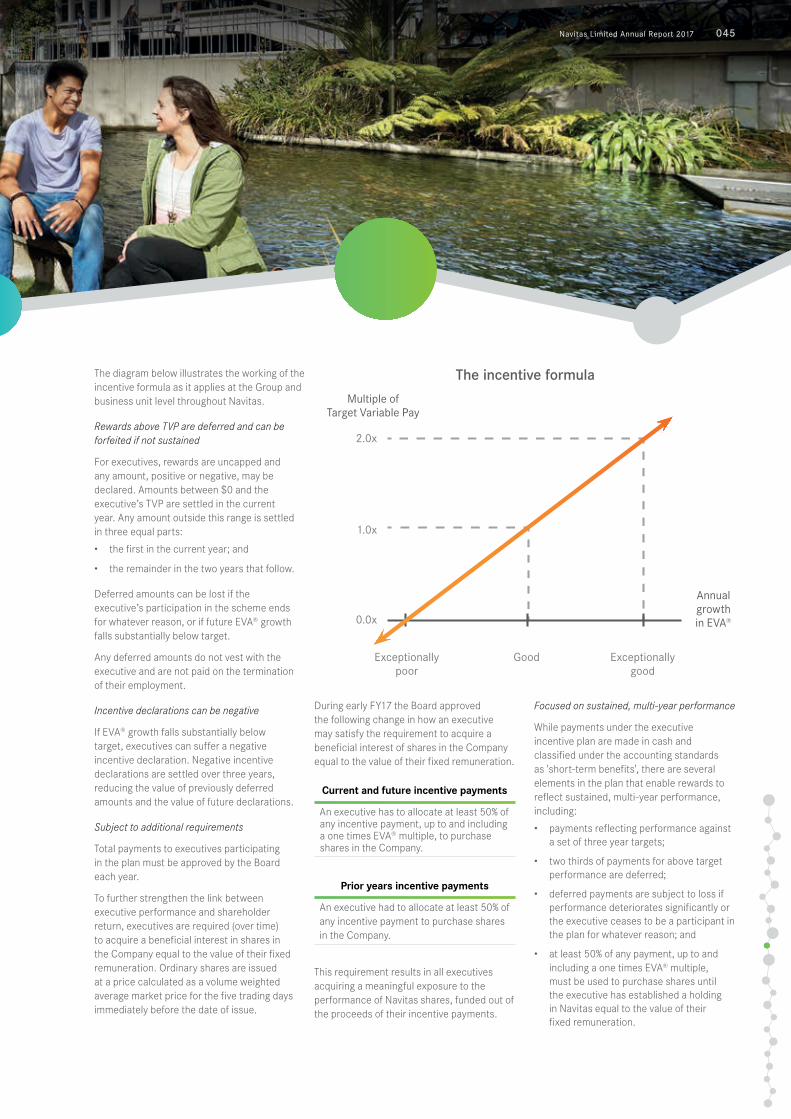
Navitas Limited Annual Report 2017 045
Exceptionally poor
Good Exceptionally good
0.0x
1.0x
2.0x
Multiple of Target Variable Pay
Annual growth in EVA®
The incentive formulaThe diagram below illustrates the working of the incentive formula as it applies at the Group and business unit level throughout Navitas.
Rewards above TVP are deferred and can be forfeited if not sustained
For executives, rewards are uncapped and any amount, positive or negative, may be declared. Amounts between $0 and the executive’s TVP are settled in the current year. Any amount outside this range is settled in three equal parts:
• the first in the current year; and
• the remainder in the two years that follow.
Deferred amounts can be lost if the executive’s participation in the scheme ends for whatever reason, or if future EVA® growth falls substantially below target.
Any deferred amounts do not vest with the executive and are not paid on the termination of their employment.
Incentive declarations can be negative
If EVA® growth falls substantially below target, executives can suffer a negative incentive declaration. Negative incentive declarations are settled over three years, reducing the value of previously deferred amounts and the value of future declarations.
Subject to additional requirements
Total payments to executives participating in the plan must be approved by the Board each year.
To further strengthen the link between executive performance and shareholder return, executives are required (over time) to acquire a beneficial interest in shares in the Company equal to the value of their fixed remuneration. Ordinary shares are issued at a price calculated as a volume weighted average market price for the five trading days immediately before the date of issue.
During early FY17 the Board approved the following change in how an executive may satisfy the requirement to acquire a beneficial interest of shares in the Company equal to the value of their fixed remuneration.
Current and future incentive payments
An executive has to allocate at least 50% of any incentive payment, up to and including a one times EVA® multiple, to purchase shares in the Company.
Prior years incentive payments
An executive had to allocate at least 50% of any incentive payment to purchase shares in the Company.
This requirement results in all executives acquiring a meaningful exposure to the performance of Navitas shares, funded out of the proceeds of their incentive payments.
Focused on sustained, multi-year performance
While payments under the executive incentive plan are made in cash and classified under the accounting standards as 'short-term benefits', there are several elements in the plan that enable rewards to reflect sustained, multi-year performance, including:
• payments reflecting performance against a set of three year targets;
• two thirds of payments for above target performance are deferred;
• deferred payments are subject to loss if performance deteriorates significantly or the executive ceases to be a participant in the plan for whatever reason; and
• at least 50% of any payment, up to and including a one times EVA® multiple, must be used to purchase shares until the executive has established a holding in Navitas equal to the value of their fixed remuneration.
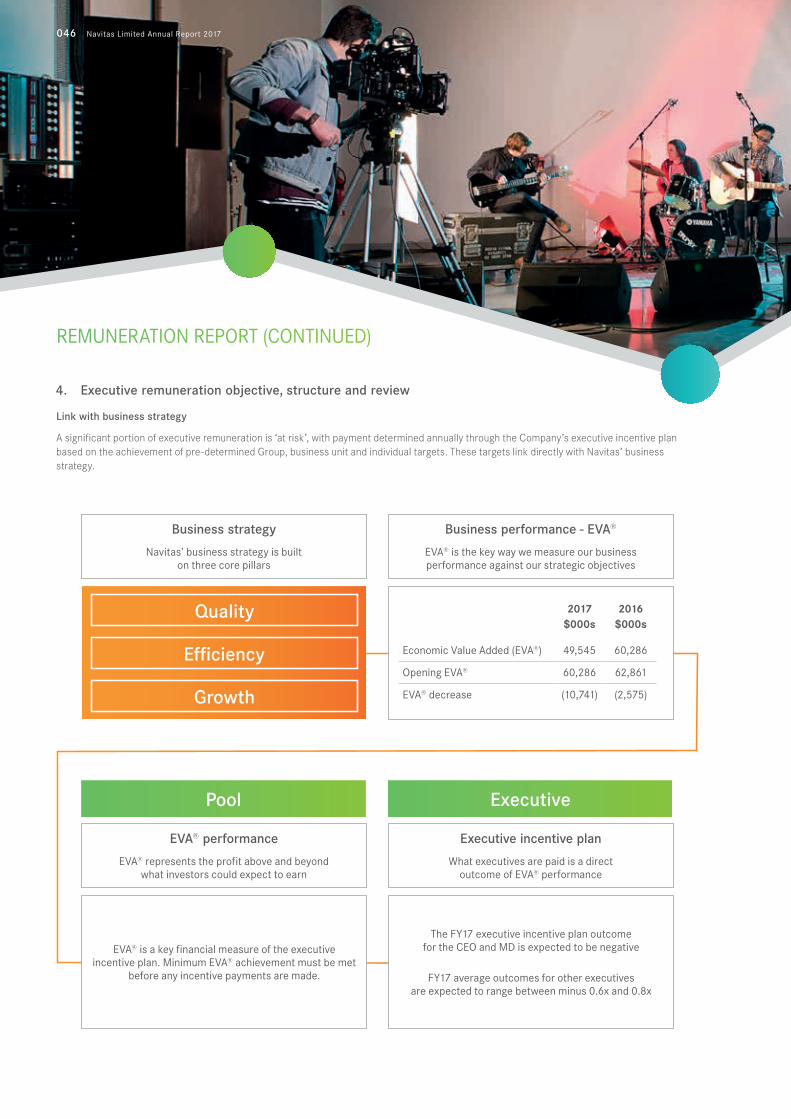
REMUNERATION REPORT (CONTINUED)
046 Navitas Limited Annual Report 2017
4. Executive remuneration objective, structure and review
Link with business strategy
A significant portion of executive remuneration is ‘at risk’, with payment determined annually through the Company’s executive incentive plan based on the achievement of pre-determined Group, business unit and individual targets. These targets link directly with Navitas’ business strategy.
Pool Executive
Business strategy
Navitas’ business strategy is built on three core pillars
Business performance - EVA®
EVA® is the key way we measure our business performance against our strategic objectives
EVA® performance
EVA® represents the profit above and beyond what investors could expect to earn
Executive incentive plan
What executives are paid is a direct outcome of EVA® performance
2017$000s
2016$000s
Economic Value Added (EVA®) 49,545 60,286
Opening EVA® 60,286 62,861
EVA® decrease (10,741) (2,575)
EVA® is a key financial measure of the executive incentive plan. Minimum EVA® achievement must be met
before any incentive payments are made.
The FY17 executive incentive plan outcome for the CEO and MD is expected to be negative
FY17 average outcomes for other executives are expected to range between minus 0.6x and 0.8x
Quality
Efficiency
Growth
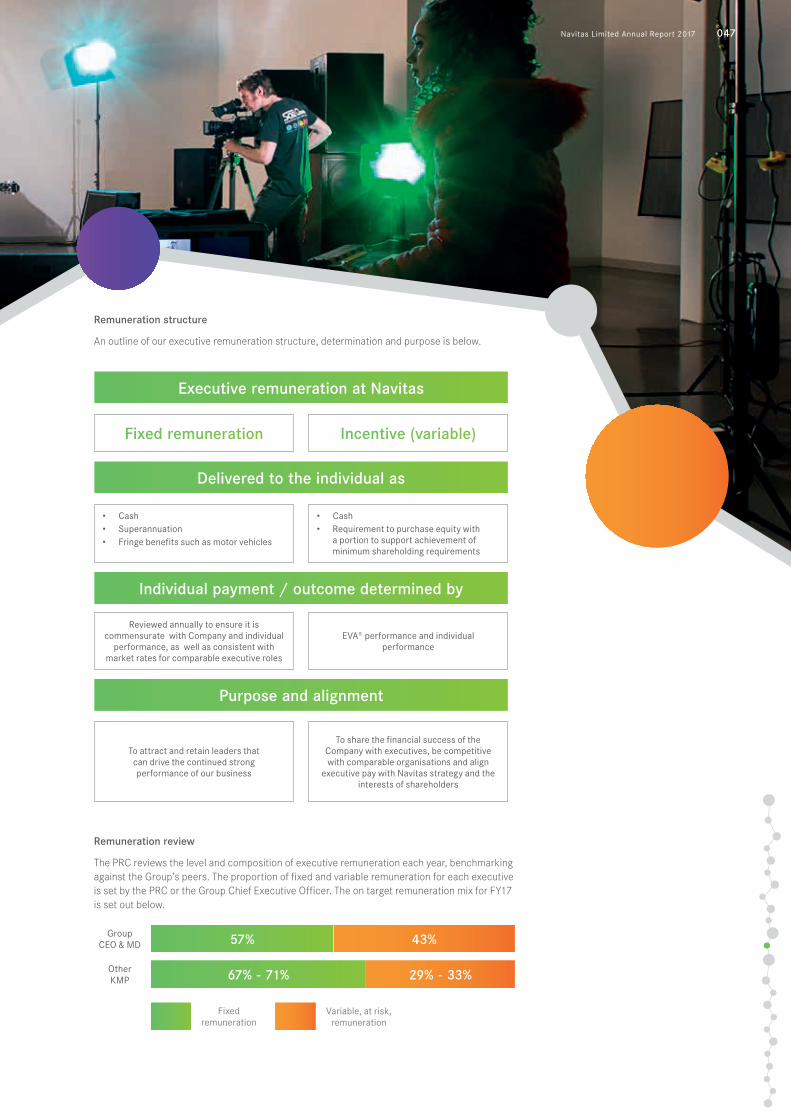
Navitas Limited Annual Report 2017 047
Remuneration structure
An outline of our executive remuneration structure, determination and purpose is below.
Remuneration review
The PRC reviews the level and composition of executive remuneration each year, benchmarking against the Group’s peers. The proportion of fixed and variable remuneration for each executive is set by the PRC or the Group Chief Executive Officer. The on target remuneration mix for FY17 is set out below.
Executive remuneration at Navitas
Fixed remuneration Incentive (variable)
Delivered to the individual as
• Cash • Superannuation• Fringe benefits such as motor vehicles
• Cash • Requirement to purchase equity with
a portion to support achievement of minimum shareholding requirements
Individual payment / outcome determined by
Reviewed annually to ensure it is commensurate with Company and individual
performance, as well as consistent with market rates for comparable executive roles
EVA® performance and individual performance
Purpose and alignment
To attract and retain leaders that can drive the continued strong performance of our business
To share the financial success of the Company with executives, be competitive with comparable organisations and align
executive pay with Navitas strategy and the interests of shareholders
57% 43%
67% - 71% 29% - 33%
Fixed remuneration
Group CEO & MD
Other KMP
Variable, at risk, remuneration
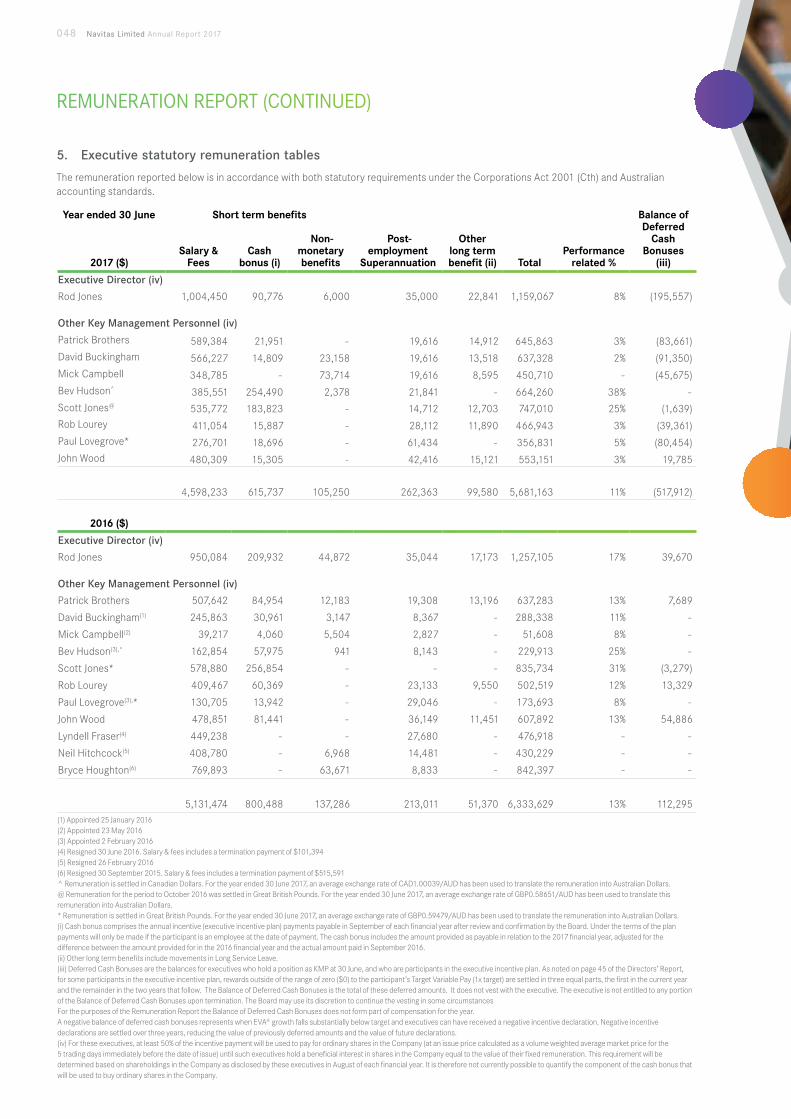
REMUNERATION REPORT (CONTINUED)
048 Navitas Limited Annual Report 2017
5. Executive statutory remuneration tables
The remuneration reported below is in accordance with both statutory requirements under the Corporations Act 2001 (Cth) and Australian accounting standards.
Year ended 30 June Short term benefits Balance of Deferred
Cash Bonuses
(iii)2017 ($)Salary &
FeesCash
bonus (i)
Non- monetary benefits
Post-employment
Superannuation
Other long term benefit (ii) Total
Performance related %
Executive Director (iv)
Rod Jones 1,004,450 90,776 6,000 35,000 22,841 1,159,067 8% (195,557)
Other Key Management Personnel (iv)
Patrick Brothers 589,384 21,951 - 19,616 14,912 645,863 3% (83,661)David Buckingham 566,227 14,809 23,158 19,616 13,518 637,328 2% (91,350)Mick Campbell 348,785 - 73,714 19,616 8,595 450,710 - (45,675)Bev Hudson^ 385,551 254,490 2,378 21,841 - 664,260 38% -Scott Jones@ 535,772 183,823 - 14,712 12,703 747,010 25% (1,639)Rob Lourey 411,054 15,887 - 28,112 11,890 466,943 3% (39,361)Paul Lovegrove* 276,701 18,696 - 61,434 - 356,831 5% (80,454)John Wood 480,309 15,305 - 42,416 15,121 553,151 3% 19,785
4,598,233 615,737 105,250 262,363 99,580 5,681,163 11% (517,912)
2016 ($)
Executive Director (iv)
Rod Jones 950,084 209,932 44,872 35,044 17,173 1,257,105 17% 39,670
Other Key Management Personnel (iv)
Patrick Brothers 507,642 84,954 12,183 19,308 13,196 637,283 13% 7,689
David Buckingham(1) 245,863 30,961 3,147 8,367 - 288,338 11% -
Mick Campbell(2) 39,217 4,060 5,504 2,827 - 51,608 8% -
Bev Hudson(3), 162,854 57,975 941 8,143 - 229,913 25% -
Scott Jones* 578,880 256,854 - - - 835,734 31% (3,279)
Rob Lourey 409,467 60,369 - 23,133 9,550 502,519 12% 13,329
Paul Lovegrove(3),* 130,705 13,942 - 29,046 - 173,693 8% -
John Wood 478,851 81,441 - 36,149 11,451 607,892 13% 54,886
Lyndell Fraser(4) 449,238 - - 27,680 - 476,918 - -
Neil Hitchcock(5) 408,780 - 6,968 14,481 - 430,229 - -
Bryce Houghton(6) 769,893 - 63,671 8,833 - 842,397 - -
5,131,474 800,488 137,286 213,011 51,370 6,333,629 13% 112,295(1) Appointed 25 January 2016 (2) Appointed 23 May 2016(3) Appointed 2 February 2016 (4) Resigned 30 June 2016. Salary & fees includes a termination payment of $101,394 (5) Resigned 26 February 2016 (6) Resigned 30 September 2015. Salary & fees includes a termination payment of $515,591
Remuneration is settled in Canadian Dollars. For the year ended 30 June 2017, an average exchange rate of CAD1.00039/AUD has been used to translate the remuneration into Australian Dollars.@ Remuneration for the period to October 2016 was settled in Great British Pounds. For the year ended 30 June 2017, an average exchange rate of GBP0.58651/AUD has been used to translate this remuneration into Australian Dollars.* Remuneration is settled in Great British Pounds. For the year ended 30 June 2017, an average exchange rate of GBP0.59479/AUD has been used to translate the remuneration into Australian Dollars.(i) Cash bonus comprises the annual incentive (executive incentive plan) payments payable in September of each financial year after review and confirmation by the Board. Under the terms of the plan payments will only be made if the participant is an employee at the date of payment. The cash bonus includes the amount provided as payable in relation to the 2017 financial year, adjusted for the difference between the amount provided for in the 2016 financial year and the actual amount paid in September 2016.(ii) Other long term benefits include movements in Long Service Leave.(iii) Deferred Cash Bonuses are the balances for executives who hold a position as KMP at 30 June, and who are participants in the executive incentive plan. As noted on page 45 of the Directors’ Report, for some participants in the executive incentive plan, rewards outside of the range of zero ($0) to the participant’s Target Variable Pay (1x target) are settled in three equal parts, the first in the current year and the remainder in the two years that follow. The Balance of Deferred Cash Bonuses is the total of these deferred amounts. It does not vest with the executive. The executive is not entitled to any portion of the Balance of Deferred Cash Bonuses upon termination. The Board may use its discretion to continue the vesting in some circumstancesFor the purposes of the Remuneration Report the Balance of Deferred Cash Bonuses does not form part of compensation for the year.A negative balance of deferred cash bonuses represents when EVA® growth falls substantially below target and executives can have received a negative incentive declaration. Negative incentive declarations are settled over three years, reducing the value of previously deferred amounts and the value of future declarations.(iv) For these executives, at least 50% of the incentive payment will be used to pay for ordinary shares in the Company (at an issue price calculated as a volume weighted average market price for the 5 trading days immediately before the date of issue) until such executives hold a beneficial interest in shares in the Company equal to the value of their fixed remuneration. This requirement will be determined based on shareholdings in the Company as disclosed by these executives in August of each financial year. It is therefore not currently possible to quantify the component of the cash bonus that will be used to buy ordinary shares in the Company.

Navitas Limited Annual Report 2017 049
Executive employment contracts
Remuneration and other terms of employment for the executives are formalised in employment contracts. A summary of the key employment contract terms for each executive is provided below. All executives’ employment contracts are for an unlimited duration.
None of the non-executive Directors have an employment contract with the Company.
Notice period1
Executive By Executive By Navitas Termination for Material Change
Rod Jones2, 3, 4 6 months 6 months 6 months by Company; 3 months by Executive
Patrick Brothers 3 months 3 months
David Buckingham 3 months 3 months
Mick Campbell 3 months 3 months
Bev Hudson 3 months 3 months
Scott Jones4, 5 3 months 3 months 6 months by Company; 2 months by Executive
Rob Lourey 3 months 3 months
Paul Lovegrove6 3 months 3 months
John Wood4,5 3 months 3 months 6 months by Company; 2 months by Executive1 Instead of giving the notice set out in the table above, the Company may terminate by paying remuneration equivalent to the notice period.2 Material Change is defined as there being a material diminution in the executive’s remuneration or responsibilities, or the executive is required to relocate outside their home state.3 Where the executives’ contract terminates as a result of a material change, the executive will be entitled to a payment equivalent to six months fixed remuneration.4 Material Change is defined as there being a material diminution in the executive’s responsibilities, or the executive is required to relocate outside their home state, or where a third party
acquires a controlling interest in the Company.5 Where an executive’s contract terminates as a result of a material change, they will be entitled to a payment equivalent to three months fixed remuneration.6 The 3 month notice period by the Company applies during the first five years of employment (employment commenced 20 July 2015).
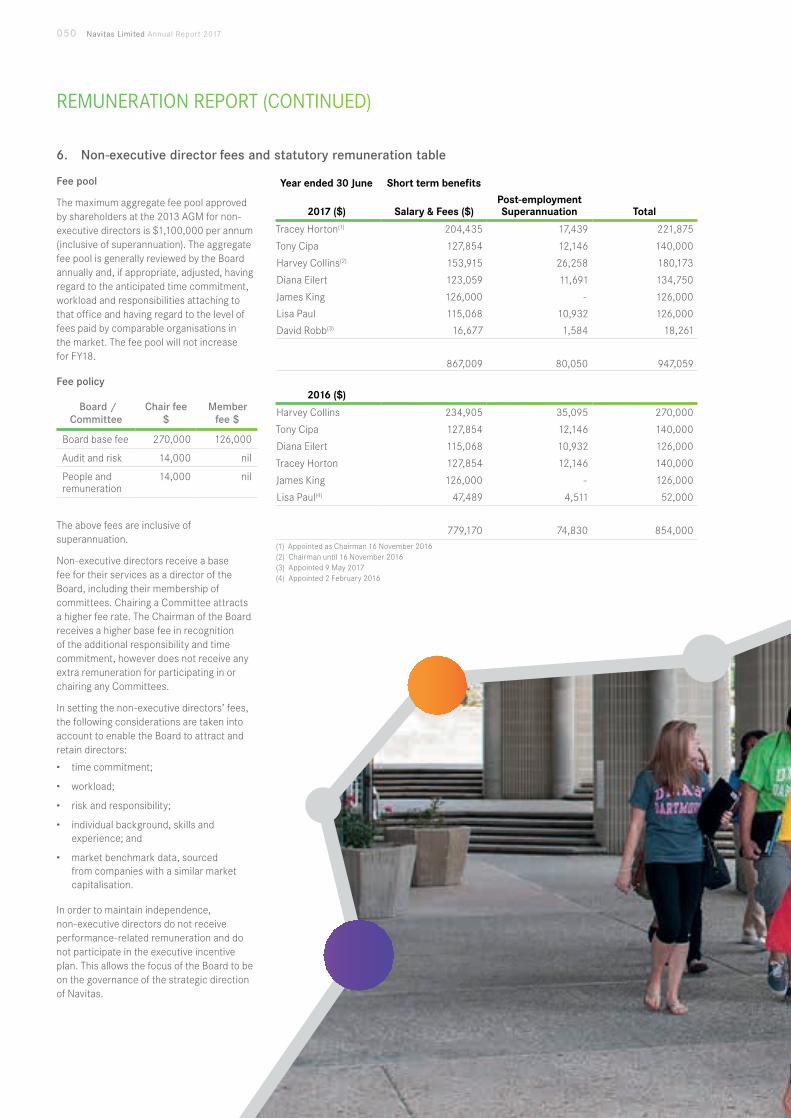
REMUNERATION REPORT (CONTINUED)
050 Navitas Limited Annual Report 2017
6. Non-executive director fees and statutory remuneration table
Fee pool
The maximum aggregate fee pool approved by shareholders at the 2013 AGM for non-executive directors is $1,100,000 per annum (inclusive of superannuation). The aggregate fee pool is generally reviewed by the Board annually and, if appropriate, adjusted, having regard to the anticipated time commitment, workload and responsibilities attaching to that office and having regard to the level of fees paid by comparable organisations in the market. The fee pool will not increase for FY18.
Fee policy
Board / Committee
Chair fee$
Member fee $
Board base fee 270,000 126,000
Audit and risk 14,000 nil
People and remuneration
14,000 nil
The above fees are inclusive of superannuation.
Non-executive directors receive a base fee for their services as a director of the Board, including their membership of committees. Chairing a Committee attracts a higher fee rate. The Chairman of the Board receives a higher base fee in recognition of the additional responsibility and time commitment, however does not receive any extra remuneration for participating in or chairing any Committees.
In setting the non-executive directors’ fees, the following considerations are taken into account to enable the Board to attract and retain directors:
• time commitment;
• workload;
• risk and responsibility;
• individual background, skills and experience; and
• market benchmark data, sourced from companies with a similar market capitalisation.
In order to maintain independence, non-executive directors do not receive performance-related remuneration and do not participate in the executive incentive plan. This allows the focus of the Board to be on the governance of the strategic direction of Navitas.
Year ended 30 June Short term benefits
2017 ($) Salary & Fees ($)Post-employment Superannuation Total
Tracey Horton(1) 204,435 17,439 221,875
Tony Cipa 127,854 12,146 140,000
Harvey Collins(2) 153,915 26,258 180,173
Diana Eilert 123,059 11,691 134,750
James King 126,000 - 126,000
Lisa Paul 115,068 10,932 126,000
David Robb(3) 16,677 1,584 18,261
867,009 80,050 947,059
2016 ($)
Harvey Collins 234,905 35,095 270,000
Tony Cipa 127,854 12,146 140,000
Diana Eilert 115,068 10,932 126,000
Tracey Horton 127,854 12,146 140,000
James King 126,000 - 126,000
Lisa Paul(4) 47,489 4,511 52,000
779,170 74,830 854,000(1) Appointed as Chairman 16 November 2016(2) Chairman until 16 November 2016(3) Appointed 9 May 2017(4) Appointed 2 February 2016
Navitas Limited Annual Report 2017 051
7. Remuneration governance
People and Remuneration Committee (PRC)
The PRC is responsible for determining and reviewing compensation arrangements for the directors, the Group Chief Executive Officer (Group CEO) and the executives. The PRC assesses the appropriateness of the nature and amount of remuneration of directors and executives on an annual basis by reference to relevant employment market conditions. The overall objective is to maintain maximum shareholder benefit from the retention of a high-quality Board and executive team.
Use of remuneration consultants
During FY17, the PRC engaged Ernst & Young (EY) and Juno Partners to provide advice on remuneration matters.
A remuneration recommendation, as defined in the Corporations Act 2001 (Cth), was provided by Juno Partners in relation to the Navitas incentive program used throughout
the Group. The recommendation provided covered the targets to be used to determine rewards at the Group and business unit level for the 2018–2020 financial years.
The Juno Partners engagement involved making a remuneration recommendation to the PRC that affected KMP. The consideration payable for this engagement was $27,125, excluding GST.
When remuneration consultants are engaged by the Board, it has put in place procedures to ensure remuneration recommendations made by remuneration consultants are free from undue influence by those KMP to whom the recommendation relates. These procedures include:
• instructions for preparing remuneration recommendations are only issued to remuneration consultants by the Chairman of the PRC or another non-executive director;
• the role of executives in any engagement regarding a remuneration
recommendation is limited to the provision of information and opinions on current and past practices and does not include any participation in the development of recommendations;
• remuneration recommendations by remuneration consultants are made directly to the PRC; and
• all remuneration recommendations made by remuneration consultants are required to include a declaration about whether the remuneration recommendation is free from undue influence by the members of the KMP.
With respect to remuneration recommendation made during the year and disclosed above, the procedures outlined above were adhered to and hence the Board is satisfied that the remuneration recommendations made were free of undue influence by the KMP to whom the recommendations related.
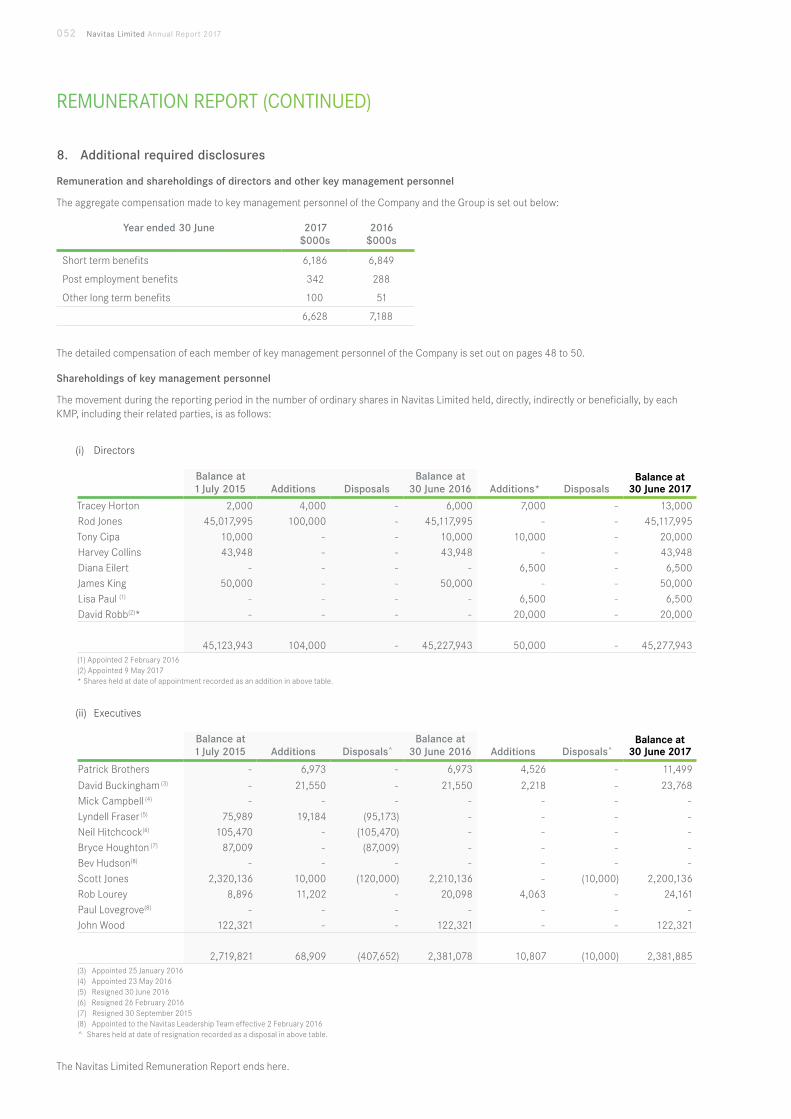
REMUNERATION REPORT (CONTINUED)
052 Navitas Limited Annual Report 2017
8. Additional required disclosures
Remuneration and shareholdings of directors and other key management personnel
The aggregate compensation made to key management personnel of the Company and the Group is set out below:
Year ended 30 June 2017$000s
2016$000s
Short term benefits 6,186 6,849
Post employment benefits 342 288
Other long term benefits 100 51
6,628 7,188
The detailed compensation of each member of key management personnel of the Company is set out on pages 48 to 50.
Shareholdings of key management personnel
The movement during the reporting period in the number of ordinary shares in Navitas Limited held, directly, indirectly or beneficially, by each KMP, including their related parties, is as follows:
(i) Directors
Balance at 1 July 2015 Additions Disposals
Balance at 30 June 2016 Additions* Disposals
Balance at 30 June 2017
Tracey Horton 2,000 4,000 - 6,000 7,000 - 13,000Rod Jones 45,017,995 100,000 - 45,117,995 - - 45,117,995Tony Cipa 10,000 - - 10,000 10,000 - 20,000Harvey Collins 43,948 - - 43,948 - - 43,948Diana Eilert - - - - 6,500 - 6,500James King 50,000 - - 50,000 - - 50,000Lisa Paul (1) - - - - 6,500 - 6,500David Robb(2)* - - - - 20,000 - 20,000
45,123,943 104,000 - 45,227,943 50,000 - 45,277,943(1) Appointed 2 February 2016 (2) Appointed 9 May 2017 * Shares held at date of appointment recorded as an addition in above table.
(ii) Executives
Balance at 1 July 2015 Additions Disposals^
Balance at 30 June 2016 Additions Disposals^
Balance at 30 June 2017
Patrick Brothers - 6,973 - 6,973 4,526 - 11,499
David Buckingham (3) - 21,550 - 21,550 2,218 - 23,768Mick Campbell (4) - - - - - - -Lyndell Fraser (5) 75,989 19,184 (95,173) - - - -Neil Hitchcock(6) 105,470 - (105,470) - - - -Bryce Houghton (7) 87,009 - (87,009) - - - -Bev Hudson(8) - - - - - - -Scott Jones 2,320,136 10,000 (120,000) 2,210,136 - (10,000) 2,200,136Rob Lourey 8,896 11,202 - 20,098 4,063 - 24,161Paul Lovegrove(8) - - - - - - -John Wood 122,321 - - 122,321 - - 122,321
2,719,821 68,909 (407,652) 2,381,078 10,807 (10,000) 2,381,885(3) Appointed 25 January 2016(4) Appointed 23 May 2016(5) Resigned 30 June 2016(6) Resigned 26 February 2016(7) Resigned 30 September 2015(8) Appointed to the Navitas Leadership Team effective 2 February 2016^ Shares held at date of resignation recorded as a disposal in above table.
The Navitas Limited Remuneration Report ends here.
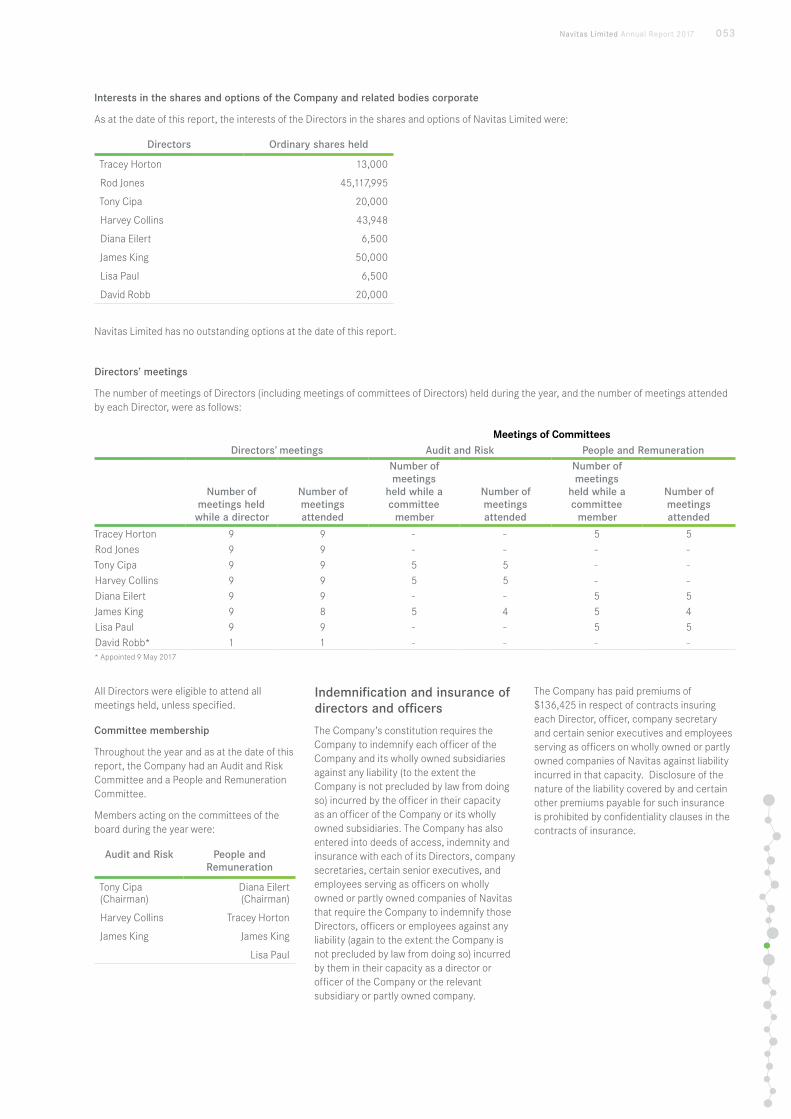
Navitas Limited Annual Report 2017 053
Interests in the shares and options of the Company and related bodies corporate
As at the date of this report, the interests of the Directors in the shares and options of Navitas Limited were:
Directors Ordinary shares held
Tracey Horton 13,000
Rod Jones 45,117,995
Tony Cipa 20,000
Harvey Collins 43,948
Diana Eilert 6,500
James King 50,000
Lisa Paul 6,500
David Robb 20,000
Navitas Limited has no outstanding options at the date of this report.
Directors’ meetings
The number of meetings of Directors (including meetings of committees of Directors) held during the year, and the number of meetings attended by each Director, were as follows:
Meetings of CommitteesDirectors’ meetings Audit and Risk People and Remuneration
Number of meetings held while a director
Number of meetings attended
Number of meetings
held while a committee
member
Number of meetings attended
Number of meetings
held while a committee
member
Number of meetings attended
Tracey Horton 9 9 - - 5 5Rod Jones 9 9 - - - -Tony Cipa 9 9 5 5 - -Harvey Collins 9 9 5 5 - -Diana Eilert 9 9 - - 5 5James King 9 8 5 4 5 4Lisa Paul 9 9 - - 5 5David Robb* 1 1 - - - -* Appointed 9 May 2017
All Directors were eligible to attend all meetings held, unless specified.
Committee membership
Throughout the year and as at the date of this report, the Company had an Audit and Risk Committee and a People and Remuneration Committee.
Members acting on the committees of the board during the year were:
Audit and Risk People and Remuneration
Tony Cipa (Chairman)
Diana Eilert (Chairman)
Harvey Collins Tracey Horton
James King James King
Lisa Paul
Indemnification and insurance of directors and officers
The Company’s constitution requires the Company to indemnify each officer of the Company and its wholly owned subsidiaries against any liability (to the extent the Company is not precluded by law from doing so) incurred by the officer in their capacity as an officer of the Company or its wholly owned subsidiaries. The Company has also entered into deeds of access, indemnity and insurance with each of its Directors, company secretaries, certain senior executives, and employees serving as officers on wholly owned or partly owned companies of Navitas that require the Company to indemnify those Directors, officers or employees against any liability (again to the extent the Company is not precluded by law from doing so) incurred by them in their capacity as a director or officer of the Company or the relevant subsidiary or partly owned company.
The Company has paid premiums of $136,425 in respect of contracts insuring each Director, officer, company secretary and certain senior executives and employees serving as officers on wholly owned or partly owned companies of Navitas against liability incurred in that capacity. Disclosure of the nature of the liability covered by and certain other premiums payable for such insurance is prohibited by confidentiality clauses in the contracts of insurance.
DIRECTOR'S REPORT (CONTINUED)
054 Navitas Limited Annual Report 2017
Company secretaries
Hugh Hangchi, LLB, BCommCompany Secretary & Group General Counsel
Appointed 27 April 2005
Mr Hangchi is a practising lawyer and has experience in providing advice to directors of listed and unlisted public companies in relation to directors’ duties, the Corporations Act, the Listing Rules and corporate governance. He has also completed the Company Directors Course Diploma.
Prior to joining the Company, Mr Hangchi was a senior associate at a national law firm where he specialised in capital raisings, mergers and acquisitions and regulated takeovers. He has also worked as a solicitor with the Australian Securities and Investments Commission.
Matthew Rumpus, LLB (Hons), BComm Assistant Company Secretary & Senior Legal Counsel
Appointed as Assistant Company Secretary 14 January 2016
Mr Rumpus is a practising lawyer and has experience in providing advice to directors of listed public companies in relation to directors’ duties, the Corporations Act, the Listing Rules and corporate governance. Prior to joining the Company, Mr Rumpus was a special counsel at a global law firm where he specialised in corporate law including corporate governance, equity capital markets and mergers and acquisitions.
Corporate information
Corporate structure
Navitas Limited is a company limited by shares that is registered and domiciled in Australia. Navitas Limited has prepared a consolidated financial report incorporating the entities that it controlled during the financial year as listed in note 6 of the financial statements.
Nature of operations and principal activities
The principal activities during the financial year of the Group were of the provision of educational services to domestic and overseas students. There have been no significant changes in the nature of those activities during the year.
Operating and financial review
A review of the Group’s operations and financial performance has been provided on pages 6 to 27.
Dividends
Cents $000s Payment date
Final dividend recommended - on ordinary shares for 2017
10.1 36,186 15 September 2017
Interim dividend paid during the year - on ordinary shares
9.4 33,794 15 March 2017
Final dividend paid for 2016 - on ordinary shares
9.9 36,593 15 September 2016
Significant changes in the state of affairs
There has been no significant change in the state of affairs of the Company since the end of the financial year.
Since the reporting date, the Directors declared a final dividend on ordinary shares in respect of the 2017 financial year. The total amount of dividend is $36.186m, which represents a fully franked dividend of 10.1 cents per share. The dividend has not been provided for in the 30 June 2017 financial statements as the dividend was declared after the end of the financial year.
Future developments
Likely developments in, expected results of the operations of the Group in subsequent years and the Group’s business strategies are referred to elsewhere in this report, particularly on pages 6 to 27. In the opinion of the Directors, further information on those matters could prejudice the interests of the Company and the Group and has therefore not been included in this report.
Environmental regulation and performance
The Group’s operations are not subject to any significant environmental regulations under the laws of the countries it operates in. The Board believes that the Group has adequate systems in place for the monitoring of environmental regulations and is not aware of any such regulations that apply to the Group.
Rounding
The amounts contained in this report and in the financial report have been rounded to the nearest $1,000 (where rounding is applicable) under the option available to the Company under ASIC Class Order 2016/191. The Company is an entity to which the Class Order applies.
Non-audit services
Details of the amounts paid to the auditor of the Company, Deloitte Touche Tohmatsu, and its related practices for audit and non-audit services provided during the year are set out in note 6.3 to the financial statements.
Auditor’s independence declaration
The auditor’s independence declaration is set on page 55 and forms part of the directors’ report for the financial year ended 30 June 2017.
Independent Audit and Remuneration Report
The required disclosures as included on pages 40 to 52 of the remuneration report have been audited by Deloitte Touche Tohmatsu.
The directors’ report, including the remuneration report, is signed in accordance with a resolution of the Directors.
ROD JONESGroup Chief Executive Officer and Managing Director
Perth, Western Australia, 31 July 2017
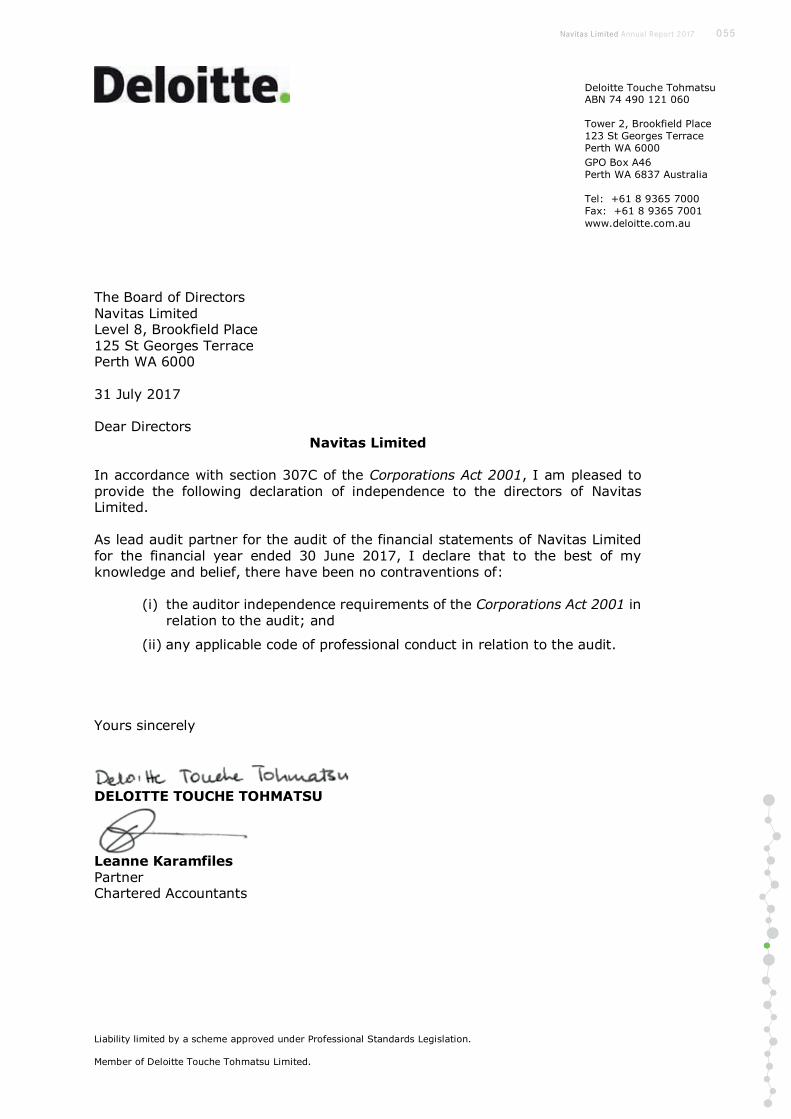
Navitas Limited Annual Report 2017 055

FINANCIAL STATEMENTS AND NOTES

Navitas Limited Annual Report 2017 057
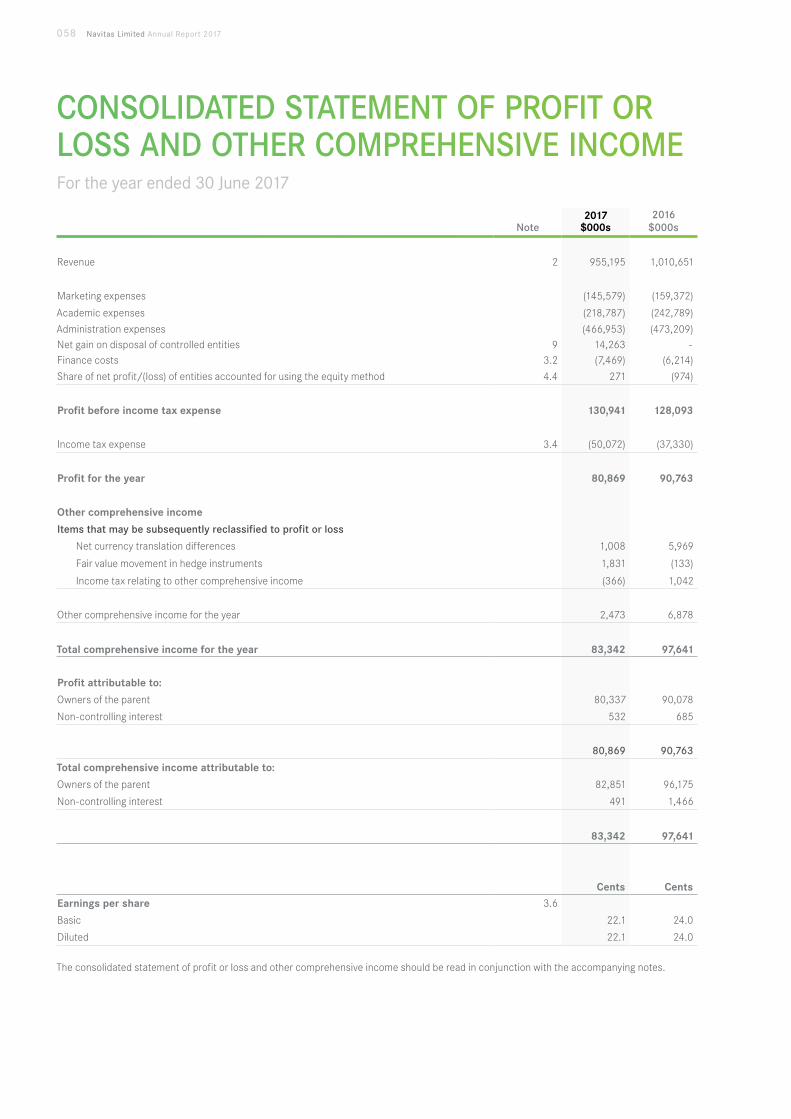
Note2017
$000s2016
$000s
Revenue 2 955,195 1,010,651
Marketing expenses (145,579) (159,372)
Academic expenses (218,787) (242,789)
Administration expenses (466,953) (473,209)Net gain on disposal of controlled entities 9 14,263 -Finance costs 3.2 (7,469) (6,214)
Share of net profit/(loss) of entities accounted for using the equity method 4.4 271 (974)
Profit before income tax expense 130,941 128,093
Income tax expense 3.4 (50,072) (37,330)
Profit for the year 80,869 90,763
Other comprehensive income
Items that may be subsequently reclassified to profit or loss
Net currency translation differences 1,008 5,969
Fair value movement in hedge instruments 1,831 (133)
Income tax relating to other comprehensive income (366) 1,042
Other comprehensive income for the year 2,473 6,878
Total comprehensive income for the year 83,342 97,641
Profit attributable to:
Owners of the parent 80,337 90,078
Non-controlling interest 532 685
80,869 90,763
Total comprehensive income attributable to:
Owners of the parent 82,851 96,175
Non-controlling interest 491 1,466
83,342 97,641
Cents CentsEarnings per share 3.6
Basic 22.1 24.0
Diluted 22.1 24.0
The consolidated statement of profit or loss and other comprehensive income should be read in conjunction with the accompanying notes.
CONSOLIDATED STATEMENT OF PROFIT OR LOSS AND OTHER COMPREHENSIVE INCOME For the year ended 30 June 2017
058 Navitas Limited Annual Report 2017
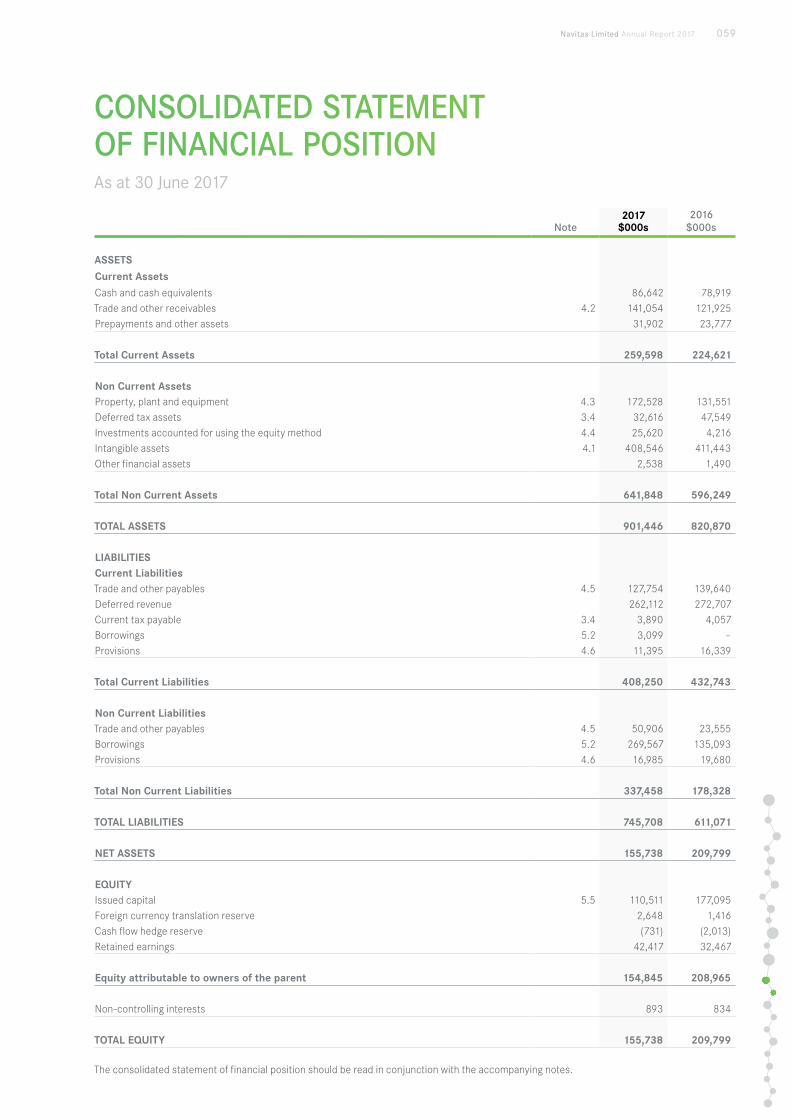
CONSOLIDATED STATEMENT OF FINANCIAL POSITION As at 30 June 2017
Note2017
$000s2016
$000s
ASSETSCurrent AssetsCash and cash equivalents 86,642 78,919Trade and other receivables 4.2 141,054 121,925Prepayments and other assets 31,902 23,777
Total Current Assets 259,598 224,621
Non Current AssetsProperty, plant and equipment 4.3 172,528 131,551Deferred tax assets 3.4 32,616 47,549Investments accounted for using the equity method 4.4 25,620 4,216Intangible assets 4.1 408,546 411,443Other financial assets 2,538 1,490
Total Non Current Assets 641,848 596,249
TOTAL ASSETS 901,446 820,870
LIABILITIESCurrent LiabilitiesTrade and other payables 4.5 127,754 139,640Deferred revenue 262,112 272,707Current tax payable 3.4 3,890 4,057Borrowings 5.2 3,099 -Provisions 4.6 11,395 16,339
Total Current Liabilities 408,250 432,743
Non Current LiabilitiesTrade and other payables 4.5 50,906 23,555Borrowings 5.2 269,567 135,093Provisions 4.6 16,985 19,680
Total Non Current Liabilities 337,458 178,328
TOTAL LIABILITIES 745,708 611,071
NET ASSETS 155,738 209,799
EQUITYIssued capital 5.5 110,511 177,095Foreign currency translation reserve 2,648 1,416Cash flow hedge reserve (731) (2,013)Retained earnings 42,417 32,467
Equity attributable to owners of the parent 154,845 208,965
Non-controlling interests 893 834
TOTAL EQUITY 155,738 209,799
The consolidated statement of financial position should be read in conjunction with the accompanying notes.
Navitas Limited Annual Report 2017 059
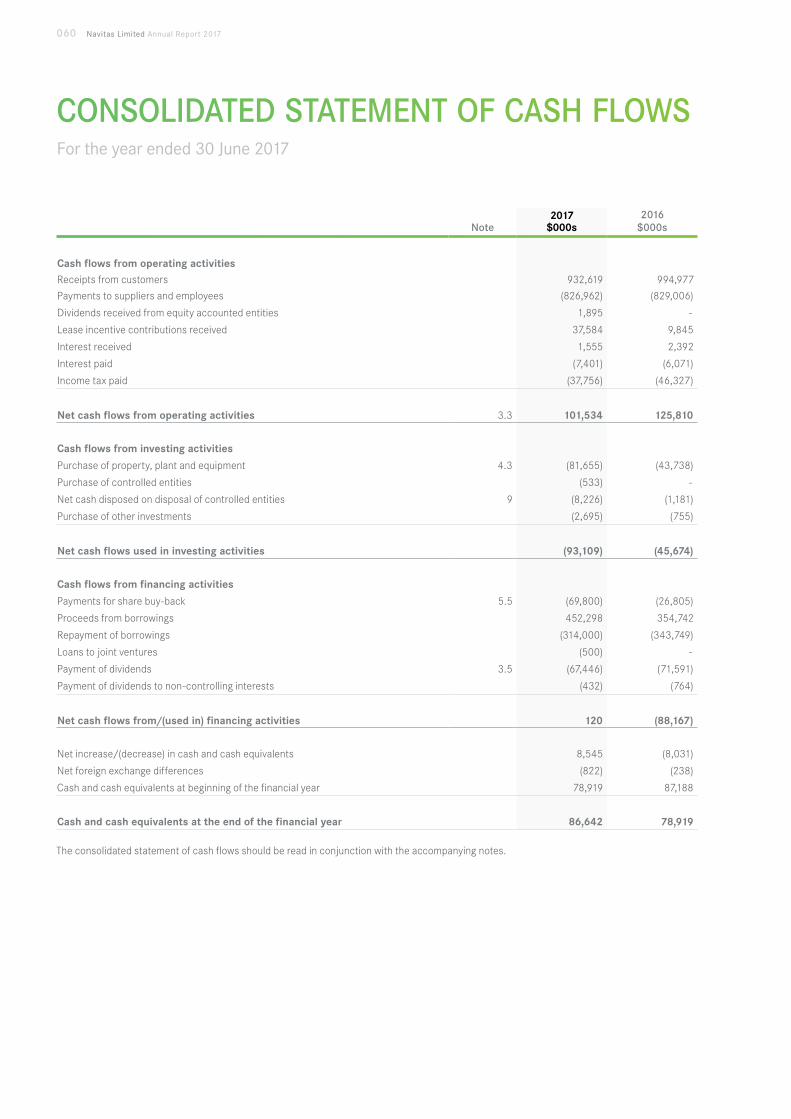
CONSOLIDATED STATEMENT OF CASH FLOWS For the year ended 30 June 2017
Note2017
$000s2016
$000s
Cash flows from operating activitiesReceipts from customers 932,619 994,977
Payments to suppliers and employees (826,962) (829,006)
Dividends received from equity accounted entities 1,895 -
Lease incentive contributions received 37,584 9,845
Interest received 1,555 2,392
Interest paid (7,401) (6,071)
Income tax paid (37,756) (46,327)
Net cash flows from operating activities 3.3 101,534 125,810
Cash flows from investing activities
Purchase of property, plant and equipment 4.3 (81,655) (43,738)
Purchase of controlled entities (533) -
Net cash disposed on disposal of controlled entities 9 (8,226) (1,181)
Purchase of other investments (2,695) (755)
Net cash flows used in investing activities (93,109) (45,674)
Cash flows from financing activities
Payments for share buy-back 5.5 (69,800) (26,805)
Proceeds from borrowings 452,298 354,742
Repayment of borrowings (314,000) (343,749)
Loans to joint ventures (500) -
Payment of dividends 3.5 (67,446) (71,591)
Payment of dividends to non-controlling interests (432) (764)
Net cash flows from/(used in) financing activities 120 (88,167)
Net increase/(decrease) in cash and cash equivalents 8,545 (8,031)
Net foreign exchange differences (822) (238)
Cash and cash equivalents at beginning of the financial year 78,919 87,188
Cash and cash equivalents at the end of the financial year 86,642 78,919
The consolidated statement of cash flows should be read in conjunction with the accompanying notes.
060 Navitas Limited Annual Report 2017
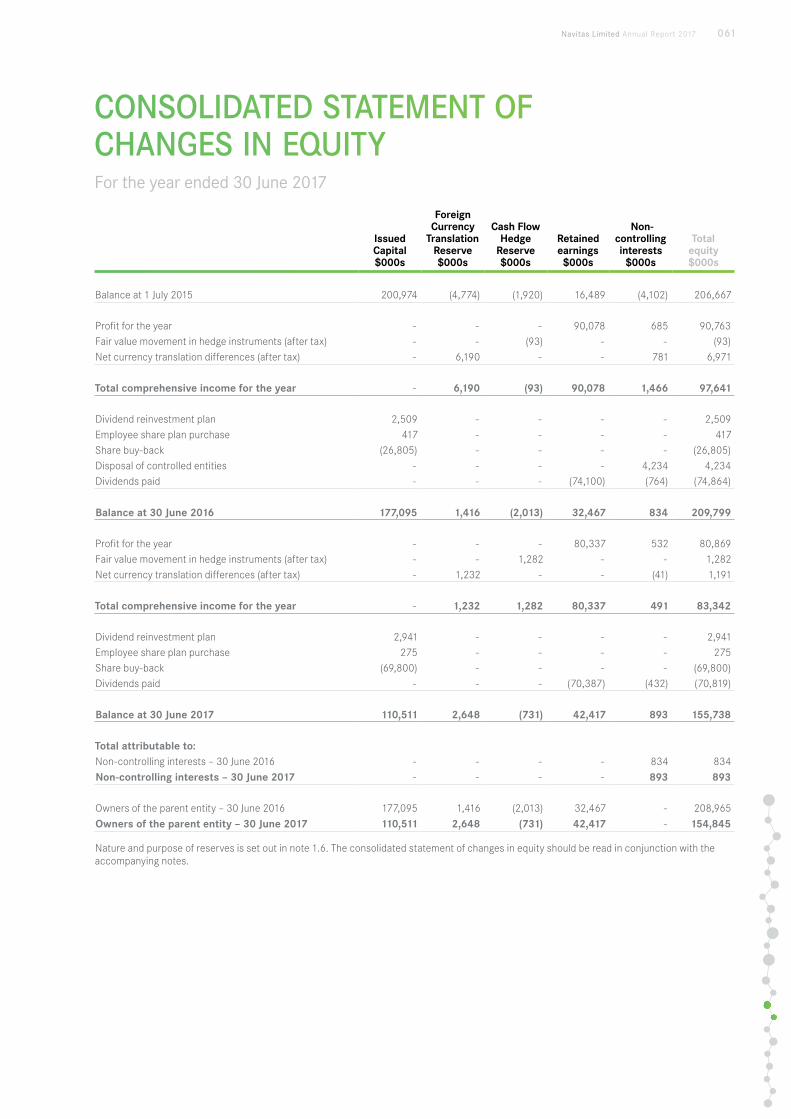
CONSOLIDATED STATEMENT OF CHANGES IN EQUITY For the year ended 30 June 2017
Issued Capital $000s
Foreign Currency
Translation Reserve $000s
Cash Flow Hedge
Reserve $000s
Retained earnings $000s
Non-controlling interests $000s
Total equity $000s
Balance at 1 July 2015 200,974 (4,774) (1,920) 16,489 (4,102) 206,667
Profit for the year - - - 90,078 685 90,763Fair value movement in hedge instruments (after tax) - - (93) - - (93)Net currency translation differences (after tax) - 6,190 - - 781 6,971
Total comprehensive income for the year - 6,190 (93) 90,078 1,466 97,641
Dividend reinvestment plan 2,509 - - - - 2,509Employee share plan purchase 417 - - - - 417Share buy-back (26,805) - - - - (26,805)Disposal of controlled entities - - - - 4,234 4,234Dividends paid - - - (74,100) (764) (74,864)
Balance at 30 June 2016 177,095 1,416 (2,013) 32,467 834 209,799
Profit for the year - - - 80,337 532 80,869Fair value movement in hedge instruments (after tax) - - 1,282 - - 1,282Net currency translation differences (after tax) - 1,232 - - (41) 1,191
Total comprehensive income for the year - 1,232 1,282 80,337 491 83,342
Dividend reinvestment plan 2,941 - - - - 2,941Employee share plan purchase 275 - - - - 275Share buy-back (69,800) - - - - (69,800)Dividends paid - - - (70,387) (432) (70,819)
Balance at 30 June 2017 110,511 2,648 (731) 42,417 893 155,738
Total attributable to:Non-controlling interests – 30 June 2016 - - - - 834 834
Non-controlling interests – 30 June 2017 - - - - 893 893
Owners of the parent entity – 30 June 2016 177,095 1,416 (2,013) 32,467 - 208,965
Owners of the parent entity – 30 June 2017 110,511 2,648 (731) 42,417 - 154,845
Nature and purpose of reserves is set out in note 1.6. The consolidated statement of changes in equity should be read in conjunction with the accompanying notes.
Navitas Limited Annual Report 2017 061
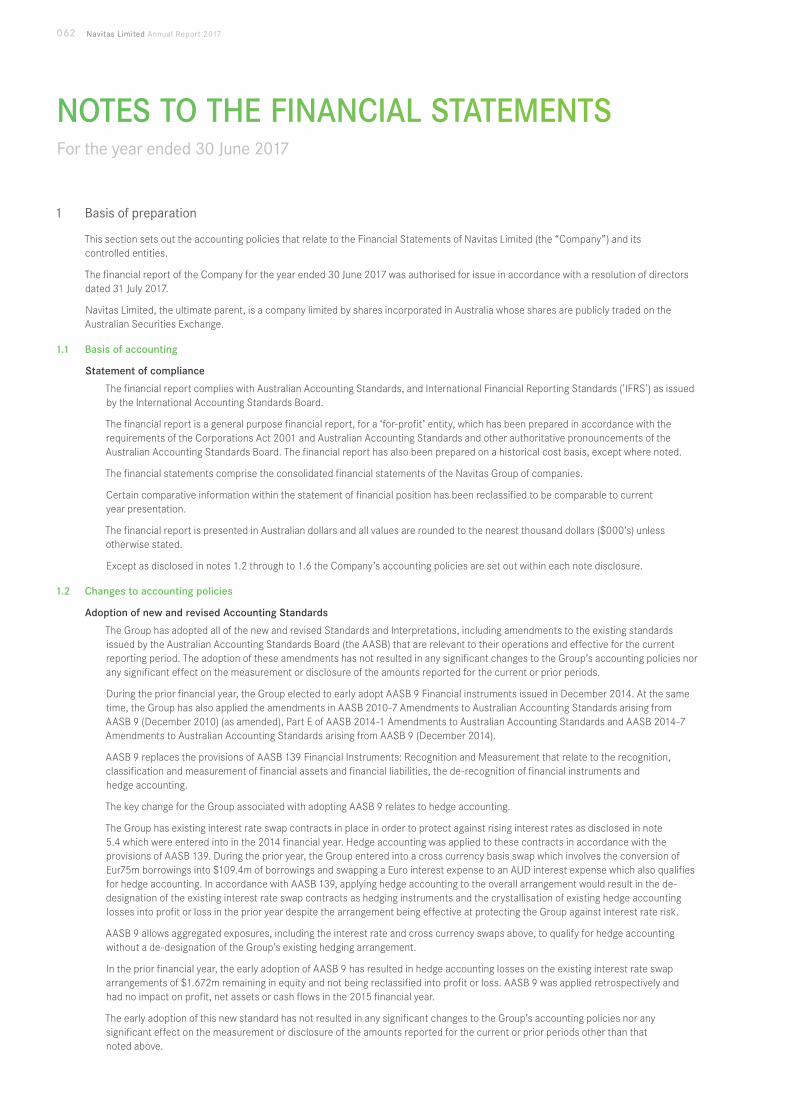
NOTES TO THE FINANCIAL STATEMENTS For the year ended 30 June 2017
1 Basis of preparation
This section sets out the accounting policies that relate to the Financial Statements of Navitas Limited (the “Company”) and its controlled entities.
The financial report of the Company for the year ended 30 June 2017 was authorised for issue in accordance with a resolution of directors dated 31 July 2017.
Navitas Limited, the ultimate parent, is a company limited by shares incorporated in Australia whose shares are publicly traded on the Australian Securities Exchange.
1.1 Basis of accounting
Statement of compliance
The financial report complies with Australian Accounting Standards, and International Financial Reporting Standards ('IFRS') as issued by the International Accounting Standards Board.
The financial report is a general purpose financial report, for a ‘for-profit’ entity, which has been prepared in accordance with the requirements of the Corporations Act 2001 and Australian Accounting Standards and other authoritative pronouncements of the Australian Accounting Standards Board. The financial report has also been prepared on a historical cost basis, except where noted.
The financial statements comprise the consolidated financial statements of the Navitas Group of companies.
Certain comparative information within the statement of financial position has been reclassified to be comparable to current year presentation.
The financial report is presented in Australian dollars and all values are rounded to the nearest thousand dollars ($000’s) unless otherwise stated.
Except as disclosed in notes 1.2 through to 1.6 the Company’s accounting policies are set out within each note disclosure.
1.2 Changes to accounting policies
Adoption of new and revised Accounting Standards
The Group has adopted all of the new and revised Standards and Interpretations, including amendments to the existing standards issued by the Australian Accounting Standards Board (the AASB) that are relevant to their operations and effective for the current reporting period. The adoption of these amendments has not resulted in any significant changes to the Group’s accounting policies nor any significant effect on the measurement or disclosure of the amounts reported for the current or prior periods.
During the prior financial year, the Group elected to early adopt AASB 9 Financial instruments issued in December 2014. At the same time, the Group has also applied the amendments in AASB 2010-7 Amendments to Australian Accounting Standards arising from AASB 9 (December 2010) (as amended), Part E of AASB 2014-1 Amendments to Australian Accounting Standards and AASB 2014-7 Amendments to Australian Accounting Standards arising from AASB 9 (December 2014).
AASB 9 replaces the provisions of AASB 139 Financial Instruments: Recognition and Measurement that relate to the recognition, classification and measurement of financial assets and financial liabilities, the de-recognition of financial instruments and hedge accounting.
The key change for the Group associated with adopting AASB 9 relates to hedge accounting.
The Group has existing interest rate swap contracts in place in order to protect against rising interest rates as disclosed in note 5.4 which were entered into in the 2014 financial year. Hedge accounting was applied to these contracts in accordance with the provisions of AASB 139. During the prior year, the Group entered into a cross currency basis swap which involves the conversion of Eur75m borrowings into $109.4m of borrowings and swapping a Euro interest expense to an AUD interest expense which also qualifies for hedge accounting. In accordance with AASB 139, applying hedge accounting to the overall arrangement would result in the de-designation of the existing interest rate swap contracts as hedging instruments and the crystallisation of existing hedge accounting losses into profit or loss in the prior year despite the arrangement being effective at protecting the Group against interest rate risk.
AASB 9 allows aggregated exposures, including the interest rate and cross currency swaps above, to qualify for hedge accounting without a de-designation of the Group’s existing hedging arrangement.
In the prior financial year, the early adoption of AASB 9 has resulted in hedge accounting losses on the existing interest rate swap arrangements of $1.672m remaining in equity and not being reclassified into profit or loss. AASB 9 was applied retrospectively and had no impact on profit, net assets or cash flows in the 2015 financial year.
The early adoption of this new standard has not resulted in any significant changes to the Group’s accounting policies nor any significant effect on the measurement or disclosure of the amounts reported for the current or prior periods other than that noted above.
062 Navitas Limited Annual Report 2017
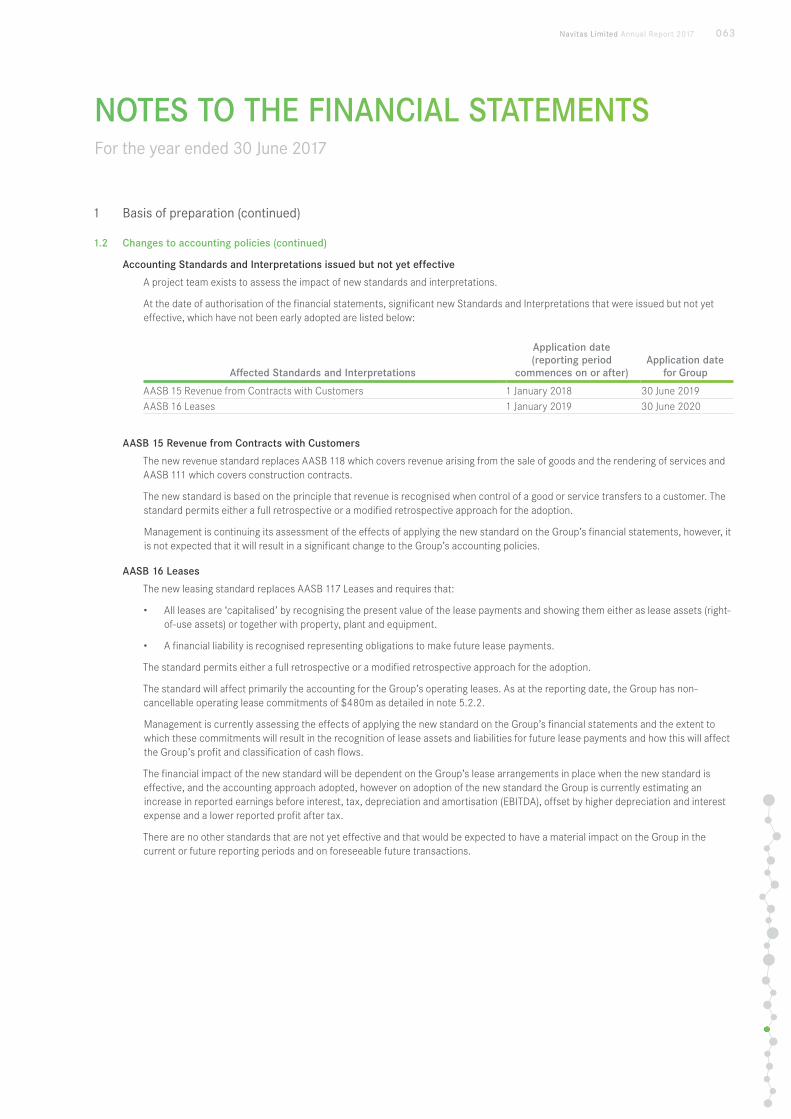
NOTES TO THE FINANCIAL STATEMENTS For the year ended 30 June 2017
1 Basis of preparation (continued)
1.2 Changes to accounting policies (continued)
Accounting Standards and Interpretations issued but not yet effective
A project team exists to assess the impact of new standards and interpretations.
At the date of authorisation of the financial statements, significant new Standards and Interpretations that were issued but not yet effective, which have not been early adopted are listed below:
Affected Standards and Interpretations
Application date (reporting period
commences on or after)Application date
for Group
AASB 15 Revenue from Contracts with Customers 1 January 2018 30 June 2019AASB 16 Leases 1 January 2019 30 June 2020
AASB 15 Revenue from Contracts with Customers
The new revenue standard replaces AASB 118 which covers revenue arising from the sale of goods and the rendering of services and AASB 111 which covers construction contracts.
The new standard is based on the principle that revenue is recognised when control of a good or service transfers to a customer. The standard permits either a full retrospective or a modified retrospective approach for the adoption.
Management is continuing its assessment of the effects of applying the new standard on the Group’s financial statements, however, it is not expected that it will result in a significant change to the Group’s accounting policies.
AASB 16 Leases
The new leasing standard replaces AASB 117 Leases and requires that:
• All leases are ‘capitalised’ by recognising the present value of the lease payments and showing them either as lease assets (right-of-use assets) or together with property, plant and equipment.
• A financial liability is recognised representing obligations to make future lease payments.
The standard permits either a full retrospective or a modified retrospective approach for the adoption.
The standard will affect primarily the accounting for the Group’s operating leases. As at the reporting date, the Group has non-cancellable operating lease commitments of $480m as detailed in note 5.2.2.
Management is currently assessing the effects of applying the new standard on the Group’s financial statements and the extent to which these commitments will result in the recognition of lease assets and liabilities for future lease payments and how this will affect the Group’s profit and classification of cash flows.
The financial impact of the new standard will be dependent on the Group’s lease arrangements in place when the new standard is effective, and the accounting approach adopted, however on adoption of the new standard the Group is currently estimating an increase in reported earnings before interest, tax, depreciation and amortisation (EBITDA), offset by higher depreciation and interest expense and a lower reported profit after tax.
There are no other standards that are not yet effective and that would be expected to have a material impact on the Group in the current or future reporting periods and on foreseeable future transactions.
Navitas Limited Annual Report 2017 063
NOTES TO THE FINANCIAL STATEMENTS For the year ended 30 June 2017
1 Basis of preparation (continued)
1.3 Significant accounting judgements, estimates and assumptions
In applying the Group's accounting policies management continually evaluates judgements, estimates and assumptions based on experience and other factors, including expectations of future events that may have an impact on the Group. All judgements, estimates and assumptions made are believed to be reasonable based on the most current set of circumstances available to management. Actual results may differ from the judgements, estimates and assumptions.
Significant judgements, estimates and assumptions made by management in the preparation of these financial statements are outlined below:
Significant accounting judgements
In the process of applying the Group’s accounting policies, management has made the following judgements, apart from those involving estimations, which have the most significant effect on the amount recognised in the financial statements: Recoverability of deferred tax assets (refer note 3.4).
Significant accounting estimates and assumptions
The carrying amounts of certain assets and liabilities are often determined based on estimates and assumptions of future events. The key estimates and assumptions that have a significant risk of causing a material adjustment to the carrying amounts of certain assets and liabilities within the next annual reporting period are: Impairment of goodwill and intangibles with indefinite useful lives (refer note 4.1).
1.4 Basis of consolidation
The consolidated financial statements comprise the financial statements of Navitas Limited and its subsidiaries (as outlined in note 6.1) as at, and for the period ended, 30 June each year (the Group).
Subsidiaries are all those entities over which the Group has control. Control is achieved when the Group has power over an entity and is exposed to, or has rights over, the variable returns of the entity, as well as the ability to use this power to affect the variable returns of the entity.
The financial statements of the subsidiaries are prepared for the same reporting period as Navitas, using consistent accounting policies. In preparing the consolidated financial statements, all intercompany balances and transactions, income and expenses and profit and losses resulting from intragroup transactions have been eliminated in full.
Subsidiaries are fully consolidated from the date on which control is obtained by the Group and cease to be consolidated from the date on which control is transferred out of the Group.
A change in the ownership interest of a subsidiary that does not result in a loss of control, is accounted for as an equity transaction.
Non-controlling interests are allocated their share of net profit after tax in the statement of comprehensive income and are presented within equity in the consolidated statement of financial position, separately from the equity of the owners of the parent.
Losses are attributed to the non-controlling interest even if that results in a deficit balance.
Interests in joint ventures are accounted for using the equity method after initially being recognised at cost in the consolidated statement of financial position.
Transactions and balances between the Company and its joint ventures were eliminated in the preparation of consolidated financial statements of the Group to the extent of the Group’s share in profits and losses of the joint venture resulting from these transactions.
064 Navitas Limited Annual Report 2017
NOTES TO THE FINANCIAL STATEMENTS For the year ended 30 June 2017
1 Basis of preparation (continued)
1.5 Foreign currencies
Functional and presentation currency
Both the functional and presentation currency of Navitas Limited and its Australian subsidiaries is Australian dollars ($). The functional and presentation currency of the non Australian Group companies is the national currency of the country of operation.
Transactions & balances
Transactions in foreign currencies are initially recorded in the functional currency at the exchange rates ruling at the date of the transaction. Monetary assets and liabilities denominated in foreign currencies are translated at the rate of exchange ruling at the balance sheet date. Foreign currency differences arising on translation are recognised in the profit or loss.
Non-monetary items that are measured in terms of historical cost in a foreign currency are translated using the exchange rate as at the date of the initial transaction. Non-monetary items measured at fair value in a foreign currency are translated using the exchange rates at the date when the fair value was determined.
Translation of Group companies’ functional currency to presentation currency
As at the reporting date the assets and liabilities of foreign subsidiaries are translated into the presentation currency of the Group at the rate of exchange ruling at the reporting date and the statements of profit or loss and other comprehensive income are translated at the weighted average exchange rates for the year. The exchange differences arising on the translation are taken directly to a separate component of equity, the foreign currency translation reserve.
1.6 Nature and purpose of reserves
The foreign currency translation reserve is used to record exchange differences arising from the translation of the financial statements of foreign subsidiaries and record foreign exchange gains and losses on the hedges of the net investments of foreign operations.
Cash flow hedge reserve records the portion of the gain or loss on a hedging instrument in a cash flow hedge that is determined to be an effective hedge.
Navitas Limited Annual Report 2017 065
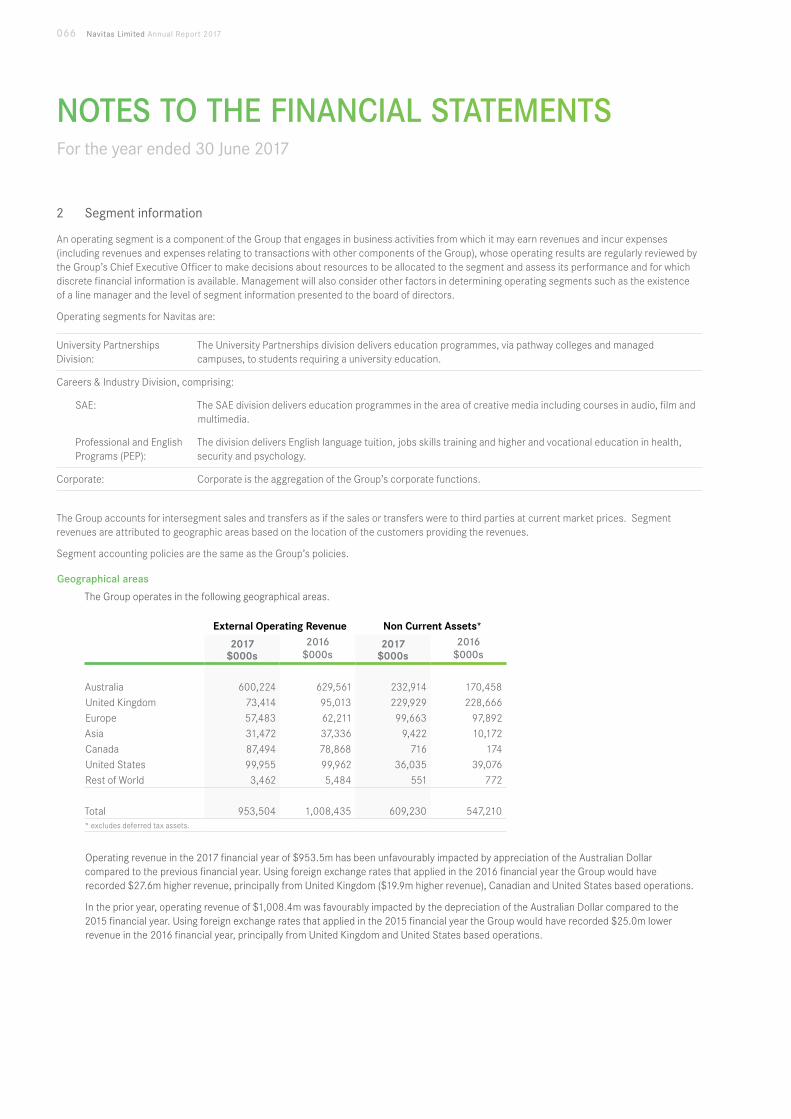
NOTES TO THE FINANCIAL STATEMENTS For the year ended 30 June 2017
2 Segment information
An operating segment is a component of the Group that engages in business activities from which it may earn revenues and incur expenses (including revenues and expenses relating to transactions with other components of the Group), whose operating results are regularly reviewed by the Group’s Chief Executive Officer to make decisions about resources to be allocated to the segment and assess its performance and for which discrete financial information is available. Management will also consider other factors in determining operating segments such as the existence of a line manager and the level of segment information presented to the board of directors.
Operating segments for Navitas are:
University Partnerships Division:
The University Partnerships division delivers education programmes, via pathway colleges and managed campuses, to students requiring a university education.
Careers & Industry Division, comprising:
SAE: The SAE division delivers education programmes in the area of creative media including courses in audio, film and multimedia.
Professional and English Programs (PEP):
The division delivers English language tuition, jobs skills training and higher and vocational education in health, security and psychology.
Corporate: Corporate is the aggregation of the Group’s corporate functions.
The Group accounts for intersegment sales and transfers as if the sales or transfers were to third parties at current market prices. Segment revenues are attributed to geographic areas based on the location of the customers providing the revenues.
Segment accounting policies are the same as the Group’s policies.
Geographical areas
The Group operates in the following geographical areas.
External Operating Revenue Non Current Assets*
2017 $000s
2016 $000s
2017 $000s
2016 $000s
Australia 600,224 629,561 232,914 170,458United Kingdom 73,414 95,013 229,929 228,666Europe 57,483 62,211 99,663 97,892Asia 31,472 37,336 9,422 10,172Canada 87,494 78,868 716 174United States 99,955 99,962 36,035 39,076Rest of World 3,462 5,484 551 772
Total 953,504 1,008,435 609,230 547,210* excludes deferred tax assets.
Operating revenue in the 2017 financial year of $953.5m has been unfavourably impacted by appreciation of the Australian Dollar compared to the previous financial year. Using foreign exchange rates that applied in the 2016 financial year the Group would have recorded $27.6m higher revenue, principally from United Kingdom ($19.9m higher revenue), Canadian and United States based operations.
In the prior year, operating revenue of $1,008.4m was favourably impacted by the depreciation of the Australian Dollar compared to the 2015 financial year. Using foreign exchange rates that applied in the 2015 financial year the Group would have recorded $25.0m lower revenue in the 2016 financial year, principally from United Kingdom and United States based operations.
066 Navitas Limited Annual Report 2017
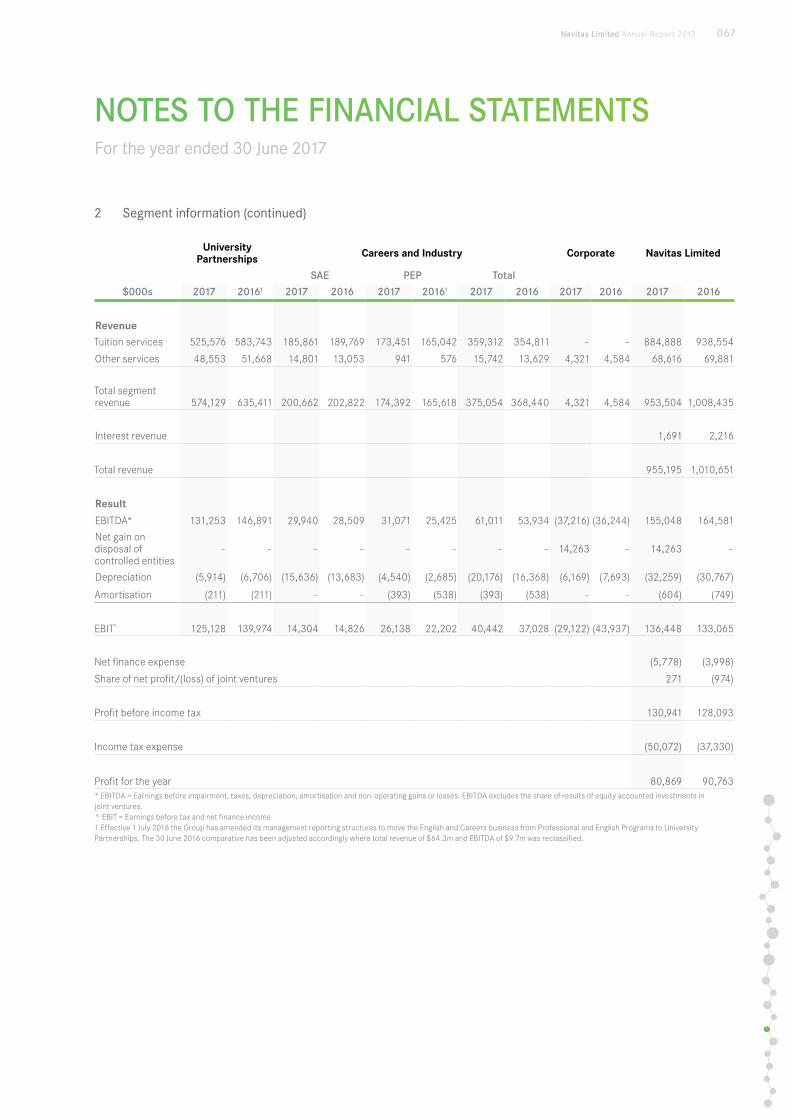
NOTES TO THE FINANCIAL STATEMENTS For the year ended 30 June 2017
2 Segment information (continued)
University Partnerships Careers and Industry Corporate Navitas Limited
SAE PEP Total
$000s 2017 20161 2017 2016 2017 20161 2017 2016 2017 2016 2017 2016
RevenueTuition services 525,576 583,743 185,861 189,769 173,451 165,042 359,312 354,811 - - 884,888 938,554
Other services 48,553 51,668 14,801 13,053 941 576 15,742 13,629 4,321 4,584 68,616 69,881
Total segment revenue 574,129 635,411 200,662 202,822 174,392 165,618 375,054 368,440 4,321 4,584 953,504 1,008,435
Interest revenue 1,691 2,216
Total revenue 955,195 1,010,651
Result
EBITDA* 131,253 146,891 29,940 28,509 31,071 25,425 61,011 53,934 (37,216) (36,244) 155,048 164,581
Net gain on disposal of controlled entities
- - - - - - - - 14,263 - 14,263 -
Depreciation (5,914) (6,706) (15,636) (13,683) (4,540) (2,685) (20,176) (16,368) (6,169) (7,693) (32,259) (30,767)
Amortisation (211) (211) - - (393) (538) (393) (538) - - (604) (749)
EBIT 125,128 139,974 14,304 14,826 26,138 22,202 40,442 37,028 (29,122) (43,937) 136,448 133,065
Net finance expense (5,778) (3,998)
Share of net profit/(loss) of joint ventures 271 (974)
Profit before income tax 130,941 128,093
Income tax expense (50,072) (37,330)
Profit for the year 80,869 90,763* EBITDA = Earnings before impairment, taxes, depreciation, amortisation and non-operating gains or losses. EBITDA excludes the share of results of equity accounted investments in joint ventures.^ EBIT = Earnings before tax and net finance income1 Effective 1 July 2016 the Group has amended its management reporting structures to move the English and Careers business from Professional and English Programs to University Partnerships. The 30 June 2016 comparative has been adjusted accordingly where total revenue of $64.3m and EBITDA of $9.7m was reclassified.
Navitas Limited Annual Report 2017 067
NOTES TO THE FINANCIAL STATEMENTS For the year ended 30 June 2017
3 Financial performance
This section focuses on the results and performance of the Group and includes disclosures explaining the Group’s results for the year, significant items, taxation, earnings per share and dividends.
3.1 Revenue
Accounting policies
Revenue is recognised to the extent that it is probable that the economic benefits will flow to the Group and the revenue can be reliably measured at the fair value of the consideration received.
In relation to the provision of education services, which is the Group’s primary activity, revenue is recognised where the contract outcome can be reliably measured, the Group has control of the right to be compensated for the education services, and the stage of completion can be reliably measured. The stage of completion is measured by reference to the number of contact days held as a percentage of the total number of contact days in the course. Where income is recorded in advance of the provision of service the full amount is recognised as deferred revenue in the statement of financial position. Revenue is then recognised as outlined above.
3.2 Expenses
Accounting policies
Interest
After initial recognition, interest-bearing loans and borrowings are subsequently measured at amortised cost using the effective interest method. Amortised cost is calculated by taking into account any issue costs, and any discount or premium on settlement.
Depreciation
Depreciation is calculated on a straight-line basis over the estimated useful life of the asset as follows:
Plant and equipment – over 2 to 10 years
Leasehold improvements – the shorter of the lease term or the estimated useful life
The assets’ residual values, useful lives and depreciation methods are reviewed, and adjusted if appropriate, at each financial year end.
Leases
Operating lease payments are recognised as an expense in the income statement on a straight-line basis over the lease term, except where another systematic basis is more representative of the time pattern in which economic benefits from the leased asset are consumed. Contingent rentals arising under operating leases are recognised as an expense in the period in which they are incurred.
In the event that lease incentives are received to enter into operating leases, such incentives are recognised as a liability. The aggregate benefits of incentives are recognised as a reduction of rental expense on a straight-line basis, except where another systematic basis is more representative of the time pattern in which economic benefits from the leased asset are consumed.
068 Navitas Limited Annual Report 2017
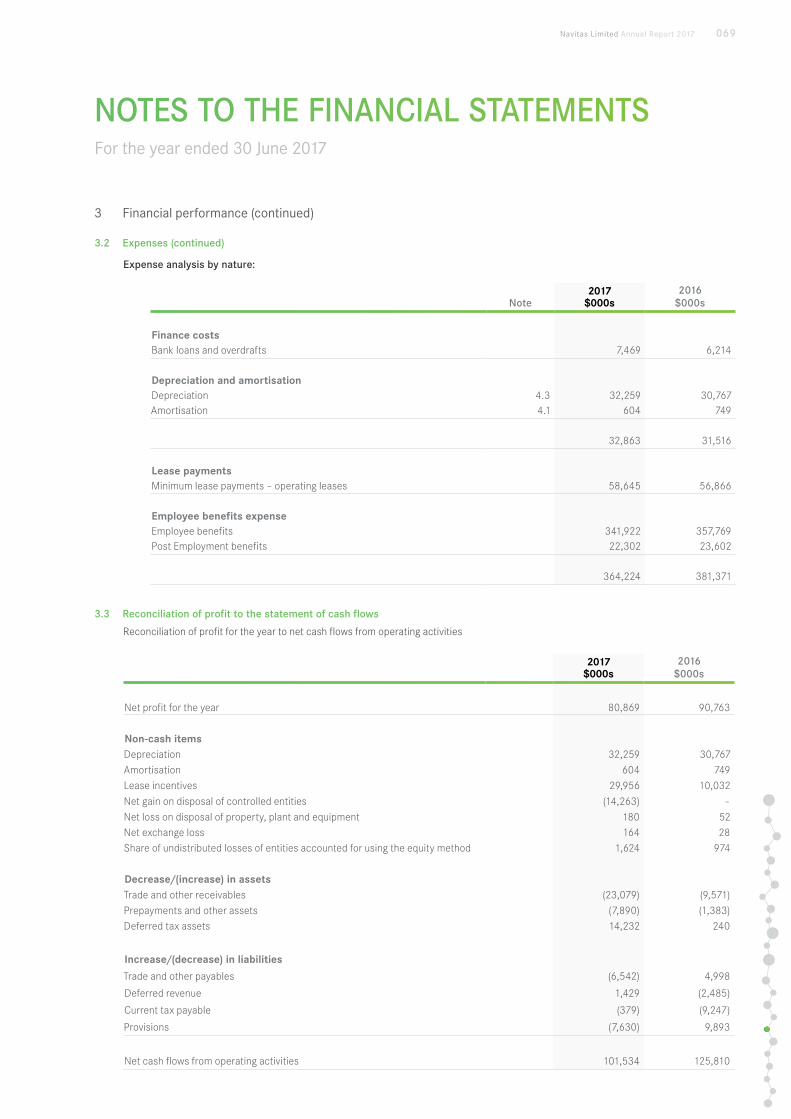
NOTES TO THE FINANCIAL STATEMENTS For the year ended 30 June 2017
3 Financial performance (continued)
3.2 Expenses (continued)
Expense analysis by nature:
Note2017
$000s2016
$000s
Finance costsBank loans and overdrafts 7,469 6,214
Depreciation and amortisationDepreciation 4.3 32,259 30,767Amortisation 4.1 604 749
32,863 31,516
Lease paymentsMinimum lease payments – operating leases 58,645 56,866
Employee benefits expenseEmployee benefits 341,922 357,769Post Employment benefits 22,302 23,602
364,224 381,371
3.3 Reconciliation of profit to the statement of cash flows
Reconciliation of profit for the year to net cash flows from operating activities
2017 $000s
2016 $000s
Net profit for the year 80,869 90,763
Non-cash itemsDepreciation 32,259 30,767Amortisation 604 749Lease incentives 29,956 10,032
Net gain on disposal of controlled entities (14,263) -Net loss on disposal of property, plant and equipment 180 52Net exchange loss 164 28Share of undistributed losses of entities accounted for using the equity method 1,624 974
Decrease/(increase) in assetsTrade and other receivables (23,079) (9,571)Prepayments and other assets (7,890) (1,383)Deferred tax assets 14,232 240
Increase/(decrease) in liabilities
Trade and other payables (6,542) 4,998
Deferred revenue 1,429 (2,485)
Current tax payable (379) (9,247)
Provisions (7,630) 9,893
Net cash flows from operating activities 101,534 125,810
Navitas Limited Annual Report 2017 069
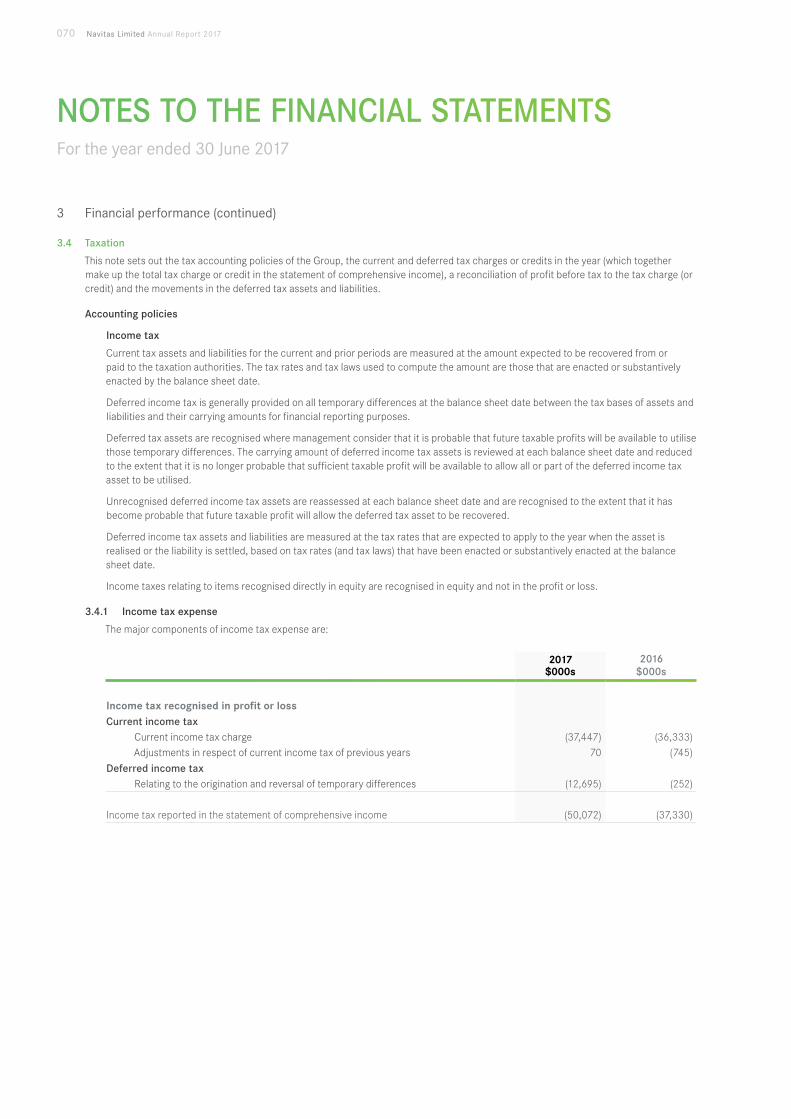
NOTES TO THE FINANCIAL STATEMENTS For the year ended 30 June 2017
3 Financial performance (continued)
3.4 Taxation
This note sets out the tax accounting policies of the Group, the current and deferred tax charges or credits in the year (which together make up the total tax charge or credit in the statement of comprehensive income), a reconciliation of profit before tax to the tax charge (or credit) and the movements in the deferred tax assets and liabilities.
Accounting policies
Income tax
Current tax assets and liabilities for the current and prior periods are measured at the amount expected to be recovered from or paid to the taxation authorities. The tax rates and tax laws used to compute the amount are those that are enacted or substantively enacted by the balance sheet date.
Deferred income tax is generally provided on all temporary differences at the balance sheet date between the tax bases of assets and liabilities and their carrying amounts for financial reporting purposes.
Deferred tax assets are recognised where management consider that it is probable that future taxable profits will be available to utilise those temporary differences. The carrying amount of deferred income tax assets is reviewed at each balance sheet date and reduced to the extent that it is no longer probable that sufficient taxable profit will be available to allow all or part of the deferred income tax asset to be utilised.
Unrecognised deferred income tax assets are reassessed at each balance sheet date and are recognised to the extent that it has become probable that future taxable profit will allow the deferred tax asset to be recovered.
Deferred income tax assets and liabilities are measured at the tax rates that are expected to apply to the year when the asset is realised or the liability is settled, based on tax rates (and tax laws) that have been enacted or substantively enacted at the balance sheet date.
Income taxes relating to items recognised directly in equity are recognised in equity and not in the profit or loss.
3.4.1 Income tax expense
The major components of income tax expense are:
2017 $000s
2016 $000s
Income tax recognised in profit or lossCurrent income tax
Current income tax charge (37,447) (36,333)Adjustments in respect of current income tax of previous years 70 (745)
Deferred income taxRelating to the origination and reversal of temporary differences (12,695) (252)
Income tax reported in the statement of comprehensive income (50,072) (37,330)
070 Navitas Limited Annual Report 2017
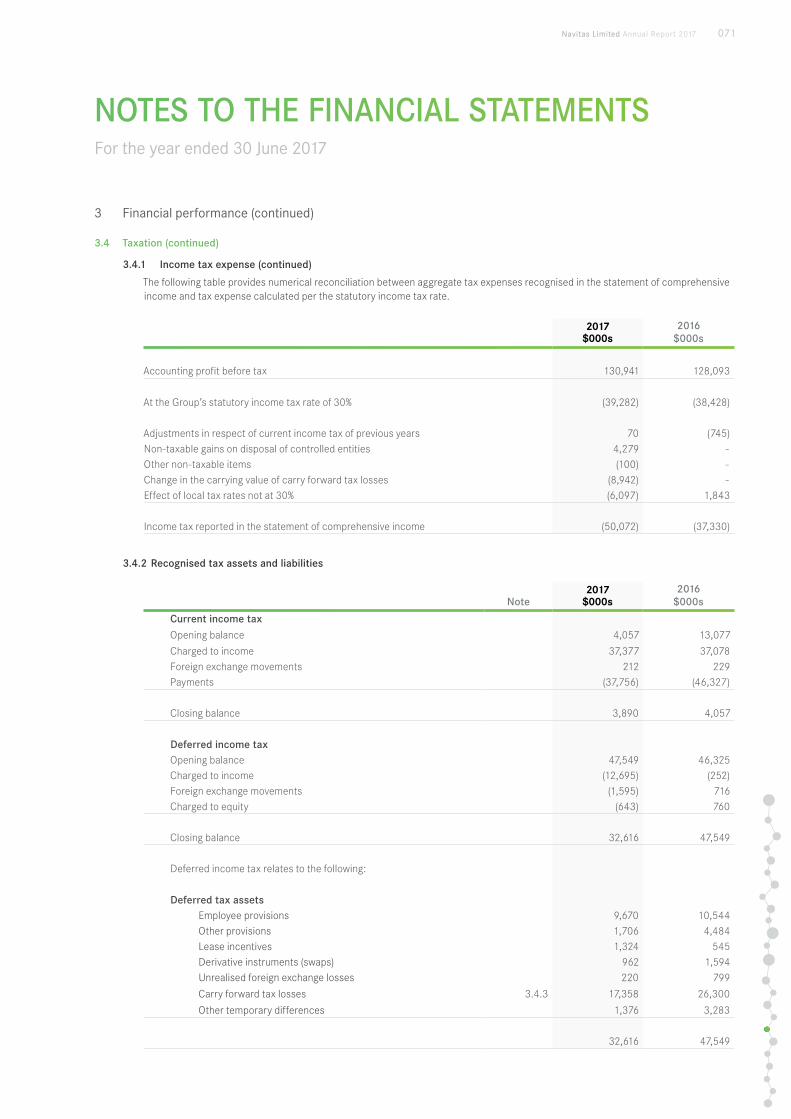
NOTES TO THE FINANCIAL STATEMENTS For the year ended 30 June 2017
3 Financial performance (continued)
3.4 Taxation (continued)
3.4.1 Income tax expense (continued)
The following table provides numerical reconciliation between aggregate tax expenses recognised in the statement of comprehensive income and tax expense calculated per the statutory income tax rate.
2017 $000s
2016 $000s
Accounting profit before tax 130,941 128,093
At the Group’s statutory income tax rate of 30% (39,282) (38,428)
Adjustments in respect of current income tax of previous years 70 (745)Non-taxable gains on disposal of controlled entities 4,279 -Other non-taxable items (100) -Change in the carrying value of carry forward tax losses (8,942) -Effect of local tax rates not at 30% (6,097) 1,843
Income tax reported in the statement of comprehensive income (50,072) (37,330)
3.4.2 Recognised tax assets and liabilities
Note2017
$000s2016
$000s
Current income taxOpening balance 4,057 13,077
Charged to income 37,377 37,078Foreign exchange movements 212 229Payments (37,756) (46,327)
Closing balance 3,890 4,057
Deferred income taxOpening balance 47,549 46,325Charged to income (12,695) (252)Foreign exchange movements (1,595) 716Charged to equity (643) 760
Closing balance 32,616 47,549
Deferred income tax relates to the following:
Deferred tax assetsEmployee provisions 9,670 10,544Other provisions 1,706 4,484Lease incentives 1,324 545Derivative instruments (swaps) 962 1,594Unrealised foreign exchange losses 220 799
Carry forward tax losses 3.4.3 17,358 26,300
Other temporary differences 1,376 3,283
32,616 47,549
Navitas Limited Annual Report 2017 071
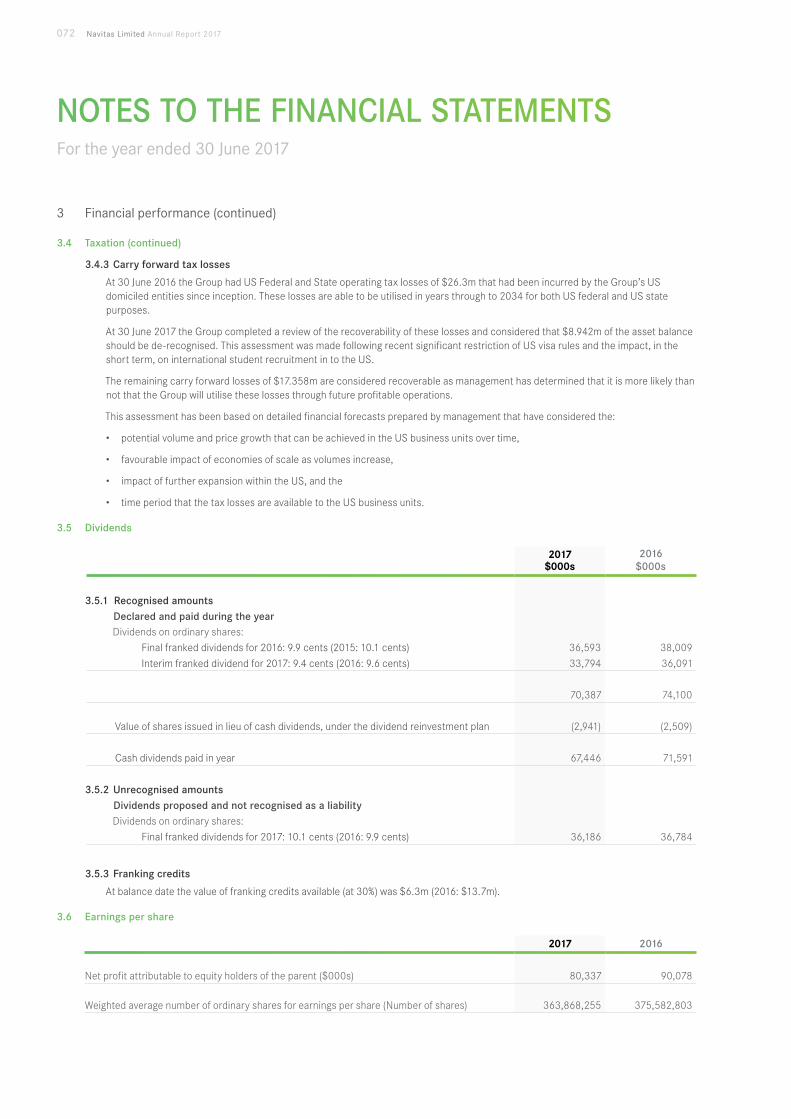
NOTES TO THE FINANCIAL STATEMENTS For the year ended 30 June 2017
3 Financial performance (continued)
3.4 Taxation (continued)
3.4.3 Carry forward tax losses
At 30 June 2016 the Group had US Federal and State operating tax losses of $26.3m that had been incurred by the Group’s US domiciled entities since inception. These losses are able to be utilised in years through to 2034 for both US federal and US state purposes.
At 30 June 2017 the Group completed a review of the recoverability of these losses and considered that $8.942m of the asset balance should be de-recognised. This assessment was made following recent significant restriction of US visa rules and the impact, in the short term, on international student recruitment in to the US.
The remaining carry forward losses of $17.358m are considered recoverable as management has determined that it is more likely than not that the Group will utilise these losses through future profitable operations.
This assessment has been based on detailed financial forecasts prepared by management that have considered the:
• potential volume and price growth that can be achieved in the US business units over time,
• favourable impact of economies of scale as volumes increase,
• impact of further expansion within the US, and the
• time period that the tax losses are available to the US business units.
3.5 Dividends
2017 $000s
2016 $000s
3.5.1 Recognised amountsDeclared and paid during the yearDividends on ordinary shares:
Final franked dividends for 2016: 9.9 cents (2015: 10.1 cents) 36,593 38,009
Interim franked dividend for 2017: 9.4 cents (2016: 9.6 cents) 33,794 36,091
70,387 74,100
Value of shares issued in lieu of cash dividends, under the dividend reinvestment plan (2,941) (2,509)
Cash dividends paid in year 67,446 71,591
3.5.2 Unrecognised amountsDividends proposed and not recognised as a liabilityDividends on ordinary shares:
Final franked dividends for 2017: 10.1 cents (2016: 9.9 cents) 36,186 36,784
3.5.3 Franking credits
At balance date the value of franking credits available (at 30%) was $6.3m (2016: $13.7m).
3.6 Earnings per share
2017 2016
Net profit attributable to equity holders of the parent ($000s) 80,337 90,078 Weighted average number of ordinary shares for earnings per share (Number of shares) 363,868,255 375,582,803
072 Navitas Limited Annual Report 2017
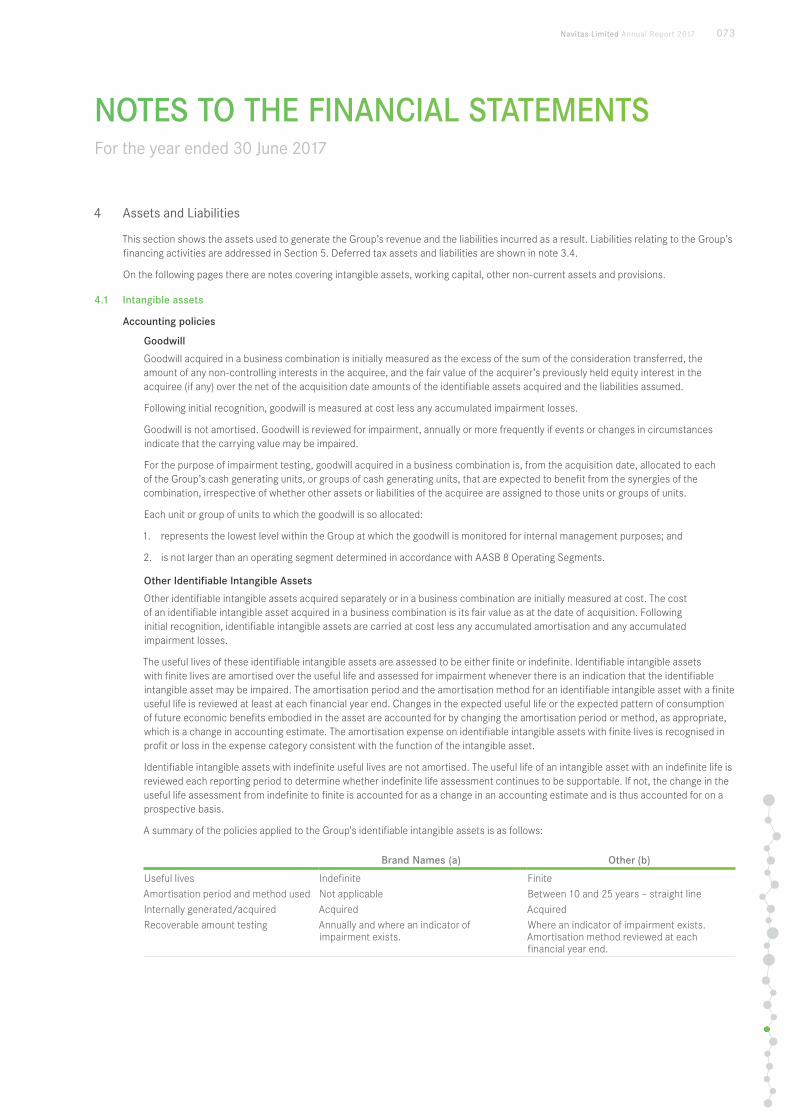
NOTES TO THE FINANCIAL STATEMENTS For the year ended 30 June 2017
4 Assets and Liabilities
This section shows the assets used to generate the Group’s revenue and the liabilities incurred as a result. Liabilities relating to the Group’s financing activities are addressed in Section 5. Deferred tax assets and liabilities are shown in note 3.4.
On the following pages there are notes covering intangible assets, working capital, other non-current assets and provisions.
4.1 Intangible assets
Accounting policies
Goodwill
Goodwill acquired in a business combination is initially measured as the excess of the sum of the consideration transferred, the amount of any non-controlling interests in the acquiree, and the fair value of the acquirer’s previously held equity interest in the acquiree (if any) over the net of the acquisition date amounts of the identifiable assets acquired and the liabilities assumed.
Following initial recognition, goodwill is measured at cost less any accumulated impairment losses.
Goodwill is not amortised. Goodwill is reviewed for impairment, annually or more frequently if events or changes in circumstances indicate that the carrying value may be impaired.
For the purpose of impairment testing, goodwill acquired in a business combination is, from the acquisition date, allocated to each of the Group’s cash generating units, or groups of cash generating units, that are expected to benefit from the synergies of the combination, irrespective of whether other assets or liabilities of the acquiree are assigned to those units or groups of units.
Each unit or group of units to which the goodwill is so allocated:
1. represents the lowest level within the Group at which the goodwill is monitored for internal management purposes; and
2. is not larger than an operating segment determined in accordance with AASB 8 Operating Segments.
Other Identifiable Intangible Assets
Other identifiable intangible assets acquired separately or in a business combination are initially measured at cost. The cost of an identifiable intangible asset acquired in a business combination is its fair value as at the date of acquisition. Following initial recognition, identifiable intangible assets are carried at cost less any accumulated amortisation and any accumulated impairment losses.
The useful lives of these identifiable intangible assets are assessed to be either finite or indefinite. Identifiable intangible assets with finite lives are amortised over the useful life and assessed for impairment whenever there is an indication that the identifiable intangible asset may be impaired. The amortisation period and the amortisation method for an identifiable intangible asset with a finite useful life is reviewed at least at each financial year end. Changes in the expected useful life or the expected pattern of consumption of future economic benefits embodied in the asset are accounted for by changing the amortisation period or method, as appropriate, which is a change in accounting estimate. The amortisation expense on identifiable intangible assets with finite lives is recognised in profit or loss in the expense category consistent with the function of the intangible asset.
Identifiable intangible assets with indefinite useful lives are not amortised. The useful life of an intangible asset with an indefinite life is reviewed each reporting period to determine whether indefinite life assessment continues to be supportable. If not, the change in the useful life assessment from indefinite to finite is accounted for as a change in an accounting estimate and is thus accounted for on a prospective basis.
A summary of the policies applied to the Group's identifiable intangible assets is as follows:
Brand Names (a) Other (b)
Useful lives Indefinite FiniteAmortisation period and method used Not applicable Between 10 and 25 years – straight lineInternally generated/acquired Acquired AcquiredRecoverable amount testing Annually and where an indicator of
impairment exists.Where an indicator of impairment exists. Amortisation method reviewed at each financial year end.
Navitas Limited Annual Report 2017 073
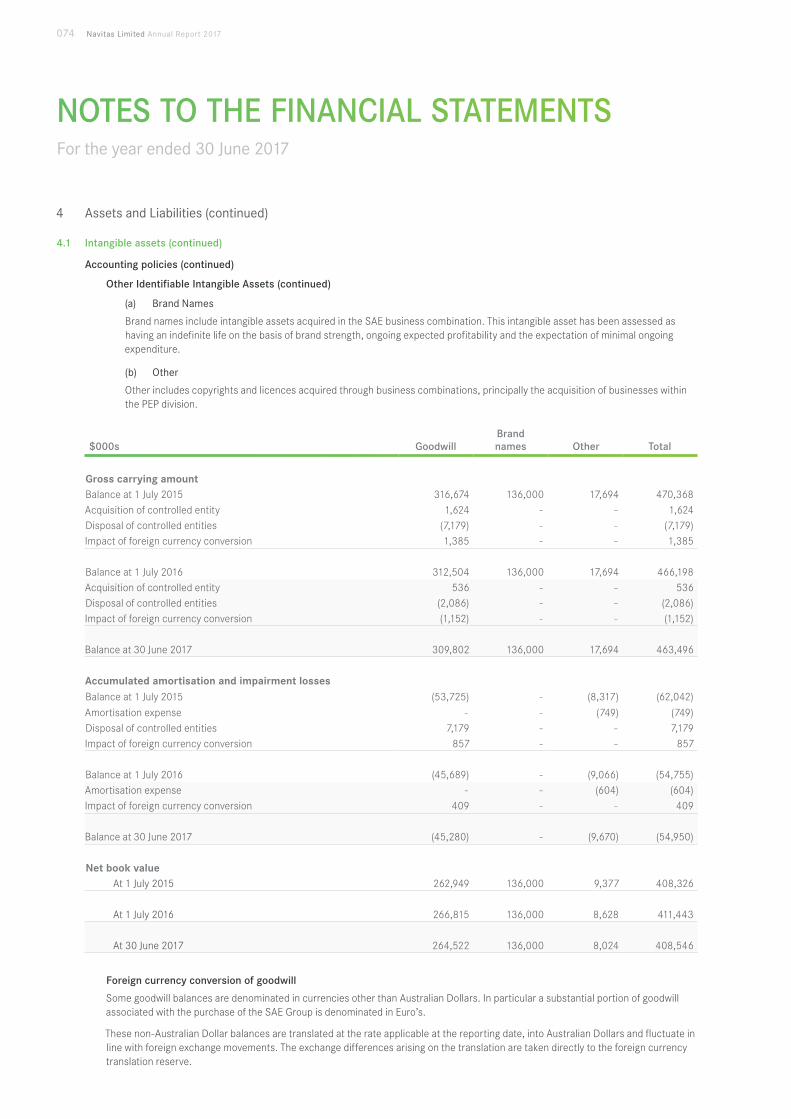
NOTES TO THE FINANCIAL STATEMENTS For the year ended 30 June 2017
4 Assets and Liabilities (continued)
4.1 Intangible assets (continued)
Accounting policies (continued)
Other Identifiable Intangible Assets (continued)
(a) Brand Names
Brand names include intangible assets acquired in the SAE business combination. This intangible asset has been assessed as having an indefinite life on the basis of brand strength, ongoing expected profitability and the expectation of minimal ongoing expenditure.
(b) Other
Other includes copyrights and licences acquired through business combinations, principally the acquisition of businesses within the PEP division.
$000s GoodwillBrand names Other Total
Gross carrying amountBalance at 1 July 2015 316,674 136,000 17,694 470,368Acquisition of controlled entity 1,624 - - 1,624Disposal of controlled entities (7,179) - - (7,179)Impact of foreign currency conversion 1,385 - - 1,385
Balance at 1 July 2016 312,504 136,000 17,694 466,198Acquisition of controlled entity 536 - - 536Disposal of controlled entities (2,086) - - (2,086)Impact of foreign currency conversion (1,152) - - (1,152)
Balance at 30 June 2017 309,802 136,000 17,694 463,496
Accumulated amortisation and impairment lossesBalance at 1 July 2015 (53,725) - (8,317) (62,042)
Amortisation expense - - (749) (749)Disposal of controlled entities 7,179 - - 7,179Impact of foreign currency conversion 857 - - 857
Balance at 1 July 2016 (45,689) - (9,066) (54,755)Amortisation expense - - (604) (604)Impact of foreign currency conversion 409 - - 409
Balance at 30 June 2017 (45,280) - (9,670) (54,950)
Net book valueAt 1 July 2015 262,949 136,000 9,377 408,326
At 1 July 2016 266,815 136,000 8,628 411,443
At 30 June 2017 264,522 136,000 8,024 408,546
Foreign currency conversion of goodwill
Some goodwill balances are denominated in currencies other than Australian Dollars. In particular a substantial portion of goodwill associated with the purchase of the SAE Group is denominated in Euro’s.
These non-Australian Dollar balances are translated at the rate applicable at the reporting date, into Australian Dollars and fluctuate in line with foreign exchange movements. The exchange differences arising on the translation are taken directly to the foreign currency translation reserve.
074 Navitas Limited Annual Report 2017

NOTES TO THE FINANCIAL STATEMENTS For the year ended 30 June 2017
4 Assets and liabilities (continued)
4.1 Intangible assets (continued)
4.1.1 Impairment
Accounting policies
Impairment testing is completed at each reporting date for goodwill and intangible assets that have indefinite useful lives or assets that are not ready for use, or more frequently if events or changes in circumstances indicate that the asset may be impaired.
For intangible assets that are subject to amortisation the asset is reviewed for impairment whenever events or changes in circumstances indicate that the asset’s carrying amount is greater than its estimated recoverable amount. Indicators of impairment may include changes in technology and business performance.
In testing for impairment, the recoverable amount is estimated for an individual asset or, if it is not possible to estimate the recoverable amount for the individual asset, the recoverable amount of the cash generating unit (CGU) to which the asset belongs.
CGUs are the smallest identifiable group of assets that generate cash flows that are largely independent from the cash flows of other assets or group of assets. Each CGU is no larger than an operating segment.
The recoverable amount of an asset or a CGU is the greater of fair value less cost of disposal and value in use. In assessing value in use, the estimated future cash flows are discounted to their present value using a pre-tax discount rate that reflects the risks specific to the asset or CGU and the market’s current assessment of the time value of money. An impairment loss is recognised in the income statement if the carrying amount of an asset or a CGU exceeds its recoverable amount. Impairment losses recognised in respect of CGUs are allocated first to reduce the carrying amount of any goodwill allocated to the CGU (group of CGUs) and then, to reduce the carrying amount of the other assets in the CGU (group of CGUs).
Impairment losses recognised in respect of goodwill are not reversed. Impairment losses recognised in prior periods in respect of other intangible assets are assessed at each reporting date for any indications that the impairment loss has decreased or may no longer exist. The impairment loss is reversed if there has been a change in the estimates used to determine the recoverable amount of the asset and is reversed only to the extent that the carrying amount of the asset does not exceed the carrying amount that would have been determined, net of amortisation, had no impairment loss been recognised.
There were no impairment losses recognised during the 2017 and 2016 financial years.
Impairment testing of goodwill and indefinite life identifiable intangible assets
Carrying amount of goodwill allocated to each of the cash generating units
The carrying amounts of acquired goodwill have been allocated to the following individual cash generating units that have significant amounts of intangibles, for impairment testing, as follows:
Cash generating unit (or group of units) Carrying amount of goodwill ($000s)
2017 2016
SAE 152,414 153,160PEP, English and Foundation Skills 31,944 31,944PEP, ELICOS 13,689 13,689Curtin College 13,089 13,089Deakin College 11,738 11,738Australian College of Applied Psychology 10,804 10,804Griffith College 9,980 9,980Multiple units without significant intangibles 20,864 22,411
264,522 266,815
Navitas Limited Annual Report 2017 075
NOTES TO THE FINANCIAL STATEMENTS For the year ended 30 June 2017
4 Assets and liabilities (continued)
4.1 Intangible assets (continued)
4.1.1 Impairment (continued)
Impairment testing of goodwill and indefinite life identifiable intangible assets (continued)
Value in use calculations for SAE
The recoverable amount of SAE has been determined based on a value in use calculation using cash flow projections covering a five year period, based on detailed financial forecasts prepared by local management and approved by SAE and Navitas Senior Executives.
The following describes each key assumption on which management has based its value in use calculation for SAE.
• The discount rate applied to pre-tax cash flow projections is 12.3%.
• Cash flows beyond the five year period are estimated using a terminal value calculated under standard valuation principles incorporating a long term growth rate of 2.0%.
• Revenue from operations is forecast to increase as a result of increased volumes of students. This has been estimated as 10% cumulatively over the five year forecast period. Weighted average forecast course fees have not been assumed to increase significantly due to conservative estimates and changed country mix. Wage inflation is assumed to be in line with the long run historical average for Australia, and EBITDA margins are forecast to improve in line with the long run average achieved by established SAE schools.
• The impact of working capital has been assumed to increase in line with revenue growth.
• Capital investment required to run the business has been assumed based on detailed estimates for three years then at 5.0% of forecast revenues.
In addition, the cash flow projections for SAE also assumes the continued ability of existing and future students to access government funding (loans) for the purpose of obtaining a qualification from a SAE school. This includes access to Title IV funding in the USA and Fee-Help in Australia.
The implications of the key assumptions for the recoverable amount are:
• Discount rate - Management has considered the possibility that the discount rate used could increase. The recoverable amount of SAE intangible assets would only drop below its carrying amount if the discount rate increased by 20% or more.
• Long term growth rate - the recoverable amount of SAE intangible assets would only drop below its carrying amount if the growth rate used was lower than 0%.
• Forecast EBITDA for SAE would need to be 15% lower each year than used in the value in use model, over the five year forecast period, either due to slower than forecast revenue growth or lower EBITDA margin, to result in a recoverable amount lower than the carrying amount of SAE intangible assets.
The recoverable value of the SAE brand name of $136.0m has been assessed using the same methods and assumptions as the related goodwill.
076 Navitas Limited Annual Report 2017
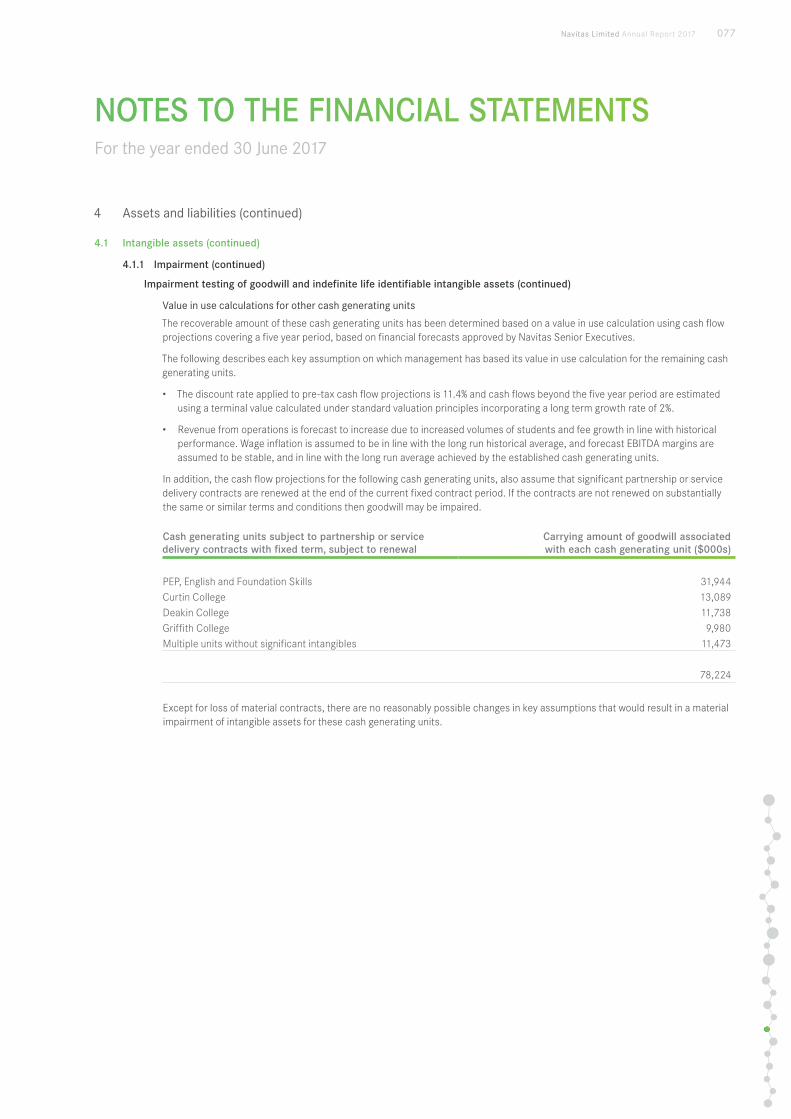
NOTES TO THE FINANCIAL STATEMENTS For the year ended 30 June 2017
4 Assets and liabilities (continued)
4.1 Intangible assets (continued)
4.1.1 Impairment (continued)
Impairment testing of goodwill and indefinite life identifiable intangible assets (continued)
Value in use calculations for other cash generating units
The recoverable amount of these cash generating units has been determined based on a value in use calculation using cash flow projections covering a five year period, based on financial forecasts approved by Navitas Senior Executives.
The following describes each key assumption on which management has based its value in use calculation for the remaining cash generating units.
• The discount rate applied to pre-tax cash flow projections is 11.4% and cash flows beyond the five year period are estimated using a terminal value calculated under standard valuation principles incorporating a long term growth rate of 2%.
• Revenue from operations is forecast to increase due to increased volumes of students and fee growth in line with historical performance. Wage inflation is assumed to be in line with the long run historical average, and forecast EBITDA margins are assumed to be stable, and in line with the long run average achieved by the established cash generating units.
In addition, the cash flow projections for the following cash generating units, also assume that significant partnership or service delivery contracts are renewed at the end of the current fixed contract period. If the contracts are not renewed on substantially the same or similar terms and conditions then goodwill may be impaired.
Cash generating units subject to partnership or service delivery contracts with fixed term, subject to renewal
Carrying amount of goodwill associated with each cash generating unit ($000s)
PEP, English and Foundation Skills 31,944Curtin College 13,089Deakin College 11,738Griffith College 9,980Multiple units without significant intangibles 11,473
78,224
Except for loss of material contracts, there are no reasonably possible changes in key assumptions that would result in a material impairment of intangible assets for these cash generating units.
Navitas Limited Annual Report 2017 077
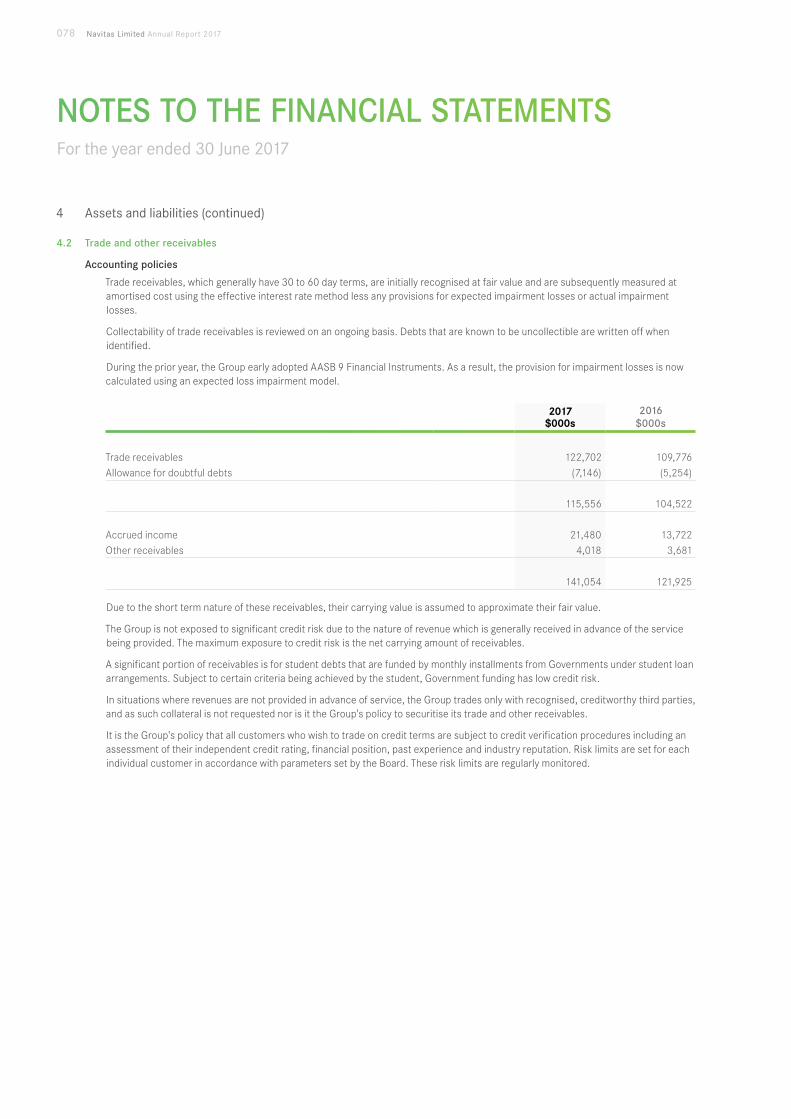
NOTES TO THE FINANCIAL STATEMENTS For the year ended 30 June 2017
4 Assets and liabilities (continued)
4.2 Trade and other receivables
Accounting policies
Trade receivables, which generally have 30 to 60 day terms, are initially recognised at fair value and are subsequently measured at amortised cost using the effective interest rate method less any provisions for expected impairment losses or actual impairment losses.
Collectability of trade receivables is reviewed on an ongoing basis. Debts that are known to be uncollectible are written off when identified.
During the prior year, the Group early adopted AASB 9 Financial Instruments. As a result, the provision for impairment losses is now calculated using an expected loss impairment model.
2017 $000s
2016 $000s
Trade receivables 122,702 109,776Allowance for doubtful debts (7,146) (5,254)
115,556 104,522
Accrued income 21,480 13,722Other receivables 4,018 3,681
141,054 121,925
Due to the short term nature of these receivables, their carrying value is assumed to approximate their fair value.
The Group is not exposed to significant credit risk due to the nature of revenue which is generally received in advance of the service being provided. The maximum exposure to credit risk is the net carrying amount of receivables.
A significant portion of receivables is for student debts that are funded by monthly installments from Governments under student loan arrangements. Subject to certain criteria being achieved by the student, Government funding has low credit risk.
In situations where revenues are not provided in advance of service, the Group trades only with recognised, creditworthy third parties, and as such collateral is not requested nor is it the Group's policy to securitise its trade and other receivables.
It is the Group's policy that all customers who wish to trade on credit terms are subject to credit verification procedures including an assessment of their independent credit rating, financial position, past experience and industry reputation. Risk limits are set for each individual customer in accordance with parameters set by the Board. These risk limits are regularly monitored.
078 Navitas Limited Annual Report 2017
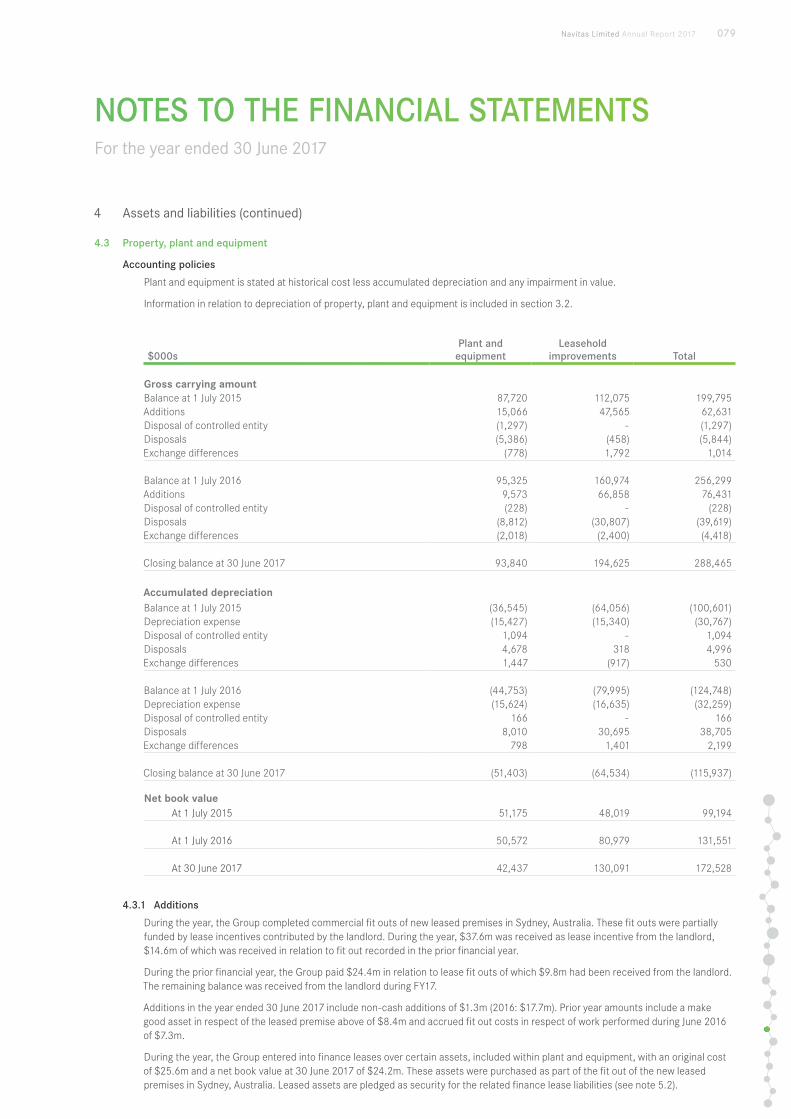
NOTES TO THE FINANCIAL STATEMENTS For the year ended 30 June 2017
4 Assets and liabilities (continued)
4.3 Property, plant and equipment
Accounting policies
Plant and equipment is stated at historical cost less accumulated depreciation and any impairment in value.
Information in relation to depreciation of property, plant and equipment is included in section 3.2.
$000sPlant and equipment
Leasehold improvements Total
Gross carrying amountBalance at 1 July 2015 87,720 112,075 199,795Additions 15,066 47,565 62,631Disposal of controlled entity (1,297) - (1,297)Disposals (5,386) (458) (5,844)Exchange differences (778) 1,792 1,014
Balance at 1 July 2016 95,325 160,974 256,299Additions 9,573 66,858 76,431Disposal of controlled entity (228) - (228)Disposals (8,812) (30,807) (39,619)Exchange differences (2,018) (2,400) (4,418)
Closing balance at 30 June 2017 93,840 194,625 288,465
Accumulated depreciationBalance at 1 July 2015 (36,545) (64,056) (100,601)Depreciation expense (15,427) (15,340) (30,767)Disposal of controlled entity 1,094 - 1,094Disposals 4,678 318 4,996Exchange differences 1,447 (917) 530
Balance at 1 July 2016 (44,753) (79,995) (124,748)Depreciation expense (15,624) (16,635) (32,259)Disposal of controlled entity 166 - 166Disposals 8,010 30,695 38,705Exchange differences 798 1,401 2,199
Closing balance at 30 June 2017 (51,403) (64,534) (115,937)
Net book valueAt 1 July 2015 51,175 48,019 99,194
At 1 July 2016 50,572 80,979 131,551
At 30 June 2017 42,437 130,091 172,528
4.3.1 Additions
During the year, the Group completed commercial fit outs of new leased premises in Sydney, Australia. These fit outs were partially funded by lease incentives contributed by the landlord. During the year, $37.6m was received as lease incentive from the landlord, $14.6m of which was received in relation to fit out recorded in the prior financial year.
During the prior financial year, the Group paid $24.4m in relation to lease fit outs of which $9.8m had been received from the landlord. The remaining balance was received from the landlord during FY17.
Additions in the year ended 30 June 2017 include non-cash additions of $1.3m (2016: $17.7m). Prior year amounts include a make good asset in respect of the leased premise above of $8.4m and accrued fit out costs in respect of work performed during June 2016 of $7.3m.
During the year, the Group entered into finance leases over certain assets, included within plant and equipment, with an original cost of $25.6m and a net book value at 30 June 2017 of $24.2m. These assets were purchased as part of the fit out of the new leased premises in Sydney, Australia. Leased assets are pledged as security for the related finance lease liabilities (see note 5.2).
Navitas Limited Annual Report 2017 079
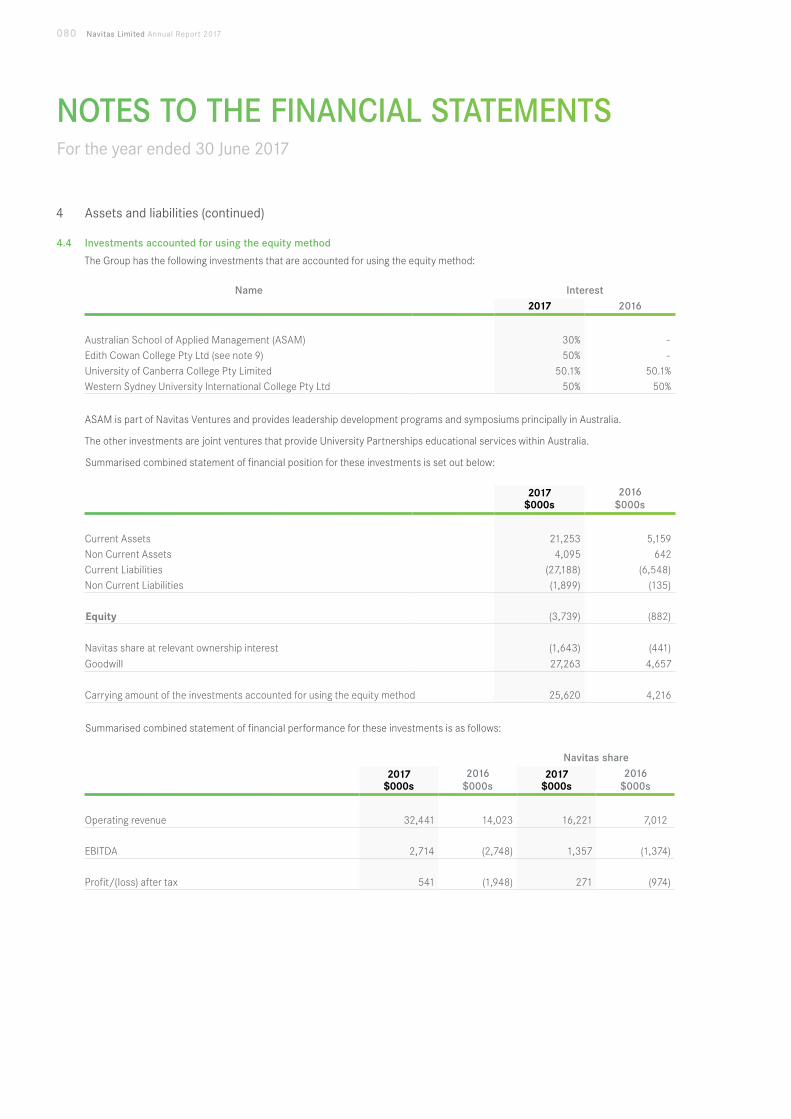
NOTES TO THE FINANCIAL STATEMENTS For the year ended 30 June 2017
4 Assets and liabilities (continued)
4.4 Investments accounted for using the equity method
The Group has the following investments that are accounted for using the equity method:
Name Interest2017 2016
Australian School of Applied Management (ASAM) 30% -Edith Cowan College Pty Ltd (see note 9) 50% -University of Canberra College Pty Limited 50.1% 50.1%Western Sydney University International College Pty Ltd 50% 50%
ASAM is part of Navitas Ventures and provides leadership development programs and symposiums principally in Australia.
The other investments are joint ventures that provide University Partnerships educational services within Australia.
Summarised combined statement of financial position for these investments is set out below:
2017 $000s
2016 $000s
Current Assets 21,253 5,159Non Current Assets 4,095 642Current Liabilities (27,188) (6,548)Non Current Liabilities (1,899) (135)
Equity (3,739) (882)
Navitas share at relevant ownership interest (1,643) (441)
Goodwill 27,263 4,657
Carrying amount of the investments accounted for using the equity method 25,620 4,216
Summarised combined statement of financial performance for these investments is as follows:
Navitas share
2017 $000s
2016 $000s
2017 $000s
2016 $000s
Operating revenue 32,441 14,023 16,221 7,012
EBITDA 2,714 (2,748) 1,357 (1,374)
Profit/(loss) after tax 541 (1,948) 271 (974)
080 Navitas Limited Annual Report 2017
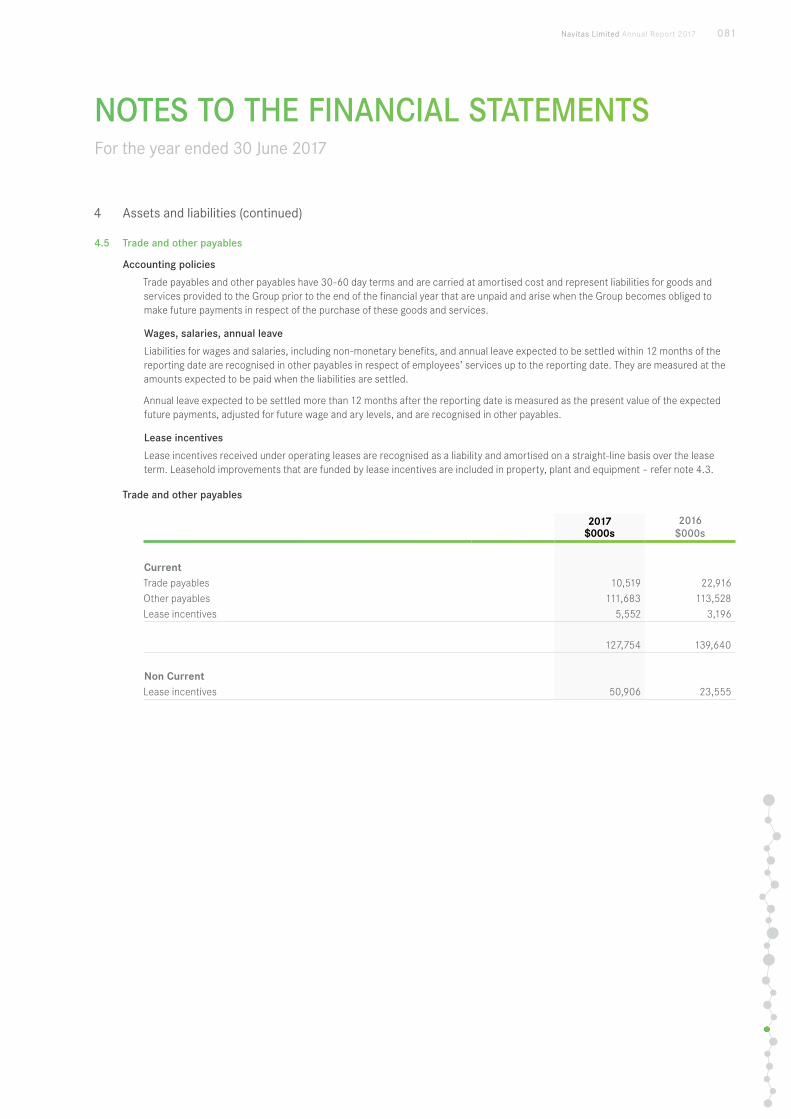
NOTES TO THE FINANCIAL STATEMENTS For the year ended 30 June 2017
4 Assets and liabilities (continued)
4.5 Trade and other payables
Accounting policies
Trade payables and other payables have 30-60 day terms and are carried at amortised cost and represent liabilities for goods and services provided to the Group prior to the end of the financial year that are unpaid and arise when the Group becomes obliged to make future payments in respect of the purchase of these goods and services.
Wages, salaries, annual leave
Liabilities for wages and salaries, including non-monetary benefits, and annual leave expected to be settled within 12 months of the reporting date are recognised in other payables in respect of employees’ services up to the reporting date. They are measured at the amounts expected to be paid when the liabilities are settled.
Annual leave expected to be settled more than 12 months after the reporting date is measured as the present value of the expected future payments, adjusted for future wage and ary levels, and are recognised in other payables.
Lease incentives
Lease incentives received under operating leases are recognised as a liability and amortised on a straight-line basis over the lease term. Leasehold improvements that are funded by lease incentives are included in property, plant and equipment – refer note 4.3.
Trade and other payables
2017 $000s
2016 $000s
CurrentTrade payables 10,519 22,916Other payables 111,683 113,528Lease incentives 5,552 3,196
127,754 139,640
Non CurrentLease incentives 50,906 23,555
Navitas Limited Annual Report 2017 081
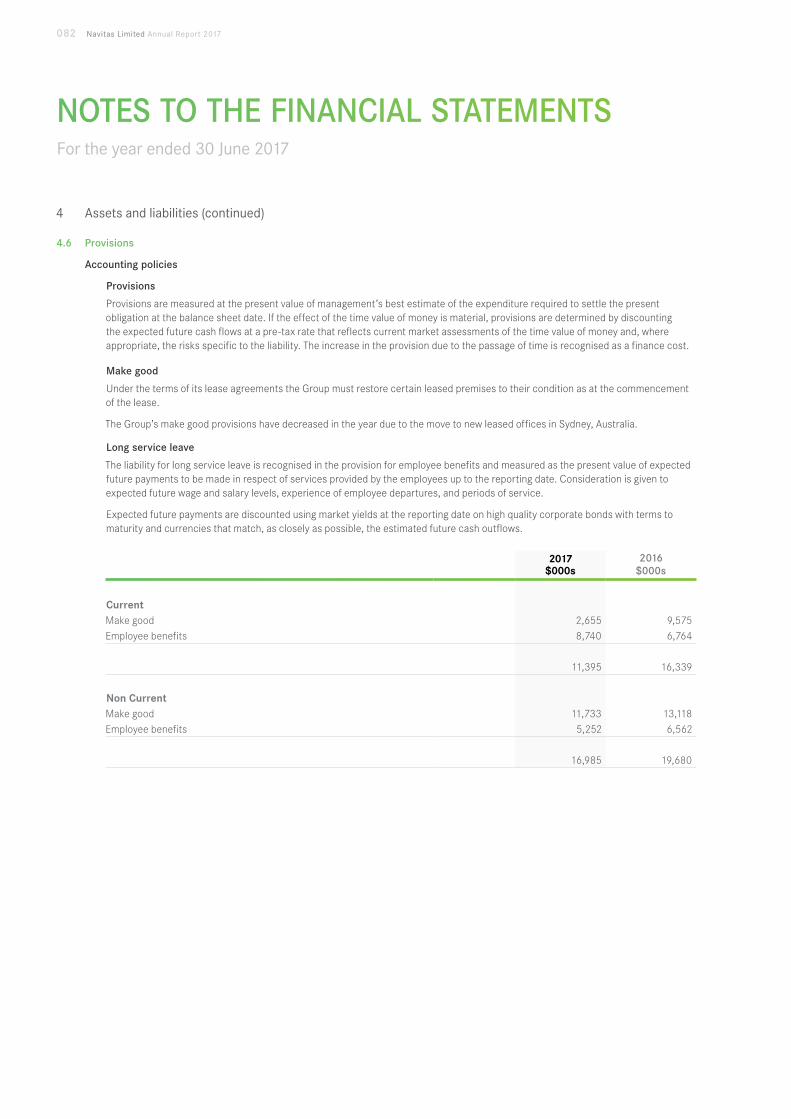
NOTES TO THE FINANCIAL STATEMENTS For the year ended 30 June 2017
4 Assets and liabilities (continued)
4.6 Provisions
Accounting policies
Provisions
Provisions are measured at the present value of management’s best estimate of the expenditure required to settle the present obligation at the balance sheet date. If the effect of the time value of money is material, provisions are determined by discounting the expected future cash flows at a pre-tax rate that reflects current market assessments of the time value of money and, where appropriate, the risks specific to the liability. The increase in the provision due to the passage of time is recognised as a finance cost.
Make good
Under the terms of its lease agreements the Group must restore certain leased premises to their condition as at the commencement of the lease.
The Group’s make good provisions have decreased in the year due to the move to new leased offices in Sydney, Australia.
Long service leave
The liability for long service leave is recognised in the provision for employee benefits and measured as the present value of expected future payments to be made in respect of services provided by the employees up to the reporting date. Consideration is given to expected future wage and salary levels, experience of employee departures, and periods of service.
Expected future payments are discounted using market yields at the reporting date on high quality corporate bonds with terms to maturity and currencies that match, as closely as possible, the estimated future cash outflows.
2017 $000s
2016 $000s
CurrentMake good 2,655 9,575Employee benefits 8,740 6,764
11,395 16,339
Non CurrentMake good 11,733 13,118Employee benefits 5,252 6,562
16,985 19,680
082 Navitas Limited Annual Report 2017
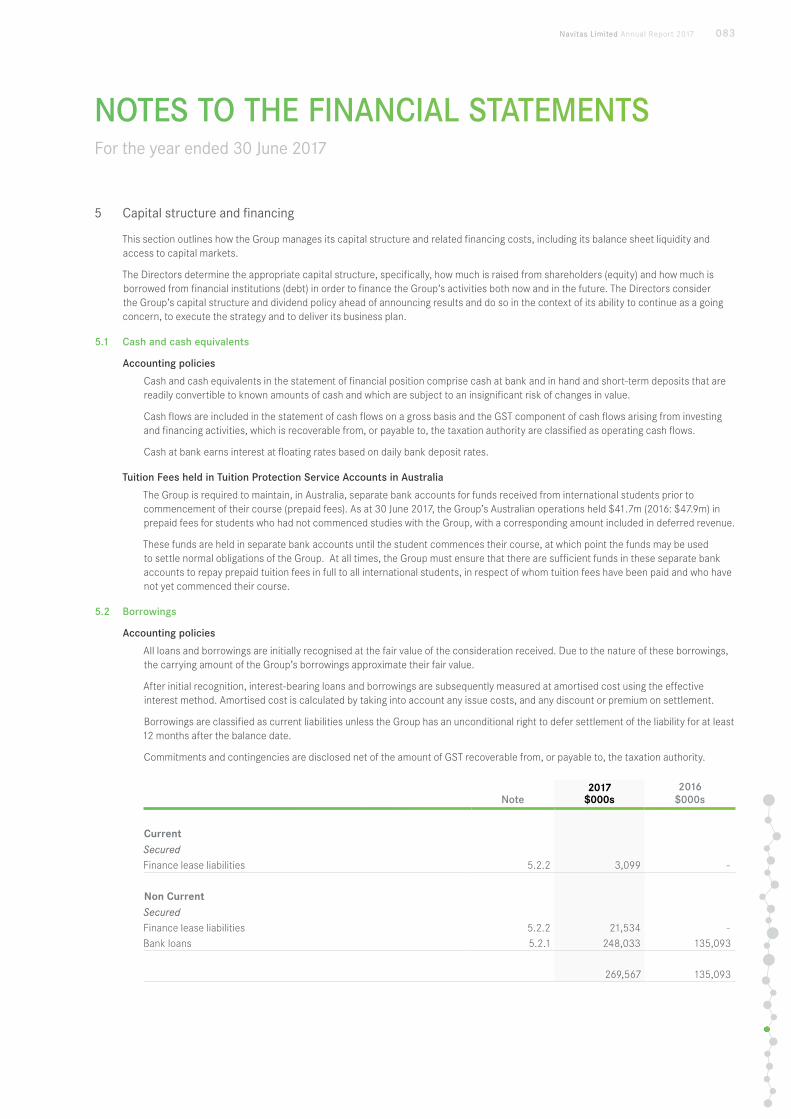
NOTES TO THE FINANCIAL STATEMENTS For the year ended 30 June 2017
5 Capital structure and financing
This section outlines how the Group manages its capital structure and related financing costs, including its balance sheet liquidity and access to capital markets.
The Directors determine the appropriate capital structure, specifically, how much is raised from shareholders (equity) and how much is borrowed from financial institutions (debt) in order to finance the Group’s activities both now and in the future. The Directors consider the Group’s capital structure and dividend policy ahead of announcing results and do so in the context of its ability to continue as a going concern, to execute the strategy and to deliver its business plan.
5.1 Cash and cash equivalents
Accounting policies
Cash and cash equivalents in the statement of financial position comprise cash at bank and in hand and short-term deposits that are readily convertible to known amounts of cash and which are subject to an insignificant risk of changes in value.
Cash flows are included in the statement of cash flows on a gross basis and the GST component of cash flows arising from investing and financing activities, which is recoverable from, or payable to, the taxation authority are classified as operating cash flows.
Cash at bank earns interest at floating rates based on daily bank deposit rates.
Tuition Fees held in Tuition Protection Service Accounts in Australia
The Group is required to maintain, in Australia, separate bank accounts for funds received from international students prior to commencement of their course (prepaid fees). As at 30 June 2017, the Group’s Australian operations held $41.7m (2016: $47.9m) in prepaid fees for students who had not commenced studies with the Group, with a corresponding amount included in deferred revenue.
These funds are held in separate bank accounts until the student commences their course, at which point the funds may be used to settle normal obligations of the Group. At all times, the Group must ensure that there are sufficient funds in these separate bank accounts to repay prepaid tuition fees in full to all international students, in respect of whom tuition fees have been paid and who have not yet commenced their course.
5.2 Borrowings
Accounting policies
All loans and borrowings are initially recognised at the fair value of the consideration received. Due to the nature of these borrowings, the carrying amount of the Group’s borrowings approximate their fair value.
After initial recognition, interest-bearing loans and borrowings are subsequently measured at amortised cost using the effective interest method. Amortised cost is calculated by taking into account any issue costs, and any discount or premium on settlement.
Borrowings are classified as current liabilities unless the Group has an unconditional right to defer settlement of the liability for at least 12 months after the balance date.
Commitments and contingencies are disclosed net of the amount of GST recoverable from, or payable to, the taxation authority.
Note2017
$000s2016
$000s
CurrentSecuredFinance lease liabilities 5.2.2 3,099 -
Non CurrentSecuredFinance lease liabilities 5.2.2 21,534 -Bank loans 5.2.1 248,033 135,093
269,567 135,093
Navitas Limited Annual Report 2017 083
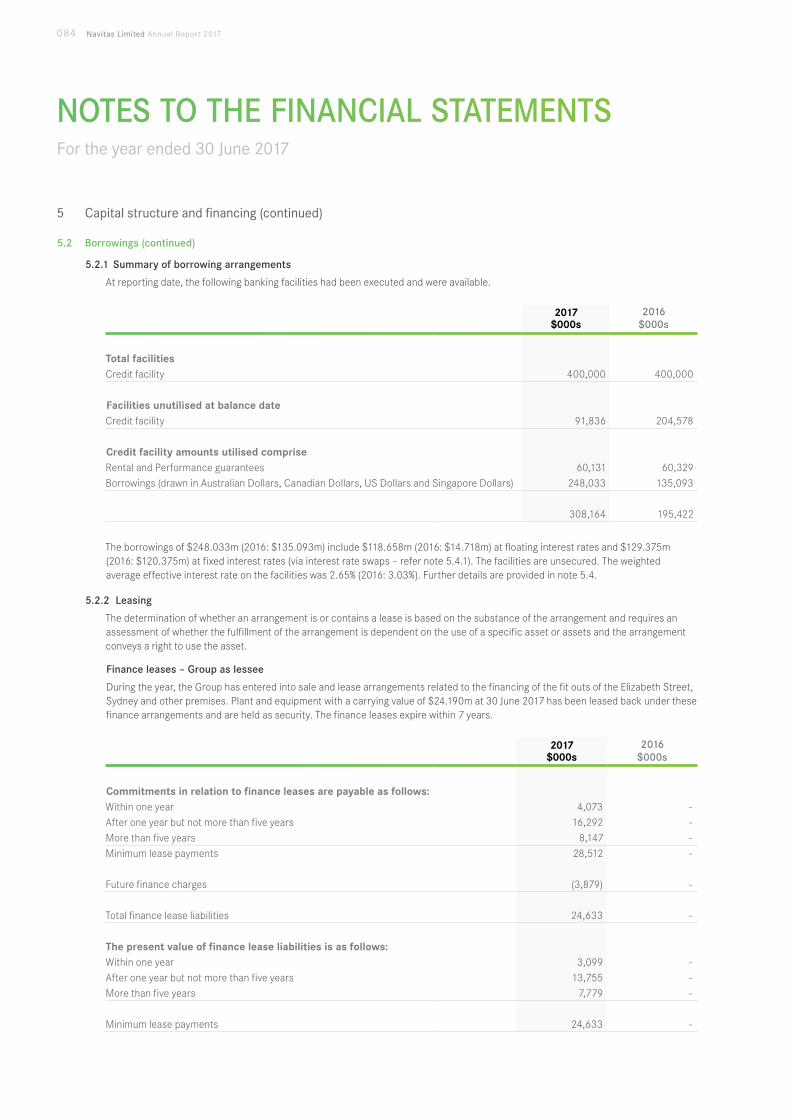
NOTES TO THE FINANCIAL STATEMENTS For the year ended 30 June 2017
5 Capital structure and financing (continued)
5.2 Borrowings (continued)
5.2.1 Summary of borrowing arrangements
At reporting date, the following banking facilities had been executed and were available.
2017 $000s
2016 $000s
Total facilitiesCredit facility 400,000 400,000
Facilities unutilised at balance dateCredit facility 91,836 204,578
Credit facility amounts utilised compriseRental and Performance guarantees 60,131 60,329Borrowings (drawn in Australian Dollars, Canadian Dollars, US Dollars and Singapore Dollars) 248,033 135,093
308,164 195,422
The borrowings of $248.033m (2016: $135.093m) include $118.658m (2016: $14.718m) at floating interest rates and $129.375m (2016: $120.375m) at fixed interest rates (via interest rate swaps – refer note 5.4.1). The facilities are unsecured. The weighted average effective interest rate on the facilities was 2.65% (2016: 3.03%). Further details are provided in note 5.4.
5.2.2 Leasing
The determination of whether an arrangement is or contains a lease is based on the substance of the arrangement and requires an assessment of whether the fulfillment of the arrangement is dependent on the use of a specific asset or assets and the arrangement conveys a right to use the asset.
Finance leases – Group as lessee
During the year, the Group has entered into sale and lease arrangements related to the financing of the fit outs of the Elizabeth Street, Sydney and other premises. Plant and equipment with a carrying value of $24.190m at 30 June 2017 has been leased back under these finance arrangements and are held as security. The finance leases expire within 7 years.
2017 $000s
2016 $000s
Commitments in relation to finance leases are payable as follows:Within one year 4,073 -After one year but not more than five years 16,292 -More than five years 8,147 -Minimum lease payments 28,512 -
Future finance charges (3,879) -
Total finance lease liabilities 24,633 -
The present value of finance lease liabilities is as follows:Within one year 3,099 -After one year but not more than five years 13,755 -More than five years 7,779 -
Minimum lease payments 24,633 -
084 Navitas Limited Annual Report 2017
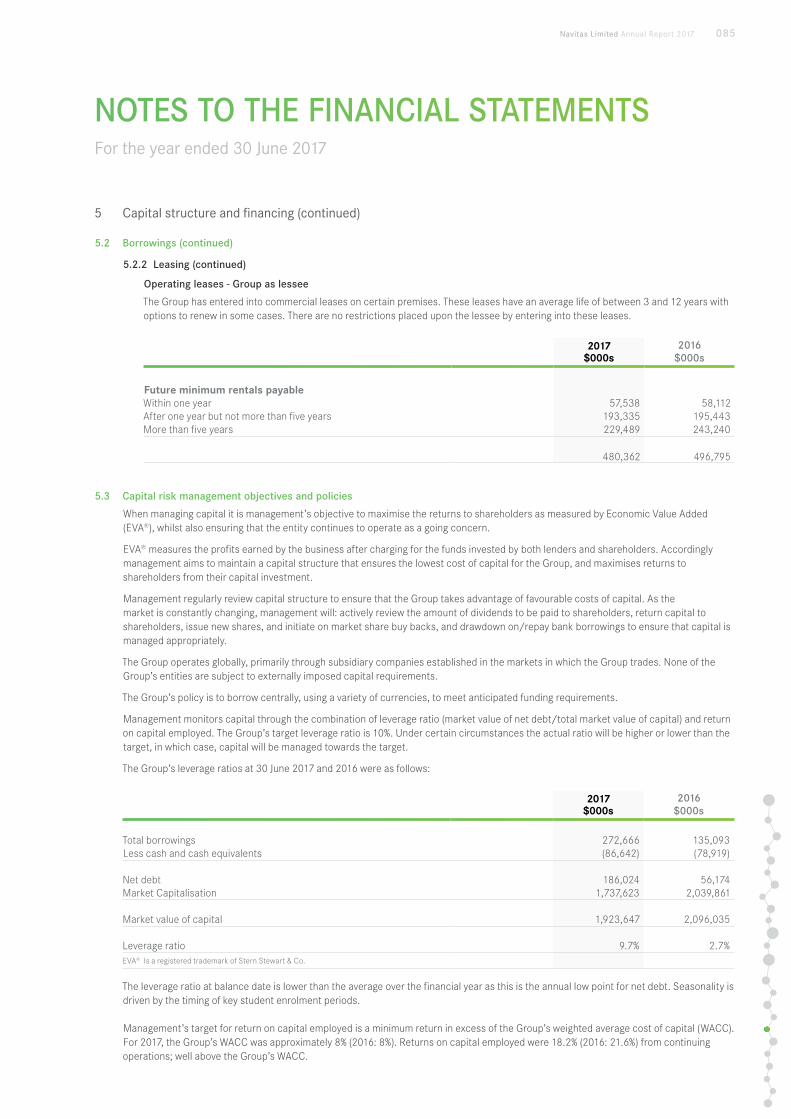
NOTES TO THE FINANCIAL STATEMENTS For the year ended 30 June 2017
5 Capital structure and financing (continued)
5.2 Borrowings (continued)
5.2.2 Leasing (continued)
Operating leases - Group as lessee
The Group has entered into commercial leases on certain premises. These leases have an average life of between 3 and 12 years with options to renew in some cases. There are no restrictions placed upon the lessee by entering into these leases.
2017 $000s
2016 $000s
Future minimum rentals payableWithin one year 57,538 58,112After one year but not more than five years 193,335 195,443More than five years 229,489 243,240
480,362 496,795
5.3 Capital risk management objectives and policies
When managing capital it is management’s objective to maximise the returns to shareholders as measured by Economic Value Added (EVA®), whilst also ensuring that the entity continues to operate as a going concern.
EVA® measures the profits earned by the business after charging for the funds invested by both lenders and shareholders. Accordingly management aims to maintain a capital structure that ensures the lowest cost of capital for the Group, and maximises returns to shareholders from their capital investment.
Management regularly review capital structure to ensure that the Group takes advantage of favourable costs of capital. As the market is constantly changing, management will: actively review the amount of dividends to be paid to shareholders, return capital to shareholders, issue new shares, and initiate on market share buy backs, and drawdown on/repay bank borrowings to ensure that capital is managed appropriately.
The Group operates globally, primarily through subsidiary companies established in the markets in which the Group trades. None of the Group’s entities are subject to externally imposed capital requirements.
The Group’s policy is to borrow centrally, using a variety of currencies, to meet anticipated funding requirements.
Management monitors capital through the combination of leverage ratio (market value of net debt/total market value of capital) and return on capital employed. The Group’s target leverage ratio is 10%. Under certain circumstances the actual ratio will be higher or lower than the target, in which case, capital will be managed towards the target.
The Group’s leverage ratios at 30 June 2017 and 2016 were as follows:
2017 $000s
2016 $000s
Total borrowings 272,666 135,093Less cash and cash equivalents (86,642) (78,919)
Net debt 186,024 56,174Market Capitalisation 1,737,623 2,039,861
Market value of capital 1,923,647 2,096,035
Leverage ratio 9.7% 2.7%EVA® Is a registered trademark of Stern Stewart & Co.
The leverage ratio at balance date is lower than the average over the financial year as this is the annual low point for net debt. Seasonality is driven by the timing of key student enrolment periods.
Management’s target for return on capital employed is a minimum return in excess of the Group’s weighted average cost of capital (WACC). For 2017, the Group’s WACC was approximately 8% (2016: 8%). Returns on capital employed were 18.2% (2016: 21.6%) from continuing operations; well above the Group’s WACC.
Navitas Limited Annual Report 2017 085
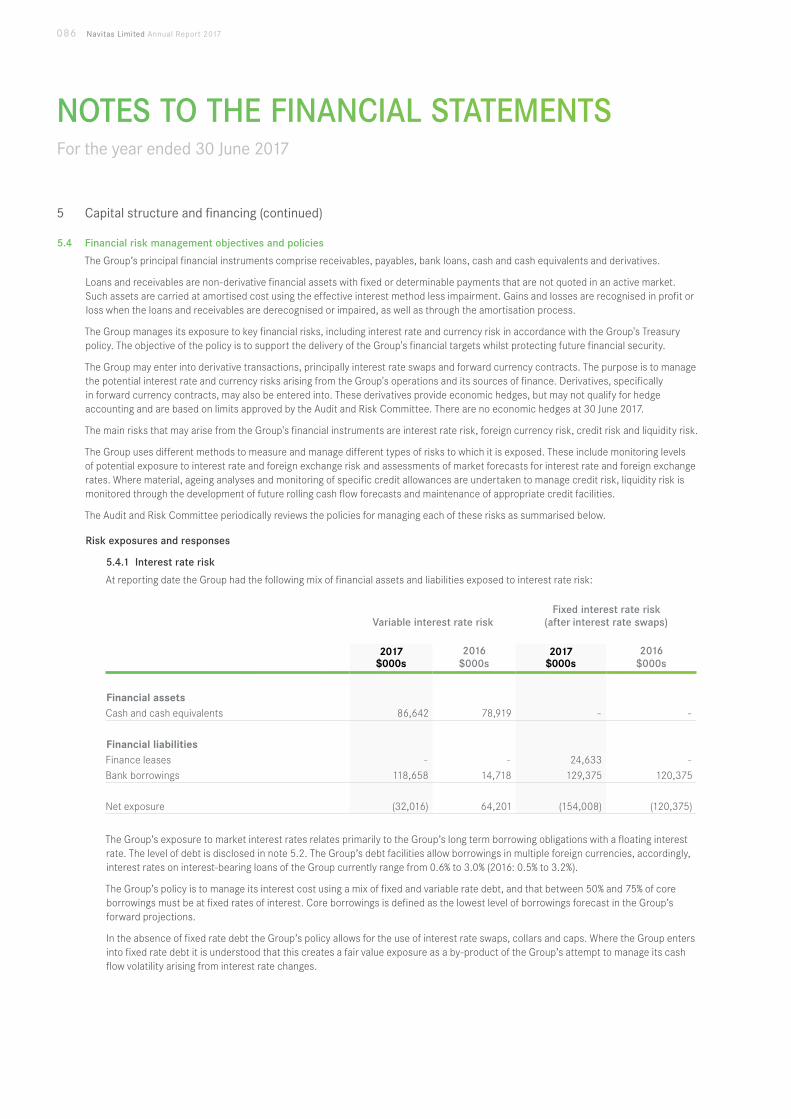
NOTES TO THE FINANCIAL STATEMENTS For the year ended 30 June 2017
5 Capital structure and financing (continued)
5.4 Financial risk management objectives and policies
The Group’s principal financial instruments comprise receivables, payables, bank loans, cash and cash equivalents and derivatives.
Loans and receivables are non-derivative financial assets with fixed or determinable payments that are not quoted in an active market. Such assets are carried at amortised cost using the effective interest method less impairment. Gains and losses are recognised in profit or loss when the loans and receivables are derecognised or impaired, as well as through the amortisation process.
The Group manages its exposure to key financial risks, including interest rate and currency risk in accordance with the Group's Treasury policy. The objective of the policy is to support the delivery of the Group's financial targets whilst protecting future financial security.
The Group may enter into derivative transactions, principally interest rate swaps and forward currency contracts. The purpose is to manage the potential interest rate and currency risks arising from the Group's operations and its sources of finance. Derivatives, specifically in forward currency contracts, may also be entered into. These derivatives provide economic hedges, but may not qualify for hedge accounting and are based on limits approved by the Audit and Risk Committee. There are no economic hedges at 30 June 2017.
The main risks that may arise from the Group's financial instruments are interest rate risk, foreign currency risk, credit risk and liquidity risk.
The Group uses different methods to measure and manage different types of risks to which it is exposed. These include monitoring levels of potential exposure to interest rate and foreign exchange risk and assessments of market forecasts for interest rate and foreign exchange rates. Where material, ageing analyses and monitoring of specific credit allowances are undertaken to manage credit risk, liquidity risk is monitored through the development of future rolling cash flow forecasts and maintenance of appropriate credit facilities.
The Audit and Risk Committee periodically reviews the policies for managing each of these risks as summarised below.
Risk exposures and responses
5.4.1 Interest rate risk
At reporting date the Group had the following mix of financial assets and liabilities exposed to interest rate risk:
Variable interest rate riskFixed interest rate risk
(after interest rate swaps)
2017 $000s
2016 $000s
2017 $000s
2016 $000s
Financial assetsCash and cash equivalents 86,642 78,919 - -
Financial liabilitiesFinance leases - - 24,633 -Bank borrowings 118,658 14,718 129,375 120,375
Net exposure (32,016) 64,201 (154,008) (120,375)
The Group’s exposure to market interest rates relates primarily to the Group’s long term borrowing obligations with a floating interest rate. The level of debt is disclosed in note 5.2. The Group’s debt facilities allow borrowings in multiple foreign currencies, accordingly, interest rates on interest-bearing loans of the Group currently range from 0.6% to 3.0% (2016: 0.5% to 3.2%).
The Group’s policy is to manage its interest cost using a mix of fixed and variable rate debt, and that between 50% and 75% of core borrowings must be at fixed rates of interest. Core borrowings is defined as the lowest level of borrowings forecast in the Group’s forward projections.
In the absence of fixed rate debt the Group’s policy allows for the use of interest rate swaps, collars and caps. Where the Group enters into fixed rate debt it is understood that this creates a fair value exposure as a by-product of the Group’s attempt to manage its cash flow volatility arising from interest rate changes.
086 Navitas Limited Annual Report 2017
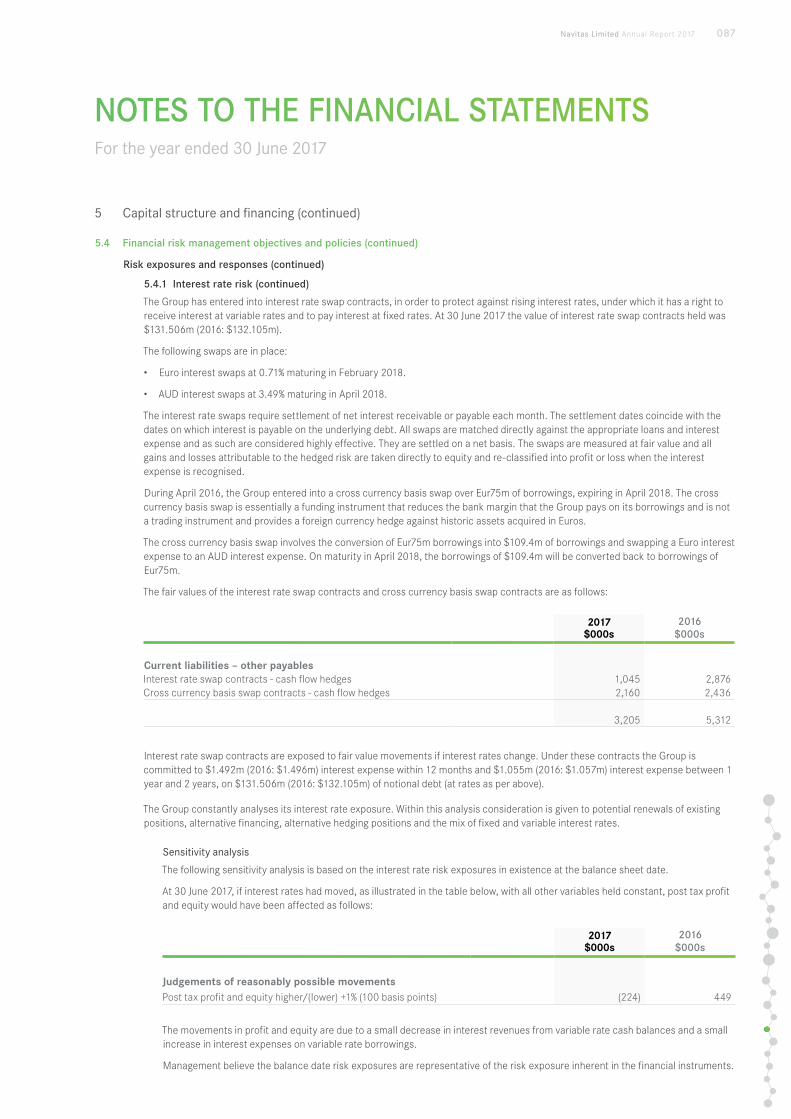
NOTES TO THE FINANCIAL STATEMENTS For the year ended 30 June 2017
5 Capital structure and financing (continued)
5.4 Financial risk management objectives and policies (continued)
Risk exposures and responses (continued)
5.4.1 Interest rate risk (continued)
The Group has entered into interest rate swap contracts, in order to protect against rising interest rates, under which it has a right to receive interest at variable rates and to pay interest at fixed rates. At 30 June 2017 the value of interest rate swap contracts held was $131.506m (2016: $132.105m).
The following swaps are in place:
• Euro interest swaps at 0.71% maturing in February 2018.
• AUD interest swaps at 3.49% maturing in April 2018.
The interest rate swaps require settlement of net interest receivable or payable each month. The settlement dates coincide with the dates on which interest is payable on the underlying debt. All swaps are matched directly against the appropriate loans and interest expense and as such are considered highly effective. They are settled on a net basis. The swaps are measured at fair value and all gains and losses attributable to the hedged risk are taken directly to equity and re-classified into profit or loss when the interest expense is recognised.
During April 2016, the Group entered into a cross currency basis swap over Eur75m of borrowings, expiring in April 2018. The cross currency basis swap is essentially a funding instrument that reduces the bank margin that the Group pays on its borrowings and is not a trading instrument and provides a foreign currency hedge against historic assets acquired in Euros.
The cross currency basis swap involves the conversion of Eur75m borrowings into $109.4m of borrowings and swapping a Euro interest expense to an AUD interest expense. On maturity in April 2018, the borrowings of $109.4m will be converted back to borrowings of Eur75m.
The fair values of the interest rate swap contracts and cross currency basis swap contracts are as follows:
2017 $000s
2016 $000s
Current liabilities – other payablesInterest rate swap contracts - cash flow hedges 1,045 2,876Cross currency basis swap contracts - cash flow hedges 2,160 2,436
3,205 5,312
Interest rate swap contracts are exposed to fair value movements if interest rates change. Under these contracts the Group is committed to $1.492m (2016: $1.496m) interest expense within 12 months and $1.055m (2016: $1.057m) interest expense between 1 year and 2 years, on $131.506m (2016: $132.105m) of notional debt (at rates as per above).
The Group constantly analyses its interest rate exposure. Within this analysis consideration is given to potential renewals of existing positions, alternative financing, alternative hedging positions and the mix of fixed and variable interest rates.
Sensitivity analysis
The following sensitivity analysis is based on the interest rate risk exposures in existence at the balance sheet date.
At 30 June 2017, if interest rates had moved, as illustrated in the table below, with all other variables held constant, post tax profit and equity would have been affected as follows:
2017 $000s
2016 $000s
Judgements of reasonably possible movementsPost tax profit and equity higher/(lower) +1% (100 basis points) (224) 449
The movements in profit and equity are due to a small decrease in interest revenues from variable rate cash balances and a small increase in interest expenses on variable rate borrowings.
Management believe the balance date risk exposures are representative of the risk exposure inherent in the financial instruments.
Navitas Limited Annual Report 2017 087
NOTES TO THE FINANCIAL STATEMENTS For the year ended 30 June 2017
5 Capital structure and financing (continued)
5.4 Financial risk management objectives and policies (continued)
Risk exposures and responses (continued)
5.4.2 Foreign currency risk
Foreign currency risk is the risk that the fair value or future cash flows of a financial instrument will fluctuate because of changes in foreign exchange rates. The Group’s exposure to the risk of changes in foreign exchange rates relates primarily to the Group’s operating activities (when revenue or expense is denominated in different currency from the Group’s presentation currency) “Transactional risk”, and the Group’s net investments in foreign subsidiaries “Translational risk”.
5.4.2.1 Transactional risk
The Group’s foreign currency risk policy is to only hedge known and committed exposures.
5.4.2.2 Translational risk
The Group’s policy is to hedge its exposure to fluctuations on the translation of its foreign operations by holding net borrowings in foreign currencies, where the unhedged exposure exceeds $10.0m. This is currently limited to the Group’s Euro, US Dollar and Singapore Dollar exposures.
5.4.3 Credit risk
Credit risk arises from the financial assets of the Group, which comprise cash and cash equivalents, trade and other receivables, other financial assets and derivative instruments. The Group's exposure to credit risk arises from potential default of the counter party, with a maximum exposure equal to the carrying amount of these instruments.
The Group is not exposed to significant credit risk. See note 4.2.
5.4.4 Liquidity risk
The Group’s objective is to maintain a balance between the continuity of funding and flexibility through the use of operating cash flows and committed available credit facilities.
The Group has a series of five year multi-currency bilateral revolving credit facilities for $400m. Of this facility $75m expires in December 2019 and $325m expires in December 2020. These facilities are split into two tranches. Tranche A is $320m and wholly consists of credit facilities, whereas Tranche B is $80m and is primarily for contingent instrument requirements.
A total of $308.164m (2016: $195.422m) had been utilised of the total facility, split between lease rental and performance guarantees of $60.131m (2016: $60.329m) and borrowings of $248.033m (2016: $135.093m).
Cash flows from operations for 2017 were $101.534m (2016: $125.810m).
The Group’s policy is that no more than 50% of credit facilities should mature within the following 12 months. At 30 June 2017, none (2016: none) of the Group’s credit facilities will mature within the following 12 months.
088 Navitas Limited Annual Report 2017
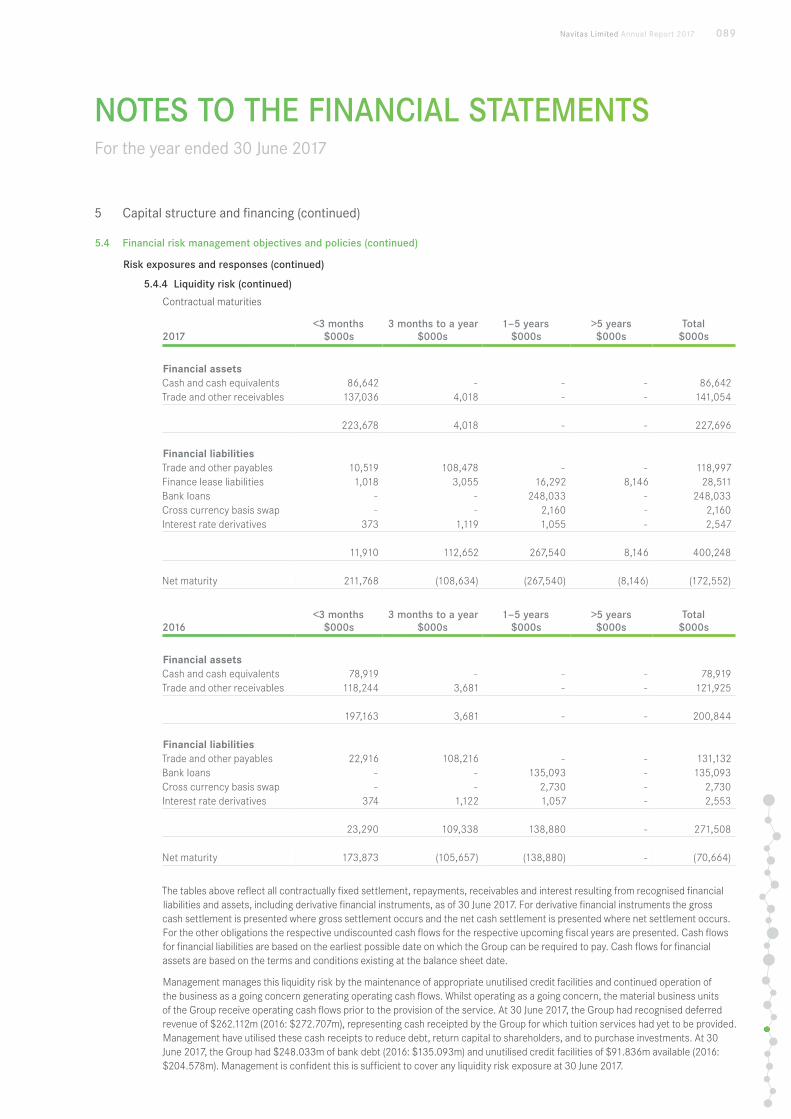
NOTES TO THE FINANCIAL STATEMENTS For the year ended 30 June 2017
5 Capital structure and financing (continued)
5.4 Financial risk management objectives and policies (continued)
Risk exposures and responses (continued)
5.4.4 Liquidity risk (continued)
Contractual maturities
2017<3 months
$000s3 months to a year
$000s1 —5 years
$000s>5 years $000s
Total $000s
Financial assetsCash and cash equivalents 86,642 - - - 86,642Trade and other receivables 137,036 4,018 - - 141,054
223,678 4,018 - - 227,696
Financial liabilitiesTrade and other payables 10,519 108,478 - - 118,997Finance lease liabilities 1,018 3,055 16,292 8,146 28,511Bank loans - - 248,033 - 248,033Cross currency basis swap - - 2,160 - 2,160Interest rate derivatives 373 1,119 1,055 - 2,547
11,910 112,652 267,540 8,146 400,248
Net maturity 211,768 (108,634) (267,540) (8,146) (172,552)
2016<3 months
$000s3 months to a year
$000s1 —5 years
$000s>5 years $000s
Total $000s
Financial assetsCash and cash equivalents 78,919 - - - 78,919Trade and other receivables 118,244 3,681 - - 121,925
197,163 3,681 - - 200,844
Financial liabilitiesTrade and other payables 22,916 108,216 - - 131,132Bank loans - - 135,093 - 135,093Cross currency basis swap - - 2,730 - 2,730Interest rate derivatives 374 1,122 1,057 - 2,553
23,290 109,338 138,880 - 271,508
Net maturity 173,873 (105,657) (138,880) - (70,664)
The tables above reflect all contractually fixed settlement, repayments, receivables and interest resulting from recognised financial liabilities and assets, including derivative financial instruments, as of 30 June 2017. For derivative financial instruments the gross cash settlement is presented where gross settlement occurs and the net cash settlement is presented where net settlement occurs. For the other obligations the respective undiscounted cash flows for the respective upcoming fiscal years are presented. Cash flows for financial liabilities are based on the earliest possible date on which the Group can be required to pay. Cash flows for financial assets are based on the terms and conditions existing at the balance sheet date.
Management manages this liquidity risk by the maintenance of appropriate unutilised credit facilities and continued operation of the business as a going concern generating operating cash flows. Whilst operating as a going concern, the material business units of the Group receive operating cash flows prior to the provision of the service. At 30 June 2017, the Group had recognised deferred revenue of $262.112m (2016: $272.707m), representing cash receipted by the Group for which tuition services had yet to be provided. Management have utilised these cash receipts to reduce debt, return capital to shareholders, and to purchase investments. At 30 June 2017, the Group had $248.033m of bank debt (2016: $135.093m) and unutilised credit facilities of $91.836m available (2016: $204.578m). Management is confident this is sufficient to cover any liquidity risk exposure at 30 June 2017.
Navitas Limited Annual Report 2017 089
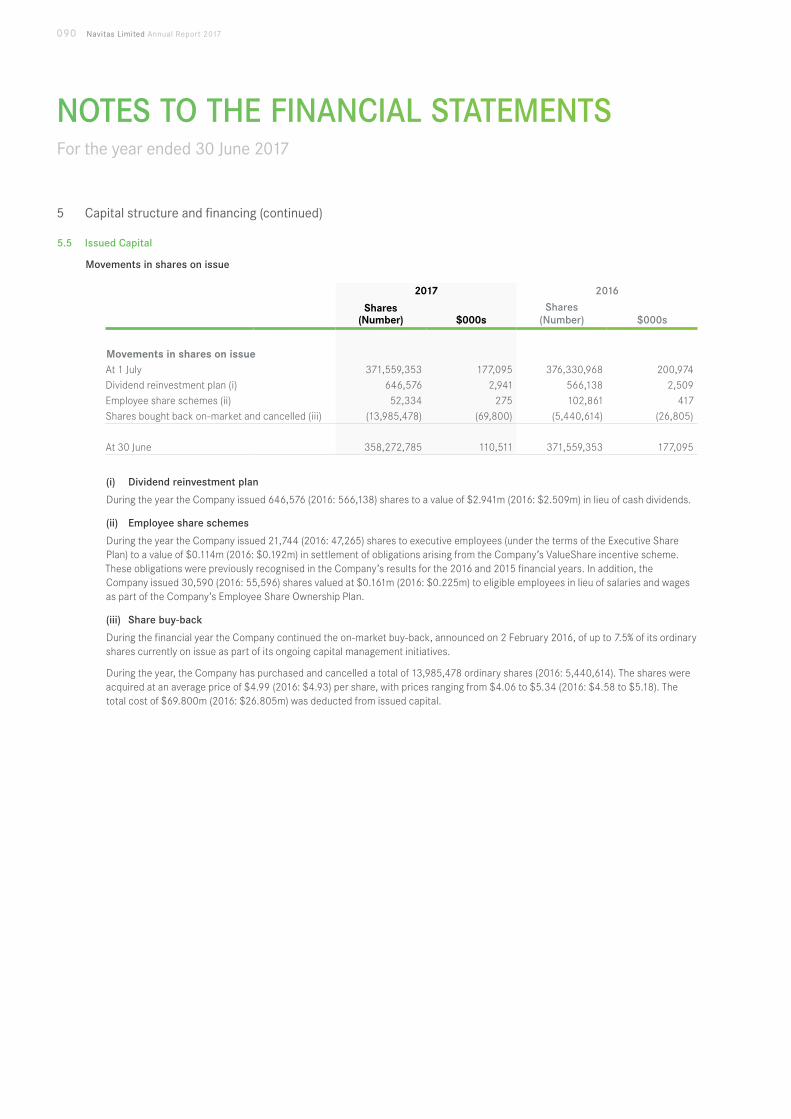
NOTES TO THE FINANCIAL STATEMENTS For the year ended 30 June 2017
5 Capital structure and financing (continued)
5.5 Issued Capital
Movements in shares on issue
2017 2016
Shares (Number) $000s
Shares (Number) $000s
Movements in shares on issueAt 1 July 371,559,353 177,095 376,330,968 200,974Dividend reinvestment plan (i) 646,576 2,941 566,138 2,509Employee share schemes (ii) 52,334 275 102,861 417Shares bought back on-market and cancelled (iii) (13,985,478) (69,800) (5,440,614) (26,805)
At 30 June 358,272,785 110,511 371,559,353 177,095
(i) Dividend reinvestment plan
During the year the Company issued 646,576 (2016: 566,138) shares to a value of $2.941m (2016: $2.509m) in lieu of cash dividends.
(ii) Employee share schemes
During the year the Company issued 21,744 (2016: 47,265) shares to executive employees (under the terms of the Executive Share Plan) to a value of $0.114m (2016: $0.192m) in settlement of obligations arising from the Company’s ValueShare incentive scheme. These obligations were previously recognised in the Company’s results for the 2016 and 2015 financial years. In addition, the Company issued 30,590 (2016: 55,596) shares valued at $0.161m (2016: $0.225m) to eligible employees in lieu of salaries and wages as part of the Company’s Employee Share Ownership Plan.
(iii) Share buy-back
During the financial year the Company continued the on-market buy-back, announced on 2 February 2016, of up to 7.5% of its ordinary shares currently on issue as part of its ongoing capital management initiatives.
During the year, the Company has purchased and cancelled a total of 13,985,478 ordinary shares (2016: 5,440,614). The shares were acquired at an average price of $4.99 (2016: $4.93) per share, with prices ranging from $4.06 to $5.34 (2016: $4.58 to $5.18). The total cost of $69.800m (2016: $26.805m) was deducted from issued capital.
090 Navitas Limited Annual Report 2017
NOTES TO THE FINANCIAL STATEMENTS For the year ended 30 June 2017
6 Other notes
6.1 Related party disclosures
6.1.1 Equity interests in related parties
The consolidated financial statements include the financial statements of Navitas Limited and its controlled entities. The table below lists the primary operating controlled entities of the Group. Individual controlled entities that do not provide a significant contribution to the Group’s revenue, profits or net assets have not been listed. All are owned 100% except as indicated.
Country of incorporation
Name
AustraliaACL Pty Ltd* Navitas Bundoora Pty Ltd*Australian Campus Network Pty Limited* Navitas College of Health Pty Ltd*Australian College of English Pty Ltd* Navitas College of Public Safety Pty Ltd*Cadre Design Pty. Limited* Navitas English Pty Limited*Colleges of Business & Technology (NSW) Pty Ltd* Navitas English Services Pty Limited*Colleges of Business and Technology (WA) Pty Ltd* Navitas LIS Holdings Pty Ltd*Cytech Intersearch Pty Limited* Navitas Professional Institute Pty Ltd*Educational Enterprises Australia Pty. Ltd.* Navitas Professional Pty Ltd*Educational Services Pty Ltd* Navitas Professional Training Pty Ltd*Hawthorn Learning Pty Limited* Navitas SAE Holdings Pty Ltd*Health Skills Australia Pty Ltd* Navitas USA Pty Ltd*IBT (Canada) Pty Limited* Newcastle International College Pty Ltd*IBT (Sydney) Pty Limited* Queensland Institute of Business & Technology Pty Ltd*IBT Education Pty Ltd* SAE Institute Pty Limited*IBT Finance Pty Limited* South Australian Institute of Business and Technology Pty Ltd*Navitas SAE (UK) Holdings Pty Ltd* Sydney Institute of Business and Technology Pty Ltd* LM Training Specialists Pty. Ltd.* The Australian Centre for Languages Pty Ltd*Melbourne Institute of Business and Technology Pty Ltd* The Learning Space Pty Ltd*Navitas America Pty Ltd** indicates member of the closed group
Rest of worldFraser International College Limited International College of Manitoba LimitedCurtin Education Centre Pte. Ltd. (90%) SAE-Institute GmbH
Entities subject to class order relief
Pursuant to ASIC Class Order 2016/785, relief has been granted to certain of the entities which are indicated above as members of the closed group (“closed group entities”) from the Corporations Act 2001 requirements for preparation, audit and lodgement of their financial reports.
As a condition of the Class Order, Navitas Limited and the closed group entities entered into a Deed of Cross Guarantee on 15 June 2006, as varied from time to time. The effect of the deed is that Navitas Limited has guaranteed to pay any deficiency in the event of winding up of any closed group entity. The closed group entities have also given a similar guarantee in the event that Navitas Limited is wound up.
During the period, no entity has been:
• removed by a revocation deed contemplated by the Deed of Cross Guarantee; or
• the subject of a notice of disposal contemplated by the Deed of Cross Guarantee; except for Perth Institute of Business and Technology Pty Ltd, (now named Edith Cowan College Pty Ltd), which was removed by revocation deed on 28 September 2016.
During the period, no entity obtained relief under the Class Order or a previous order at the end of the immediately preceding financial year but which was ineligible for relief in respect of the relevant financial period.
Navitas Limited Annual Report 2017 091
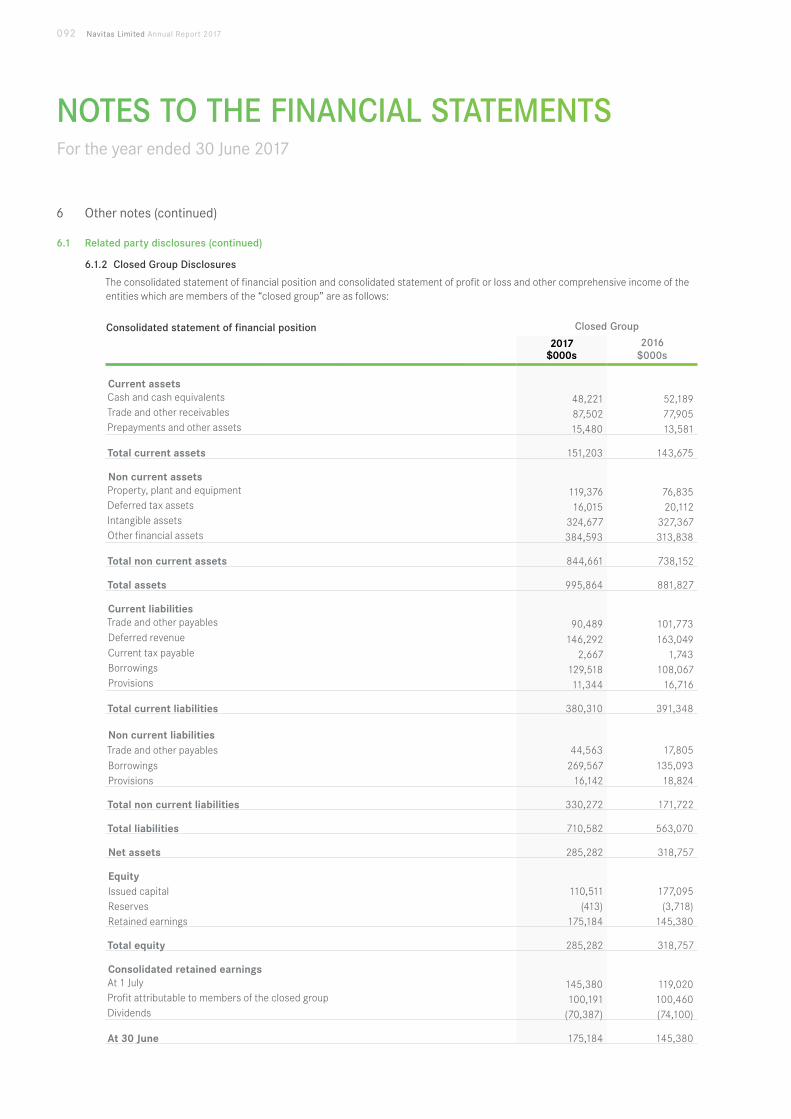
NOTES TO THE FINANCIAL STATEMENTS For the year ended 30 June 2017
6 Other notes (continued)
6.1 Related party disclosures (continued)
6.1.2 Closed Group Disclosures
The consolidated statement of financial position and consolidated statement of profit or loss and other comprehensive income of the entities which are members of the “closed group” are as follows:
Consolidated statement of financial position Closed Group
2017 $000s
2016 $000s
Current assets Cash and cash equivalents 48,221 52,189Trade and other receivables 87,502 77,905Prepayments and other assets 15,480 13,581 Total current assets 151,203 143,675 Non current assetsProperty, plant and equipment 119,376 76,835Deferred tax assets 16,015 20,112Intangible assets 324,677 327,367Other financial assets 384,593 313,838 Total non current assets 844,661 738,152 Total assets 995,864 881,827 Current liabilitiesTrade and other payables 90,489 101,773Deferred revenue 146,292 163,049Current tax payable 2,667 1,743Borrowings 129,518 108,067Provisions 11,344 16,716 Total current liabilities 380,310 391,348 Non current liabilitiesTrade and other payables 44,563 17,805Borrowings 269,567 135,093Provisions 16,142 18,824 Total non current liabilities 330,272 171,722 Total liabilities 710,582 563,070 Net assets 285,282 318,757 EquityIssued capital 110,511 177,095Reserves (413) (3,718)Retained earnings 175,184 145,380 Total equity 285,282 318,757 Consolidated retained earningsAt 1 July 145,380 119,020Profit attributable to members of the closed group 100,191 100,460Dividends (70,387) (74,100) At 30 June 175,184 145,380
092 Navitas Limited Annual Report 2017
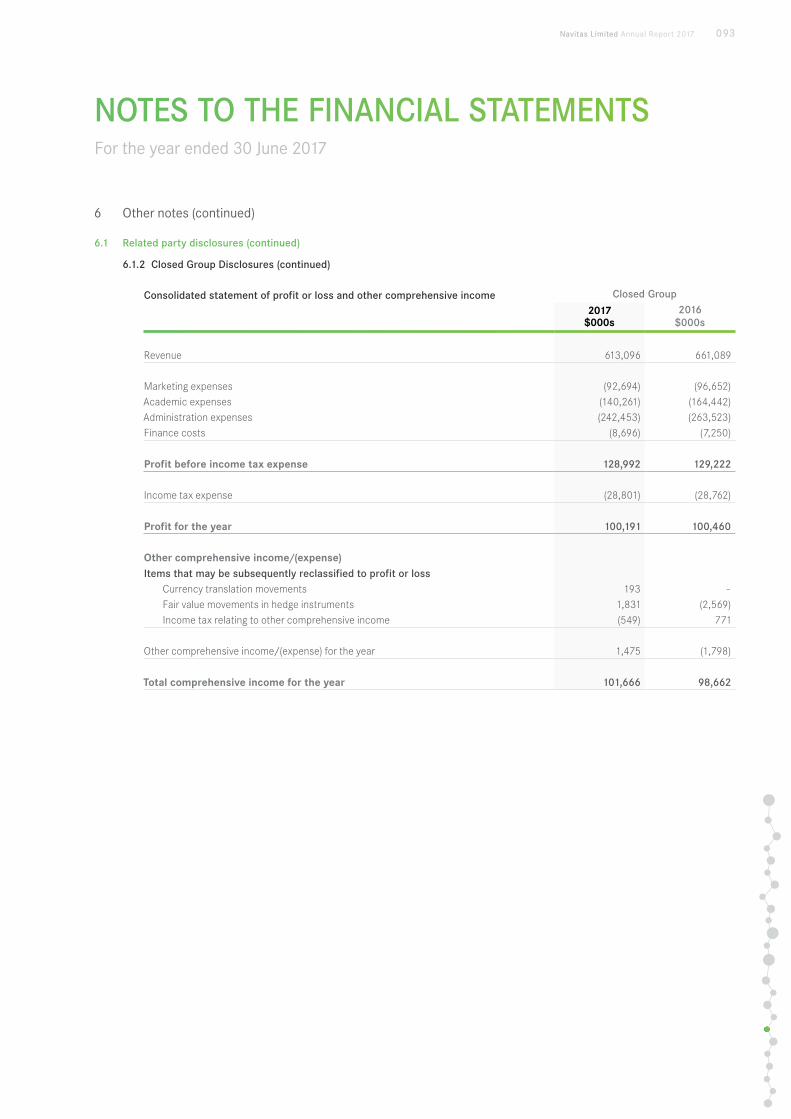
NOTES TO THE FINANCIAL STATEMENTS For the year ended 30 June 2017
6 Other notes (continued)
6.1 Related party disclosures (continued)
6.1.2 Closed Group Disclosures (continued)
Consolidated statement of profit or loss and other comprehensive income Closed Group
2017 $000s
2016 $000s
Revenue 613,096 661,089
Marketing expenses (92,694) (96,652)Academic expenses (140,261) (164,442)Administration expenses (242,453) (263,523)Finance costs (8,696) (7,250)
Profit before income tax expense 128,992 129,222
Income tax expense (28,801) (28,762)
Profit for the year 100,191 100,460
Other comprehensive income/(expense)Items that may be subsequently reclassified to profit or loss
Currency translation movements 193 -Fair value movements in hedge instruments 1,831 (2,569)Income tax relating to other comprehensive income (549) 771
Other comprehensive income/(expense) for the year 1,475 (1,798)
Total comprehensive income for the year 101,666 98,662
Navitas Limited Annual Report 2017 093
NOTES TO THE FINANCIAL STATEMENTS For the year ended 30 June 2017
6 Other notes (continued)
6.1 Related party disclosures (continued)
6.1.3 Transactions with other related parties
Transactions between the Group and its related parties
During the financial year, the following transactions occurred between the Group and its other related parties:
• Hoperidge Advisors Pty Ltd, an entity associated with Mr Rod Jones, is a sub tenant in one of the Group’s rented properties. Navitas has recorded income of $67,144 (2016: $64,388) in relation to this contract. This contract is on normal terms and conditions.
• Greenridge Electrical Pty Ltd, an entity associated with Mr Rod Jones, is a sub tenant in one of the Group’s rented properties. Navitas has recorded income of $26,118 (2016: $43,080) in relation to this contract. This contract is on normal terms and conditions.
• Navitas Limited has provided a loan to Western Sydney University International College Pty Ltd, a joint venture company, of $1,300,000 (2016: $800,000). Interest is payable on the loan at a rate of the RBS cash rate plus a margin of 3% and is payable quarterly in arrears. During the year, Navitas Limited has charged interest income of $49,202 (2016: $12,798) on the loan and interest of $14,655 (2016: $8,208) is outstanding at 30 June 2017. The loan is outstanding at 30 June 2017 and has no set repayment terms.
• Navitas Limited has charged service fees of $454,683 (2016: $38,363) and provided marketing, staff and other services totaling $56,174 (2016: $143,150) to Western Sydney University International College Pty Ltd, a joint venture company, during the year. At 30 June 2017, an amount of $52,208 (2016: $52,483) is outstanding.
• Navitas Limited has charged service fees of $877,545 (2016: $1,288,415) and provided marketing, staff and other services totaling $285,919 (2016: $117,353) to University of Canberra College Pty Limited, a joint venture company, during the year. At 30 June 2017, an amount of $563,268 (2016: $70,988) is outstanding.
• University of Canberra College Pty Limited has provided marketing, staff and other services totaling $119,238 (2016: $nil) to Navitas Limited and related entities during the year. At 30 June 2017, an amount of $23,820 (2016: $nil) is outstanding.
• Navitas Limited has charged service fees of $1,407,655 (2016: $nil) and provided staff and other services totaling $134,385 (2016: $nil) to Edith Cowan College Pty Ltd, a joint venture company, during the year. At 30 June 2017, an amount of $243,368 (2016: $nil) is outstanding.
• Edith Cowan College Pty Ltd has charged royalty fees to a subsidiary of Navitas Limited totaling $495,730 and has recharged staff costs totaling $124,093 during the year. At 30 June 2017, an amount of $523,650 (2016: $nil) is outstanding.
Apart from the above, there were no balances, arising from transactions between the Group and its other related parties, outstanding at reporting date.
All amounts advanced to or repayable to related parties are unsecured and are subordinate to other liabilities. The amounts outstanding will be settled in cash.
6.1.4 Transactions with Key Management Personnel
A list of key management personnel is provided in the remuneration report on pages 42 to 43. Aggregate compensation and shareholdings are provided on pages 48 to 53.
094 Navitas Limited Annual Report 2017
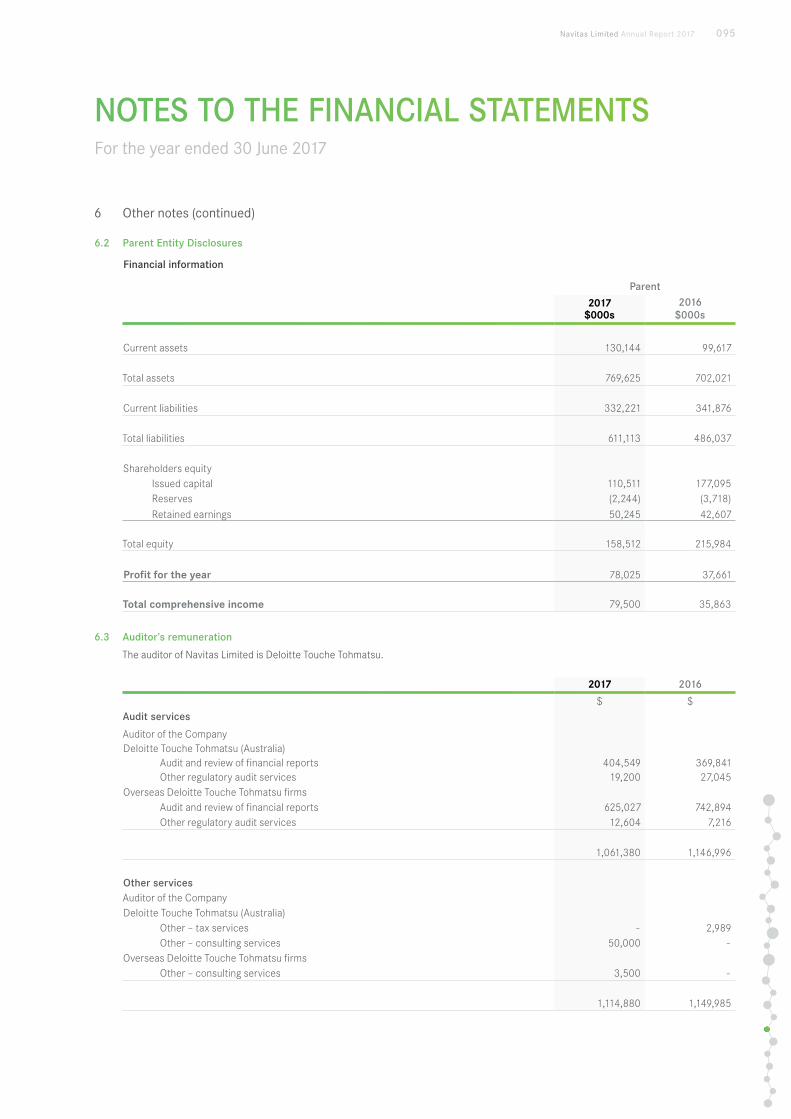
NOTES TO THE FINANCIAL STATEMENTS For the year ended 30 June 2017
6 Other notes (continued)
6.2 Parent Entity Disclosures
Financial information
Parent
2017 $000s
2016 $000s
Current assets 130,144 99,617
Total assets 769,625 702,021
Current liabilities 332,221 341,876
Total liabilities 611,113 486,037
Shareholders equity Issued capital 110,511 177,095 Reserves (2,244) (3,718)
Retained earnings 50,245 42,607
Total equity 158,512 215,984
Profit for the year 78,025 37,661
Total comprehensive income 79,500 35,863
6.3 Auditor’s remuneration
The auditor of Navitas Limited is Deloitte Touche Tohmatsu.
2017 2016
$ $Audit services
Auditor of the CompanyDeloitte Touche Tohmatsu (Australia) Audit and review of financial reports 404,549 369,841 Other regulatory audit services 19,200 27,045Overseas Deloitte Touche Tohmatsu firms Audit and review of financial reports 625,027 742,894 Other regulatory audit services 12,604 7,216
1,061,380 1,146,996
Other servicesAuditor of the CompanyDeloitte Touche Tohmatsu (Australia) Other – tax services - 2,989 Other – consulting services 50,000 -Overseas Deloitte Touche Tohmatsu firms Other – consulting services 3,500 -
1,114,880 1,149,985
Navitas Limited Annual Report 2017 095
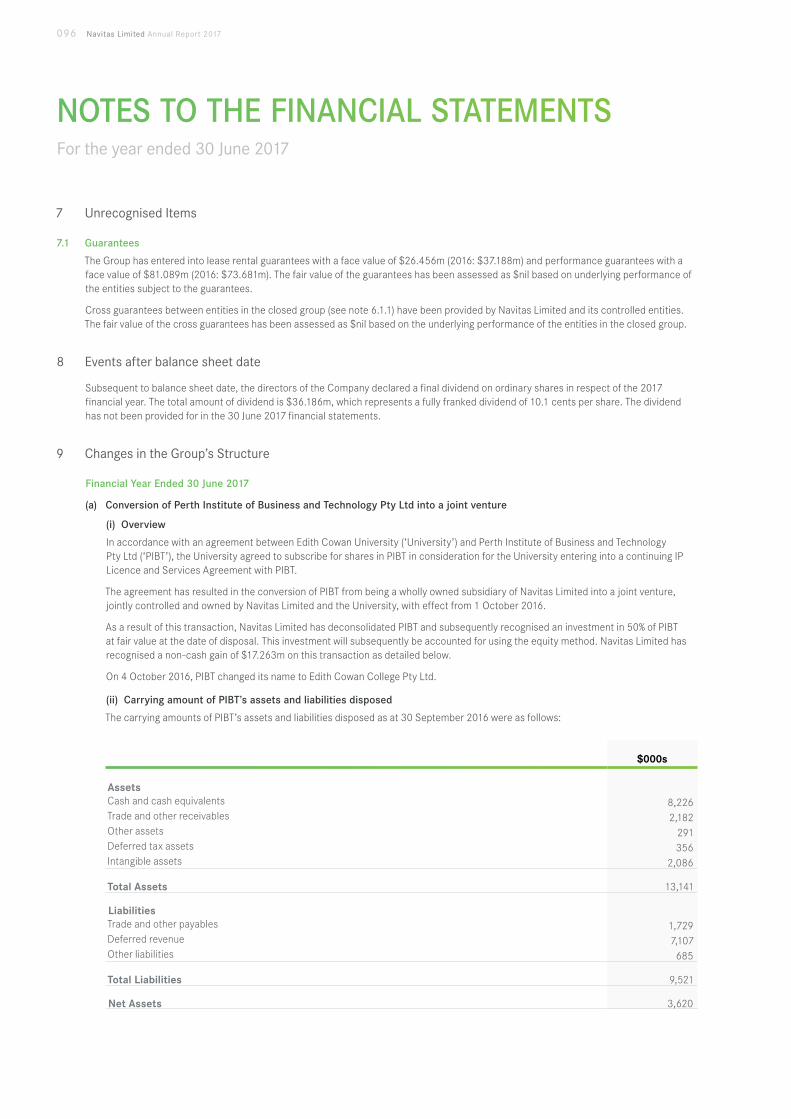
NOTES TO THE FINANCIAL STATEMENTS For the year ended 30 June 2017
7 Unrecognised Items
7.1 Guarantees
The Group has entered into lease rental guarantees with a face value of $26.456m (2016: $37.188m) and performance guarantees with a face value of $81.089m (2016: $73.681m). The fair value of the guarantees has been assessed as $nil based on underlying performance of the entities subject to the guarantees.
Cross guarantees between entities in the closed group (see note 6.1.1) have been provided by Navitas Limited and its controlled entities. The fair value of the cross guarantees has been assessed as $nil based on the underlying performance of the entities in the closed group.
8 Events after balance sheet date
Subsequent to balance sheet date, the directors of the Company declared a final dividend on ordinary shares in respect of the 2017 financial year. The total amount of dividend is $36.186m, which represents a fully franked dividend of 10.1 cents per share. The dividend has not been provided for in the 30 June 2017 financial statements.
9 Changes in the Group’s Structure
Financial Year Ended 30 June 2017
(a) Conversion of Perth Institute of Business and Technology Pty Ltd into a joint venture
(i) Overview
In accordance with an agreement between Edith Cowan University (‘University’) and Perth Institute of Business and Technology Pty Ltd (‘PIBT’), the University agreed to subscribe for shares in PIBT in consideration for the University entering into a continuing IP Licence and Services Agreement with PIBT.
The agreement has resulted in the conversion of PIBT from being a wholly owned subsidiary of Navitas Limited into a joint venture, jointly controlled and owned by Navitas Limited and the University, with effect from 1 October 2016.
As a result of this transaction, Navitas Limited has deconsolidated PIBT and subsequently recognised an investment in 50% of PIBT at fair value at the date of disposal. This investment will subsequently be accounted for using the equity method. Navitas Limited has recognised a non-cash gain of $17.263m on this transaction as detailed below.
On 4 October 2016, PIBT changed its name to Edith Cowan College Pty Ltd.
(ii) Carrying amount of PIBT’s assets and liabilities disposed
The carrying amounts of PIBT’s assets and liabilities disposed as at 30 September 2016 were as follows:
$000s
AssetsCash and cash equivalents 8,226Trade and other receivables 2,182Other assets 291Deferred tax assets 356Intangible assets 2,086 Total Assets 13,141 LiabilitiesTrade and other payables 1,729Deferred revenue 7,107Other liabilities 685 Total Liabilities 9,521 Net Assets 3,620
096 Navitas Limited Annual Report 2017
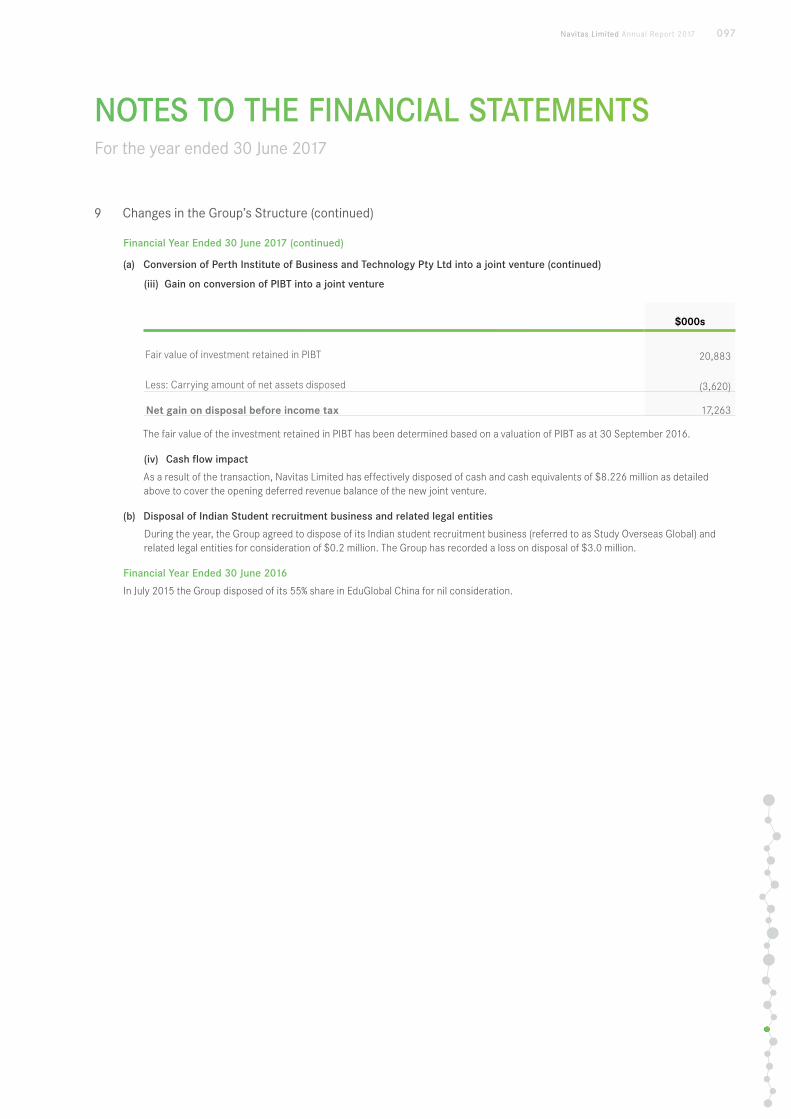
NOTES TO THE FINANCIAL STATEMENTS For the year ended 30 June 2017
9 Changes in the Group’s Structure (continued)
Financial Year Ended 30 June 2017 (continued)
(a) Conversion of Perth Institute of Business and Technology Pty Ltd into a joint venture (continued)
(iii) Gain on conversion of PIBT into a joint venture
$000s
Fair value of investment retained in PIBT 20,883
Less: Carrying amount of net assets disposed (3,620) Net gain on disposal before income tax 17,263
The fair value of the investment retained in PIBT has been determined based on a valuation of PIBT as at 30 September 2016.
(iv) Cash flow impact
As a result of the transaction, Navitas Limited has effectively disposed of cash and cash equivalents of $8.226 million as detailed above to cover the opening deferred revenue balance of the new joint venture.
(b) Disposal of Indian Student recruitment business and related legal entities
During the year, the Group agreed to dispose of its Indian student recruitment business (referred to as Study Overseas Global) and related legal entities for consideration of $0.2 million. The Group has recorded a loss on disposal of $3.0 million.
Financial Year Ended 30 June 2016
In July 2015 the Group disposed of its 55% share in EduGlobal China for nil consideration.
Navitas Limited Annual Report 2017 097

098 Navitas Limited Annual Report 2017
DIRECTORS’ DECLARATIONIn accordance with a resolution of the directors of Navitas Limited, I state that:
1. In the opinion of the Directors:
(a) the financial statements and notes are in accordance with the Corporations Act 2001, including:
(i) giving a true and fair view of the financial position as at 30 June 2017 and the performance for the year ended on that date of the consolidated entity; and
(ii) complying with Australian Accounting Standards and the Corporations Regulations 2001;
(b) the attached financial statements are in compliance with International Financial Reporting Standards, as stated in note 1.1 to the financial statements; and
(c) there are reasonable grounds to believe that the Company will be able to pays its debts as and when they become due and payable.
2. This declaration has been made after receiving the declarations required to be made to the Directors in accordance with sections 295A of the Corporations Act 2001 for the financial year ended 30 June 2017.
3. In the opinion of the Directors, as at the date of this declaration, there are reasonable grounds to believe that the members of the Closed Group identified in note 6.1.1 to the financial statements will, as a group, be able to meet any obligations or liabilities to which they are or may become subject, by virtue of the Deed of Cross Guarantee.
On behalf of the Board
R JONESGroup Chief Executive Officer and Managing Director Perth, Western Australia, 31 July 2017
Navitas Limited Annual Report 2017 099
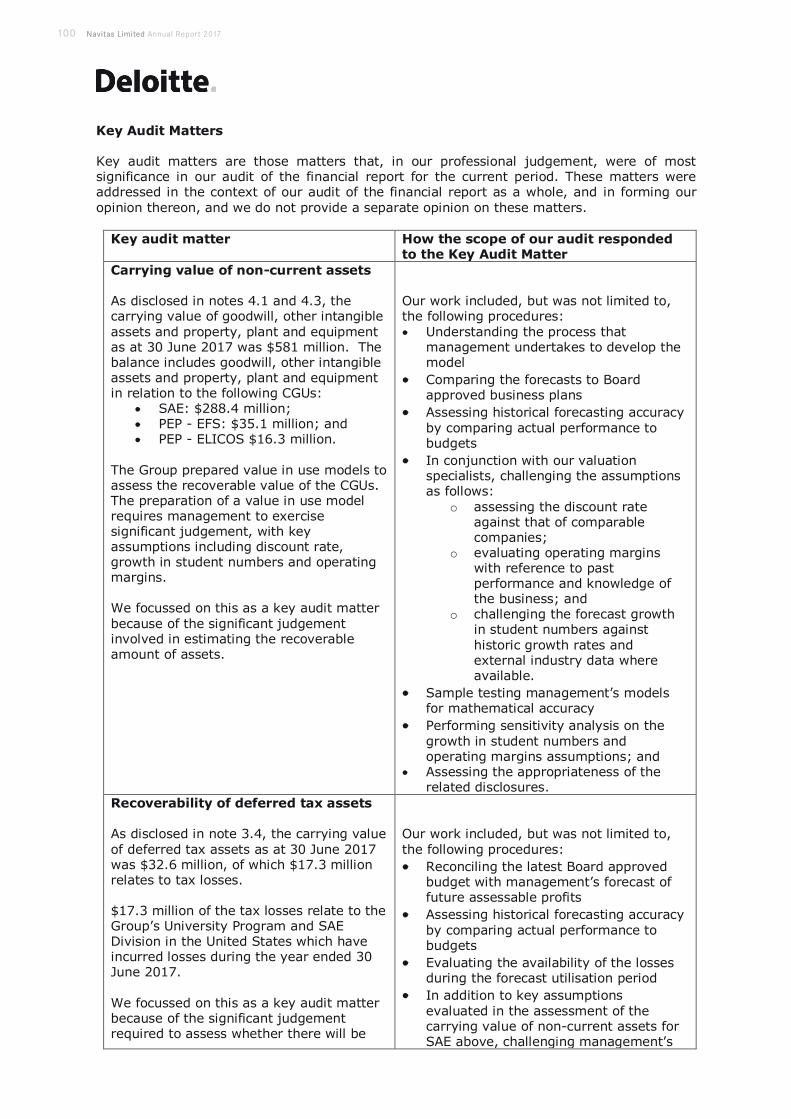
100 Navitas Limited Annual Report 2017
Navitas Limited Annual Report 2017 101
102 Navitas Limited Annual Report 2017

Navitas Limited Annual Report 2017 103
104 Navitas Limited Annual Report 2017
Additional information required by ASX and not shown elsewhere in this annual report is as follows. The information is current as at 31 August 2017.
Substantial shareholders
Substantial shareholders as disclosed in substantial holding notices given to the Company, were:
Shareholder Shares
Mr Rodney M Jones 45,117,995
Schroder Investment Management Australia Limited
26,421,938
Dr Peter D Larsen 23,433,610Allan Gray Australia Pty Ltd 22,321,745AustralianSuper Pty Ltd 18,820,858
Voting Rights
The voting rights attached to shares as set out in rule 16.2 of Navitas’ constitution are the right to attend and vote at general meetings of Navitas and on a show of hands to one vote, and on a poll to one vote for each share held.
Distribution of shareholders and their holdings
Size of shareholdingNumber of
shareholders
1–1,000 2,0121,001–5,000 1,9875,001–10,000 46610,001–100,000 326100,001–and over 69Total 4,860
As at 31 August 2017, there were 4,860 holders of Navitas shares, and a total 358,072,785 shares on issue.
There were 303 shareholders holding less than a marketable parcel of shares based on the market price on 31 August 2017 holding a total of 6,764 shares.
No shares are subject to voluntary escrow and there are no restricted securities on issue.
The Company has a current on-market buy-back for up to 7.5% of its shares, which commenced on 16 February 2016, has an unlimited duration and is approximately 70% complete.
There are no issues of securities approved for the purpose of item 7, Section 611 of the Corporations Act which have not yet been completed.
Twenty Largest Shareholders
The twenty largest holders of Navitas shares on the Company’s register as at 31 August 2017 were:
Rank Name Number of Shares % of Issued Capital
1 J P Morgan Nominees Australia Limited 54,652,805 15.26
2 HSBC Custody Nominees (Australia) Limited 43,460,110 12.14
3 Remjay Investments Pty Ltd 34,711,843 9.69
4 Citicorp Nominees Pty Limited 26,043,579 7.27
5 Landmark Holdings (WA) Pty Ltd 23,433,610 6.54
6 National Nominees Limited 22,931,054 6.40
7 Wonder Holdings Pty Ltd 18,751,890 5.24
8 Cambo Investments Pty Ltd 17,237,078 4.81
9 Hoperidge Enterprises Pty Ltd 9,486,690 2.65
10 BNP Paribas Nominees Pty Ltd 8,901,654 2.49
11 Coolah Holdings Pty Ltd 8,800,000 2.46
12 Mr Maxwell Charles Schroder 8,633,391 2.41
13 Ms Julianne Hannaford 8,129,000 2.27
14 Lily Investments Pty Ltd 5,527,968 1.5415 Mrs Luniarty Kartosudiro 4,384,312 1.22
16 CS Third Nominees Pty Limited 4,000,862 1.12
17 Argo Investments Limited 3,757,061 1.05
18 Citicorp Nominees Pty Limited 3,005,151 0.84
19 Dasam Nominees Pty Ltd 2,910,904 0.81
20 BNP Paribas Noms Pty Ltd 2,792,968 0.78
ADDITIONAL INFORMATION
Navitas Limited Annual Report 2017 105
INVESTOR INFORMATION
Annual General Meeting
The Annual General Meeting of Navitas will be held at:
Curtin University Old Perth Boys School 139 St Georges Terrace Perth WA 6000
on Wednesday 15 November 2017 at 11.00am (AWST).
Full details of the meeting are contained in the notice of annual general meeting sent with this annual report for those Shareholders who elected to receive a hard copy annual report.
Shareholder enquiries
All enquiries should be directed to the Company’s Share registry at:
Computershare Investor Services Pty Limited Level 11, 172 St Georges Terrace Perth WA 6000
T 1300 55 70 10 F +61 8 9323 2033
All written enquiries should include your Holder Identification Number as it appears in your holding statement along with your current address.
Change of address
It is important that you notify the Share registry immediately in writing if there is any change to your registered address.
Lost holding statements
Shareholders should notify the Share registry immediately, in writing, so that a replacement statement can be arranged.
Change of name
Shareholders who change their name should notify the Share registry, in writing, and attach a certified copy of a relevant marriage certificate or deed poll.
Tax File Numbers (TFN)
Although it is not compulsory for each Shareholder to provide a TFN or exemption details, for those Shareholders who do not provide the necessary details, the Company will be obliged to deduct tax from any
unfranked portion of their dividends at the top marginal rate. TFN application forms can be obtained from the Share registry, any Australia Post Office or the Australian Taxation Office.
Navitas publications
The Company’s annual report is the main source of information for investors. Shareholders who do not wish to receive the annual report should advise the Share registry. Navitas’ financial reports are also available on the Navitas website (see below).
Navitas website
Information about Navitas and the Group is available on the internet at navitas.com.
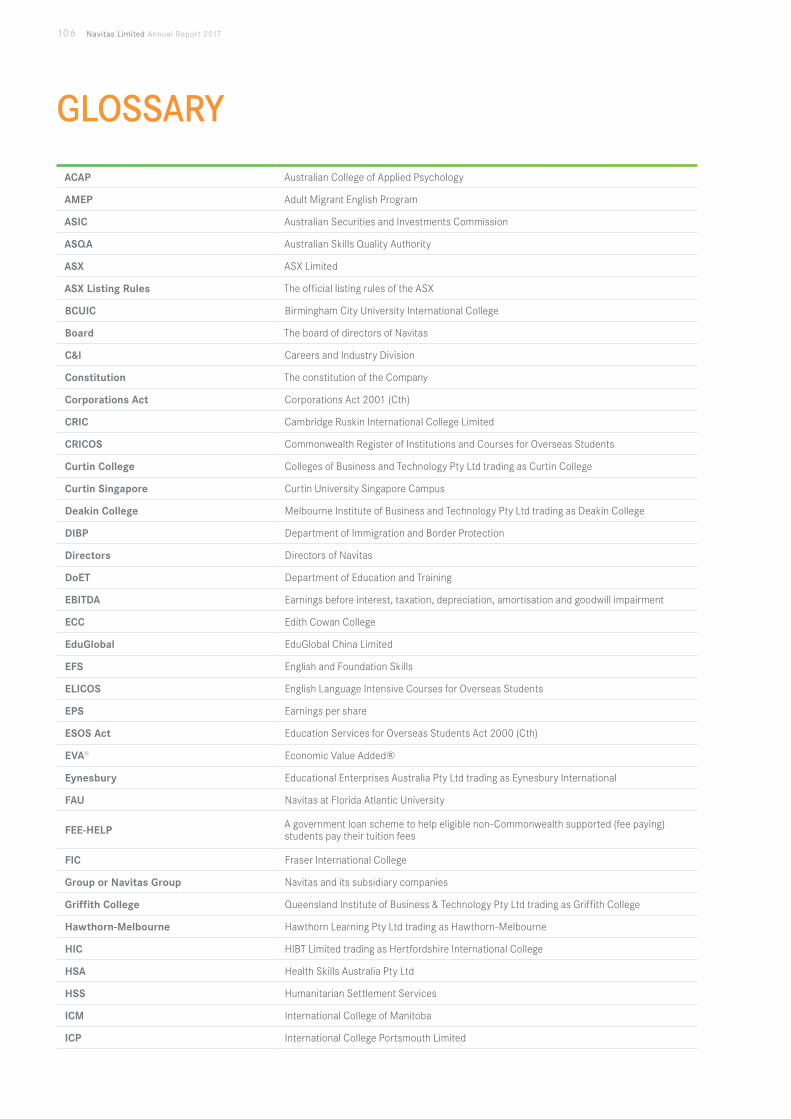
106 Navitas Limited Annual Report 2017
GLOSSARY
ACAP Australian College of Applied Psychology
AMEP Adult Migrant English Program
ASIC Australian Securities and Investments Commission
ASQA Australian Skills Quality Authority
ASX ASX Limited
ASX Listing Rules The official listing rules of the ASX
BCUIC Birmingham City University International College
Board The board of directors of Navitas
C&I Careers and Industry Division
Constitution The constitution of the Company
Corporations Act Corporations Act 2001 (Cth)
CRIC Cambridge Ruskin International College Limited
CRICOS Commonwealth Register of Institutions and Courses for Overseas Students
Curtin College Colleges of Business and Technology Pty Ltd trading as Curtin College
Curtin Singapore Curtin University Singapore Campus
Deakin College Melbourne Institute of Business and Technology Pty Ltd trading as Deakin College
DIBP Department of Immigration and Border Protection
Directors Directors of Navitas
DoET Department of Education and Training
EBITDA Earnings before interest, taxation, depreciation, amortisation and goodwill impairment
ECC Edith Cowan College
EduGlobal EduGlobal China Limited
EFS English and Foundation Skills
ELICOS English Language Intensive Courses for Overseas Students
EPS Earnings per share
ESOS Act Education Services for Overseas Students Act 2000 (Cth)
EVA® Economic Value Added®
Eynesbury Educational Enterprises Australia Pty Ltd trading as Eynesbury International
FAU Navitas at Florida Atlantic University
FEE-HELP A government loan scheme to help eligible non-Commonwealth supported (fee paying) students pay their tuition fees
FIC Fraser International College
Group or Navitas Group Navitas and its subsidiary companies
Griffith College Queensland Institute of Business & Technology Pty Ltd trading as Griffith College
Hawthorn-Melbourne Hawthorn Learning Pty Ltd trading as Hawthorn-Melbourne
HIC HIBT Limited trading as Hertfordshire International College
HSA Health Skills Australia Pty Ltd
HSS Humanitarian Settlement Services
ICM International College of Manitoba
ICP International College Portsmouth Limited
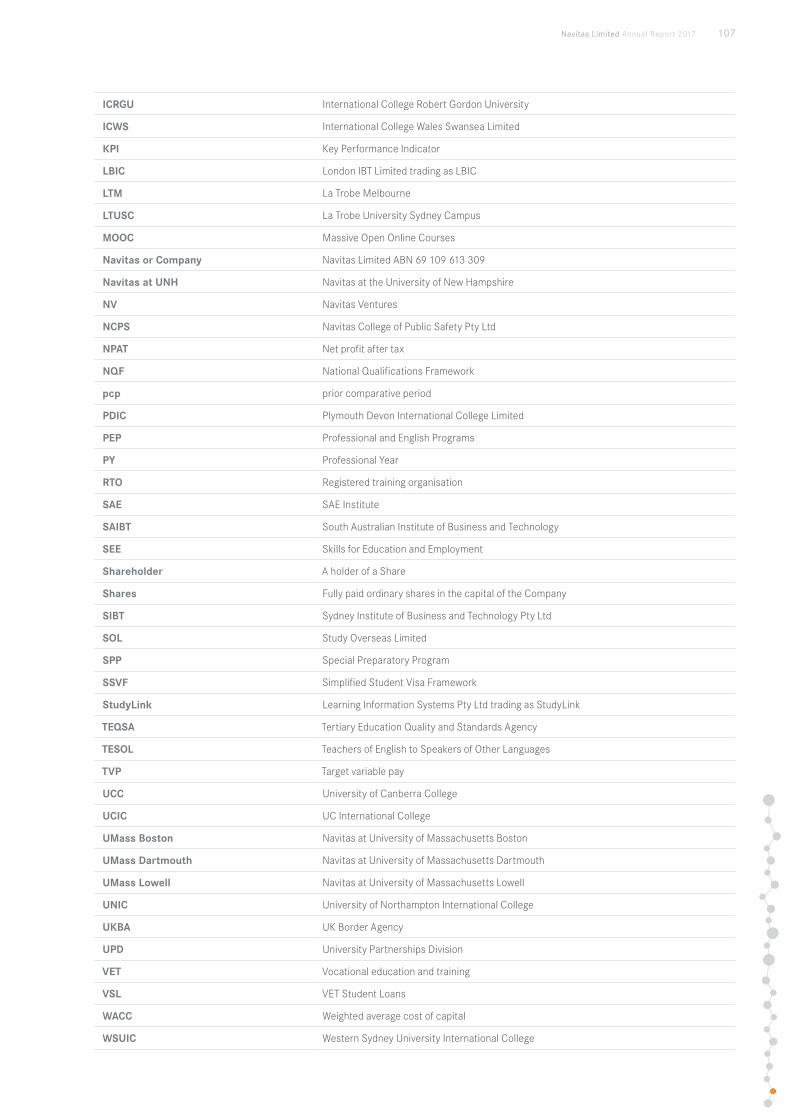
Navitas Limited Annual Report 2017 107
ICRGU International College Robert Gordon University
ICWS International College Wales Swansea Limited
KPI Key Performance Indicator
LBIC London IBT Limited trading as LBIC
LTM La Trobe Melbourne
LTUSC La Trobe University Sydney Campus
MOOC Massive Open Online Courses
Navitas or Company Navitas Limited ABN 69 109 613 309
Navitas at UNH Navitas at the University of New Hampshire
NV Navitas Ventures
NCPS Navitas College of Public Safety Pty Ltd
NPAT Net profit after tax
NQF National Qualifications Framework
pcp prior comparative period
PDIC Plymouth Devon International College Limited
PEP Professional and English Programs
PY Professional Year
RTO Registered training organisation
SAE SAE Institute
SAIBT South Australian Institute of Business and Technology
SEE Skills for Education and Employment
Shareholder A holder of a Share
Shares Fully paid ordinary shares in the capital of the Company
SIBT Sydney Institute of Business and Technology Pty Ltd
SOL Study Overseas Limited
SPP Special Preparatory Program
SSVF Simplified Student Visa Framework
StudyLink Learning Information Systems Pty Ltd trading as StudyLink
TEQSA Tertiary Education Quality and Standards Agency
TESOL Teachers of English to Speakers of Other Languages
TVP Target variable pay
UCC University of Canberra College
UCIC UC International College
UMass Boston Navitas at University of Massachusetts Boston
UMass Dartmouth Navitas at University of Massachusetts Dartmouth
UMass Lowell Navitas at University of Massachusetts Lowell
UNIC University of Northampton International College
UKBA UK Border Agency
UPD University Partnerships Division
VET Vocational education and training
VSL VET Student Loans
WACC Weighted average cost of capital
WSUIC Western Sydney University International College

108 Navitas Limited Annual Report 2017
CORPORATE INFORMATION
Directors Executive Directors
Mr Rod Jones
Non-Executive Directors
Ms Tracey Horton
Mr Tony Cipa
Mr Harvey Collins
Ms Diana Eilert
Mr James King
Ms Lisa Paul
Mr David Robb
Company Secretaries Mr Hugh Hangchi
Mr Matthew Rumpus (Assistant Company Secretary)
Registered Office Navitas Limited
Level 8, Brookfield Place
125 St Georges Terrace
Perth WA 6000
Share Registrar Computershare Investor Services Pty Limited
Level 2, 45 St Georges Terrace
Perth WA 6000
Auditor Deloitte Touche Tohmatsu
Brookfield Place, Tower 2
123 St Georges Terrace
Perth WA 6000
Internet address navitas.com

Navitas Limited Annual Report 2017 109

NAVITAS LIMITED
Level 8, Brookfield Place 125 St Georges Terrace Perth WA 6000
T +61 (8) 9314 9600 F +61 (8) 9314 9699 E [email protected]
navitas.com
ABN 69 109 613 309NAVC170419-1123 0917_AW