transforming our future
TRANSCRIPT

KINROSS GOLD CORPORATION2010 ANNUAL REPORT
TRANSFORMINGOUR FUTURE

In 2010, Kinross established itself as the new growth leader among senior
gold producers while delivering record operational and fi nancial results.
We signifi cantly upgraded our portfolio by acquiring strategic assets in high-
potential gold regions — including Tasiast in Mauritania, one of the world’s
fastest-growing gold resources. At the same time, we continued to build our
capacity to deliver on our ambitious growth plans by adding new strength to
our global organization.
With a balanced global portfolio of ten operating mines and four high-quality
growth projects, Kinross expects to double its share of world gold production
in the next fi ve years.
02 LETTER TO SHAREHOLDERS
08 DRIVING RESULTS
12 TAKING THE LEAD IN GROWTH
16 BUILDING STRENGTH AT OUR CORE
20 TAKING RESPONSIBILITY
25 CORPORATE GOVERNANCE
AND DIRECTORS
27 KINROSS MANAGEMENT TEAM
28 FINANCIAL REVIEW
173 NON-GAAP FINANCIAL MEASURES
175 CAUTIONARY STATEMENT ON
FORWARD-LOOKING INFORMATION
IBC CORPORATE INFORMATION
2010 HIGHLIGHTS
Acquired Red Back MiningThe transformational combination with Red Back expanded our global portfolio, including
the addition of the spectacular Tasiast project, giving Kinross the best growth profi le among
senior gold producers.
Increased Revenue, Cash Flow and EarningsFor the fi rst time, annual revenue exceeded $3 billion, an increase of 25% over 2009, while
adjusted operating cash fl ow exceeded $1 billion. Adjusted net earnings increased by 57%
and adjusted net earnings per share increased by 32%.
Advanced Growth Projects With new studies completed at Tasiast, Fruta del Norte, Lobo-Marte and Dvoinoye, we are
making signifi cant and steady progress advancing the projects that will fuel our next round
of growth. By 2015 we expect production to grow to 4.5 — 4.9 million ounces, double our
2010 production.
Expanded Gold Reserves and ResourcesIn 2010, Kinross increased total proven and probable gold reserves by 23% to 62.4 million
gold ounces.
Part of Kinross’ aggressive drill program at Tasiast, Mauritania

KINROSS is a Canadian-based gold mining company with mines and projects in the United States,
Brazil, Canada, Chile, Ecuador, Ghana, Mauritania and Russia, employing approximately 7,000 people
worldwide. Kinross’ strategic focus is to maximize net asset value and cash fl ow per share through a
four-point plan built on: delivering mine and fi nancial performance; attracting and retaining the best
people in the industry; achieving operating excellence through the “Kinross Way”; and delivering future
value through profi table growth. Kinross maintains listings on the Toronto Stock Exchange (symbol: K)
and the New York Stock Exchange (symbol: KGC).
CORPORATE PROFILE1.
6
1.8
2.2 2
.3
07 08 09 10
1,0
93
1,6
17
2,4
12
3,0
10
07 08 09 10
36
8
42
1
43
7
50
8
07 08 09 10
2010 PERFORMANCE
Cost of Sales($ per gold equivalent ounce)
(attributable) 1
Record Revenue($ millions)
Record Production(million gold equivalent ounces)
(attributable) 1
46
.6
45
.6 51.
0
62
.4
07 08 09 10
11.1
13.7
16.6 17
.7
07 08 09 10
7.0
20
.8
16.2
24
.0
07 08 09 10
MINERAL RESERVES & RESOURCES(As at December 31 for each year shown)
Proven and Probable Gold Mineral Reserves(million gold ounces)
Measured and Indicated Gold Mineral Resources(million gold ounces)
Inferred Gold Mineral Resources(million gold ounces)
314
63
5
93
7
1,0
91
07 08 09 10
+247%
0.3
1
0.4
0 0.4
4
0.5
8
07 08 09 10
+87%
32
9
43
6
53
0
68
3
07 08 09 10
+108%
HIGHLIGHTS
† Attributable margin per ounce sold is defi ned as average realized gold price per ounce less attributable cost of sales per gold equivalent ounce sold.
10 09 08
FINANCIAL
Revenue $ 3,010.1 $ 2,412.1 $ 1,617.0
Cash flow from operating activities $ 968.4 $ 785.6 $ 443.6
Adjusted operating cash flow* $ 1,091.2 $ 937.2 $ 634.6
Adjusted operating cash flow per share* $ 1.32 $ 1.36 $ 1.01
Net earnings (loss) $ 771.6 $ 309.9 $ (807.2)
Earnings per share (loss)
Basic $ 0.94 $ 0.45 $ (1.28)
Diluted $ 0.93 $ 0.44 $ (1.28)
Adjusted net earnings* $ 478.8 $ 304.9 $ 248.8
Adjusted net earnings per share* $ 0.58 $ 0.44 $ 0.40
Capital expenditures $ 563.7 $ 481.2 $ 714.7
OPERATING
Gold equivalent ounces produced 2,527,695 2,470,042 1,994,674
Gold equivalent ounces sold 2,537,175 2,487,076 1,888,954
Attributable gold equivalent ounces produced 1 2,334,104 2,238,665 1,838,038
Attributable gold equivalent ounces sold 1 2,343,505 2,251,189 1,756,056
Average realized gold price per ounce $ 1,191 $ 967 $ 857
Cost of sales per equivalent ounce sold $ 495 $ 421 $ 407
Attributable cost of sales
per equivalent ounce sold 1 $ 508 $ 437 $ 421
Proven and probable gold reserves 2 (million ounces) 62.4 51.0 45.6
Measured and indicated gold resources 2 (million ounces) 17.7 16.6 13.7
Inferred gold resources 2 (million ounces) 24.0 16.2 20.8
Proven and probable silver reserves 2 (million ounces) 90.9 102.9 105.8
Proven and probable copper reserves 2 (million pounds) 1,446 2,891 2,601
All fi gures in this report are cited in U.S. dollars unless otherwise noted.
* Adjusted net earnings, adjusted net earnings per share, adjusted operating cash fl ow, and adjusted operating cash fl ow per share fi gures used throughout this report are non-GAAP fi nancial measures which are meant to provide additional information and should not be used as a substitute for performance measures prepared in accordance with GAAP. Please refer to the reconciliation of non-GAAP fi nancial measures located at the end of this report.
(As of December 31 for each year shown)
Margin per Ounce Sold†
(attributable)
Adjusted Net Earnings Per Share*($/share)
Adjusted Operating Cash Flow*($ millions)

OperatiOns and GrOwth prOjects
OPERATIONS GROWTH PROJECTS CORPORATE OFFICE, TORONTO, CANADA
1 “Attributable”includesKinross’shareofKupol(75%)andChirano(90%)production.2 PleaserefertoKinross’MineralReserveandMineralResourceStatementatDecember31,2010locatedattheendofthisreport.FiguresforMineralReservesand
Resourcesreportedinthistablehavebeenrounded.Totalsmaynotreconcileduetorounding.3 ProductionresultsaresubsequenttothecloseoftheRedBackacquisitiononSeptember17,2010.
Production(gold equiv. oz.)
(attributable) 1
Proven andprobable
gold reserves 2
(mm oz.)
Measured andindicated
gold resources 2
(mm oz.)
Inferred goldresources 2
(mm oz.)Location Ownership
UnIted StateS Fort Knox (alaska) 100% 349,729 3.6 2.2 0.2
Kettle River-Buckhorn (Washington) 100% 198,810 0.6 — 0.1
Round Mountain (nevada) 50% 184,554 1.3 1.1 0.4
RUSSIa Kupol 75% 554,008 2.5 — 0.3
dvoinoye 100% — — 1.1 0.4
BRazIL Paracatu 100% 482,397 18.5 3.8 1.6
Crixás 50% 74,777 0.4 0.1 0.4
ChILe Maricunga 100% 156,590 6.1 3.4 3.0
La Coipa 100% 196,330 0.9 0.5 0.5
Lobo-Marte 100% — 6.0 0.9 2.8
Cerro Casale 25% — 5.8 0.8 1.5
eCUadOR Fruta del norte 100% — 6.8 0.6 3.5
WeSt aFRICa tasiast (Mauritania) 100% 56,611 3 7.6 2.1 8.6
Chirano (Ghana) 90% 80,298 3 2.4 0.2 0.2
Canada White Gold (Yukon) 100% — — 1.0 0.6
tOtaL 2,334,104 62.4 17.7 24.0

Tye W. BurtPresident and CEO
For Kinross, 2010 can justifiably be called a year
of transformation.
Amid the strongest gold market in decades, we delivered
solid results at our mines and completed key transactions
that set the Company on an industry-leading growth
trajectory, while building the organizational strength
to maximize the remarkable opportunity that lies ahead
for our shareholders.
Our friendly acquisition of Red Back Mining was one of the mining world’s
biggest stories of 2010, dramatically changing the face of Kinross. It added
immediate new production from two producing mines, Tasiast and Chirano,
and expanded our operations into a new and fast-growing region — West Africa.
Most important, it transformed Kinross into the gold industry’s fastest-growing
senior producer. At a time when high-quality gold deposits have become
increasingly difficult to find, Tasiast has added new reserves and resources at an
unprecedented rate, contributing to a 23% net increase in Kinross’ overall proven
and probable gold reserves in 2010.
Fuelled by the expansion we plan at Tasiast, and by our other high-quality growth
projects, Kinross expects to double its gold production from 2010 levels to
approximately 4.5 — 4.9 million ounces by 2015. That rate of growth is unequalled
among senior gold producers.
In 2010, Kinross made other key moves to optimize our global portfolio. Early
in the year, we expanded and consolidated our holdings in Russia’s Far East,
closing the acquisitions of the Dvoinoye deposit and Vodorazdelnaya property
in Chukotka, and acquiring additional interests in the Kupol East and West
properties adjacent to Kupol. We completed the acquisition of Underworld
Resources in northern Canada, adding a new project in a highly prospective
region. We sold half of our 50% share in Cerro Casale, scaling the project to a
more optimal size within our portfolio. We sold our shares in Harry Winston and
our indirect interest in the Diavik Diamond Mines joint venture, realizing a major
gain for our shareholders and generating cash to help fund our growth.
As we strengthened our asset base, we also strengthened our organization.
Brant Hinze joined our management team as Chief Operating Officer. In addition,
in March 2011, we welcomed Paul Barry as our new Chief Financial Officer. We
added depth and bench strength to our project group to drive our growth
program, and improved our project management methodology to ensure
Our rate of growth is
unequalled among senior
gold producers.
LETTER TO SHAREHOLDERS
02

03
THE KINROSS WAY OUR CORE PURPOSE
• To lead the world in generating value through responsible mining
OUR VALUES
• Putting people first• Outstanding corporate citizenship• High performance culture• Rigorous financial discipline
Success in the future is built on the
current success of our existing
operations.
disciplined project controls from early development through to commissioning. We
also developed a new capital effi ciency framework to help manage expenditures
and ensure we optimize our return on investment.
We accomplished all of this in a gold market which maintained strong upward
momentum through the year, with the average annual gold price increasing 26%
and reaching an all-time high of $1,431 per ounce in early December. The major
driver was growth in investor demand for gold amid continued global economic
uncertainty. Concerns over sovereign debt issues in Europe, additional quantitative
easing by the world’s major central banks and expectations of higher infl ation drove
investors to turn to gold as a hedge against currency risk. Physical demand for gold
was also robust, with jewellery and fabrication demand increasing by 13%*, driven
mainly by India and China.
ACHIEVING SUCCESS AT OUR OPERATIONSSuccess in the future is built on the current success of our existing operations,
and in 2010 Kinross’ global portfolio delivered impressive results.
Our production reached a new record with strong performance from our mines,
and for the fi rst time revenue exceeded $3 billion while adjusted operating cash
fl ow exceeded $1 billion. Margins averaged $683 per ounce in 2010, an increase
of 29% year-over-year.
Much of our operational success in 2010 came from the strong performance
of our recently-completed developments and expansion projects — the Paracatu
expansion, Kupol, Kettle River-Buckhorn and Fort Knox. Together, their performance
in 2010 underscored Kinross’ experience in successfully executing and delivering on
our growth commitments.
The improved performance at our Paracatu expansion plant was noteworthy.
With a mine life extending until 2042, Paracatu is Brazil’s largest gold producer
and a cornerstone asset for Kinross. The expansion project hit its stride in 2010,
with signifi cant improvements in recovery and throughput during the year, and
delivered above-plan performance for the full year. In 2011, we are adding a third
ball mill to the Paracatu expansion plant, and in 2012, a fourth ball mill, both of
which will increase plant grinding capacity and maintain throughput levels as
we mine harder parts of the orebody in the coming years.
While production at Kupol was lower in 2010 than 2009 due to an anticipated
decline in ore grades, the Russian operation outperformed expectations. We
also took steps to build on our success at Kupol and ensure that it remains a key
contributor in the years ahead with the acquisition of nearby Dvoinoye, which we
plan to develop as an underground mine to provide the Kupol processing facilities
with higher-grade ore in the coming years.
* GFMS 2010 Gold Survey
KinrossAR_Front.indd 03 Mar/25/2011 9:45 AM
04
We are moving aggressively
to advance our next round of
growth projects.
With the Dvoinoye closing, Kinross became the fi rst foreign mining company in
Russia to receive government approval for 100% ownership of an asset classifi ed
as strategic. We are gratifi ed that Kinross was named as the only Canadian
company on Russia’s prestigious Foreign Investment Advisory Council, chaired
by Prime Minister Vladimir Putin.
Our operations in Chile were one area of disappointment in 2010, with lower
production and higher costs than planned due to a combination of unusually
severe winter weather and operational issues at both the Maricunga and La Coipa
mines. By the end of 2010, however, these issues had been largely resolved, and
a stronger year is forecast for both mines in 2011.
ADVANCING THE INDUSTRY’S LEADING GROWTH PROFILEIn 2010, Kinross’ proven and probable gold reserves increased by 23%. Our growth
in production to a forecast 4.5 — 4.9 million gold equivalent ounces in 2015 will
come both from new projects at existing sites — most notably the expansion at
Tasiast, as well as Dvoinoye, described above — and from greenfi eld development
projects at Lobo-Marte, Fruta del Norte and Cerro Casale.
TASIAST EXPANSION
Tasiast is a once-in-a-lifetime gold deposit and is destined to become one of the
world’s largest producing gold mines. Our aggressive drilling campaign added
signifi cant new reserves and resources by year-end, and we expect the resource
to continue growing. Our scoping study, completed in December 2010, envisages
a 16-year mine plan for the expanded project with average annual production of
approximately 1.5 million ounces for the fi rst eight full years.
With only eight kilometres of Tasiast’s 80-kilometre greenstone belt explored
to date — and with a geologic architecture similar to sites of major gold deposits
in settings such as Kalgoorlie in Australia and Timmins in Canada — we believe
there is further potential for Tasiast to become an entire gold producing region.
LOBO-MARTE
The Lobo-Marte project in Chile’s mineral-rich Maricunga region offers the
benefi ts of a large resource in a mature mining jurisdiction, existing infrastructure
and potential synergies with current Kinross operations in the region.
An update to the Lobo-Marte pre-feasibility study has confi rmed the viability
of a 47,000-tonne-per-day open pit heap leach operation. Average annual
production is estimated to be approximately 350,000 ounces per year, with
the project targeted to commence commissioning in 2014.
KinrossAR_Front.indd 04 Mar/25/2011 9:45 AM

05KINROSS GOLD CORPORATION 2010 ANNUAL REPORT
SENIOR LEADERSHIP TEAM
Pictured left to right
FRUTA DEL NORTE
Our Fruta del Norte (FDN) project in southeastern Ecuador is a large, high-grade
deposit and one of the most exciting gold discoveries in recent years.
Kinross has completed its pre-feasibility study for FDN based on a mine life of
16 years, with average annual production estimated to be 410,000 gold equivalent
ounces per year over the life of mine. We are targeting start-up of the mine in
late 2014.
CERRO CASALE
Cerro Casale is a large undeveloped copper-gold porphyry deposit in central Chile.
In 2010, we sold half of our 50% share of the Cerro Casale project to Barrick Gold
Corporation for a total transaction value of $474 million. This transaction
generated immediate cash proceeds, and appropriately weighted the project
in our overall portfolio.
* Replaced Thomas M. Boehlert as of March 31, 2011
TYE W. BURTPresident and Chief Executive Offi cer
GEOFFREY P. GOLDExecutive Vice-Presidentand Chief Legal Offi cer
PAUL H. BARRY*Executive Vice-Presidentand Chief Financial Offi cer
BRANT E. HINZEExecutive Vice-Presidentand Chief Operating Offi cer
LISA J. COLNETTSenior Vice-President,Human Resources and Corporate Services
J. PAUL ROLLINSONExecutive Vice-President, Corporate Development
JAMES CROSSLANDExecutive Vice-President, External Relations and Corporate Responsibility
KEN G. THOMASSenior Vice-President,Projects
KinrossAR_Front.indd 05 Mar/25/2011 9:45 AM

06
STRIVING TO LEAD IN RESPONSIBLE MINING Corporate responsibility is a Kinross priority, both as an ethical imperative and
a strategic driver. In 2010 we were named to the Dow Jones Sustainability Index
North America, as well as the Jantzi Social Index, and were recognized as one of
Canada’s Top 50 Corporate Citizens by both Maclean’s magazine and Corporate
Knights magazine. These recognitions refl ect a sincere commitment across our
operations to the “Kinross Way” of conducting business responsibly, actively
engaging the communities where we work and ensuring that our activities result
in a positive net benefi t.
Our growth holds promise not only for our shareholders but also for the people
and communities where we invest. For example, late in 2010, we announced a
contribution of $10 million to support the government of Mauritania in building
a new mining school, which will help to give a new generation of Mauritanians
the skills to lead the development of their country’s nascent mining industry.
At a corporate level, we continued to promote research and innovation in
environmental stewardship and social responsibility with our launch of the
new Kinross Chair in Environmental Governance at Guelph University in
Ontario, Canada.
A TIME OF UNMATCHED POTENTIALKinross has come a long way over the past few years. We’ve grown not only in
size but in experience, and in the strength and depth of our organization. By
any measure, today we rank among the world’s top senior gold producers.
In 2010, we expanded our ranks as we welcomed our new employees at Tasiast
and Chirano. We also launched an aggressive recruitment strategy to provide the
bench strength we will need to double our share of global gold production in the
coming years.
With the industry’s best portfolio of high-quality gold properties and growth
opportunities, Kinross’ potential is unmatched. We have a seasoned team of
world-class professionals and employees who are eager to turn that potential into
reality. We thank them for their untiring efforts, and thank our shareholders for
their continued support.
Tye W. BurtPresident and Chief Executive Offi cer
their continued support.their continued support.
Tye W. Burt
KinrossAR_Front.indd 06 Mar/25/2011 9:45 AM

07KINROSS GOLD CORPORATION 2010 ANNUAL REPORT
Updated annually, our Four-Point Plan lays
out key objectives for the year in every area
of our business. Some highlights of Kinross’
performance against the 2010 Plan include:
· Closed and integrated Red Back Mining acquisition
· Achieved record production, revenue, operating cash
fl ow and margins
· Increased adjusted net earnings by 57% year-over-year
· Declared proven and probable mineral reserves of 62.4
million gold ounces, a 23% increase year-over-year
· Signifi cantly increased Tasiast reserves and resources
and completed scoping study
· Sold interests in Harry Winston and the Diavik Diamond
Mines joint venture for gains of $146.4 million and
$95.5 million, respectively
· Consolidated interests around Kupol in Russia’s
Far East by acquiring high-grade Dvoinoye deposit,
Vodorazdelnaya exploration property and interests
in Kupol East and West licence areas
· Completed sale of 25% of Cerro Casale
· Declared fi rst reserves of 6.8 million gold ounces, and
completed pre-feasibility study at Fruta del Norte
· Completed pre-feasibility study at Lobo-Marte
· Advanced construction of third ball mill at Paracatu
· Acquired Underworld Resources and its key White Gold
property in northern Canada
· Finished year with solid balance sheet and
$1,467 million in cash, cash equivalents and short-
term investments
· Advanced Sulphidization, Acidifi cation, Recycling and
Thickening (SART) plant construction and completed
major upgrades to Adsorption, Desorption and Refi ning
(ADR) plant at Maricunga
· Published a Global Reporting Initiative (GRI) “A” level
corporate responsibility report
· Received our fi rst listing on the Dow Jones Sustainability
Index North America and maintained our position on the
Jantzi Social Index
1 Deliver mine
and financial
performance
• Achieve production and performance targets
• Increase cash flow per share through continuous improvement
• Improve spending discipline at all levels
• Strengthen capital structure and liquidity
2 Best talent,
best teams
• Attract, develop and retain the best people
• Accelerate future leaders from within
• Implement further organizational effectiveness
• Reinforce a high performance culture
• Strengthen employee engagement
3 Elevate the
“Kinross Way”
• Lead industry in environment, health and safety
• Lead industry in corporate responsibility
• Enhance management operating and information systems
• Distinguish the Kinross brand
• Further enhance governance practices
4 Deliver
future value
• Deliver on major development projects
• Grow production and margin from 2011 — 2015
• Capitalize on new market opportunities
• Upgrade exploration pipeline
2010 FOUR-POINT PLAN
TRACKING OUR PROGRESS
KinrossAR_Front.indd 07 Mar/25/2011 9:45 AM

1 Attributable includes Kinross’ share of Kupol (75%) and Chirano (90%) production.
Kinross delivered impressive results across its key metrics
in 2010 and strengthened its balance sheet to provide
a solid foundation for future growth.
2009 2009 20092010 2010 2010
Fort Knox, Alaska, United States
REVENUE ($ millions)
+25%
MARGIN PER OUNCE SOLD ($) (attributable) 1
+29%
ADJUSTED NETEARNINGS ($ millions)
+57%
2,412530
304.9
3,010 683
478.8

10
Our attributable margin continued
to grow at a faster pace than the gold
price in 2010.
Strong performance from Paracatu in
Brazil and Fort Knox in Alaska, and the
addition of new ounces from Chirano
and Tasiast in West Africa following
the closing of our Red Back acquisition,
contributed to record production
of 2.33 million attributable gold
equivalent ounces in 2010. Since 2005,
our gold equivalent production has
increased by 45%, and we expect to
double production from the 2010 level
in fi ve years.
Our attributable margin continued to
grow at a faster pace than the gold
price in 2010, expanding by 29% to
$683 per ounce sold, while the average
realized gold price increased by 23%.
Since 2005, our margin has increased
by 302%.
Adjusted operating cash fl ow was
$1,091.2 million, an increase of 16%
from 2009. Our adjusted operating
cash fl ow per share was $1.32,
representing a fi ve-year compound
annual growth rate of 21%.
Attributable cost of sales per gold
equivalent ounce was $508 for the
year, at the lower end of our cost
guidance. As a pure gold producer, our
cost of sales per ounce calculation is
not reduced by base metal credits,
unlike other major gold producers.
At year-end, Kinross had a solid
balance sheet, with $1,467 million
in cash, cash equivalents and short-term
investments, $630 million in long-term
investments and $503 million of debt,
providing a stable platform to fi nance
our growth projects.
Kinross delivered on key fi nancial performance metrics, including record results in
revenue, cash fl ow and margin per ounce sold in a year of rising gold prices.
Paracatu, Brazil
KinrossAR_Front.indd 10 Mar/25/2011 9:46 AM

11KINROSS GOLD CORPORATION 2010 ANNUAL REPORT
WEST AFRICA
Kinross’ two newest mines — Chirano
in Ghana and Tasiast in Mauritania —
produced 136,909 1 attributable gold
equivalent ounces from the completion
of the Red Back acquisition on
September 17, 2010 until year-end
2010. For full-year 2010, including
production prior to the acquisition as
disclosed by Red Back, the two West
African mines produced a combined
total of 402,272 attributable gold
equivalent ounces.
UNITED STATES
Production and costs were in line
with yearly guidance for our U.S.
operations at Fort Knox, Kettle
River-Buckhorn and Round Mountain.
Our Fort Knox mine in Alaska produced
349,729 gold equivalent ounces,
which was supported by strong fi rst
full-year results from the new heap
leach. Both Kettle River-Buckhorn
in Washington and Round Mountain
in Nevada had solid results, with
gold production of 198,810 and
184,554 ounces, respectively.
RUSSIA
Our Kupol operation in the
Chukotka region of the Russian
Far East performed above target
and produced 554,008 attributable
gold equivalent ounces for Kinross
in 2010. In January 2011, Kupol
achieved the production milestone of
two million gold ounces. Our acquisition
of the Dvoinoye deposit, near Kupol,
secured a future source of high-grade
ore for the Kupol mill, while our
agreement to acquire B2Gold’s rights
to an interest in the Kupol East and
West exploration licence areas further
consolidated our position in this highly
prospective region.
SOUTH AMERICA
Our Paracatu mine in Brazil, the biggest
gold mine in the country, signifi cantly
improved its performance in 2010,
producing 482,397 gold equivalent
ounces, an increase of 36% from 2009.
Enhancements made at the expansion
plant improved throughput and
recovery rates, which trended upward
through the year. Installation of a
third ball mill advanced in 2010 and
commissioning is expected to start in
the fi rst half of 2011. A fourth ball mill
has been approved and is scheduled to
be operational in the fi rst half of 2012
to help maintain plant throughput as
we mine and process harder ore in the
coming years.
At our Chilean operations, output was
lower than expected as severe weather
and operational issues negatively
impacted production. Kinross launched
a comprehensive plan to address
these issues, including strengthening
the regional management team, adding
local bench strength, and improving
operational controls, and performance
improvements were seen by the end of
the year.
Photos top to bottom: Kupol, Russia; Fort Knox, Alaska, United States
SOLID RESULTS FROM A BALANCED PORTFOLIO With the addition of two new operating mines in
West Africa, and increased production at our Paracatu
expansion in Brazil and our Fort Knox mine in Alaska,
Kinross’ 2010 production reached record levels.
1 Kinross’ consolidated results include Chirano and Tasiast production from the date of acquisition on September 17, 2010 to year-end. Production prior to September 17, 2010 is excluded.
KinrossAR_Front.indd 11 Mar/25/2011 11:30 AM

Kinross has the best growth profi le among senior gold
producers, with production forecast to double from 2010
levels to approximately 4.5 — 4.9 million gold equivalent
ounces by 2015, driven by new production from projects at
existing operations and by greenfi eld development projects.
1 Attributable includes Kinross’ share of Kupol (75%) and Chirano (90%) production.
Tasiast, Mauritania
2005 2010 2015e
1.6
2.3
4.5 — 4.9GOLD EQUIVALENT PRODUCTION (mm oz.)(attributable) 1
+181%

14
TASIAST
Located in a highly prospective,
under-explored area with no
geographic constraints to expansion,
the Tasiast expansion project in
Mauritania provides unrivalled
potential for growth. Kinross continues
to advance Tasiast on an accelerated
timeline. At year-end 2010, Kinross
increased Tasiast’s proven and
probable reserves to 7.6 million gold
ounces. With 26 drills active on site,
Kinross expects to further expand the
deposit’s reserves in 2011. The
expansion project scoping study,
completed in late 2010, envisions
average annual production of
approximately 1.5 million gold ounces
per year for the fi rst eight years of
production. Mill capacity is expected to
increase from 8,000 to 68,000 tonnes
per day, dramatically increasing the
size and scope of current mining
operations. A feasibility study is
expected to be completed in mid-2011,
with start-up of the expansion project
targeted for the fi rst half of 2014.
LOBO-MARTE
At the Lobo-Marte project, located
between two of our Chilean mines
in the prospective Maricunga gold
district, development activities
remain on schedule. An updated
pre-feasibility study has confi rmed the
viability of a 47,000-tonne-per-day
heap leach operation incorporating
a SART (Sulphidization, Acidifi cation,
Recycling and Thickening) plant,
with an approximate mine life of
ten years. Kinross expects production
of approximately 350,000 gold ounces
per year, with average life-of-mine
grade expected to be 1.17 grams per
tonne. The project is expected to
commence commissioning in 2014.
We made excellent progress in 2010 advancing our suite of high-quality growth projects.
The Tasiast expansion
project provides unrivalled
potential for growth.
Tasiast, Mauritania
KinrossAR_Front.indd 14 Mar/25/2011 11:31 AM

15KINROSS GOLD CORPORATION 2010 ANNUAL REPORT
DVOINOYE
Kinross completed its acquisition
of the Dvoinoye deposit and the
Vodorazdelnaya exploration and
mining licences, located approximately
90 kilometres north of Kupol in a
prospective gold district where we have
a strong track record of operational
success. The Russian government
approved Kinross’ 100% ownership
of Dvoinoye as a strategic deposit,
making Kinross the fi rst international
mining company to receive such an
approval from the Russian government.
Kinross plans to develop Dvoinoye as
an underground mine and leverage
local synergies by transporting
Dvoinoye ore to the Kupol mill for
processing. Commissioning is targeted
to commence in 2013.
CERRO CASALE
Kinross completed the sale of half
of its interest in Cerro Casale in Chile
to Barrick Gold Corporation in 2010.
Kinross now owns 25%, and Barrick
75%, of the massive gold-copper
project. A feasibility study of
the project contemplates a heap
leach facility and a 160,000-tonne-
per-day mill.
WHITE GOLD
Kinross is continuing its aggressive
exploration program at the White Gold
project located in Canada’s Yukon
Territory. We acquired the high-
potential property in 2010.
FRUTA DEL NORTE
Kinross continued to advance the
Fruta del Norte (FDN) project in
Ecuador, one of the most exciting gold
discoveries of the past decade. In 2010,
Kinross declared proven and probable
reserves of 6.8 million ounces of gold
and 9.1 million ounces of silver after
completing a 22,000-metre infi ll
drilling campaign on the upper portion
of the orebody. The Environmental
Impact Assessment for the exploration
decline at La Zarza — the location
of the FDN orebody — was approved
ahead of schedule. This ramp will allow
drilling below surface to continue the
upgrading of FDN resources. Kinross
expects to complete a feasibility study
by the second half of 2011, with start-up
expected in late 2014.
Photos top to bottom: Fruta del Norte, Ecuador; Dvoinoye, Russia
At Fruta del Norte, Kinross declared its fi rst gold reserve of 6.8 million ounces.
KinrossAR_Front.indd 15 Mar/25/2011 11:31 AM

Building on Kinross’ proven record of delivering major
projects, we have strengthened our organization,
processes and fi nancial capacity to ensure that we
deliver on one of the industry’s most ambitious growth
plans between now and 2015.
Fort Knox, Alaska, United States

18
In 2010, we restructured and expanded
our project group and added signifi cant
new resources across our project
teams. We are applying a detailed gate
review process at each stage of project
development, incorporating reviews for
quality and accuracy by independent
review teams. Operations personnel
have taken a larger role in project
development to facilitate a deeper
understanding of the project once in
production. We have engaged world-
class Engineering, Procurement,
Construction Management (EPCM)
fi rms at all of our major projects to
ensure an enhanced level of quality
and consistency, and have also
assigned Kinross team members to
mirror functions within the EPCM team
for a greater level of project control.
On the operations front, we appointed
Brant Hinze, an accomplished
mining leader, as our new Chief
Operating Offi cer.
We continue to seek opportunities to
increase operational effi ciency and
continuous improvement. For example,
Kinross is reviewing opportunities to
consolidate and centralize services
in Chile, given the proximity of
our two operating mines to the
Lobo-Marte project.
We have also started to implement
the Global Operational Leadership
Dashboard (GOLD) system, which
will provide updated performance
metrics for regional and mine
management on an hourly basis and
signifi cantly enhance the effi ciency
of our data collection.
As we have expanded our asset base, we have built the organizational capacity to deliver
on our exceptional growth opportunity.
We’ve added signifi cant new
resources across our project team.
Fort Knox, Alaska, United States
KinrossAR_Front.indd 18 Mar/25/2011 11:31 AM

19KINROSS GOLD CORPORATION 2010 ANNUAL REPORT
SOLID FINANCIAL PLATFORM
FOR GROWTH
During 2010, we strengthened our
fi nancial position to fund the projects
that will fuel our growth. At the end of
2010, Kinross had $1,467 million in
cash, cash equivalents and short-term
investments, plus $630 million in
long-term investments. We have made
solid gains by optimizing our portfolio
to focus on core projects while realizing
an increase of 16% in our adjusted
operating cash fl ow for the year.
We launched a rigorous capital
effi ciency program to govern the
allocation of capital across our
operations and projects, and we are
accelerating this program in 2011. We
aim to maximize return and minimize
risks on all of our capital investments
by improving accountability and fi rmly
applying clear guidelines and processes
when making key decisions.
EXPANDING OUR WORKFORCE
A major challenge in the industry today
is fi nding the right people to build and
staff new projects. With assets located
in remote areas around the world, and
a tightening mining labour market, we
are laying the foundation to establish
Kinross as the employer of choice in the
mining world to attract the best recruits.
We have implemented talent and
leadership management programs to
retain and develop our people, while
gathering detailed intelligence on
global labour markets to get an edge in
recruitment. We also continue to invest
in training and education, such as the
$10 million we committed to help the
Mauritanian government establish a
new mining school. When completed,
the school will help promote the
development of skilled professional
and technical experts as the country
experiences rapid growth in its
mining industry.
We launched a rigorous capital effi ciency program to govern the allocation of capital across our operations and projects.
Above: Kupol, Russia
Photos top to bottom: Kettle River-Buckhorn, Washington, United States; Chirano, Ghana
KinrossAR_Front.indd 19 Mar/25/2011 11:31 AM
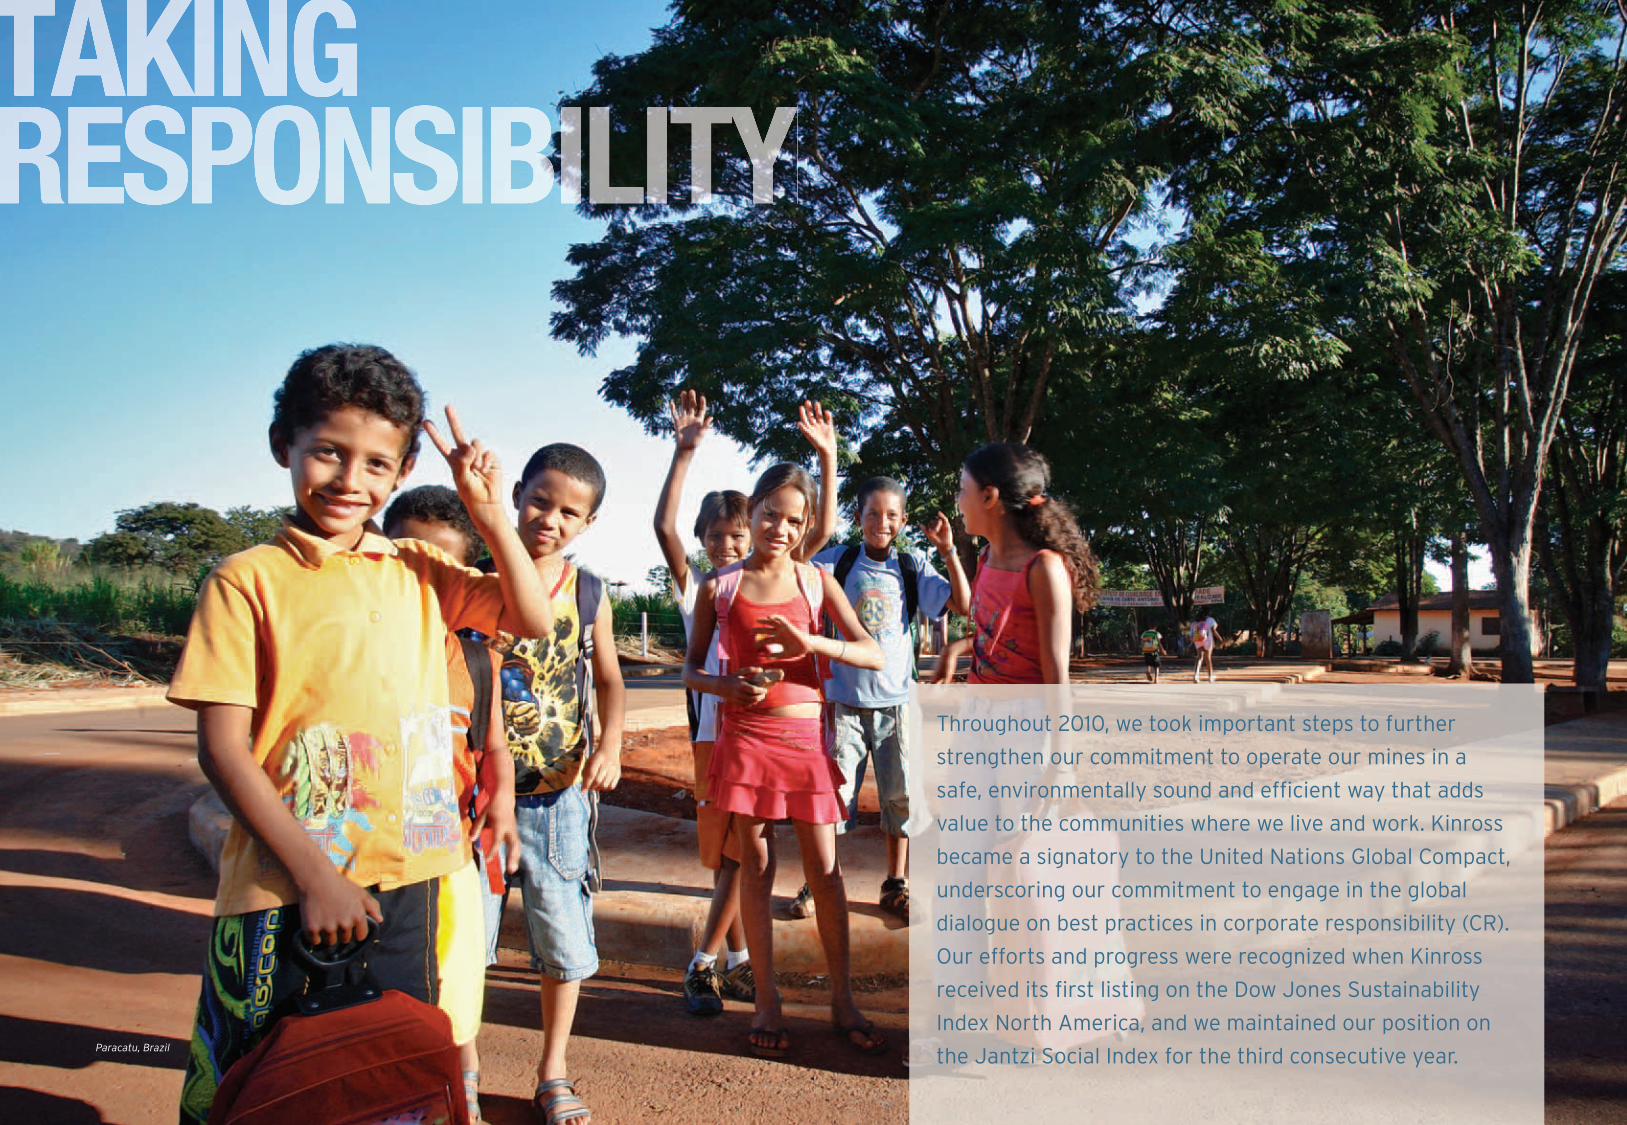
Throughout 2010, we took important steps to further
strengthen our commitment to operate our mines in a
safe, environmentally sound and effi cient way that adds
value to the communities where we live and work. Kinross
became a signatory to the United Nations Global Compact,
underscoring our commitment to engage in the global
dialogue on best practices in corporate responsibility (CR).
Our efforts and progress were recognized when Kinross
received its fi rst listing on the Dow Jones Sustainability
Index North America, and we maintained our position on
the Jantzi Social Index for the third consecutive year. Paracatu, Brazil

ADVANCING OUR CR STRATEGY
To align Kinross with the objectives
of the Voluntary Principles on Security
and Human Rights, in 2010 we
implemented a comprehensive Human
Rights Adherence and Verifi cation
Program. We also developed an
Indigenous Peoples Policy and
Kinross Supplier Guidelines,
strengthening our CR framework
in these two important areas.
Our operations have developed Site
Responsibility Plans (SRPs) to help
ensure that our actions in the community
consistently align with our Ten Guiding
Principles for Corporate Responsibility.
Building on the strong foundation
of being a good neighbour in our
communities, the SRPs lay out a
systematic approach to stakeholder
engagement and community-based
initiatives that incorporate best
practice standards.
With our acquisition of Red Back Mining,
we inherited strong operating teams,
well-targeted community programs and
a shared commitment to responsible
mining. We are working with local
governments and communities at our
West African sites to build on this strong
foundation and ensure that our
investments deliver positive benefi ts
to the people of Mauritania and Ghana.
STRONG ENVIRONMENTAL
PERFORMANCE
We made strides in key areas of our
environmental performance in 2010.
We expanded our Environmental,
Health and Safety Management System
to provide our sites with additional
guidance in the area of air emissions
controls. We completed independent
technical reviews of tailings storage
facilities at Kettle River-Buckhorn,
Round Mountain, Paracatu and
Crixás. At Fort Knox, we completed
an engineering risk assessment of
process solution systems.
In early 2010, our La Coipa operation
received a GE Ecomagination Leadership
Award for reduced water use, benefi ting
one of the most water-stressed areas
of Chile. La Coipa successfully cut the
amount of water used to control dust,
conserving some 45 million litres of
water annually.
We published our second corporate responsibility report, elevating our disclosure to stakeholders by reporting at an “A” level according to the Global Reporting Initiative standards.
22
Kinross’ CR strategy provides an important framework to help ensure that our behaviour
on the ground consistently refl ects our Ten Guiding Principles for Corporate Responsibility.
KinrossAR_Front.indd 22 Mar/25/2011 9:43 AM

Kinross was an original participant in
the International Cyanide Management
Code, and in 2010 we successfully
completed recertifi cation of our Round
Mountain operation — our fi rst facility
to be certifi ed three years ago. Our La
Coipa operation was audited for
Cyanide Code certifi cation, which is
anticipated in 2011.
ADDING VALUE TO
OUR COMMUNITIES
In partnership with our communities
and stakeholders, our goal is to
maximize the positive impacts, or
“benefi t footprint,” arising from our
presence in the local community.
Through partnerships, investments and
sponsorships in the communities where
we live and work, we made positive
contributions in our three priority areas
of health, environment and education.
In response to the February 2010
earthquake in Chile, Kinross made
a CDN $705,000 commitment to
humanitarian relief. We are building
a new school and repairing two other
schools in the town of Cobquecura,
the epicentre of the earthquake. Other
initiatives during the year included
ongoing support for the Kupol Social
Development Foundation; support for
the APEOSAE coffee growers in
Ecuador; fi nancial contributions to
the hospitals at Kettle River-Buckhorn,
Paracatu and Nouakchott (Mauritania);
and ongoing partnerships and support
for apprenticeship, training and
educational programs in Chile, Brazil
and Ghana.
In November 2010, we announced a
CDN $1 million contribution to the
University of Guelph’s BetterPlanet
Project to create the Kinross Gold Chair
in Environmental Governance.
FOCUS ON SAFE OPERATIONS
Across the company, Kinross
employees and contractors worked
23.5 million hours last year with
30 lost-time injuries (LTI) and nine
incidents resulting in restricted work
activity (RWA). Company-wide, there
were fewer days lost in 2010 than in
2009. This represents a signifi cant
improvement in RWA and severity
rates, despite a small increase in LTI
frequency rate year-over-year. Workers
at our La Coipa mine completed the
year with no lost-time or medical
treatment injuries and Fort Knox
employees achieved four million hours
worked and more than four consecutive
years without an LTI. In Ghana, the
Chirano mine received the National
Safety and First Aid Competition
Award. Sadly, we suffered a fatality
at our Kupol operation.
In early 2011, we updated our Health and
Safety Policy, further integrating health
and safety as part of Kinross’ Corporate
Responsibility Management System and
reaffi rming Kinross’ commitment to
achieving excellence in health and
safety performance.
Round Mountain, Nevada, United States; Opposite: La Coipa, Chile
Six-Year Safety Performance (Incident Rate)(includes all employees and contractors;
per 200,000 hours worked)
■ Medical treatment case frequency rate■ Restricted work activity frequency rate■ Lost-time injury frequency rate
05
.65
.50 .57
.46
.57
.45
.08
.25
.20
.18
.47
.73.12.63
.38
.46
.72
.54
06 07 08 09 10 1
1 Includes safety performance statistics for Chirano and Tasiast from September 17, 2010.
INVESTING IN THE FUTURE OF MINING
In November, Kinross announced a $10 million commitment over the
next three years to assist the government of Mauritania in establishing a
mining school. The school will give a new generation of Mauritanians the
skills they need to lead the development of a rapidly expanding mining
industry. Focused on developing both technicians and engineers for
careers in mining, the school is expected to host a total of 340 students
and to graduate 50 engineers and 30 technicians annually. The mining
school is the fi rst part of a comprehensive investment by Kinross in
training and skills development to support the planned expansion of the
Tasiast mine in northern Mauritania.
23KINROSS GOLD CORPORATION 2010 ANNUAL REPORT
KinrossAR_Front.indd 23 Mar/25/2011 9:43 AM

La Coipa, Chile
KinrossAR_Front.indd 24 Mar/25/2011 9:43 AM

25KINROSS GOLD CORPORATION 2010 ANNUAL REPORT
2010 CORPORATE GOVERNANCE HIGHLIGHTS• The Board of Directors met
12 times in 2010
• Kinross ranked 33rd out of
187 Canadian companies in
The Globe and Mail annual
corporate governance survey
• Maintained “A” rating on the
Board Shareholder Confi dence
Index of the Clarkson Centre
for Board Effectiveness
MANDATE OF THE BOARD OF DIRECTORSKinross’ Board of Directors
is committed to the goals of
independence, diligence,
integrity and transparency.
The Board has adopted a charter
that formally sets out its key
responsibilities, including:
• appointing an independent director
as Chair with responsibility for
the leadership of the Board and
for specifi c functions to protect
the independence of the Board;
• adopting a strategic planning
process, approving strategic plans
and monitoring performance
against such plans;
• reviewing and approving
corporate objectives and goals
for senior management;
• overseeing succession planning
for management;
• defi ning corporate decisions
requiring Board approval and
approving such decisions as
they arise; and,
• obtaining periodic reports from
management on the company’s
operations, including reports on
security issues surrounding the
company’s assets, property and
employees and the relevant
mechanisms that management
has put in place.
THE BOARD IS COMMITTED TO THE FOLLOWING GOALS:
INDEPENDENCE
The Kinross Board of Directors is
chaired by a director (Mr. John Oliver)
who is independent as defi ned in the
company’s Corporate Governance
Guidelines and corporate governance
standards in Canada and of the
New York Stock Exchange. The Board
is made up of 11 directors, including the
Chair, eight of whom are considered
independent of management. The Chair
of the Board has been designated to
assume the leadership of the Board
and to enhance and protect, with the
Corporate Governance Committee and
the other committees, the independence
of the Board. There are fi ve Board
committees, four of which are
completely independent, while the fi fth
has only one non-independent member
(the Corporate Responsibility Committee).
Independent directors hold regularly
scheduled meetings at least on a
quarterly basis and strive to meet
independently following all Board
meetings. Charters have been
developed for the Board, its various
committees, the Chair of the Board and
the Chief Executive Offi cer that set out
their respective roles and responsibilities.
DILIGENCE
Directors are expected to use their
skill and experience to provide oversight
of Kinross’ business. Directors have
a duty to Kinross to act honestly and
in good faith, and exercise the care,
diligence and skill that a reasonably
prudent person would in comparable
circumstances. Directors are expected
to attend all Board and committee
meetings and to review and be familiar
with Board and committee materials.
The Board conducts an annual 360º
performance assessment of the
Independent Chair, the Chief Executive
Offi cer, the committees of the Board
and their Chairs and individual directors.
The Board is subject to a majority voting
policy and our shareholders can annually
vote for or withhold from voting on the
election of individual directors, rather
than being required to vote for or
against a slate of director nominees.
INTEGRITY
The Board expects directors, as well
as Kinross’ offi cers and employees,
to act ethically at all times and to
comply with our Code of Business
Conduct and Ethics.
TRANSPARENCY
The Board has adopted the Disclosure,
Confi dentiality and Insider Trading
Policy to ensure the transparency
of, and compliance with, Kinross’
disclosure obligations. Public disclosure
documents are reviewed for accuracy
and compliance with applicable
disclosure requirements by a committee
composed of senior company executives
prior to being released.
OVERVIEW OF COMMITTEE MANDATESThere were fi ve committees of the
Kinross Board of Directors in 2010.
AUDIT AND RISK COMMITTEE
This committee is responsible for
overseeing the integrity of Kinross’
fi nancial statements, the independence
and qualifi cations of the company’s
independent auditors, the performance
CORPORATE GOVERNANCE AND DIRECTORS
KinrossAR_Front.indd 25 Mar/25/2011 9:43 AM

of the internal audit functions and
Kinross’ fi nancial reporting process
and internal control systems. This
committee met six times in 2010.
CORPORATE GOVERNANCE
COMMITTEE
This committee is responsible for
developing our approach to matters
of corporate governance. This
committee met four times in 2010.
CORPORATE RESPONSIBILITY
COMMITTEE
This committee oversees the
development and implementation
of policies and best practices relating
to environment, health and safety and
social performance in order to ensure
compliance with applicable laws and
to ensure the safety of our employees.
This committee met four times in 2010.
HUMAN RESOURCES,
COMPENSATION AND
NOMINATING COMMITTEE
This committee makes recommendations
to the Board on all matters relating to
the compensation of the offi cers and
employees of the company and CEO
and senior offi cer successorship. This
committee met eight times in 2010.
SPECIAL COMMITTEE
This committee assists management
and the Board on matters of strategic
planning and acquisition activities.
This committee met 14 times in 2010.
26
JOHN K. CARRINGTONCorporate Director CG, CR, S
JOHN A. KEYESCorporate Director CG, CR
RICHARD P. CLARKCorporate Director CR
CATHERINE MCLEOD-SELTZER Chairman, Pacifi c RimMining Corporation CR, H
JOHN M. H. HUXLEYCorporate Director A, H
GEORGE F. MICHALSCorporate Director CG, H, S
TERENCE C. W. REIDCorporate Director A, CR
LUKAS H. LUNDINCorporate Director S
DIRECTORS
JOHN E. OLIVERIndependent Chair H, S
JOHN A. BROUGHCorporate Director A, H, S
TYE W. BURTPresident and Chief Executive Offi cer
A Audit and Risk CommitteeCG Corporate Governance CommitteeCR Corporate Responsibility CommitteeH Human Resources, Compensation and Nominating CommitteeS Special Committee
KinrossAR_Front.indd 26 Mar/25/2011 9:43 AM

27KINROSS GOLD CORPORATION 2010 ANNUAL REPORT
SENIOR OFFICERS
TYE W. BURT
President
and Chief Executive Offi cer
PAUL H. BARRY*
Executive Vice-President
and Chief Financial Offi cer
LISA J. COLNETT
Senior Vice-President,
Human Resources
and Corporate Services
JAMES CROSSLAND
Executive Vice-President,
External Relations and
Corporate Responsibility
GEOFFREY P. GOLD
Executive Vice-President
and Chief Legal Offi cer
BRANT E. HINZE
Executive Vice-President
and Chief Operating Offi cer
J. PAUL ROLLINSON
Executive Vice-President,
Corporate Development
KENNETH G. THOMAS
Senior Vice-President,
Projects
OTHER OFFICERS
RICK A. BAKER
Senior Vice-President,
Environment and Project Permitting
FRANK DE COSTANZO
Vice-President,
Treasurer
ROBERT D. HENDERSON
Senior Vice-President,
Technical Services
MARK E. ISTO
Senior Vice-President,
Project Development
JULIANA L. LAM
Senior Vice-President,
Finance
GLEN J. MASTERMAN
Senior Vice-President,
Exploration
SHELLEY M. RILEY
Vice-President,
Administration and
Corporate Secretary
KINROSS MANAGEMENT TEAM
* Replaced Thomas M. Boehlert as of March 31, 2011.
Chirano, Ghana
KinrossAR_Front.indd 27 Mar/25/2011 9:43 AM

Kupol, Russia
29 MANAGEMENT’S DISCUSSION
AND ANALYSIS
108 MANAGEMENT’S RESPONSIBILITY
FOR FINANCIAL STATEMENTS
109 REPORT OF INDEPENDENT
CHARTERED ACCOUNTANTS
110 CONSOLIDATED BALANCE SHEETS
111 CONSOLIDATED STATEMENTS
OF OPERATIONS
112 CONSOLIDATED STATEMENTS
OF CASH FLOWS
113 CONSOLIDATED STATEMENTS OF
COMMON SHAREHOLDERS’ EQUITY
114 CONSOLIDATED STATEMENTS OF
COMPREHENSIVE INCOME (LOSS)
115 NOTES TO THE AUDITED
CONSOLIDATED FINANCIAL
STATEMENTS
164 MINERAL RESERVE AND MINERAL
RESOURCE STATEMENT
172 SUMMARIZED FIVE-YEAR REVIEW
172 KINROSS SHARE TRADING DATA
173 NON-GAAP FINANCIAL MEASURES
175 CAUTIONARY STATEMENT ON
FORWARD-LOOKING INFORMATION
KinrossAR_Front.indd 28 Mar/25/2011 9:43 AM

MANAGEMENT’S DISCUSSIONAND ANALYSISFor the year ended December 31, 2010
This management’s discussion and analysis (‘‘MD&A’’) relates to the financial condition and results of operations of Kinross
Gold Corporation together with its wholly owned subsidiaries, as of February 16, 2011, and is intended to supplement and
complement Kinross Gold Corporation’s audited consolidated financial statements for the year ended December 31, 2010 and
the notes thereto. Readers are cautioned that the MD&A contains forward-looking statements and that actual events may
vary from management’s expectations. Readers are encouraged to read the Cautionary Statement on Forward Looking
Information included with this MD&A and to consult Kinross Gold Corporation’s audited consolidated financial statements
and corresponding notes to the financial statements which are available on the Company’s web site at www.kinross.com and
on www.sedar.com. The consolidated financial statements and MD&A are presented in US dollars and have been prepared in
accordance with Canadian generally accepted accounting principles (‘‘CDN GAAP’’). This discussion addresses matters we
consider important for an understanding of our financial condition and results of operations as of and for the year ended
December 31, 2010, as well as our outlook.
This section contains forward-looking statements and should be read in conjunction with the risk factors described in ‘‘Risk
Analysis’’. In certain instances, references are made to relevant notes in the consolidated financial statements for additional
information.
Where we say ‘‘we’’, ‘‘us’’, ‘‘our’’, the ‘‘Company’’ or ‘‘Kinross’’, we mean Kinross Gold Corporation or Kinross Gold
Corporation and/or one or more or all of its subsidiaries, as it may apply. Where we refer to the ‘‘industry’’, we mean the gold
mining industry.
1. DESCRIPTION OF THE BUSINESS
Kinross is engaged in gold mining and related activities, including exploration and acquisition of gold-bearing properties, the
extraction and processing of gold-containing ore, and reclamation of gold mining properties. Kinross’ gold production and
exploration activities are carried out principally in Canada, the United States, the Russian Federation, Brazil, Ecuador, Chile,
Ghana and Mauritania. Gold is produced in the form of dore, which is shipped to refineries for final processing. Kinross also
produces and sells silver.
The profitability and operating cash flow of Kinross are affected by various factors, including the amount of gold and silver
produced, the market prices of gold and silver, operating costs, interest rates, regulatory and environmental compliance, the
level of exploration activity and capital expenditures, general and administrative costs, and other discretionary costs and
activities. Kinross is also exposed to fluctuations in currency exchange rates, interest rates, political risks and varying levels
of taxation that can impact profitability and cash flow. Kinross seeks to manage the risks associated with its business
operations; however, many of the factors affecting these risks are beyond the Company’s control.
Commodity prices continue to see volatility as economies around the world continue their cautious recovery from the
economic difficulties experienced over the last several years. Volatility in the price of gold and silver may impact the
Company’s revenue, while volatility in the price of other commodities, such as oil and foreign exchange rates, particularly
the Canadian dollar, Brazilian real, Chilean peso, Russian rouble, euro, Mauritanian ouguiya, and Ghanaian cedi, may have an
impact on the Company’s operating costs and capital expenditures (see section 11 - Risk Analysis for additional details on the
impact of foreign exchange rates). Moreover, the global financial crisis may impact the demand for gold as gold has
traditionally been viewed as a ‘‘safe haven’’ (see section 2 - Gold Supply and Demand Fundamentals for additional details).
During 2010, the Company amended its credit facility agreement to increase the amount of available credit to
$600.0 million, on an unsecured basis, and increased the amount of the letter of credit guarantee facility to $136.0 million.
As at December 31, 2010, the Company had $513.2 million available under its credit facility arrangements. During 2009, the
Company filed a shelf prospectus in Canada and a shelf registration statement in the United States, qualifying the issuance
KINROSS GOLD CORPORATION 2010 ANNUAL REPORT 29

of up to $1 billion of common shares and debt securities. Maintaining a current shelf prospectus and registration statement
with the regulators will allow the Company to more readily access the Canadian and US public capital markets.
Segment profile
Each of the Company’s significant operating mines is considered to be a separate segment. These are the segments that are
reviewed and measured by the Chief Executive Officer as they are financially and operationally significant operations
of Kinross.
Ownership percentage at December 31
Operating Segments Operator Location 2010 2009 2008
Fort Knox Kinross U.S.A. 100% 100% 100%
Round Mountain Kinross U.S.A. 50% 50% 50%
Kettle River-Buckhorn Kinross U.S.A. 100% 100% 100%
Kupol Kinross Russian Federation 75% 75% 75%
Paracatu Kinross Brazil 100% 100% 100%
Crixas AngloGold Ashanti Brazil 50% 50% 50%
La Coipa Kinross Chile 100% 100% 100%
Maricunga Kinross Chile 100% 100% 100%
Tasiast Kinross Mauritania 100% - -
Chirano Kinross Ghana 90% - -
30

Consolidated Financial and Operating Highlights
Year ended December 31, 2010 vs 2009 2009 vs 2008(in millions, except ounces, per share amounts, gold price
and cost of sales per equivalent ounce) 2010 2009 2008 Change % Change Change % Change
Operating Highlights
Total gold equivalent ounces (a)
Produced (b) 2,527,695 2,470,042 1,994,674 57,653 2% 475,368 24%
Sold (b) 2,537,175 2,487,076 1,888,954 50,099 2% 598,122 32%
Attributable gold equivalent ounces (a)
Produced (b) 2,334,104 2,238,665 1,838,038 95,439 4% 400,627 22%
Sold (b) 2,343,505 2,251,189 1,756,056 92,316 4% 495,133 28%
Financial Highlights
Metal sales $ 3,010.1 $ 2,412.1 $ 1,617.0 $598.0 25% $ 795.1 49%
Cost of sales (c) $ 1,255.4 $ 1,047.1 $ 768.8 $208.3 20% $ 278.3 36%
Accretion and reclamation expense $ 29.0 $ 19.3 $ 24.7 $ 9.7 50% $ (5.4) (22%)
Depreciation, depletion and amortization $ 517.5 $ 447.3 $ 273.8 $ 70.2 16% $ 173.5 63%
Impairment charges - Goodwill $ - $ - $ 994.1 $ - - $ (994.1) (100%)
Operating earnings (loss) $ 867.2 $ 645.9 $ (611.6) $ 221.3 34% $ 1,257.5 206%
Net earnings (loss) $ 771.6 $ 309.9 $ (807.2) $ 461.7 149% $ 1,117.1 138%
Basic earnings (loss) per share $ 0.94 $ 0.45 $ (1.28) $ 0.49 109% $ 1.73 135%
Diluted earnings (loss) per share $ 0.93 $ 0.44 $ (1.28) $ 0.49 111% $ 1.72 134%
Cash flow from operating activities $ 968.4 $ 785.6 $ 443.6 $ 182.8 23% $ 342.0 77%
Average realized gold price per ounce $ 1,191 $ 967 $ 857 $ 224 23% $ 110 13%
Consolidated cost of sales per equivalent
ounce sold (b),(c) $ 495 $ 421 $ 407 $ 74 18% $ 14 3%
(a) Total includes 100% of Kupol and Chirano production. ‘‘Attributable’’ includes Kinross’ share of Kupol (75%) and Chirano (90%) production.
(b) Gold equivalent ounces include silver ounces produced and sold converted to a gold equivalent based on a ratio of the average spot market prices for the commodities for each year. Theratios were: 2010 - 60.87:1, 2009 - 66.97:1, 2008 - 58.17:1.
(c) Cost of sales excludes accretion and reclamation expense, depreciation, depletion and amortization.
Consolidated Financial Performance
Unless otherwise stated, ‘‘attributable’’ production and sales includes only Kinross’ share of Kupol (75%) and Chirano (90%).
2010 vs. 2009
Kinross’ attributable production for 2010 increased by 4% compared to 2009. During 2010, production increased at Fort
Knox due to a full year of production from the heap leach pad which commenced production in the fourth quarter of 2009,
at Paracatu due to operating improvements and enhanced recoveries, and at Kettle River-Buckhorn as the mine was
ramping up to targeted production during 2009. Additionally, Kinross acquired Red Back Mining Inc. (‘‘Red Back’’) on
September 17, 2010, incorporating the production of its two operating mines, Tasiast and Chirano for the balance of 2010.
The increases in production were offset by lower production at Kupol and in Chile. Production for 2010 was lower at Kupol
due to lower grades. At La Coipa, production was negatively impacted by adverse weather conditions and a higher
concentration of clay in the ore blend which impacted filter plant capacity and recovery rates, while at Maricunga access to
ore was restricted as mining reached the bottom of the Verde pit.
Metal sales amounted to $3,010.1 million in 2010, a 25% increase over 2009. The increase in metal sales can be attributed to
higher metal prices and a 2% increase in gold equivalent ounces sold (2,537,175 ounces) compared to 2009
KINROSS GOLD CORPORATION 2010 ANNUAL REPORT 31

(2,487,076 ounces). The average realized gold price increased by 23% to $1,191 for 2010 compared with $967 in 2009.
Attributable gold equivalent ounces sold in 2010 were slightly higher than attributable gold equivalent ounces produced, as
finished goods inventory on hand at the end of December 31, 2009 was sold during 2010. The acquisition of Red Back during
2010 contributed $194.8 million to total metal sales.
Cost of sales increased by 20% to $1,255.4 million in 2010 compared with $1,047.1 million for 2009. Cost of sales was higher
during 2010 largely due to increased production at Fort Knox and Paracatu, and increased contractor and energy costs at La
Coipa. Fort Knox also experienced higher costs, including energy and diesel, associated with the full year operation of the
heap leach pad during 2010. Additionally, Kinross acquired Red Back on September 17, 2010, incorporating cost of sales of
$94.7 million from its two operating mines, Tasiast and Chirano, for the balance of 2010.
Accretion and reclamation increased from $19.3 million in 2009 to $29.0 million in 2010, primarily due to revised
reclamation costs at sites.
Depreciation, depletion and amortization increased to $517.5 million compared with $447.3 million for 2009. Significant
increases were recorded at Kettle River-Buckhorn and Paracatu due to higher gold equivalent ounces sold. At Fort Knox,
depreciation was recorded for the full year of 2010 on the heap leach pad that commenced production during the fourth
quarter of 2009. Additionally, Kinross recorded depreciation, depletion and amortization of $51.5 million at Tasiast and
Chirano between September 17 and December 31, 2010. These increases were offset to some extent by a $48.5 million
reduction in depreciation, depletion and amortization at Kupol as a result of lower gold equivalent ounces sold.
During 2010, the Company recorded operating earnings of $867.2 million compared with $645.9 million for 2009, an
increase of 34%. Operating earnings reflect the impact of higher metal prices, offset to some extent by higher cost of sales,
depreciation, depletion and amortization, exploration and business development, and higher general and administrative
expenses compared with 2009.
Net earnings increased to $771.6 million or $0.94 per share in 2010 compared with $309.9 million or $0.45 per share in
2009. The increase reflects higher operating earnings and gains on the sale of assets and investments of $348.5 million.
Gains of $146.4 million and $95.5 million were recognized on the sales of Kinross’ equity interest in Harry Winston Diamond
Corporation (‘‘Harry Winston’’) and on its Working Interest in the Diavik Diamond Mines joint venture (‘‘Diavik’’), respectively,
a gain of $74.1 million was recorded on the sale of shares in Osisko Mining Corporation (‘‘Osisko’’), and a pre-tax gain of
$36.7 million was recognized on the sale of one-half of the Company’s interest in Cerro Casale. Earnings per share was
impacted by a 133.0 million increase in the weighted average number of common shares outstanding in 2010 compared with
2009, primarily due to shares issued in the acquisition of Red Back.
Operating cash flows were $968.4 million in 2010 compared with $785.6 million for 2009. Higher operating cash flows for
2010 reflect the impact of higher metal prices.
Cost of sales per ounce increased to $495 per ounce compared with $421 per ounce for 2009, reflecting the changes in cost
of sales and gold equivalent ounces sold noted above.
2009 vs. 2008
In 2009, Kinross’ attributable production increased by 22% to 2,238,665 gold equivalent ounces compared with
1,838,038 for 2008. A full year of attributable production at Kupol and Kettle River-Buckhorn and additional production
from the Paracatu expansion resulted in an increase of 536,982 gold equivalent ounces. This increase was offset to some
extent by lower production at Fort Knox, primarily the result of planned lower grades, and Round Mountain, the result of
lower throughput. Additionally, 2008 production included 39,585 gold equivalent ounces at Julietta, which was sold in
August 2008.
32

Metal sales for 2009 were $2,412.1 million, a 49% increase compared with $1,617.0 million in 2008. The increase in metal
sales can be attributed to higher realized gold prices and more gold equivalent ounces sold. Higher realized gold and silver
prices were responsible for $195.8 million of the increase in metal sales compared with 2008. Gold equivalent ounces sold
for 2009 were 2,487,076, an increase of 32% over the prior year, as 2009 reflects a full year of production at Kupol and
Kettle River-Buckhorn and additional production from the Paracatu expansion. These operations were in various stages of
development during 2008. Gold equivalent ounces sold were higher primarily due to higher production. Higher sales
volumes accounted for the remaining increase in metal sales compared with 2008. Additionally, gold equivalent ounces sold
in 2009 were partially impacted by timing of shipments, as shipments produced at the end of 2008 were sold in 2009.
Cost of sales increased by 36% to $1,047.1 million compared with $768.8 million for 2008, which reflects more gold
equivalent ounces sold. Additionally, higher costs were experienced as a result of the on-going challenges in achieving
targeted throughput and recovery in the new plant at Paracatu during 2009. Cost of sales, however, was positively impacted
as the average U.S. dollar exchange rate relative to the Russian rouble, Brazilian real and Chilean peso was stronger during
2009 compared with 2008.
Accretion and reclamation expense was $19.3 million, a decrease of $5.4 million from 2008, primarily due to a revision to the
Company’s reclamation liability as at December 31, 2009.
Depreciation, depletion and amortization increased by 63% to $447.3 million compared with $273.8 million for 2008, as
2009 results reflect the impacts of a full year of production at Kupol and Kettle River-Buckhorn and increased production
from the Paracatu expansion. These projects were in various stages of development and not depreciated during the earlier
part of 2008.
During 2009, the Company recorded operating earnings of $645.9 million compared with an operating loss of $611.6 million
for 2008. Operating earnings reflect the impact of higher gold equivalent ounces sold offset by a slightly higher cost of sales
per ounce, and higher depreciation, depletion and amortization. Additionally, the operating loss in 2008 includes a non-cash
goodwill impairment charge of $994.1 million.
Net earnings for the year were $309.9 million or $0.45 per share and reflect higher gold equivalent ounces sold, although
this was partially offset by higher depreciation, foreign exchange losses, and higher income and mining tax expenses.
Included in net earnings is tax expense related to foreign exchange gains on U.S. dollar intercompany and third party debt
owing by Paracatu. The tax expense related to the gains is calculated locally in Brazilian reais and is included in the
consolidated income tax expense, however, since the Company’s functional currency is the U.S. dollar, this foreign exchange
gain is excluded from the Company’s consolidated income before taxes. In addition, the net earnings contain a tax recovery
with respect to the settlement of several of its Brazilian federal tax debts under the Brazilian Federal Tax Amnesty Program
along with a recovery due to the true-up of past year’s tax balances. On December 23, 2009, $545 million of intercompany
debt and accrued interest owing by Paracatu was converted into preferred shares of Paracatu. This transaction has
eliminated approximately 80% of the Company’s exposure to the impact of the volatility of the Brazilian real with respect to
U.S. dollar denominated debt. The Company also recorded foreign exchange losses of $91.0 million as a result of the
revaluation of foreign currency denominated balances, largely future income and mining taxes, as a result of a weaker spot
US dollar at December 31, 2009 compared with December 31, 2008.
Operating cash flows of $785.6 million reflect the impact of higher gold equivalent ounces sold and higher metal prices.
Additionally, operating cash flows were positively impacted by a smaller change in inventory balances, as 2008 reflects the
build up of inventory at Kupol and the positive cash flow impact of a higher accounts payable and accrued liability balance at
Kupol and the Corporate offices at December 31, 2009, while the tax settlement under the Brazilian Federal Tax Amnesty
program reduced operating cash flow by $71.0 million.
KINROSS GOLD CORPORATION 2010 ANNUAL REPORT 33

Cost of sales per ounce increased by 3% compared with 2008, largely due to sales of higher cost production at Paracatu.
Reserves (1)
Kinross’ total estimated proven and probable mineral reserves at year-end 2010 increased by 11.5 million ounces to
62.4 million ounces of gold, a 23% increase over year-end 2009. The net increase is due to the acquisition of Red Back
Mining which added 10.0 million ounces to mineral reserves through the addition of the Tasiast (7.6 million ounces) and
Chirano (2.4 million ounces) properties. Mineral reserves of 6.8 million ounces were also reported for the first time at the
Fruta del Norte development property upon completion of the pre-feasibility study. This addition offset the 5.8 million ounce
decrease at Cerro Casale from the sale of 25% of the project.
In 2010, depletion from production at all operations totaled 2.4 million ounces.
Proven and probable silver reserves at year-end 2010 decreased by 12.0 million ounces, or 12% to 91.0 million ounces, versus
103.0 million ounces at year-end 2009 as a result of depletion at La Coipa and Kupol.
Proven and probable copper reserves at year-end 2010 decreased to 1.4 billion pounds primarily due to the sale of half our
interest in the Cerro Casale project.
(1) For details concerning mineral reserve and mineral resource estimates refer to the Mineral Reserves and Mineral Resources tables and notes in the Company’s press release filed withCanadian and U.S. regulators on February 16, 2011.
34

5MAR201100124807
2. IMPACT OF KEY ECONOMIC TRENDS
Price of Gold - Four Year Price Performance
Gold Price History
$1,600
$1,400
$1,200
$1,000
$800
$600
$400
Jan-07 Jul-07 Jan-08 Jul-08 Jan-09 Jul-09 Jan-10 Jan-11Jul-10
US
D p
er O
un
ce
Source: Bloomberg
The price of gold is the largest single factor in determining profitability and cash flow from operations, therefore, the
financial performance of the Company has been, and is expected to continue to be, closely linked to the price of gold.
Historically, the price of gold has been subject to volatile price movements over short periods of time and is affected by
numerous macroeconomic and industry factors that are beyond the Company’s control. Major influences on the gold price
include currency exchange rate fluctuations and the relative strength of the U.S. dollar, the supply of and demand for gold
and macroeconomic factors such as the level of interest rates and inflation expectations. During 2010 the price of gold hit a
new all time high of approximately $1,431 per ounce. The low price for the year was $1,045 per ounce. The average price for
the year based on the London PM Fix was $1,225 per ounce, a $253 increase over the 2009 average price of $972 per ounce.
The major influences on the gold price during 2010 were continuing strong investment demand, further producer
de-hedging, and persisting risks with respect to the global financial crisis.
Source: London Bullion Marketing Association London PM Fix, Bloomberg, Company records
KINROSS GOLD CORPORATION 2010 ANNUAL REPORT 35

5MAR201100125278
Gold Supply and Demand Fundamentals
Gold Supply
5,000
4,500
4,000
3,500
3,000
2,500
2,000
1,500
1,000
500
0
2006 2007 2008 2009 2010E
Mine production Official sector sales Recycled gold
Ton
nes
Source: GFMS Gold Survey 2010
Global gold mine production in 2010 is estimated to have increased 2.7% from 2009 levels. Central banks, which had been
net sellers of gold for several years, became net buyers of gold in 2010. This shift was primarily driven by lower sales by
signatories to the Washington Agreement, partially offset by the IMF gold sale program which was completed in late 2010.
Central banks outside of the Washington Agreement continued to increase their gold positions in 2010. Finally, although
recycled gold supply decreased by 1.1% over 2009 levels, it remained a significant source of supply at more than
1,500 tonnes. High gold prices are encouraging people to sell their unwanted jewellery and other items made of precious
metals.
Overall, the limited supply of gold to the market has been a positive influence on the price of gold, as mine supply growth has
been limited, and central banks have reduced their selling activity.
36

5MAR201100124555
Gold Demand
5,000
4,500
4,000
3,500
3,000
2,500
2,000
1,500
1,000
500
0
2006 2007 2008 2009 2010E
Ton
nes
Fabrication/jewelry
Producer dehedging
Official sector purchases Bar hoarding
Net investmentSource: GFMS 2010 Gold Survey
Gold prices rose significantly in many of the traditional gold market currencies such as the Indian rupee and many far-east
currencies. Despite higher gold prices, jewellery and fabrication demand was 13% higher in 2010 compared with 2009,
primarily driven by demand growth in India, Brazil, Russia, and China. Bar hoarding demand grew strongly in 2010 following a
decline in 2009, while net producer de-hedging and investment demand declined but nonetheless accounted for over
1,000 tonnes of demand for the year. Overall, demand was 0.5% higher than in 2009. If the U.S. dollar continues to be weak
and gold prices remain high, fabrication and jewellery demand are expected to weaken in the coming year. Investment
demand and bar hoarding will have to increase to keep the market balanced.
The Company generally has a ‘‘no gold hedge’’ policy. However, the Company may acquire gold and/or silver hedge or
derivative product obligations as a result of an acquisition or under financing arrangements. A hedge program can protect
the Company against future declines in price and can prevent the Company from benefiting from future price increases.
As a result of the acquisition of Bema Gold in 2007, the Company acquired a portfolio of hedge contracts for gold and silver
related to the Kupol project financing. Red Back Mining, which Kinross acquired in 2010, did not have a gold hedge portfolio.
Kinross is not actively engaged in hedging its exposure to prices for gold or silver.
KINROSS GOLD CORPORATION 2010 ANNUAL REPORT 37
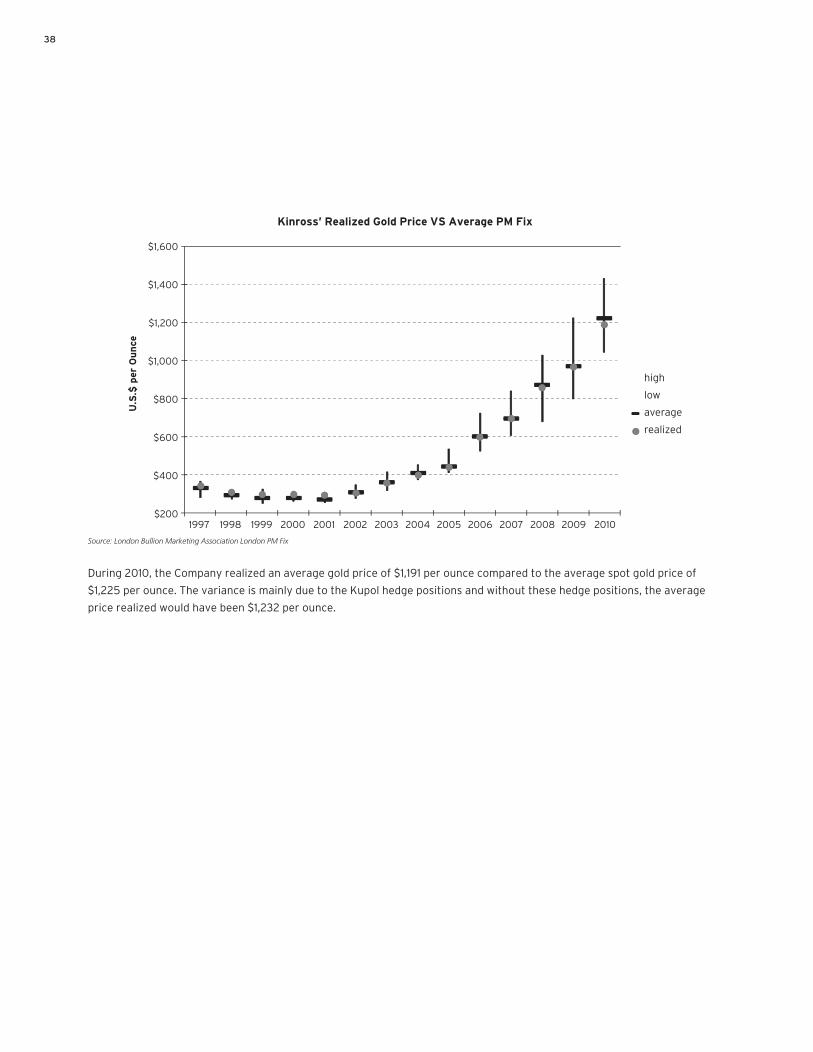
5MAR201100125112
Kinross’ Realized Gold Price VS Average PM Fix
$1,600
high
low
average
realized
$1,400
$1,200
$1,000
U.S
.$ p
er O
un
ce
$800
$600
$400
$2001997 1998 1999 2000 2001 2002 2003 2004 2005 2006 2007 2008 2009 2010
Source: London Bullion Marketing Association London PM Fix
During 2010, the Company realized an average gold price of $1,191 per ounce compared to the average spot gold price of
$1,225 per ounce. The variance is mainly due to the Kupol hedge positions and without these hedge positions, the average
price realized would have been $1,232 per ounce.
38

5MAR201100125448
Inflationary Cost Pressures
The Company’s profitability has been impacted by development and operating costs with respect to labour, energy and
consumables in general. Since mining is generally an energy intensive activity, especially in open pit mining, energy prices
can have a significant impact on operations. The cost of fuel as a percentage of total costs varies amongst the Company’s
mines, and all mines have observed, to some extent, higher energy costs resulting from the increase in global oil prices that
occurred during the second half of 2010. Kinross continues to actively hedge its exposure to energy costs by hedging its
exposure to crude oil prices.
West Texas Intermediate Crude Oil Price History
$160
$140
$120
$100
$80
$60
$40
$20
$0Jan-07 Jul-07 Jan-08 Jul-08 Jan-09 Jul-09 Jan-10 Jan-11Jul-10
US
D p
er B
arr
el
Source: Bloomberg
In order to mitigate the impact of higher consumable prices, the Company continues to focus on continuous improvement by
extending the life of capital assets and promoting a more efficient use of materials and supplies in general.
KINROSS GOLD CORPORATION 2010 ANNUAL REPORT 39

5MAR201100124297
Currency Fluctuations
Currency Exchange Rate Relative Performance Against U.S. Dollar
250%
200%
150%
100%
50%
0%
Jan-07 Jul-07 Jan-08 Jul-08 Jan-09 Jul-09 Jan-10 Jul-10 Jan-11
Gold
Brazil
Chile
Russia
Canada
Europe
Ghana
Mauritania
Source: Bloomberg
At the Company’s non-U.S. mining operations, which are located in Brazil, Chile, Ghana, Mauritania, the Russian Federation,
and Canada, a portion of operating costs and capital expenditures are denominated in their respective local currencies. Many
of the currencies of the countries in which Kinross operates strengthened against the U.S. dollar during 2010, as highlighted
in the graph above. Generally, as the U.S. dollar strengthens, these currencies weaken, and as the U.S. dollar weakens, these
foreign currencies strengthen. Approximately 75% of the Company’s expected attributable production in 2011 is forecast to
come from operations outside the U.S. and costs will continue to be exposed to foreign exchange rate movements. In order
to manage this risk, the Company periodically uses currency hedges for certain foreign currency exposures.
40

3. OUTLOOK
The forward-looking information contained in this section is subject to the risk factors and assumptions contained in the
Cautionary Statement on Forward-Looking Information included with this MD&A and these factors are set out in Section 11 -
Risk Analysis.
Unless otherwise stated ‘‘attributable’’ production includes only Kinross’ share of Kupol (75%) and Chirano (90%)
production. Cost of sales per attributable gold equivalent ounce is defined as cost of sales as per the financial statements
divided by the number of gold equivalent ounces sold, both reduced for Kupol (25%) and Chirano (10%) sales attributable to
third parties.
Key sensitivities
Approximately 60%-70% of the Company’s costs are denominated in U.S. dollars.
A 10% change in foreign exchange could result in an approximate $7 impact in cost of sales per ounce (2).
A $10 change in the price of oil could result in an approximate $3 impact on cost of sales per ounce.
The impact on royalties of a $100 change in the gold price could result in an approximate $3 impact on cost of sales
per ounce.
In 2011, Kinross expects to produce approximately 2.5 to 2.6 million of attributable gold equivalent ounces.
Cost of sales per attributable gold equivalent ounce is expected to be in the range of $565 to $610 for 2011.
On a by-product accounting basis, Kinross expects to produce 2.3 to 2.4 million ounces of gold and 10.9 to 11.3 million ounces
of silver at an average cost of sales per gold ounce of approximately $520 to $570.
Material assumptions used to forecast 2011 cost of sales are: a gold price of $1,300 per ounce, a silver price of $24 per ounce,
an oil price of $85 per barrel, and foreign exchange rates of 1.75 Brazilian reais to the U.S. dollar, 1.02 Canadian dollars to the
U.S. dollar, 32 Russian roubles to the U.S. dollar, 500 Chilean pesos to the U.S. dollar, 1.45 Ghanaian cedi to the U.S. dollar,
and 275 Mauritanian ouguiya to the U.S. dollar. Taking into account existing currency and oil hedges respectively, a 10%
change in foreign currency exchange rates would be expected to result in an approximate $7 impact on our cost of sales per
ounce, a $10 per barrel change in the price of oil would be expected to result in an approximate $3 impact on our cost of
sales per ounce, and a $100 change in the price of gold would be expected to result in an approximate $3 impact on our cost
of sales per ounce as a result of a change in royalties.
Capital expenditures for the full year 2011 are forecast to total approximately $1.5 billion, including $70 million which was
budgeted for 2010, unspent, and carried over to 2011. Subsequent to the sale of half its interest in Cerro Casale, Kinross
accounts for its remaining investment in the project under the equity method. As a result, the $90 million which the
Company expects to spend on the project this year is excluded from the 2011 capital expenditure forecast.
The capital expenditures forecast for new projects in 2011 includes $210 million for Tasiast, $110 million for Dvoinoye,
$60 million for Fruta del Norte, and $35 million for Lobo-Marte. Not included in the 2011 capital forecast is approximately
$130 million in expected advance payments to suppliers for the Tasiast expansion project.
(2) Refers to all of the currencies in the countries where the Company has mining operations, fluctuating simultaneously by 10% in the same direction, either appreciating or depreciating,taking into consideration the impact of hedging and the weighting of each currency within our consolidated cost structure.
KINROSS GOLD CORPORATION 2010 ANNUAL REPORT 41

The 2011 forecast for exploration and business development expenses is approximately $146 million, of which $110 million is
for exploration expenses. Capitalized exploration is forecast to be $65 million in 2011, for a total exploration expenditure
forecast of $175 million.
Other operating costs are forecast to be $25 million. General and administrative expense is forecast to be approximately
$170 million, which includes approximately $20 million for additional resources related to newly acquired West African
operations. General and administrative expense includes approximately $35 million relating to equity-based compensation.
The Company’s tax rate in 2011 is forecast to be in the range of 34% to 39% and depreciation, depletion and amortization is
forecast to be approximately $651 million.
As a result of gold forward purchase contracts entered into during the year and subsequent to December 31, the Company
has de-designated 96% of Kupol gold forward sales contracts maturing in 2011 and 100% of such contracts maturing in 2012.
As a result, Kinross expects the net impact of locked-in Kupol gold hedges to be a $155 million reduction in revenue in 2011.
Kupol silver hedges are expected to reduce revenue by $40 million in 2011, based on a budgeted silver price of
$24 per ounce.
4. PROJECT UPDATE AND NEW DEVELOPMENTS
Growth Projects at Sites
Tasiast expansion project
Kinross ramped up drilling activities at the Tasiast site in Mauritania through the fourth quarter 2010. As at December 31,
2010, proven and probable mineral reserves at Tasiast were 7.6 million ounces, measured and indicated mineral resources
were 2.1 million ounces, and inferred mineral resources were 8.6 million ounces. With a total of 25 drills currently active, the
Company is continuing its aggressive exploration and engineering drilling campaign at Tasiast in 2011.
Kinross has completed a scoping study for the Tasiast expansion project, based on a 16-year mine plan for the expanded
project. During the first eight full years of operation, average annual production is expected to be approximately 1.5 million
gold equivalent ounces at an average cost of sales per ounce of approximately $480-520, with an expected average gold
grade of approximately 2 g/t, and expected average recoveries of 93%.
The proposed open pit mine will feed both the existing 8,000 tonne per day plant and an expansion plant. The proposed
expansion plant is a conventional gold cyanidation plant, consisting of primary crushing, grinding, gravity separation,
carbon-in-leach cyanidation and cyanide destruction, with a design throughput of approximately 60,000 tonnes per day.
The scoping level pre-commissioning capital cost estimate for the process plant, initial mine fleet equipment and associated
infrastructure is approximately $1.8 billion, plus a contingency of approximately $400 million. Post start-up capital is
expected to include an estimated $500 million in additional fleet purchases to sustain full mining and stripping activity. The
project team continues to refine its estimates for operating costs, which are expected to be included in the project feasibility
study, scheduled for completion in mid-2011.
An international joint venture Engineering, Procurement, Construction Management (‘‘EPCM’’) joint venture firm has been
retained and is proceeding with the project feasibility study and basic engineering. Kinross has appointed a Regional
Vice-President for its West Africa region and a Project Director for the Tasiast project.
Key processing equipment for the expanded plant has now been ordered, including one SAG mill and two ball mills,
wrap-around motors for the mills, and three crushers. The Company is currently in advanced negotiations regarding the
purchase of trucks and shovels for the expanded mining fleet.
42

The Company has had initial meetings with key government ministries concerning project permitting, and a permitting
strategy has been developed to support the project timeline. Pending approval of necessary Environmental Impact
Assessments for the expansion project, construction is expected to start in mid-2012, with operations expected to
commence early in 2014.
Dvoinoye development
A scoping study on the Dvoinoye project was completed in January 2011. The scoping study is based on developing Dvoinoye
as an underground mine with a mine life of at least eight years, with an average output of approximately 900 tonnes per day
from 2013 through 2020. Dvoinoye feed will be processed at the Kupol mill and is expected to allow an increase in mill
throughput to approximately 4,000 tonnes per day, requiring only minor modifications to the mill. Batch processing is
proposed, using one week of Dvoinoye feed and three weeks of Kupol feed per month. The average gold equivalent grade of
Dvoinoye feed is expected to be approximately 17.5 g/tonne. Initial capex for the project is estimated to be approximately
$300 million. Processing of Dvoinoye ore at Kupol is targeted to commence in the second half of 2013.
Permitting is proceeding as planned, and as previously disclosed, the five-year exploration plan for Dvoinoye, including an
exploration decline, has been approved by government authorities. Exploration drilling is expected to continue at Dvoinoye
in 2011 to further define resources and reserves and assist with engineering and hydrology studies in support of a
pre-feasibility study, scheduled for completion in the third quarter of 2011, and a feasibility study, scheduled for completion
in the first quarter of 2012. Key project development milestones for 2011 include construction of the mine portal, exploration
decline development, and construction of additional facilities and infrastructure.
Paracatu third ball mill
Construction for the third Paracatu ball mill is proceeding on schedule and on budget, with construction 75% complete and
the project at 82% completion. The ball mill has been mounted on its foundations, structural steel is substantially erected,
and electrical equipment installation is well advanced. The project remains on target for commissioning in the first half
of 2011.
Paracatu fourth ball mill
An EPCM contract is being finalized for the fourth Paracatu ball mill with the same firm completing the third ball mill.
Engineering on the project is well advanced. The fourth ball mill has been ordered and is expected to be delivered by
mid-year, and an additional shovel and mine truck have been purchased. Construction activities are expected to commence
mid-2011. The project remains on target to be operational in the first half of 2012.
Maricunga projects
Engineering on the Maricunga SART (Sulphidization, Acidification, Recycling and Thickening) plant is complete and
construction commenced late in the fourth quarter of 2010. The plant remains on schedule to be operational in late 2011.
Once the SART plant begins operation, additional copper production at Maricunga is expected to result in a cost of sales
credit of approximately $40 per ounce.
Major work on upgrades to the ADR (Adsorption, Desorption and Refining) plant at Maricunga has been completed on
schedule, with commissioning of the new kiln in December 2010. Additional modifications to the adsorption and elution
sections are expected to be completed early in the second quarter of 2011.
KINROSS GOLD CORPORATION 2010 ANNUAL REPORT 43

New Developments
Lobo-Marte
Kinross has completed an update to its earlier pre-feasibility study on Lobo-Marte. The updated study is based on a mine life
of approximately 10 years and confirms the viability of a 47,000 tonne per day open pit heap leach operation incorporating
SART technology.
The updated study estimates an average annual production of approximately 350,000 ounces per year, with average
operating costs of $11.00-11.50- per tonne. The average gold grade over the life of mine is estimated to be 1.17 g/t and
average recovery 60-70%. The average cost of sales is estimated to be approximately $500 per ounce, or approximately
$450 per ounce net of a copper credit of approximately $50 per ounce, based on a copper price of $2.50 per pound. Capital
expenditures are estimated to be approximately $700 million, versus the earlier pre-feasibility estimate of $575-650 million.
The increase is due to enhancements to the site layout and facilities, including installation of an overland conveyor and a
conveyer loading system for the leach pad, which optimizes layout and allows for potential future expansion.
Kinross received approval for an additional 20,000 metres of drilling at Lobo-Marte late in the fourth quarter of 2010. The
Company is proceeding with further infill and geotechnical drilling in support of the project feasibility study, which is
scheduled for completion in mid-2011. Hydrogeological, geotechnical and infill drilling associated with the previous permit
was completed in the fourth quarter, with condemnation drilling expected to be completed in the second quarter of 2011. The
Company expects to complete an Environmental Impact Assessment (EIA) for the project in mid-2011. The project remains on
target to commence commissioning in 2014.
Fruta del Norte
Kinross has prepared a pre-feasibility study and technical report for Fruta del Norte (FDN), incorporating reserve and
resource information as of year-end 2010. Proven and probable mineral reserves are estimated at 6.8 million ounces of gold
and 9.1 million ounces of silver. The study is based on a mine life of approximately 16 years, with life of mine gold production
of 6.3 million ounces and silver production of 6.7 million ounces.
Annual production is expected to average approximately 410,000 gold equivalent ounces per annum over the life of mine.
The average gold grade is expected to be 8.07 g/t, and the average silver grade is expected to be 10.89 g/t, with an expected
average recovery rate of 93% for gold and 74% for silver. The average cost of sales is estimated to be approximately $370
per gold equivalent ounce.
Plant commissioning is expected to begin at a rate of approximately 2,500 tonnes per day, processing non-refractory ore,
and is expected to ramp up over a period of three years to a rate of 5,000 tonnes per day with the addition of a pressure
oxidation (POX) circuit, 18 months after commissioning, which will allow the processing of refractory ore. The initial capital
cost for Phase 1 is expected to be approximately $700 million, with additional capital expenditures of approximately
$400 million expected in Phase 2 with the addition of the POX circuit.
The Company obtained a number of permits to advance work on FDN in 2010. In addition, in early January 2011, Kinross
obtained its environmental licence to construct the underground exploration decline at La Zarza, the location of the FDN
orebody. Construction of the decline is expected to commence in the second quarter of 2011 with surface preparatory work
commencing in the first quarter. Future drilling at FDN will target an extension of the ore body at depth and along strike and
upgrading existing resources.
The Company expects to submit EIAs to build and operate the mine and processing facilities by mid-2011. Kinross expects to
complete a feasibility study in the second half of 2011, and is targeting start up in late 2014.
44

Throughout 2010, the Company maintained informal dialogue with the Ecuadorian government authorities respecting the
negotiation process for the FDN exploitation contract. Formal contract negotiations are expected to begin in the first half of
2011 following the agreement of the Company and government to enter into the economic evaluation phase of the project.
Cerro Casale
On March 31, 2010, Kinross closed the sale of 25% of the Cerro Casale project in Chile to Barrick Gold Corporation
(‘‘Barrick’’) for a total transaction value of approximately $474.3 million, comprised of approximately $454.3 million in cash
plus the assumption by Barrick of a $20 million contingent obligation. Kinross now owns 25%, and Barrick 75%, of the Cerro
Casale project.
Other Developments
Underworld Resources acquisition
On April 26, 2010, the Company acquired 81.6% of the issued and outstanding shares of Underworld Resources Inc.
(‘‘Underworld’’), on a fully diluted basis by way of a friendly take-over bid. On June 30, 2010, the Company acquired the
remaining outstanding shares of Underworld, and on July 6, 2010, the shares of Underworld were delisted. Pursuant to the
acquisition approximately 6.5 million Kinross shares and approximately 0.4 million Kinross options were issued. The total
transaction was valued at $126.5 million, including transaction costs. This amount was added to the cost of a previously
owned investment of $3.5 million, resulting in a total cost of $130.0 million for the asset.
Underworld’s key asset is the White Gold project, located in the Tintina gold belt, approximately 95 kilometres south of
Dawson City, Yukon Territory.
Completion of business combination with Red Back Mining
On September 17, 2010, Kinross completed its plan of arrangement with Red Back, acquiring all of the issued and outstanding
common shares of Red Back that it did not previously own. The acquisition gives the Company a strong position in West
Africa, one of the world’s fastest-growing and most prospective gold regions, and the best growth profile among senior
gold producers.
Former Red Back shareholders received 1.778 Kinross common shares plus 0.11 of a Kinross common share purchase warrant
for each common share of Red Back. Each whole warrant is exercisable for a period of four years at an exercise price of
$21.30 per Kinross common share. Outstanding options to acquire Red Back shares have been converted into fully vested
replacement options to acquire Kinross common shares, adjusted by 1.778, plus an amount equal to the fair market value of
0.11 of a Kinross warrant. Red Back common shares were delisted from the TSX after market on September 21, 2010. Kinross
has appointed Lukas Lundin, former Chairman of Red Back Mining, and Richard Clark, former CEO and President of Red Back
Mining, to the Company’s Board of Directors.
Sale of interest in Harry Winston Diamond Corporation
On July 23, 2010, the Company entered into an agreement with a group of financial institutions to sell its approximate 19.9%
equity interest in Harry Winston, consisting of 15.2 million Harry Winston common shares, on an underwritten block trade
basis, for proceeds of approximately $185.6 million and realized a gain of $146.4 million. The transaction closed on
July 28, 2010.
KINROSS GOLD CORPORATION 2010 ANNUAL REPORT 45

Completion of sale of Diavik mine interest
On August 25, 2010 the Company completed the sale of its 22.5% interest in the partnership holding Harry Winston’s 40%
interest in Diavik to Harry Winston for net proceeds of $189.6 million. The final purchase price was comprised of
$50.0 million cash, approximately 7.1 million Harry Winston common shares, valued at $69.7 million on the closing date, and
a note payable in the amount of $70.0 million maturing 12 months from the date of closing. The transaction resulted in a gain
of $95.5 million.
Completion of acquisition of Dvoinoye and Vodorazdelnaya
During 2010, Kinross received approval from the Russian government to acquire 100% ownership of Dvoinoye, classified by
the government as a strategic deposit. As a result, on August 27, 2010, the Company completed its acquisition of the
Dvoinoye deposit and the Vodorazdelnaya property for consideration comprised of $167.0 million in cash and approximately
10.6 million newly issued Kinross shares.
Completion of acquisition of Kupol East and West licences
On August 27, 2010, Kinross completed its agreement with B2Gold Corp. (‘‘B2Gold’’) to acquire B2Gold’s rights to an interest
in the Kupol East and West exploration licence areas adjacent to the Kupol mine site, further consolidating the Company’s
interests in the area.
Sale of interest in Osisko
On December 13, 2010, the Company completed the sale of its 1.8% interest in Osisko, consisting of approximately 6.8 million
Osisko common shares, on an underwritten block trade basis, at a gross price of CDN$14.70 per share, for net proceeds of
$97.5 million. The transaction resulted in a gain of $74.1 million.
Increase in the revolving credit facility
On June 17, 2010, Kinross increased the size of its revolving credit facility from $450.0 million to $600.0 million. All other
terms and conditions under the existing revolving credit facility remain unchanged, and the facility has a maturity date of
November 2012. The facility is led and arranged by Scotia Capital and by Bank of America Merrill Lynch.
New Chief Operating Officer appointed
On May 3, 2010, Kinross announced that Tim Baker, Executive Vice-President and Chief Operating Officer, had decided to
retire, effective December 31, 2010.
On August 4, 2010, Kinross announced the appointment of Brant Hinze as Executive Vice-President and Chief Operating
Officer, effective October 1, 2010. Mr. Hinze succeeds Tim Baker.
46
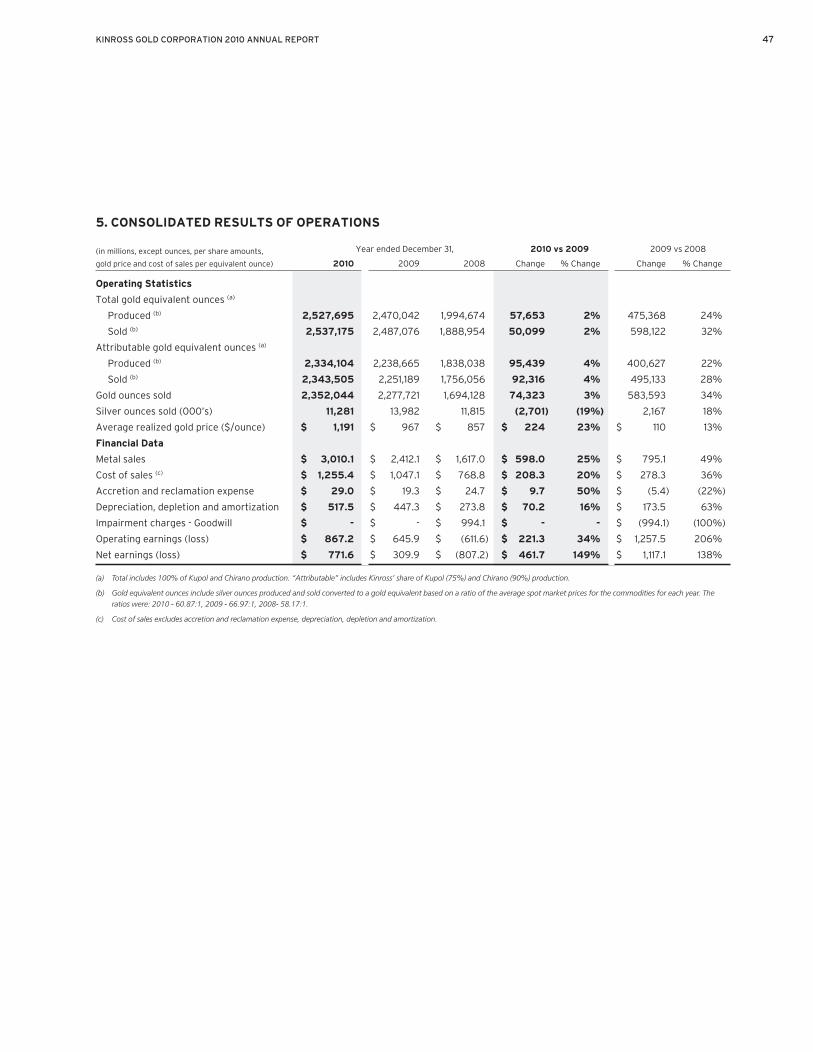
5. CONSOLIDATED RESULTS OF OPERATIONS
Year ended December 31, 2010 vs 2009 2009 vs 2008(in millions, except ounces, per share amounts,
gold price and cost of sales per equivalent ounce) 2010 2009 2008 Change % Change Change % Change
Operating Statistics
Total gold equivalent ounces (a)
Produced (b) 2,527,695 2,470,042 1,994,674 57,653 2% 475,368 24%
Sold (b) 2,537,175 2,487,076 1,888,954 50,099 2% 598,122 32%
Attributable gold equivalent ounces (a)
Produced (b) 2,334,104 2,238,665 1,838,038 95,439 4% 400,627 22%
Sold (b) 2,343,505 2,251,189 1,756,056 92,316 4% 495,133 28%
Gold ounces sold 2,352,044 2,277,721 1,694,128 74,323 3% 583,593 34%
Silver ounces sold (000’s) 11,281 13,982 11,815 (2,701) (19%) 2,167 18%
Average realized gold price ($/ounce) $ 1,191 $ 967 $ 857 $ 224 23% $ 110 13%
Financial Data
Metal sales $ 3,010.1 $ 2,412.1 $ 1,617.0 $ 598.0 25% $ 795.1 49%
Cost of sales (c) $ 1,255.4 $ 1,047.1 $ 768.8 $ 208.3 20% $ 278.3 36%
Accretion and reclamation expense $ 29.0 $ 19.3 $ 24.7 $ 9.7 50% $ (5.4) (22%)
Depreciation, depletion and amortization $ 517.5 $ 447.3 $ 273.8 $ 70.2 16% $ 173.5 63%
Impairment charges - Goodwill $ - $ - $ 994.1 $ - - $ (994.1) (100%)
Operating earnings (loss) $ 867.2 $ 645.9 $ (611.6) $ 221.3 34% $ 1,257.5 206%
Net earnings (loss) $ 771.6 $ 309.9 $ (807.2) $ 461.7 149% $ 1,117.1 138%
(a) Total includes 100% of Kupol and Chirano production. ‘‘Attributable’’ includes Kinross’ share of Kupol (75%) and Chirano (90%) production.
(b) Gold equivalent ounces include silver ounces produced and sold converted to a gold equivalent based on a ratio of the average spot market prices for the commodities for each year. Theratios were: 2010 - 60.87:1, 2009 - 66.97:1, 2008- 58.17:1.
(c) Cost of sales excludes accretion and reclamation expense, depreciation, depletion and amortization.
KINROSS GOLD CORPORATION 2010 ANNUAL REPORT 47

Operating earningsYear ended December 31, 2010 vs 2009 2009 vs 2008
(in millions) 2010 2009 2008 Change % Change(d) Change % Change(d)
Operating segments
Fort Knox $ 182.5 $ 80.4 $ 102.3 $ 102.1 127% $ (21.9) (21%)
Round Mountain 84.7 84.1 76.8 0.6 1% 7.3 10%
Kettle River-Buckhorn 79.6 58.6 (6.6) 21.0 36% 65.2 nm
Kupol 370.5 442.5 (479.9) (72.0) (16%) 922.4 (192%)
Paracatu 260.7 41.7 70.2 219.0 525% (28.5) (41%)
Crixas 38.6 25.9 35.0 12.7 49% (9.1) (26%)
La Coipa 58.3 42.3 38.7 16.0 38% 3.6 9%
Maricunga 53.8 83.2 (180.5) (29.4) (35%) 263.7 (146%)
Tasiast (9.2) - - (9.2) nm - -
Chirano 29.4 - - 29.4 nm - -
Julietta (a) - - (3.0) - - 3.0 nm
Non-operating segments
Fruta del Norte (40.1) (26.0) (4.8) (14.1) (54%) (21.2) (442%)
Cerro Casale (b) - (0.4) (0.1) 0.4 100% (0.3) (300%)
Corporate and Other (c) (241.6) (186.4) (259.7) (55.2) (30%) 73.3 (28%)
Total $ 867.2 $ 645.9 $ (611.6) $ 221.3 34% $ 1,257.5 (206%)
(a) Includes results of operations from the Julietta mine acquired from Bema on February 27, 2007 and sold on August 16, 2008.
(b) As of March 31, 2010, Cerro Casale is accounted for as an equity investment.
(c) ‘‘Corporate and Other’’ includes operating costs which are not directly related to individual mining properties such as general and administrative expenditures, gains and losses on disposal ofassets and investments and other operating costs.
(d) ‘‘nm’’ means not meaningful.
48
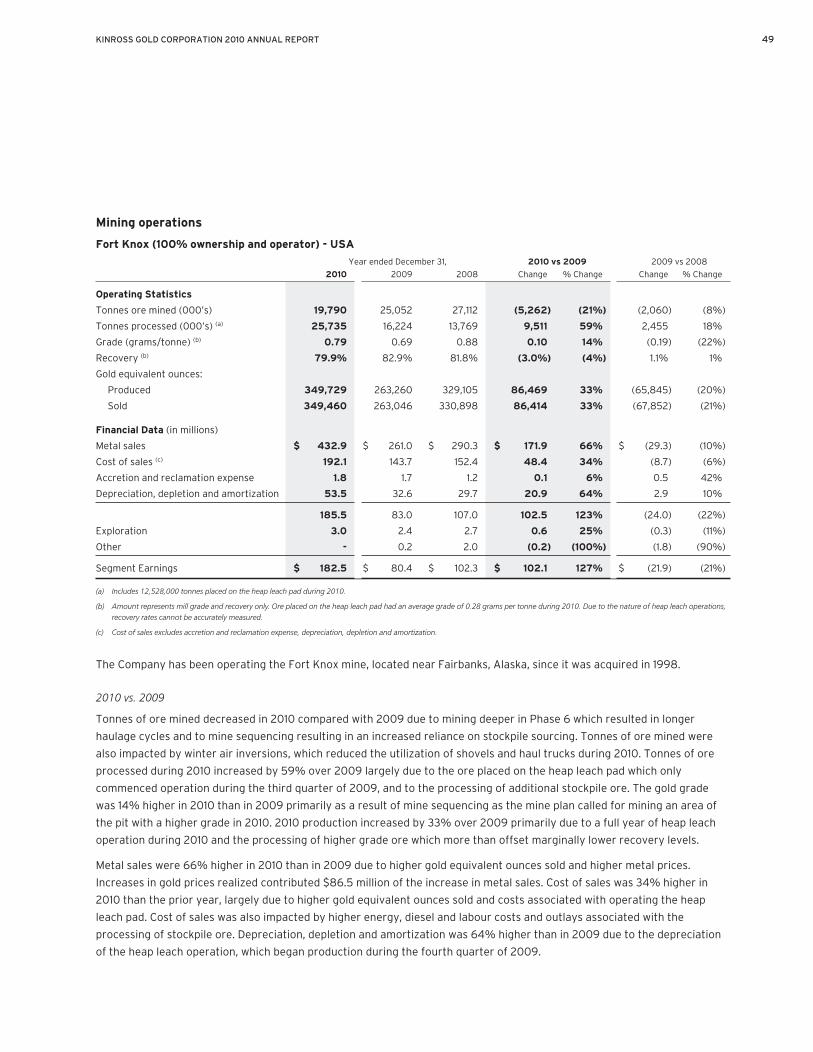
Mining operations
Fort Knox (100% ownership and operator) - USA
Year ended December 31, 2010 vs 2009 2009 vs 2008
2010 2009 2008 Change % Change Change % Change
Operating Statistics
Tonnes ore mined (000’s) 19,790 25,052 27,112 (5,262) (21%) (2,060) (8%)
Tonnes processed (000’s) (a) 25,735 16,224 13,769 9,511 59% 2,455 18%
Grade (grams/tonne) (b) 0.79 0.69 0.88 0.10 14% (0.19) (22%)
Recovery (b) 79.9% 82.9% 81.8% (3.0%) (4%) 1.1% 1%
Gold equivalent ounces:
Produced 349,729 263,260 329,105 86,469 33% (65,845) (20%)
Sold 349,460 263,046 330,898 86,414 33% (67,852) (21%)
Financial Data (in millions)
Metal sales $ 432.9 $ 261.0 $ 290.3 $ 171.9 66% $ (29.3) (10%)
Cost of sales (c) 192.1 143.7 152.4 48.4 34% (8.7) (6%)
Accretion and reclamation expense 1.8 1.7 1.2 0.1 6% 0.5 42%
Depreciation, depletion and amortization 53.5 32.6 29.7 20.9 64% 2.9 10%
185.5 83.0 107.0 102.5 123% (24.0) (22%)
Exploration 3.0 2.4 2.7 0.6 25% (0.3) (11%)
Other - 0.2 2.0 (0.2) (100%) (1.8) (90%)
Segment Earnings $ 182.5 $ 80.4 $ 102.3 $ 102.1 127% $ (21.9) (21%)
(a) Includes 12,528,000 tonnes placed on the heap leach pad during 2010.
(b) Amount represents mill grade and recovery only. Ore placed on the heap leach pad had an average grade of 0.28 grams per tonne during 2010. Due to the nature of heap leach operations,recovery rates cannot be accurately measured.
(c) Cost of sales excludes accretion and reclamation expense, depreciation, depletion and amortization.
The Company has been operating the Fort Knox mine, located near Fairbanks, Alaska, since it was acquired in 1998.
2010 vs. 2009
Tonnes of ore mined decreased in 2010 compared with 2009 due to mining deeper in Phase 6 which resulted in longer
haulage cycles and to mine sequencing resulting in an increased reliance on stockpile sourcing. Tonnes of ore mined were
also impacted by winter air inversions, which reduced the utilization of shovels and haul trucks during 2010. Tonnes of ore
processed during 2010 increased by 59% over 2009 largely due to the ore placed on the heap leach pad which only
commenced operation during the third quarter of 2009, and to the processing of additional stockpile ore. The gold grade
was 14% higher in 2010 than in 2009 primarily as a result of mine sequencing as the mine plan called for mining an area of
the pit with a higher grade in 2010. 2010 production increased by 33% over 2009 primarily due to a full year of heap leach
operation during 2010 and the processing of higher grade ore which more than offset marginally lower recovery levels.
Metal sales were 66% higher in 2010 than in 2009 due to higher gold equivalent ounces sold and higher metal prices.
Increases in gold prices realized contributed $86.5 million of the increase in metal sales. Cost of sales was 34% higher in
2010 than the prior year, largely due to higher gold equivalent ounces sold and costs associated with operating the heap
leach pad. Cost of sales was also impacted by higher energy, diesel and labour costs and outlays associated with the
processing of stockpile ore. Depreciation, depletion and amortization was 64% higher than in 2009 due to the depreciation
of the heap leach operation, which began production during the fourth quarter of 2009.
KINROSS GOLD CORPORATION 2010 ANNUAL REPORT 49

2009 vs. 2008
Tonnes of ore mined was lower in 2009 compared with 2008 due to geotechnical issues experienced in the East Wall. As a
result of these issues, the mine plan was modified in order to improve stability in the pit wall so that production focused on
higher grades, although a harder portion of the ore body, and supplemented by lower grade stockpile ore. Tonnes of ore
processed were higher primarily due to tonnes placed on the heap leach. The grade mined was lower in 2009 due to the
processing of lower grade stockpile ore and as the mine plan called for mining an area of the pit with a lower grade than the
area mined in 2008 and the inclusion of 3.4 million tonnes on the heap leach. Production in 2009 was lower than 2008
primarily due to lower grades which more than offset the higher tonnes processed and the slightly higher recovery.
At the Fort Knox heap leach, approximately 3.4 million tonnes of ore had been stacked as of the end of the fourth quarter,
and leaching was progressing well.
Metal sales were lower in 2009 than in 2008, largely due to lower ounces sold. Lower sales volumes resulted in a
$67.7 million decrease in metal sales in 2009 compared with 2008, while higher gold prices offset the impact by
$38.4 million. Cost of sales was lower primarily due to fewer gold equivalent ounces sold.
Round Mountain (50% ownership and operator; Barrick 50%) - USA
Year ended December 31, 2010 vs 2009 2009 vs 2008
2010 2009 2008 Change % Change Change % Change(d)
Operating Statistics (a)
Tonnes ore mined (000’s) (b) 23,218 22,179 26,227 1,039 5% (4,048) (15%)
Tonnes processed (000’s) (b) 30,348 30,035 37,368 313 1% (7,333) (20%)
Grade (grams/tonne) (b) 0.50 0.55 0.47 (0.05) (9%) 0.08 17%
Gold equivalent ounces:
Produced 184,554 213,916 246,946 (29,362) (14%) (33,030) (13%)
Sold 184,503 215,469 242,652 (30,966) (14%) (27,183) (11%)
Financial Data (in millions)
Metal sales $ 227.5 $ 210.0 $ 213.7 $ 17.5 8% $ (3.7) (2%)
Cost of sales (c) 121.3 111.4 112.9 9.9 9% (1.5) (1%)
Accretion and reclamation expense 1.4 1.6 1.1 (0.2) (13%) 0.5 45%
Depreciation, depletion and amortization 19.0 12.1 22.2 6.9 57% (10.1) (45%)
85.8 84.9 77.5 0.9 1% 7.4 10%
Exploration 1.4 0.4 0.7 1.0 250% (0.3) (43%)
Other (0.3) 0.4 - (0.7) (175%) 0.4 nm
Segment earnings $ 84.7 $ 84.1 $ 76.8 $ 0.6 1% $ 7.3 10%
(a) Due to the nature of heap leach operations, recovery rates cannot be accurately measured.
(b) Tonnes of ore mined/processed represent 100%.
(c) Cost of sales excludes accretion and reclamation expense, depreciation, depletion and amortization.
(d) ‘‘nm’’ means not meaningful.
The Company acquired its ownership interest in the Round Mountain open pit mine, located in Nye county, Nevada, with the
acquisition of Echo Bay Mines Ltd. (‘‘Echo Bay’’) on January 31, 2003.
50

2010 vs. 2009
Tonnes of ore mined during 2010 increased by 5% compared to 2009 due primarily to mine sequencing, offset by the impact
of pit wall stability issues. Gold grade declined by 9% in 2010 compared with 2009 due to changes in mine sequencing. Gold
equivalent ounces produced were 14% lower in 2010 due to lower gold grades combined with only marginal increases in
tonnes processed.
Metal sales were 8% higher in 2010 than in 2009 due to higher metal prices which more than offset the 14% decline in gold
equivalent ounces sold. Cost of sales increased by 9% in 2010 compared with 2009 due primarily to higher contractor costs
and increased diesel fuel prices. Depreciation, depletion and amortization increased by $6.9 million between 2009 and 2010
due largely to the commencement of amortization of previously capitalized stripping costs during the year.
2009 vs. 2008
Tonnes of ore mined in 2009 was 15% lower than in 2008 as mining was impacted by wall stability issues in Phase E. The
stability issues were encountered in October and the wall was stabilized in November. Geotechnical work was ongoing to
address the stability issues. Mining was occurring in Phase G in the interim. The reduction in tonnes placed on the leach pads
was primarily due to fewer tonnes mined and the depletion in 2008 of the remaining low grade stockpile ore. All tonnes
currently being placed on the dedicated pads are sourced from the pit. Gold equivalent ounces produced were 13% lower
than in 2008 due to lower tonnes processed, which more than offset the higher grade.
Metal sales were consistent with 2008 as higher gold prices more than offset the lower ounces sold. Fewer gold equivalent
ounces sold reduced metal sales by $25.4 million, which was largely offset by the impact of higher gold prices of
$21.7 million. The $10.1 million decrease in depreciation, depletion and amortization is due to fewer gold equivalent ounces
sold, increased reserves which increased the base upon which depreciation, depletion and amortization is calculated and a
reduction in the asset retirement obligation.
Kettle River-Buckhorn (100% ownership and operator) - USA
Year ended December 31, 2010 vs 2009 2009 vs 2008
2010 2009 2008 Change % Change Change % Change(b)
Operating Statistics
Tonnes ore mined (000’s) 438 286 36 152 53% 250 694%
Tonnes processed (000’s) 436 282 77 154 55% 205 266%
Grade (grams/tonne) 16.21 20.48 12.29 (4.27) (21%) 8.19 67%
Recovery 88.8% 91.8% 88.4% (3.0%) (3%) 3.4% 4%
Gold equivalent ounces:
Produced 198,810 173,555 27,036 25,255 15% 146,519 542%
Sold 196,282 182,472 16,296 13,810 8% 166,176 1020%
Financial Data (in millions)
Metal sales $ 242.6 $ 182.0 $ 13.7 $ 60.6 33% $ 168.3 1228%
Cost of sales (a) 64.7 53.6 5.6 11.1 21% 48.0 857%
Accretion and reclamation expense 2.3 2.9 2.1 (0.6) (21%) 0.8 38%
Depreciation, depletion and amortization 91.5 64.6 5.9 26.9 42% 58.7 995%
84.1 60.9 0.1 23.2 38% 60.8 nm
Exploration 7.1 3.9 3.4 3.2 82% 0.5 15%
Other (2.6) (1.6) 3.3 (1.0) (63%) (4.9) (148%)
Segment Earnings (loss) $ 79.6 $ 58.6 $ (6.6) $ 21.0 36% $ 65.2 988%
(a) Cost of sales excludes accretion and reclamation expense, depreciation, depletion and amortization.
(b) ‘‘nm’’ means not meaningful.
KINROSS GOLD CORPORATION 2010 ANNUAL REPORT 51

The Kettle River-Buckhorn properties are located in Ferry County in the State of Washington and cover approximately
3,075 hectares through patented and unpatented mining claims and fee lands. Kinross acquired Kettle River through the
acquisition of Echo Bay on January 31, 2003.
2010 vs. 2009
Tonnes of ore mined and processed were 53% and 55% higher in 2010 than in 2009, respectively, as Kettle River-Buckhorn
was ramping up to targeted mining and processing rates during 2009 after commencing operations during the fourth
quarter of 2008. Gold grades declined by 21% in 2010 compared with 2009 due to mine sequencing resulting in the mining
and processing of lower grade ore. Gold equivalent ounces produced were 15% higher in 2010 than in 2009 due to higher
tonnes processed which more than offset the impact of lower grades and recovery.
Metal sales increased by $60.6 million or 33% in 2010 compared with 2009 due to increases in gold prices realized and
higher gold equivalent ounces sold. Increases in gold prices realized contributed $46.8 million to the change in metal sales
between 2009 and 2010. Cost of sales increased by 21% in 2010 compared with 2009 primarily due to a 53% increase in
tonnes ore mined and higher contractor outlays. Depreciation, depletion and amortization was 42% higher due to an
increase in gold equivalent ounces sold and a decline in reserves at December 31, 2009, decreasing the base on which the
majority of depreciation is calculated.
2009 vs. 2008
Kettle River-Buckhorn completed its first full year of production in 2009 as the mine commenced operations during the
fourth quarter of 2008, upon reaching certain minimum levels of production. Gold equivalent ounces sold were higher than
production as production at the end of 2008 was sold at the beginning of 2009. Results for 2009 reflect a full year
of production.
52

Kupol (75% ownership and operator) - Russian Federation
Year ended December 31, 2010 vs 2009 2009 vs 2008
2010 2009 2008 Change % Change(d) Change % Change(d)
Operating Statistics - 100%
Tonnes ore mined (000’s) (a) 1,331 1,090 463 241 22% 627 135%
Tonnes processed (000’s) (a) 1,163 1,144 618 19 2% 526 85%
Grade (grams/tonne)
Gold 18.04 22.79 28.51 (4.75) (21%) (5.72) (20%)
Silver 217.00 266.90 330.38 (49.90) (19%) (63.48) (19%)
Recovery
Gold 94.6% 94.7% 94.5% (0.1%) (0%) 0.2% 0%
Silver 83.7% 82.9% 82.0% 0.8% 1% 0.9% 1%
Gold equivalent ounces: (a), (b)
Produced 738,677 925,507 626,543 (186,830) (20%) 298,964 48%
Sold 740,566 943,548 531,590 (202,982) (22%) 411,958 77%
Silver ounces: (a)
Produced (000’s) 6,672.3 8,205.0 5,566.8 (1,532.7) (19%) 2,638.2 47%
Sold (000’s) 6,573.2 8,160.8 4,695.0 (1,587.6) (19%) 3,465.8 74%
Financial Data (in millions) - 100%
Metal sales $ 781.8 $ 900.2 $ 433.2 $ (118.4) (13%) $ 467.0 108%
Cost of sales (c) 236.2 245.5 116.8 (9.3) (4%) 128.7 110%
Accretion and reclamation expense 1.6 1.4 0.9 0.2 14% 0.5 56%
Depreciation, depletion and
amortization 156.6 205.1 121.6 (48.5) (24%) 83.5 69%
387.4 448.2 193.9 (60.8) (14%) 254.3 131%
Exploration 15.7 4.8 5.4 10.9 227% (0.6) (11%)
Impairment charge - Goodwill - - 668.4 - nm (668.4) (100%)
Other 1.2 0.9 - 0.3 33% 0.9 nm
Segment earnings (loss) $ 370.5 $ 442.5 $ (479.9) $ (72.0) (16%) $ 922.4 192%
(a) Tonnes of ore mined/processed and production and sales represent 100%.
(b) ‘‘Gold equivalent ounces’’ include silver ounces produced and sold converted to a gold equivalent based on the ratio of the average spot market prices for the commodities for each period.The ratios were: 2010 - 60.87:1; 2009 - 66.97:1; and 2008 - 58.17:1.
(c) ‘‘Cost of sales’’ excludes accretion and reclamation expense, depreciation, depletion and amortization.
(d) ‘‘nm’’ means not meaningful.
The Company acquired a 75% interest in the Kupol project in Far Eastern Russia on February 27, 2007 through the
acquisition of Bema. The remaining 25% interest is held by the Chukotka government.
2010 vs. 2009
Tonnes of ore mined were 22% higher in 2010 compared with 2009 as Kupol added mining equipment during 2009, which
was in use for the full year of 2010. Gold and silver grades were 21% and 19% lower than in 2009, respectively, due to
planned mine sequencing and the processing of lower grade stockpile ore as a result of ground control issues. The lower
grades resulted in gold equivalent ounces produced that were 20% lower than in 2009. Gold equivalent ounces sold during
2010 were higher than those produced due to timing of shipments and the sale in 2010 of finished goods inventory on hand
at the end of December 31, 2009.
KINROSS GOLD CORPORATION 2010 ANNUAL REPORT 53

Metal sales were 13% lower in 2010 than in 2009, as the lower gold equivalent ounces sold more than offset the impact of
higher metal prices. Cost of sales declined by 4% between 2009 and 2010 as a result of lower consumption of reagents and
power. Depreciation, depletion and amortization declined by 24% in 2010 compared to the prior year as a result of lower
gold equivalent ounces sold.
2009 vs. 2008
Tonnes of ore mined and processed were higher in 2009 compared with 2008 as Kupol had just begun operations during the
second quarter of 2008. Gold and silver grades were lower in 2009 compared with 2008 as higher grade ore that had been
stockpiled during the development phase was processed during 2008. Ground control issues were encountered earlier in the
year and were addressed with a modified mine plan and refined mining techniques. By the end of the year, underground
conditions had improved significantly as a result of mine plan modifications, which included limiting the length of selected
stopes, modified blasting techniques, and limiting air circulation to inactive headings.
Metal sales, cost of sales and depreciation, depletion and amortization were higher in 2009 due to higher ounces sold, which
reflects a full year of activity. In 2008, ounces were not sold until the second half of the year.
Paracatu (100% ownership and operator) - Brazil
Year ended December 31, 2010 vs 2009 2009 vs 2008
2010 2009 2008 Change % Change Change % Change
Operating Statistics
Tonnes ore mined (000’s) 44,902 41,256 20,575 3,646 9% 20,681 101%
Tonnes processed (000’s) 42,658 39,744 20,307 2,914 7% 19,437 96%
Grade (grams/tonne) 0.45 0.41 0.39 0.04 10% 0.02 5%
Recovery 77.5% 67.6% 74.2% 9.9% 15% (6.6%) (9%)
Gold equivalent ounces:
Produced 482,397 354,396 188,156 128,001 36% 166,240 88%
Sold 487,877 347,664 183,115 140,213 40% 164,549 90%
Financial Data (in millions)
Metal sales $ 597.8 $ 340.1 $ 161.4 $ 257.7 76% $ 178.7 111%
Cost of sales (a) 261.0 240.9 82.4 20.1 8% 158.5 192%
Accretion and reclamation expense 2.5 1.0 1.2 1.5 150% (0.2) (17%)
Depreciation, depletion and amortization 62.9 42.5 16.3 20.4 48% 26.2 161%
271.4 55.7 61.5 215.7 387% (5.8) (9%)
Other 10.7 14.0 (8.7) (3.3) (24%) 22.7 261%
Segment earnings $ 260.7 $ 41.7 $ 70.2 $ 219.0 525% $ (28.5) (41%)
(a) ‘‘Cost of sales’’ excludes accretion and reclamation expense, depreciation, depletion and amortization.
The Company acquired a 49% ownership interest in the Paracatu open pit mine, located in the State of Minas Gerais, Brazil,
in the acquisition of TVX Gold Inc. (‘‘TVX’’) on January 31, 2003. On December 31, 2004, the Company completed the
purchase of the remaining 51% of Paracatu from Rio Tinto Plc.
2010 vs. 2009
Tonnes of ore mined in 2010 increased by 9% compared with 2009 largely due to improvements in equipment availability
and mine sequencing. Gold grades were 10% higher in 2010 than in 2009 due to planned changes in mine sequencing.
54

Plant 2 operating improvements also resulted in a 15% increase in recoveries in 2010 compared with 2009. Gold equivalent
ounces produced and sold were 36% and 40% higher in 2010 than in 2009, respectively, as a result of higher grades,
recoveries, and throughput. Gold equivalent ounces sold during 2010 were higher than gold equivalent ounces produced due
to timing of shipments, as finished goods inventory on hand at the end of December 31, 2009 was sold during 2010.
Metal sales increased to $597.8 million in 2010 compared with $340.1 million in 2009, of which $137.2 million was due to an
increase in sales volumes and $120.5 million was due to a higher realized gold price. Cost of sales and depreciation, depletion
and amortization were higher largely due to higher gold equivalent ounces sold. The increase in cost of sales is due to
additional costs associated with the ramp up to targeted processing and recovery rates. Depreciation, depletion and
amortization increased further as a result of a reduction in reserves at December 31, 2009, decreasing the base on which the
majority of depreciation is calculated.
2009 vs. 2008
Results for 2009 reflect the additional capacity from the expansion as tonnes of ore mined and tonnes of ore processed
were 101% and 96% higher than 2008, respectively. The grade was 5% higher than in the prior year as a higher grade area
of the pit was mined, consistent with the mine plan. Recoveries were lower for 2009 compared with 2008 primarily due to
lack of plant stability, difficulty achieving optimum grind size, and hydromet plant startup issues. Performance at the
expansion plant was considerably improved in the latter part of the year. Upgrades to the plant have eliminated minor
unplanned stoppages, contributing to plant stability and recovery. In addition, circuit modifications have been made to
optimize grinding capacity.
Higher tonnes processed and a higher grade contributed to a 88% increase in production compared with 2008. This was
partially offset by a decrease in recoveries. Gold equivalent ounces sold were higher due to higher production.
Metal sales increased to $340.1 million compared with $161.4 million in 2008, of which $161.1 million was due to an increase in
sales volumes. Cost of sales increased by $158.5 million compared with 2008, due to the greater volume of ounces sold and
additional costs due to the challenges experienced earlier in the year in achieving targeted recovery levels while maintaining
targeted throughput levels. The increase in cost of sales was primarily due to increased spending on labour and consumables
which reflect higher production volumes and were $162.9 million higher than in 2008. However, costs were reduced to some
extent by a weaker Brazilian real in 2009 versus 2008. Depreciation, depletion and amortization expense was higher due to
higher ounces sold and the depreciation on the increased capital spending for the mine expansion. Of the $26.2 million
increase in depreciation, $14.4 million was due to the higher gold equivalent ounces sold.
KINROSS GOLD CORPORATION 2010 ANNUAL REPORT 55

Crixas (50% ownership; AngloGold Ashanti 50% and operator) - Brazil
Year ended December 31, 2010 vs 2009 2009 vs 2008
2010 2009 2008 Change % Change Change % Change
Operating Statistics
Tonnes ore mined (000’s) (a) 1,132 1,036 807 96 9% 229 28%
Tonnes processed (000’s) (a) 1,132 1,036 807 96 9% 229 28%
Grade (grams/tonne) 4.40 4.85 7.11 (0.45) (9%) (2.26) (32%)
Recovery 93.3% 91.6% 95.0% 1.7% 2% (3.4%) (4%)
Gold equivalent ounces:
Produced 74,777 74,654 87,669 123 0% (13,015) (15%)
Sold 77,156 75,173 86,663 1,983 3% (11,490) (13%)
Financial Data (in millions)
Metal sales $ 94.7 $ 73.6 $ 75.3 $ 21.1 29% $ (1.7) (2%)
Cost of sales (b) 37.5 31.0 26.2 6.5 21% 4.8 18%
Accretion and reclamation expense 0.2 0.1 0.4 0.1 100% (0.3) (75%)
Depreciation, depletion and
amortization 17.1 9.7 10.7 7.4 76% (1.0) (9%)
39.9 32.8 38.0 7.1 22% (5.2) (14%)
Exploration 0.9 0.7 2.1 0.2 29% (1.4) (67%)
Other 0.4 6.2 0.9 (5.8) (94%) 5.3 589%
Segment earnings $ 38.6 $ 25.9 $ 35.0 $ 12.7 49% $ (9.1) (26%)
(a) Tonnes of ore mined/processed represents 100% of mine production.
(b) ‘‘Cost of sales’’ excludes accretion and reclamation expense, depreciation, depletion and amortization.
The Company acquired its ownership interest in the Crixas underground mine, located in the State of Goias, Brazil, with the
acquisition of TVX on January 31, 2003.
2010 vs. 2009
Tonnes of ore mined and processed were 9% higher in 2010 than in 2009 due to the mill expansion, which occurred during
2009. Gold grade declined by 9% in 2010 compared with 2009 due to a change in mine sequencing. Gold equivalent ounces
produced and sold were comparable to 2009 as the increase in tonnes processed offset the lower gold grade.
Metal sales increased by $21.1 million or 29% to $94.7 million due to higher gold equivalent ounces sold and higher metal
prices. Higher gold prices realized accounted for $19.2 million of the increase in sales. Cost of sales increased by 21% during
2010 largely due to higher labour, contractor and consumables costs. Depreciation, depletion and amortization increased by
76% due to the depreciation of additional deferred development costs. Additionally, a significant increase in capital
expenditures during 2009 contributed approximately $2.9 million to the increase in 2010 depreciation expense.
2009 vs. 2008
Tonnes of ore mined and processed were 28% higher than 2008 primarily due to the mill expansion. The grade was lower in
the current year as lower grade areas were mined, consistent with the mine plan. Recovery was lower because of low
residence time in the leaching circuit, due to insufficient capacity of the existing leaching tanks. New leaching tanks were
installed at the end of September 2009. Gold equivalent ounces produced were lower, primarily due to lower grades which
more than offset the higher tonnes processed.
56

Metal sales decreased by 2% during 2009 as the impact of higher gold prices of $9.6 million was largely offset by the impact
of fewer gold equivalent ounces sold of $11.2 million. Cost of sales was higher as costs were increased by higher spending on
labour of $2.6 million and consumables of $2.3 million, compared with 2008.
La Coipa (100% ownership and operator) - Chile
Year ended December 31, 2010 vs 2009 2009 vs 2008
2010 2009 2008 Change % Change Change % Change
Operating Statistics
Tonnes ore mined (000’s) 3,985 3,164 2,350 821 26% 814 35%
Tonnes processed (000’s) 4,445 4,907 4,918 (462) (9%) (11) (0%)
Grade (grams/tonne)
Gold 1.14 1.13 1.02 0.01 1% 0.11 11%
Silver 50.43 52.53 58.33 (2.10) (4%) (5.80) (10%)
Recovery
Gold 79.0% 85.4% 80.6% (6.4%) (7%) 4.8% 6%
Silver 58.8% 62.7% 61.2% (3.9%) (6%) 1.5% 2%
Gold equivalent ounces: (a)
Produced 196,330 231,169 226,293 (34,839) (15%) 4,876 2%
Sold 203,626 222,664 234,759 (19,038) (9%) (12,095) (5%)
Silver ounces:
Produced (000’s) 4,154 5,263 5,686 (1,109) (21%) (423) (7%)
Sold (000’s) 4,078 5,219 6,261 (1,141) (22%) (1,042) (17%)
Financial Data (in millions)
Metal sales $ 250.5 $ 216.4 $ 206.6 $ 34.1 16% $ 9.8 5%
Cost of sales (b) 132.0 97.6 114.7 34.4 35% (17.1) (15%)
Accretion and reclamation expense 9.1 8.5 7.9 0.6 7% 0.6 8%
Depreciation, depletion and
amortization 45.8 57.5 38.8 (11.7) (20%) 18.7 48%
63.6 52.8 45.2 10.8 20% 7.6 17%
Exploration 5.1 6.3 3.7 (1.2) (19%) 2.6 70%
Other 0.2 4.2 2.8 (4.0) (95%) 1.4 50%
Segment earnings $ 58.3 $ 42.3 $ 38.7 $ 16.0 38% $ 3.6 9%
(a) ‘‘Gold equivalent ounces’’ include silver ounces produced and sold converted to a gold equivalent based on the ratio of the average spot market prices for the commodities for each period.The ratios were: 2010 - 60.87:1, 2009 - 66.97:1, 2008 - 58.17:1.
(b) ‘‘Cost of sales’’ excludes accretion and reclamation expense, depreciation, depletion and amortization.
The Company acquired its original 50% ownership interest in the La Coipa open pit mine in the acquisition of TVX on
January 31, 2003. On December 21, 2007 the Company completed an asset Purchase and Sale Agreement with Goldcorp
whereby the interest in the PJV and Musselwhite mines were sold and the remaining 50% interest in La Coipa was acquired.
Included in the results of La Coipa is its 65% interest in the Puren deposit.
2010 vs. 2009
The increase in tonnes of ore mined in 2010 compared with 2009 is due to mine sequence changes and a strike that limited
access to the pit between July 8 and August 1 of 2009. Mine plan changes resulted in ore being sourced from areas that had
a higher concentration of clay during 2010. The higher concentration of clay in the ore blend negatively impacted filter plant
KINROSS GOLD CORPORATION 2010 ANNUAL REPORT 57

capacity, and consequently tonnes processed during 2010. Operations were also impacted by adverse winter weather
conditions and related plant shutdowns during 2010. Recoveries were lower during 2010 due to higher clay content in the
ore. A reduction in tonnes processed and lower recovery rates resulted in a 15% decline in gold equivalent ounces produced
in 2010 compared with 2009.
Metal sales increased by 16% compared to 2009 as higher metal prices more than offset lower sales volumes. Cost of sales
increased by $34.4 million or 35% due to higher power costs resulting from a new agreement, higher reagent costs, and
increases in contractor costs. Depreciation, depletion and amortization declined by 20% in 2010 compared with 2009
primarily due to lower gold equivalent ounces sold.
2009 vs. 2008
Tonnes of ore mined in 2009 were higher than the prior year as mining in 2008 was impacted by a pit wall failure in the
Coipa Norte pit during January 2008. Replacement ore to feed the mill in 2008 was sourced from stockpile ore which
contained lower gold grades. Silver grades were lower as the mine plan called for mining an area of the pit with lower grades.
Gold equivalent ounces sold were lower than produced due to timing of shipments.
Metal sales were slightly higher as the impact of lower gold equivalent ounces was more than offset by the impact of higher
metal prices of $5.6 million. Cost of sales in 2009 was 15% lower than in 2008 partially due to lower gold equivalent ounces
sold. Additionally, the decline in cost of sales reflects the impact of a weaker Chilean peso in 2009 compared with 2008.
Cost of sales was lower in part due to $5.6 million less spent on consumables during the year. Depreciation, depletion and
amortization increased compared with 2008 largely because of the decrease in reserves, which reduced the base upon
which depreciation, depletion and amortization is calculated.
Maricunga (100% ownership and operator) - Chile
Year ended December 31, 2010 vs 2009 2009 vs 2008
2010 2009 2008 Change % Change(c) Change % Change(c)
Operating Statistics (a)
Tonnes ore mined (000’s) 14,929 15,099 14,971 (170) (1%) 128 1%
Tonnes processed (000’s) 14,267 15,613 15,027 (1,346) (9%) 586 4%
Grade (grams/tonne) 0.77 0.84 0.76 (0.08) (9%) 0.08 11%
Gold equivalent ounces:
Produced 156,590 233,585 223,341 (76,995) (33%) 10,244 5%
Sold 155,320 237,040 221,882 (81,720) (34%) 15,158 7%
Financial Data (in millions)
Metal sales $ 187.5 $ 228.8 $ 184.8 $ (41.3) (18%) $ 44.0 24%
Cost of sales (b) 115.9 123.4 125.5 (7.5) (6%) (2.1) (2%)
Accretion and reclamation expense 0.6 0.5 0.4 0.1 20% 0.1 25%
Depreciation, depletion and
amortization 14.5 19.3 17.8 (4.8) (25%) 1.5 8%
56.5 85.6 41.1 (29.1) (34%) 44.5 108%
Exploration 1.1 0.2 1.4 0.9 450% (1.2) (86%)
Impairment charge - Goodwill - - 220.2 - nm (220.2) nm
Other 1.6 2.2 - (0.6) (27%) 2.2 nm
Segment earnings (loss) $ 53.8 $ 83.2 $ (180.5) $ (29.4) (35%) $ 263.7 146%
(a) Due to the nature of heap leach operations, recovery rates cannot be accurately measured.
(b) ‘‘Cost of sales’’ excludes accretion and reclamation expense, depreciation, depletion and amortization.
(c) ‘‘nm’’ means not meaningful.
58
Kinross acquired its original 50% interest in the Maricunga open pit mine (formerly known as the Refugio mine), located
120 kilometres northeast of Copiapo, Chile in 1998. On February 27, 2007, Kinross acquired the remaining 50% interest in
Maricunga through the acquisition of Bema.
2010 vs. 2009
Tonnes of ore mined and processed were lower in 2010 than in 2009 as a result of mining approaching the bottom of the
Verde pit, and decreased equipment availability which negatively impacted tonnes placed on the heap leach. Gold grades
were 9% lower in 2010 than in 2009 due primarily to mine sequencing. Gold equivalent ounces produced were 33% lower
due to reductions in tonnes processed and gold grade.
Metal sales declined by 18% in 2010 compared with 2009 as lower gold equivalent ounces sold more than offset higher metal
prices. Cost of sales was 6% lower than in 2009 largely due to lower gold equivalent ounces sold, offset by higher contractor
and energy costs. Depreciation, depletion and amortization decreased by 25% to $14.5 million in 2010 due primarily to lower
gold equivalent ounces sold.
2009 vs. 2008
Tonnes of ore processed were higher by 4% in 2009 compared with 2008, due to improved plant availability and reflects
the impact of the optimization initiatives implemented early in the year. The gold grade increased to 0.84 grams per tonne
compared with 0.76 grams per tonne in 2008 due to mine sequencing. Gold equivalent ounces produced and sold were
higher than 2008 due to higher tonnes processed and a higher gold grade.
Metal sales for the year were higher than 2008, due to higher realized gold prices, which increased metal sales by
$24.5 million and higher gold equivalent ounces sold which increased metal sales by $19.5 million. Cost of sales for 2009 was
largely consistent with the same period in the prior year as the impact of higher gold equivalent ounces sold was largely
offset by the impact of the strengthening of the Chilean peso relative to the U.S. dollar and lower contractor costs incurred
during 2009 compared with 2008.
KINROSS GOLD CORPORATION 2010 ANNUAL REPORT 59

Tasiast (100% ownership and operator) - Mauritania
Year ended
December 31, 2010
Operating Statistics
Tonnes ore mined (000’s) 2,197
Tonnes processed (000’s) (a) 2,059
Grade (grams/tonne) (b) 2.33
Recovery (b) 86.7%
Gold equivalent ounces:
Produced 56,611
Sold 57,097
Financial Data (in millions)
Metal sales $ 78.0
Cost of sales (c) 43.1
Accretion and reclamation expense 0.1
Depreciation, depletion and amortization 20.4
14.4
Exploration 22.9
Other 0.7
Segment loss $ (9.2)
(a) Includes 1,540,000 tonnes placed on the heap leach pad during 2010.
(b) Amount represents mill grade and recovery only. Ore placed on the heap leach pad had an average grade of 0.64 grams per tonne during 2010. Due to the nature of heap leach operations,recovery rates cannot be accurately measured.
(c) Cost of sales excludes accretion and reclamation expense, depreciation, depletion and amortization.
On September 17, 2010, Kinross acquired all of the outstanding common shares of Red Back that it did not previously own. As
this purchase is a business acquisition with Kinross as the acquirer, results of operations of Red Back, including those of the
Tasiast open pit mine, have been consolidated with those of Kinross commencing on September 17, 2010.
During the period from September 17 to December 31, 2010, ore mined and processed amounted to 2,197,000 and
2,059,000 tonnes, respectively. Tasiast produced 56,611 gold equivalent ounces, while selling 57,097 gold equivalent ounces
during the period from September 17 to December 31 of 2010. Gold was milled at an average grade of 2.33g/t.
Metal sales of $78.0 million, net of cost of sales, depreciation, depletion and amortization, and exploration expenses,
resulted in a net operating loss of $9.2 million for the period. Exploration costs amounted to $22.9 million between
September 17 and December 31, 2010 due to Kinross’ implementation of the planned post-acquisition ramp up. An acquisition
date inventory fair value adjustment of $9.3 million represents 22% of total cost of sales.
60

Chirano (90% ownership and operator) - Ghana
Year ended
December 31, 2010
Operating Statistics
Tonnes ore mined (000’s) (a) 1,308
Tonnes processed (000’s) (a) 1,142
Grade (grams/tonne) 2.74
Recovery 91.3%
Gold equivalent ounces: (a)
Produced 89,220
Sold 85,288
Silver ounces:
Produced (000’s) 12,725
Sold (000’s) 12,725
Financial Data (in millions)
Metal sales $ 116.8
Cost of sales (b) 51.6
Accretion and reclamation expense 0.1
Depreciation, depletion and amortization 31.1
34.0
Exploration 4.4
Other 0.2
Segment earnings $ 29.4
(a) Tonnes of ore mined/processed and production and sales represents 100%.
(b) Cost of sales excludes accretion and reclamation expense, depreciation, depletion and amortization.
On September 17, 2010, Kinross acquired all of the outstanding common shares of Red Back that it did not previously own. As
this purchase is a business acquisition with Kinross as the acquirer, results of operations of Red Back, including those of the
Chirano open pit and underground mine, have been consolidated with those of Kinross commencing on September 17, 2010.
The Company owns a 90% interest in the Chirano mine. A 10% carried interest is held by the government of Ghana.
During the period from September 17 to December 31, 2010, ore mined and processed amounted to 1,308,000 and
1,142,000 tonnes, respectively. Grade amounted to 2.74g/t and recovery was 91.3% for the period. Chirano produced
89,220 gold equivalent ounces, while selling 85,288 gold equivalent ounces during the period from September 17 to
December 31 of 2010.
Metal sales of $116.8 million, net of cost of sales, depreciation, depletion and amortization, and exploration expenses,
resulted in net operating earnings of $29.4 million for the period. An acquisition date inventory fair value adjustment of
$3.5 million represents 7% of total cost of sales.
Mining operations sold
Julietta (0%) - Russian Federation
The Company acquired 90% ownership of Julietta as part of the Bema acquisition on February 27, 2007. Subsequently, on
August 16, 2008, the Company disposed of this operation. Results for 2008 include the results of operations to
August 16, 2008.
KINROSS GOLD CORPORATION 2010 ANNUAL REPORT 61

Gold equivalent ounces produced in 2008 were 39,585 ounces while gold equivalent ounces sold amounted to 41,099.
During 2008, metal sales were $38.0 million and cost of sales of $32.3 million were recorded.
Exploration and business developmentYear ended December 31, 2010 vs 2009 2009 vs 2008
(in millions) 2010 2009 2008 Change % Change Change % Change
Exploration and business development $ 142.7 $ 72.5 $ 59.0 $ 70.2 97% $ 13.5 23%
Exploration and business development expenses for 2010 were $142.7 million, compared with $72.5 million for 2009. Of the
total exploration and business development expense, expenditures on exploration totalled $120.1 million for the year.
Significant 2010 exploration programs included those at Tasiast, Kupol, Fruta del Norte, Dvoinoye and Chirano. Capitalized
exploration expenses totalled $7.1 million. Kinross was active on 44 mine site, near-mine and greenfield projects in 2010 with
a total of 375,084 metres drilled (353,547 metres expensed and 21,537 metres capitalized).
In 2009, exploration and business development expenses for the year were $72.5 million, compared with $59.0 million for
2008. Of the total exploration and business development expense, expenditures on exploration totaled $56.1 million for the
year. Capitalized exploration expenses for 2009 totaled $10.6 million. Kinross was active on more than 40 mine site and
greenfields projects in 2009 with a total of 166,496 metres drilled (126,772 metres expensed and 39,742 metres capitalized).
In 2008, exploration and business development expenses increased 25% from 2007 to $59.0 million. Of the total 2008
exploration and business development expense, expenditures on exploration totaled $45.1 million for the year. Capitalized
exploration expenses for 2008 totaled $10.3 million. Kinross was active on more than two dozen mine site and greenfields
projects in 2008 with a total of 172,580 metres drilled (112,385 metres expensed and 60,195 metres capitalized).
General and administrativeYear ended December 31, 2010 vs 2009 2009 vs 2008
(in millions) 2010 2009 2008 Change % Change Change % Change
General and administrative $ 144.5 $ 117.7 $ 100.8 $ 26.8 23% $ 16.9 17%
General and administrative costs include expenses related to the overall management of the business which are not part of
direct mine operating costs. These are costs that are incurred at corporate offices located in Canada, the United States,
Brazil, the Russian Federation and Chile.
A 23% increase in general and administrative costs in 2010 compared with 2009 was largely due to the continued growth of
the Company which has resulted in higher information technology and employee related costs, and costs related to the
integration of Red Back. At the Company’s corporate office in Toronto, employee related compensation costs including stock
based compensation increased by 24% from $64.1 million in 2009 to $79.7 million in 2010. Information technology costs
increased by 50% in 2010 compared with 2009.
Costs for 2009 were 17% higher than in 2008. The increase was primarily a result of higher personnel costs, including
additional hires and information technology costs, which were incurred as a result of the growth in the Company. At the
Company’s corporate office in Toronto, employee related compensation costs including stock based compensation increased
by 16% in 2009, while information technology costs increased by 15%.
62

Impairment of Goodwill
The Company evaluates its carrying value of goodwill at least once each year. The test for impairment of goodwill is
discussed further in the ‘‘The Carrying Value of Goodwill’’ in the Critical Accounting Policies and Estimates section below.
There were no impairment charges recorded in 2010 or 2009.
In 2008, as part of the annual review of the carrying amount of goodwill for each reporting segment that has goodwill it was
determined that the carrying value of goodwill at Kupol, Maricunga and Quebrada Seca, an exploration property, exceeded
its fair value. As a result, the Company wrote down the value of goodwill for each reporting segment to its fair value
resulting in a non-cash charge of $994.1 million. The assets were acquired through the acquisition of Bema in 2007.
A summary of impairment charges to goodwill is as follows:
Year ended December 31, 2010 vs 2009 2009 vs 2008
(in millions) 2010 2009 2008 Change % Change(a) Change % Change(a)
Goodwill Impairment Charges
Kupol $ - $ - $ 668.4 $ - nm $ (668.4) nm
Maricunga - - 220.2 - nm (220.2) nm
Quebrada Seca - - 105.5 - nm (105.5) nm
$ - $ - $ 994.1 $ - nm $ (994.1) nm
(a) ‘‘nm’’ means not meaningful.
Other income (expense) - netYear ended December 31, 2010 vs 2009 2009 vs 2008
(in millions) 2010 2009 2008 Change % Change(a) Change % Change(a)
Gain on sale of assets and investments -
net $ 348.5 $ 16.2 $ 30.2 $ 332.3 2051% $ (14.0) (46%)
Impairment of Investments - - (83.9) - nm 83.9 100%
Litigation reserve adjustment - 18.5 (19.1) (18.5) (100%) 37.6 197%
Interest income and other 8.3 9.2 21.7 (0.9) (10%) (12.5) (58%)
Interest expense (31.1) (19.1) (74.6) (12.0) (63%) 55.5 74%
Foreign exchange gains (losses) (12.7) (91.0) 41.4 78.3 86% (132.4) (320%)
Non-hedge derivative gains (losses) (17.6) 2.9 41.6 (20.5) (707%) (38.7) (93%)
Working interest in Diavik Diamond mine (2.4) (11.0) - 8.6 78% (11.0) nm
$ 293.0 $ (74.3) $ (42.7) $ 367.3 494% $ (31.6) (74%)
(a) ‘‘nm’’ means not meaningful.
On a net basis, other income of $293.0 million was recorded in 2010 compared to other expense of $74.3 million in 2009.
The increase is primarily due to a $332.3 million increase in gains on the sale of assets and investments, and a reduction in
foreign exchange losses from $91.0 million in 2009 to $12.7 million in 2010. These net gains were offset to some extent by an
$18.5 million litigation settlement gain in 2009, a $12.0 million increase in interest expense in 2010 compared with 2009, and
a change from net non-hedge derivative gains of $2.9 million in 2009 to a net loss of $17.6 million in 2010.
Other expense increased by $31.6 million from $42.7 million in 2008 to $74.3 million in 2009. The increase can be partially
explained by a foreign exchange loss in 2009 compared with a gain in 2008, lower interest income, lower non-hedge
KINROSS GOLD CORPORATION 2010 ANNUAL REPORT 63

derivative gains and lower gains on the sale of assets and investments. The decreases were offset to some extent by a
litigation settlement gain in 2009 compared with a loss in 2008, and lower interest expense.
Gain on the sale of assets and investments - net
In 2010, the Company recorded gains of $146.4 million, $95.5 million, and $74.1 million on the sales of Kinross’ equity
interest in Harry Winston, its Working Interest in Diavik, and its investment in Osisko, respectively. These impacts, combined
with a $36.7 million pre-tax gain recognized on the sale of one-half of Kinross’ interest in Cerro Casale during the first
quarter of 2010, resulted in a $332.3 million increase in the gain on sale of assets and investments in 2010 compared
with 2009.
During 2009, the Company closed an agreement with Jaguar Mining Inc. (‘‘Jaguar’’) to sell the Gurupi property to Jaguar in
exchange for 3.4 million common shares of Jaguar. Additionally, during the fourth quarter, the Company disposed of all or a
portion of its equity interests in several junior mining companies for proceeds of $6.7 million. As a result of the disposition of
non-core assets and investments, the Company recognized a non-cash gain on these transactions of $16.2 million, before tax
for the year.
In 2008, total gains on disposal of assets and investments were $30.2 million. Kinross recognized gains on the disposition of
Julietta ($3.0 million), the disposition of its 40% interest in Hammond Reef ($12.2 million) and the disposition of the Kubaka
mine ($11.5 million).
Impairment of investments
There were no impairments recorded on Kinross’ investment portfolio during 2010 or 2009.
In 2008, the Company assessed its portfolio of available for sale and equity accounted investments. Based on the decline in
the market values of certain investments, severe market conditions and the difficulties facing junior mining companies in
raising financing, the Company determined that the decline in values of certain investments were other-than-temporary and
recorded an impairment charge of $83.9 million during the year.
The investment impairment charges recognized in 2008 primarily related to the Company’s investment in several junior
mining companies, acquired as part of the Bema acquisition, the majority of which are related to the Company’s investment
in Pamodzi Gold, Consolidated Puma Minerals and Victoria Gold Corporation.
Litigation settlements
In 2009, the Company settled litigation in respect of certain actions brought against Aurelian Resources Inc., which was
acquired in 2008. As a result, an adjustment to the litigation reserve was made in the amount of $18.5 million.
In 2008, the Company agreed to settle the Kinam preferred share litigation in the amount of $29.2 million. As the Company
previously held the preferred shares balance at $10.1 million, this resulted in a loss of $19.1 million for 2008.
See ‘‘Other legal matters’’ section for additional details.
Interest income and other
Interest income and other decreased marginally from $9.2 million in 2009 to $8.3 million in 2010.
Interest income and other decreased by $12.5 million in 2009 compared with 2008. The decrease was primarily due to lower
interest rates and a change in the nature of the Company’s investments in 2009. The Company has focused on investing in
treasury bills which earn a lower interest rate than the investments in 2008.
64
Interest expense
Interest expense increased by $12.0 million during 2010 compared with 2009. The increase in interest expense was primarily
the result of the one-time 2009 reversal of $45.5 million in accrued interest related to the Brazil Federal Tax Amnesty,
offset to some degree by lower debt balances during 2010. Capitalized interest for 2010 amounted to $13.2 million compared
with $8.6 million in 2009 on qualifying projects at Round Mountain and Fort Knox.
Interest expense decreased by $55.5 million during 2009 compared with 2008. Positively impacting interest expense was
the reversal of accrued interest of $45.5 million, as a result of the Brazil Federal Tax Amnesty. Additionally, with the start-up
of Kupol, Kettle River-Buckhorn and the Paracatu expansion in 2008, Kinross ceased capitalizing interest expense to these
projects. Capitalized interest for 2009 was $8.6 million compared with $30.6 million in 2008.
Foreign exchange gains (losses)
During 2010, the Company recorded a foreign exchange loss of $12.7 million compared with a loss of $91.0 million for 2009.
The foreign exchange losses were driven by the translation and revaluation of net monetary liabilities, including future
income taxes. As at December 31, 2010, the U.S. dollar foreign exchange rate was weaker than at December 31, 2009 relative
to the Canadian dollar, the Brazilian real and the Chilean peso. The U.S. dollar strengthened over the same period relative to
the Russian ruble.
For 2009, foreign exchange losses were $91.0 million. The foreign exchange losses primarily relate to the translation and
revaluation of net monetary liabilities, primarily future income taxes, denominated in foreign currencies to the US dollar. As
at December 31, 2009, the U.S. dollar foreign exchange rate was weaker compared with the Russian rouble and the Brazilian
real than the foreign exchange rates at December 31, 2008.
For 2008, the Company recorded a foreign exchange gain of $41.4 million compared with a loss of $36.4 million for 2007, a
change of $77.8 million. The foreign exchange gains were primarily due to the translation of net foreign currency
denominated liabilities, mainly future tax liabilities, resulting from a strengthening of the U.S. dollar over the second half of
the year. Foreign exchange on the translation of local currency denominated future income tax liabilities was a gain of
$58.0 million compared with loss of $39.9 million in the prior year.
Net non-hedge derivative gains (losses)
Net non-hedge derivative losses of $17.6 million were incurred in 2010 compared to gains of $2.9 million in 2009. This
change was primarily due to a credit risk adjustment on gold and silver derivatives. Credit risk adjustment changes are a
component of the mark-to-market adjustment of the derivatives which are recorded in other income (expense). Additionally,
the remainder of the change principally relates to mark-to-market adjustments on derivative instruments that are not
designated as hedges as at December 31, 2010.
For 2009, non-hedge derivative gains decreased by $38.7 million compared with 2008. The decline in the gains primarily
related to a change in the fair value of the derivatives acquired through the acquisition of Bema in 2007. In 2008, the
change in forward metal prices on the Company’s derivatives had a greater impact than the change in forward metal prices
in 2009.
In December 2007, the Company re-designated the hedge relationship for derivative contracts using a new methodology for
assessing their effectiveness. Under the new methodology, the changes in the value of the contracts due to changes in the
spot price of gold or silver are recorded in OCI. Any changes in the spot forward differential in the contracts are excluded
from the assessment of effectiveness for hedge accounting purposes and are recorded in income. During 2008, U.S. interest
rates decreased substantially, reducing the spot forward differential on gold and silver contracts. This change resulted in a
KINROSS GOLD CORPORATION 2010 ANNUAL REPORT 65

substantial gain in value on the derivative gold and silver contracts. This unrealized gain was recorded in income along with
realized gains and losses during the period.
Working Interest in Diavik Diamond mine
In 2010, the Company recorded a loss of $2.4 million on its Working Interest in the Diavik Diamond mine prior to completing
its sale on August 25, 2010.
For 2009, the Company recognized a loss of $11.0 million on its Working Interest in the Diavik Diamond mine which was
acquired in 2009. The $11.0 million is comprised of the Company’s share of pro-rata earnings from the mine and includes
amortization of the initial investment, net of any distributions from the Working Interest.
Income and mining taxes
Kinross is subject to tax in various jurisdictions including Canada, the United States, Brazil, Chile, Ecuador, the Russian
Federation, Mauritania and Ghana. The Company recorded a tax provision of $275.4 million on earnings before taxes of
$1,160.2 million in 2010, compared with a tax provision of $150.8 million on earnings before taxes of $571.6 million in 2009,
and a provision of $101.1 million on a loss before taxes of $654.3 million in 2008. Kinross’ combined federal and provincial
statutory tax rate was 31.0% for 2010, 33.0% for 2009, and 33.5% in 2008.
The Company’s tax provision increased compared with 2009 largely due to the impact of the Company’s sale of one-half of
its interest in Cerro Casale in the first quarter of 2010 and a change in the income mix, partially offset by a reduction in the
tax provision related to lower foreign exchange gains on U.S. dollar intercompany and third party debt than in the prior year.
There are a number of factors that can significantly impact the Company’s effective tax rate including the geographic
distribution of income, varying rates in different jurisdictions, the non-recognition of tax assets, mining allowance, foreign
currency exchange rate movements, changes in tax laws and the impact of specific transactions and assessments. A
reconciliation of the Company’s statutory rate to the actual provision is provided in Note 14 to the consolidated financial
statements.
Due to the number of factors that can potentially impact the effective tax rate and the sensitivity of the tax provision to
these factors, as discussed above, it is expected that the Company’s effective tax rate will fluctuate in future periods.
In late December 2008, Rio Paracatu Mineracao (‘‘KBM’’), a wholly-owned Brazilian subsidiary of the Company, received a
tax assessment from the Brazilian tax authorities in respect of its 2003 tax year in the amount of approximately $30 million.
This assessment is the result of the denial of a deduction for interest paid on certain debentures issued by such Brazilian
subsidiary. On January 15, 2009, the Company filed its administrative appeal of the assessment. The Company believes that
the basis for this assessment is equally relevant to the 2004 tax year of the same Brazilian subsidiary. At that time the
Company recorded a total charge of $63.9 million, primarily comprised of $20.7 million that related to tax expense and
$37.3 million in interest with respect to the 2003 and 2004 tax years after considering the tax deductibility of the assessed
interest. As a result of the Company’s review, it had recorded a tax liability in that amount resulting in a corresponding
reduction in its net income after taxes for the quarter and year ended December 31, 2008. On November 27, 2009, the
Company settled this tax debt under the Brazilian Federal Tax Amnesty Program.
66

6. LIQUIDITY AND CAPITAL RESOURCES
The following table summarizes Kinross’ cash flow activity:
Year ended December 31, 2010 vs 2009 2009 vs 2008
(in millions) 2010 2009 2008 Change % Change Change % Change
Cash flow:
Provided from operating activities $ 968.4 $ 785.6 $ 443.6 $ 182.8 23% $ 342.0 77%
Provided from (used in) investing
activities 231.8 (751.5) (856.2) 983.3 131% 104.7 12%
Provided from (used in) financing
activities (337.3) 63.3 375.7 (400.6) (633%) (312.4) (83%)
Effect of exchange rate changes on cash 6.3 9.4 (23.8) (3.1) (33%) 33.2 139%
Increase (decrease) in cash and cash
equivalents 869.2 106.8 (60.7) 762.4 714% 167.5 276%
Cash and cash equivalents, beginning of
period 597.4 490.6 551.3 106.8 22% (60.7) (11%)
Short-term investments - 35.0 34.5 (35.0) (100%) 0.5 1%
Cash and cash equivalents, end of period $1,466.6 $ 632.4 $ 525.1 $ 834.2 132% $ 107.3 20%
Cash and cash equivalent balances increased by $834.2 million to $1,466.6 million at December 31, 2010 from $632.4 million
at December 31, 2009. The increase primarily relates to an increase in cash provided from investing and operating activities.
These changes were offset to some extent by a $400.6 million change from cash provided from financing activities of
$63.3 million in 2009 to cash used in financing activities of $337.3 million in 2010. Detailed discussions regarding these cash
flow movements are noted below.
Operating Activities
2010 vs. 2009
During 2010, cash provided from operating activities was $182.8 million higher than in 2009. The increase in operating cash
flows was largely the result of an increase in gross margin due to higher metal prices, offset to some degree by higher VAT
and trade receivables at December 31, 2010.
2009 vs. 2008
During 2009, cash provided from operating activities was $342.0 million higher than in 2008. The increase in operating cash
flows reflects the impact of higher gold equivalent ounces sold and higher metal prices. Additionally, operating cash flows
were positively impacted by a smaller change in inventory balances, as 2008 reflected the build up of inventory at Kupol.
Operating cash flows in 2009 were also positively impacted by higher accounts payable and accrued liabilities at Kupol and
the Corporate offices at December 31, 2009, while the tax settlement under the Brazilian Federal tax amnesty reduced
operating cash flow by $71.0 million.
Investing Activities
Cash provided from investing activities was $231.8 million in 2010 compared with cash used in investing activities of
$751.5 million for 2009. During 2010 the primary sources of cash were proceeds on the Company’s disposal of its equity
interest in Harry Winston, its Working Interest in Diavik, its investment in Osisko, and proceeds on the sale of one-half of the
KINROSS GOLD CORPORATION 2010 ANNUAL REPORT 67

Company’s interest in Cerro Casale. Offsetting these proceeds were cash payments associated with the Company’s
acquisition of Dvoinoye during the third quarter of 2010 and an increase in additions to PP&E of $82.5 million.
Cash used in investing activities was $751.5 million in 2009 compared with $856.2 million for 2008. Cash used in investing
activities for 2009 reflects the acquisition of the remaining interest Lobo-Marte of $41.4 million and the investment in Harry
Winston and the indirect interest in the Diavik Diamond Mine for a gross amount of $173.5 million. Additionally, cash used in
investing activities reflects the payments to settle the Aurelian warrant litigation. In 2008, as part of the acquisition of
Aurelian Resources Inc., net cash of $21.2 million was received. This was offset to some extent by lower capital expenditures.
Capital expenditures were lower in 2009, largely due to lower capital expenditures at Kupol and Paracatu, as Kupol was
ramping up and the Paracatu expansion was in development during 2008.
The following table provides a breakdown of capital expenditures:
Year ended December 31, 2010 vs 2009 2009 vs 2008
(in millions) 2010 2009 2008 Change % Change(d) Change % Change(d)
Operating segments
Fort Knox $ 87.9 $ 133.1 $ 126.6 $ (45.2) (34%) $ 6.5 5%
Round Mountain 32.7 33.0 36.9 (0.3) (1%) (3.9) (11%)
Kettle River-Buckhorn 9.2 30.3 42.5 (21.1) (70%) (12.2) (29%)
Kupol 32.1 39.3 102.4 (7.2) (18%) (63.1) (62%)
Paracatu 161.4 124.1 329.2 37.3 30% (205.1) (62%)
Crixas 24.6 25.2 19.7 (0.6) (2%) 5.5 28%
La Coipa 26.5 18.8 17.1 7.7 41% 1.7 10%
Maricunga 72.0 42.5 22.4 29.5 69% 20.1 90%
Julietta (a) - - 2.4 - nm (2.4) nm
Tasiast 53.8 - - 53.8 nm - nm
Chirano 10.1 - - 10.1 nm - nm
Non-operating segments
Fruta del Norte 1.4 3.1 - (1.7) (55%) 3.1 nm
Cerro Casale (b) 4.0 22.2 10.9 (18.2) (82%) 11.3 104%
Corporate and Other (c) 48.0 9.6 4.6 38.4 400% 5.0 109%
Total $ 563.7 $ 481.2 $ 714.7 $ 82.5 17% $ (233.5) (33%)
(a) Includes results of operations from the Julietta mine acquired from Bema on February 27, 2007 and sold on August 16, 2008.
(b) As of March 31, 2010, Cerro Casale is accounted for as an equity investment.
(c) ‘‘Corporate and Other’’ includes operating costs which are not directly related to individual mining properties such as general and administrative expenditures, gains on disposal of assets andinvestments and other operating costs.
(d) ‘‘nm’’ means not meaningful.
During 2010, capital expenditures included costs related to the expansion at Paracatu, the pit expansion at Fort Knox, and
the construction of the Maricunga SART and ADR plants. Additionally, $63.9 million in capital expenditures were incurred at
the newly acquired Tasiast and Chirano mines between September 17 and December 31, 2010.
Capital expenditures in 2009 included costs related to the expansion at Paracatu and the pit expansion at Fort Knox.
Capital expenditures in 2008 included costs related to the expansion at Paracatu, and the development of Kupol and Kettle
River-Buckhorn, which began operations during 2008.
68

Financing Activities
Cash used in financing activities in 2010 was $337.3 million compared with cash provided from financing activities of
$63.3 million in 2009. During 2009, the Company raised $396.4 million through an equity offering. During 2010, the
Company repaid debt of $334.9 million, a net repayment increase of $9.0 million over 2009. Offsetting this net use of cash
to some degree was a $49.6 million increase in the net proceeds from the issuance of debt in 2010 compared to 2009.
Cash provided from financing activities for 2009 was $63.3 million, lower by $312.4 million compared with 2008. The
variance was largely due to a net repayment of debt of $248.2 million in 2009 compared with a net increase of
$449.6 million in 2008. Additionally the Company raised $421.5 million through the issuance of shares in 2009 compared
with $31.7 million in 2008. During 2009, the Company paid out $88.2 million in dividends to common shareholders and
non-controlling shareholders.
During 2008, cash flow provided by financing activities of $375.7 million primarily consisted of a net increase in debt of
$449.6 million, and cash from the exercise of options and warrants of $31.7 million, partially offset by dividends paid of
$51.5 million and net cash paid in respect of the settlement of derivative instruments in the amount of $23.2 million. The net
increase in debt primarily related to the Senior Convertible Notes issued in January 2008 in the amount of $449.9 million.
Balance Sheet As at
December 31, December 31, December 31,
(in millions) 2010 2009 2008
Cash and cash equivalents and short-term investments $ 1,466.6 $ 632.4 $ 525.1
Current assets $ 2,668.5 $ 1,390.9 $ 1,124.9
Total assets $ 16,397.1 $ 8,013.2 $ 7,387.5
Current liabilities $ 927.4 $ 638.0 $ 551.5
Total long-term financial liabilities (a) $ 987.0 $ 1,058.2 $ 1,370.4
Total debt, including current portion $ 503.0 $ 692.2 $ 950.9
Total liabilities (b) $ 2,996.6 $ 2,453.7 $ 2,610.6
Shareholders’ equity $ 13,400.5 $ 5,559.5 $ 4,776.9
Statistics
Working capital $ 1,741.1 $ 752.9 $ 573.4
Working capital ratio (c) 2.88:1 2.18:1 2.04:1
(a) Includes long-term debt and other long-term liabilities.
(b) Includes non-controlling interest.
(c) Current assets divided by current liabilities.
At December 31, 2010, Kinross had cash, cash equivalents and short-term investments of $1,466.6 million, an increase of
$834.2 million compared with 2009. Current assets increased by $1,277.6 million largely due to assets assumed through the
acquisitions of Red Back, Underworld and Dvoinoye during the year, a note receivable related to the sale of the Company’s
Working Interest in Diavik, and an increase in VAT receivable. Total assets increased by $8,383.9 million amounting to a
105% increase relative to 2009, primarily due to the acquisitions of Red Back, Dvoinoye, and Underworld, in addition to the
increase in current assets. This was offset to some degree by depreciation, depletion and amortization and the Company’s
sale of its equity interest in Harry Winston, its working interest in Diavik, its investment in Osisko, and one-half of its interest
in the Cerro Casale project. Total debt decreased from $692.2 million in 2009 to $503.0 million in 2010 due mainly to the
repayment of the Kupol project loan during the year. Shareholders’ equity increased from $5,559.5 million at December 31,
2009 to $13,400.5 million at December 31, 2010 due to share issuances on the acquisitions of Red Back, Dvoinoye and
Underworld, and net earnings of $771.6 million in 2010.
KINROSS GOLD CORPORATION 2010 ANNUAL REPORT 69

On February 16, 2011, the Board of Directors declared a dividend of $0.05 per common share to shareholders of record on
March 24, 2011.
On August 4, 2010, the Board of Directors declared a dividend of $0.05 per common share which was paid to common
shareholders on September 30, 2010 to shareholders of record at the close of business on August 31, 2010.
On February 17, 2010, the Board of Directors declared a dividend of $0.05 per common share to shareholders of record on
March 24, 2010.
On August 12, 2009, the Board of Directors declared a cash dividend of $0.05 per common share. A cash dividend of $0.04
per common share was declared on February 18, 2009.
A cash dividend of $0.04 per common share was declared on February 21, 2008.
As of February 15, 2011, there were 1,133.8 million common shares of the Company issued and outstanding. In addition, at the
same date, the Company had 14.9 million share purchase options outstanding under its share option plan and 56.3 million
common share purchase warrants outstanding (convertible to 50.3 million Kinross shares).
Credit Facilities and Financing
Convertible debentures
In January 2008, Kinross received net proceeds of $449.9 million from the offering of $460.0 million Convertible Senior
Notes due March 15, 2028 (the ‘‘Convertible Notes’’), after payment of commissions and expenses of the offering. The notes
pay interest semi-annually at a rate of 1.75% per annum. The notes will be convertible on or after December 27, 2027, at the
holder’s option, equivalent to a conversion price of $28.04 per share of common stock subject to adjustment. The
Convertible Senior Notes may be converted, at the same conversion rate and at the option of the holder, prior to
December 15, 2027 if certain events occur, including Kinross common shares trading at a level greater than 130% of the
effective conversion price of the Convertible Senior Notes for any 20 trading days during the 30 consecutive trading day
period ending on the last trading day of each calendar quarter ending on or after June 30, 2008. The Convertible Senior
Notes are redeemable by the Company, in whole or part, for cash at any time on or after March 20, 2013, at a redemption
price equal to par plus accrued and unpaid interest, if any, to the redemption date. Holders may require Kinross to
repurchase the Convertible Senior Notes at a purchase price equal to par plus accrued and unpaid interest, if any, to the
repurchase date, on March 15, 2013, March 15, 2018 and March 15, 2023, or upon certain fundamental changes. Subject to
certain conditions, Kinross may deliver, in lieu of cash, Kinross common shares, or a combination of cash and Kinross
common shares, in satisfaction of the purchase price.
Credit facilities
In November 2009, the Company entered into an amended revolving credit facility which provides credit of $450.0 million
on an unsecured basis and expires in November 2012. The term loan for the Paracatu property, which was part of the credit
facility agreement the Company entered into in 2006, forms part of the amended revolving credit facility, and that credit will
be available to the Company as the term loan is repaid. On June 17, 2010, the Company entered into a further amendment to
increase availability under the facility to $600.0 million. On September 17, 2010, the revolving credit facility was further
amended to add Mauritania, Ghana, and Cote d’Ivoire as permitted jurisdictions as a result of the Red Back acquisition. All
other terms and conditions under the existing revolving credit facility remain unchanged. As at December 31, 2010, the
Company had drawn $87.7 million (December 31, 2009 - $124.4 million) on the amended revolving credit facility, including
drawings for the Paracatu term loan and $28.6 million (December 31, 2009 - $28.9 million) for letters of credit.
70

The new credit agreement contains various covenants including limits on indebtedness, asset sales and liens. Significant
financial covenants include a minimum tangible net worth of $3,345.3 million starting September 30, 2009 and increasing by
50% of positive net income each quarter, an interest coverage ratio of at least 4.25:1, and net debt to EBITDA, as defined in
the agreement, of no more than 3.5:1. The Company is in compliance with these covenants at December 31, 2010.
Loan interest is variable, set at LIBOR plus an interest rate margin which is dependent on the ratio of the Company’s net
debt to EBITDA as defined in the agreement.
The Company’s current ratio of net debt to EBITDA, as defined in the agreement, is less than 1.50:1. At this ratio, interest
charges are as follows:
Type of Credit Credit Facility
Dollar based LIBOR loan LIBOR plus 2.50%
Letters of credit 2.50%
Standby fee applicable to unused availability 0.75%
Also in November 2009, the Company entered into a separate Letter of Credit guarantee facility with Export Development
Canada (‘‘EDC’’) for $125.0 million. Letters of credit guaranteed by this new facility are solely for reclamation liabilities at
Fort Knox, Round Mountain, and Kettle River-Buckhorn. On July 30, 2010, the Company entered into an amendment to
increase the amount of the Letter of Credit guarantee facility from $125.0 million to $136.0 million. All other terms and
conditions under this facility remain the same. As at December 31, 2010, $135.1 million was outstanding under this facility
compared with $96.4 million at December 31, 2009.
In addition, at December 31, 2010 the Company had approximately $11.5 million (December 31, 2009 - $15.8 million) in letters
of credit outstanding in respect of its operations in Brazil. These letters of credit have been issued pursuant to arrangements
with Brazilian and international banks.
Prior to the amendment of the revolving credit facility, the Company had in place a revolving credit facility of $300.0 million
and a $104.6 million term loan, under an agreement signed in 2006. The 2006 revolving credit facility supported the
Company’s liquidity and letters of credit requirements and, as amended in 2007, was to expire in August 2010. The purpose
of the term loan was, and continues to be, to support the expansion program at the Paracatu mine in Brazil. The term loan
expires in February 2012.
Loan interest under the 2006 revolving credit facility agreement was variable, set at LIBOR plus an interest rate margin
dependent on the ratio of the Company’s net debt to operating cash flow, as defined under the agreement.
The 2006 credit agreement contained various covenants that included limits on indebtedness, distributions, asset sales and
liens. Significant financial covenants included a minimum tangible net worth of $700.0 million, an interest coverage ratio of
at least 4.5:1, net debt to operating cash flow of no more than 3.0:1 and minimum Proven and Probable Reserves of 6 million
gold equivalent ounces after repayment of the term loan. The financial covenants were based on the amounts recorded by
the Company, less amounts recorded in EastWest Gold Corporation (‘‘EastWest Gold’’), a subsidiary of Kinross and formerly
known as Bema Gold.
In addition to these facilities, Chukotka Mining and Geological Company had a project finance loan acquired as part of the
Bema acquisition. The loan has been repaid in full and as such there was no balance outstanding at December 31, 2010 as
compared with $158.4 million outstanding at December 31, 2009.
KINROSS GOLD CORPORATION 2010 ANNUAL REPORT 71

The following table outlines the credit facility utilization and availability:As at
December 31, December 31,
(in millions) 2010 2009
Revolving credit facility $ (87.7) $ (124.4)
Utilization of EDC facility (135.1) (96.4)
Draw against Kupol project loan - (158.4)
Borrowings $ (222.8) $ (379.2)
Available under revolving credit facility 512.3 325.6
Available under EDC credit facility 0.9 28.6
Available under Kupol project loan - -
Available credit $ 513.2 $ 354.2
The Company’s Kupol project financing consisting of a project loan (‘‘Project Loan’’) was repaid in full in December 2010. In
addition, Bayerische Hypo-und Vereinsbank AG (‘‘HVB’’) had provided the Company with a cost overrun facility, which
expired on June 1, 2009.
The Project Loan consisted of Tranche A which had a six-and-one half year term from drawdown, and Tranche B which had a
seven-and-one half year term. The annual interest rate was: (a) LIBOR plus 2% prior to economic completion of the Kupol
mine; (b) LIBOR plus 2.5% for two years after economic completion; and (c) LIBOR plus 3% for each remaining term (each
rate is net of political risk insurance premiums). The Project Loan was collateralized against the Kupol Mine and guaranteed
by a subsidiary until economic completion was achieved, as defined by the loan agreements. The loan agreements included
customary covenants for debt financings of this type, including that EastWest Gold continued as a guarantor of the Kupol
credit facility until the project reaches economic completion. EastWest Gold was to maintain a minimum liquidity balance to
meet future capital expenditure requirements at Kupol. This declined as capital expenditures were made. Kinross agreed to
assume the hedge contracts for the Kupol project in the event that the Kupol loan was accelerated, and the net
mark-to-market position of all the hedge contracts was negative.
Under the terms of the Kupol Project Loan there were two significant milestones that the project had to meet in order for
the loan to become a non-recourse loan; Mechanical Completion, and Economic Completion. Mechanical Completion was
achieved on September 30, 2008, and Economic completion was achieved on September 23, 2009.
Having achieved economic completion, the Company was released from a guarantee that EastWest Gold had given the
project lenders and we received back a $25 million letter of credit. The Company received consent from the lenders to allow
it to complete a special cash distribution when the Company achieved economic completion. As part of the distribution, the
Company was required to prepay a portion of the principal outstanding on the loan (approximately $89.0 million) and as a
result, the Company declared and paid a dividend (total dividend payment $102.6 million, Kinross’ share $76.8 million).
Under the terms of the HVB Facility, the Company could have issued convertible unsecured notes to HVB, with a seven-year
term from the date of drawdown. The holder of the notes would have had the right to convert the notes into common shares
of Kinross at a conversion price equal to $14.57 per share prior to maturity or repayment of the notes. The annual interest
was expected to be at the rate of LIBOR plus 2.5% for four years from date of issuance and thereafter at the rate of LIBOR
plus 3%.
In 2008, the Company had a subordinated loan, up to a maximum of $25.0 million, with the International Finance
Corporation (‘‘IFC’’), of which a $19.8 million loan had been drawn under the loan at December 31, 2008. Prior to the
acquisition of Bema by Kinross, Bema had issued share purchase warrants to IFC. There were 8.5 million Kinross share
72

purchase warrants outstanding relating to the issuance which are convertible into 3.8 million Kinross shares, as a result of
the acquisition of Bema. Each warrant entitles IFC to receive one Kinross share plus CAD$0.01, at a price of $6.61, until
March 1, 2014. During 2009, 8.5 million Kinross share purchase warrants were converted into 3.8 million Kinross shares at a
price of $6.61 plus CAD$0.01 per warrant. As a result, the balance outstanding on the IFC loan of $25 million was assigned to
EastWest Gold and as a result was eliminated from Kinross’ consolidated financial results.
Total debt of $503.0 million at December 31, 2010 consists of $419.5 million for the debt component of the convertible
debentures, $56.8 million for the Corporate term loan and revolving credit facilities, and $26.7 million in capital leases and
other debt. The current portion of this debt is $48.4 million at December 31, 2010.
Equity financing
On February 5, 2009, the Company completed a public offering of common shares at a price of $17.25 per common share.
The offering resulted in a total of 24,035,000 common shares being issued for net proceeds of $396.4 million. The Company
used the net proceeds from the offering to enhance its capital position following the funding of recent acquisitions and for
general corporate purposes.
Liquidity Outlook
In 2011, the Company expects to repay $48.4 million of debt.
The Company’s capital resources include existing cash and cash equivalents balances of $1,466.6 million, available credit of
$513.2 million and expected operating cash flows based on current assumptions (as noted in Section 3 of this MD&A). We
believe these capital resources are sufficient to fund operations, our forecasted exploration and capital expenditures (noted
in Section 3 of this MD&A), debt repayments noted above and reclamation and remediation obligations in 2011. Prior to any
capital investments, consideration is given to the cost and availability of various sources of capital resources.
With respect to the longer term capital expenditure funding requirements, the Company has begun discussions with lending
institutions that have been active in the jurisdictions in which the Company’s development projects are located. Some of the
jurisdictions in which the Company operates have seen the participation of lenders including export credit agencies,
development banks and multi lateral agencies. The Company believes the capital from these institutions combined with more
traditional bank loans and capital available through debt capital market transactions will fund a portion of the longer term
capital expenditure requirements. Another possible source of capital would be proceeds from the sale of non-core assets.
These capital sources together with operating cash flow and the Company’s active management of its operations and
development activities will enable the Company to maintain an appropriate overall liquidity position.
Contractual Obligations and Commitments
Certain contractual obligations of the Company are noted in the table below:
2016 and
(in millions) Total 2011 2012 2013 2014 2015 thereafter
Long-term debt obligations $ 482.9 $ 38.8 $ 23.5 $ 420.3 $ 0.3 $ - $ -
Lease obligations 66.1 15.6 14.3 8.1 4.6 4.3 19.2
Purchase obligations 102.9 82.7 20.2 - - - -
Reclamation and remediation obligations 943.0 24.2 42.2 57.6 49.7 39.9 729.4
Interest and other fees 35.8 17.0 14.7 4.1 - - -
Total $ 1,630.7 $ 178.3 $ 114.9 $ 490.1 $ 54.6 $ 44.2 $ 748.6
KINROSS GOLD CORPORATION 2010 ANNUAL REPORT 73

The Company manages its exposure to fluctuations in input commodity prices, currency exchange rates and interest rates,
by entering into derivative financial instruments from time to time, in accordance with the Company’s risk management
policy. The Company also assumed gold and silver derivative financial instruments as required under the terms of the Kupol
project financing and other contracts that were acquired with the acquisition of Bema.
As at December 31, 2010, the Company had gold and silver forward contracts to deliver 393,735 ounces of gold and
3,600,000 ounces of silver which were acquired with the acquisition of Bema. These contract dates range from 2011 through
2012, at prices ranging from $621.24 per ounce to $674.44 per ounce for gold and $10.71 for silver.
As at December 31, 2010, the Company had purchased silver put contracts for 2,806,000 ounces of silver at an average cost
of $13.00 per ounce on anticipated silver production at La Coipa. The Company has also entered into sold silver call
contracts for 2,806,000 ounces of silver at an average cost of $17.29 per ounce. These contracts mature in 2011.
As at December 31, 2010, Kinross had contracts to sell $406.0 million U.S. dollars for Brazilian reais at an average rate of
1.93, maturing during 2011 and 2012. As at December 31, 2010 Kinross had contracts to sell $145.0 million U.S. dollars for
Russian roubles at an average rate of 32.36, maturing during 2011 and 2012. Also at December 31, 2010, Kinross had
contracts to sell $172.0 million U.S. dollars for Chilean pesos at an average rate of 511.22, contracts to sell $84.0 million
U.S. dollars for Canadian dollars at an average rate of 1.05, and contracts to sell $8.7 million U.S. dollars for euros at an
average rate of 0.78, all of which mature in 2011.
During 2010, the Company entered into gold forward purchase contracts as follows:
• 91,250 ounces of gold at an average price of $1,126 per ounce which matured in 2010;
• 265,940 ounces of gold at an average price of $1,169 per ounce which mature in 2011;
• 37,695 ounces of gold at an average price of $1,400 per ounce which mature in 2012.
Commensurate with the engagement of these derivatives, the Company has de-designated the gold forward sale contract
hedging relationship for 100% of 2010 maturities, 83% of 2011 maturities and 51% of 2012 maturities.
Additionally the following new forward buy derivative contracts were engaged during 2010:
• $434 million at an average rate of 1.92 Brazilian reais, with maturities in 2010 and 2011;
• $288 million at an average rate of 515 Chilean pesos, with maturities in 2010 and 2011;
• $168 million at an average rate of 32.2 Russian roubles, with maturities in 2010 and 2011;
• $130 million at an average rate of 1.05 Canadian dollars, with maturities in 2010 and 2011;
• $8.7 million at an average rate of 0.78 Euros, which mature in 2011;
• 160,000 barrels of oil at an average rate of $79 per barrel, with maturities in 2010 and 2011.
Subsequent to December 31, 2010, the Company entered into gold forward purchase contracts as follows:
• 40,665 ounces of gold at an average price of $1,364 per ounce which mature in 2011;
• 36,380 ounces of gold at an average price of $1,363 per ounce which mature in 2012.
Commensurate with the engagement of these derivatives, the Company has de-designated the gold forward sale contract
hedging relationship for 96% of all remaining maturities. The remaining 4% of hedging relationships relate to positions that
74
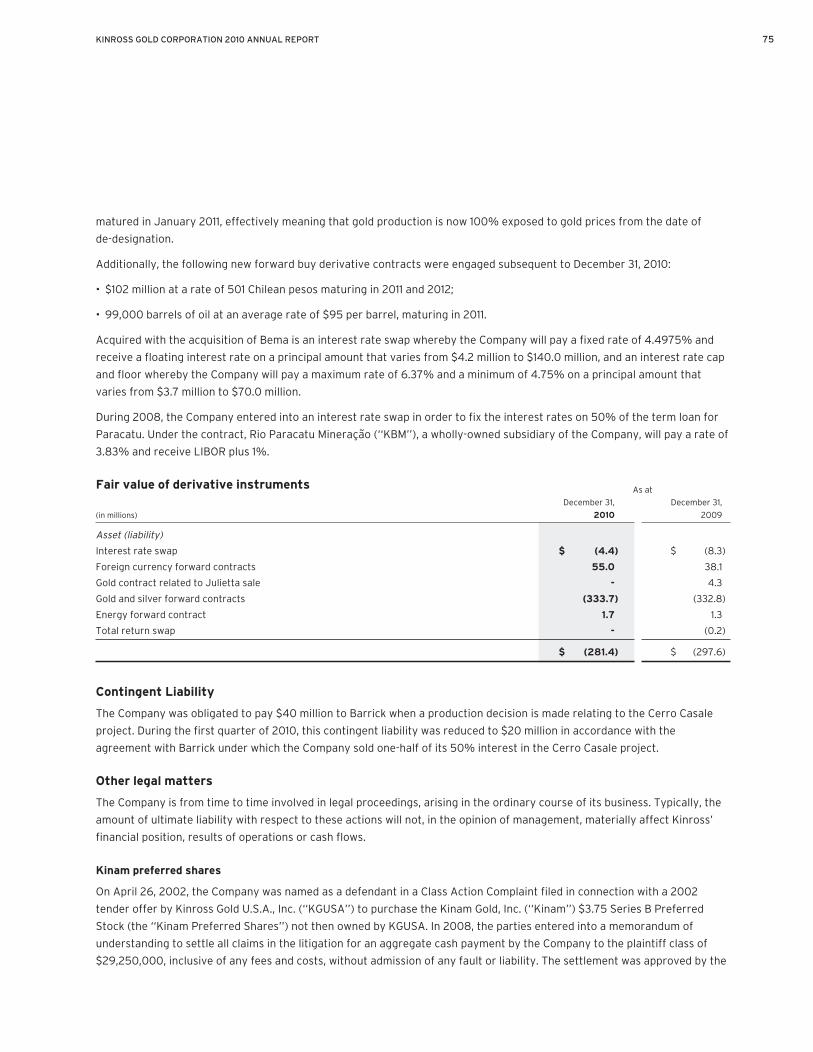
matured in January 2011, effectively meaning that gold production is now 100% exposed to gold prices from the date of
de-designation.
Additionally, the following new forward buy derivative contracts were engaged subsequent to December 31, 2010:
• $102 million at a rate of 501 Chilean pesos maturing in 2011 and 2012;
• 99,000 barrels of oil at an average rate of $95 per barrel, maturing in 2011.
Acquired with the acquisition of Bema is an interest rate swap whereby the Company will pay a fixed rate of 4.4975% and
receive a floating interest rate on a principal amount that varies from $4.2 million to $140.0 million, and an interest rate cap
and floor whereby the Company will pay a maximum rate of 6.37% and a minimum of 4.75% on a principal amount that
varies from $3.7 million to $70.0 million.
During 2008, the Company entered into an interest rate swap in order to fix the interest rates on 50% of the term loan for
Paracatu. Under the contract, Rio Paracatu Mineracao (‘‘KBM’’), a wholly-owned subsidiary of the Company, will pay a rate of
3.83% and receive LIBOR plus 1%.
Fair value of derivative instruments As at
December 31, December 31,
(in millions) 2010 2009
Asset (liability)
Interest rate swap $ (4.4) $ (8.3)
Foreign currency forward contracts 55.0 38.1
Gold contract related to Julietta sale - 4.3
Gold and silver forward contracts (333.7) (332.8)
Energy forward contract 1.7 1.3
Total return swap - (0.2)
$ (281.4) $ (297.6)
Contingent Liability
The Company was obligated to pay $40 million to Barrick when a production decision is made relating to the Cerro Casale
project. During the first quarter of 2010, this contingent liability was reduced to $20 million in accordance with the
agreement with Barrick under which the Company sold one-half of its 50% interest in the Cerro Casale project.
Other legal matters
The Company is from time to time involved in legal proceedings, arising in the ordinary course of its business. Typically, the
amount of ultimate liability with respect to these actions will not, in the opinion of management, materially affect Kinross’
financial position, results of operations or cash flows.
Kinam preferred shares
On April 26, 2002, the Company was named as a defendant in a Class Action Complaint filed in connection with a 2002
tender offer by Kinross Gold U.S.A., Inc. (‘‘KGUSA’’) to purchase the Kinam Gold, Inc. (‘‘Kinam’’) $3.75 Series B Preferred
Stock (the ‘‘Kinam Preferred Shares’’) not then owned by KGUSA. In 2008, the parties entered into a memorandum of
understanding to settle all claims in the litigation for an aggregate cash payment by the Company to the plaintiff class of
$29,250,000, inclusive of any fees and costs, without admission of any fault or liability. The settlement was approved by the
KINROSS GOLD CORPORATION 2010 ANNUAL REPORT 75

United States District Court of Nevada on January 29, 2009. All Kinam Preferred Shares held by persons other than Kinross
are now cancelled pursuant to the settlement. No further dividends will be payable on the Kinam Preferred Shares. As the
Company previously held the preferred shares balance at $10.1 million, this resulted in a charge of $19.1 million during 2008.
7. SUMMARY OF QUARTERLY INFORMATION
2010 2009
(in millions, except per share amounts) Q4 Q3 Q2 Q1 Q4 Q3 Q2 Q1
Metal sales $ 920.4 $ 735.5 $ 696.6 $ 657.6 $ 699.0 $ 582.3 $ 598.1 $ 532.7
Net earnings (loss) $ 210.3 $ 346.9 $ 103.8 $ 110.6 $ 235.6 $ (21.5) $ 19.3 $ 76.5
Basic earnings (loss) per share $ 0.19 $ 0.45 $ 0.15 $ 0.16 $ 0.34 $ (0.03) $ 0.03 $ 0.11
Diluted earnings (loss) per share $ 0.18 $ 0.44 $ 0.15 $ 0.16 $ 0.34 $ (0.03) $ 0.03 $ 0.11
Cash flow provided from operating
activities $ 268.3 $ 271.7 $ 216.4 $ 212.0 $ 306.5 $ 141.9 $ 171.8 $ 165.4
The Company’s results over the past several quarters have been largely driven by increases in the gold equivalent ounces
produced. Additionally, fluctuations in the gold and silver price and foreign exchange rates have impacted results.
During the fourth quarter of 2010, revenue increased to $920.4 million on gold equivalent ounces sold of 696,355 compared
with revenue of $699.0 million on sales of 636,601 gold equivalent ounces during the fourth quarter of 2009. The average
spot price of gold was $1,368 per ounce in the fourth quarter of 2010 compared with $1,100 per ounce in the fourth quarter
of the prior year. Cost of sales increased by 38% to $374.3 million in the final quarter of 2010 versus $271.0 million in the
prior year, largely due to an increase in gold equivalent ounces sold.
On December 13, 2010, the Company completed the sale of its 1.8% interest in Osisko, consisting of approximately 6.8 million
Osisko common shares for net proceeds of $97.5 million. The transaction resulted in a gain of $74.1 million.
In the fourth quarter of 2010, operating cash flows decreased to $268.3 million compared with $306.5 million during the
fourth quarter of 2009 largely due to lower gold equivalent ounces sold and higher accounts receivable and inventory
balances.
8. DISCLOSURE CONTROLS AND PROCEDURES AND INTERNAL CONTROLS OVERFINANCIAL REPORTING
Pursuant to regulations adopted by the US Securities and Exchange Commission, under the Sarbanes-Oxley Act of 2002 and
those of the Canadian Securities Administrators, Kinross’ management evaluates the effectiveness of the design and
operation of the Company’s disclosure controls and procedures, and internal controls over financial reporting. This
evaluation is done under the supervision of, and with the participation of, the President and Chief Executive Officer and the
Chief Financial Officer.
Effective September 17, 2010, the Company acquired 100 percent of the outstanding common shares of Red Back by way of a
plan of arrangement. The results of Red Back’s operations have been included in these consolidated financial statements
since the date of acquisition. However, the Company has not had sufficient time to appropriately assess the internal controls
used by Red Back and integrate them with those of the Company. As a result, the Red Back operations have been excluded in
the Company’s annual assessment of disclosure controls and procedures and internal controls over financial reporting. The
Company is in the process of integrating the Red Back operations and will be expanding its disclosure controls and
procedures and internal control over financial reporting compliance program to include Red Back over the next year.
76

The acquisition date financial information for Red Back is included in the discussion regarding the acquisition contained in
this MD&A and in Note 4 of the consolidated financial statements. A summary of the financial information for Red Back,
expressed in millions of dollars, which was included in the consolidated financial statements of the Company at December 31,
2010, is provided below.
Period ended
December 31,
Financial Data (in millions) 2010
Metal sales $ 194.8
Operating income 20.2
Net assets 894.8
As of the end of the period covered by this MD&A and accompanying audited financial statements, Kinross’ management
evaluated the effectiveness of its disclosure controls and procedures and internal control over financial reporting. Based on
that evaluation and subject to the scope exclusion described above, the President and Chief Executive Officer and the Chief
Financial Officer have concluded that Kinross’ disclosure controls and procedures and internal controls over financial
reporting were effective as at December 31, 2010. There have not been any significant changes in internal controls for 2010
other than as noted below.
During 2010, Maricunga converted to the ERP system that has been utilized by La Coipa. Management employed appropriate
procedures to ensure internal controls were in place during and after the conversion.
9. INTERNATIONAL FINANCIAL REPORTING STANDARDS
Effective January 1, 2011, International Financial Reporting Standards (‘‘IFRS’’) is replacing Canadian GAAP for publicly
accountable enterprises. As a result, Kinross will report under IFRS for interim and annual periods beginning January 1, 2011,
with comparative information for 2010 restated under IFRS. Adoption of IFRS as Canadian GAAP requires the Company to
make certain accounting policy choices that impact our reported financial position and results of operations. Our goal has
been to make policy changes that are compliant with IFRS but also provide the most meaningful information to our
shareholders.
The Company developed a changeover plan which includes the following three phases and sets out activities to be
performed in each phase over the life of the project.
• Assessment phase: In this phase, the Company formed a Steering Committee, established a project management team
and a working group, developed an initial project plan, and identified high level differences between Canadian GAAP and
IFRS that may impact the Company. This phase was completed in Q1 2009.
• Design phase: This phase involved the development of a detailed project plan, the completion of site visits, the completion
of analyses of the differences between Kinross accounting policies and IFRS to provide a basis for accounting policy
recommendations, the establishment of an IFRS Accounting Policy Committee, completion of an IT systems impact
analysis and the development of a strategy for dual Canadian GAAP and IFRS reporting during 2010 and changeover to
IFRS in 2011, assessment of the impact of accounting and other business process changes on internal controls, the review
of compensation arrangements, debt agreements and other contractual arrangements, and the delivery of detailed IFRS
training to key finance and other personnel. This phase was substantially completed in Q2 2010.
• Implementation phase: This phase involves the implementation of the necessary changes to our information systems and
business processes as identified through the assessment and design phases of the changeover plan. Significant
KINROSS GOLD CORPORATION 2010 ANNUAL REPORT 77

implementation phase milestones include the development of IFRS-compliant financial models, budgeting and reporting
processes, the implementation of our 2010 dual reporting systems strategy, the amendment and testing of internal
controls over financial reporting and disclosure controls and procedures impacted by accounting policy changes, the
implementation of our internal and external communication plans, and the preparation of a January 1, 2010 opening
balance sheet and 2010 comparative data under IFRS, with reconciliations from Canadian GAAP. The implementation
phase will culminate in the preparation of our financial reporting under IFRS in 2011.
During the fourth quarter of 2010, the Company continued to execute on the implementation phase of its changeover plan.
During this period, specific project milestones achieved include: further progression in the identification and amendment of
internal controls over financial reporting and business processes impacted by IFRS; further progression in determining and
selecting accounting policies; further progression in the development of the Company’s IFRS Accounting Policy Manual;
further progression in the preparation of draft annual mock-up financial statements and notes under IFRS; completion of the
preliminary conversion of the March 31, 2010 and June 30, 2010 Canadian GAAP financial statements to draft IFRS financial
statements; and progression in the preliminary conversion of the September 30, 2010 Canadian GAAP financial statements
to draft IFRS financial statements. Updates regarding the progress of the IFRS changeover project are provided to the
Company’s Audit and Risk Committee on a quarterly basis.
Our draft IFRS opening balance sheet as at January 1, 2010 is presented in section II below and reflects the impact of
accounting policy changes from those applied under Canadian GAAP and first-time adoption elections applied in our
transition to IFRS. The opening balance sheet is preliminary and unaudited and may require other adjustments relating to
new IFRS pronouncements or other changes identified subsequent to the date of this MD&A.
In addition, in completing the preliminary conversion of our March 31, 2010 and June 30, 2010 financial statements to draft
IFRS financial statements, we have completed a preliminary assessment of the impact of the conversion to IFRS on our
balance sheets at March 31, 2010 and June 30, 2010 and on our statements of operations for the three months ended
March 31, 2010 and for the three and six months ended June 30, 2010. Reconciliations for these financial statements are
presented below and are preliminary and unaudited. As applicable, the discussions below are referenced to the
reconciliations provided.
As we complete the implementation phase, and as changes to IFRS standards may continue to occur, the differences and
impacts described below may be subject to change.
I) First time adoption
The Company’s adoption of IFRS requires the application of IFRS 1 First-time Adoption of International Financial Reporting
Standards (‘‘IFRS 1’’) which provides guidance for an entity’s initial adoption of IFRS. IFRS 1 generally requires that an entity
apply all IFRS effective at the end of its first IFRS reporting period retrospectively, with specific mandatory exceptions and a
number of optional exemptions.
Significant first-time adoption optional exemptions chosen by the Company relate to the following. The impact of these
exemptions is discussed below.
• Borrowing Costs
• Reclamation and remediation obligations included in the cost of property, plant and equipment; and
• Business combinations (see Section II ‘‘Other Significant IFRS Accounting Policies’’).
78

(a) Borrowing costs
IFRS 1 permits entities to apply IAS 23 Borrowing Costs (‘‘IAS 23’’) prospectively from the transition date under certain
circumstances. The alternative to this election would be to retrospectively restate borrowing costs previously capitalized to
comply with IFRS requirements in addition to capitalizing borrowing costs in accordance with IFRS prospectively from the
Company’s transition date of January 1, 2010. We elected the borrowing costs exemption, and applied IAS 23 prospectively
from January 1, 2010. In effecting this election, we reversed the carrying value of previously capitalized borrowing costs as
determined under the Company’s previous Canadian GAAP accounting policy for such costs on January 1, 2010 with an
adjustment to the Company’s opening deficit.
The reversal of previously capitalized borrowing costs resulted in a reduction in the carrying value of Property, plant and
equipment of $59.5 million in the Company’s opening balance sheet. This adjustment resulted in an increase in the
Company’s opening deficit of $38.8 million, net of related income tax of $15.2 million and non-controlling interest of
$5.5 million.
During the three months ended March 31, 2010, the accounting under IFRS resulted in decreases of $2.1 million in
Depreciation, depletion and amortization; $0.7 million in Property, plant and equipment; and $0.1 million in Deferred tax
liabilities and Income tax expense. Interest expense included in Finance expense increased by $2.8 million and income
attributed to non-controlling interest and non-controlling interest were each increased by $0.3 million.
During the three months ended June 30, 2010, the accounting under IFRS resulted in decreases of $2.2 million in
Depreciation, depletion and amortization; $0.8 million in Property, plant and equipment; and $0.2 million in Deferred tax
liabilities and Income tax expense. Interest expense included in Finance expense increased by $3.0 million and income
attributed to non-controlling interest and non-controlling interest were each increased by $0.5 million.
During the six months ended June 30, 2010, the accounting under IFRS resulted in decreases of $4.3 million in Depreciation,
depletion and amortization; $1.5 million in Property, plant and equipment; and $0.3 million in each of Deferred tax liabilities
and Income tax expense. Interest expense included in Finance expense increased by $5.8 million and income attributed to
non-controlling interest and non-controlling interest were each increased by $0.8 million.
(b) Provision for reclamation and remediation (asset retirement obligations)
IFRS 1 provides an optional exemption from the full retrospective application of decommissioning liabilities (provisions for
reclamation and remediation), which allows entities to re-measure provisions on the transition date under IAS 37 Provisions,
Contingent Liabilities and Contingent Assets (‘‘IAS 37’’) and estimate the amount to be included in the cost of the related
asset by discounting the liability to the date at which it first arose. The alternative to this election, retrospective application,
would require the Company to estimate its provision for reclamation and remediation at the original date incurred and
reflect changes in estimates and discount rates through to the date of transition to IFRS. We elected the optional exemption
and applied IAS 37 to our provision for reclamation and remediation on a prospective basis from January 1, 2010. Under
Canadian GAAP, the Company records a provision for reclamation and remediation based on the estimated amount to be
paid out at the time of decommissioning discounted to the current date using a credit adjusted risk free rate. Subsequent to
a provision for reclamation and remediation being recorded, changes to the estimated liability, other than accretion, are
recorded only as a result of changes in the timing or amount of future cash flows to settle the obligations. IFRS requires the
Company to recognize a provision based on the estimated amount to be paid out at the time of decommissioning, discounted
using a pre-tax discount rate that reflects the market’s assessment of the time value of money and the risks specific to the
liability at the reporting date. IFRS also requires changes in the liability to be recorded each period based on changes in
discount rates in addition to changes in estimated timing or amount of future cash flows.
KINROSS GOLD CORPORATION 2010 ANNUAL REPORT 79

Under Canadian GAAP, the Company recognizes the accretion related to the decommissioning liability as an operating
expense. IFRS requires the accretion to be recognized within finance expense.
The Company’s provision for reclamation and remediation was increased by $163.4 million in the opening balance sheet on
transition to IFRS. The application of the exemption described above resulted in an increase of $85.4 million to the carrying
value of Property, plant and equipment in the opening balance sheet. These adjustments resulted in an increase in the
Company’s opening deficit of $59.0 million, net of related income tax of $18.5 million and non-controlling interest of
$0.5 million. During the three months ended March 31, 2010, the accounting under IFRS resulted in an increase of
$2.3 million in Depreciation, depletion and amortization with a corresponding decrease in Property, plant and equipment.
Finance expense (accretion) decreased by $1.8 million, and both net earnings attributed to non-controlling interest and
non-controlling interest decreased by $0.1 million. Income tax expense and Deferred income tax liabilities both decreased by
$0.2 million.
During the three months ended June 30, 2010, the accounting under IFRS resulted in an increase of $1.8 million in
Depreciation, depletion and amortization with a corresponding decrease in Property, plant and equipment. Finance expense
(accretion) and provisions decreased by $1.8 million, and both net earnings attributed to non-controlling interest and
non-controlling interest decreased by $0.1 million. Income tax expense and Deferred income tax liabilities both decreased by
$0.2 million.
During the six months ended June 30, 2010, the accounting under IFRS resulted in an increase of $4.1 million in Depreciation,
depletion and amortization with a corresponding decrease in Property, plant and equipment. Finance expense (accretion)
and provisions decreased by $3.6 million, and both net earnings attributed to non-controlling interest and non-controlling
interest decreased by $0.2 million. Income tax expense and Deferred income tax liabilities both decreased by $0.4 million.
(c) Exploration and evaluation
Under CDN GAAP, except in the case of acquired exploration assets, exploration and evaluation costs incurred prior to
establishing proven and probable reserves for an exploration property or to expand existing properties are expensed as
incurred. Once proven and probable reserves for a project have been established and the Company determines that the
property can be economically developed, further exploration and evaluation costs are capitalized prospectively. Under IFRS,
except in the case of acquired exploration assets, exploration and evaluation costs are expensed as incurred until such time
as the Company expects that mineral resources will be converted to mineral reserves within a reasonable period. Thereafter,
exploration and evaluation costs are capitalized prospectively. Acquired exploration assets are always capitalized.
On transition to IFRS, in the opening balance sheet, the change in accounting policy resulted in an increase of $74.4 million
in Property, plant and equipment and $9.6 million in Deferred tax liabilities and a decrease of $63.1 million in the opening
deficit. Non-controlling interest increased by $1.7 million.
During the three months ended March 31, 2010, the accounting under IFRS resulted in increases of $10.4 million in Property
plant and equipment, $1.5 million in Depreciation, depletion and amortization and $0.4 million in Deferred tax liabilities.
Other operating costs and Exploration and business development expenses decreased by $6.6 million and $5.3 million,
respectively. Income tax expense increased by $0.4 million. In addition, net earnings attributed to non-controlling interest
and non-controlling interest both increased by $0.1 million.
During the three months ended June 30, 2010, the accounting under IFRS resulted in increases of $15.4 million in Property
plant and equipment, $1.2 million in Depreciation, depletion and amortization and $1.4 million in Deferred tax liabilities. Other
operating costs and Exploration and business development expenses decreased by $8.5 million and $8.1 million, respectively.
80
Income tax expense increased by $1.4 million. In addition, net earnings attributed to non-controlling interest and
non-controlling interest both increased by $0.6 million.
During the six months ended June 30, 2010, the accounting under IFRS resulted in increases of $25.8 million in Property
plant and equipment, $2.7 million in Depreciation, depletion and amortization and $1.8 million in Deferred tax liabilities. Other
operating costs and Exploration and business development expenses decreased by $15.1 million and $13.4 million,
respectively. Income tax expense increased by $1.8 million. In addition, net earnings attributed to non-controlling interest
and non-controlling interest both increased by $0.7 million.
(d) Convertible notes
Under Canadian GAAP, the value of the convertible notes consists of a debt component and an equity component. On initial
recognition, the fair value of the debt component was determined, and the difference between the proceeds and the fair
value of the debt component was treated as equity. Subsequent to initial recognition, the debt component is accreted to its
face value using the effective interest method. The equity component is not revalued. Under IFRS, the conversion options
attached to the convertible notes are embedded derivatives that the Company has the option to settle in cash upon
conversion and so are treated as liabilities. In addition, because these embedded derivatives are not closely related to the
underlying debt, they must be separated from the underlying debt and classified as a derivative liability. On initial
recognition, this derivative liability was measured at fair value. The difference between the proceeds of the convertible debt
and the fair value of the derivative liability was determined to be the carrying value of the underlying debt. Subsequent to
initial recognition, the derivative liability is recorded at fair value each reporting period with changes in its fair value being
recognized in the consolidated statement of operations. The underlying debt is accreted to its face value using the effective
interest method.
The accounting under IFRS resulted in an opening balance sheet adjustment to increase Unrealized fair value of derivative
liabilities by $77.2 million, decrease Long-term debt by $39.4 million, and decrease Contributed surplus by $76.6 million. As
a result, the opening deficit decreased by $38.8 million.
During the three months ended March 31, 2010, the accounting under IFRS resulted in an increase of $19.0 million in income
included in Other income (expense) with a corresponding decrease in Unrealized fair value of derivative liabilities. Finance
expense increased by $2.5 million in with a corresponding increase in Long-term debt.
During the three months ended June 30, 2010, the accounting under IFRS resulted in an increase of $16.3 million in income
included in Other income (expense) with a corresponding decrease in Unrealized fair value of derivative liabilities; Finance
expense increased by $2.7 million with a corresponding increase in Long-term debt.
For the six months ended June 30, 2010, the accounting under IFRS resulted in an increase of $35.3 million in income
included in Other income (expense) with a corresponding decrease in Unrealized fair value of derivative liabilities. Finance
expense increased by $5.2 million with a corresponding increase in Long-term debt.
(e) Warrants
Under Canadian GAAP, the Company accounts for its Canadian dollar denominated warrants, primarily related to the Bema
and Aurelian acquisitions, as equity instruments. IFRS requires that warrants denominated in a currency other than the
functional currency of the issuer be classified as liabilities and fair valued each period unless they are issued pro rata to all
existing shareholders, in which case they would be classified as equity. As such, upon adoption of IFRS, our outstanding
Canadian dollar denominated warrants were reclassified as liabilities and revalued to fair value, with the changes in value
being recorded in Accumulated deficit. Subsequent changes in fair value are recorded in the statement of operations.
KINROSS GOLD CORPORATION 2010 ANNUAL REPORT 81

The impact of this change on the opening balance sheet is an increase in the Company’s current liabilities of $83.6 million, a
decrease in common share capital of $68.8 million, and an increase in the opening deficit of $14.8 million.
During the three months ended March 31, 2010, the accounting under IFRS resulted in an increase of $21.9 million in income
included in Other income (expense) with a corresponding decrease in Current portion of unrealized fair value of derivative
liabilities, representing a decrease in the fair value of the warrants as determined under IFRS.
During the three months ended June 30, 2010, the accounting under IFRS resulted in an increase of $1.3 million in income
included in Other income (expense) with a corresponding decrease in Current portion of unrealized fair value of derivative
liabilities, representing a decrease in the fair value of the warrants as determined under IFRS.
During the six months ended June 30, 2010, the accounting under IFRS resulted in an increase of $23.2 million in income
included in Other income (expense) with a corresponding decrease in current portion of Unrealized fair value of derivative
liabilities, representing a decrease in the fair value of the warrants as determined under IFRS.
(f) Income taxes
Under Canadian GAAP, when an asset is acquired other than in a business combination and the tax basis of that asset is less
than or more than its cost, the cost or benefit of future income taxes recognized at the time of acquisition is added to or
deducted from the cost of the asset and the future tax liability or asset recognized. Under IFRS, a deferred tax liability or
asset is not recognized if it arises from the initial recognition of an asset or liability in a transaction that is not a business
combination.
The accounting under IFRS related to assets acquired other than in a business combination resulted in an opening balance
sheet adjustment to decrease Property, plant and equipment by $262.8 million and future income tax liabilities by
$236.1 million. The difference of $26.7 million was an increase to the opening deficit.
In addition, under Canadian GAAP, in the determination of temporary differences of non-monetary assets and liabilities, the
temporary differences computed in local currency are multiplied by the appropriate tax rate. The resulting future tax
amount is then translated into the Company’s functional currency if it is different from the local currency. Under IFRS, in the
determination of temporary differences, the carrying value of non-monetary assets and liabilities is translated into the
functional currency at the historical rate and compared to its tax value translated into the functional currency at the current
rate. The resulting temporary difference (measured in the functional currency) is then multiplied by the appropriate tax rate
to determine the related deferred tax balance.
The accounting under IFRS related to the determination of temporary differences of foreign currency non-monetary assets
and liabilities resulted in an opening balance sheet adjustment to decrease future income taxes and the opening deficit by
approximately $98 million on transition to IFRS.
In addition, other changes in determination of timing differences under IFRS resulted in a decrease to future tax liabilities of
$33.4 million, with a corresponding decrease to the opening deficit.
During the three months ended March 31, 2010 and the three and six months ended June 30, 2010, the impact of the
accounting differences described above and other IFRS related adjustments are as follows.
During the three months ended March 31, 2010, Income tax expense was increased by $13.1 million. Current tax payable was
increased by $2.3 million and Deferred tax liabilities were increased by $12.2 million. In addition, Accounts payable and
accrued liabilities and Production costs both decreased by $2.6 million, and expenses included in Other income (expense)
were increased by $1.4 million.
82

During the three months ended June 30, 2010, Income tax expense was increased by $12.9 million. Current tax payable was
increased by $1.2 million and Deferred tax liabilities were increased by $18.0 million. In addition, Accounts payable and
Production costs both decreased by $1.5 million, and expenses included in Other income (expense) were increased by
$6.3 million.
For the six months ended June 30, 2010, Income tax expense was increased by $26.0 million. Current tax payable was
increased by $3.5 million and Deferred tax liabilities increased were increased by $30.2 million. In addition, Accounts payable
and Production costs both decreased by $4.1 million, and expenses included in Other income (expense) were increased by
$7.7 million.
(g) Equity method investments
Under Canadian GAAP, the Company determines whether it has significant influence over an investment based primarily on
its current ownership of voting interests. Under IFRS, the determination of significant influence is based on presently
exercisable potential voting rights in addition to current ownership interests. Under both Canadian GAAP and IFRS, where
the percentage of voting interests determined as described above is below 20%, other factors are considered to determine
if significant influence exists by virtue of other terms.
On transition, we recorded an adjustment to increase the carrying value of Long-term investments by $16.3 million in the
Company’s opening balance sheet as a result of the change in classification of an investment from equity method to
available-for-sale. As a result, the opening deficit was decreased by $16.3 million.
During the three months ended March 31, 2010, the accounting under IFRS resulted in an increase of $7.4 million in
Long-term investments and an increase of $5.7 million in Accumulated other comprehensive income. Equity in losses of
associates was decreased by $1.7 million relating to the reversal of the equity losses in the associate under Canadian GAAP.
During the three and six months ended June 30, 2010, the accounting under IFRS resulted in decreases in Equity in losses of
associates of $0.2 million and $1.9 million, respectively.
At June 30, 2010, the investment was reclassified as available for sale under Canadian GAAP. As a result, at June 30, 2010,
the opening IFRS adjustment was reversed and Accumulated other comprehensive loss was increased by $18.2 million.
(h) Interest in joint ventures
Under Canadian GAAP, following a partial disposition of an investment where joint control is lost and the investment is to be
accounted for using the equity method, the gain or loss on disposal is calculated as the difference between the net proceeds
from the partial disposal and the carrying value of the investment disposed of. The retained interest in the investment is
transferred to an equity method investment at its carrying value. Under IFRS, in accordance with IAS 31 ‘‘Interests in Joint
Ventures’’, when a jointly controlled entity becomes an associate as a result of a partial disposal, the investment retained is
remeasured to fair value. As a result, the gain or loss on disposal is equal to the difference between the net proceeds and the
carrying value for the interest disposed of plus the difference between the fair value of the retained interest and its carrying
value prior to the disposal. There is no impact of this difference on the opening balance sheet on transition to IFRS.
On March 31, 2010, Kinross sold one half of its 50% interest in the Cerro Casale project, which was accounted for as a joint
venture. As a result of the sale, the Company’s interest was accounted for as an investment in an associate prospectively
from March 31, 2010. The accounting under IFRS for the transfer from a joint venture to an investment in an associate
resulted in an increase of $41.4 million in Investments in associates with a corresponding increase in income included in
Other income (expense) related to the difference between the fair value of the retained interest in Cerro Casale and its
carrying value prior to the disposition. Income tax expense and Deferred tax liabilities were each increased by $7.0 million.
KINROSS GOLD CORPORATION 2010 ANNUAL REPORT 83

(i) Impairment of property, plant and equipment
Under Canadian GAAP, whenever the estimated future cash flows on an undiscounted basis of a property is less than the
carrying amount of the property, an impairment loss is measured and recorded based on fair values. Under IFRS, IAS 36
Impairment of Assets (‘‘IAS 36’’) requires an impairment charge to be recognized if the recoverable amount, determined as
the higher of the estimated fair value less costs to sell or value in use, is less than the carrying amount. The impairment
charge under IFRS is equal to the amount by which the carrying amount exceeds the recoverable amount. The difference in
testing and determining an impairment may result in more frequent impairment charges, where carrying values of assets
may have been supported under Canadian GAAP on an undiscounted cash flow basis, but cannot be supported on a
discounted cash flow basis.
IAS 36 also requires the reversal of any previous impairment losses where circumstances requiring the impairment charge
have changed and reversed. Canadian GAAP does not permit the reversal of impairment losses in any circumstance. We
recorded an adjustment to increase the carrying value of Property, plant and equipment by $9.3 million on the Company’s
opening balance sheet as a result of reversal of a previously recorded impairment charge. The corresponding decrease to
opening deficit on transition to IFRS is $6.8 million net of related income taxes of $2.5 million.
During the three months ended March 31, 2010, no adjustment was required.
For the three and six months ended June 30, 2010, the accounting under IFRS resulted in an increase to Depreciation,
depletion and amortization of $3.5 million with a corresponding decrease in Property, plant and equipment.
(j) Share based payments
Under Canadian GAAP, stock options and restricted share units issued under the Company’s share-based compensation
plans that vest in equal increments over a number of periods, typically three years, are treated as a single grant for purposes
of valuation. The value of the grant is then amortized evenly over the vesting period.
Under IFRS, where options and restricted share units vest over a number of periods, each vesting amount is valued as a
separate tranche and each tranche is amortized over its individual vesting period. The result of the treatment under IFRS as
compared with Canadian GAAP is generally to accelerate the recognition of compensation costs.
On transition, the accounting under IFRS resulted in a decrease of $0.9 million in Accounts payable and accrued liabilities
and increases of $14.4 million in Contributed surplus and $13.5 million in the opening deficit.
During the three months ended March 31, 2010, the accounting under IFRS resulted in increases of $0.7 million in General
and administrative expense, $0.2 million in Accounts payable and accrued liabilities and $0.5 million in Contributed surplus.
During the three months ended June 30, 2010, the accounting under IFRS resulted in a decrease of $0.1 million in General
and administrative expense and increases of $0.3 million in Accounts payable and accrued liabilities and a decrease of
$0.4 million in Contributed surplus.
During the six months ended June 30, 2010, the accounting under IFRS resulted in increases of $0.6 million in General and
administrative expense, $0.5 million in Accounts payable and accrued liabilities and $0.1 million in Contributed surplus.
(k) Other
Other IFRS adjustments recorded on transition resulted in increases of $5.6 million in Provisions and $6.1 million in
Accumulated deficit, and decreases of $1.2 million in Deferred tax liabilities and $1.7 million in Accumulated other
comprehensive loss.
84
II) Other significant IFRS accounting policies
The following accounting policy changes did not result in adjustments to the Company’s opening balance sheet and did not
impact Company’s operating results for the six months ended June 30, 2010.
Business combinations
IFRS 1 permits companies to apply IFRS 3 Business Combinations (‘‘IFRS 3’’) prospectively to business combinations
occurring on or after the transition date, being January 1, 2010 for the Company. As a result of applying this election, the
Company will restate any business combinations effected during the 2010 year which were originally reported under
Canadian GAAP, for comparative reporting in 2011. The alternative, retrospective application of IFRS 3, would have required
the restatement of all business combinations occurring prior to the date of transition to IFRS in addition to those occurring
on or after January 1, 2010.
The election of this exemption, however, did not preclude the Company from assessing its assets that were acquired and
liabilities assumed through business combinations occurring prior to the Company’s transition date to comply with IFRS
requirements in establishing the Company’s opening balance sheet at January 1, 2010.
We elected the business combinations exemption under IFRS 1 and adopted IFRS 3 prospectively beginning on January 1,
2010 and as such did not restate business combinations effected prior to the transition to IFRS.
In addition, there are several differences between currently effective Canadian GAAP, CICA 1581 Business Combinations, and
IFRS 3. The differences that we expect may have a significant impact on the Company’s accounting for business
combinations occurring after January 1, 2010 are:
• Valuation of equity securities issued by an acquirer in a business combination - the Company currently values such
securities by reference to their market price around the date the terms of the acquisition are agreed to and announced.
Under IFRS, the valuation of equity securities issued by an acquirer in a business combination must be valued by reference
to their market price on the closing date.
• Transaction costs - the Company currently capitalizes direct, incremental acquisition related costs in the cost of the
acquisition. Under IFRS, acquisition related costs paid to third parties are excluded from the capitalized cost of acquisition,
and expensed by the acquirer.
• Restructuring costs - the Company currently recognizes provisions for restructuring associated with the acquiree’s
operations as assumed liabilities at the date of acquisition in a business combination if certain conditions are met. Under
IFRS, only those restructuring costs meeting the criteria for recognition by the acquiree can be recorded as a liability
assumed at the date of acquisition in a business combination.
As a result of the differences in the determination of the purchase price under IFRS, we expect to record an increase in the
purchase price of our acquisition of Red Back as at September 17, 2010 by $1,361.8 million to $8,720.4 million.
Goodwill
Under Canadian GAAP, the Company currently recognizes exploration potential acquired in a business combination (referred
to as ‘‘Expected Additional Value’’ or ‘‘EAV’’) within goodwill. IFRS requires that exploration potential be classified separately
from goodwill. As a result of the use of the optional exemption related to business combinations, exploration potential
currently recognized within goodwill remained as goodwill on the date of transition and goodwill was assessed for
impairment in accordance with IFRS. We intend to recognize exploration potential acquired in business combinations
KINROSS GOLD CORPORATION 2010 ANNUAL REPORT 85

effected on or after January 1, 2010 as part of the value beyond proven and probable (‘‘VBPP’’) within Property, plant
and equipment.
As the Company’s goodwill balance will not include exploration potential acquired in business combinations on or after
January 1, 2010 under IFRS, the Company has adopted a new goodwill impairment model. This model uses a net asset
valuation (‘‘NAV’’) multiple methodology which applies a market multiple to the estimated present value of future cash flows
for the Company’s cash generating units to which goodwill is allocated. The resulting fair value estimate is then compared to
the carrying value of the cash generating unit to determine and measure any impairment.
On transition to IFRS, we did not record any goodwill impairment charges on the Company’s opening balance sheet.
In addition, as a result of the difference in classification of EAV, we expect to record an adjustment to reallocate the EAV
acquired in our acquisition of Red Back from goodwill to mineral interests within property, plant and equipment.
86

Kinross Gold CorporationReconciliation of Consolidated Balance SheetAs at January 1, 2010(Unaudited, expressed in millions of United States dollars)
CDN IFRS Re-
CDN GAAP Accounts Reference GAAP adjustments classifications IFRS IFRS Accounts
Assets AssetsCurrent assets Current assets
Cash, cash equivalents and short-term $ 632.4 $ - $ (35.0) $ 597.4 Cash and cash equivalentsinvestments
Restricted Cash 24.3 - - 24.3 Restricted cash- - 35.0 35.0 Short term investments
Accounts receivable and other assets 135.5 - - 135.5 Accounts receivable and other assetsInventories 554.4 - - 554.4 InventoriesUnrealized fair value of derivative 44.3 - - 44.3 Unrealized fair value of derivative
assets assets
1,390.9 - - 1,390.9Non-current assets
Property, plant and equipment (a)(b)(c)(f)(i) 4,989.9 (153.2) - 4,836.7 Property, plant and equipmentGoodwill 1,179.9 - - 1,179.9 GoodwillLong-term investments (g) 292.2 16.3 (150.7) 157.8 Long-term investments
- 150.7 150.7 Investments in associates and workinginterests
- - - - Deferred tax assetsUnrealized fair value of derivative assets 1.9 - - 1.9 Unrealized fair value of derivative
assetsDeferred charges and other long-term 158.4 - - 158.4 Deferred charges and other long-term
assets assets
$ 8,013.2 $ (136.9) $ - $ 7,876.3
Liabilities LiabilitiesCurrent liabilities Current liabilities
Accounts payable and accrued (j) $ 312.9 $ (0.9) $ (24.4) $ 287.6 Accounts payable and accruedliabilities liabilities
- - 24.4 24.4 Current tax payableCurrent portion of long-term debt 177.0 - - 177.0 Current portion of long-term debtCurrent portion of reclamation and 17.1 - - 17.1 Current portion of provisions
remediation obligationsCurrent portion of unrealized fair (e) 131.0 83.6 - 214.6 Current portion of unrealized fair
value of derivative liabilities value of derivative liabilities
638.0 82.7 - 720.7Non-current liabilities
Long-term debt (d) 515.2 (39.4) - 475.8 Long-term debt(b)(k) - 169.0 279.5 448.5 Provisions
(d) - 77.2 212.8 290.0 Unrealized fair value of derivativeliabilities
Other long-term liabilities 543.0 - (492.3) 50.7 Other long-term liabilitiesFuture income and mining taxes (a)(b)(c)(f)(i)(k) 624.6 (390.3) - 234.3 Deferred tax liabilities
2,320.8 (100.8) - 2,220.0
Non-controlling interest 132.9 - (132.9) -Equity
Common shareholders’ equity Common shareholders’ equityCommon share capital and common (e) 6,448.1 (68.8) - 6,379.3 Common share capital and common
share purchase warrants share purchase warrantsContributed surplus (d)(j) 169.6 (62.2) - 107.4 Contributed surplusAccumulated deficit (838.1) 97.5 - (740.6) Accumulated deficitAccumulated other comprehensive (k) (220.1) 1.7 - (218.4) Accumulated other comprehensive
loss loss
5,559.5 (31.8) - 5,527.7(a)(b)(c) (4.3) 132.9 128.6 Non-controlling interest
5,559.5 (36.1) 132.9 5,656.3
$ 8,013.2 $ (136.9) $ - $ 7,876.3
KINROSS GOLD CORPORATION 2010 ANNUAL REPORT 87

Kinross Gold CorporationReconciliation of Consolidated Balance SheetAs at March 31, 2010(Unaudited, expressed in millions of United States dollars)
CDN IFRS Re-
CDN GAAP Accounts Reference GAAP adjustments classifications IFRS IFRS Accounts
Assets AssetsCurrent assets Current assets
Cash, cash equivalents and short-term $ 1,091.1 $ - $ (25.0) $ 1,066.1 Cash and cash equivalentsinvestments
Restricted Cash 46.3 - - 46.3 Restricted cash- - 25.0 25.0 Short term investments
Accounts receivable and other assets 143.6 - - 143.6 Accounts receivable and other assetsInventories 528.4 - - 528.4 InventoriesUnrealized fair value of derivative 42.2 - - 42.2 Unrealized fair value of derivative
assets assets
1,851.6 - - 1,851.6Non-current assets
Property, plant and equipment (a)(b)(c)(f)(i) 4,402.8 (145.8) - 4,257.0 Property, plant and equipmentGoodwill 818.9 - - 818.9 GoodwillLong-term investments (g) 718.9 22.0 (556.4) 184.5 Long-term investments
(h) - 43.1 556.4 599.5 Investments in associates and workinginterests
- - - - Deferred tax assetsUnrealized fair value of derivative assets 7.5 - - 7.5 Unrealized fair value of derivative
assetsDeferred charges and other long-term 179.9 - - 179.9 Deferred charges and other long-term
assets assets
$ 7,979.6 $ (80.7) $ - $ 7,898.9
Liabilities LiabilitiesCurrent liabilities Current liabilities
Accounts payable and accrued (j) $ 290.6 $ (3.3) $ (59.6) $ 227.7 Accounts payable and accruedliabilities liabilities
(f) - 2.3 59.6 61.9 Current tax payableCurrent portion of long-term debt 132.6 - - 132.6 Current portion of long-term debtCurrent portion of reclamation and 15.9 - - 15.9 Current portion of provisions
remediation obligationsCurrent portion of unrealized fair (e) 148.8 61.7 - 210.5 Current portion of unrealized fair
value of derivative liabilities value of derivative liabilities
587.9 60.7 - 648.6Non-current liabilities
Long-term debt (d) 507.4 (36.9) - 470.5 Long-term debt(b)(k) - 167.2 287.7 454.9 Provisions
(d) - 58.2 178.0 236.2 Unrealized fair value of derivativeliabilities
Other long-term liabilities 517.7 - (465.7) 52.0 Other long-term liabilitiesFuture income and mining taxes (a)(b)(c)(f)(i)(k) 529.6 (371.0) - 158.6 Deferred tax liabilities
2,142.6 (121.8) - 2,020.8
Non-controlling interest 150.6 - (150.6) -Equity
Common shareholders’ equity Common shareholders’ equityCommon share capital and common (e) 6,463.0 (68.8) - 6,394.2 Common share capital and common
share purchase warrants share purchase warrantsContributed surplus (d) 165.7 (61.7) - 104.0 Contributed surplusAccumulated deficit (762.3) 168.2 - (594.1) Accumulated deficitAccumulated other comprehensive (k) (180.0) 7.4 - (172.6) Accumulated other comprehensive
loss loss
5,686.4 45.1 - 5,731.5(a)(b)(c) - (4.0) 150.6 146.6 Non-controlling interest
5,686.4 41.1 150.6 5,878.1
$ 7,979.6 $ (80.7) $ - $ 7,898.9
88

Kinross Gold CorporationReconciliation of Consolidated Statement of OperationsThree months ended March 31, 2010(Unaudited, expressed in millions of United States dollars)
CDN IFRS Re-
CDN GAAP Accounts Reference GAAP adjustments classifications IFRS IFRS Accounts
Revenue Revenue
Metal sales $ 657.6 $ - $ - $ 657.6 Metal sales
Operating costs and expenses Cost of sales
Cost of sales (excludes reclamation, (f) 277.4 (2.6) - 274.8 Production costs
depreciation and amortization)
Accretion and reclamation expense 5.2 - (5.2) -
Depreciation, depletion and (a)(b)(c)(i) 128.9 1.7 - 130.6 Depreciation, depletion and
amortization amortization
411.5 (0.9) (5.2) 405.4 Total Cost of sales
246.1 0.9 5.2 252.2 Gross Profit
Other operating costs (c) 6.2 (6.6) - (0.4) Other operating costs
Exploration and business development (c) 18.2 (5.3) - 12.9 Exploration and business development
General and administrative (j) 28.3 0.7 - 29.0 General and administrative
Operating earnings 193.4 12.1 5.2 210.7 Operating earnings
Other income (expense) - net (d)(e)(f)(h) 24.1 80.9 8.6 113.6 Other income (expense) - net
(g) - 1.7 (3.2) (1.5) Equity in losses of associates
- - 0.7 0.7 Finance income
(a)(b)(d) - (3.5) (13.3) (16.8) Finance expense
Earnings before taxes and other items 217.5 91.2 (2.0) 306.7 Earnings before taxes
Income and mining taxes expense - net (a)(b)(c)(f)(h) (78.8) (20.2) (1.2) (100.2) Income tax expense - net
Equity in losses of associated companies (3.2) - 3.2 -
Non-controlling interest of subsidiary (24.9) - 24.9 -
Net earnings $ 110.6 $ 71.0 $ 24.9 $ 206.5 Net earnings
(a)(b)(c) - (0.3) (24.9) (25.2) Attributed to non-controlling interest
110.6 70.7 - 181.3 Attributed to common shareholders
Earnings per share Earnings (loss) per share
Basic $ 0.16 $ 0.26 Basic
Diluted $ 0.16 $ 0.26 Diluted
Weighted average number of common Weighted average number of common
shares outstanding (millions) shares outstanding (millions)
Basic 696.4 696.4 Basic
Diluted 699.7 699.7 Diluted
KINROSS GOLD CORPORATION 2010 ANNUAL REPORT 89

Kinross Gold CorporationReconciliation of Consolidated Balance SheetAs at June 30, 2010(Unaudited, expressed in millions of United States dollars)
CDN IFRS Re-
CDN GAAP Accounts Reference GAAP adjustments classifications IFRS IFRS Accounts
Assets AssetsCurrent assets Current assets
Cash, cash equivalents and short-term $ 694.8 $ - $ - $ 694.8 Cash and cash equivalentsinvestments
Restricted Cash 25.1 - - 25.1 Restricted cash- - - - Short term investments
Accounts receivable and other assets 195.6 - - 195.6 Accounts receivable and other assetsInventories 538.4 - - 538.4 InventoriesUnrealized fair value of derivative 57.5 - - 57.5 Unrealized fair value of derivative
assets assets
1,511.4 - - 1,511.4Non-current assets
Property, plant and equipment (a)(b)(c)(f)(i) 4,519.1 (136.5) - 4,382.6 Property, plant and equipmentGoodwill 818.9 - - 818.9 GoodwillLong-term investments (g) 1,352.8 - (557.0) 795.8 Long-term investments
(h) - 41.4 557.0 598.4 Investments in associates and workinginterests
- - - - Deferred tax assetsUnrealized fair value of derivative assets 17.3 - - 17.3 Unrealized fair value of derivative
assetsDeferred charges and other long-term 167.0 - - 167.0 Deferred charges and other long-term
assets assets
$ 8,386.5 $ (95.1) $ - $ 8,291.4
Liabilities LiabilitiesCurrent liabilities Current liabilities
Accounts payable and accrued (j) $ 302.6 $ (4.5) $ (67.2) $ 230.9 Accounts payable and accruedliabilities liabilities
(f) - 3.5 67.2 70.7 Current tax payableCurrent portion of long-term debt 121.8 - - 121.8 Current portion of long-term debtCurrent portion of reclamation and 14.7 - - 14.7 Current portion of provisions
remediation obligationsCurrent portion of unrealized fair (e) 205.8 60.4 - 266.2 Current portion of unrealized fair
value of derivative liabilities value of derivative liabilities
644.9 59.4 - 704.3- Non-current liabilities
Long-term debt (d) 589.1 (34.2) - 554.9 Long-term debt(b)(k) - 165.4 292.2 457.6 Provisions
(d) - 41.9 165.3 207.2 Unrealized fair value of derivativeliabilities
Other long-term liabilities 514.9 - (457.5) 57.4 Other long-term liabilitiesFuture income and mining taxes (a)(b)(c)(f)(i)(k) 502.5 (352.0) - 150.5 Deferred tax liabilities
2,251.4 (119.5) - 2,131.9
Non-controlling interest 180.2 - (180.2) -Equity
Common shareholders’ equity Common shareholders’ equityCommon share capital and common (e) 6,587.4 (68.8) - 6,518.6 Common share capital and common
share purchase warrants share purchase warrantsContributed surplus (d) 176.1 (62.1) - 114.0 Contributed surplusAccumulated deficit (658.5) 174.8 - (483.7) Accumulated deficitAccumulated other comprehensive (k) (150.1) (16.5) - (166.6) Accumulated other comprehensive
loss loss
5,954.9 27.4 - 5,982.3(a)(b)(c) - (3.0) 180.2 177.2 Non-controlling interest
5,954.9 24.4 180.2 6,159.5
$ 8,386.5 $ (95.1) $ - $ 8,291.4
90

Kinross Gold CorporationReconciliation of Consolidated Statement of OperationsThree months ended June 30, 2010(Unaudited, expressed in millions of United States dollars)
CDN IFRS Re-
CDN GAAP Accounts Reference GAAP adjustments classifications IFRS IFRS Accounts
Revenue Revenue
Metal sales $ 696.6 $ - $ - $ 696.6 Metal sales
Operating costs and expenses Cost of sales
Cost of sales (excludes reclamation, (f) 289.9 (1.5) - 288.4 Production costs
depreciation and amortization)
Accretion and reclamation expense 5.2 - (5.2) -
Depreciation, depletion and (a)(b)(c)(i) 112.6 4.3 - 116.9 Depreciation, depletion and
amortization amortization
407.7 2.8 (5.2) 405.3 Total Cost of sales
288.9 (2.8) 5.2 291.3 Gross Profit
Other operating costs (c) 8.0 (8.5) - (0.5) Other operating costs
Exploration and business development (c) 27.4 (8.1) - 19.3 Exploration and business development
General and administrative (j) 33.0 (0.1) - 32.9 General and administrative
Operating earnings 220.5 13.9 5.2 239.6 Operating earnings
Other income (expense) - net (d)(e)(f)(h) (18.5) 11.3 7.4 0.2 Other income (expense) - net
(g) - 0.2 (0.8) (0.6) Equity in losses of associates
- - 0.7 0.7 Finance income
(a)(b)(d) - (3.9) (12.2) (16.1) Finance expense
Earnings before taxes and other items 202.0 21.5 0.3 223.8 Earnings before taxes
Income and mining taxes expense - net (a)(b)(c)(f)(h) (67.8) (13.9) (1.1) (82.8) Income tax expense - net
Equity in losses of associated companies (0.8) - 0.8 -
Non-controlling interest of subsidiary (29.6) - 29.6 -
Net earnings $ 103.8 $ 7.6 $ 29.6 $ 141.0 Net earnings
(a)(b)(c) - (1.0) (29.6) (30.6) Attributed to non-controlling interest
103.8 6.6 - 110.4 Attributed to common shareholders
Earnings per share Earnings (loss) per share
Basic $ 0.15 $ 0.16 Basic
Diluted $ 0.15 $ 0.16 Diluted
Weighted average number of common Weighted average number of common
shares outstanding (millions) shares outstanding (millions)
Basic 698.8 698.8 Basic
Diluted 702.6 702.6 Diluted
KINROSS GOLD CORPORATION 2010 ANNUAL REPORT 91

Kinross Gold CorporationReconciliation of Consolidated Statement of OperationsSix months ended June 30, 2010(Unaudited, expressed in millions of United States dollars)
CDN IFRS Re-
CDN GAAP Accounts Reference GAAP adjustments classifications IFRS IFRS Accounts
Revenue Revenue
Metal sales $ 1,354.2 $ - $ - $ 1,354.2 Metal sales
Operating costs and expenses Cost of sales
Cost of sales (excludes reclamation, (f) 567.3 (4.1) - 563.2 Production costs
depreciation and amortization)
Accretion and reclamation expense 10.4 - (10.4) -
Depreciation, depletion and (a)(b)(c)(i) 241.5 6.0 - 247.5 Depreciation, depletion and
amortization amortization
819.2 1.9 (10.4) 810.7 Total Cost of sales
535.0 (1.9) 10.4 543.5 Gross Profit
Other operating costs (c) 14.2 (15.1) - (0.9) Other operating costs
Exploration and business development (c) 45.6 (13.4) - 32.2 Exploration and business development
General and administrative (j) 61.3 0.6 - 61.9 General and administrative
Operating earnings 413.9 26.0 10.4 450.3 Operating earnings
Other income (expense) - net (d)(e)(f)(h) 5.6 92.2 16.0 113.8 Other income (expense) - net
(g) - 1.9 (4.0) (2.1) Equity in losses of associates
- - 1.4 1.4 Finance income
(a)(b)(d) - (7.4) (25.5) (32.9) Finance expense
Earnings before taxes and other items 419.5 112.7 (1.7) 530.5 Earnings before taxes
Income and mining taxes expense - net (a)(b)(c)(f)(h) (146.6) (34.1) (2.3) (183.0) Income tax expense - net
Equity in losses of associated companies (4.0) - 4.0 -
Non-controlling interest of subsidiary (54.5) - 54.5 -
Net earnings $ 214.4 $ 78.6 $ 54.5 $ 347.5 Net earnings
(a)(b)(c) - (1.3) (54.5) (55.8) Attributed to non-controlling interest
214.4 77.3 - 291.7 Attributed to common shareholders
Earnings per share Earnings (loss) per share
Basic $ 0.31 $ 0.42 Basic
Diluted $ 0.31 $ 0.42 Diluted
Weighted average number of common Weighted average number of common
shares outstanding (millions) shares outstanding (millions)
Basic 697.6 697.6 Basic
Diluted 701.3 701.3 Diluted
III) IFRS recent pronouncements
Joint Arrangements
The International Accounting Standards Board (‘‘IASB’’) has issued Exposure Draft 9 Joint Arrangements (‘‘ED 9’’) which
proposes to require that all jointly controlled entities be accounted for using the equity method of accounting. ED 9 would
replace the current IFRS standard which allows for a policy choice to account for jointly controlled entities using either
proportionate consolidation, which is consistent with Canadian GAAP, or the equity method of accounting. ED 9 is expected
to result in the issue of a final IFRS standard in 2011, which the Company will be required to adopt during a period subsequent
92

to its transition to IFRS. The Company is currently evaluating the impact that ED 9 is expected to have on its consolidated
financial statements.
Financial instruments
The IASB has issued IFRS 9 Financial Instruments which proposes to replace IAS 39 Financial instruments: Recognition and
Measurement. The replacement standard has the following significant components: establishes two primary measurement
categories for financial assets - amortized cost and fair value; establishes criteria for classification within measurement
category based on business model and cash flow characteristics; and eliminates existing held to maturity, available for sale
and loans and receivable categories.
This standard is effective for the Company’s annual year end beginning January 1, 2013. The Company will evaluate the
impact of the change to its consolidated financial statements based on the characteristics of its financial instruments at the
time of adoption.
10. CRITICAL ACCOUNTING POLICIES AND ESTIMATES
Kinross’ accounting policies are described in Note 2 to the consolidated financial statements. The preparation of the
Company’s consolidated financial statements, in conformity with GAAP, requires management to make estimates and
assumptions that affect amounts reported in the consolidated financial statements and accompanying notes. The following
is a list of the accounting policies that the Company believes are critical, due to the degree of uncertainty regarding the
estimates or assumptions involved and the magnitude of the asset, liability, revenue or expense being reported:
• Purchase price allocation;
• Goodwill and Goodwill Impairment;
• Carrying Value of Operating Mines, Mineral Rights, Development Properties and Other Assets;
• Long-term investments;
• Depreciation, depletion and amortization;
• Inventories;
• Reclamation and remediation obligations; and
• Income and mining taxes
Management has discussed the development and selection of the above critical accounting policies with the Audit
Committee of the Board of Directors, and the Audit Committee has reviewed the disclosure relating to such policies in
the MD&A.
Purchase Price Allocation
Business acquisitions are accounted for by the purchase method of accounting whereby the purchase price is allocated to
the assets acquired and the liabilities assumed based on fair value at the time of the acquisition. The excess purchase price
over the fair value of identifiable assets and liabilities acquired is goodwill. The determination of fair value often requires
management to make assumptions and estimates about future events. The assumptions and estimates with respect to
determining the fair value of property, plant and equipment acquired generally require a high degree of judgment, and
include estimates of mineral reserves acquired, future gold prices and discount rates. Changes in any of the assumptions or
estimates used in determining the fair value of acquired assets and liabilities could impact the amounts assigned to assets,
liabilities and goodwill in the purchase price allocation.
KINROSS GOLD CORPORATION 2010 ANNUAL REPORT 93

Goodwill and Goodwill Impairment
The amount by which the purchase price of a business acquisition exceeds the fair value of identifiable assets and liabilities
acquired, is goodwill. Goodwill is allocated to the reporting units acquired based on management’s estimates of the fair value
of each reporting unit as compared with the fair value of the assets and liabilities of the reporting unit. Under the Company’s
goodwill policy, goodwill is attributed to the following factors:
• Expected additional value (‘‘EAV’’) from identified exploration targets at the reporting unit is calculated based on
management’s estimates of the ounces at such targets, based on the specific geological attributes of the mineral property
and based on prices in market transactions involving properties with similar exploration targets;
• The optionality (real option value associated with the portfolio of acquired mines as well as each individual mine) to
develop additional, higher-cost reserves and to intensify efforts to develop the more promising acquired properties and
reduce efforts at developing the less promising acquired properties in the future. This optionality may result from changes
in the overall economics of an individual mine or a portfolio of mines, largely driven by changes in the gold price; and
• The going concern value of the Company’s capacity to replace and augment reserves through completely new discoveries
whose value is not reflected in any of the other valuations.
At the date of acquisition, the fair value of a reporting unit is comprised of the following:
• Discounted nominal cash flows of reserves and resources, which includes estimates for capital expenditures.
• Fair value of exploration properties based on market comparable data.
• Goodwill.
The value associated with EAV is assigned to reporting units at the date of acquisition. Residual goodwill represented by
optionality and going-concern value as described above, is also assigned to reporting units at the date of acquisition.
However, the Company assigns residual goodwill to reporting units using a relative fair value methodology.
Discounted nominal cash flows are estimated based on the Company’s life-of-mine plans and include the following estimates
and assumptions:
• estimated future recoverable mine production based on Proven and Probable Reserves, Measured, Indicated and Inferred
Resources, metal grades and recovery rates;
• metal prices, foreign exchange, inflation, tax rates and operating and abandonment costs, and
• capital expenditures, which are all based on life-of-mine plans representing the budgets and long-term business plans for
each reporting unit.
The fair value arrived at as described above is the Company’s estimate of fair value for accounting purposes and is not a
‘‘preliminary assessment’’ as defined in National Instrument 43-101 - Standards of Disclosure for Mineral Projects.
The use of estimates and assumptions is subjective and therefore it is possible that actual future cash flows may differ
significantly from projected future results prepared using numerous estimates and assumptions. Each of the estimates and
assumptions noted above are subject to significant risks and uncertainties.
The Company evaluates the carrying amount of goodwill allocated to reporting units on an annual basis and at any other
time if events or changes in circumstances indicate that the fair value of a reporting unit may have been impaired. The
Company compares the estimated fair value of reporting units to which goodwill was allocated to the carrying amounts. If
the carrying value of a reporting unit were to exceed its estimated fair value, the Company would compare the implied fair
94

value of the reporting unit’s goodwill to its carrying amount. Any excess of the carrying value over the fair value is charged
to earnings.
At impairment testing dates, the fair value of the reporting unit is estimated based on a computation of the reporting unit’s
discounted cash flows which requires assumptions similar to those used at the acquisition dates, together with the fair value
of exploration properties based on market comparable data and the expected additional value based on the expected ability
to find additional ore.
However, in applying the Company’s accounting policy at impairment testing dates, no value is computed or attributed for
the optionality and the going concern value, which are contributors to goodwill at the time that the reporting units were
acquired. Under the Company’s accounting policy these amounts are considered to exist at the corporate level and cannot
be attributed to individual reporting units or individual mines. By not attributing any value to the optionality and going-
concern value at the individual mines, an impairment of acquired goodwill, with all other assumptions including gold price
and reserves remaining constant, is likely to occur at the time of the first impairment test after acquisition. Positive changes
in valuation inputs such as the gold price and reserves in the period prior to the impairment test could moderate or eliminate
any impairment.
The timing and extent of future goodwill impairment charges, beyond the first impairment test after an acquisition, is
dependant on a number of factors and assumptions that impact the fair value of the reporting unit as previously discussed,
such as gold prices. Furthermore, since mines have a finite life and the Company tests them for impairment at the reporting
unit level, the extent to which reserves and resources are depleted and not replaced and the extent to which expected
additional value is not converted to reserves or resources, a goodwill impairment charge may be recorded. If there are no
goodwill impairment charges during the mine life, it is expected that the carrying value of goodwill would be written off at
the end of the mine life.
The application of the Company’s goodwill policy resulted in a substantial goodwill impairment in 2003 relating to an
acquisition made by the Company for which goodwill was recorded. In 2008, the application of this policy resulted in an
impairment charge of $994.1 million, related to reporting units acquired through the acquisition of Bema Gold Corporation.
At December 31, 2010, key estimates include estimates and assumptions for Reserves and Resources, the gold and silver
price and discount rates. The Company used the Reserves and Resources for each reporting unit as disclosed in the ‘‘Mineral
Reserve and Resource Statement’’ at December 31, 2010, a long-term gold price of $1,052 per ounce of gold, a long-term
silver price of $18.41 per ounce, a 7.0% discount rate applied to Proven and Probable Reserves and Measured and Indicated
Resources and a 10.0% discount rate applied to Inferred Resources.
While the Company believes that the approach used to calculate estimated fair value for each reporting unit is appropriate,
the Company also recognizes that the timing and future value of additions to proven and probable mineral reserves, as well
as the gold price and other assumptions discussed previously, may change significantly from current expectations. For 2010,
a reduction in the forecasted gold price used to test impairment of 10% would not have resulted in any impairment charge.
Carrying Value of Operating Mines, Mineral Rights, Development Properties and Other Assets
Kinross reviews and evaluates the carrying value of its operating mines and development properties for impairment
whenever events or circumstances indicate that the carrying amounts of these assets might not be recoverable. When the
carrying amount exceeds the undiscounted cash flow, an impairment loss is measured and recorded. Future cash flows are
based on estimated recoverable production as determined from Proven and Probable Reserves and Measured, Indicated and
Inferred Resources. Assumptions underlying the cash flow estimates include, but are not limited to, forecasted prices for
gold and silver, production levels, and operating, capital and reclamation costs. The fair values of exploration-stage
KINROSS GOLD CORPORATION 2010 ANNUAL REPORT 95

properties are estimated based primarily on recent transactions involving similar properties adjusted for any infrastructure
that may already be in place. Assumptions underlying future cash flow estimates are subject to risks and uncertainties.
Therefore, it is possible that changes in estimates with respect to the Company’s mine plans could occur which may affect
the expected recoverability of Kinross’ investments in the carrying value of the assets. The components of the asset
impairment charges are discussed in ‘‘Impairment of Goodwill and Property, Plant and Equipment’’ under the ‘‘Consolidated
Financial Results’’ section.
Included in the carrying value of property, plant and equipment and mineral properties is Value beyond Proven and Probable
Reserves (‘‘VBPP’’) resulting from Kinross’ acquisitions. The concept of VBPP is described in FASB Emerging Issues Task
Force (‘‘EITF’’) Issue No. 04-3, ‘‘Mining Assets: Impairment and Business Combinations,’’ and the Emerging Issues Committee
abstract ‘‘EIC - 152 - Mining assets - Impairment and Business Combinations’’ and has been interpreted differently by
different mining companies. The Company’s adjustments to property, plant and equipment include VBPP attributable to
mineralized material, which includes Measured and Indicated amounts that the Company believes could be brought into
production, and Inferred Resources.
Long-term Investments
Long-term investments in equity securities are designated as available-for-sale. Unrealized holding gains and losses related
to available-for-sale investments are excluded from net earnings and are included in other comprehensive income (‘‘OCI’’)
until such gains and losses are realized or an other-than-temporary impairment is determined to have occurred. The
Company periodically reviews the carrying value of its investments. When a decline in the value of an investment is
considered to be other-than-temporary, the investment is written down to net realizable value with a charge to other income
(expense).
Depreciation, Depletion and Amortization
Plants and other facilities used directly in mining activities are depreciated using the units-of-production (‘‘UOP’’) method
over a period not to exceed the estimated life of the ore body based on recoverable ounces to be mined from estimated
proven and probable mineral reserves. Mobile and other equipment is depreciated, net of residual value, on a straight-line
basis, over the useful life of the equipment but does not exceed the related estimated life of the mine based on Proven and
Probable Reserves.
Costs to develop new properties, where it has been determined that a mineral property can be economically developed as a
result of establishing proven and probable mineral reserves, are capitalized. All such costs are depleted using the UOP
method based on recoverable ounces to be mined from proven and probable mineral reserves.
Major costs incurred after the commencement of production that represent betterment to the property are capitalized and
depleted using the UOP method based on recoverable ounces to be mined from estimated proven and probable mineral
reserves from the reserves exposed as a result of these activities.
The calculation of the UOP rate, and therefore the annual depreciation, depletion, and amortization expense, could be
materially affected by changes in the underlying estimates. Changes in estimates can be the result of actual future
production differing from current forecasts of future production, expansion of proven and probable mineral reserves
through exploration activities, differences between estimated and actual costs of mining and differences in gold price used
in the estimation of proven and probable mineral reserves.
96

Significant judgment is involved in the determination of useful life and residual values for the computation of depreciation,
depletion, and amortization and no assurance can be given that actual useful lives and residual values will not differ
significantly from current assumptions.
Inventories
Expenditures incurred, and depreciation, depletion and amortization of assets used in mining and processing activities are
deferred and accumulated as the cost of ore in stockpiles, ore on leach pads, in-process and finished metal inventories.
These deferred amounts are carried at the lower of average cost or net realizable value (‘‘NRV’’). Average cost is determined
by using a trailing average of cost of production for a period of no longer than three months. NRV is the difference between
the estimated future gold price based on prevailing and long-term prices, less estimated costs to complete production into a
saleable form. Write-downs of ore in stockpiles, ore on leach pads, in-process and finished metal inventories resulting from
NRV impairments are reported as a component of current period costs. The primary factors that influence the need to
record write-downs include prevailing and long-term gold prices and prevailing costs for production inputs such as labour,
fuel and energy, materials and supplies, as well as realized ore grades and actual production levels.
Ore on leach pads is ore that is placed on pads where it is permeated with a chemical solution that dissolves the gold
contained in the ore. Costs are attributed to the leach pads based on current mining costs, including applicable depreciation,
depletion and amortization relating to mining operations incurred up to the point of placing the ore on the pad. Costs are
removed from the leach pad based on the average cost per recoverable ounce of gold on the leach pad as the gold is
recovered. Estimates of recoverable gold on the leach pads are calculated from the quantities of ore placed on the pads, the
grade of ore placed on the leach pads and an estimated percentage of recovery. Timing and ultimate recovery of gold
contained on leach pads can vary significantly from the estimates. The quantities of recoverable gold placed on the leach
pads are reconciled to the quantities of gold actually recovered (metallurgical balancing), by comparing the grades of ore
placed on the leach pads to actual ounces recovered. The nature of the leaching process inherently limits the ability to
precisely monitor inventory levels. As a result, the metallurgical balancing process is constantly monitored and the
engineering estimates are refined based on actual results over time. The ultimate recovery of gold from a pad will not be
known until the leaching process is completed.
The allocation of costs to ore in stockpiles, ore on leach pads and in-process inventories and the determination of NRV
involves the use of estimates. There is a high degree of judgment in estimating future costs, future production levels, proven
and probable mineral reserve estimates, gold and silver prices, and the ultimate estimated recovery for ore on leach pads.
There can be no assurance that actual results will not differ significantly from estimates used in the determination of the
carrying value of inventories.
Reclamation and Remediation Obligations
Mining and exploration activities are subject to various laws and regulations governing the protection of the environment. In
general, these laws and regulations are continually changing and the Company has made, and intends to make in the future,
expenditures to comply with such laws and regulations. The Company records the estimated present value of reclamation
liabilities in the period in which they are incurred. A corresponding increase to the carrying amount of the related asset is
recorded and depreciated over the life of the asset. The liability will be increased each period to reflect the interest element
or accretion reflected in its initial measurement at fair value, and will also be adjusted for changes in the estimate of the
amount, timing and cost of the work to be carried out.
KINROSS GOLD CORPORATION 2010 ANNUAL REPORT 97

Future remediation costs for inactive mines are accrued based on management’s best estimate at the end of each period of
the undiscounted cash costs expected to be incurred at each site. Changes in estimates are reflected in earnings in the
period an estimate is revised.
Accounting for reclamation and remediation obligations requires management to make estimates of the future costs the
Company will incur to complete the reclamation and remediation work required to comply with existing laws and regulations
at each mining operation. Actual costs incurred may differ from those amounts estimated. Also, future changes to
environmental laws and regulations could increase the extent of reclamation and remediation work required to be
performed by the Company. Increases in future costs could materially impact the amounts charged to operations for
reclamation and remediation. At December 31, 2010, the undiscounted future cost of reclamation and remediation
obligations before inflation was estimated to be $613.5 million. The net present value of estimated future cash outflows for
reclamation and remediation obligations was $354.6 million and $269.8 million at December 31, 2010 and 2009,
respectively.
Income and Mining Taxes
The Company recognizes the future tax benefit related to deferred income and resource tax assets and sets up a valuation
allowance against any portion that it believes will, more likely than not, fail to be realized (see Note 15 to the consolidated
financial statements). Assessing the recoverability of future income tax assets requires management to make significant
estimates of future taxable income. Estimates of future taxable income are subject to changes as discussed under the
section ‘‘Carrying Value of Operating Mines, Mineral Rights, Development Properties and Other Assets’’. To the extent that
future cash flows and taxable income differ significantly from estimates, the ability of the Company to realize the net
deferred tax assets recorded at the balance sheet date could be impacted. In addition, future changes in tax laws could limit
the ability of the Company to obtain tax deductions in future periods from deferred income and resource tax assets.
Recent Accounting Pronouncements
Business combinations, Consolidated financial statements and Non-controlling interest
In 2008, the CICA issued Handbook Section 1582, ‘‘Business Combinations’’ (‘‘Section 1582’’), which is effective for business
combinations with an acquisition date on or after January 1, 2011. The standard requires the additional use of fair value
measurements, recognition of additional assets and liabilities and increased disclosure. The impact of Section 1582 is
expected to have a material impact on how prospective business combinations are accounted for. Additionally, as part of the
application of Section 1582, companies will be required to adopt CICA Handbook Section 1601 ‘‘Consolidated Financial
Statements’’ and 1602 ‘‘Non-controlling interests’’. These sections will require that non-controlling interest be presented as
part of shareholders’ equity on the balance sheet and the controlling parent to present 100 percent of the subsidiary’s
results in the statement of operations with an allocation between controlling and non-controlling interest. The standards are
effective as of January 1, 2011, with early adoption permitted.
For new accounting pronouncements adopted see Note 3 of the consolidated financial statements.
98

11. RISK ANALYSIS
The business of Kinross contains significant risk due to the nature of mining, exploration, and development activities. Certain
risk factors listed below are related to the mining industry in general while others are specific to Kinross. Included in the risk
factors below are details on how Kinross seeks to mitigate these risks wherever possible. For additional discussion of risk
factors please refer to the Company’s most recently filed Annual Information Form, which is available on the Company’s web
site www.kinross.com and on www.sedar.com or is available upon request from the Company.
Gold Price and Silver Price
The profitability of Kinross’ operations is significantly affected by changes in the market price of gold and silver. Gold and
silver prices fluctuate on a daily basis and are affected by numerous factors beyond the control of Kinross. The price of gold
and/or silver can be subject to volatile price movements and future serious price declines could cause continued commercial
production to be impractical. Depending on the prices of gold and silver, cash flow from mining operations may not be
sufficient to cover costs of production and capital expenditures. If, as a result of a decline in gold and/or silver prices,
revenues from metal sales were to fall below cash operating costs, production may be discontinued. The factors that may
affect the price of gold and silver include industry factors such as: industrial and jewellery demand; the level of demand for
the metal as an investment; central bank lending, sales and purchases of the metal; speculative trading; and costs of and
levels of global production by producers of the metal. Gold and silver prices may also be affected by macroeconomic factors,
including: expectations of the future rate of inflation; the strength of, and confidence in, the US dollar, the currency in which
the price of the metal is generally quoted, and other currencies; interest rates; and global or regional political or economic
uncertainties.
If the world market price of gold and/or silver were to drop and the prices realized by Kinross on gold and/or silver sales
were to decrease significantly and remain at such a level for any substantial period, Kinross’ profitability and cash flow
would be negatively affected. In such circumstances, Kinross may determine that it is not economically feasible to continue
commercial production at some or all of its operations or the development of some or all of its current projects, which could
have an adverse impact on Kinross’ financial performance and results of operations. Kinross may curtail or suspend some or
all of its exploration activities, with the result that depleted reserves are not replaced. In addition, the market value of
Kinross’ gold and/or silver inventory may be reduced and existing reserves may be reduced to the extent that ore cannot be
mined and processed economically at the prevailing prices. Furthermore, certain of Kinross’ mineral projects include copper
which is similarly subject to price volatility based on factors beyond Kinross’ control.
Nature of Mineral Exploration and Mining
The exploration and development of mineral deposits involves significant financial and other risks over an extended period
of time which may not be eliminated even with careful evaluation, experience and knowledge. While discovery of
gold-bearing structures may result in substantial rewards, few properties explored are ultimately developed into producing
mines. Major expenditures are required to establish reserves by drilling and to construct mining and processing facilities at a
site. It is impossible to ensure that the current or proposed exploration programs on properties in which Kinross has an
interest will result in profitable commercial mining operations.
The operations of Kinross are subject to the hazards and risks normally incident to exploration, development and production
of gold and silver, any of which could result in damage to life or property, environmental damage and possible legal liability
for such damage. The activities of Kinross may be subject to prolonged disruptions due to weather conditions depending on
the location of operations in which it has interests. Hazards, such as unusual or unexpected formations, rock bursts,
pressures, cave-ins, flooding, pit wall failures or other conditions, may be encountered in the drilling and removal of material.
KINROSS GOLD CORPORATION 2010 ANNUAL REPORT 99

While Kinross may obtain insurance against certain risks, potential claims could exceed policy limits or could be excluded
from coverage. There are also risks against which Kinross cannot or may elect not to insure. The potential costs which could
be associated with any liabilities not covered by insurance or in excess of insurance coverage or compliance with applicable
laws and regulations may cause substantial delays and require significant capital outlays, adversely affecting the future
earnings and competitive position of Kinross and, potentially, its financial viability.
Whether a gold deposit will be commercially viable depends on a number of factors, some of which include the particular
attributes of the deposit, such as its size and grade, costs and efficiency of the recovery methods that can be employed,
proximity to infrastructure, financing costs and governmental regulations, including regulations relating to prices, taxes,
royalties, infrastructure, land and water use, importing and exporting of gold and environmental protection. The effect of
these factors cannot be accurately predicted, but the combination of these factors may result in Kinross not receiving an
adequate return on its invested capital.
Kinross mitigates the likelihood and potential severity of these mining risks it encounters in its day-to-day operations
through the application of high operating standards. In addition, Kinross reviews its insurance coverage at least annually to
ensure that the most complete and cost-effective coverage is obtained.
Environmental Risks
Kinross’ mining and processing operations and exploration activities in Canada, the United States, Russia, Brazil, Ecuador,
Chile, Mauritania and Ghana are subject to various laws and regulations governing the protection of the environment,
exploration, development, production, exports, taxes, labour standards, occupational health, waste disposal, toxic
substances, mine safety, and other matters. New laws and regulations, amendments to existing laws and regulations, or
more stringent implementation of existing laws and regulations could have a material adverse impact on Kinross through
increased costs, a reduction in levels of production and/or a delay or prevention of the development of new mining
properties. Compliance with these laws and regulations requires significant expenditures and increases Kinross’ mine
development and operating costs.
Permits from various governmental authorities are necessary in order to engage in mining operations in all jurisdictions in
which Kinross operates. Such permits relate to many aspects of mining operations, including maintenance of air, water and
soil quality standards. In most jurisdictions, the requisite permits cannot be obtained prior to completion of an environmental
impact statement and, in some cases, public consultation. Further, Kinross may be required to submit for government
approval a reclamation plan, to post financial assurance for the reclamation costs of the mine site, and to pay for the
reclamation of the mine site upon the completion of mining activities. Kinross mitigates this risk by performing certain
reclamation activities concurrent with production.
Mining, like many other extractive natural resource industries, is subject to potential risks and liabilities concerning the
environmental effects associated with mineral exploration and production. Environmental liability may result from mining
activities conducted by others prior to Kinross’ ownership of a property. To the extent Kinross is subject to uninsured
environmental liabilities, the payment of such liabilities would reduce funds otherwise available for business activities and
could have a material adverse effect on Kinross. Should Kinross be unable to fully fund the cost of remedying an
environmental problem, Kinross might be required to suspend operations or enter into interim compliance measures
pending completion of the required remedy, which could have a material adverse effect. Kinross mitigates the likelihood and
potential severity of these environmental risks it encounters in its day-to-day operations through the application of high
operating standards.
100

Reserve Estimates
The reserve and resource figures are estimates, and no assurance can be given that the anticipated tonnages and grades will
be achieved or that the indicated level of recovery will be realized. Market fluctuations in the price of gold may render the
mining of ore reserves uneconomical and require Kinross to take a write-down of an asset or to discontinue development or
production. Moreover, short-term operating factors relating to the reserves, such as the need for orderly development of the
ore body or the processing of new or different ore grades, may cause a mining operation to be unprofitable in any particular
accounting period.
Proven and Probable Reserves at Kinross’ mines and development projects were estimated as of December 31, 2010, based
upon a gold price of $900 per ounce of gold. Prior to 2002, gold prices were significantly below these levels.
Prolonged declines in the market price of gold may render reserves containing relatively lower grades of gold mineralization
uneconomic to exploit and could materially reduce Kinross’ reserves. Should such reductions occur, material write-downs of
Kinross’ investment in mining properties or the discontinuation of development or production might be required, and there
could be material delays in the development of new projects and reduced income and cash flow.
There are numerous uncertainties inherent in estimating quantities of proven and probable gold reserves. The estimates in
this document are based on various assumptions relating to gold prices and exchange rates during the expected life of
production and the results of additional planned development work. Actual future production rates and amounts, revenues,
taxes, operating expenses, environmental and regulatory compliance expenditures, development expenditures and recovery
rates may vary substantially from those assumed in the estimates. Any significant change in these assumptions, including
changes that result from variances between projected and actual results, could result in a material downward or upward
revision of current estimates.
Production and Cost Estimates
Kinross prepares estimates of future production, operating costs and capital costs for its operations. No assurance can be
given that such estimates will be achieved. Failure to achieve production or cost estimates or material increases in costs
could have an adverse impact on Kinross’ future cash flows, forward sales program, profitability, results of operations and
financial condition.
Kinross’ actual production and costs may vary from estimates for a variety of reasons, including: actual ore mined varying
from estimates of grade, tonnage, dilution and metallurgical and other characteristics; short-term operating factors relating
to the ore reserves, such as the need for sequential development of orebodies and the processing of new or different ore
grades; revisions to mine plans; difficulties with supply chain management, including the implementation and management
of enterprise resource planning software; risks and hazards associated with mining; natural phenomena, such as inclement
weather conditions, floods, and earthquakes; and unexpected labour shortages or strikes. Costs of production may also be
affected by a variety of factors, including: changing waste-to-ore ratios, ore grade metallurgy, labour costs, the cost of
supplies and services (for example, power and fuel), general inflationary pressures and currency exchange rates.
Political, Economic and Legislative Risk
Kinross has mining and exploration operations in various regions of the world, including the United States, Brazil, Chile,
Ecuador, the Russian Federation, Mauritania and Ghana and such operations are exposed to various levels of political,
economic, and other risks and uncertainties. These risks and uncertainties vary from country to country and include, but are
not limited to: terrorism; hostage taking; extreme fluctuations in currency exchange rates; high rates of inflation; labour
unrest; the risks of civil unrest; expropriation and nationalization; renegotiation or nullification of existing concessions,
licenses, permits and contracts; illegal mining; changes to policies and regulations impacting the mining sector; restrictions
KINROSS GOLD CORPORATION 2010 ANNUAL REPORT 101

on foreign exchange and repatriation; and changing political conditions, currency controls, and governmental regulations
that favour or require the awarding of contracts to local contractors or require foreign contractors to employ citizens of, or
purchase supplies from, a particular jurisdiction.
Future political and economic conditions in these countries may result in these governments adopting different policies
respecting foreign investment, and development and ownership of mineral resources. Any changes in such policies may
result in changes in laws affecting ownership of assets, foreign investment, mining exploration and development, taxation,
rates of exchange, gold sales, environmental protection, labour relations, price controls, repatriation of income, and return
of capital, which may affect both the ability of Kinross to undertake exploration and development activities in respect of
future properties in the manner currently contemplated, as well as its ability to continue to explore, develop, and operate
those properties to which it has rights relating to exploration, development, and operation. Future governments in these
countries may adopt substantially different policies, which might extend to, as an example, expropriation of assets.
The tax regimes in these countries may be subject to differing interpretations and are subject to change from time to time.
Kinross’ interpretation of taxation law as applied to its transactions and activities may not coincide with that of the tax
authorities in a given country. As a result, transactions may be challenged by tax authorities and Kinross’ operations may be
assessed, which could result in significant additional taxes, penalties and interest.
Kinross is subject to the considerations and risks of operating in the Russian Federation. Certain currency conversion risks
exist in the Russian economy. Russian legislation currently permits the conversion of ruble revenues into foreign currency.
However, the market in the Russian Federation for the conversion of rubles into foreign currencies is limited. Further, any
delay or other difficulty in converting rubles into a foreign currency to make a payment or delay in or restriction on the
transfer of foreign currency could limit our ability to meet our payment and debt obligations, which could result in the loss of
suppliers, acceleration of debt obligations, etc.
Licenses and Permits
The operations of Kinross require licenses and permits from various governmental authorities. However, such licenses and
permits are subject to change in various circumstances. There can be no guarantee that Kinross will be able to obtain or
maintain all necessary licenses and permits that may be required to explore and develop its properties, commence
construction or operation of mining facilities and properties under exploration or development or to maintain continued
operations that economically justify the cost. Kinross endeavours to be in compliance with these regulations at all times.
Title to Properties and Community Relations
The validity of mining claims which constitute most of Kinross’ property holdings may, in certain cases, be uncertain and
subject to being contested. Kinross’ titles, particularly title to undeveloped properties, may be defective and open to being
challenged by governmental authorities and local communities.
Certain of Kinross’ properties may be subject to the rights or the asserted rights of various community stakeholders,
including indigenous people. The presence of community stakeholders may also impact on the Company’s ability to develop
or operate its mining properties. In certain circumstances, consultation with such stakeholders may be required and the
outcome may affect the Company’s ability to develop or operate its mining properties.
Competition
The mineral exploration and mining business is competitive in all of its phases. Kinross competes with numerous other
companies and individuals, including competitors with greater financial, technical and other resources than Kinross, in the
search for and the acquisition of attractive mineral properties. The ability of Kinross to operate successfully in the future will
102

depend not only on its ability to develop its present properties, but also on its ability to select and acquire suitable producing
properties or prospects for mineral exploration. Kinross may be unable to compete successfully with its competitors in
acquiring such properties or prospects on terms it considers acceptable, if at all.
Joint Ventures
Certain of the operations in which Kinross has an interest are operated through joint ventures with other mining companies.
Any failure of such other companies to meet their obligations to Kinross or to third parties could have a material adverse
effect on the joint venture. In addition, Kinross may be unable to exert control over strategic decisions made in respect of
such properties.
Interest Rate Fluctuations
Fluctuations in interest rates can affect Kinross’ results of operations and cash flow. The Company’s credit facilities are
subject to variable interest rates.
Disclosures About Market Risks
To determine its market risk sensitivities, Kinross uses an internally generated financial forecast model that is sensitized to
various gold prices, currency exchange rates, interest rates and energy prices. The variable with the greatest impact is the
gold price, and Kinross prepares a base case scenario and then sensitizes it by a 10% increase and decrease in the gold price.
For 2011, sensitivity to a 10% change in the gold price is estimated to have a $324.4 million on pre-tax earnings. Kinross’
financial forecast covers the projected life of its mines. In each year, gold is produced according to the mine plan.
Additionally, for 2011, sensitivity to a 10% change in the silver price is estimated to have an $29.9 million impact on pre-tax
earnings. Costs are estimated based on current production costs plus the impact of any major changes to the operation
during its life. Quantitative disclosure of market risks is disclosed below.
Hedging Risks
Kinross’ net earnings can vary significantly with fluctuations in the market price of gold and silver. At various times, in
response to market conditions, Kinross has entered into gold forward sales contracts, spot deferred forward sales contracts,
purchased put options and written call options for some portion of expected future production in an attempt to mitigate the
risk of adverse price fluctuations. Kinross is not subject to margin requirements on any of its hedging lines. Kinross has
made the decision not to continue with a comprehensive gold hedging program. On occasion, however, the Company may
enter into forward sales contracts or similar instruments if hedges are acquired on a business acquisition, if hedges are
required under project financing requirements, or when deemed advantageous by management. As at December 31, 2010,
Kinross had gold and silver forward sales contracts and gold spot deferred forward sales contracts acquired with the
acquisition of Bema. Included in the portfolio are gold and silver hedge contracts required as part of the Kupol financing
requirements. In addition, Kinross had gold forward purchases contracts offsetting the Kupol sales contracts, and purchased
silver put options and written silver call options with respect to the production at the Puren deposit in Chile. Kinross does not
include these financial instruments in testing for impairment of operating mines, mineral rights, and development properties.
Foreign Currency Exchange Risk
Currency fluctuations may affect the revenues which Kinross will realize from its operations since gold is sold in the world
market in United States dollars. The costs of Kinross are incurred principally in Canadian dollars, United States dollars,
Chilean pesos, Brazilian reais, Russian rubles, Mauritanian ouguiya and Ghanaian cedis. The appreciation of non-U.S. dollar
currencies against the U.S. dollar increases the cost of gold production in U.S. dollar terms. Kinross’ results are positively
KINROSS GOLD CORPORATION 2010 ANNUAL REPORT 103

affected when the U.S. dollar strengthens against these foreign currencies and are adversely affected when the U.S. dollar
weakens against these foreign currencies. Where possible, Kinross’ cash and cash equivalent balances are primarily held in
U.S. dollars. From time to time, Kinross transacts currency hedging to reduce the risk associated with currency fluctuations.
Currency hedging involves risks and may require margin activities. Sudden fluctuations in currencies could result in margin
calls that could have an adverse effect on Kinross’ financial position. While the Chilean peso, Brazilian real and Russian ruble
are currently convertible into Canadian and United States dollars, they may not always be convertible in the future.
Credit, Counterparty and Liquidity Risk
The Company is subject to counterparty risk and may be impacted, in the event that a counterparty becomes insolvent. To
manage both counterparty and credit risk, the Company proactively manages its exposure to individual counterparties. The
Company only transacts with highly-rated counterparties. A limit on contingent exposure has been established for each
counterparty based on the counterparty’s credit rating and the Company monitors the financial condition of each
counterparty.
Credit risk relates to accounts receivable and derivative contracts and arises from the possibility that a counterparty to an
instrument fails to perform. The Company only transacts with highly-rated counterparties and a limit on contingent exposure
has been established for each counterparty based on the counterparty’s credit rating.
As at December 31, 2010, the Company’s gross credit exposure was $253.6 million and at December 31, 2009, the gross
credit exposure was $79.0 million.
To manage liquidity risk, the Company maintains cash positions and has financing in place, that the Company expects will be
sufficient to meet its operating and capital expenditure requirements. Potential sources for liquidity could include, but are
not limited to: the Company’s current cash position, existing credit facilities, future operating cash flow and potential private
and public financing. Additionally, the Company reviews its short-term operational forecasts regularly and long-term
budgets to determine its cash requirements.
Shortages and Price Volatility of Input Commodities and Equipment
The Company is dependent on various commodities (such as diesel fuel, electricity, natural gas, steel, concrete and cyanide)
and equipment to conduct its mining operations and development projects. The shortage of such commodities, equipment
and parts or a significant increase of their cost could have a material adverse effect on the Company’s ability to carry out its
operations and therefore limit, or increase the cost of, production. The Company is also dependent on access to and supply
of water to carry out its mining operations, and such access and supply may not be readily available, especially at the
Company’s operations in Chile. Market prices of commodities can be subject to volatile price movements which can be
material, occur over short periods of time and are affected by factors that are beyond Kinross’ control. An increase in the
cost, or decrease in the availability, of input commodities, equipment or parts may affect the timely conduct and cost of
Kinross’ operations and development projects. If the costs of certain commodities consumed or otherwise used in
connection with Kinross’ operations and development projects were to increase significantly, and remain at such levels for a
substantial period, Kinross may determine that it is not economically feasible to continue commercial production at some or
all of Kinross’ operations or the development of some or all of Kinross’ current projects, which could have an adverse impact
on Kinross’ financial performance and results of operations.
Potential for Incurring Unexpected Costs or Liabilities as a Result of the Acquisitions
Although the Company has conducted investigations in connection with the acquisitions of Red Back, Underworld, Dvoinoye
and other recent acquisitions, risks remain regarding any undisclosed or unknown liabilities associated with these
104

acquisitions. The Company may discover that it has acquired substantial undisclosed liabilities. The Company may have little
recourse against the seller if any of the representations or warranties provided in connection with these acquisitions prove
to be inaccurate. Such liabilities could have an adverse impact on the Company’s business, financial condition, results of
operations or cash flows.
Current Global Financial Condition
Recent global financial conditions have been characterized by increased volatility and several financial institutions have
either gone into bankruptcy or have had to be rescued by governmental authorities. The fallout from the current global
financial crisis has resulted in the following conditions, which may have an impact on the operations and cash flows of
the Company:
• Volatility in commodity prices and foreign exchange rates,
• Tightening of credit markets,
• Increased counterparty risk, and
• Volatility in the prices of publicly traded entities.
Although the tightening of credit markets has restricted the ability of certain companies to access capital, to date this has
not had an impact on the Company’s liquidity. The Company raised approximately $396 million in net proceeds from a 2009
public common share offering. Additionally, the Company re-negotiated its credit facilities in 2009 and has additional
availability under its revolving credit facility of $512.3 million at December 31, 2010. However, continued tightening of credit
markets may impact the ability of the Company to obtain equity or debt financing in the future on terms favourable to
the Company.
The Company has not experienced any difficulties to date with respect to the counterparties it transacts with. The
counterparties continue to be highly rated and as noted above, the Company has employed measures to reduce the impact
of counterparty risk.
Continued volatility in equity markets may have an impact on the value of publicly listed companies in Kinross’ equity
portfolio. Should declines in the equity values continue and are deemed to be other than temporary, impairment losses
may result.
Cautionary Statement on Forward-Looking Information
All statements, other than statements of historical fact, contained or incorporated by reference in this Management’s
Discussion and Analysis, but not limited to, any information as to the future financial or operating performance of Kinross,
constitute ‘‘forward-looking information’’ or ‘‘forward-looking statements’’ within the meaning of certain securities laws,
including the provisions of the Securities Act (Ontario) and the provisions for ‘‘safe harbour’’ under the United States Private
Securities Litigation Reform Act of 1995 and are based on expectations, estimates and projections as of the date of this
Management’s Discussion and Analysis. Forward-looking statements include, without limitation, possible events, statements
with respect to possible events, the future price of gold and silver, the estimation of mineral reserves and resources, the
realization of mineral reserve and resource estimates, the timing and amount of estimated future production, costs of
production, expected capital expenditures, costs and timing of the development of new deposits, success of exploration,
development and mining activities, permitting timelines, currency fluctuations, requirements for additional capital,
government regulation and permitting of mining operations and development projects, environmental risks, unanticipated
reclamation expenses, title disputes or claims and limitations on insurance coverage. The words ‘‘plans’’, ‘‘expects’’ or ‘‘does
KINROSS GOLD CORPORATION 2010 ANNUAL REPORT 105
not expect’’, ‘‘is expected’’, ‘‘budget’’, ‘‘scheduled’’, ‘‘estimates’’, ‘‘forecasts’’, ‘‘guidance’’, ‘‘targets’’, ‘‘models’’, ‘‘intends’’,
‘‘anticipates’’, or ‘‘does not anticipate’’, or ‘‘believes’’, or variations of such words and phrases or statements that certain
actions, events or results ‘‘may’’, ‘‘could’’, ‘‘would’’, ‘‘should’’, ‘‘might’’, or ‘‘will be taken’’, ‘‘occur’’ or ‘‘be achieved’’ and
similar expressions identify forward-looking statements. Forward-looking statements are necessarily based upon a number
of estimates and assumptions that, while considered reasonable by Kinross as of the date of such statements, are inherently
subject to significant business, political, economic and competitive uncertainties and contingencies. The estimates and
assumptions of Kinross contained or incorporated by reference in this Management’s Discussion and Analysis, which may
prove to be incorrect, include, but are not limited to, the various assumptions set forth herein and in our most recently filed
Annual Information Form, or as otherwise expressly incorporated herein by reference as well as: (1) there being no
significant disruptions affecting operations, whether due to labour disruptions, supply disruptions, power disruptions,
damage to equipment or otherwise; (2) permitting, development, operations, expansion and acquisitions at Paracatu
(including, without limitation, land acquisitions for and permitting and construction of new tailings facilities) being consistent
with our current expectations; (3) development of the Phase 7 pit expansion and the heap leach project at Fort Knox
continuing on a basis consistent with Kinross’ current expectations; (4) the viability, permitting and development of the
Fruta del Norte deposit being consistent with Kinross’ current expectations; (5) political developments in any jurisdiction in
which the Company operates being consistent with its current expectations including, without limitation, the implementation
of Ecuador’s new mining law and related regulations and policies being consistent with Kinross’ current expectations;
(6) permitting, construction, development and production at Cerro Casale being consistent with the approved feasibility
study and the Company’s current expectations; (7) the viability, permitting and development of the Lobo-Marte project,
including, without limitation, the metallurgy and processing of its ore, being consistent with our current expectations; (8) the
exchange rate between the Canadian dollar, Brazilian real, Chilean peso, Russian rouble, Mauritanian ouguiya, Ghanaian cedi
and the U.S. dollar being approximately consistent with current levels; (9) certain price assumptions for gold and silver;
(10) prices for natural gas, fuel oil, electricity and other key supplies being approximately consistent with current levels;
(11) production and cost of sales forecasts for the Company, and entities in which it now or hereafter directly or indirectly
holds an investment, meeting expectations; (12) the accuracy of current mineral reserve and mineral resource estimates for
the Company and any entity in which it now or hereafter directly or indirectly holds an interest; (13) labour and materials
costs increasing on a basis consistent with Kinross’ current expectations; (14) the development of the Dvoinoye and
Vodorazdelnaya deposits being consistent with Kinross’ expectations;and (15) the viability of the Tasiast and Chirano mines,
and the development and expansion of the Tasiast and Chirano mines on a basis consistent with Kinross’ current
expectations. Known and unknown factors could cause actual results to differ materially from those projected in the
forward-looking statements. Such factors include, but are not limited to: fluctuations in the currency markets; fluctuations in
the spot and forward price of gold or certain other commodities (such as diesel fuel and electricity); changes in interest rates
or gold or silver lease rates that could impact the mark-to-market value of outstanding derivative instruments and ongoing
payments/receipts under any interest rate swaps and variable rate debt obligations; risks arising from holding derivative
instruments (such as credit risk, market liquidity risk and mark-to-market risk); changes in national and local government
legislation, taxation, controls, regulations and political or economic developments in Canada, the United States, Chile, Brazil,
Russia, Ecuador, Mauritania, Ghana or other countries in which the Company conducts business or may carry on business in
the future; business opportunities that may be presented to, or pursued by, the Company; the Company’s ability to
successfully integrate acquisitions; operating or technical difficulties in connection with mining or development activities;
employee relations; the speculative nature of gold exploration and development, including the risks of obtaining necessary
licenses and permits; diminishing quantities or grades of reserves; adverse changes in our credit rating; and contests over
title to properties, particularly title to undeveloped properties. In addition, there are risks and hazards associated with the
business of gold exploration, development and mining, including environmental hazards, industrial accidents, unusual or
unexpected formations, pressures, cave-ins, flooding and gold bullion losses (and the risk of inadequate insurance, or the
106

inability to obtain insurance, to cover these risks). Many of these uncertainties and contingencies can affect, and could
cause, Kinross’ actual results to differ materially from those expressed or implied in any forward-looking statements made
by, or on behalf of, Kinross. There can be no assurance that forward-looking statements will prove to be accurate, as actual
results and future events could differ materially from those anticipated in such statements. Forward-looking statements are
provided for the purpose of providing information about management’s expectations and plans relating to the future. All of
the forward-looking statements made in this Management’s Discussion and Analysis are qualified by these cautionary
statements and those made in our other filings with the securities regulators of Canada and the United States including, but
not limited to, the cautionary statements made in the ‘‘Risk Factors’’ section of our most recently filed Annual Information
Form. These factors are not intended to represent a complete list of the factors that could affect Kinross. Kinross disclaims
any intention or obligation to update or revise any forward-looking statements or to explain any material difference between
subsequent actual events and such forward-looking statements, except to the extent required by applicable law.
Key Sensitivities
Approximately 60%-70% of the Company’s costs are denominated in U.S. dollars.
A 10% change in foreign exchange could result in an approximate $7 impact in cost of sales per ounce (4).
A $10 change in the price of oil could result in an approximate $3 impact on cost of sales per ounce.
The impact on royalties of a $100 change in the gold price could result in an approximate $3 impact on cost of sales
per ounce.
Other information
Where we say ‘‘we’’, ‘‘us’’, ‘‘our’’, the ‘‘Company’’, or ‘‘Kinross’’ in this Management’s Discussion and Analysis, we mean
Kinross Gold Corporation and/or one or more or all of its subsidiaries, as may be applicable.
The technical information about the Company’s material mineral properties contained in this Management’s Discussion and
Analysis has been prepared under the supervision of Mr. Rob Henderson, an officer of the Company who is a ‘‘qualified
person’’ within the meaning of National Instrument 43-101.
(4) Refers to all of the currencies in the countries where the Company has mining operations, fluctuating simultaneously by 10% in the same direction, either appreciating or depreciating,taking into consideration the impact of hedging and the weighting of each currency within our consolidated cost structure.
KINROSS GOLD CORPORATION 2010 ANNUAL REPORT 107

26MAR2007213218323APR200619180130
MANAGEMENT’S RESPONSIBILITYFOR FINANCIAL STATEMENTS
The consolidated financial statements, the notes thereto and other financial information contained in the Management
Discussion and Analysis have been prepared in accordance with Canadian generally accepted accounting principles and are
the responsibility of the management of Kinross Gold Corporation. The financial information presented elsewhere in the
Management Discussion and Analysis is consistent with the data that is contained in the consolidated financial statements.
The consolidated financial statements, where necessary, include amounts which are based on the best estimates and
judgment of management.
In order to discharge management’s responsibility for the integrity of the financial statements, the Company maintains a
system of internal accounting controls. These controls are designed to provide reasonable assurance that the Company’s
assets are safeguarded, transactions are executed and recorded in accordance with management’s authorization, proper
records are maintained and relevant and reliable financial information is produced. These controls include maintaining
quality standards in hiring and training of employees, policies and procedures manuals, a corporate code of conduct and
ensuring that there is proper accountability for performance within appropriate and well-defined areas of responsibility. The
system of internal controls is further supported by a compliance function, which is designed to ensure that we and our
employees comply with securities legislation and conflict of interest rules.
The Board of Directors is responsible for overseeing management’s performance of its responsibilities for financial reporting
and internal control. The Audit Committee, which is composed of non-executive directors, meets with management as well as
the external auditors to ensure that management is properly fulfilling its financial reporting responsibilities to the Directors
who approve the consolidated financial statements. The external auditors have full and unrestricted access to the Audit
Committee to discuss the scope of their audits, the adequacy of the system of internal controls and review financial
reporting issues.
The consolidated financial statements have been audited by KPMG LLP, the independent registered chartered accountants,
in accordance with Canadian generally accepted auditing standards and standards of the Public Company Accounting
Oversight Board (United States).
Tye W. Burt Thomas M. Boehlert
President and Chief Executive Officer Executive Vice President
and Chief Financial Officer
Toronto, Canada
February 16, 2011
108

20DEC200611131390
REPORT OF INDEPENDENTCHARTERED ACCOUNTANTS
To the Shareholders of Kinross Gold Corporation
We have audited the accompanying consolidated financial statements of Kinross Gold Corporation, which comprise the
consolidated balance sheets as at December 31, 2010 and December 31, 2009, the consolidated statements of operations,
cash flows, common shareholders’ equity and comprehensive income (loss) for each of the years in the three-year period
ended December 31, 2010, and notes, comprising a summary of significant accounting policies and other explanatory
information.
Management’s Responsibility for the Consolidated Financial Statements
Management is responsible for the preparation and fair presentation of these consolidated financial statements in
accordance with Canadian generally accepted accounting principles, and for such internal control as management
determines is necessary to enable the preparation of consolidated financial statements that are free from material
misstatement, whether due to fraud or error.
Auditors’ Responsibility
Our responsibility is to express an opinion on these consolidated financial statements based on our audits. We conducted our
audits in accordance with Canadian generally accepted auditing standards and the standards of the Public Company
Accounting Oversight Board (United States). Those standards require that we comply with ethical requirements and plan and
perform the audit to obtain reasonable assurance about whether the consolidated financial statements are free from
material misstatement.
An audit involves performing procedures to obtain audit evidence about the amounts and disclosures in the consolidated
financial statements. The procedures selected depend on our judgment, including the assessment of the risks of material
misstatement of the consolidated financial statements, whether due to fraud or error. In making those risk assessments, we
consider internal control relevant to the entity’s preparation and fair presentation of the consolidated financial statements
in order to design audit procedures that are appropriate in the circumstances. An audit also includes evaluating the
appropriateness of accounting policies used and the reasonableness of accounting estimates made by management, as well
as evaluating the overall presentation of the consolidated financial statements.
We believe that the audit evidence we have obtained in our audits is sufficient and appropriate to provide a basis for our
audit opinions.
Opinion
In our opinion, the consolidated financial statements present fairly, in all material respects, the financial position of Kinross
Gold Corporation as at December 31, 2010 and December 31, 2009 and the results of its operations and its cash flows for
each of the years in the three-year period ended December 31, 2010 in accordance with Canadian generally accepted
accounting principles.
Chartered Accountants, Licensed Public Accountants
Toronto, Canada
February 16, 2011
KINROSS GOLD CORPORATION 2010 ANNUAL REPORT 109

31MAR200603404010 31MAR200603422026
CONSOLIDATEDBALANCE SHEETSAs at December 31
(expressed in millions of United States dollars, except share amounts) 2010 2009
Assets
Current assets
Cash, cash equivalents and short-term investments Note 5 $ 1,466.6 $ 632.4
Restricted cash 2.1 24.3
Accounts receivable and other assets Note 5 329.4 135.5
Inventories Note 5 737.0 554.4
Unrealized fair value of derivative assets Note 8 133.4 44.3
2,668.5 1,390.9
Property, plant and equipment Note 5 6,911.5 4,989.9
Goodwill Note 5 5,980.0 1,179.9
Long-term investments Note 5 629.9 292.2
Unrealized fair value of derivative assets Note 8 2.6 1.9
Deferred charges and other long-term assets Note 5 204.6 158.4
$ 16,397.1 $ 8,013.2
Liabilities
Current liabilities
Accounts payable and accrued liabilities Note 5 $ 496.6 $ 312.9
Current portion of long-term debt Note 9 48.4 177.0
Current portion of reclamation and remediation obligations Note 10 23.1 17.1
Current portion of unrealized fair value of derivative liabilities Note 8 359.3 131.0
927.4 638.0
Long-term debt Note 9 454.6 515.2
Other long-term liabilities Note 5 532.4 543.0
Future income and mining taxes Note 14 883.8 624.6
2,798.2 2,320.8
Non-controlling interest Note 5 198.4 132.9
Common shareholders’ equity
Common share capital and common share purchase warrants Note 11 $ 13,468.6 $ 6,448.1
Contributed surplus 231.7 169.6
Accumulated deficit (137.1) (838.1)
Accumulated other comprehensive loss Note 6 (162.7) (220.1)
13,400.5 5,559.5
Contingencies Note 18Subsequent events Notes 8
$ 16,397.1 $ 8,013.2
Common shares
Authorized Unlimited Unlimited
Issued and outstanding 1,133,294,930 696,027,270
Signed on behalf of the Board:
John A. Brough John M.H. Huxley
Director Director
The accompanying notes are an integral part of these consolidated financial statements
110

CONSOLIDATED STATEMENTSOF OPERATIONSFor years ended December 31
(expressed in millions of United States dollars, except share amounts) 2010 2009 2008
Revenue
Metal sales $ 3,010.1 $ 2,412.1 $ 1,617.0
Operating costs and expenses
Cost of sales (excludes accretion, depreciation, depletion and
amortization) 1,255.4 1,047.1 768.8
Accretion and reclamation expense 29.0 19.3 24.7
Depreciation, depletion and amortization 517.5 447.3 273.8
1,208.2 898.4 549.7
Other operating costs 53.8 62.3 7.4
Exploration and business development 142.7 72.5 59.0
General and administrative 144.5 117.7 100.8
Impairment charges: goodwill - - 994.1
Operating earnings (loss) 867.2 645.9 (611.6)
Other income (expense) - net Note 5 293.0 (74.3) (42.7)
Earnings (loss) before taxes and other items 1,160.2 571.6 (654.3)
Income and mining taxes expense - net (275.4) (150.8) (101.1)
Equity in losses of associated companies Note 5 (3.9) (8.6) (8.7)
Non-controlling interest Note 5 (109.3) (102.3) (42.3)
Dividends on convertible preferred shares of subsidiary - - (0.8)
Net earnings (loss) $ 771.6 $ 309.9 $ (807.2)
Earnings (loss) per share
Basic $ 0.94 $ 0.45 $ (1.28)
Diluted $ 0.93 $ 0.44 $ (1.28)
Weighted average number of common shares outstanding
(millions)
Basic Note 13 824.5 691.5 628.6
Diluted Note 13 829.2 696.5 628.6
The accompanying notes are an integral part of these consolidated financial statements
KINROSS GOLD CORPORATION 2010 ANNUAL REPORT 111

CONSOLIDATED STATEMENTSOF CASH FLOWSFor the years ended December 31
(expressed in millions of United States dollars) 2010 2009 2008
Net inflow (outflow) of cash related to the following activities:Operating:Net earnings (loss) $ 771.6 $ 309.9 $ (807.2)Adjustments to reconcile net earnings (loss) to net cash
provided from operating activities:Depreciation, depletion and amortization 517.5 447.3 273.8Accretion and reclamation expenses Note 10 29.0 19.3 24.7Accretion of convertible debt and deferred financing costs 18.4 17.1 15.4Impairment charges:
Goodwill Note 5 - - 994.1Investments and other assets - - 83.9
Gain on disposal of assets and investments - net Notes 4,5 (348.5) (16.2) (30.2)Equity in losses of associated companies Note 5 3.9 8.6 8.7Non-hedge derivative losses - net Note 5 20.1 (2.9) (41.6)Future income and mining taxes Note 14 (79.2) (27.9) 27.9Non-controlling interest Note 5 109.3 102.3 42.3Stock-based compensation expense Note 12 33.0 29.0 21.6Foreign exchange losses and Other 16.1 50.7 21.2Brazilian tax settlement Note 18 - (71.0) -Changes in operating assets and liabilities:
Accounts receivable and other assets (82.9) (14.9) (33.7)Inventories (98.5) (115.1) (145.4)Accounts payable and other liabilities 58.6 49.4 (11.9)
Cash flow provided from operating activities 968.4 785.6 443.6
Investing:Additions to property, plant and equipment Note 15 (563.7) (481.2) (714.7)Asset purchases - net of cash acquired Note 4 504.0 (41.7) 21.2Net proceeds from the sale of long-term investments and
other assets 846.4 6.7 37.3Net acquisitions of long-term investments and other assets (617.8) (178.1) (168.9)Net proceeds from the sale of property, plant and equipment 3.1 0.9 -Disposals (additions) to short-term investments 35.0 (0.5) (24.6)Decrease (increase) in restricted cash 22.2 (11.9) (10.0)Other 2.6 (45.7) 3.5
Cash flow provided from (used in) investing activities 231.8 (751.5) (856.2)
Financing:Issuance of common shares Note 12 - 396.4 -Issuance of common shares on exercise of options and
warrants 15.9 25.1 31.7Proceeds from issuance of debt 127.3 77.7 123.2Proceeds from issuance of convertible debentures - - 449.9Debt issuance costs - - (1.6)Repayment of debt (334.9) (325.9) (123.5)Dividends paid to common shareholders (70.6) (62.4) (51.5)Dividends paid to non-controlling shareholders Note 5 (47.7) (25.8) -Settlement of derivative instruments (27.3) (19.4) (23.2)Other - (2.4) (29.3)
Cash flow provided from (used in) financing activities (337.3) 63.3 375.7
Effect of exchange rate changes on cash 6.3 9.4 (23.8)
Increase (decrease) in cash and cash equivalents 869.2 106.8 (60.7)Cash and cash equivalents, beginning of year 597.4 490.6 551.3
Cash and cash equivalents, end of year $ 1,466.6 $ 597.4 $ 490.6
Short-term investments $ - $ 35.0 $ 34.5
Cash, cash equivalents and short-term investments $ 1466.6 $ 632.4 $ 525.1
The accompanying notes are an integral part of these consolidated financial statements
112

CONSOLIDATED STATEMENTS OFCOMMON SHAREHOLDERS’ EQUITYFor the year ended December 31
(expressed in millions of United States dollars) 2010 2009 2008
Common share capital and common share purchase warrants
Balance beginning of year $ 6,448.1 $ 5,873.0 $ 5,123.6
Shares issued on equity offering - 396.4 -
Shares issued on acquisition of Lobo-Marte - 102.9 -
Shares issued on acquisition of Aurelian - - 639.7
Shares issued on acquisition of Underworld 117.7 - -
Shares issued on acquisition of Dvoinoye 173.9 - -
Shares issued on acquisition of Red Back 6,549.3 - -
Warrants issued on acquisition of Aurelian - - 56.0
Warrants issued on acquisition of Red Back 117.7 - -
Common shares issued for employee share purchase plan 5.5 4.4 3.4
Transfer from contributed surplus on exercise of options and
restricted shares 44.0 24.2 18.6
Options and warrants exercised, including cash 12.4 47.2 31.7
Balance at the end of the year $ 13,468.6 $ 6,448.1 $ 5,873.0
Contributed surplus
Balance beginning of year $ 169.6 $ 168.5 $ 65.4
Equity portion of convertible notes - - 76.6
Stock-based compensation 31.1 25.3 19.2
Bema options exercised - (0.1) -
Aurelian options issued (exercised) (4.3) (7.6) 25.9
Underworld options issued 5.3 - -
Underworld options exercised (2.8) - -
Red Back options issued 69.8 - -
Red back options exercised (19.8) - -
Transfer of fair value of exercised options and restricted shares (17.2) (16.5) (18.6)
Balance at the end of the year $ 231.7 $ 169.6 $ 168.5
Accumulated deficit
Balance beginning of year $ (838.1) (1,100.2) (253.1)
Adoption of new accounting policy - 14.6 11.0
Dividends paid (70.6) (62.4) (50.9)
Net earnings (loss) 771.6 309.9 (807.2)
Balance at the end of the year $ (137.1) $ (838.1) $ (1,100.2)
Accumulated other comprehensive income (loss)
Balance beginning of year $ (220.1) $ (164.4) $ (98.1)
Adoption of new accounting policy - 1.6 -
Adjusted balance, beginning of year $ (220.1) $ (162.8) $ (98.1)
Other comprehensive income (loss) 57.4 (57.3) (66.3)
Balance at the end of the year $ (162.7) $ (220.1) $ (164.4)
Total accumulated deficit and accumulated other comprehensive
loss $ (299.8) $ (1,058.2) $ (1,264.6)
Total common shareholders’ equity $ 13,400.5 $ 5,559.5 $ 4,776.9
The accompanying notes are an integral part of these consolidated financial statements
KINROSS GOLD CORPORATION 2010 ANNUAL REPORT 113

CONSOLIDATED STATEMENTS OFCOMPREHENSIVE INCOME (LOSS)For the years ended December 31
(expressed in millions of United States dollars) 2010 2009 2008
Net earnings (loss) $ 771.6 $ 309.9 $ (807.2)
Other comprehensive income (loss), net of tax: Note 6
Change in fair value of investments (a) 331.4 42.2 (72.0)
Accumulated OCI related to investments sold (b) (70.8) 3.2 -
Reclassification of accumulated OCI related to the investment in
Red Back (b),(e) (209.3) - -
Reclassification of accumulated OCI related to the investment in
Underworld (b),(f) (7.4) - -
Change in fair value of derivative financial instruments
designated as cash flow hedges (c) (75.2) (135.5) (80.3)
Reclassification to earnings for impairment charges - - 47.0
Accumulated OCI related to derivatives settled (d) 88.7 32.8 39.0
57.4 (57.3) (66.3)
Total comprehensive income (loss) $ 829.0 $ 252.6 $ (873.5)
(a) Net of tax of $4.0 million (2009 - $4.0 million; 2008 - $(2.1) million).
(b) Net of tax of $nil (2009 - $nil; 2008 - $nil).
(c) Net of tax of $13.5 million (2009 - $20.0 million; 2008 - $13.2 million).
(d) Net of tax of $(13.2) million (2009 - $8.5 million; $3.1 million).
(e) See Note 4(vii).
(f) See Note 4(ii).
The accompanying notes are an integral part of these consolidated financial statements
114

NOTES TO THE CONSOLIDATEDFINANCIAL STATEMENTSFor the years ended December 31, 2010, 2009, and 2008
(in millions of United States dollars)
1. DESCRIPTION OF BUSINESS AND NATURE OF OPERATIONS
Kinross Gold Corporation (individually and collectively with its subsidiaries, as applicable, ‘‘Kinross’’ or the ‘‘Company’’) is
engaged in gold mining and related activities, including exploration and acquisition of gold-bearing properties, extraction,
processing and reclamation. Kinross’ gold production and exploration activities are carried out principally in Canada, the
United States, the Russian Federation, Brazil, Ecuador, Chile, Ghana, and Mauritania. Gold is produced in the form of dore, which
is shipped to refineries for final processing. Kinross also produces and sells a quantity of silver.
The operating cash flow and profitability of the Company are affected by various factors, including the amount of gold and
silver produced and sold, the market prices of gold and silver, operating costs, interest rates, regulatory and environmental
compliance, the level of exploration activity and capital expenditures, general and administrative costs, and other discretionary
costs and activities. Kinross is also exposed to fluctuations in currency exchange rates, interest rates, political risk and varying
levels of taxation that can impact profitability and cash flow. Kinross seeks to manage the risks associated with its business
operations; however, many of the factors affecting these risks are beyond the Company’s control.
Certain comparative figures for 2009 and 2008 have been reclassified to conform to the 2010 financial statement
presentation.
2. SUMMARY OF SIGNIFICANT ACCOUNTING POLICIES AND ACCOUNTING CHANGES
The consolidated financial statements of Kinross have been prepared in accordance with Canadian generally accepted
accounting principles (‘‘CDN GAAP’’) using the following significant accounting policies, and are expressed in
United States dollars.
KINROSS GOLD CORPORATION 2010 ANNUAL REPORT 115

Accounting policies
i Basis of presentation and principles of consolidation:
The consolidated financial statements include the accounts of the Company and all its subsidiaries and investments. The
Company’s significant mining properties are listed below:
As at December 31,
Location 2010 2009 2008
Through majority owned subsidiaries (Consolidated)
Fort Knox USA 100% 100% 100%
Paracatu Brazil 100% 100% 100%
Maricunga Chile 100% 100% 100%
La Coipa Chile 100% 100% 100%
Kettle River USA 100% 100% 100%
Kupol (a) Russian Federation 75% 75% 75%
Lobo-Marte (b) Chile 100% 100% 40%
Fruta del Norte Ecuador 100% 100% 100%
Tasiast (c) Mauritania 100% - -
Chirano (c) Ghana 90% - -
Dvoinoye (d) Russian Federation 100% - -
White Gold (e) Canada 100% - -
As interests in unincorporated joint ventures (Proportionately
consolidated)
Round Mountain USA 50% 50% 50%
As interests in incorporated joint ventures (Proportionately
consolidated)
Cerro Casale (f) Chile 25% 50% 49%
Crixas Brazil 50% 50% 50%
(a) Interests in Kupol was acquired with the acquisition of Bema on February 27, 2007.
(b) A 40% interest in Lobo-Marte was acquired on December 16, 2008. The remaining 60% interest was acquired on January 7, 2009.
(c) Interests in Tasiast and Chirano were acquired with the acquisition of Red Back Mining Inc. (‘‘Red Back’’) on September 17, 2010.
(d) On August 27, 2010, Dvoinoye was acquired with the acquisition of Northern Gold LLC and Regionruda LLC.
(e) On April 26, 2010, 81.6% of White Gold was acquired with the acquisition of Underworld Resources Inc. (‘‘Underworld’’). The remaining 18.4% was acquired on June 30, 2010.
(f) A 49% interest in Cerro Casale was acquired with the acquisition of Bema on February 27, 2007. An additional 1% interest was acquired during 2009. Subsequently, on March 31, 2010,a 25% interest was sold. Total retained interest in Cerro Casale is 25%, as at December 31, 2010, and is accounted for using the equity method.
ii Use of estimates
The preparation of the Company’s consolidated financial statements in conformity with CDN GAAP requires management to
make estimates and assumptions that affect amounts reported in the consolidated financial statements and accompanying
notes. These estimates and assumptions affect the reported amounts of assets and liabilities and disclosures of contingent
assets and liabilities at the date of the consolidated financial statements and the reported amounts of revenues and
expenses during the reporting period. Changes in estimates of useful lives are accounted for prospectively from the date of
change. Actual results could differ from these estimates. The assets and liabilities which require management to make
significant estimates and assumptions in determining carrying values include, but are not limited to, property, plant and
equipment, mineral interests, inventories, financial instruments, goodwill, long-term investments, reclamation and
remediation obligations, and the provision for income and mining taxes.
116

iii Functional and reporting currency
The functional currency of the Company and its subsidiaries is the United States dollar. The Company and its subsidiaries and
joint ventures operate in Canada, the United States, the Russian Federation, Brazil, Ecuador, Chile, Ghana, and Mauritania.
Monetary assets and liabilities of the Company’s operations denominated in currencies other than the United States dollar
are translated into U.S. dollars at the rates of exchange at the consolidated balance sheet dates. Non-monetary assets and
liabilities are translated at historical exchange rates prevailing at each transaction date. Revenue and expenses are
translated at average exchange rates throughout the reporting period, with the exception of depreciation, depletion and
amortization and the expense related to equity settled stock-based compensation which are translated at historical
exchange rates. Gains and losses on translation of foreign currencies are included in earnings.
The cumulative translation adjustments included in Accumulated other comprehensive income (‘‘AOCI’’) relate to unrealized
translation gains and losses on the Company’s net investment in self-sustaining operations, including equity-accounted
investees that are translated using the current rate method. The exchange gains and losses will become realized in earnings
upon the substantial disposition, liquidation or closure of the investment that gave rise to such amounts.
iv Cash and cash equivalents
Cash and cash equivalents include cash and highly liquid investments with a maturity of three months or less at the date
of acquisition.
v Short-term investments
Short-term investments include short-term money market instruments with terms to maturity at the date of acquisition of
between three and twelve months. The carrying value of short-term investments is equal to cost and accrued interest.
vi Long-term investments including Working Interests, Impairment of Investments and Other Assets
Long-term investments in equity securities consist of investments that are accounted for using the equity method and
investments that are designated as available-for-sale. If the Company can exert significant influence over an investee
company, the investment in the investee company is accounted for using the equity method. Available for sale investments
are measured at fair value with changes in fair value recorded in Other comprehensive income (‘‘OCI’’) until such gains and
losses are realized or an other-than-temporary impairment is determined to have occurred. The Company periodically
reviews the carrying value of its investments. When a decline in the value of an investment is considered to be
other-than-temporary, the investment is written down to fair value with a charge to other income (expense).
Earnings from Working Interests are accounted for based on Kinross’ pro-rata share of earnings in the underlying entity. The
cost of the Working Interest plus any funding contributions made, less any cash distributions received in excess of Kinross’
share of post acquisition earnings are amortized on a units of production basis corresponding to the Proven and Probable
Reserves of the underlying entity Kinross has invested in. Changes in the investment in Working Interests include changes as
a result of Kinross’ pro-rata share of net income or loss and are accounted for in the statement of operations as earnings
from Working Interests within other income (expense). Cash received from the Working Interest is accounted for as a
reduction, while funding contributions into the Working Interest are accounted for as an increase in the carrying value of the
Working Interest on the balance sheet.
vii Inventories
Inventories consisting of metal in circuit ore, metal in-process and finished metal are valued at the lower of cost or net
realizable value (‘‘NRV’’). NRV is calculated as the difference between the estimated gold prices based on prevailing and
long-term metal prices and estimated costs to complete production into a saleable form.
Metal in circuit is comprised of ore in stockpiles and ore on heap leach pads. Ore in stockpiles is coarse ore that has been
extracted from the mine and is available for further processing. Costs are added to stockpiles based on the current mining
cost per tonne and removed at the average cost per tonne. Costs are added to ore on the heap leach pads based on current
KINROSS GOLD CORPORATION 2010 ANNUAL REPORT 117

mining costs and removed from the heap leach pads as ounces are recovered, based on the average cost per recoverable
ounce of gold on the leach pad. Ore in stockpiles not expected to be processed in the next twelve months is classified
as long-term.
In-process inventories represent materials that are in the process of being converted to a saleable product.
The quantities of recoverable gold placed on the leach pads are reconciled by comparing the grades of ore placed on the
leach pads to the quantities of gold actually recovered (metallurgical balancing), however, the nature of the leaching process
inherently limits the ability to precisely monitor inventory levels. As a result, the metallurgical balancing process is
constantly monitored and the engineering estimates are refined based on actual results over time. Variances between actual
and estimated quantities resulting from changes in assumptions and estimates that do not result in write-downs to NRV are
accounted for on a prospective basis. The ultimate recovery of gold from a leach pad will not be known until the leaching
process has concluded. In the event that the Company determines, based on engineering estimates, that a quantity of gold
contained in ore on leach pads is to be recovered over a period exceeding twelve months, that portion is classified
as long-term.
In process and finished metal inventories, comprised of gold and silver dore and bullion, are valued at the lower of the
previous three month average production cost and NRV whereby the average does not exceed three month production
costs. Average production cost represents the average cost of the respective in-process inventories incurred prior to the
refining process, plus applicable refining costs and associated royalties.
Materials and supplies are valued at the lower of average cost and NRV.
Write-downs of inventory are reported in current period costs. The Company reverses write-downs in the event that there is
a subsequent increase in NRV.
viii Property, plant and equipment and Impairment of property, plant and equipment
New facilities, plant and equipment are recorded at cost and carried net of depreciation. Mobile and other equipment are
depreciated, net of residual value, using the straight-line method, over the estimated productive life of the asset. Productive
lives for mobile and other equipment range from 2 to 25 years, but do not exceed the related estimated mine life based on
Proven and Probable Reserves. Plant and other facilities, used in carrying out the mine operating plan, are depreciated using
the units-of-production (‘‘UOP’’) method over a period not to exceed the estimated life of the ore body based on recoverable
ounces to be mined from estimated Proven and Probable Reserves. Repairs and maintenance expenditures are expensed as
incurred. Expenditures that extend the useful lives of existing facilities or equipment are capitalized and depreciated over the
remaining useful life of the related asset.
Exploration costs are incurred in gathering the information necessary to determine whether a particular property can
become a commercially viable operating mine and include costs to determine whether a property adjacent to a property with
Proven and Probable Reserves has Proven and Probable Reserves, whether Inferred Resources can be classified as
Measured and Indicated Resources, or whether Measured and Indicated Resources can be converted to Proven and Probable
Reserves. These costs are expensed as incurred. When it has been determined than an exploration property can be
economically developed as a result of establishing Proven and Probable Reserves, costs incurred prospectively to develop
the property and place it into commercial production are classified as development costs and capitalized as they are incurred
until the asset is ready for its intended use.
Costs incurred in a pit expansion are capitalized and amortized using the UOP method based on recoverable ounces to be
mined from estimated Proven and Probable Reserves contained in the pit expansion. Production stage mineral interests are
depleted over the life of mine using the UOP method based on recoverable ounces to be mined from estimated Proven and
Probable Reserves.
Costs to acquire mineral properties are capitalized and represent the property’s fair value at the time it was acquired, either
as an individual asset purchase or as part of a business combination.
118

Interest expense attributable to the cost of developing mining properties and to constructing new facilities is capitalized until
assets are ready for their intended use.
The expected useful lives used in depletion calculations are determined based on the facts and circumstances associated
with the mineral interest. The Company evaluates the Proven and Probable Reserves at least on an annual basis and adjusts
the UOP calculation upon which depletion is based, to correspond with the changes in reserves as necessary. Any changes in
estimates of useful lives are accounted for prospectively from the date of the change.
Kinross reviews and evaluates the carrying value of its operating mines, development and exploration properties for
impairment whenever events or changes in circumstances indicate that the carrying amounts of related assets or groups of
assets might not be recoverable.
Whenever the total estimated future cash flows on an undiscounted basis of a property is less than the carrying amount of
the property, an impairment loss is measured and recorded based on fair values. Future cash flows are based on estimated
future recoverable mine production, sales prices, production levels and costs, capital requirements and reclamation and
remediation obligations, which are all based on detailed engineering life of mine plans. Future recoverable mine production is
determined from Proven and Probable Reserves and Measured, Indicated and Inferred Mineral Resources, net of losses
during ore processing and treatment. Cash flow estimates of recoverable production are risk-adjusted to reflect relative
geological uncertainty, with Proven and Probable Reserves and Measured and Indicated Resources assigned a lower discount
rate and Inferred Resources assigned a higher discount rate. All long-lived assets at a particular operation are combined for
purposes of estimating future cash flows.
Exploration properties are assessed for impairment by comparing the carrying value against the fair value. Fair value may be
determined based on values of recent transactions involving sales of similar properties or through a discounted cash flow
analysis based on a life-of-mine plan.
ix Goodwill and goodwill impairment
Business acquisitions are accounted for using the purchase method whereby acquired assets and liabilities are recorded at
fair value as of the date of acquisition with the excess of the purchase price over such fair value recorded as goodwill.
Goodwill is assigned to the reporting units and is not amortized.
Included in the fair value of property, plant and equipment and mineral properties is Value beyond Proven and Probable
Reserves (‘‘VBPP’’) resulting from Kinross’ acquisitions. The concept of VBPP is described in FASB Emerging Issues Task
Force (‘‘EITF’’) Issue No. 04-3, ‘‘Mining Assets: Impairment and Business Combinations,’’ and the Emerging Issues Committee
abstract ‘‘EIC-152 - Mining assets - Impairment and Business Combinations’’ and has been interpreted differently by different
mining companies. Kinross’ acquisition adjustments to property, plant and equipment include VBPP attributable to
mineralized material, which includes Measured and Indicated amounts that the Company believes could be brought into
production, and Inferred Resources. In addition, as part of a business acquisition, the Company may acquire land with mineral
rights (‘‘exploration properties’’), which is the area adjacent and contiguous to existing mines or properties containing
reserves, resources or without any identified exploration targets. The exploration properties are valued based on prices paid
for similar types of properties in market transactions.
Goodwill is attributed to the following factors:
• Expected additional value (‘‘EAV’’) from identified exploration targets at the reporting unit is calculated based on
management’s estimates of the ounces at such targets, based on the specific geological attributes of the mineral property
and based on prices in market transactions involving properties with similar exploration targets;
• The optionality (real option value associated with the portfolio of acquired mines as well as each individual mine) to
develop additional, higher-cost reserves and to intensify efforts to develop the more promising acquired properties and
reduce efforts at developing the less promising acquired properties in the future. This optionality may result from changes
in the overall economics of an individual mine or a portfolio of mines, largely driven by changes in the gold price; and
KINROSS GOLD CORPORATION 2010 ANNUAL REPORT 119

• The going concern value of the Company’s capacity to replace and augment reserves through completely new discoveries
whose value is not reflected in any of the other valuations.
The value associated with EAV is assigned to reporting units at the date of acquisition. Residual goodwill represented by
optionality and going-concern value as described above, is also assigned to reporting units at the date of acquisition.
However, the Company assigns residual goodwill to reporting units using a relative fair value methodology.
The Company evaluates the carrying amount of goodwill allocated to reporting units on an annual basis and at any other
time if events or changes in circumstances indicate that the fair value of a reporting unit may have been impaired. The
Company compares the estimated fair value of reporting units to which goodwill was allocated to the carrying amounts. If
the carrying value of a reporting unit were to exceed its estimated fair value, the Company would compare the implied fair
value of the reporting unit’s goodwill to its carrying amount. Any excess of the carrying value over the fair value is charged
to earnings.
In testing goodwill for impairment, the Company compares the estimated fair value of reporting units to which goodwill was
allocated to the carrying amounts. Fair value of the reporting unit for the purposes of impairment testing, is comprised of
the following:
• Discounted nominal cash flows of reserves and resources, which includes estimates for capital expenditures.
• Fair value of exploration properties based on market comparable data.
• EAV at the impairment testing date.
Discounted nominal cash flows are estimated based on the Company’s life-of-mine plans and include the following estimates
and assumptions:
• estimated future recoverable mine production based on Proven and Probable Reserves, Measured, Indicated and Inferred
Resources, metal grades and processing and recovery rates;
• metal prices, foreign exchange, inflation, tax rates and operating and abandonment costs, and
• Capital expenditures, which are all based on life-of-mine plans representing the budgets and long-term business plans for
each reporting unit.
The fair value arrived at as described above, is the Company’s estimate of fair value for accounting purposes and is not a
‘‘preliminary assessment’’ as defined in National Instrument 43-101 - Standards of Disclosure for Mineral Projects.
The use of estimates and assumptions is subjective and therefore it is possible that actual future cash flows may differ
significantly from projected future results prepared using numerous estimates and assumptions. Each of the estimates and
assumptions noted above are subject to significant risks and uncertainties.
In applying the Company’s accounting policy at impairment testing dates, no value is computed or attributed for the
optionality and the going concern value, which are contributors to goodwill at the time that the reporting units were
acquired. Under the Company’s accounting policy these amounts are considered to exist at the corporate level and cannot be
attributed to individual reporting units or individual mines. By not attributing any value to the optionality and going-concern
value at the individual mines an impairment of acquired goodwill, with all other assumptions including gold price and
reserves remaining constant, is likely to occur at the time of the first impairment test after acquisition. Positive changes in
valuation inputs such as the gold price and reserves in the period prior to the impairment test could moderate or eliminate
any impairment.
x Financial Instruments and hedging activity
Financial instruments are measured at fair value on initial recognition of the instrument. Measurement in subsequent periods
depends on whether the financial instrument has been classified as ‘‘held-for-trading’’, ‘‘available for sale’’,
120

‘‘held-to-maturity’’, ‘‘loans and receivables’’, or ‘‘other financial liabilities’’ as defined by the Canadian Institute of Chartered
Accountants (‘‘CICA’’) Handbook Section 3855 Financial Instruments - Recognition and Measurement (‘‘Section 3855’’).
Financial assets and financial liabilities ‘‘held-for-trading’’ are measured at fair value with changes in those fair values
recognized in net earnings. Financial assets ‘‘available for sale’’ are measured at fair value, with changes in those fair values
recognized in OCI except for other-than-temporary impairment which is recorded as a charge to Other income (expense).
Financial assets ‘‘held-to-maturity’’, ‘‘loans and receivables’’ and ‘‘other financial liabilities’’ are measured at amortized cost
using the effective interest method of amortization.
Cash and cash equivalents, restricted cash, short-term investments and marketable securities are designated as ‘‘held for
trading’’ and are measured at fair value. Trade receivables, taxes recoverable and other assets are designated as ‘‘loans and
receivables’’. Long-term investments in equity securities, where the company cannot exert significant influence, are
designated as ‘‘available-for sale’’. Accounts payable and accrued liabilities and long-term debt are designated as ‘‘other
financial liabilities’’. The Company’s policy is to record financial assets and liabilities net of transaction costs.
Derivative assets and liabilities include derivative financial instruments that do not qualify as hedges, or are not designated
as hedges and are classified as ‘‘held-for-trading’’.
The Company formally documents all relationships between hedging instruments and hedged items, as well as its risk
management objectives and strategies for undertaking the hedge transactions. This process includes linking all derivatives to
specific assets and liabilities on the balance sheet or to specific firm commitments or forecasted transactions. Hedge
effectiveness is assessed based on the degree to which the cash flows from the derivative contracts are expected to offset
the cash flows of the underlying position or transaction being hedged. At the time of inception of the hedge and on an
ongoing basis, the Company assesses whether the derivatives that are used in hedging transactions are highly effective in
offsetting changes in fair values or cash flows of hedged items. The effective portion of changes in the fair value of
derivatives designated as cash flow hedges is recorded in OCI, net of tax, until earnings are affected by the hedged item, with
any ineffective portion being included immediately in net earnings.
Derivative contracts that have been designated as cash flow hedges have been entered into in order to effectively establish
prices for future production of metals, to hedge exposure to exchange rate fluctuations of foreign currency denominated
settlement of capital and operating expenditures, to establish prices for future purchases of energy or to hedge exposure to
interest rate fluctuations. Unrealized gains or losses on these contracts remain in OCI and are included in earnings when the
underlying hedged transaction, identified at the contract inception, is completed. The Company has made the policy choice
to match the realized gains or losses on contracts designated as cash flow hedges with the hedged expenditures at the
maturity of the contracts.
Realized and unrealized gains or losses associated with designated cash flow hedges which have been terminated or cease to
be effective prior to maturity, remain in OCI and are included in earnings in the period in which the underlying hedged
transaction is recognized.
For hedges that do not qualify for hedge accounting, gains or losses are recorded in income in the current period. Premiums
received at the inception of written call options are recorded as a liability. Changes in the fair value of the liability are
recognized in current earnings.
The estimated fair value of all derivative instruments is based on quoted market prices or, in their absence, third-party
market indications and forecasts.
In the event that financial instruments that qualified for hedge accounting no longer qualify for hedge accounting, any gains
or losses recorded in OCI up until the time the hedge did not qualify for hedge accounting, remain in OCI. Amounts in OCI are
recorded in income in the period in which the hedge is settled. Gains or losses subsequent to the hedge not qualifying for
hedge accounting are included in earnings in the current period.
KINROSS GOLD CORPORATION 2010 ANNUAL REPORT 121

xi Stock-based incentive and compensation plans
The Company’s stock-based incentive and compensation plans are comprised of the following plans.
Employee Share Purchase Plan (‘‘ESPP’’): The Company’s contribution to the ESPP is recorded as compensation expense on
a payroll cycle basis as the employer’s obligation to contribute is incurred. The cost of the common shares issued under the
ESPP is based on the average of the last twenty trading sessions prior to the end of the quarter.
Restricted Share Unit Plan: Restricted share units (‘‘RSU’’) are only settled in equity and are valued using the market value of
the underlying stock at the grant date. The Company’s compensation expense is recognized on a straight-line basis over the
vesting period. Adjustments to compensation expense for employment vesting requirements are accounted for in the period
when they occur. On exercise of RSUs, the shares are issued from treasury.
Deferred Share Unit Plan: Deferred share units are settled in cash and accounted for as a liability as of the grant date based
on the market value at the grant date. The value of the liability is re-measured each period based on the current market
value of the underlying stock at period end and any changes in the liability are recorded as compensation expense
each period.
Stock Option Plan: The fair value of stock options at the grant date is estimated using the Black-Scholes option pricing model.
Compensation expense is recognized on a straight-line basis over the stock option vesting period. Adjustments to
compensation expense due to not meeting employment vesting requirements are accounted for based on an estimated
forfeiture rate and adjusted to actual on an annual basis.
xii Revenue recognition
Metal sales includes sales of refined gold and silver, which are generally delivered to customers in the period in which they
are produced, with their sales price based on prevailing spot market metal prices. Metal sales revenue is recognized when the
sales price is fixed, title has passed to the customer, and collectability is reasonably assured.
xiii Reclamation and remediation obligations
The Company records a liability and corresponding asset for estimated costs for future site reclamation and closure. The
estimated present value of the asset retirement obligations are reassessed on an annual basis or when new material
information becomes available. Increases or decreases to the obligation usually arise due to changes in legal or regulatory
requirements, the extent of environmental remediation required or methods of reclamation or cost estimates. The present
value of the estimated costs of these changes are recorded in the period in which the change is identified and quantified.
Changes to asset retirement obligations related to operating mines are recorded with an offsetting change to the related
asset. For properties where mining activities have ceased or are in reclamation, changes are charged directly to earnings.
The present value is determined using the Company’s credit adjusted risk free interest rate.
xiv Income and mining taxes
The Company uses the liability method of accounting for income and mining taxes. Under the liability method, future tax
assets and liabilities are recognized for the future tax consequences attributable to differences between the financial
statement carrying amounts of existing assets and liabilities and their respective tax bases and for tax losses and other
deductions carried forward. In a business acquisition, the cost of the acquisition is allocated to the assets and liabilities
acquired by reference to their fair values at the date of acquisition. Temporary differences that exist between the assigned
values and the tax bases of the related assets and liabilities, result in either future income tax liabilities or assets. These
future income tax assets and liabilities are treated as identifiable assets and liabilities when allocating the cost of the
purchase and are considered monetary items.
Future tax assets and liabilities are measured using enacted or substantively enacted tax rates expected to apply when the
asset is realized or the liability settled. A reduction in respect of the benefit of a future tax asset, a valuation allowance, is
122

recorded against any future tax asset if it is not likely to be realized. The effect on future tax assets and liabilities of a change
in tax rates is recognized in income in the period in which the change is substantively enacted.
xv Earnings (loss) per share
Earnings (loss) per share calculations are based on the weighted average number of common shares and common share
equivalents issued and outstanding during the year. Diluted earnings (loss) per share is calculated using the treasury
method, except the if-converted method is used in assessing the dilution impact of convertible debentures and preferred
shares. The treasury method assumes that outstanding stock options, warrants and restricted share units with an average
exercise price below market price of the underlying shares, are exercised and the assumed proceeds are used to repurchase
common shares of the Company at the average market price of the common shares for the period. The if-converted method
assumes that all debentures and preferred shares have been converted in determining fully diluted EPS.
3. ACCOUNTING CHANGES AND RECENT PRONOUNCEMENTS
Accounting changes
(i) In May 2007, the CICA issued Section 3031 ‘‘Inventories’’ (‘‘Section 3031’’) that superseded Handbook Section 3030
to converge Canadian standards with IAS 2, Inventories. This standard requires: that inventories be measured at the
lower of cost and net realizable value; that the allocation of overhead be based on normal capacity; the use of the
specific cost method for inventories that are not normally interchangeable or goods and services produced for specific
purposes; the use of a consistent cost formula for inventory of a similar nature and use; and the reversal of previous
write-downs of inventory to net realizable value, when there is a subsequent increase in the value of inventories.
Disclosure requirements include the Company’s policies, carrying amounts, amounts recognized as an expense, write-
downs and subsequent reversal of write-downs. The Company adopted this standard commencing in the 2008 fiscal
year and upon adoption, the opening accumulated deficit decreased by $11.0 million, net of tax of $3.4 million primarily
due to an adjustment of the carrying value of certain long-term stockpiles to cost as at January 1, 2008.
(ii) In February 2008, the CICA issued Section 3064, ‘‘Goodwill and Intangible Assets’’ (‘‘Section 3064’’) which replaces
Section 3062, ‘‘Goodwill and Other Intangible Assets.’’ Section 3064 establishes standards for the recognition,
measurement, presentation and disclosure of goodwill and intangible assets for profit-oriented enterprises. This
standard was effective for the Company on January 1, 2009. Adoption of this standard had no impact on the
Company’s financial statements.
(iii) In January 2009, the Emerging Issues Committee issued EIC-173, ‘‘Credit Risk and the Fair Value of Financial Assets
and Financial Liabilities’’ (‘‘EIC-173’’). The Committee concluded that an entity’s credit risk and the credit risk of the
counterparty should be taken into account in determining the fair value of financial assets and financial liabilities,
including derivative instruments.
Prior to the implementation of EIC-173, the Company had considered the impact of credit risk on a qualitative basis
only. As a result of adopting EIC-173 as at January 1, 2009, the Company quantified the impact of credit risk when
calculating the fair value of financial assets and liabilities, including derivatives and the impact was as follows:
• An increase in the current portion of Unrealized fair value of derivative assets of $0.1 million;
• An increase in the long-term portion of Unrealized fair value of derivative assets of $0.6 million;
• An increase in Future income tax assets of $0.4 million;
• A decrease in the current portion of Unrealized fair value of derivative liabilities of $2.1 million;
• A decrease in the long-term portion of Unrealized fair value of derivative liabilities of $13.0 million;
• An increase in opening Retained earnings of $14.6 million; and
• An increase in OCI of $1.6 million.
KINROSS GOLD CORPORATION 2010 ANNUAL REPORT 123

(iv) In March 2009, the Emerging Issues Committee issued EIC-174, ‘‘Mining Exploration Costs’’, which provides guidance
on the capitalization of exploration costs related to mining properties and the impairment review of such capitalized
exploration costs. This EIC was effective for the Company on January 1, 2009. The application of this EIC did not have
an effect on the Company’s financial statements.
(v) In May 2009, the CICA amended Section 3862, ‘‘Financial Instruments - Disclosures’’ (‘‘Section 3862’’), which requires
additional disclosure of fair value measurements using a fair value hierarchy that reflects the significance of the inputs
used in making the measurements (Level 1, Level 2 and Level 3 inputs as defined in the standard). The amendments
were applicable for the Company beginning January 1, 2010, and are harmonized with disclosures currently required
under US GAAP.
Recent pronouncements
(i) In 2008, the CICA issued Handbook Section 1582, ‘‘Business Combinations’’ (‘‘Section 1582’’), which is effective for
business combinations with an acquisition date on or after January 1, 2011. The standard requires the additional use of
fair value measurements, recognition of additional assets and liabilities and increased disclosure. The impact of
Section 1582 is expected to have a material impact on how prospective business combinations are accounted for.
Additionally, as part of the application of Section 1582, companies will be required to adopt CICA Handbook
Section 1601 ‘‘Consolidated Financial Statements’’ and 1602 ‘‘Non-controlling interests’’. These sections will require
that non-controlling interest be presented as part of shareholders’ equity on the balance sheet and the controlling
parent to present 100 percent of the subsidiary’s results in the statement of operations with an allocation between
controlling and non-controlling interest. The standards are effective as of January 1, 2011, with early adoption
permitted. The Company has chosen not to early adopt these standards.
(ii) In August 2009, the CICA issued certain amendments to Section 3251, ‘‘Equity’’. The amendments apply to entities that
have adopted Section 1602, ‘‘Non-controlling interests’’. The amendments require separate presentation on the
statements of operations and comprehensive income of income attributable to owners of the Company and those
attributable to non-controlling interests. The amendments also require that non-controlling interests be presented
separately as a component of equity. As the Company has not adopted section 1602, which is not mandatory until the
year beginning January 1, 2011, the amendments are not applicable to the Company in the interim and there is no
impact to the financial statements for the period ended December 31, 2010 or 2009. The Company has chosen not to
early adopt these standards.
(iii) The Canadian Accounting Standards Board has confirmed January 1, 2011 as the date that International Financial
Reporting Standards (‘‘IFRS’’) will replace Canadian GAAP for publicly accountable enterprises. As a result, Kinross will
report under IFRS for interim and annual periods beginning January 1, 2011, with comparative information for 2010
restated under IFRS. Adoption of IFRS as Canadian GAAP requires the Company to make certain accounting policy
choices and could materially impact its reported financial position and results of operations.
4. ACQUISITIONS AND DIVESTITURES
i Disposition of one-half interest in the Cerro Casale project
On February 17, 2010, the Company executed an agreement to sell one-half of its interest in the Cerro Casale project to
Barrick Gold Corporation (‘‘Barrick’’). The sale closed on March 31, 2010. The Company received $454.3 million in gross
proceeds, before transaction costs, and the transaction resulted in a gain of $36.7 million, before taxes. Additionally, as part
of the agreement, Barrick assumed $20.0 million of a $40.0 million payment obligation contingent upon a production
decision on the project.
Subsequent to the disposition, the Company continues to hold a 25% interest in the project and the investment is accounted
for under the equity method. Refer to note 5(vii).
124
ii Acquisition of Underworld Resources Inc.
On April 26, 2010, the Company acquired 81.6% of the issued and outstanding shares of Underworld Resources Inc.
(‘‘Underworld’’), on a fully diluted basis, by way of a friendly take-over bid. On June 30, 2010, the Company acquired the
remaining outstanding shares of Underworld it did not already own, and on July 6, 2010 the shares of Underworld were
delisted. Pursuant to the acquisition approximately 6.5 million Kinross shares and approximately 0.4 million Kinross options
were issued. The total transaction was valued at $126.5 million, including transaction costs. This amount was added to the
cost of a previously owned investment of $3.5 million, resulting in a total cost of $130.0 million. The acquisition was
accounted for as an asset acquisition.
During the second quarter of 2010, the investment in Underworld was re-classified from available for sale investments due to
the acquisition of control of Underworld. As of April 26, 2010, the financial statements of Underworld are being consolidated
with those of Kinross.
iii Sale of interest in Harry Winston Diamond Corporation
On July 23, 2010, the Company entered into an agreement to sell its approximate 19.9% equity interest in Harry Winston
Diamond Corporation (‘‘Harry Winston’’), consisting of 15.2 million Harry Winston common shares, to a group of financial
institutions, on an underwritten block trade basis for net proceeds of $185.6 million. The sale was completed on July 28, 2010
and resulted in a gain of $146.4 million.
iv Sale of interest in Diavik Diamond mine
On August 25, 2010, the Company completed the sale of its 22.5% interest in the partnership holding Harry Winston’s 40%
interest in the Diavik Diamond Mines (‘‘Diavik’’) joint venture to Harry Winston for final net proceeds of $189.6 million. The
purchase price is comprised of $50.0 million cash, approximately 7.1 million Harry Winston common shares with a value of
$69.7 million based on the share price on the closing date, and a note receivable in the amount of $70.0 million maturing
August 25, 2011. The note bears interest at a rate of 5% per annum and can be satisfied in cash or, subject to certain
limitations, shares issued by Harry Winston to Kinross. The sale resulted in a gain of $95.5 million.
v Acquisition of the Dvoinoye deposit and the Vodorazdelnaya property
On August 27, 2010, the Company completed the acquisition of 100% of the participatory interests in Northern Gold LLC and
Regionruda LLC, the owners of the Dvoinoye and Vodorazdelnaya exploration and mining licenses, both located
approximately 90 km north of Kinross’ Kupol operation in the Chukotka region of the Russian Far East. The purchase price of
$346.8 million was comprised of $167.0 million in cash and 10.6 million newly issued Kinross shares, which are subject to a
minimum hold period of four months after closing, and transaction costs of $5.9 million. This acquisition was accounted for
as an asset acquisition.
vi Acquisition of B2Gold Corp’s interest in Kupol exploration licenses
On August 27, 2010, the Company closed the agreement with B2Gold Corp (‘‘B2Gold’’) to acquire B2Gold’s right to an interest
in the Kupol East and West exploration licence areas. Under the terms of a previous agreement, Kinross had undertaken to
secure a 37.5% joint venture interest for B2Gold in the Kupol East and West exploration licence areas. According to the new
agreement, Kinross is no longer obligated to enter into joint venture arrangements with B2Gold in respect of Kinross’ 75%
interest in these licence areas. The purchase price comprised: $33.0 million in cash; contingent payments based on National
Instrument 43-101 qualified Proven and Probable Reserves within the licence areas at the subject properties, should such
reserves be declared in future; and payments based on net smelter returns of 1.5% from any future production at the licence
areas. This acquisition was accounted for as an asset acquisition.
The Kupol East and West exploration licences remain 100%-owned by the Chukotka Mining & Geological Company (‘‘CMGC’’),
which also owns 100% of the Kupol mine. CMGC is owned 75% by Kinross and 25% by the State Unitary enterprise of the
Chukotsky Autonomous Okrug (Chukotsnab).
KINROSS GOLD CORPORATION 2010 ANNUAL REPORT 125

vii Acquisition of Red Back Mining Inc.
On September 17, 2010 (the ‘‘acquisition date’’), Kinross completed its acquisition of Red Back Mining Inc. (‘‘Red Back’’)
through a plan of arrangement, whereby Kinross acquired all of the issued and outstanding common shares of Red Back that
it did not already own. As a result of this acquisition, the Company expanded operations into West Africa. In Ghana, the
Company holds a 90% interest in the Chirano Gold Mine with the Government of Ghana having the right to the remaining
10% interest. In Mauritania, the Company holds a 100% interest in the Tasiast Mine. Total consideration for the acquisition
was approximately $7,358.6 million, including the cost of the previously owned interest of $580.3 million.
Red Back shareholders received 1.778 Kinross common shares, plus 0.11 of a Kinross common share purchase warrant for
each Red Back common share held. As a result of the transaction, Kinross issued 416.4 million common shares and
25.8 million common share purchase warrants. The Company also issued 8.7 million fully vested replacement options to
acquire Kinross common shares to previous Red Back option holders.
As the purchase is a business combination, with Kinross being the acquirer, results of operations of Red Back have been
consolidated with those of Kinross commencing on the acquisition date.
Total consideration paid of $7,358.6 million was calculated as follows:
Common shares issued (416.4 million) $ 6,549.3
Fair value of warrants issued (25.8 million) 117.7
Fair value of options issued (8.7 million) 69.8
Cost of shares previously acquired 580.3
Acquisition costs 41.5
Total purchase price $ 7,358.6
The following table sets forth a preliminary allocation of the purchase price to assets and liabilities acquired, based on
preliminary estimates of fair value. Final valuations of assets and liabilities are not yet complete due to the timing of the
acquisition and the inherent complexity associated with the valuations. This is a preliminary purchase price allocation and
therefore subject to adjustment over the period to completion of the valuation process and analysis of resulting tax effects.
Preliminary Red Back Purchase Price Allocation
Cash and cash equivalents $ 742.6
Accounts receivable and other assets 27.0
Inventories 115.2
Property, plant and equipment (including mineral interests) 1,765.8
Accounts payable and accrued liabilities (103.4)
Future income and mining tax liabilities (311.5)
Other long-term liabilities (34.3)
Non-controlling interest (3.9)
Goodwill 5,161.1
Total purchase price $ 7,358.6
viii Sale of interest in Osisko
On December 13, 2010, the Company completed the sale of its 1.8% interest in Osisko Mining Corporation (‘‘Osisko’’),
consisting of approximately 6.8 million Osisko common shares, which was accounted for as an available for sale investment.
The sale was completed on an underwritten block trade basis, at a gross price of CDN$14.70 per share, for net proceeds of
$97.5 million. The transaction resulted in a gain of $74.1 million.
126
ix Investment in Harry Winston Diamond Corporation and Diavik Diamond mine
On March 31, 2009, Kinross completed the acquisition of 15.2 million shares of Harry Winston at a subscription price of $3.00
per share for a total subscription price of $45.6 million. Pursuant to the closing of the transaction Kinross obtained a seat on
the Board of Directors of Harry Winston. Additionally, on the same date, Kinross acquired a 22.5% interest in the limited
partnership that holds Harry Winston’s 40% interest in the Diavik Diamond Mine, (a 9% indirect interest in the mine), for a
gross subscription price of $125.1 million, inclusive of working capital adjustments which were finalized during the second
quarter. The investment in Harry Winston was accounted for as an equity investment, whereas the acquisition of the
partnership interest was accounted for as an acquisition of a Working Interest. Kinross incurred approximately $3 million in
transaction costs on these transactions.
The Company disposed of the investments in Harry Winston and the Diavik Diamond Mine during the third quarter of 2010.
Refer to note 4(iii,iv).
x Disposition of Gurupi and junior equity investments
On December 2, 2009, the Company disposed of its Gurupi property in a sale to Jaguar Mining Inc. (‘‘Jaguar’’) in exchange
for 3.4 million common shares of Jaguar valued at $42.5 million on the date of sale. The Company retained its ownership in
the adjacent Jiboia property. At the time of sale, the net book value for the Gurupi property was $28.0 million. The Company
recognized a gain on the disposition of Gurupi of $10.7 million, net of taxes of $3.3 million and transaction costs.
Additionally, during 2009 the Company disposed of all or a portion of its equity interests in several junior mining companies
for proceeds of $6.7 million, resulting in a gain of $3.2 million.
xi Acquisition of Lobo-Marte
On December 16, 2008, Kinross completed the acquisition of a 40% interest in Minera Santa Rosa SCM (‘‘Minera’’) from
certain subsidiaries of Anglo American plc for an aggregate purchase price of $141.1 million. Minera owns 100% of the
Lobo-Marte gold project located in the Maricunga district of Chile, roughly midway between the Company’s Maricunga and La
Coipa mines. The acquisition was accounted for as an equity investment as at December 31, 2008 and included transaction
costs of $1.1 million.
On January 7, 2009, Kinross completed the 100% acquisition of Minera through the acquisition of the remaining 60%
interest from Teck Cominco Limited (‘‘Teck’’) for net cash of $40 million, 5.6 million shares of Kinross and a 1.75% net
smelter royalty on 60% of future production, payable when the gold price is $760 per ounce or more.
As of January 7, 2009, the financial statements of Minera are being consolidated and the previously acquired 40% interest
in Lobo-Marte accounted for as an equity investment as at December 31, 2008 of $141.1 million was reclassified to mineral
interests.
xii Acquisition of Aurelian
Kinross acquired Aurelian Resources Inc. (‘‘Aurelian’’) in 2008. On July 28, 2008, Kinross completed a purchase of 15 million
Aurelian common shares pursuant to a private placement for a total subscription price of CDN$71.3 million, and concurrently
mailed its offer and take-over bid circular to Aurelian shareholders. On September 30, 2008, Kinross acquired 94.29% of
Aurelian’s issued and outstanding common shares. Kinross immediately exercised its statutory rights under the Canada
Business Corporation Act and compulsorily acquired the remaining common shares of Aurelian not deposited to the offer.
Effective September 30, 2008, Aurelian became a wholly-owned subsidiary of Kinross. For each Aurelian common share,
Kinross offered 0.317 of a Kinross common share, plus 0.1429 of a warrant, with each warrant entitling the holder to acquire
one Kinross common share. The Kinross warrants have an exercise price of CDN$32.00 per Kinross common share and will
expire in September 2013. Kinross issued 43.7 million shares, 4.1 million options and 19.7 million warrants pursuant to the
transaction. Total consideration was $810 million which, net of cash acquired of $105 million, amounted to $705 million. The
acquisition of Aurelian was accounted for as an asset purchase.
KINROSS GOLD CORPORATION 2010 ANNUAL REPORT 127

xiii Disposal of Julietta
Arian Resources Limited (‘‘Arian’’), a wholly-owned subsidiary of Kinross, entered into an agreement dated August 8, 2008,with Yanskaya Mining and Geological Company (‘‘Yanskaya’’), a subsidiary of Dukat Mining and Geological Company. Underthe agreement, Yanskaya purchased all of the shares held by Arian in Omsukchansk Mining and Geological Company(‘‘OMGC’’). The shares represented a 90% interest in OMGC whose assets included the Julietta mine in the RussianFederation. The Julietta mine was originally purchased as part of the Bema Gold Corporation acquisition on February 27,2007. The purchase price was $20.0 million. Arian received an additional cash payment for finished goods and supplies intransit and all of OMGC’s cash was used to repay intercompany payables owing to Arian and its affiliates immediately prior toclosing. In addition, there are deferred payments based on gold prices in 2009 and 2010 and deferred payments in 2011 and2012 of $5.0 million based on specified production. The deferred payments based on the gold price have been accounted foras an embedded derivative in the financial statements (see Note 8 for additional details), whereas the deferred paymentsbased on specified production have not been recognized due to their contingent nature. Yanskaya has further agreed tomake $12.0 million in expenditures at the Julietta mine between the date of closing and January 1, 2011. The transactionclosed on August 16, 2008 and resulted in a gain of $3.0 million.
xiv Disposal of Kubaka
On January 25, 2008 a wholly-owned subsidiary of the Company, Kinam Magadan Gold Corporation, completed the sale of itsapproximate 98.1% interest in OAO Omolon Gold Mining Company (‘‘Omolon’’) to OAO Polymetal for a purchase price of$15.0 million, plus a variable royalty on future production from the Kubaka gold mine properties. The assets sold included theKubaka gold mine and related mining licenses, located in the Magadan region in the far east of the Russian Federation. TheKubaka gold mine began commercial production in 1997 and ceased mining operations in 2005. A gain of $11.5 million wasrealized on this disposition.
xv Acquisition of Louisiana Land and Exploration Company Royalty
A royalty payment known as the Louisiana Land and Exploration Company Royalty (‘‘LL&E Royalty’’) applies to Kinross’ 50%interest in Round Mountain. The royalty rate is 3% of gross proceeds until the time that total royalty payments of$75.0 million are paid, and 1.5% thereafter. As at December 31, 2010, cumulative royalty payments total $72.5 million(December 31, 2009 - $69.1 million). On January 23, 2008, the Company purchased the LL&E royalty from ConocoPhillips.The purchase price was $26.5 million and the effective date of the purchase was January 1, 2008. On January 31, 2008,pursuant to the terms of the Round Mountain joint venture, the Company offered the opportunity to purchase 50% of theroyalty, on a pro rata basis with Barrick’s joint venture interest. On February 11, 2008, Barrick accepted the offer and thetransaction closed on May 15, 2008 with an effective date of January 1, 2008.
xvi Hammond Reef Project Interest
Kinross and Brett Resources Inc. (‘‘Brett’’) entered into a purchase and sale agreement whereby Brett agreed to purchaseKinross’ 40% interest in the Hammond Reef Project located near Atikokan, Ontario. Kinross and Brett were parties to anoption agreement pursuant to which Brett earned a 60% interest in the project by incurring CDN$5.0 million in expendituresand issuing 1 million common shares to Kinross. In exchange for the 40% interest in the Hammond Reef Project, Kinrossreceived 14 million Brett shares and a 2% net smelter returns royalty on future production from the property. Thetransaction closed on July 31, 2008. Following completion, Kinross held 17,095,313 common shares, representingapproximately 26% of Brett’s issued and outstanding common shares as at the closing date. In connection with thetransaction, Brett and Kinross have entered into a strategic alliance whereby Brett will spend up to CDN$2.0 million over athree-year period exploring and acquiring properties of interest in British Columbia and the Yukon Territory, in which Kinrossmay elect to obtain a 50% interest. The transaction resulted in a gain of $12.2 million.
xvii Ixhuatan Project Option Agreement
On October 22, 2007, the Company signed a definitive option agreement (the ‘‘Option Agreement’’) with a wholly ownedsubsidiary of Linear Gold Corp. (‘‘Linear’’) to earn up to a 70% interest in Linear’s Ixhuatan Project, located in Chiapas,Mexico (the ‘‘Project’’). A $1.0 million transaction fee was paid to Linear upon execution of the Option Agreement. Under theterms of the Option Agreement, the Company agreed to fund $15.0 million of exploration expenditures within a 24 monthperiod, which commenced on October 26, 2007. During 2009, the Company decided to terminate the Option Agreement, andrecorded a liability of $3.4 million, representing the Company’s remaining commitment to fund exploration expenditures. Theamount was paid to Linear during 2010.
128

5. CONSOLIDATED FINANCIAL STATEMENT DETAILS
Consolidated Balance Sheets
i Cash, cash equivalents and short-term investments:
December 31, December 31,
2010 2009
Cash on hand and balances with banks $ 873.3 $ 352.8
Short-term deposits 593.3 244.6
Short-term investments - 35.0
$ 1,466.6 $ 632.4
ii Accounts receivable and other assets:
December 31, December 31,
2010 2009
Trade receivables $ 24.3 $ 9.9
Taxes recoverable 14.7 6.2
Prepaid expenses 45.0 26.7
VAT receivable 119.6 61.0
Note receivable (a) 70.0 -
Other 55.8 31.7
$ 329.4 $ 135.5
(a) See Note 4(iv).
iii Inventories:
December 31, December 31,
2010 2009
Ore in stockpiles (a) $ 144.3 $ 120.5
Ore on leach pads (b) 114.4 44.3
In-process 39.4 26.1
Finished metal 81.5 80.6
Materials and supplies 460.6 395.1
840.2 666.6
Long-term portion of ore in stockpiles and ore on leach pads (a),(b) (103.2) (112.2)
$ 737.0 $ 554.4
(a) Ore in stockpiles includes low-grade material not scheduled for processing within the next twelve months and is included in deferred charges and other long-term assets on theconsolidated balance sheets. See deferred charges and other long-term assets, Note 5 (viii).
(b) Ore on leach pads relates to the Company’s Maricunga, Fort Knox, Tasiast and 50% owned Round Mountain mines. Based on current mine plans, the Company expects to place the lasttonne of ore on its leach pads at Maricunga in 2026, Fort Knox in 2021, Tasiast in 2026, and Round Mountain in 2017. Ore on leach pads includes material not scheduled for processingwithin the next twelve months and is included in deferred charges and other long-term assets on the consolidated balance sheets. See deferred charges and other long-term assets,Note 5 (viii).
KINROSS GOLD CORPORATION 2010 ANNUAL REPORT 129
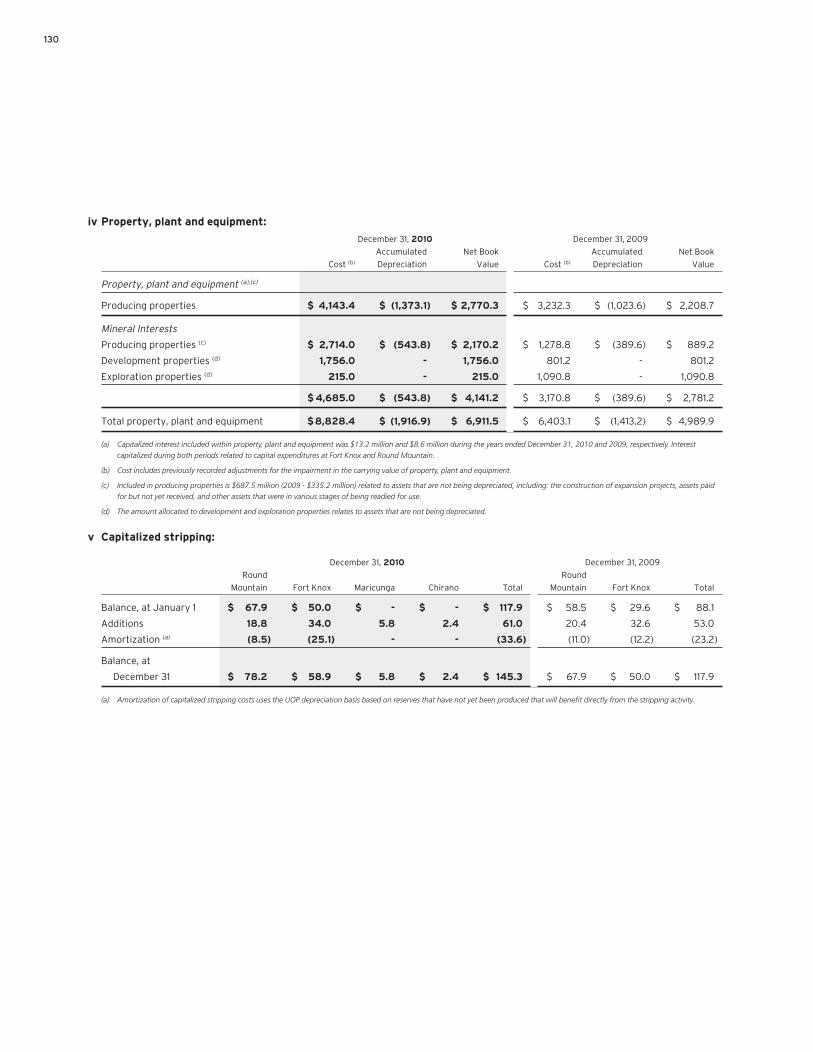
iv Property, plant and equipment:
December 31, 2010 December 31, 2009
Accumulated Net Book Accumulated Net Book
Cost (b) Depreciation Value Cost (b) Depreciation Value
Property, plant and equipment (a),(c)
Producing properties $ 4,143.4 $ (1,373.1) $ 2,770.3 $ 3,232.3 $ (1,023.6) $ 2,208.7
Mineral Interests
Producing properties (c) $ 2,714.0 $ (543.8) $ 2,170.2 $ 1,278.8 $ (389.6) $ 889.2
Development properties (d) 1,756.0 - 1,756.0 801.2 - 801.2
Exploration properties (d) 215.0 - 215.0 1,090.8 - 1,090.8
$ 4,685.0 $ (543.8) $ 4,141.2 $ 3,170.8 $ (389.6) $ 2,781.2
Total property, plant and equipment $8,828.4 $ (1,916.9) $ 6,911.5 $ 6,403.1 $ (1,413.2) $ 4,989.9
(a) Capitalized interest included within property, plant and equipment was $13.2 million and $8.6 million during the years ended December 31, 2010 and 2009, respectively. Interestcapitalized during both periods related to capital expenditures at Fort Knox and Round Mountain.
(b) Cost includes previously recorded adjustments for the impairment in the carrying value of property, plant and equipment.
(c) Included in producing properties is $687.5 million (2009 - $335.2 million) related to assets that are not being depreciated, including: the construction of expansion projects, assets paidfor but not yet received, and other assets that were in various stages of being readied for use.
(d) The amount allocated to development and exploration properties relates to assets that are not being depreciated.
v Capitalized stripping:
December 31, 2010 December 31, 2009
Round Round
Mountain Fort Knox Maricunga Chirano Total Mountain Fort Knox Total
Balance, at January 1 $ 67.9 $ 50.0 $ - $ - $ 117.9 $ 58.5 $ 29.6 $ 88.1
Additions 18.8 34.0 5.8 2.4 61.0 20.4 32.6 53.0
Amortization (a) (8.5) (25.1) - - (33.6) (11.0) (12.2) (23.2)
Balance, at
December 31 $ 78.2 $ 58.9 $ 5.8 $ 2.4 $ 145.3 $ 67.9 $ 50.0 $ 117.9
(a) Amortization of capitalized stripping costs uses the UOP depreciation basis based on reserves that have not yet been produced that will benefit directly from the stripping activity.
130

vi Goodwill:
The Goodwill allocated to the Company’s reporting units and included in the respective operating segment assets is shown in
the table below:
December 31, Allocation and December 31, Additions/ December 31,
2008 Adjustment (a) Impairment (c) 2009 (reductions) Impairment (c) 2010
Operating segments
Round Mountain $ 58.7 $ - $ - $ 58.7 $ - $ - $ 58.7
Paracatu 65.5 - - 65.5 - - 65.5
La Coipa 124.4 - - 124.4 - - 124.4
Kettle River-Buckhorn 20.9 - - 20.9 - - 20.9
Kupol 158.8 - - 158.8 - - 158.8
Maricunga 175.9 - - 175.9 - - 175.9
Crixas 38.0 - - 38.0 - - 38.0
Red Back acquisition (d) - - - - 5,161.1 - 5,161.1
Other operations (a)(b) 539.7 (2.0) - 537.7 (361.0) - 176.7
Total $ 1,181.9 $ (2.0) $ - $ 1,179.9 $ 4,800.1 $ - $5,980.0
(a) At December 31, 2010, other operations includes goodwill allocated to Quebrada Seca of $168.8 million and Jiboia of $7.9 million. In 2009, goodwill was reduced by $2.0 million as aresult of the disposition of Gurupi.
(b) The Company disposed of one-half of its interest in the Cerro Casale project on March 31, 2010 (see Note 4(i)). As a result, goodwill was reduced by $361.0 million which represents theentire goodwill previously allocated to Cerro Casale. As the Company continues to retain a 25% interest in the project, one-half of the goodwill balance previously allocated, amountingto $180.5 million, now forms part of the carrying value of the investment in the Cerro Casale project.
(c) No impairment charges were recognized in 2009 and 2010.
(d) On September 17, 2010, the Company acquired all of the outstanding common shares of Red Back that it did not previously own (see Note 4 (vii)). Goodwill of $5,161.1 million wasrecorded on the transaction based on the preliminary purchase price allocation. Goodwill will be allocated among the Red Back properties once the purchase price allocation is finalized.
vii Long-term investments:
Long-term investments of $629.9 million (2009 - $292.2 million) include $426.1 million of investments accounted for using
the equity method (2009 - $53.2 million), $203.8 million of investments classified as available-for-sale (2009 -
$129.6 million), for which associated unrealized gains or losses are recorded in OCI, and $nil accounted for as a Working
Interest (2009 - $109.4 million).December 31, December 31,
2010 2009
Available for sale investments (a) $ 203.8 $ 129.6
Investment in shares carried on an equity basis 426.1 53.2
Working Interests (b) - 109.4
Long-term investments $ 629.9 $ 292.2
(a) During the second quarter of 2010, the investment in Underworld was re-classified from available for sale investments due to the acquisition of control of Underworld. See Note 4(ii).
(b) On August 25, 2010, the Company disposed of its Working Interest in Diavik. See Note 4(iv).
December 31, 2010 December 31, 2009
Gains Gains
(losses) (losses)
Available for sale investments Fair Value in AOCI (a) Fair Value in AOCI (a)
Securities in an unrealized gain position $ 203.3 $ 88.5 $ 86.9 $ 51.4
Securities in an unrealized loss position 0.5 (0.8) 42.7 (4.9)
$ 203.8 $ 87.7 $ 129.6 $ 46.5
(a) ‘‘AOCI’’ refers to Accumulated other comprehensive income (loss).
KINROSS GOLD CORPORATION 2010 ANNUAL REPORT 131

December 31, 2010
Investments in shares and working interests carried on an equity basis Carrying Value Market Value % Ownership
Cerro Casale (a) $ 426.1 $ - 25.0%
December 31, 2009
Carrying Value Market Value % Ownership
Victoria Gold Corporation (b) $ 11.9 $ 28.2 22.3%
Harry Winston Diamond Corporation (c) 41.3 146.0 19.9%
53.2 $ 174.2
Working Interest in Diavik Diamond mine (d) 109.4
$ 162.6
(a) On March 31, 2010, the Company sold one-half of its interest in Cerro Casale. Subsequent to the disposition, the Company continues to hold a 25% interest in the project and theinvestment is accounted for under the equity method. See Note 4(i). Cerro Casale is not publicly traded, therefore, its external market value is not available.
(b) During the second quarter of 2010, the Company ceased accounting for its investment in Victoria Gold Corporation on an equity basis as the Company no longer had the ability to exertsignificant influence.
(c) On July 28, 2010, the Company sold its investment in Harry Winston. See Note 4(iii).
(d) On August 25, 2010, the Company disposed of its Working Interest in Diavik. See Note 4(iv).
viii Deferred charges and other long-term assets:
December 31, December 31,
2010 2009
Long-term ore in stockpiles and on leach pads (a) $ 103.2 $ 112.2
Deferred charges, net of amortization 0.9 1.3
Long-term receivables 52.7 42.8
Advances on the purchase of capital equipment 23.2 -
Other 24.6 2.1
$ 204.6 $ 158.4
(a) Ore in stockpiles and on leach pads represent low-grade material not scheduled for processing within the next twelve months. Ore in stockpiles are at the Company’s Fort Knox, Kupol,Paracatu and Round Mountain mines. Ore on leach pads are at the Fort Knox and Round Mountain mines.
ix Accounts payable and accrued liabilities:
December 31, December 31,
2010 2009
Trade payables $ 153.3 $ 92.5
Accrued liabilities 212.6 150.9
Employee related accrued liabilities 54.5 45.1
Taxes payable 76.2 24.4
$ 496.6 $ 312.9
x Other long-term liabilities:
December 31, December 31,
2010 2009
Reclamation and remediation obligations Note 10 $ 331.5 $ 252.7
Unrealized fair value of derivative liabilities Note 8 58.1 212.8
Other long-term liabilities 142.8 77.5
$ 532.4 $ 543.0
132

Consolidated Statements of Operations
xi Other income (expense) - net:
Year ended December 31,
2010 2009 2008
Gain (loss) on sale of assets and investments - net $ 348.5 $ 16.2 $ 30.2
Impairment of investments (a) - - (83.9)
Litigation reserve adjustment (b) - 18.5 (19.1)
Interest income and other 8.3 9.2 21.7
Interest expense (c) Note 9 (31.1) (19.1) (74.6)
Foreign exchange gains (losses) (12.7) (91.0) 41.4
Net non-hedge derivative gains (losses) (17.6) 2.9 41.6
Working Interest in Diavik Diamond mine (2.4) (11.0) -
$ 293.0 $ (74.3) $ (42.7)
(a) During 2008, the Company wrote-down several available-for-sale and equity investments. The equity investments written down were acquired as part of the Bema acquisition andprimarily related to Consolidated Puma Minerals, Pamodzi Gold and Victoria Gold as it was determined that the decline in fair value was other than temporary.
(b) See Note 18 for additional details.
(c) During 2010, $13.2 million (2009: $8.6 million, 2008: $30.6 million) of interest was capitalized to property, plant and equipment, respectively. See Note 5(iv).
xii Gain (loss) on sale of assets and investments - net:
Year ended December 31,
2010 2009 2008
Assets:
Gurupi $ - $ 14.0 $ -
Hammond Reef project - - 12.2
Julietta mine - - 3.0
Kubaka mine - - 11.5
Interest in Cerro Casale (a) 36.7 - -
Investments:
Harry Winston Diamond Corporation (b) 146.4 - -
Working Interest in Diavik Diamond mine (c) 95.5 - -
Osisko Mining (d) 74.1 - -
Other assets and investments (4.2) 2.2 3.5
$ 348.5 $ 16.2 $ 30.2
(a) On March 31, 2010, the Company sold one-half of its interest in Cerro Casale. See Note 4(i).
(b) On July 28, 2010, the Company sold its investment in Harry Winston. See Note 4(iii).
(c) On August 25, 2010, the Company disposed of its Working Interest in Diavik. See Note 4(iv).
(d) On December 13, 2010, the Company sold its 1.8% interest in Osisko. See Note 4(viii).
KINROSS GOLD CORPORATION 2010 ANNUAL REPORT 133

xiii Equity income (losses) in associated companies - net:
Year ended December 31,
2010 2009 2008
Victoria Gold Corporation (a) $ (2.0) $ (2.7) $ (3.0)
Harry Winston Diamond Corporation (b) (2.1) (5.1) -
Cerro Casale (c) 0.2 - -
Pamodzi Gold Limited - - (4.7)
Consolidated Puma Minerals Corporation - - (1.1)
Rolling Rock Resources Corporation - - 0.1
Brett Resources Inc. - (0.8) -
$ (3.9) $ (8.6) $ (8.7)
(a) During the second quarter of 2010, the Company ceased accounting for its investment in Victoria Gold Corporation on an equity basis as the Company no longer had the ability to exertsignificant influence.
(b) On July 28, 2010, the Company sold its investment in Harry Winston. See Note 4(iii).
(c) On March 31, 2010, the Company sold one-half of its interest in Cerro Casale. Subsequent to the disposition, the Company continues to hold a 25% interest in the project and theinvestment is accounted for under the equity method. See Note 4(i).
Supplemental cash flow information
xiv Interest and income taxes paid:
Year ended December 31,
2010 2009 2008
Interest $ 15.7 $ 30.2 $ 49.7
Income taxes $ 287.3 $ 166.3 $ 75.3
xv Non-controlling interest:
Kupol (a) Chirano (b) Total
Balance at January 1, 2008 $ 14.0 $ - $ 14.0
Share of net earnings 42.3 - 42.3
Balance at December 31, 2008 $ 56.3 $ - $ 56.3
Share of net earnings 102.3 - 102.3
Dividends paid (25.8) - (25.8)
Other increase in non-controlling interest 0.1 - 0.1
Balance at December 31, 2009 $ 132.9 $ - $ 132.9
Addition upon acquisition - 3.9 3.9
Share of net earnings 106.3 3.0 109.3
Dividends paid (47.7) - (47.7)
Balance at December 31, 2010 $ 191.5 $ 6.9 $ 198.4
(a) Represents non-controlling interest in Chukotka Mining and Geological Company.
(b) Represents non-controlling interest in Chirano Gold Mines Limited.
134

6. ACCUMULATED OTHER COMPREHENSIVE LOSS
December 31, December 31,
2010 2009
Accumulated other comprehensive income (loss):
Investments (a),(b) Note 5 $ 87.7 $ 43.8
Financial derivatives (c),(d) Note 8 (250.4) (263.9)
Accumulated other comprehensive loss, end of period $ (162.7) $ (220.1)
(a) Includes cumulative translation adjustments of $(1.2) million (2009 - $1.7 million).
(b) Net of tax of $8.0 million (2009 - $4.0 million).
(c) Net of tax of $9.9 million (2009 - $9.6 million).
(d) As a result of adopting EIC-173 (Note 3) on January 1, 2009, an adjustment of $1.6 million was made to Accumulated other comprehensive loss.
7. JOINT VENTURE INTERESTS
The Company conducts a portion of its business through joint ventures where the venturers are bound by contractual
arrangements establishing joint control over the ventures. The Company records its proportionate share of assets, liabilities,
revenue and operating costs of the joint ventures.
As at December 31, 2010, the Company had a joint venture interest in Round Mountain and Crixas (see Note 15 for additional
details).
The following tables contain selected financial information on Kinross’ consolidated share of participation for each of its
participating operating joint ventures for the years ended December 31, 2010, 2009, and 2008.
Operating Joint Venture interests - 2010 Round Mountain Crixas Total
(i) (ii)
Metal sales $ 227.5 $ 94.7 $ 322.2
Cost of sales 121.3 37.5 158.8
Accretion and reclamation expense 1.4 0.2 1.6
Depreciation, depletion and amortization 19.0 17.1 36.1
Exploration and business development 1.4 0.9 2.3
Other operating costs (0.3) 0.4 0.1
Operating earnings $ 84.7 $ 38.6 $ 123.3
Current assets $ 38.0 $ 29.8 $ 67.8
Property, plant and equipment 164.4 74.6 239.0
Goodwill 58.7 38.0 96.7
Deferred charges and other long-term assets 11.3 2.6 13.9
$ 272.4 $ 145.0 $ 417.4
Current liabilities 21.9 24.5 46.4
Long-term liabilities 24.7 22.0 46.7
46.6 46.5 93.1
Net investment in joint ventures $ 225.8 $ 98.5 $ 324.3
Cash flow provided from (used in):
Operating activities $ 107.3 $ 44.7 $ 152.0
Investing activities $ (32.6) $ (24.5) $ (57.1)
Financing activities $ (73.8) $ (22.4) $ (96.2)
KINROSS GOLD CORPORATION 2010 ANNUAL REPORT 135

Round
Operating Joint Venture interests - 2009 Mountain Crixas Total
(i) (ii)
Metal sales $ 210.0 $ 73.6 $ 283.6
Cost of sales 111.4 31.0 142.4
Accretion and reclamation expense 1.6 0.1 1.7
Depreciation, depletion and amortization 12.1 9.7 21.8
Exploration and business development 0.4 0.7 1.1
Other operating costs 0.4 6.2 6.6
Operating earnings $ 84.1 $ 25.9 $ 110.0
Current assets $ 31.3 $ 27.8 59.1
Property, plant and equipment 146.7 66.8 213.5
Goodwill 58.7 38.0 96.7
Deferred charges and other long-term assets 11.4 2.2 13.6
$ 248.1 $ 134.8 $ 382.9
Current liabilities 15.3 17.3 32.6
Long-term liabilities 19.1 24.0 43.1
34.4 41.3 75.7
Net investment in joint ventures $ 213.7 $ 93.5 $ 307.2
Cash flow provided from (used in):
Operating activities $ 92.7 $ 30.0 $ 122.7
Investing activities $ (32.9) $ (25.1) $ (58.0)
Financing activities $ (57.6) $ (8.3) $ (65.9)
136

Round
Operating Joint Venture interests - 2008 Mountain Crixas Total
(i) (ii)
Metal sales $ 213.7 $ 75.3 $ 289.0
Cost of sales 112.9 26.2 139.1
Accretion and reclamation expense 1.1 0.4 1.5
Depreciation, depletion and amortization 22.2 10.7 32.9
Exploration and business development 0.7 2.1 2.8
Other operating costs - 0.9 0.9
Operating earnings $ 76.8 $ 35.0 $ 111.8
Current assets $ 26.4 $ 31.4 $ 57.8
Property, plant and equipment 131.7 50.1 181.8
Goodwill 58.7 38.0 96.7
Deferred charges and other long-term assets 11.4 0.9 12.3
$ 228.2 $ 120.4 $ 348.6
Current liabilities 19.6 14.1 33.7
Long-term liabilities 22.5 15.3 37.8
42.1 29.4 71.5
Net investment in joint ventures $ 186.1 $ 91.0 $ 277.1
Cash flow provided from (used in):
Operating activities $ 95.7 $ 34.3 $ 130.0
Investing activities $ (77.5) $ (19.6) $ (97.1)
Financing activities $ - $ 5.3 $ 5.3
i Round Mountain
The Company owns a 50% interest in the Smoky Valley Common Operation joint venture, which owns the Round Mountain
mine, located in Nye County, Nevada, U.S.A. Under the joint venture agreement between the Company and Barrick, the
Company is the operator.
The Management Committee of the joint venture represents the joint venture partners, authorizes annual programs and
budgets and approves major transactions prior to execution by site management. The joint venture owners are entitled to their
pro-rata share of production and are obliged to make their pro-rata share of contributions as requested.
ii. Crixas
The Company owns a 50% interest in Mineracao Serra Grande, S.A. (‘‘MSG’’), which owns the Crixas mine, located in central
Brazil. Under the joint venture agreement, a wholly owned subsidiary of AngloGold Ashanti Limited is the operator.
The Board of Directors of MSG approves annual programs and budgets, and authorizes major transactions prior to execution by
site management. The joint venture participants are entitled to their pro-rata share of profits in the form of distributions and
are obliged to make their pro-rata share of contributions if required.
8. FINANCIAL INSTRUMENTS
The Company manages its exposure to changes in currency exchange rates, energy and interest rates by periodically entering
into derivative financial instrument contracts in accordance with the formal risk management policy approved by the
Company’s Board of Directors. The Company has gold and silver derivative instruments acquired with the Bema acquisition,
KINROSS GOLD CORPORATION 2010 ANNUAL REPORT 137

primarily related to Kupol financing requirements. All of the Company’s hedges are cash flow hedges. The Company applies
hedge accounting whenever hedging relationships exist and have been documented.
Fair values of financial instruments
Carrying values for primary financial instruments, including cash and cash equivalents, short-term investments and other
accounts receivable, accounts payable and accrued liabilities, approximate fair values due to their short-term maturities.
Fair value estimates for derivative contracts are based on quoted market prices for comparable contracts and represent the
amount the Company would have received from, or paid to, a counterparty to unwind the contract at the market rates in effect
at the balance sheet date.
December 31, 2010 December 31, 2009
Asset/ Asset/
(Liability) (Liability)
Fair Value (a) AOCI (e) Fair Value (a) AOCI (e)
Interest rate contracts
Interest rate swap $ (4.4) $ (0.3) $ (8.3) $ (6.7)
(4.4) (0.3) (8.3) (6.7)
Currency contracts
Foreign currency forward contracts (b) 55.0 39.9 38.1 27.2
55.0 39.9 38.1 27.2
Commodity contracts
Gold and silver forward contracts (c) (333.7) (291.3) (332.8) (285.3)
Gold contract related to Julietta sale - - 4.3 -
Energy forward contract (d) 1.7 1.3 1.3 0.9
Other contracts
Total return swap - - (0.2) -
(332.0) (290.0) (327.4) (284.4)
Total all contracts $ (281.4) $(250.4) $ (297.6) $ (263.9)
(a) Consists of unrealized fair value of derivative assets - current - $133.4 million (December 31, 2009 - $44.3 million), unrealized fair value of derivative assets - long-term - $2.6 million(December 31, 2009 - $1.9 million), current portion of unrealized fair value of derivative liabilities - $359.3 million (December 31, 2009 - $131.0 million), and unrealized fair value ofderivative liabilities long-term - $58.1 million (December 31, 2009 - $212.8 million).
(b) The amount of $38.7 million of the total amount recorded in AOCI will be reclassified to net earnings within the next 12 months as a result of settling the contracts.
(c) The amount of $240.5 million of the total amount recorded in AOCI will be reclassified to net earnings within the next 12 months as a result of settling the contracts.
(d) The entire amount recorded in AOCI will be reclassified to net earnings within the next 12 months as a result of settling the contracts.
(e) AOCI refers to accumulated other comprehensive income (loss).
The fair value hierarchy established by Section 3862 establishes three levels to classify the inputs to valuation techniques used
to measure fair value and is harmonized with disclosure requirements included in ASC Subtopic 820-10 on financial instruments
under US GAAP. Level 1 inputs are quoted prices (unadjusted) in active markets for identical assets or liabilities. Level 2 inputs
are quoted prices in markets that are not active, quoted prices for similar assets or liabilities in active markets, inputs other
than quoted prices that are observable for the asset or liability (for example, interest rate and yield curves observable at
commonly quoted intervals, forward pricing curves used to value currency and commodity contracts and volatility
measurements used to value option contracts), or inputs that are derived principally from or corroborated by observable
market data or other means. Level 3 inputs are unobservable (supported by little or no market activity). The fair value hierarchy
gives the highest priority to Level 1 inputs and the lowest priority to Level 3 inputs.
138

Assets (liabilities) measured at fair value on a recurring basis as at December 31, 2010 include:
Aggregate
Level One Level Two Level Three Fair Value
Available-for-sale securities $ 203.8 $ - $ - $ 203.8
Derivative instruments - (281.4) - (281.4)
$ 203.8 $ (281.4) $ - $ (77.6)
The valuation techniques that are used to measure fair value are as follows:
Available-for-sale securities:
The fair value of available-for-sale securities is determined based on a market approach reflecting the closing price of each
particular security at the balance sheet date. The closing price is a quoted market price obtained from the exchange that is the
principal active market for the particular security, and therefore available-for-sale securities are classified within Level 1 of the
fair value hierarchy established by Section 3862.
Derivative instruments:
The fair value of derivative instruments is based on quoted market prices for comparable contracts and represent the amount
the Company would have received from, or paid to, a counterparty to unwind the contract at the market rates in effect at the
balance sheet dates and therefore derivative instruments are classified within Level 2 of the fair value hierarchy established by
Section 3862.
Gold and silver price risk management
The Company’s policy is to not hedge metal sales. However in certain circumstances the Company may use derivative contracts
to hedge against the risk of falling prices for a portion of its forecasted metal sales.
The Company may also assume derivative contracts as part of a business acquisition or they may be required under financing
arrangements. As a result of the acquisition of Bema in February 2007, the Company assumed gold and silver forward sales
contracts, call options, and put options, primarily due to requirements related to the Kupol project financing.
During 2010, the Company entered into gold forward contracts to purchase 394,885 ounces of gold at an average rate of
$1,181.17 per ounce. Contracts for 91,250 oz of gold matured in 2010, 265,940 ounces mature in 2011, with the remainder of
37,695 ounces maturing in 2012. The purpose of these derivatives is to offset a portion of the above noted derivatives which
were acquired as a result of the Bema acquisition in 2007. Commensurate with the engagement of these derivatives, the
Company de-designated the hedging relationships and ceased hedge accounting for the maturities.
In 2009, the Company purchased silver put contracts for 3,495,000 ounces of silver at an average cost of $13.00 per ounce on
anticipated silver production at La Coipa. The Company has also entered into sold silver call contracts for 3,495,000 ounces at
an average cost of $17.20 per ounce. Contracts representing 689,000 ounces of silver matured in 2010, with the remaining
2,806,000 ounces maturing in 2011.
The Company’s commodity price risk associated with financial instruments related to gold and silver primarily relates to
changes in fair value of existing gold and silver contracts.
The following represents the financial instruments’ effect on pre-tax earnings and OCI before tax due to a 10% change in gold
and silver prices, based on contracts held at December 31, 2010 at December 31, 2010 prices with all other variables unchanged.
KINROSS GOLD CORPORATION 2010 ANNUAL REPORT 139

The sensitivity of the Company’s financial instruments to commodity price changes is comprised of the commodity contracts
described in this note:
Effect of gold and Effect of gold and
silver contracts on silver contracts on
Price on Dec. 31, pre-tax earnings, OCI before tax,
2010 Change gain (loss) gain (loss)
Gold $ 1,410.25 +10% $ (0.7) $ (12.6)
Gold $ 1,410.25 - 10% $ 0.5 $ 12.6
Silver $ 30.63 +10% $ (0.1) $ (16.5)
Silver $ 30.63 - 10% $ 0.1 $ 16.5
Gold and silver
Under the terms of the Kupol project loan facilities, the Company was required to maintain gold and silver hedge contracts over
the life of the loans in order to cover a portion of the mine’s future operating and debt service costs. As a result, and as part of
the acquisition of Bema in February 2007, the Company assumed gold and silver forward and option contracts related to the
Kupol project as well as contracts relating to Julietta and Maricunga.
140

At December 31, 2010, the following derivative contracts were outstanding:
2011 2012 Total
Metals
Gold forward sell contracts (ounces) 319,660 74,075 393,735
Average price 621.24 674.44 631.45
Gold forward buy contracts (ounces) 265,940 37,695 303,635
Average price 1,169.24 1,399.85 1,197.87
Silver forward sell contracts (ounces 000’s) 3,600 - 3,600
Average price 10.71 - 10.71
Purchased silver put contracts (ounces 000’s) 2,806 - 2,806
Average price 13.00 - 13.00
Sold silver collar contracts (ounces 000’s) 2,806 - 2,806
Average price 17.29 - 17.29
Foreign currency
Brazil reias forward buy contracts
(in millions of U.S. dollars) 350.0 56.0 406.0
Average price 1.91 2.00 1.93
Chilean pesos forward buy contracts
(in millions of U.S. dollars) 172.0 - 172.0
Average price 511.22 - 511.22
Russian roubles forward buy contracts
(in millions of U.S. dollars) 97.0 48.0 145.0
Average price 32.00 33.10 32.36
Canadian dollar forward buy contracts
(in millions of U.S. dollars) 84.0 - 84.0
Average price 1.05 - 1.05
Euro forward buy contracts
(in millions of U.S. dollars) 8.7 - 8.7
Average price 0.78 - 0.78
Energy
Oil forward buy contracts (barrels) 120,000 - 120,000
Average price 79.90 - 79.90
Subsequent to December 31, 2010, the Company entered into an additional 77,045 forward purchase contracts at an average
rate of $1,363.32 per ounce, of which 40,665 ounces mature in 2011 and 36,380 ounces mature in 2012.
Currency risk management
The Company is primarily exposed to currency fluctuations relative to the U.S. dollar on expenditures that are denominated in
Canadian dollars, Brazilian reais, Chilean pesos, Russian roubles and euros. This risk is reduced, from time to time, through the
use of foreign exchange forward contracts to lock in the exchange rates on future non-U.S. denominated currency cash
outflows. The Company has entered into forward contracts to purchase the Canadian dollars, Brazilian reais, Chilean pesos,
Russian roubles and euros as part of this risk management strategy. The Company is also exposed to the impact of currency
fluctuations on its monetary assets and liabilities. The Company does not actively manage this exposure.
KINROSS GOLD CORPORATION 2010 ANNUAL REPORT 141
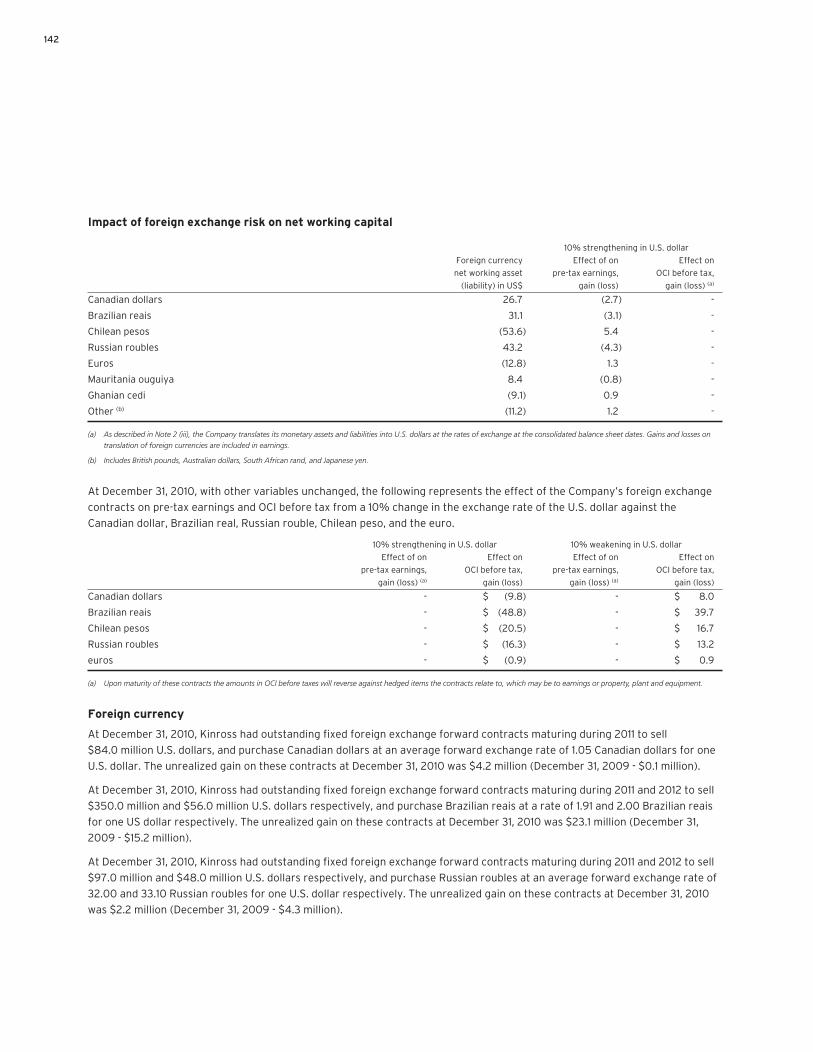
Impact of foreign exchange risk on net working capital
10% strengthening in U.S. dollar
Foreign currency Effect of on Effect on
net working asset pre-tax earnings, OCI before tax,
(liability) in US$ gain (loss) gain (loss) (a)
Canadian dollars 26.7 (2.7) -
Brazilian reais 31.1 (3.1) -
Chilean pesos (53.6) 5.4 -
Russian roubles 43.2 (4.3) -
Euros (12.8) 1.3 -
Mauritania ouguiya 8.4 (0.8) -
Ghanian cedi (9.1) 0.9 -
Other (b) (11.2) 1.2 -
(a) As described in Note 2 (iii), the Company translates its monetary assets and liabilities into U.S. dollars at the rates of exchange at the consolidated balance sheet dates. Gains and losses ontranslation of foreign currencies are included in earnings.
(b) Includes British pounds, Australian dollars, South African rand, and Japanese yen.
At December 31, 2010, with other variables unchanged, the following represents the effect of the Company’s foreign exchange
contracts on pre-tax earnings and OCI before tax from a 10% change in the exchange rate of the U.S. dollar against the
Canadian dollar, Brazilian real, Russian rouble, Chilean peso, and the euro.
10% strengthening in U.S. dollar 10% weakening in U.S. dollar
Effect of on Effect on Effect of on Effect on
pre-tax earnings, OCI before tax, pre-tax earnings, OCI before tax,
gain (loss) (a) gain (loss) gain (loss) (a) gain (loss)
Canadian dollars - $ (9.8) - $ 8.0
Brazilian reais - $ (48.8) - $ 39.7
Chilean pesos - $ (20.5) - $ 16.7
Russian roubles - $ (16.3) - $ 13.2
euros - $ (0.9) - $ 0.9
(a) Upon maturity of these contracts the amounts in OCI before taxes will reverse against hedged items the contracts relate to, which may be to earnings or property, plant and equipment.
Foreign currency
At December 31, 2010, Kinross had outstanding fixed foreign exchange forward contracts maturing during 2011 to sell
$84.0 million U.S. dollars, and purchase Canadian dollars at an average forward exchange rate of 1.05 Canadian dollars for one
U.S. dollar. The unrealized gain on these contracts at December 31, 2010 was $4.2 million (December 31, 2009 - $0.1 million).
At December 31, 2010, Kinross had outstanding fixed foreign exchange forward contracts maturing during 2011 and 2012 to sell
$350.0 million and $56.0 million U.S. dollars respectively, and purchase Brazilian reais at a rate of 1.91 and 2.00 Brazilian reais
for one US dollar respectively. The unrealized gain on these contracts at December 31, 2010 was $23.1 million (December 31,
2009 - $15.2 million).
At December 31, 2010, Kinross had outstanding fixed foreign exchange forward contracts maturing during 2011 and 2012 to sell
$97.0 million and $48.0 million U.S. dollars respectively, and purchase Russian roubles at an average forward exchange rate of
32.00 and 33.10 Russian roubles for one U.S. dollar respectively. The unrealized gain on these contracts at December 31, 2010
was $2.2 million (December 31, 2009 - $4.3 million).
142

At December 31, 2010, Kinross had outstanding fixed foreign exchange forward contracts maturing during 2010 to sell
$172.0 million U.S. dollars, and purchase Chilean pesos at an average forward exchange rate of 511.22 Chilean pesos for one
U.S. dollar. The unrealized gain on these contracts at December 31, 2010 was $10.1 million (December 31, 2009 - $7.6 million).
At December 31, 2010, Kinross had outstanding fixed foreign exchange forward contracts maturing during 2010 to sell
$8.7 million U.S. dollars, and purchase Euros at an average forward exchange rate of 0.78 Euros for one U.S. dollar. The
unrealized gain on these contracts at December 31, 2010 was $0.3 million (December 31, 2009 -$nil).
Subsequent to December 31, 2010, the Company entered into additional fixed foreign exchange forward contracts for:
• $42.0 million USD at a rate of 497.4 Chilean pesos maturing in 2011.
• $60.0 million USD at a rate of 503.4 Chilean pesos maturing in 2012
Interest rate risks
The Company is exposed to interest rate risk on its variable rate debt. As a result of the acquisition of Bema in February 2007,
the Company assumed an interest rate swap, an interest rate cap and interest rate floor contract. During the first quarter of
2008, the Company entered into an interest rate swap for Brasil Mineracao S.A. (‘‘KBM’’), formerly known as Rio Paracatu
Mineracao S.A., a 100% subsidiary of Kinross.
At December 31, 2010 with other variables unchanged, a 50 basis point downward shift in the interest rate curve would
decrease pre-tax earnings by $0.1 million and OCI before tax by $0.3 million, and a 50 basis point upward shift in the interest
rate curve would increase pre-tax earnings by $0.1 million and OCI before tax by $0.3 million.
Interest rates
As part of the Kupol project financing which was repaid in December 2010, the Company hedged its exposure to rising interest
rates by entering into an interest rate swap, and purchasing an interest rate cap, which was financed by selling an interest rate
floor. The Company has contracted to pay a fixed rate of interest of 4.4975% and receive a floating rate of interest on an
interest rate swap with a notional amount that varies from $4.2 million up to $140.0 million over the life of the swap. The fair
market value of the interest rate swap was a liability of $2.1 million as at December 31, 2010 ($4.3 million as at
December 31, 2009).
The interest rate cap has an exercise strike level of 6.37%, which is the maximum interest rate that the Company will pay on the
notional amount underlying the cap. The interest rate floor has an exercise strike level of 4.75%, which is the minimum interest
rate that will be paid on the notional amount. When floating U.S. dollar interest rates are between the cap and the floor, there is
no settlement received or paid by the Company. The notional amount varies between $3.7 million and $70.0 million over the life
of the loan. The fair value of the interest rate cap and floor was a liability of $1.9 million as at December 31, 2010 (December 31,
2009 - $2.8 million).
During the first quarter of 2008, as part of the Paracatu term loan, the Company entered into an interest rate swap to pay a
fixed rate of 3.83% and receive a floating LIBOR rate plus 100 bps on a notional amount of $100 million which amortizes over
the life of the loan. As at December 31, 2010, the fair market value was a liability of $0.5 million (December 31, 2009 -
$1.2 million).
Energy
The Company is exposed to changes in crude oil prices through its consumption of diesel fuel, and the price of electricity in
some electricity supply contracts. The Company entered into forward contracts that establish the price for some of the
Company’s diesel fuel consumption and manage the risk of fuel price increases. Diesel fuel is consumed in the operation of
mobile equipment and electricity generation.
KINROSS GOLD CORPORATION 2010 ANNUAL REPORT 143

As at December 31, 2010, the Company had purchased oil forward contracts for 120,000 barrels of Nymex Crude WTI during
2010 at an average price of $79.90 per barrel maturing in 2011. The unrealized gain on these contracts at December 31, 2010
was $1.3 million (December 31, 2009 - $0.9 million).
At December 31, 2010, with other variables unchanged, a 10% decrease in Nymex Crude WTI prices would not impact pre-tax
earnings and would decrease OCI before tax by $1.1 million, and a 10% increase in Nymex Crude WTI prices would not impact
pre-tax earnings and would increase OCI before tax by $1.1 million.
Subsequent to December 31, 2010, the Company entered into additional oil forward contracts for:
• 99,000 barrels of Nymex Crude WTI at a price of $95.17 per barrel maturing in 2011.
Total return swap
A total return swap (TRS) was engaged during the fourth quarter of 2008 as an economic hedge of the Company’s deferred
share units (DSUs). Under the terms of the TRS, a bank has the right to purchase Kinross shares in the marketplace as a hedge
against the returns in the TRS. At December 31, 2010, 96% of the DSUs were economically hedged, although hedge accounting
was not applied.
Liquidity risk
The Company manages liquidity risk by maintaining adequate cash and cash equivalent balances (December 31, 2010 -
$1,466.6 million), by utilizing its lines of credit and by monitoring developments in the capital markets. The Company’s Treasury
department continuously monitors and reviews both actual and forecasted cash flows.
The contractual cash flow requirements for financial liabilities at December 31, 2010 are as follows:
More than 2, More than 3,
Less than less than less than More than
Total 2 years 3 years 5 years 5 years
Long-term debt (a) $ 581.6 $ 113.1 $ 468.2 $ 0.3 $ -
Derivative liabilities - net $ 281.4 $ 277.4 $ 4.0 $ - $ -
(a) Includes long-term debt, including the current portion, interest as well as obligations under letters of credit issued and the full face value of the Senior Convertible Notes.
Credit risk management
Credit risk relates to accounts receivable and derivative contracts and arises from the possibility that any counterparty to an
instrument fails to perform. The Company only transacts with highly-rated counterparties and a limit on contingent exposure
has been established for any counterparty based on that counterparty’s credit rating. As at December 31, 2010, the Company’s
maximum exposure to credit risk was the carrying value of trade receivables, derivative assets, and taxes recoverable.
144

9. LONG-TERM DEBT AND CREDIT FACILITIES
As at As at
December 31, 2010 December 31, 2009
Deferred
Interest Nominal Financing Carrying Fair Carrying Fair
Rates amount Costs Amount (a) Value Amount (a) Value
Corporate revolving credit facility (i) Variable $ - $ - $ - $ - $ - $ -
Debt component, senior convertible notes (iv) 1.75% 419.5 - 419.5 450.5 402.6 403.1
Kupol project financing (iii) Variable - - - - 158.4 157.9
Corporate term loan facility (i) Variable 59.1 (2.3) 56.8 57.1 92.0 92.6
Paracatu capital leases (ii) 5.62% 22.3 - 22.3 23.2 31.8 32.2
Maricunga capital leases (ii) 6.04% - - - - 0.2 0.2
Kettle River-Buckhorn capital leases (ii) 7.70% 0.1 - 0.1 0.1 0.1 0.1
Crixas bank loan and other Variable 4.3 - 4.3 4.3 7.1 7.1
505.3 (2.3) 503.0 535.2 692.2 693.2
Less: current portion (48.4) - (48.4) (48.4) (177.0) (177.0)
Long-term debt $ 456.9 $ (2.3) $ 454.6 $ 486.8 $ 515.2 $ 516.2
(a) Includes transaction costs on debt financing.
Year ended
December 31,
2010 2009 2008
Interest incurred $ (44.3) $ (27.7) $ (105.2)
Less amounts capitalized 13.2 8.6 30.6
Interest expense $ (31.1) $ (19.1) $ (74.6)
2016 and
2011 2012 2013 2014 2015 thereafter Total
Corporate term loan facility $ 36.4 $ 22.7 $ - $ - $ - $ - $ 59.1
Crixas bank loan 2.4 0.8 0.8 0.3 - - 4.3
Paracatu capital leases 9.5 9.5 3.3 - - - 22.3
Kettle River-Buckhorn capital leases 0.1 - - - - - 0.1
Convertible Debenture - - 419.5 - - - 419.5
Total long-term debt payable $ 48.4 $ 33.0 $ 423.6 $ 0.3 $ - $ - $ 505.3
i Corporate revolving credit and term loan facilities
In November 2009, the Company entered into an amended revolving credit facility which provides credit of $450.0 million
on an unsecured basis and expires in November 2012. The term loan (corporate term loan facility) for the Paracatu property
forms part of the amended revolving credit facility, and that credit will be available to the Company as the term loan
is repaid.
On June 17, 2010 the Company entered into a further amendment to increase availability under the facility to $600.0 million.
On September 17, 2010, the revolving credit facility was further amended to add Mauritania, Ghana, and Cote d’Ivoire as
permitted jurisdictions as a result of the Red Back acquisition. All other terms and conditions under the existing revolving
credit facility remain unchanged.
KINROSS GOLD CORPORATION 2010 ANNUAL REPORT 145

As at December 31, 2010, the Company had drawn $87.7 million (December 31, 2009 - $124.4 million) on the amended
revolving credit facility, including drawings for the Paracatu term loan and $28.6 million (December 31, 2009 - $28.9 million)
for letters of credit.
The amended revolving credit facility agreement contains various covenants including limits on indebtedness, asset sales
and liens. Significant financial covenants include a minimum tangible net worth of $3,345.3 million starting September 30,
2009 and increasing by 50% of positive net income each quarter, an interest coverage ratio of at least 4.25:1, and net debt
to EBITDA, as defined in the agreement, of no more than 3.5:1. The Company is in compliance with these covenants at
December 31, 2010.
Loan interest is variable, set at LIBOR plus an interest rate margin which is dependent on the ratio of the Company’s net debt
to EBITDA as defined in the agreement.
The Company’s current ratio of net debt to EBITDA, as defined in the agreement, is less than 1.50:1. At this ratio, interest
charges are as follows:
Interest rates
Type of Credit credit facility
Dollar based LIBOR loan LIBOR plus 2.50%
Letters of credit 2.50%
Standby fee applicable to unused availability 0.75%
Also in November 2009, the Company entered into a separate Letter of Credit guarantee facility with Export Development
Canada for $125 million. Letters of credit guaranteed by this new facility are solely for reclamation liabilities at Fort Knox,
Round Mountain, and Kettle River-Buckhorn. Fees related to letters of credit under this facility are 1.00% to 1.25%.
On July 30, 2010, the Company entered into an amendment to increase the amount of the Letter of Credit guarantee facility
from $125 million to $136 million. As at December 31, 2010, the amount outstanding under this facility was $135.1 million. All
other terms and conditions under this agreement remain the same.
In addition, at December 31, 2010, the Company had approximately $11.5 million (December 31, 2009 - $15.8 million) in letters
of credit outstanding, in respect of its operations in Brazil. These letters of credit have been issued pursuant to
arrangements with Brazilian and international banks.
ii Capital leases
At December 31, 2010, the Company had equipment under capital lease totaling $22.4 million (December 31, 2009 -
$32.1 million). Repayments on the capital leases end in 2013.
The Company recorded interest expense related to the capital leases of $1.6 million, $2.3 million, and $2.2 million for the
years ended December 31, 2010, 2009, and 2008, respectively. The cost of the assets and the accumulated depreciation
related to the capital leases is $39.8 million and $14.1 million, respectively as at December 31, 2010 (December 31, 2009 -
$73.8 million and $24.1 million). The depreciation expense related to these assets in 2010 is $8.4 million (2009 - $8.4 million).
146

For the years ended December 31, 2010 and 2009, the capital lease obligations are as follows:
2010 2009
2010 $ - $ 11.4
2011 10.7 10.5
2012 10.0 10.0
2013 3.3 3.3
2014 - -
2015 - -
Total minimum lease payments $ 24.0 $ 35.2
Less amount representing interest 1.6 3.1
Present value of net minimum lease payments $ 22.4 $ 32.1
Current portion of obligations under capital lease 9.6 9.7
$ 12.8 $ 22.4
iii Kupol project financing
The Kupol project financing loan was repaid in full in December 2010.
The Kupol project financing consisted of a project loan (‘‘Project Loan’’) with a syndicate of banks and previously consisted
of a subordinated loan with the International Finance Corporation (‘‘IFC’’). The Project Loan and IFC loan were undertaken by
the Company’s 75% owned subsidiary, the Chukotka Mining and Geological Company (‘‘CMGC’’).
The Project Loan consisted of two tranches totaling $400.0 million. Tranche A, for $150.0 million, maturing June 30, 2013,
was from a group of multilateral and industry finance institutions, of which the mandated lead arrangers were Caterpillar
Financial SARL, Export Development Canada, IFC, Bank of Tokyo and ING. As at December 31, 2010, $nil (December 31, 2009 -
$69.5 million) was outstanding on Tranche A. Tranche B, for $250.0 million, maturing June 30, 2012, was fully underwritten
by the mandated lead arrangers, namely HVB and Societe Generale Corporate & Investment Banking (‘‘SG CIB’’) and as at
December 31, 2010, $nil (December 31, 2009 - $88.9 million) was outstanding. Both tranches of the Project Loan were drawn
down on a pro rata basis and administered by HVB, as documentation and facility agent, and SG CIB, as technical and
insurance agent.
Tranche A of the Project Loan had a seven-and-one half year term from drawdown, and Tranche B had a six-and-one half
year term. The annual interest rate was: (a) LIBOR plus 2% prior to economic completion of the Kupol mine; (b) LIBOR plus
2.5% for two years after economic completion; and (c) LIBOR plus 3% for each remaining term (each rate is net of political
risk insurance premiums). The Project Loan was collateralized against the Kupol Mine and was guaranteed by a subsidiary
until economic completion was achieved, as defined by the loan agreements. The loan agreements included customary
covenants for debt financings of this type including that EastWest Gold Corporation (‘‘EastWest’’), a subsidiary of Kinross,
was required to maintain minimum liquidity to meet future capital expenditure requirements at Kupol. This liquidity
requirement declined as capital expenditures were made. Kinross agreed to assume the hedge contracts for the Kupol
project in the event that the Kupol loan is accelerated, and the net mark-to-market position of all the hedge contracts
is negative.
Under the terms of the Kupol Project Loan there were two significant milestones that the project had to meet in order for the
loan to become a non-recourse loan; Mechanical Completion, and Economic Completion. Mechanical Completion was
achieved on September 30, 2008, and Economic completion was achieved on September 23, 2009.
Having achieved economic completion, the Company was released from a guarantee that EastWest Gold (formerly known as
Bema Gold) had given the project lenders and the Company received back a $25 million letter of credit. The Company
received consent from the lenders to allow it to complete a special cash distribution when economic completion was
KINROSS GOLD CORPORATION 2010 ANNUAL REPORT 147

achieved. As part of the distribution, the Company was required to prepay a portion of the principal outstanding on the loan
(approximately $89.0 million), and as a result, also declared and paid a dividend (total dividend payment $102.6 million,
Kinross’ share $76.8 million).
The Project Loan contained various covenants, including certain ratios of estimated future cash flows to total debt that are
to be greater than 135% over the term of the loans and greater than 150% over the term of the project; debt coverage ratios
of at least 115%; and the minimum Proven and Probable Reserves of at least 30% of the Proven and Probable Reserves as of
the effective date of the Project Loan.
On March 20, 2009, 8.5 million Kinross share purchase warrants were converted into 3.8 million Kinross shares at a price of
$6.61 plus CDN$0.01 per warrant. As a result, the balance outstanding on the IFC loan of $25 million was assigned to
EastWest Gold. As the loan was of an intercompany nature, it was eliminated on consolidation, and as at December 31, 2010
the loan was fully repaid. The $25 million was allocated to common shares commensurate with the issuance of the 3.8 million
Kinross shares.
As at December 31, 2010, cash of $nil (December 31, 2009 - $22.2 million) was restricted for payments related to the Project
Loan, as the loan was repaid in full.
iv Senior convertible notes
During January 2008, the Company completed a public offering of $460.0 million Senior Convertible Notes due March 15,
2028, each in the amount of one thousand dollars. The notes will pay interest semi-annually at a rate of 1.75% per annum.
The notes will be convertible, at the holder’s option, equivalent to a conversion price of $28.04 per share of common stock,
subject to adjustment. Kinross received net proceeds of $449.9 million from the offering of Convertible Notes, after payment
of the commissions of the initial purchasers and expenses of the offering. The Convertible Notes are convertible into Kinross
common shares at a fixed conversion rate, subject to certain anti-dilution adjustments, only in the event that (i) the market
price of Kinross common shares exceeds 130% of the effective conversion price of the Convertible Notes, (ii) the trading
price of the Convertible Notes falls below 98% of the amount equal to Kinross’ then prevailing common share price, times
the applicable conversion rate, (iii) the Convertible Notes are called for redemption, (iv) upon the occurrence of specified
corporate transactions or (v) if Kinross common shares cease to be listed on a specified stock exchange or eligible for
trading on an over-the-counter market. The Convertible Notes will also be convertible on and after December 15, 2027. The
Convertible Senior Notes are redeemable by the Company, in whole or part, for cash at any time on or after March 20, 2013,
at a redemption price equal to par plus accrued and unpaid interest, if any, to the redemption date. Holders of the
Convertible Notes will have the right to require Kinross to repurchase the Convertible Notes on March 15, 2013, 2018 and
2023, and, on or prior to March 20, 2013, upon certain fundamental changes. The redemption price will be equal to 100% of
the principal amount of the Convertible Notes plus accrued and unpaid interest to the redemption date, if any.
148

10. RECLAMATION AND REMEDIATION OBLIGATIONS
The Company conducts its operations so as to protect the public health and the environment, and to comply with all applicable
laws and regulations governing protection of the environment. Reclamation and remediation obligations arise throughout the
life of each mine. The Company estimates future reclamation costs based on the level of current mining activity and estimates
of costs required to fulfill the Company’s future obligation. The following table details the items that affect the reclamation and
remediation obligations:
December 31, December 31,
2010 2009
Balance at January 1, $ 269.8 $ 246.8
Additions resulting from acquisition of Red Back 11.9 -
Additions resulting from acquisition of Dvoinoye 5.0 -
Reclamation spending (13.1) (12.5)
Accretion and reclamation expenses 29.0 19.3
Asset retirement cost 52.0 16.2
Balance at December 31 354.6 269.8
Less: current portion (23.1) (17.1)
Long-term reclamation and remediation obligations $ 331.5 $ 252.7
Included in the December 31, 2010 accretion and reclamation expenses is a $8.1 million charge (2009 - $3.6 million reduction)
reflecting revised estimated fair values of costs that support the reclamation and remediation obligation for properties that
have been closed. The undiscounted cash flows, before inflation adjustments, estimated to settle the reclamation and
remediation obligations as at December 31, 2010 are approximately $613.5 million (2009 - $470.5 million). The majority of the
expenditures are expected to occur between 2011 and 2051. The credit adjusted risk-free rates used in estimating the site
restoration cost obligation were 6%, 9% and, 9%, and the inflation rate used was 2% for each of the years ended December 31,
2010, 2009 and 2008, respectively.
Regulatory authorities in certain jurisdictions require that security be provided to cover the estimated reclamation and
remediation obligations. As at December 31, 2010, letters of credit totaling $155.4 million (2009 - $119.5 million) had been issued
to various regulatory agencies to satisfy financial assurance requirements for this purpose. The letters of credit were issued
against the Company’s Letter of Credit guarantee facility with Export Development Canada and the revolving credit facility. The
Company believes it is in compliance with all applicable requirements under these facilities.
KINROSS GOLD CORPORATION 2010 ANNUAL REPORT 149

11. COMMON SHARE CAPITAL AND COMMON SHARE PURCHASE WARRANTS
The authorized share capital of the Company is comprised of an unlimited number of common shares. A summary of common
share transactions are as follows:
2010 2009 2008
Number of Number of Number of
shares shares shares
(000’s) Amount (000’s) Amount (000’s) Amount
Common shares
Balance at January 1, 696,027 $ 6,387.0 659,438 $ 5,779.2 611,925 $ 5,085.6
Issued (cancelled):
Equity Issuance - - 24,035 396.4 - -
On acquisition of Lobo-Marte - - 5,605 102.9 - -
On acquisition of Aurelian - - - - 43,692 639.7
On acquisition of Underworld 6,501 117.7 - - - -
On acquisition of Dvoinoye 10,558 173.9 - - - -
On acquisition of Red Back 416,358 6,549.3 - - - -
Under employee share purchase plan 304 5.5 225 4.4 187 3.4
Under stock option and restricted share plan 1,152 20.8 1,953 30.4 3,343 46.2
Under Aurelian options 316 4.6 918 15.1 246 3.8
Expiry of Echo Bay options - - - - - (0.1)
Under Bema options 11 0.1 65 0.8 - -
Under Echo Bay options - - 6 0.1 - -
Under Underworld options 214 3.8 - - - -
Under Red Back options 1,632 25.7 - - - -
Conversions:
Bema warrants (a) 222 2.4 3,782 57.7 45 0.6
Balance at December 31, 1,133,295 $13,290.8 696,027 $ 6,387.0 659,438 $ 5,779.2
Common share purchase warrants (a)
Balance at January 1, 24,725 $ 61.1 28,507 $ 93.8 8,856 $ 38.0
On acquisition of Aurelian - - - - 19,696 56.0
On acquisition of Red Back 25,759 117.7 - - - -
Conversion of warrants (222) (1.0) (3,782) (32.7) (45) (0.2)
Balance at December 31, 50,262 $ 177.8 24,725 $ 61.1 28,507 $ 93.8
Total common share capital and common share
purchase warrants $13,468.6 $ 6,448.1 $ 5,873.0
(a) See below for discussion of common share purchase warrants.
On February 16, 2011, the Board of Directors declared a dividend of $0.05 per common share to shareholders of record on
March 24, 2011.
On August 4, 2010, the Board of Directors declared a dividend of $0.05 per share which was payable to common shareholders
on September 30, 2010. On February 17, 2010, the Board of Directors declared a dividend of $0.05 per common share which was
payable to common shareholders on March 31, 2010.
On August 12, 2009, the Board of Directors declared a cash dividend of $0.05 per common share. A cash dividend of $0.04 per
common share was declared on February 18, 2009.
A cash dividend of $0.04 per common share was declared on February 21, 2008.
150

Updated shareholders’ rights plan
On February 26, 2009, the Company entered into a new shareholder rights plan (the ‘‘New Plan’’). The New Plan ensures that
Kinross and its shareholders continue to receive the benefits associated with Kinross’ current shareholder rights plan (the ‘‘Old
Plan’’) which expired on March 29, 2009. The New Plan has been adopted at this time to prevent any gap in shareholder
protection and was effective on March 29, 2009. Subject to shareholder reconfirmation of the New Plan at Kinross’ annual
meetings in 2012 and 2015, the New Plan will be in effect until the ninth anniversary of the date on which it becomes effective.
As with the Old Plan, the New Plan is designed to provide adequate time for the Board of Directors and shareholders to assess
an unsolicited take-over bid for Kinross, to provide the Board of Directors with sufficient time to explore and develop
alternatives for maximizing shareholder value if a take-over bid is made, and to provide shareholders with an equal opportunity
to participate in a take-over bid and receive full and fair value for their Kinross common shares (the ‘‘Common Shares’’).
The rights issued under the New Plan will initially attach to and trade with the Common Shares and no separate certificates will
be issued unless an event triggering these rights occurs. The rights will become exercisable only when a person, including any
party related to it, acquires or attempts to acquire 20 percent or more of the outstanding Shares without complying with the
‘‘Permitted Bid’’ provisions of the New Plan or without approval of the Board of Directors. Should such an acquisition occur or
be announced, each right would, upon exercise, entitle a rights holder, other than the acquiring person and related persons, to
purchase Common Shares at a 50 percent discount to the market price at the time.
Under the New Plan, a Permitted Bid is a bid which is made to all holders of the Common Shares and which is open for
acceptance for not less than 60 days. If at the end of 60 days at least 50 percent of the outstanding Common Shares, other
than those owned by the offeror and certain related parties have been tendered, the offeror may take up and pay for the
Common Shares but must extend the bid for a further 10 days to allow other shareholders to tender.
Common share purchase warrants
A summary of the status of the common share purchase warrants and changes during the year ended December 31, 2010 are
as follows:
Canadian $ denominated common share purchase warrants
Weighted average
Number outstanding exercise price
(000’s) (a) (CDN$)
Balance, January 1, 2010 24,392 $ 30.17
Issued - -
Exercised - -
Outstanding at December 31, 2010 (c) 24,392 $ 30.17
US $ denominated common share purchase warrants
Number outstanding Weighted average
(000’s) (a) exercise price
Balance, January 1, 2010 333 $ 8.46
Issued (b) 25,759 21.30
Exercised (222) 6.30
Outstanding at December 31, 2010 (d) 25,870 $ 21.26
(a) Represents share equivalents of warrants.
(b) On acquisition of Red Back, 25.8 million purchase warrants were issued.
(c) Includes 10.6 million Bema warrants outstanding that are convertible into 4.7 million Kinross shares plus CDN$0.01 per Bema warrant.
(d) Includes 0.3 million Bema warrants outstanding that are convertible into 0.1 million Kinross shares plus CDN$0.01 per Bema warrant.
KINROSS GOLD CORPORATION 2010 ANNUAL REPORT 151

The following table summarizes information regarding the common share purchase warrants outstanding and exercisable at
December 31, 2010:
Canadian $ denominated common share purchase warrants
Weighted average
Weighted average remaining
Number outstanding exercise price contractual life
Exercise price (000’s) (a) (CDN$) (years)
$ 22.48 4,697 $ 22.48 0.68
32.00 19,695 32.00 2.68
Outstanding at December 31, 2010 24,392 $ 30.17 2.29
US $ denominated common share purchase warrants
Weighted average
Weighted average remaining
Number outstanding exercise price contractual life
Exercise price (000’s) (a) (US$) (years)
$ 12.89 111 $ 12.89 0.40
21.30 25,759 21.30 3.72
Outstanding at December 31, 2010 25,870 $ 21.26 3.70
(a) Represents share equivalents of warrants.
Capital Management
Our objectives when managing capital are to:
• Ensure the Company has sufficient cash available to support the mining, exploration, and other areas of the business in any
gold price environment
• Ensure the Company has the capital and capacity to support our long-term growth strategy
• Provide investors with a superior rate of return on their invested capital
• Ensure compliance with all bank covenant ratios
• Minimize counterparty credit risk
Kinross adjusts its capital structure based on changes in forecasted economic conditions and based on the Company’s
long-term strategic business plan. Kinross has the ability to adjust its capital structure by issuing new equity, drawing on
existing credit facilities, issuing new debt, and by selling or acquiring assets. Kinross can also control how much capital is
returned to shareholders through dividends and share buybacks.
152

The Company’s quantitative capital management objectives are largely driven by the requirements under its debt agreements
and are noted in the tables below:
December 31, December 31,
2010 2009
Long-term debt $ 454.6 $ 515.2
Current portion of long-term debt $ 48.4 $ 177.0
Total debt $ 503.0 $ 692.2
Common shareholders’ equity $ 13,400.5 $ 5,559.5
Gross debt/equity ratio 3.8% 12.5%
Company target 0 - 30% 0 - 30%
December 31, December 31,
2010 2009
Rolling 12 month EBITDA (a) $ 1,471.9 $ 1,104.2
Rolling 12 month Interest expense (b) $ 44.3 $ 27.7
Interest coverage ratio 33.23:1 39.86:1
Company target ratio > 4.25:1 > 4.25:1
(a) EBITDA is a defined term under the Company’s current credit facility agreement.
(b) Interest expense includes interest expense reported in the financial statements in addition to capitalized interest.
12. STOCK-BASED COMPENSATION
Stock-based compensation recorded during the years ended December 31 was as follows:
2010 2009 2008
Stock option plan expense $ 10.8 $ 11.1 $ 6.8
Employer portion of share purchase plan 1.9 1.5 1.1
Restricted share plan expense, including restricted performance share plan 19.7 16.4 12.4
Deferred share unit plan expense 0.6 - 1.3
Total stock-based compensation expense $ 33.0 $ 29.0 $ 21.6
Share purchase plan
The Company has an Employee Share Purchase Plan whereby North American employees of the Company have the opportunity
to contribute up to a maximum of 10% of their annual base salary to purchase common shares. Since 2004, the Company
contributes 50% of the employees’ contributions. The Company issues common shares equal to the employees’ contributions
and the Company’s contribution from treasury each quarter. The common shares are purchased based on the weighted average
price on the last twenty trading sessions prior to the end of the quarter. The number of shares issued by the Company and the
average of the price per share for the years ending December 31 are as follows:
2010 2009 2008
Common shares issued (000’s) 304 225 187
Average price of shares issued $ 18.01 $ 19.33 $ 18.15
Restricted share unit plan
The Company has a Restricted Share Unit (‘‘RSU’’) plan whereby restricted share units may be granted to employees, officers,
directors and consultants of the Company. A restricted share unit is exercisable into one common share entitling the holder to
KINROSS GOLD CORPORATION 2010 ANNUAL REPORT 153

acquire the common share for no additional consideration. Restricted share units vest over a three year period. The current
maximum number of common shares issuable under the RSU plan is 8.0 million. A total of 1,335,000 restricted share units with
a weighted average grant-date fair value of CDN$18.98 per unit were granted during the year ended December 31, 2010 (2009 -
1,145,000 at CDN$22.72; 2008 - 896,000 at CDN$21.93). There were 2,132,000 and 1,856,000 restricted share units granted
and outstanding as at December 31, 2010 and 2009, respectively.
A summary of the status of the restricted share unit plan and changes during the years ended December 31, 2010, 2009, and
2008, are as follows:
2010 2009 2008
Restricted share units (000’s) (000’s) (000’s)
Balance, January 1 1,856 1,597 1,215
Granted 1,335 1,145 896
Reinvested 12 8 6
Redeemed (878) (714) (453)
Forfeited (193) (180) (67)
Outstanding at December 31 2,132 1,856 1,597
Restricted performance share unit plan
In 2009, the Company implemented a restricted performance share unit plan (‘‘RPSUs’’). The RPSUs are subject to certain
vesting requirements and vest after 35 months. The vesting requirements are based on certain criteria established by
the Company. A total of 214,000 restricted performance share units with a weighted average grant-date fair value of
CDN$19.23 per unit were granted during the year ended December 31, 2010 (2009 - 49,000 at CDN$23.74). There were
223,000 and 42,000 restricted performance share units granted and outstanding as at December 31, 2010 and 2009,
respectively.
A summary of the status of the restricted performance share unit plan and changes during the years ended December 31, 2010
and 2009 are as follows:
2010 2009
Restricted performance share units (000’s) (000’s)
Balance, January 1 42 -
Granted 214 49
Reinvested 2 -
Forfeited (35) (7)
Outstanding at December 31 223 42
Deferred share unit plan
The Company has a deferred share unit (‘‘DSU’’) plan for its outside directors that provides that each outside director receives,
on the date in each quarter which is two business days following the publication by the Company of its earnings results for the
previous quarter, or year in the case of the first quarter, that number of DSUs having a value equal to 50% of the compensation
of the outside director for the current quarter. Each outside director can elect to receive a greater percentage of their
compensation in DSUs, and an outside director who has exceeded a minimum DSU/common share ownership requirement may
elect to receive cash for all or any portion of the compensation otherwise payable in DSUs. The number of DSUs granted to an
outside director is based on the closing price of the Company’s common shares on the Toronto Stock Exchange on the business
day immediately preceding the date of grant. At such time as an outside director ceases to be a director, the Company will
make a cash payment to the outside director, equal to the market value of a Kinross common share on the date of departure,
multiplied by the number of DSUs held on that date. A total of 37,300 DSU’s with a weighted average grant-date fair value of
154

CDN$18.44 were granted during the year ended December 31, 2010 (2009 - 38,500 at CDN$21.91; 2008 - 38,100 at CDN $21.67
per unit). There were 255,100, 220,000, and 201,200 DSUs outstanding as at December 31, 2010, 2009, and 2008, respectively.
Stock option plan
The Company has a stock option plan for officers and employees, enabling them to purchase common shares. The total number
of options outstanding at any time cannot exceed 10% of the total number of outstanding common shares. Each option granted
under the plan is for a maximum term of five years. One-third of the options are exercisable each year commencing one year
after the date of grant. The exercise price is determined by the Company’s Board of Directors at the time the option is granted,
subject to regulatory approval and may not be less than the closing market price of the common shares on the last trading day
prior to the grant of the option. The stock options outstanding at December 31, 2010 expire at various dates to 2015. As at
December 31, 2010, 6,518,846 common shares, in addition to those outstanding at year end, were available for granting
of options.
A summary of the status of the stock option plan and changes during the years ended December 31, 2010, 2009, and 2008, are
as follows:
2010 2009 2008
Weighted Weighted Weighted
average average average
price price price
Canadian $ denominated options (000’s) (CDN$) (000’s) (CDN$) (000’s) (CDN$)
Balance, January 1 7,192 $ 18.80 8,293 $ 16.22 5,948 $ 12.31
Options issued on acquisition of Aurelian - - - - 4,125 14.84
Options issued on acquisition of Red Back 8,726 8.55 - - - -
Options issued on acquisition of Underworld 420 5.69 - - - -
Granted 1,575 19.14 1,500 22.95 1,500 22.58
Exercised (2,446) 4.54 (2,229) 11.57 (3,136) 10.08
Forfeited (221) 20.78 (372) 21.34 (144) 17.11
Outstanding at December 31 15,246 $ 14.86 7,192 $ 18.80 8,293 $ 16.22
2010 2009 2008
Weighted Weighted Weighted
average average average
exercise price exercise price exercise price
United States $ denominated options (000’s) (CDN$) (000’s) (CDN$) (000’s) (CDN$)
Balance, January 1 - $ - - $ - 1 $ 9.15
Adjustments - - - - - -
Exercised - - - - - -
Forfeited - - - - (1) 9.15
Outstanding at December 31 - $ - - $ - - $ -
KINROSS GOLD CORPORATION 2010 ANNUAL REPORT 155

The following table summarizes information about the stock options outstanding and exercisable at December 31, 2010:
Options outstanding Options exercisable
Weighted Weighted Weighted Weighted
average average average average
Number exercise remaining Number exercise remaining
outstanding price contractual outstanding price contractual
Exercise Price range in Canadian dollars: (000’) (CDN$) life (years) (000’) (CDN$) life (years)
$ 3.01 $ 4.03 2,133 $ 3.72 2.32 2,133 $ 3.72 2.32
4.04 9.22 2,469 7.31 3.14 2,469 7.31 3.14
9.23 13.82 1,274 13.27 1.77 1,274 13.27 1.77
13.83 21.06 5,812 17.03 3.47 4,062 16.11 3.19
21.07 26.42 3,558 23.81 2.09 2,570 23.83 1.81
15,246 $ 14.86 2.79 12,508 $ 13.56 2.60
The following weighted average assumptions were used in computing the fair value of stock options granted during the last
three fiscal years ended December 31:
Black-Scholes weighted-average assumptions: 2010 2009 2008
Expected dividend yield 0.52% 0.36% 0.5%
Expected volatility 49.9% 50.4% 42.3%
Risk-free interest rate 1.7% 1.7% 2.9%
Estimated forfeiture rate 3.0% 3.0% 3.0%
Expected option life in years 3.5 3.5 3.2
Weighted average fair value per stock option granted CDN$ $ 7.01 $ 8.54 $ 6.82
156

13. EARNINGS PER SHARE
Earnings per share (‘‘EPS’’) has been calculated using the weighted average number of common shares and common share
equivalents issued and outstanding during the period. Stock options and common share purchase warrants are reflected in
diluted earnings per share by application of the treasury method. In 2008, the Kinam Gold Inc. preferred shares and convertible
notes were reflected in diluted earnings per share by application of the if-converted method. The following table details the
weighted average number of outstanding common shares for the purposes of computing basic and diluted earnings per
common share for the following periods:
(Number of common shares in thousands) 2010 2009 2008
Basic weighted average shares outstanding: 824,545 691,509 628,594
Weighted average shares dilution adjustments:
Dilutive stock options (a) 2,212 2,086 -
Restricted shares 2,151 1,884 -
Performance shares 223 41 -
Common share purchase warrants (a) 78 969 -
Diluted weighted average shares outstanding 829,209 696,489 628,594
Weighted average shares dilution adjustments - exclusions: (b)
Stock options 5,876 1,509 2,712
Common share purchase warrants 50,152 24,393 13,744
Kinam preferred shares - - 331
Convertible notes 25,960 16,152 22,737
(a) Dilutive stock options and warrants were determined using the Company’s average share price for the period. For the year ended December 31, 2010 the average share price used was$17.72 (2009: $18.64, 2008: $nil per share).
(b) These adjustments were excluded, as they were anti-dilutive for the years ended December 31, 2010, 2009, and 2008.
14. INCOME AND MINING TAXES
i Income and mining taxes expense
The following table shows the provision for income and mining taxes:
(in millions) 2010 2009 2008
Income Taxes
Current
Canada $ - $ - $ -
Foreign (352.9) (175.5) (71.3)
Future
Canada 2.5 - -
Foreign 74.2 29.7 (24.3)
Mining Taxes
Current
Canada - - 0.1
Foreign (1.7) (3.2) (2.0)
Future
Canada - - -
Foreign 2.5 (1.8) (3.6)
$(275.4) $ (150.8) $ (101.1)
KINROSS GOLD CORPORATION 2010 ANNUAL REPORT 157

The reconciliation of the combined Canadian federal and provincial statutory income tax rate to the effective tax rate is
as follows:
2010 2009 2008
Combined statutory income tax rate 31.0% 33.0% 33.5%
Increase (decrease) resulting from:
Mining taxes 0.8% 1.0% (0.8%)
Resource allowance and depletion - - 1.5%
Difference in foreign tax rates and foreign exchange on
future tax balances 0.3% (13.8%) 7.8%
Benefit of losses not recognized (3.3%) 3.4% (8.1%)
Taxes on repatriation of foreign earnings 2.3% - -
Income not subject to tax (6.7%) - -
Effect of non-deductible goodwill impairment - - (50.9%)
Enacted rate change (2.3%) - -
Other (a) 1.6% 2.8% 1.5%
Effective tax rate 23.7% 26.4% (15.5%)
(a) For 2009, other is primarily the income tax expense related to foreign exchange gains on US dollar intercompany and third party debt owing by Paracatu less the income tax recoveryrelated to the Brazilian Federal Tax Amnesty program.
ii Future income taxes
The following table summarizes the components of future income taxes:
2010 2009
Future tax assets
Accrued expenses and other $ 115.3 $ 98.7
Reclamation and remediation obligations 71.3 39.1
Alternative minimum tax credits - 78.0
Non-capital loss carryforwards 152.2 216.5
Property, plant and equipment 104.6 95.4
Inventory capitalization 7.0 4.5
Valuation allowance (230.3) (310.7)
220.1 221.5
Future tax liabilities
Accrued expenses and other 49.4 13.2
Property, plant and equipment 1,029.2 831.6
Inventory capitalization 25.3 1.3
Future tax liabilities - net 883.8 624.6
158

iii Non-capital losses
The following table summarizes the Company’s non-capital losses that can be applied against future taxable income:
Country Type Amount Expiry Date
Canada (a) Net operating losses $ 277.5 2011 - 2030
United States (b) Net operating losses 175.8 2011 - 2030
United States (b) Alternative minimum tax 17.8 2011 - 2030
Chile Net operating losses 277.8 No expiry
Mexico Net operating losses 13.7 2020 - 2021
Brazil Net operating losses 8.9 No expiry
Barbados Net operating losses 320.2 2014-2020
Other Net operating losses 13.6 2020
(a) Approximately $3.9 million are limited in their deduction to income from specific operations.
(b) Utilization of the U.S. loss carry forwards will be limited in any year as a result of previous changes in ownership.
15. SEGMENTED INFORMATION
The Company operates primarily in the gold mining industry and its major product is gold. Its activities include gold production,
acquisition, exploration and development of gold properties. The Company’s primary mining operations are in the
United States, the Russian Federation, Brazil, Ecuador, Chile, Ghana, and Mauritania. The reported segments are those
operations whose operating results are reviewed by the Chief Executive Officer and that pass certain quantitative measures.
Operations whose revenues, earnings or losses or assets exceed 10% of the total consolidated revenue, earnings or losses, or
assets are reportable segments. Properties that are in development or have not reached commercial production levels are
reported as non-operating segments. Properties that are under care and maintenance, are shut down and are in reclamation
and non-mining and other operations are reported in Corporate and other.
KINROSS GOLD CORPORATION 2010 ANNUAL REPORT 159

The following tables set forth information by segment.
Year ended December 31, 2010:
Segment
Exploration Segment assets -
and operating As at
Metal Cost of business earnings Capital December 31,
sales sales (a) Accretion DD&A (b) development Other (c) (loss) expenditures 2010
Operating segments
Fort Knox $ 432.9 $ 192.1 $ 1.8 $ 53.5 $ 3.0 $ - $ 182.5 $ 87.9 $ 491.2
Round Mountain 227.5 121.3 1.4 19.0 1.4 (0.3) 84.7 32.7 272.4
Kettle River-Buckhorn 242.6 64.7 2.3 91.5 7.1 (2.6) 79.6 9.2 258.1
Kupol 781.8 236.2 1.6 156.6 15.7 1.2 370.5 32.1 1,332.2
Paracatu 597.8 261.0 2.5 62.9 - 10.7 260.7 161.4 1,563.7
Crixas 94.7 37.5 0.2 17.1 0.9 0.4 38.6 24.6 145.0
La Coipa 250.5 132.0 9.1 45.8 5.1 0.2 58.3 26.5 450.8
Maricunga 187.5 115.9 0.6 14.5 1.1 1.6 53.8 72.0 609.3
Tasiast 78.0 43.1 0.1 20.4 22.9 0.7 (9.2) 53.8 1,323.3
Chirano 116.8 51.6 0.1 31.1 4.4 0.2 29.4 10.1 712.6
Non-operating segments
Fruta del Norte - - - 0.6 7.8 31.7 (40.1) 1.4 1,040.6
Cerro Casale (d) - - - - - - - 4.0 -
Corporate and other (e) - - 9.3 4.5 73.3 154.5 (241.6) 48.0 8,197.9
Total $ 3,010.1 $ 1,255.4 $ 29.0 $ 517.5 $ 142.7 $ 198.3 $ 867.2 $ 563.7 $16,397.1
Year ended December 31, 2009:
Segment
Exploration Segment assets -
and operating As at
Metal Cost of business earnings Capital December 31,
sales sales (a) Accretion DD&A (b) development Other (c) (loss) expenditures 2009
Operating segments
Fort Knox $ 261.0 $ 143.7 $ 1.7 $ 32.6 $ 2.4 $ 0.2 $ 80.4 $ 133.1 $ 434.2
Round Mountain 210.0 111.4 1.6 12.1 0.4 0.4 84.1 33.0 248.1
Kettle River-Buckhorn 182.0 53.6 2.9 64.6 3.9 (1.6) 58.6 30.3 332.8
Kupol 900.2 245.5 1.4 205.1 4.8 0.9 442.5 39.3 1,411.8
Paracatu 340.1 240.9 1.0 42.5 - 14.0 41.7 124.1 1,358.9
Crixas 73.6 31.0 0.1 9.7 0.7 6.2 25.9 25.2 134.8
La Coipa 216.4 97.6 8.5 57.5 6.3 4.2 42.3 18.8 436.8
Maricunga 228.8 123.4 0.5 19.3 0.2 2.2 83.2 42.5 537.5
Non-operating segments
Fruta del Norte - - - 0.3 4.3 21.4 (26.0) 3.1 1,033.4
Cerro Casale (d) - - - - - 0.4 (0.4) 22.2 914.6
Corporate and other (e) - - 1.6 3.6 49.5 131.7 (186.4) 9.6 1,170.3
Total $ 2,412.1 $ 1,047.1 $ 19.3 $ 447.3 $ 72.5 $ 180.0 $ 645.9 $ 481.2 $ 8,013.2
160

Year ended December 31, 2008:
Segment
Exploration Segment assets -
and operating As at
Metal Cost of business Impairment earnings Capital December 31,
sales sales (a) Accretion DD&A (b) development Other (c) - Goodwill (loss) expenditures 2008
Operating segments
Fort Knox $ 290.3 $ 152.4 $ 1.2 $ 29.7 $ 2.7 $ 2.0 $ - $ 102.3 $ 126.6 $ 315.8
Round Mountain 213.7 112.9 1.1 22.2 0.7 - - 76.8 36.9 228.2
Kettle River-
Buckhorn 13.7 5.6 2.1 5.9 3.4 3.3 - (6.6) 42.5 362.5
Kupol 433.2 116.8 0.9 121.6 5.4 - 668.4 (479.9) 102.4 1,476.3
Paracatu 161.4 82.4 1.2 16.3 - (8.7) - 70.2 329.2 1,241.0
Crixas 75.3 26.2 0.4 10.7 2.1 0.9 - 35.0 19.7 120.4
La Coipa 206.6 114.7 7.9 38.8 3.7 2.8 - 38.7 17.1 408.5
Maricunga 184.8 125.5 0.4 17.8 1.4 - 220.2 (180.5) 22.4 525.5
Julietta (f) 38.0 32.3 0.2 8.1 0.4 - - (3.0) 2.4 -
Non-operating segments
Fruta del Norte - - - - 0.4 4.4 - (4.8) - 1,043.3
Cerro Casale (d) - - - - - 0.1 - (0.1) 10.9 884.8
Corporate and other (e) - - 9.3 2.7 38.8 103.4 105.5 (259.7) 4.6 781.2
Total $ 1,617.0 $ 768.8 $ 24.7 $ 273.8 $ 59.0 $ 108.2 $ 994.1 $ (611.6) $ 714.7 $ 7,387.5
(a) Cost of sales excludes accretion, depreciation, depletion and amortization.
(b) Depreciation, depletion and amortization is referred to as ‘‘DD&A’’ in the tables above.
(c) Other includes Other operating costs and General and administrative expenses.
(d) As of March 31, 2010, Cerro Casale is accounted for as an equity investment.
(e) Includes corporate, shutdown operations and other non-core operations. As at December 31, 2010, Corporate and other includes unallocated goodwill relating to the acquisition of RedBack of $5,161.1 million.
(f) Julietta was sold in August 2008.
The following table outlines information by country:
Metal sales Property, plant & equipment
For the years ended December December 31, December 31,
2010 2009 2008 2010 2009
Geographic information:
United States $ 903.0 $ 653.0 $ 517.7 $ 714.2 $ 730.4
Russian Federation 781.8 900.2 471.2 1,081.0 707.5
Brazil 692.5 413.7 236.7 1,323.4 1,197.3
Chile 438.0 445.2 391.4 827.1 1,290.0
Mauritania 78.0 - - 1,199.0 -
Ghana 116.8 - - 582.8 -
Ecuador - - - 1,028.8 1,028.0
Canada - - - 155.2 36.7
Total $ 3,010.1 $ 2,412.1 $ 1,617.0 $ 6,911.5 $ 4,989.9
KINROSS GOLD CORPORATION 2010 ANNUAL REPORT 161

The following table outlines sales to individual customers exceeding 10% of annual metal sales:
Metal Sales
For the years ended December 31,
Rank 2010 2009 2008
1 $ 1,152.7 $ 1,187.6 $ 579.5
2 353.4 300.7 244.0
3 353.1 250.5 195.8
4 - - 165.3
5 - - 118.6
Total $ 1,859.2 $ 1,738.8 $ 1,303.2
% of total metal sales 61.8% 72.0% 80.6%
The Company is not economically dependent on a limited number of customers for the sale of its product because gold can besold through numerous commodity market traders worldwide.
16. OPERATING LEASESThe Company has a number of operating lease agreements involving office space and equipment. The operating leases forequipment provide that the Company may, after the initial lease term, renew the lease for successive yearly periods or maypurchase the equipment at its fair market value. One of the operating leases for office facilities contains escalation clauses forincreases in operating costs and property taxes. A majority of these leases are cancelable and are renewable on a yearly basis.Future minimum lease payments required to meet obligations that have initial or remaining non-cancelable lease terms inexcess of one year are $6.0 million, $4.8 million, $4.8 million, $4.6 million and $4.3 million for each year from 2011 to 2015,respectively, and $19.2 million thereafter.
17. RELATED PARTY TRANSACTIONThere were no material related party transactions in 2010, 2009, and 2008.
18. CONTINGENCIESGeneralEstimated losses from contingencies are accrued by a charge to earnings when information available prior to the issuance ofthe financial statements indicates that it is likely that a future event will confirm that an asset has been impaired or a liabilityincurred at the date of the financial statements and the amount of the loss can be reasonably estimated.
Aurelian Warrant LitigationIn 2009, the Company settled litigation in respect of certain actions brought against Aurelian Resources Inc., which wasacquired in 2008. As a result, an adjustment to the litigation reserve was made in the amount of $18.5 million.
Kinam Preferred SharesDuring 2008, the Company entered into a memorandum of understanding to settle all claims related to the Kinam preferredshare litigation in the amount of $29.25 million. As the Company previously held the preferred shares balance at $10.1 million,this resulted in a charge of $19.1 million in 2008 (see Note 5(xi)).
Cerro Casale ContingencyThe Company was obligated to pay $40 million to Barrick when a production decision is made relating to the Cerro Casaleproject. During the first quarter of 2010, this contingent liability was reduced to $20 million in accordance with the agreementwith Barrick under which the Company sold one-half of its 50% interest in the Cerro Casale project. See Note 4(i) for moredetails on the disposition.
Other legal mattersThe Company is involved in legal proceedings from time to time, arising in the ordinary course of its business. Typically, theamount of ultimate liability with respect to these actions will not, in the opinion of management, materially affect Kinross’financial position, results of operations or cash flows.
162

Income taxes
The Company operates in numerous countries around the world and accordingly is subject to, and pays annual income taxes
under the various regimes in countries in which it operates. These tax regimes are determined under general corporate income
tax laws of the country. The Company has historically filed, and continues to file, all required income tax returns and to pay the
taxes reasonably determined to be due. The tax rules and regulations in many countries are complex and subject to
interpretation. From time to time the Company will undergo a review of its historic tax returns and in connection with such
reviews, disputes can arise with the taxing authorities over the Company’s interpretation of the country’s income tax rules.
Brazil
During 2009, the Brazilian federal legislature passed a tax amnesty program. A Brazilian taxpayer could agree to settle its
federal tax debts resulting from an assessment of tax before December 1, 2009 at a discount. On November 27, 2009, the
Company settled a significant portion of its Brazilian federal tax debts under this amnesty program resulting in a reduction in
its other expense line in the income statement of $45.5 million.
In early August 2009, the Company’s wholly-owned Brazilian subsidiary, Kinross Brasil Mineracao S.A. (‘‘KBM’’), formerly known
as Rio Paracatu Mineracao S.A., the owner of Paracatu, received a tax assessment from the Brazilian federal tax authorities in
the amount of $153.7 million (December 31, 2009 - $146.0 million), including penalties and interest of $89.5 million
(December 31, 2009 - $82 million). The assessment denies deductions for goodwill claimed by KBM during 2005 through 2008.
As at December 31, 2010, the Company has a future tax asset of approximately $66.4 million recorded in its financial
statements in respect of the goodwill balance, the future deduction of which will depend on the outcome of the assessment. The
Company has assessed the net tax benefit related to this item, concluding it appropriate. On September 1, 2009, the Company
filed its administrative appeal of this assessment.
In late December 2008, KBM received a tax assessment from the Brazilian tax authorities in respect of its 2003 tax. This
assessment is the result of the denial of a deduction for interest paid on certain debentures issued by such Brazilian subsidiary.
On July 15, 2009, the Company received a similar assessment with respect to its 2004 tax year. On November 27, 2009, the
Company settled these tax debts under the Brazilian tax amnesty program.
Mineracao Serra Grande, S.A. (‘‘MSG’’) which owns the Crixas mine, the Company’s 50% joint venture with Anglogold Ashanti,
received two tax reassessments since November 2003 from the Minas Gerais State and Goias State tax authorities. The
reassessments disallowed the claiming of certain sales tax credits and assessed interest and penalties of which the Company’s
50% share totals approximately $9.7 million (December 31, 2009 - $8.9 million). The Company and its joint venture partner
believe that this reassessment will be resolved without any material adverse effect on its financial position, results of
operations or cash flows. This reassessment relates to the Crixas operating segment.
In December 2007, the Company’s 100% owned Brazilian subsidiary, Kinross Participacoes Ltda. received a tax assessment
from the Brazilian federal tax authorities in the amount of $137.4 million (December 31, 2009 - $126.5 million), including
penalties and interest in respect of alleged income taxes not withheld from a third party. The Company has appealed this
assessment and believes that it has reasonable defences to the assessment. The Company is pursuing its indemnity rights from
the third party in respect of the assessment.
In September 2005, MSG received assessments relating to payments of sales taxes on exported gold deliveries from tax
inspectors for the State of Goias. The Company’s share of the assessments is approximately $55.3 million (December 31, 2009 -
$46.7 million). The counsel for MSG believes the suit is in violation of Federal legislation on sales taxes and that there is a
remote chance of success for the State of Goias. The assessment has been appealed. This reassessment relates to the Crixas
operating segment.
In October 2006, MSG received an assessment from the State of Goias tax authorities relating to remittance of gold from Crixas
to Nova Lima in Minas Gerais for export purposes. Since May 2006, the Goias State signed an authorization (TARE) to this
procedure. The Company’s share of this assessment is approximately $34.0 million (December 31, 2009 - $28.7million). The
Company and its joint venture partner believe that this reassessment will be resolved without any material adverse affect on its
financial position, results of operations or cash flows.
KINROSS GOLD CORPORATION 2010 ANNUAL REPORT 163

MINERAL RESERVE ANDMINERAL RESOURCE STATEMENT
PROVEN AND PROBABLE MINERAL RESERVES
Gold
Proven and Probable Mineral Reserves (1,3,5,6,7)
Kinross Gold Corporation’s Share at December 31, 2010
Proven Probable Proven and ProbableKinross
Interest Tonnes Grade Ounces Tonnes Grade Ounces Tonnes Grade Ounces
Property Location (%) (kt) (g/t) (koz) (kt) (g/t) (koz) (kt) (g/t) (koz)
North America
Fort Knox Area USA 100.0% 146,271 0.38 1,799 107,163 0.52 1,780 253,434 0.44 3,579
Kettle River (13) USA 100.0% – – – 1,545 11.30 562 1,545 11.30 562
Round Mountain Area USA 50.0% 24,412 0.72 563 41,829 0.56 756 66,241 0.62 1,319
Subtotal 170,683 0.43 2,362 150,537 0.64 3,098 321,220 0.53 5,460
South America
Cerro Casale (10) Chile 25.0% 57,888 0.64 1,192 245,334 0.58 4,601 303,222 0.59 5,793
Crixas (9) Brazil 50.0% 1,964 3.42 216 1,319 4.15 176 3,283 3.71 392
Fruta del Norte (5) Ecuador 100.0% – – – 26,117 8.07 6,775 26,117 8.07 6,775
La Coipa (11) Chile 100.0% 16,863 1.36 739 4,865 1.27 199 21,728 1.34 938
Lobo-Marte (5) Chile 100.0% – – – 164,230 1.14 6,028 164,230 1.14 6,028
Maricunga Area Chile 100.0% 133,511 0.75 3,238 136,290 0.65 2,851 269,801 0.70 6,089
Paracatu Brazil 100.0% 724,520 0.38 8,965 736,541 0.40 9,520 1,461,061 0.39 18,485
Subtotal 934,746 0.48 14,350 1,314,696 0.71 30,150 2,249,442 0.62 44,500
Africa
Chirano Ghana 90.0% 14,501 1.40 651 16,060 3.45 1,783 30,561 2.48 2,434
Tasiast Mauritania 100.0% 68,816 1.65 3,661 60,100 2.02 3,902 128,916 1.82 7,563
Subtotal 83,317 1.61 4,312 76,160 2.32 5,685 159,477 1.95 9,997
Russia
Kupol Russia 75.0% 1,375 13.96 617 5,871 9.88 1,865 7,246 10.66 2,482
Subtotal 1,375 13.96 617 5,871 9.88 1,865 7,246 10.66 2,482
Total Gold 1,190,121 0.57 21,641 1,547,264 0.82 40,798 2,737,385 0.71 62,439
164

Silver
Proven and Probable Mineral Reserves (1,3,5,6,7)
Kinross Gold Corporation’s Share at December 31, 2010
Proven Probable Proven and ProbableKinross
Interest Tonnes Grade Ounces Tonnes Grade Ounces Tonnes Grade Ounces
Property Location (%) (kt) (g/t) (koz) (kt) (g/t) (koz) (kt) (g/t) (koz)
North America
Round Mountain Area USA 50.0% 104 7.7 26 10,917 7.2 2,534 11,021 7.2 2,560
Subtotal 104 7.7 26 10,917 7.2 2,534 11,021 7.2 2,560
South America
Cerro Casale (10) Chile 25.0% 57,888 1.9 3,494 245,334 1.4 11,188 303,222 1.5 14,682
Fruta del Norte (5) Ecuador 100.0% – – – 26,117 10.9 9,141 26,117 10.9 9,141
La Coipa (11) Chile 100.0% 16,863 51.0 27,668 4,865 33.9 5,306 21,728 47.2 32,974
Subtotal 74,751 13.0 31,162 276,316 2.9 25,635 351,067 5.0 56,797
Russia
Kupol Russia 75.0% 1,375 205.4 9,080 5,871 119.1 22,471 7,246 135.4 31,551
Subtotal 1,375 205.4 9,080 5,871 119.1 22,471 7,246 135.4 31,551
Total Silver 76,230 16.4 40,268 293,104 5.4 50,640 369,334 7.7 90,908
Copper
Proven and Probable Mineral Reserves (3,5,6,7)
Kinross Gold Corporation’s Share at December 31, 2010
Proven Probable Proven and ProbableKinross
Interest Tonnes Grade Pounds Tonnes Grade Pounds Tonnes Grade Pounds
Property Location (%) (kt) (%) (Mlb) (kt) (%) (Mlb) (kt) (%) (Mlb)
South America
Cerro Casale (10) Chile 25.0% 57,888 0.19 241 245,334 0.22 1,205 303,222 0.22 1,446
Subtotal 57,888 0.19 241 245,334 0.22 1,205 303,222 0.22 1,446
Total Copper 57,888 0.19 241 245,334 0.22 1,205 303,222 0.22 1,446
KINROSS GOLD CORPORATION 2010 ANNUAL REPORT 165

MEASURED AND INDICATED MINERAL RESOURCES
Gold
Measured and Indicated Mineral Resources(excludes proven and probable mineral reserves) (2,3,4,6,7,8)
Kinross Gold Corporation’s Share at December 31, 2010
Measured Indicated Measured and IndicatedKinross
Interest Tonnes Grade Ounces Tonnes Grade Ounces Tonnes Grade Ounces
Property Location (%) (kt) (g/t) (koz) (kt) (g/t) (koz) (kt) (g/t) (koz)
North America
Fort Knox Area USA 100.0% 14,031 0.43 194 146,427 0.43 2,020 160,458 0.43 2,214
Round Mountain Area USA 50.0% 11,784 0.97 366 34,361 0.67 741 46,145 0.75 1,107
White Gold Area (12) Yukon 100.0% – – – 9,797 3.19 1,005 9,797 3.19 1,005
Subtotal 25,815 0.67 560 190,585 0.61 3,766 216,400 0.62 4,326
South America
Cerro Casale (10) Chile 25.0% 4,428 0.38 55 56,004 0.41 737 60,432 0.41 792
Crixas (9) Brazil 50.0% 108 4.04 14 326 3.63 38 434 3.73 52
Fruta del Norte Ecuador 100.0% – – – 3,583 5.50 634 3,583 5.50 634
La Coipa (11) Chile 100.0% 11,040 0.99 351 3,622 1.16 135 14,662 1.03 486
Lobo-Marte Chile 100.0% – – – 34,052 0.83 908 34,052 0.83 908
Maricunga Area Chile 100.0% 23,670 0.60 458 163,941 0.56 2,970 187,611 0.57 3,428
Paracatu Brazil 100.0% 57,597 0.28 519 299,209 0.34 3,263 356,806 0.33 3,782
Subtotal 96,843 0.45 1,397 560,737 0.48 8,685 657,580 0.48 10,082
Africa
Chirano Ghana 90.0% 1,555 1.59 80 2,503 1.38 111 4,058 1.46 191
Tasiast Mauritania 100.0% 45,199 0.60 874 51,135 0.74 1,214 96,334 0.67 2,088
Subtotal 46,754 0.63 954 53,638 0.77 1,325 100,392 0.71 2,279
Russia
Dvoinoye Russia 100.0% – – – 1,047 31.48 1,059 1,047 31.48 1,059
Subtotal – – – 1,047 31.48 1,059 1,047 31.48 1,059
Total Gold 169,412 0.53 2,911 806,007 0.57 14,835 975,419 0.57 17,746
166

Silver
Measured and Indicated Mineral Resources(excludes proven and probable mineral reserves) (2,3,4,6,7,8)
Kinross Gold Corporation’s Share at December 31, 2010
Measured Indicated Measured and IndicatedKinross
Interest Tonnes Grade Ounces Tonnes Grade Ounces Tonnes Grade Ounces
Property Location (%) (kt) (g/t) (koz) (kt) (g/t) (koz) (kt) (g/t) (koz)
North America
Round Mountain Area USA 50.0% 9 9.9 3 1,296 7.2 301 1,305 7.2 304
Subtotal 9 9.9 3 1,296 7.2 301 1,305 7.2 304
South America
Cerro Casale (10) Chile 25.0% 4,428 1.5 212 56,004 1.1 1,949 60,432 1.1 2,161
Fruta del Norte Ecuador 100.0% – – – 3,583 10.7 1,235 3,583 10.7 1,235
La Coipa (11) Chile 100.0% 11,040 50.5 17,913 3,622 23.6 2,753 14,662 43.8 20,666
Subtotal 15,468 36.4 18,125 63,209 2.9 5,937 78,677 9.5 24,062
Russia
Dvoinoye Russia 100.0% – – – 1,047 35.7 1,201 1,047 35.7 1,201
Subtotal – – – 1,047 35.7 1,201 1,047 35.7 1,201
Total Silver 15,477 36.4 18,128 65,552 3.5 7,439 81,029 9.8 25,567
Copper
Measured and Indicated Mineral Resources(excludes proven and probable mineral reserves) (3,4,7,8)
Kinross Gold Corporation’s Share at December 31, 2010
Measured Indicated Measured and IndicatedKinross
Interest Tonnes Grade Pounds Tonnes Grade Pounds Tonnes Grade Pounds
Property Location (%) (kt) (%) (Mlb) (kt) (%) (Mlb) (kt) (%) (Mlb)
South America
Cerro Casale (10) Chile 25.0% 4,428 0.15 15 56,004 0.18 224 60,432 0.18 239
Subtotal 4,428 0.15 15 56,004 0.18 224 60,432 0.18 239
Total Copper 4,428 0.15 15 56,004 0.18 224 60,432 0.18 239
KINROSS GOLD CORPORATION 2010 ANNUAL REPORT 167

INFERRED MINERAL RESOURCES
Gold
Inferred Mineral Resources (2,3,4,6,7,8)
Kinross Gold Corporation’s Share at December 31, 2010
InferredKinross
Interest Tonnes Grade Ounces
Property Location (%) (kt) (g/t) (koz)
North America
Fort Knox Area USA 100.0% 12,547 0.46 187
Kettle River USA 100.0% 319 10.00 103
Round Mountain Area USA 50.0% 22,562 0.61 443
White Gold Area (12) Yukon 100.0% 9,391 1.91 578
Subtotal 44,819 0.91 1,311
South America
Cerro Casale (10) Chile 25.0% 116,228 0.39 1,450
Crixas (9) Brazil 50.0% 2,278 5.00 366
Fruta del Norte Ecuador 100.0% 19,553 5.50 3,460
La Coipa (11) Chile 100.0% 3,123 4.70 472
Lobo-Marte Chile 100.0% 112,767 0.78 2,834
Maricunga Area Chile 100.0% 201,092 0.46 3,004
Paracatu Brazil 100.0% 117,530 0.42 1,572
Subtotal 572,571 0.71 13,158
Africa
Chirano Ghana 90.0% 2,468 2.33 185
Tasiast Mauritania 100.0% 182,805 1.47 8,615
Subtotal 185,273 1.48 8,800
Russia
Dvoinoye Russia 100.0% 645 19.47 404
Kupol Russia 75.0% 1,097 9.86 348
Subtotal 1,742 13.43 752
Total Gold 804,405 0.93 24,021
168

Silver
Inferred Mineral Resources (2,3,4,6,7,8)
Kinross Gold Corporation’s Share at December 31, 2010
InferredKinross
Interest Tonnes Grade Ounces
Property Location (%) (kt) (g/t) (koz)
North America
Round Mountain Area USA 50.0% 134 2.1 9
Subtotal 134 2.1 9
South America
Cerro Casale (10) Chile 25.0% 116,228 1.0 3,879
Fruta del Norte Ecuador 100.0% 19,553 10.7 6,707
La Coipa (11) Chile 100.0% 3,123 53.3 5,351
Subtotal 138,904 3.6 15,937
Russia
Dvoinoye Russia 100.0% 645 20.8 431
Kupol Russia 75.0% 1,097 132.2 4,664
Subtotal 1,742 91.0 5,095
Total Silver 140,780 4.6 21,041
Copper
Inferred Mineral Resources (3,4,8)
Kinross Gold Corporation’s Share at December 31, 2010
InferredKinross
Interest Tonnes Grade Pounds
Property Location (%) (kt) (%) (Mlb)
South America
Cerro Casale (10) Chile 25.0% 116,228 0.20 505
Subtotal 116,228 0.20 505
Total Copper 116,228 0.20 505
KINROSS GOLD CORPORATION 2010 ANNUAL REPORT 169

Mineral Reserve and Mineral Resource Statement Notes
(1) Unless otherwise noted, the Company’s mineral reserves are estimated using appropriate cut-off grades based on an assumed gold price of US$900 per ounce, a silver price of US$14.00 perounce and a copper price of US$2.00 per pound. Mineral reserves are estimated using appropriate process recoveries, operating costs and mine plans that are unique to each property andinclude estimated allowances for dilution and mining recovery. Mineral reserves are reported in contained units and are estimated based on the following foreign exchange rates:
Russian Roubles to US$ 32Chilean Peso to US$ 550Brazilian Reais to US$ 2.00Ghanaian Cedi to US$ 1.50Mauritanian Ouguiya to US$ 300
(2) Unless otherwise noted, the Company’s mineral resources are estimated using appropriate cut-off grades based on a gold price of US$1,000 per ounce, a silver price of US$15.00 per ounce,a copper price of US$2.50 per pound and the following foreign exchange rates:
Russian Roubles to US$ 32Chilean Peso to US$ 550Brazilian Reais to US$ 2.00Ghanaian Cedi to US$ 1.50Mauritanian Ouguiya to US$ 300
(3) The Company’s mineral reserves and mineral resources as at December 31, 2010 are classified in accordance with the Canadian Institute of Mining, Metallurgy and Petroleum’s ‘‘CIMDefinition Standards - For Mineral Resources and Mineral Reserves’’ in accordance with the requirements of National Instrument 43-101 ‘‘Standards of Disclosure for Mineral Projects’’(the Instrument). Mineral reserve and mineral resource estimates reflect the Company’s reasonable expectation that all necessary permits and approvals will be obtained and maintained.
(4) Cautionary note to U.S. investors concerning estimates of measured, indicated and inferred mineral resources. U.S. investors are advised that the terms ‘‘measured mineral resource’’,‘‘indicated mineral resource’’ and ‘‘inferred mineral resource’’ are recognized and required by Canadian securities laws. These terms are not recognized by the U.S. Securities and ExchangeCommission. U.S. investors should not assume that all or any part of mineral deposits in these categories will ever be converted into mineral reserves and that as compared with measuredand indicated mineral resources, inferred mineral resources have a greater amount of uncertainty as to their existence, and great uncertainty as to their economic feasibility. It should not beassumed that any part of an inferred mineral resource will ever be upgraded to a higher category.
(5) The mineral reserves presented herein comply with the reserve categories of Industry Guide 7 published by the U.S. Securities and Exchange Commission except for mineral reserves atLobo-Marte and Fruta del Norte, which estimates are based on recently completed pre-feasibility studies. For mineral reserves under the Instrument, a pre-feasibility study is sufficient,however for reserves under Industry Guide 7, a feasibility study is required.
(6) Except as provided in Note (12), the Company’s mineral resource and mineral reserve estimates were prepared under the supervision of Mr. R. Henderson, P. Eng., an officer of Kinross, who isa qualified person as defined by the Instrument.
(7) The Company’s normal data verification procedures have been used in collecting, compiling, interpreting and processing the data used to estimate mineral reserves and mineral resources.Independent data verification has not been performed.
(8) Mineral resources that are not mineral reserves do not have to demonstrate economic viability. Mineral resources are subject to infill drilling, permitting, mine planning, mining dilution andrecovery losses, among other things, to be converted into mineral reserves. Due to the uncertainty associated with inferred mineral resources, it cannot be assumed that all or any part of aninferred mineral resource will ever be upgraded to indicated or measured mineral resources, including as a result of continued exploration.
(9) The Crixas mine is operated by AngloGold Ashanti Ltd. Mineral reserves are reported based on a gold price of US$850 per ounce. Mineral resources are reported using a gold price ofUS$1,100 per ounce. Mineral resources and mineral reserves are reported using the following foreign exchange rate: Brazilian Reais to US$1.94.
(10) Estimates for the Cerro Casale project are based on the feasibility study completed in 2009 by the joint venture. Mineral reserves and mineral resources are estimated using appropriatecut-off grades based on the following commodity prices and foreign exchange rates:
Mineral reserves - Gold price of US$1,000 per ounce, Silver price of US$16.00 per ounce, Copper price of US$2.00 per poundMineral resources - Gold price of US$1,200 per ounce, Silver price of US$19.00 per ounce, Copper price of US$2.50 per poundChilean Peso to US$525
(11) Includes mineral reserves and mineral resources from the Puren deposit in which the Company holds a 65% interest.
(12) The mineral resource estimates for the White Gold Property were prepared by Mr. Wayne Barnett, Pr.Sci.Nat., and Mr. Marek Nowak, P. Eng., of SRK Consulting, both of whom are qualifiedpersons as defined by the Instrument. Mineral resources are reported at a cut-off of 0.5 g/t for open pit and 2.0 g/t for underground.
(13) Kettle River mineral resources were estimated using the same gold price as mineral reserves (US$900 per ounce).
170

Mineral Reserve and Mineral Resource Definitions
A Mineral Reserve is the economically mineable part of a Measured or Indicated Mineral Resource demonstrated by at least
a Preliminary Feasibility Study. This Study must include adequate information on mining, processing, metallurgical,
economic and other relevant factors that demonstrate, at the time of reporting, that economic extraction can be justified. A
Mineral Reserve includes diluting materials and allowances for losses that may occur when the material is mined.
A ‘‘Probable Mineral Reserve’’ is the economically mineable part of an Indicated and, in some circumstances, a Measured
Mineral Resource demonstrated by at least a Preliminary Feasibility Study. This Study must include adequate information
on mining, processing, metallurgical, economic, and other relevant factors that demonstrate, at the time of reporting, that
economic extraction can be justified.
A ‘‘Proven Mineral Reserve’’ is the economically mineable part of a Measured Mineral Resource demonstrated by at least
a Preliminary Feasibility Study. This Study must include adequate information on mining, processing, metallurgical,
economic, and other relevant factors that demonstrate, at the time of reporting, that economic extraction is justified.
A Mineral Resource is a concentration or occurrence of diamonds, natural solid inorganic material, or natural solid fossilized
organic material including base and precious metals, coal, and industrial minerals in or on the Earth’s crust in such form and
quantity and of such a grade or quality that it has reasonable prospects for economic extraction. The location, quantity,
grade, geological characteristics and continuity of a Mineral Resource are known, estimated or interpreted from specific
geological evidence and knowledge.
An ‘‘Inferred Mineral Resource’’ is that part of a Mineral Resource for which quantity and grade or quality can be
estimated on the basis of geological evidence and limited sampling and reasonably assumed, but not verified, geological
and grade continuity. The estimate is based on limited information and sampling gathered through appropriate techniques
from locations such as outcrops, trenches, pits, workings and drill holes.
An ‘‘Indicated Mineral Resource’’ is that part of a Mineral Resource for which quantity, grade or quality, densities, shape
and physical characteristics, can be estimated with a level of confidence sufficient to allow the appropriate application of
technical and economic parameters, to support mine planning and evaluation of the economic viability of the deposit. The
estimate is based on detailed and reliable exploration and testing information gathered through appropriate techniques
from locations such as outcrops, trenches, pits, workings and drill holes that are spaced closely enough for geological and
grade continuity to be reasonably assumed.
A ‘‘Measured Mineral Resource’’ is that part of a Mineral Resource for which quantity, grade or quality, densities, shape,
and physical characteristics are so well established that they can be estimated with confidence sufficient to allow the
appropriate application of technical and economic parameters, to support production planning and evaluation of the
economic viability of the deposit. The estimate is based on detailed and reliable exploration, sampling and testing
information gathered through appropriate techniques from locations such as outcrops, trenches, pits, workings and drill
holes that are spaced closely enough to confirm both geological and grade continuity.
KINROSS GOLD CORPORATION 2010 ANNUAL REPORT 171

SUMMARIZEDFIVE-YEAR REVIEW
2010 2009 2008 2007 2006
Operating results (in millions of U.S. dollars)
Revenue $ 3,010.1 $ 2,412.1 $ 1,617.0 $ 1,093.0 $ 905.6
Net earnings (loss) for the year 771.6 309.9 (807.2) 334.0 165.8
Cash flow provided from operating activities 968.4 785.6 443.6 341.2 292.0
Capital expenditures 563.7 481.2 714.7 601.1 202.9
Financial position (in millions of U.S. dollars)
Cash, cash equivalents and short-term investments $ 1,466.6 $ 632.4 $ 525.1 $ 561.2 $ 154.1
Working capital 1,741.1 752.9 573.4 526.3 85.3
Total assets 16,397.1 8,013.2 7,387.5 6,729.3 2,053.5
Long-term debt (including current portion) 503.0 692.2 950.9 564.1 89.9
Common shareholders’ equity 13,400.5 5,559.5 4,776.9 4,837.8 1,468.0
Debt to capitalization 4% 12% 20% 12% 6%
Per share data (U.S. dollars)
Net earnings (loss) - basic $ 0.94 $ 0.45 $ (1.28) $ 0.60 $ 0.47
KINROSS SHARETRADING DATA
2010
High Low
TSX (Cdn dollars)
First quarter $ 21.80 $ 17.18
Second quarter $ 19.89 $ 17.40
Third quarter $ 19.95 $ 14.00
Fourth quarter $ 19.98 $ 17.41
NYSE (U.S. dollars)
First quarter $ 21.12 $ 16.13
Second quarter $ 19.54 $ 16.26
Third quarter $ 19.48 $ 14.84
Fourth quarter $ 19.90 $ 16.85
172

NON-GAAPFINANCIAL MEASURES
The Company has included certain non-GAAP financial measures in this document. The Company believes that these
measures, together with measures determined in accordance with GAAP, provide investors with an improved ability to
evaluate the underlying performance of the Company. The inclusion of these measures is meant to provide additional
information and should not be used as a substitute for performance measures prepared in accordance with GAAP. These
measures are not necessarily standard and therefore may not be comparable to other issuers.
Adjusted net earnings and adjusted net earnings per share are non-GAAP measures which determine the performance of the
Company, excluding certain impacts which the Company believes are not reflective of the Company’s underlying
performance, such as the impact of foreign exchange gains and losses, reassessment of prior year taxes and non-hedge
derivative gains and losses. Management believes that these measures, which are also used internally, provide investors with
the ability to better evaluate underlying performance particularly since the excluded items are typically not included in
public guidance. The following table provides a reconciliation of net earnings to adjusted net earnings for the periods
presented:
GAAP to Adjusted Earnings Reconciliation
Year ended December 31
(in US$ millions) 2010 2009 2008
Net earnings (loss) - GAAP $ 771.6 $ 309.9 $ (807.2)
Adjusting items:
Foreign exchange (gains) losses 12.7 91.0 (41.4)
Non-hedged derivatives (gains) losses - net of tax 19.9 (2.9) (41.6)
Gains on sale of assets and investments - net of tax (328.5) (12.9) (30.2)
Litigation reserve adjustment - (18.5) 19.1
Asset Retirement Obligation (6.3) (2.7) 3.2
Impairments - - 1,078.0
Change in future income tax due to the change in Chile and Ecuador’s corporate income
tax rate (26.6) - -
Brazilian tax settlement - (53.0) -
Inventory fair value adjustment - net of tax 9.4 - -
Taxes on repatriation of certain foreign earnings 20.0 - -
Taxes in respect of prior years 6.6 (6.0) 63.9
Acquisition related fair value inventory adjustment, net of tax - - 5.0
(292.8) (5.0) 1,056.0
Net earnings - Adjusted $ 478.8 $ 304.9 $ 248.8
Weighted average number of common shares outstanding - Basic 824.5 691.5 628.6
Net earnings per share - Adjusted $ 0.58 $ 0.44 $ 0.40
The Company makes reference to a non-GAAP measure for adjusted operating cash flow and adjusted operating cash flow
per share. Adjusted operating cash flow is defined as cash flow from operations excluding certain impacts which the
Company believes are not reflective of the Company’s regular operating cash flow, and also excludes changes in working
capital. Working capital can be volatile due to numerous factors, including the timing of tax payments, and in the case of
Kupol, a build-up of inventory due to transportation logistics. Management believes that, by excluding these items from
operating cash flow, this non-GAAP measure provides investors with the ability to better evaluate the cash flow performance
of the Company. The comparative figures for years prior to 2009 represent cash flows from operating activities adjusted for
changes in working capital only. Prior to the year ended December 31, 2009, the Company did not prepare a reconciliation of
KINROSS GOLD CORPORATION 2010 ANNUAL REPORT 173

adjusted operating cash flow nor adjusted operating cash flow per share. Readers should refer to the Company’s financial
statements and Management’s Discussion and Analysis for the applicable periods for additional financial information
prepared in accordance with GAAP. The following table provides a reconciliation of adjusted operating cash flow:
GAAP to Adjusted Operating Cash Flow
Year ended December 31
(in US$ millions) 2010 2009 2008
Cash flow provided from operating activities - GAAP $ 968.4 $ 785.6 $ 443.6
Adjusting items:
Brazilian tax settlement - 71.0 -
Working capital changes:
Accounts receivable and other assets 82.9 14.9 33.7
Inventories 98.5 115.1 145.4
Accounts payable and other liabilities (58.6) (49.4) 11.9
122.8 151.6 191.0
Adjusted operating cash flow $ 1,091.2 $ 937.2 $ 634.6
Weighted average number of common shares outstanding - Basic 824.5 691.5 628.6
Adjusted operating cash flow per share $ 1.32 $ 1.36 $ 1.01
174
CAUTIONARY STATEMENT ONFORWARD-LOOKING INFORMATION
All statements, other than statements of historical fact, contained or incorporated by reference in this Annual Report, but
not limited to, any information as to the future financial or operating performance of Kinross, constitute ‘‘forward-looking
information’’ or ‘‘forward-looking statements’’ within the meaning of certain securities laws, including the provisions of the
Securities Act (Ontario) and the provisions for ‘‘safe harbour’’ under the United States Private Securities Litigation Reform
Act of 1995 and are based on expectations, estimates and projections as of the date of this Annual Report. Forward-looking
statements include, without limitation, possible events, statements with respect to possible events, the future price of gold
and silver, the estimation of mineral reserves and resources, the realization of mineral reserve and resource estimates, the
timing and amount of estimated future production, costs of production, expected capital expenditures, costs and timing of
the development of new deposits, success of exploration, development and mining activities, permitting timelines, currency
fluctuations, requirements for additional capital, government regulation of mining operations, environmental risks,
unanticipated reclamation expenses, title disputes or claims and limitations on insurance coverage. The words ‘‘plans’’,
‘‘proposes’’, ‘‘expects’’ or ‘‘does not expect’’, ‘‘is expected’’, ‘‘budget’’, ‘‘scheduled’’, ‘‘envision’’; ‘‘estimates’’, ‘‘forecasts’’,
‘‘guidance’’; ‘‘targets’’, ‘‘models’’, ‘‘intends’’, ‘‘anticipates’’, or ‘‘does not anticipate’’, or ‘‘believes’’, or variations of such
words and phrases or statements that certain actions, events or results ‘‘may’’, ‘‘could’’, ‘‘would’’, ‘‘should’’, ‘‘might’’, or ‘‘will
be taken’’, ‘‘occur’’ or ‘‘be achieved’’ and similar expressions identify forward-looking statements. Forward-looking
statements are necessarily based upon a number of estimates and assumptions that, while considered reasonable by Kinross
as of the date of such statements, are inherently subject to significant business, economic and competitive uncertainties and
contingencies. The estimates, models and assumptions of Kinross referenced, contained or incorporated by reference in this
Annual Report, which may prove to be incorrect, include, but are not limited to, the various assumptions set forth herein and
in our most recently filed Annual Information Form and our most recently filed Management’s Discussion and Analysis as
well as: (1) there being no significant disruptions affecting the operations of the Company or any entity in which it now or
hereafter directly or indirectly holds an investment, whether due to labour disruptions, supply disruptions, power
disruptions, damage to equipment or otherwise; (2) permitting, development, operations, expansion and acquisitions at
Paracatu (including, without limitation, land acquisitions for and permitting and construction of the new tailings facility)
being consistent with our current expectations; (3) development of and production from the Phase 7 pit expansion and heap
leach project at Fort Knox continuing on a basis consistent with Kinross’ current expectations; (4) the viability, permitting
and development of the Fruta del Norte deposit being consistent with Kinross’ current expectations; (5) political
developments in any jurisdiction in which the Company, or any entity in which it now or hereafter directly or indirectly holds
an investment, operates being consistent with its current expectations including, without limitation, the implementation of
Ecuador’s new mining law and related regulations and policies, and negotiation of an exploitation contract with the
government, being consistent with Kinross’ current expectations; (6) permitting, construction, development and production
at Cerro Casale being consistent with the new feasibility study prepared and approved by the joint venture and the
Company’s current expectations; (7) the viability, permitting and development of the Lobo-Marte project, including, without
limitation, the metallurgy and processing of its ore, being consistent with our current expectations; (8) the exchange rate
between the Canadian dollar, Brazilian real, Chilean peso, Russian rouble, Mauritanian ouguiya, Ghanaian cedi and the
U.S. dollar being approximately consistent with current levels; (9) certain price assumptions for gold and silver; (10) prices
for natural gas, fuel oil, electricity and other key supplies being approximately consistent with current levels; (11) production
and cost of sales forecasts for the Company, and entities in which it now or hereafter directly or indirectly holds an
investment, meeting expectations; (12) the accuracy of the current mineral reserve and mineral resource estimates of the
Company and any entity in which it now or hereafter directly or indirectly holds an investment; (13) labour and materials
costs increasing on a basis consistent with Kinross’ current expectations; (14) the development of the Dvoinoye and
Vodorazdelnaya deposits being consistent with Kinross’ expectations; and (15) the viability of the Tasiast and Chirano mines,
and the development and expansion of the Tasiast and Chirano mines on a basis consistent with Kinross’ current
expectations. Known and unknown factors could cause actual results to differ materially from those projected in the
KINROSS GOLD CORPORATION 2010 ANNUAL REPORT 175

forward-looking statements. Such factors include, but are not limited to: fluctuations in the currency markets; fluctuations in
the spot and forward price of gold or certain other commodities (such as diesel fuel and electricity); changes in interest rates
or gold or silver lease rates that could impact the mark-to-market value of outstanding derivative instruments and ongoing
payments/receipts under any interest rate swaps and variable rate debt obligations; risks arising from holding derivative
instruments (such as credit risk, market liquidity risk and mark-to-market risk); changes in national and local government
legislation, taxation, controls, policies and regulations, the security of personnel and assets, and political or economic
developments in Canada, the United States, Chile, Brazil, Russia, Ecuador, Mauritania, Ghana, or other countries in which
Kinross, or entities in which it now or hereafter directly or indirectly holds an investment, do business or may carry on
business in the future; business opportunities that may be presented to, or pursued by, us; our ability to successfully
integrate acquisitions; operating or technical difficulties in connection with mining or development activities; employee
relations; the speculative nature of gold exploration and development, including the risks of obtaining necessary licenses and
permits; diminishing quantities or grades of reserves; adverse changes in our credit rating; and contests over title to
properties, particularly title to undeveloped properties. In addition, there are risks and hazards associated with the business
of gold exploration, development and mining, including environmental hazards, industrial accidents, unusual or unexpected
formations, pressures, cave-ins, flooding and gold bullion losses (and the risk of inadequate insurance, or the inability to
obtain insurance, to cover these risks). Many of these uncertainties and contingencies can directly or indirectly affect, and
could cause, Kinross’ actual results to differ materially from those expressed or implied in any forward-looking statements
made by, or on behalf of, Kinross. There can be no assurance that forward-looking statements will prove to be accurate, as
actual results and future events could differ materially from those anticipated in such statements. Forward-looking
statements are provided for the purpose of providing information about management’s expectations and plans relating to
the future. All of the forward-looking statements made in this Annual Report are qualified by these cautionary statements
and those made in our other filings with the securities regulators of Canada and the United States including, but not limited
to, the cautionary statements made in the ‘‘Risk Factors’’ section of our most recently filed Annual Information Form. These
factors are not intended to represent a complete list of the factors that could affect Kinross. Kinross disclaims any intention
or obligation to update or revise any forward-looking statements or to explain any material difference between subsequent
actual events and such forward-looking statements, except to the extent required by applicable law.
Key Sensitivities
Approximately 60%-70% of the Company’s costs are denominated in U.S. dollars. A 10% change in foreign exchange could
result in an approximate $7 impact on cost of sales per ounce.
A $10 change in the price of oil could result in an approximate $3 impact on cost of sales per ounce.
The impact on royalties of a $100 change in the gold price could result in an approximate $3 impact on cost of sales
per ounce.
Other information
Where we say ‘‘we’’, ‘‘us’’, ‘‘our’’, the ‘‘Company’’, or ‘‘Kinross’’ in this Annual Report, we mean Kinross Gold Corporation
and/or one or more or all of its subsidiaries, as may be applicable.
176

SHAREHOLDER INFORMATIONTRANSFER AGENT
AND REGISTRAR
Computershare Investor Services Inc.
Toronto, Ontario, Canada
Toll-free: 1-800-564-6253
ANNUAL SHAREHOLDERS’ MEETING
The Annual and Special Meeting
of Shareholders will be held
at 10:00 a.m. EDT on
Wednesday, May 4, 2011 at
The Design Exchange
234 Bay Street
Toronto, Ontario, Canada
TRADING DATATSX
K — common
K.WT.B — warrants (exp. 09/07/11)
K.WT.C — warrants (exp. 09/03/13)
K.WT.D — warrants (exp. 09/17/14)
NYSE
KGC — common
LEGAL COUNSELOsler, Hoskin & Harcourt LLP
Toronto, Ontario, Canada
Blake, Cassels & Graydon LLP
Toronto, Ontario, Canada
Sullivan & Cromwell LLP
New York, New York, United States
Parr Brown Gee & Loveless
Salt Lake City, Utah, United States
AUDITORSKPMG LLP
Toronto, Ontario, Canada
CONTACT INFORMATIONGENERAL
Kinross Gold Corporation
25 York Street, 17th Floor
Toronto, Ontario, Canada M5J 2V5
Web site: www.kinross.com
Telephone: 416-365-5123
Toll-free: 1-866-561-3636
Facsimile: 416-363-6622
E-mail: [email protected]
MEDIA RELATIONS
Steve Mitchell, Vice-President,
Corporate Communications
Telephone: 416-365-2726
E-mail: [email protected]
INVESTOR RELATIONS
Erwyn Naidoo, Vice-President,
Investor Relations
Telephone: 416-365-2744
E-mail: [email protected]
SHAREHOLDER INQUIRIES
Computershare Investor Services Inc.
9th Floor, 100 University Avenue
Toronto, Ontario, Canada M5J 2Y1
www.computershare.com/kinross
Toll-free: 1-800-564-6253
Toll-free facsimile: 1-888-453-0330
PUBLICATIONS
To obtain copies of Kinross’ publications,
please visit our corporate web site at
www.kinross.com, or contact us
by e-mail at [email protected] or
call 1-866-561-3636.
CORPORATE RESPONSIBILITY REPORTKinross publishes its corporate
responsibility performance data annually
and a comprehensive Global Reporting
Initiative (GRI) report every two years.
In 2010, we published a web-based GRI
corporate responsibility report. The report
provides a detailed account of our social,
environmental and health and safety
performance for 2008 and 2009.
The report is available on our web site at
http://takingresponsibility2009.kinross.com
CORPORATE INFORMATION

KINROSS GOLD CORPORATION 25 York Street, 17th FloorToronto, Ontario, CanadaM5J 2V5