transhorizon radiowave propagation due to evaporation … radiowave... · general i article...
TRANSCRIPT

GENERAL I ARTICLE
Transhorizon Radiowave Propagation due to Evaporation Ducting
The Effect of Tropospheric Weather Conditions on VHF and UHF Radio
Paths Over the Sea
S D Gunashekar, D R Siddle and E M Warrington
An evaporation duct is a weather phenomenon that occurs in the tropospheric region of the atmosphere over the open sea and other large water bodies. It has been observed that in addition to being interesting atmospheric occurrences from the meteorological perspective, evaporation ducts have far reaching implications on radio communications over the sea and in coastal regions (e.g. ship to ship and ship to shore communications). They are of particular impor- tance at the extreme limits of propagation and allow radio waves to propagate beyond the horizon. Over the years, much research has been undertaken to explain the mecha- nism of radiowave propagation in evaporation ducts.
Background Theory
The lowest part of the earth's atmosphere is called the tropo-
sphere. Typically, the troposphere extends from the surface of the
earth to an altitude of approximately 9 km at the poles and 17 km
at the equator [1]. This upper boundary is referred to as the
tropopause and is defined as the point at which the temperature in
the atmosphere begins to increase with height. Within the
troposphere, the temperature is found to decrease with altitude
at a rate of approximately 7 ~ C per kilometre [1,2]. The earth's
weather system is confined to the troposphere and the fluctua-
tions in weather parameters like temperature, pressure and
humidity cause the refractive index of the air in this layer to vary
from one point to another. It is in this context that the tropo-
sphere assumes a vital role in the propagation of radiowaves at
All the authors are in the Department of Engineering, University of Leicester, UK.
SD Gunashekar is doing his PhD. His topic of research is the transhorizon propagation of UHF radio waves over the
sea. (top left)
D R Siddle, Lecturer, is currentlY investigating the
effect of tropospheric conditions on UHF transmis- sions, running an experimen.
tal program in the Britich Channel Islands. (top right)
E M Warrington's, Reader, and Head of the Radio
Systems Research Group, present research projects
concern the influence of the propagation medium on the preformanee of long-range communications and radio direction finding systems.
(bottom)
RESONANCE I Januctry 2006 51
GENERAL J ARTICLE
VHF (30-300 MHz) and UHF (300-3000 MHz) frequencies. The
meteorological conditions therefore influence the manner in
which radiowave propagation occurs in the troposphere both on
a spatial and temporal scale.
Refractive Index, Refractivity and Modified Refrac- tivity
In general, the refractive index, n, of the troposphere decreases
with altitude [2,3,4]. To simplify the mathematics involved
variations in the horizontal are neglected and horizontal homo-
geneity of the refractive index of the troposphere is assumed in
most discussions on this topic. A typical value for n at sea level is
1.000350. A few metres above sea level, this might decrease to a
value such as 1.000300. For all practical purposes, at this scale,
this change in the refractive index is negligibly small, with
hardly any visible deviation. However, immediately above the
surface of the sea, it is often this small (but rapid) change in the
refractive index profile that facilitates the formation of meteoro-
logical phenomena called evaporat/on ducts.
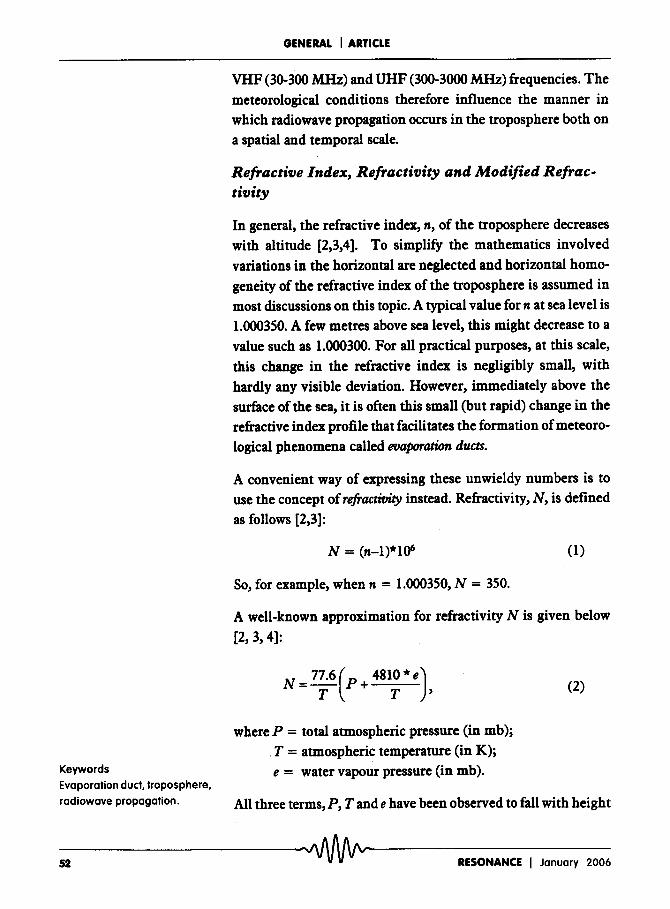
A convenient way of expressing these unwieldy numbers is to
use the concept of refract/v/ty instead. Refractivity, N, is defined
as follows [2,3]:
N = (n-1)*10 s (1)
So, for example, when n = 1.000350, N = 350.
A well-known approximation for refractivity N is given below
[2, 3, 4]:
N = P ~ T '
Keywords Evaporation duct, troposphere, radiowave propagation.
where P = total atmospheric pressure (in mb);
�9 T = atmospheric temperature (in K);
e = water vapour pressure (in mb).
All three terms, P, T and e have been observed to fall with height
52 RESONANCE I January 2006

GENERAL J ARTICLE
in an exponential manner, resulting in a corresponding decrease
in N with height [2,4]. A standard atmosphere, therefore is one in
which the refractivity varies with altitude according to equation
(1). Using Snelrs law, a radio ray projected into the atmosphere
will have to travel from a denser to rarer medium and will refract
downwards towards the surface of the earth. The curvature of
the ray, however, will still be less than the earth's curvature. The
gradient of refractivity in this case generally varies from 0 to -79
N-units per kilometre [2]. When the refractivity gradient varies
from -79 to -157 N-units per kilometre, a suparefractive condi-
tion is said to prevail in the troposphere and the ray will refract
downwards at a rate greater than standard but less than the
curvature of the earth [2]. A refractivity gradient that is even less
than -157 N-units per kilometre will result in a ray that refracts
towards the earth's surface with a curvature that exceeds the
curvature of the earth [2]. This situation is referred to as trapping and is of particular importance in the context of evaporation
ducts. Finally, if the refractivity gradient is greater than 0 N-
units per kilometre, a subrefiactiw condition exists and a radio
ray will now refract upwards, away from the surface of the earth
[2]. Depending on the existing conditions in the troposphere, a
radio wave will undergo any of the types of refraction:
subrefraction, standard refraction, superrefraction or trapping.
Figure 1 illustrates the four refractive conditions discussed above.
Figure 1. Diagram illustrat- ing the four refractive con- ditions in the troposphere,
Submfraction
Standard
Superrefraction
Trapping
Surface of the Earth
RESONANCE J January 2006 53

GENERAL J ARTICLE
54
While dealing with radio propagation profiles, it is customary to
replace curved radio rays with linear rays for the purpose of
geometric simplicity. To account for drawing radio rays as
straight lines, we must therefore increase the radius of the earth.
The radius of this virtual sphere is known as the effective earth radius and it is approximately equal to four-thirds the true radius
of the earth (i.e. roughly 8500 kin) [2,3].
A more classical form of representing n is that of modified refractivity, M. In this case, the surface of the earth is repre-
sented by a fiat plane and the radio rays are constituted by curves
that are determined by Snelrs law and the corresponding value
of M at each point along the radio link. The following is the
expression for M [1,5]:
= N + 0.157h, (4)
where N -- refractivity (in N-units),
h = height above sea level (in metres)
a = radius of the earth (in metres).
Theory of Evaporation Ducts
Formation of Eeaporation Ducts
The air that is in immediate contact with the sea surface is
saturated with water vapour (i.e. the relative humidi ty is 100%).
As the height increases, the water vapour pressure in the atmo-
sphere rapidly decreases until it reaches an ambient value at
which it remains more or less static for a further increase in
height. Therefore, for the first few metres above the surface of
the sea, it is the water vapour pressure, e, in the expression for N
that dominates. This rapid decrease in e causes a steep fall in N.
This is reflected in the modified refractivity, M, which also
correspondingly decreases. (The height term h, which increases,
is more than offset by the rapidly decreasing N term). This
behaviour can be clearly observed in the following graph ofh vs.
RESONANCE J January 2006

GENERAL t ARTICLE
h
sea su r face .~ . . .~
Region of the troposphere Evaporation dominated by a rapid duct height ~ decrease in humidity
M
M (Figure 2) as that portion of the curve with a strong negativeM
gradient. Therefore, despite the fact that the height h is increas-
ing, it is the sharp fall in the water vapour pressure, e that
contributes to the rapid decrease in M.
Once e has reached its ambient value at a given height, a further
rise in altitude does not cause a substantial change in the humid-
ity of the troposphere. Thus, as h increases further, N decreases
more (since air pressure and temperature both decrease with
height). But this decrease in N is very small over large height
increments. Consequently, despite a decreasing N term, it is the
h term that starts to dominate in the expression for M. Thus, M
now gradually increases with height, and can be seen as the portion of the curve that has a positive M gradient.
Figure 2. Modified refrac- tivity profile of the tropo- sphere above the surface of the sea indicating the presence of an evaporation duct.
The point at which the M gradient changes from negative to
positive is referred to as the evaporation duct height (or thickness), and is a practical and realistic measure of the strength of the evaporation duct.
Evaporation Ducts and the Troposphere
By virtue of their nature of formation, evaporation ducts are nearly permanent features over the sea surface. Typically, the
height of an evaporation duct is of the order of only a few metres;
however, this can vary considerably with geographical location
RESONANCE I January 2006 5,5

GENERAL ] ARTICLE
and changes in atmospheric parameters such as humidity, air
pressure and temperature. In the lower regions of the tropo-
sphere where the earth's weather is confined, these parameters
do, in fact, fluctuate significantly. The turbulent nature of the
atmosphere contributes to its unpredictability and a variable
atmosphere, in turn, is one of the major causes of unreliable
wireless communications.
Depending on their location and the prevailing climate, evapo-
ration duct heights may vary from a few metres to few tens of
metres. The world average duct height has been reported to be
13m. Also, tropical climates are more favourable than temperate
climates for the formation of evaporation ducts [6]. Addition-
ally, it has been observed that calm sea conditions are more
conducive for the creation of ducts. As a consequence of sporadic
meteorological phenomena, evaporation duct heights undergo
significant spatial and temporal variations.
Evaporation ducts are weather-related phenomena; their heights
cannot easily be measured directly using instruments like re-
fractometers and radiosondes. At best, the height of an evapora-
tion duct can be deduced from the bulk meteorological param-
eters that are representative of the ongoing physical processes at
the air-sea boundary. The dependence of evaporation ducts on
the physical structure of the troposphere signifies that changing
weather conditions can indeed result in alterations in radio wave
propagation.
Evaporation Ducts and Radio~oave Propagation
Over the years, much research has been undertaken to explain
the mechanism of radiowave propagation in evaporation ducts.
A key reason why evaporation ducts are so important for radio
communications is because they are often associated with en-
hanced signal strengths at receivers.
An evaporation duct can be regarded as a natural waveguide that
steers the radio signal from the transmitter to a receiver that may
be situated well beyond the radio horizon [1, 4, 5]. The drop in
RESONANCE J January 2006

GENERAL I ARTICLE
RADIO SIGNAL WITH ONE SEA SURFACE REFLECTION AND TWO TOP-OF-DUCT REFLECTIONS
RADIO SIGNAL WITH A SINGLE TOP-OF-DUCT REFLECTION
LEAKA%OF ENERGY / ~ TOPOF
_I __~____.~__~. ~ EVAPORATION DUCT
v ANTENNA ANTENNA
the refractive index of the atmosphere within the first few metres
above the surface of the sea causes incident radio waves to be
refracted towards the earth more than normal so that their
radius of curvature becomes less than or equal to that of the
earth's surface. The sudden change in the atmosphere's refrac-
tivity at the top of the duct causes the radio waves to refract back
into the duct, and when it comes in contact with the surface of
the sea, it gets reflected upwards again. The waves then propa-
gate long ranges by means of successive reflections (refractions)
from the top of the duct and the surface of the earth (Figure 3).
It is worth mentioning here that since the top of an evaporation
duct is not 'solid' (as in the case of an actual waveguide), there
will be a small but finite amount of energy leakage into the free
space immediately above the duct (Figure 3). However, despite
this escape of energy, radio waves are still capable of travelling
great distances through the duct, with relatively small attenua-
tion and path loss.
It must be remembered that this is a very simplistic and one-
dimensional means of illustrating radiowave propagation in
evaporation ducts, one that is based on the assumption that the
atmosphere's refractive index is horizontally homogeneous.
Figure 3. Diagram illustrat- ing evaporation ductpropa- gation.
RESONANCE J January 2006 57
GENERAL I ARTICLE
As mentioned previously, this ducting effect often results in
radio signals reaching places that are beyond the radio horizon
with improved signal strengths. This naturally has far reaching
implications on practical radio propagation patterns. For this
reason, evaporation ducts and their impact on radio wave propa-
gation have been studied extensively over the years. Numerous
statistical models have been proposed to describe evaporation
ducts and compute the duct heights under different atmospheric
conditions [5].
The presence of evaporation ducts might not always indicate
enhanced signal strengths. For instance, if there is an unwanted
distant transmitter also located within the duct, then there is
always the possibility of the system under consideration being
susceptible to signal interference and interception. This, of
course, is dependent on the location of the radio paths being
investigated. Another scenario that might arise is the interfer-
ence between the various propagation modes that exist within
the evaporation duct itself. Depending on the separation of the
transmitter and receiver and the prevailing atmospheric condi-
tions, there could be destructive interference between the direct
and reflected rays, the latter of which is comprised of the various
multiple hop (one-hop, two-hop, and so on) propagation modes
(Figure 3). Additionally, signal degradation may also occur if
there is destructive interference between various modes that
arrive at the receiver after refraction from different heights in
the troposphere. All these situations could possibly cause key
problems in the domain of cellular mobile communication sys-
tems in littoral regions. Thus, in addition to aiding radiowave
propagation, evaporation ducts could also be principal limiting
factors in beyond line of sight over-the-sea UHF propagation.
Marine Boundary Layer Processes
It is a well-established fact that the occurrence of evaporation
ducts over the open sea is highly dependent on the various
physical processes and interactions that exist at the air-sea bound- ary/ayer [1,5]. It has been proposed that the difference in tern-
RESONANCE J January 2006

GENERAL J ARTICLE
perature between the sea and the air in immediate contact with
the sea is a significant contributing factor in the formation of
evaporation ducts. This temperature difference is referred to as
the air-sea temperature difference (ASTD). When this quantity is
positive, that is, when the air temperature is higher than the sea
temperature, we have a stable atmospheric condition. This is be-
cause colder air (in direct contact with the cold ocean) remains
beneath the warmer rising air, thus preventing convection cur-
rents from arising. On the other hand, when the air temperature
is somewhat less than the sea temperature, an unstable condition is
said to prevail. Such a situation tends to occur when the warmer
air (in immediate contact with the warm ocean) begins to rise
above the cold sinking air, thereby resulting in a convective
motion. Meteorological observations reveal that in the open
ocean, unstable conditions are more likely to exist.
Practical Results: Enhanced Signal Propagation in the British Channel Islands due to Ducting
This section contains graphical outputs and statistical results
using experimental data to clearly verify the theory and conclu-
sions that have been presented. The various results have been
obtained from a research experiment being conducted in the
British Channel Islands by the Radio Systems Research Group,
Department of Engineering, University of Leicester, UK. Spe-
cifically, a number of scatter plots have been produced that try to
explain the correlation between enhanced signal strength occur-
rences and specific meteorological conditions in the English
Channel along a 50 kilometre transhorizon UHF radio link
(Jersey to Alderney).
In general, the sea temperature is a few degrees above the air
temperature, reflecting the prevalent unstable atmospheric con-
ditions in the open sea. However, there are periods when the air
temperature exceeds the sea temperature (Figure 4a). Enhanced
signal strengths were observed during most of these periods
(Figure 4b). The plots reveal that for enhanced propagation to
occur, the following conditions must both be satisfied:
RESONANCE J January 2006 59

GENERAL I ARTICLE
Figure 4. (a) The variation in the air and sea temperatures in the English Channel with time (from August 2003 to June 2004) (blue data = times when T,v< T ; red data = times when T, ir> T,,,). (b) The signal strength measured at the Alderney receiving station antenna in the Channel Islands as a function of time (blue data=times when T,I< T,,,; red data = times when T,~r> T , , . )
60 RESONANCE I January 2006

GENERAL I ARTICLE
RESONANCE I January 2006 61

GENERAL J ARTICLE
S u g g e s t e d R e a d i n g
[1] M P M Hall, Effects of tl~ Troposphere on Radio Com- munication, Institution of Electrical Engineers, Chap- ters 1, 2 and 6,1979.
[2] A Piequenard, Rad/o Waue Propagat/on, The Macmillan
Press Ltd., Chapter 2,1974. [3] J Griffith$, Radio Wa~#
Propagation and Antennas: An Introduction, Prentice- Hall International (UK) Ltd., Chapter 4,1987.
[4] J D Parsons, Ti~MobileRa-
d/oPropagat/on Channd, 2nd Edition, pp. 26-31, John Wiley and Sons, 2000.
[5] L Barclay, Propagat/on of Radiowaves, 2nd Edition, The Institution of Electrical Engineers, London, United Kingdom, Chapter 7, 2003.
[6] P A Matthews, Rad/o Waw Propagat/on - V.H.F. AND ABOVE, Chapman and Hall Ltd., pp, 63-65,1965.
Address for Correspondence Salil David Gunashekar Radio Systems Research
Group Department of Engineering
University of Leicester Leicester LE1 7RH United Kingdom
Email: [email protected]
�9 Tar > T~, �9 Tse . > 12 ~ (approximately)
In particular, when enhanced signal strengths occur, the follow- ing meteorological conditions were prevalent:
�9 an increase in the air (>16~ and sea (> 12~ temperatures (e.g. during summer months) (Figure 5a)
�9 a positive air-sea temperature difference (ASTD) that is associated with a thermally stable atmosphere (Figure 5b)
�9 the existence of high-pressure centres over the region (i.e.
anti-cyclonic weather) (Figure 5c)
�9 an enhancement in the absolute humidity of the air immedi- ately above the sea surface (> 9 g/m 3) (Figure 5d)
�9 the presence of low velocity (<6m/s) winds (i.e. calm sea conditions) (Figure 5e)
�9 an increase in the refractivity of the lower troposphere (> 340 N-units) (Figure 5f)
�9 wind blowing from continental Europe to the sea.
C o n c l u s i o n
A detailed description of evaporation ducts and their relevance
to radiowave propagation over the sea has been presented. The
constantly changing weather conditions over the sea mean that
marine and coastal environments, in particular, are prone to
these unusual tropospheric phenomena that facilitate radio waves
to have higher signal strengths and to travel longer distances
than expected. Therefore, the influence of evaporation ducts on
over-sea radiowave propagation needs to be thoroughly investi-
gated. Research in this area will have implications for maritime
communication systems used in coastal cellular telephone net-
works, commercial shipping, naval radar operations and sea-
rescue.
62 RESONANCE I January 2006