transient simulation of secondary loop mobile air
TRANSCRIPT

Purdue UniversityPurdue e-PubsInternational Refrigeration and Air ConditioningConference School of Mechanical Engineering
2018
Transient Simulation of Secondary Loop MobileAir Conditioning SystemsZhenyuan MeiUniversity Of Maryland, United States of America, [email protected]
Yunho [email protected]
Jaeyeon KimHyundai Motors Company, Republic of Korea, [email protected]
Follow this and additional works at: https://docs.lib.purdue.edu/iracc
This document has been made available through Purdue e-Pubs, a service of the Purdue University Libraries. Please contact [email protected] foradditional information.Complete proceedings may be acquired in print and on CD-ROM directly from the Ray W. Herrick Laboratories at https://engineering.purdue.edu/Herrick/Events/orderlit.html
Mei, Zhenyuan; Hwang, Yunho; and Kim, Jaeyeon, "Transient Simulation of Secondary Loop Mobile Air Conditioning Systems"(2018). International Refrigeration and Air Conditioning Conference. Paper 1987.https://docs.lib.purdue.edu/iracc/1987
2484, Page 1
17th International Refrigeration and Air Conditioning Conference at Purdue, July 9-12, 2018
Transient Simulation of Secondary Loop Mobile Air Conditioning Systems
Zhenyuan Mei1, Yunho Hwang1*, Jaeyeon Kim2
1 Center for Environmental Energy Engineering Department of Mechanical Engineering, University of Maryland,
4164 Glenn Martin Hall Bldg., College Park, MD 20742, United States 2 Automotive R&D, Hyundai Motors Company,
772-1, Jangduk-Dong, Hwaseong-Si, Gyeonggi-Do, 445-706, Republic of Korea *Corresponding author: Tel: (301) 405-5247, email: [email protected]
ABSTRACT Since the conventional refrigerant R-134a is being phased down due to its high Global Warming Potential (GWP), finding a suitable replacement refrigerant with low GWP and system design is of great importance. However, most of the alternatives are either flammable or more expensive. Therefore, to ensure the safety of passenger and reduce the refrigerant charge, a Secondary Loop (SL) system with coolant loop on both condenser side and evaporator side was proposed. In the SL system, the evaporator and condenser exchange heat with air through cabin cooler and radiator, respectively. The SL system has more advantages than the Direct Expansion (DX) system such as the easy applicability of battery thermal management. In this study, transient models were developed for both DX system and SL system in Dymola. The simulation results show that the coefficient of performance of the SL system is lower than that of DX system due to high pressure ratio and high compressor revolution speed when two types of systems provide similar cooling capacity. Moreover, the performances of the system using R-134a, R-152a, and R-1234yf were evaluated and compared to that of conventional DX system using R-134a under the Urban Dynamometer Driving Schedule (UDDS). Though large fluctuation is observed on the condenser capacity in the DX system, the evaporator capacity is very stable. In overall, R-152a has better performance than R-1234yf and is a good candidate as an alternative refrigerant, but the secondary system needs more efficiency enhancement options to compete with current DX R-134a system. Keyword: Transient Simulation, Mobile Air Conditioning, Secondary Loop System, R-134a, R-152a, R-1234yf
1. INTRODUCTION R-134a is currently the most widely used refrigerant in Mobile Air Conditioning (MAC). However, it has high Global Warming Potential (GWP) and has been banned in Europe since 2017 (DIRECTIVE 2006/40/EC, 2006). It is likely that other countries will also follow Europe and ban R-134a. As a result, it is necessary to find an alternative of R-134a. The alternative refrigerant is expected to have similar thermal performance but has lower GWP. Although simulations and experiments show that using R-1234yf as a drop-in replacement of R-134a will lead to performance degradation (Daviran et al., 2017; Lee and Yoo, 2000; Navarro-Esbrí et al., 2013), it is still considered as one of the best replacements due to its safety and easy implementation. The main problem of R-1234yf is its price, which is much more expensive than R-134a. Another candidate is R-152a, which also has good thermal performance. And due to its low density, using R-152a can significantly reduce the refrigerant charge (Cabello et al., 2015; Li et al., 2014). However, R-152a is flammable and is classified as an A2 refrigerant. Thus it would be dangerous to circuit R-152a in the cabin. One solution to these concerns is using the Secondary Loop (SL) system, which adds an additional coolant loop between refrigerant and air side. The secondary loop can be applied only on the evaporator side (Ghodbane et al., 2007) or both evaporator and condenser sides (Malvicino and Riccardo, 2010). The introduction of the secondary loop makes the refrigerant loop more compact and increases the safety of the system (Eisele, 2012). However, because of the additional thermal resistance brought by the coolant loop, the performance of the SL system would be poorer than that of the direct expansion (DX) system when using the same refrigerant. In this research, a MAC system with two secondary loops was developed to isolate the refrigerant loop from the cabin and reduce the refrigerant charge. Transient simulation models were developed for both systems in Dymola. And transient simulation was performed by

2484, Page 2
17th International Refrigeration and Air Conditioning Conference at Purdue, July 9-12, 2018
following the Urban Dynamometer Driving Schedule (UDDS) to evaluate systems’ performance at city driving condition.
2. SYSTEM CONFIGURATION
Direct Expansion System The conventional DX system serves as the baseline in this study, where the “direct” refers to the fact that supply air is directly cooled by the evaporator, and expansion refers to the expansion process the refrigerant has gone through before entering the evaporator. Its schematic is shown in Figure 1. Both evaporator and condenser in the DX system are microchannel heat exchangers with louver fin on the air side. And the compressor is a positive displacement compressor.
(a) DX system (b) SL system
Figure 1: Schematic diagrams of two systems
To improve the system performance, two additional components, desuperheater and Internal Heat Exchanger (IHX), were added. The desuperheater is a compact heat exchanger which has offset strip fins on refrigerant channels. It cools the superheated refrigerant vapor from the compressor by using the relatively cold coolant from the power element cooling loop, which uses 50% concentration ethylene glycol-water mixture as the coolant. The IHX is a concentric heat exchanger which is installed between the condenser outlet and the evaporator outlet so that the two fluids can exchanger heat with each other. As a result, both condenser subcooling and evaporator superheat can be increased, which leads to higher cooling capacity.
Secondary Loop System The schematic of SL system is shown on the right-hand side of Figure 1, where the blue line represents the refrigerant loop, and the orange color line represents the coolant loop. As shown in Figure 1, the SL system of this study has two separate secondary loops, one on the evaporator side and one on the condenser side. Thus the refrigerant pipe length can be reduced to the minimum, and the cabin is isolated from the refrigerant cycle. Both evaporator and condenser used in the SL system are compact heat exchangers, which have offset strip fin on the refrigerant side and dimple fin on the coolant side. And both cabin cooler and radiator are flat tube heat exchanger with louver fin. Because the evaporating pressure of the SL system is very low, adding the IHX will increase the compressor suction temperature which leads to a lower refrigerant mass flow rate and may reduce the system performance. Therefore, for now it is not considered for the secondary system.
2484, Page 3
17th International Refrigeration and Air Conditioning Conference at Purdue, July 9-12, 2018
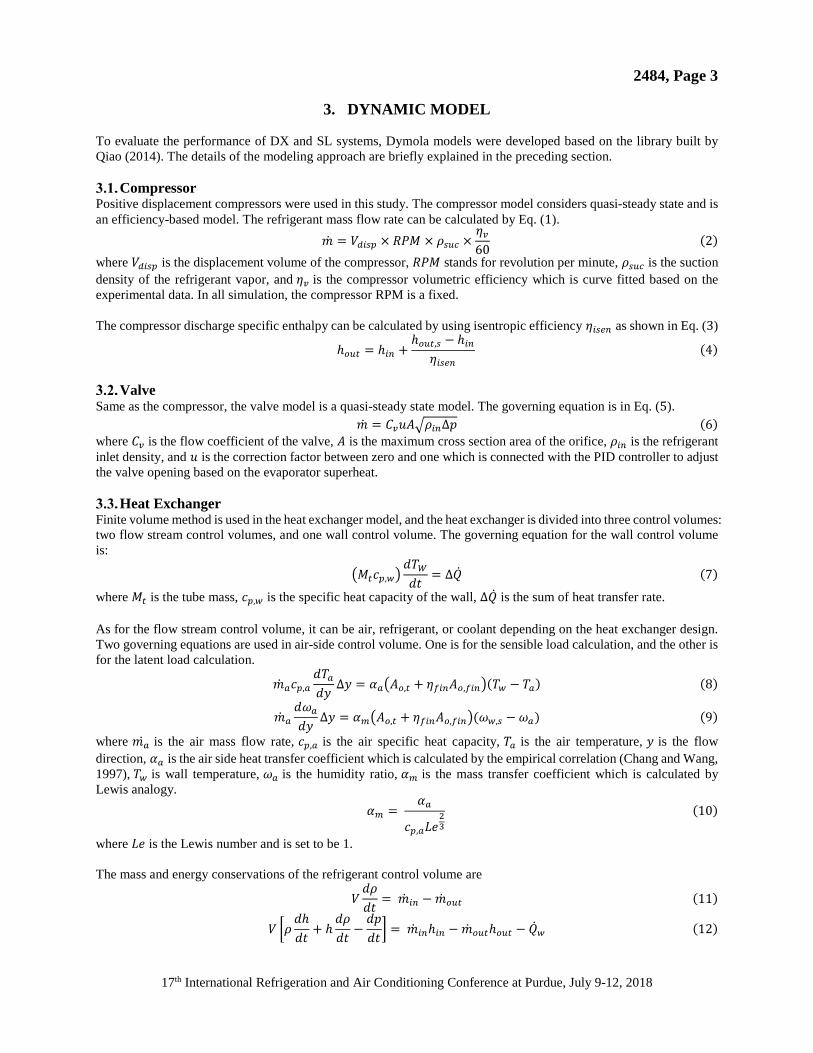
3. DYNAMIC MODEL To evaluate the performance of DX and SL systems, Dymola models were developed based on the library built by Qiao (2014). The details of the modeling approach are briefly explained in the preceding section.
Compressor Positive displacement compressors were used in this study. The compressor model considers quasi-steady state and is an efficiency-based model. The refrigerant mass flow rate can be calculated by Eq. (1).
�̇�𝑚 = 𝑉𝑉𝑑𝑑𝑑𝑑𝑑𝑑𝑑𝑑 × 𝑅𝑅𝑅𝑅𝑅𝑅 × 𝜌𝜌𝑑𝑑𝑠𝑠𝑠𝑠 ×𝜂𝜂𝑣𝑣60
(2) where 𝑉𝑉𝑑𝑑𝑑𝑑𝑑𝑑𝑑𝑑 is the displacement volume of the compressor, 𝑅𝑅𝑅𝑅𝑅𝑅 stands for revolution per minute, 𝜌𝜌𝑑𝑑𝑠𝑠𝑠𝑠 is the suction density of the refrigerant vapor, and 𝜂𝜂𝑣𝑣 is the compressor volumetric efficiency which is curve fitted based on the experimental data. In all simulation, the compressor RPM is a fixed. The compressor discharge specific enthalpy can be calculated by using isentropic efficiency 𝜂𝜂𝑑𝑑𝑑𝑑𝑖𝑖𝑖𝑖 as shown in Eq. (3)
ℎ𝑜𝑜𝑠𝑠𝑜𝑜 = ℎ𝑑𝑑𝑖𝑖 +ℎ𝑜𝑜𝑠𝑠𝑜𝑜,𝑑𝑑 − ℎ𝑑𝑑𝑖𝑖
𝜂𝜂𝑑𝑑𝑑𝑑𝑖𝑖𝑖𝑖(4)
Valve
Same as the compressor, the valve model is a quasi-steady state model. The governing equation is in Eq. (5). �̇�𝑚 = 𝐶𝐶𝑣𝑣𝑢𝑢𝑢𝑢�𝜌𝜌𝑑𝑑𝑖𝑖∆𝑝𝑝 (6)
where 𝐶𝐶𝑣𝑣 is the flow coefficient of the valve, 𝑢𝑢 is the maximum cross section area of the orifice, 𝜌𝜌𝑑𝑑𝑖𝑖 is the refrigerant inlet density, and 𝑢𝑢 is the correction factor between zero and one which is connected with the PID controller to adjust the valve opening based on the evaporator superheat.
Heat Exchanger Finite volume method is used in the heat exchanger model, and the heat exchanger is divided into three control volumes: two flow stream control volumes, and one wall control volume. The governing equation for the wall control volume is:
�𝑅𝑅𝑜𝑜𝑐𝑐𝑑𝑑,𝑤𝑤�𝑑𝑑𝑇𝑇𝑊𝑊𝑑𝑑𝑑𝑑
= Δ�̇�𝑄 (7)
where 𝑅𝑅𝑜𝑜 is the tube mass, 𝑐𝑐𝑑𝑑,𝑤𝑤 is the specific heat capacity of the wall, Δ�̇�𝑄 is the sum of heat transfer rate. As for the flow stream control volume, it can be air, refrigerant, or coolant depending on the heat exchanger design. Two governing equations are used in air-side control volume. One is for the sensible load calculation, and the other is for the latent load calculation.
�̇�𝑚𝑎𝑎𝑐𝑐𝑑𝑑,𝑎𝑎𝑑𝑑𝑇𝑇𝑎𝑎𝑑𝑑𝑑𝑑
Δ𝑑𝑑 = 𝛼𝛼𝑎𝑎�𝑢𝑢𝑜𝑜,𝑜𝑜 + 𝜂𝜂𝑓𝑓𝑑𝑑𝑖𝑖𝑢𝑢𝑜𝑜,𝑓𝑓𝑑𝑑𝑖𝑖�(𝑇𝑇𝑤𝑤 − 𝑇𝑇𝑎𝑎) (8)
�̇�𝑚𝑎𝑎𝑑𝑑𝜔𝜔𝑎𝑎𝑑𝑑𝑑𝑑
Δ𝑑𝑑 = 𝛼𝛼𝑚𝑚�𝑢𝑢𝑜𝑜,𝑜𝑜 + 𝜂𝜂𝑓𝑓𝑑𝑑𝑖𝑖𝑢𝑢𝑜𝑜,𝑓𝑓𝑑𝑑𝑖𝑖�(𝜔𝜔𝑤𝑤,𝑑𝑑 − 𝜔𝜔𝑎𝑎) (9)
where 𝑚𝑚𝑎𝑎̇ is the air mass flow rate, 𝑐𝑐𝑑𝑑,𝑎𝑎 is the air specific heat capacity, 𝑇𝑇𝑎𝑎 is the air temperature, 𝑑𝑑 is the flow direction, 𝛼𝛼𝑎𝑎 is the air side heat transfer coefficient which is calculated by the empirical correlation (Chang and Wang, 1997), 𝑇𝑇𝑤𝑤 is wall temperature, 𝜔𝜔𝑎𝑎 is the humidity ratio, 𝛼𝛼𝑚𝑚 is the mass transfer coefficient which is calculated by Lewis analogy.
𝛼𝛼𝑚𝑚 = 𝛼𝛼𝑎𝑎
𝑐𝑐𝑑𝑑,𝑎𝑎𝐿𝐿𝐿𝐿23
(10)
where 𝐿𝐿𝐿𝐿 is the Lewis number and is set to be 1. The mass and energy conservations of the refrigerant control volume are
𝑉𝑉𝑑𝑑𝜌𝜌𝑑𝑑𝑑𝑑
= �̇�𝑚𝑑𝑑𝑖𝑖 − �̇�𝑚𝑜𝑜𝑠𝑠𝑜𝑜 (11)
𝑉𝑉 �𝜌𝜌𝑑𝑑ℎ𝑑𝑑𝑑𝑑
+ ℎ𝑑𝑑𝜌𝜌𝑑𝑑𝑑𝑑
−𝑑𝑑𝑝𝑝𝑑𝑑𝑑𝑑� = �̇�𝑚𝑑𝑑𝑖𝑖ℎ𝑑𝑑𝑖𝑖 − �̇�𝑚𝑜𝑜𝑠𝑠𝑜𝑜ℎ𝑜𝑜𝑠𝑠𝑜𝑜 − �̇�𝑄𝑤𝑤 (12)

2484, Page 4
17th International Refrigeration and Air Conditioning Conference at Purdue, July 9-12, 2018
where 𝑉𝑉 is the volume, ℎ is the specific enthalpy, and �̇�𝑄𝑤𝑤 is the heat transfer rate from the control volume to the wall. The pressure drop of the refrigerant is calculated by
𝑑𝑑𝑝𝑝 = � �̇�𝑚�̇�𝑚0
�2
𝑑𝑑𝑝𝑝0 (13)
where 𝑑𝑑𝑝𝑝0 and �̇�𝑚0 are the refrigerant pressure and mass flow rate obtained from the experiment. When the experimental data is not available, empirical correlation is used to calculated 𝑑𝑑𝑝𝑝 (Kim and Sohn, 2006; Manglik and Bergles, 1995) in each segment.
Cabin The cabin room temperature can be calculated by Eq. (14) (Eisele, 2012; Lee et al., 2015).
𝑅𝑅𝑟𝑟𝑐𝑐𝑑𝑑,𝑟𝑟𝑑𝑑𝑇𝑇𝑟𝑟𝑑𝑑𝑑𝑑
= ℎ𝑑𝑑𝑐𝑐𝑠𝑠𝑢𝑢𝑠𝑠(𝑇𝑇𝑠𝑠 − 𝑇𝑇𝑟𝑟) +�̇�𝑚𝑑𝑑𝑖𝑖�𝑐𝑐𝑑𝑑,𝑑𝑑𝑖𝑖 + 𝑐𝑐𝑑𝑑,𝑟𝑟�
2(𝑇𝑇𝑑𝑑𝑖𝑖 − 𝑇𝑇𝑟𝑟) + �̇�𝑄𝑑𝑑𝑜𝑜𝑠𝑠
+�̇�𝑄𝑑𝑑𝑑𝑑 + ℎ𝑑𝑑𝑐𝑐𝑜𝑜𝑢𝑢𝑜𝑜(𝑇𝑇𝑎𝑎𝑚𝑚𝑎𝑎 − 𝑇𝑇𝑟𝑟) + �̇�𝑚𝑑𝑑𝑣𝑣𝑐𝑐𝑑𝑑,𝑎𝑎𝑚𝑚𝑎𝑎(𝑇𝑇𝑎𝑎𝑚𝑚𝑎𝑎 − 𝑇𝑇𝑟𝑟) (15)
where the left-hand side of the equation is the energy storage inside the cabin, and the right-hand side of the equation considers the heat transfer between cabin air and the interior object, heat gain from supply air, solar radiation load, sensible passenger load, heat transfer with ambient, and heat gain from infiltration air.
4. MODEL VALIDATION The cabin model was validated with the results from Huang (1988), which is plotted in Figure 2. The simulation results matched well with the results from Huang. Due to the lack of experimental data, only the model of DX system was validated at the steady-state condition. The test conditions for evaporator and condenser are listed in Table 1 and Table 2, respectively. And the results comparisons are shown in Figure 3. As shown in Figure 3, the deviations of both condenser and evaporator model are less than 7%. And the deviation tends to decrease as the air velocity increases. In general, the evaporator model has larger deviation than the condenser model. This is because the evaporator has two banks and the deviation in the first bank will affect the calculation of the second bank. Overall, the Dymola model shows good agreement with experiment.
Figure 2: Cabin model validation
Table 1: Evaporator test conditions
Test Number Test 1 Test 2 Test 3 Test 4
𝑇𝑇𝑎𝑎,𝑑𝑑𝑖𝑖 [°C] 27 27 27 27
𝑅𝑅𝑅𝑅𝑎𝑎,𝑑𝑑𝑖𝑖 [%] 50 50 50 50
𝑉𝑉𝑉𝑉𝑅𝑅𝑎𝑎,𝑑𝑑𝑖𝑖 [𝑚𝑚3/𝑠𝑠] 0.056 0.083 0.111 0.139
0
10
20
30
40
50
60
70
0 2000 4000 6000 8000
T cab
in(°
C)
Time (s)
HuangCabin Model

2484, Page 5
17th International Refrigeration and Air Conditioning Conference at Purdue, July 9-12, 2018
Table 2: Condenser test conditions
Test Number Test 1 Test 2 Test 3 Test 4
𝑇𝑇𝑎𝑎,𝑑𝑑𝑖𝑖 [°C] 37 37 37 37
𝑉𝑉𝑉𝑉𝑅𝑅𝑎𝑎,𝑑𝑑𝑖𝑖 [𝑚𝑚3/𝑠𝑠] 0.405 0.607 0.809 1.012
(a) Evaporator capacity
(b) Condenser capacity
Figure 3: Comparison of simulation results
5. TRANSIENT SIMULATION
Initial Condition The EPA UDDS (US EPA, 2015) representing city driving condition with frequently stops was used in this research. The detailed velocity profile is shown in Figure 4. During the 1369 seconds duration of the driving cycle, the average car speed is 31.5 kilometer per hour, and the driving distance is 12.07 km. The condenser air inlet velocity was interpolated by using the velocity profile.
Figure 4: UDDS velocity profile
1500 2500 3500 4500 5500 65001500
2500
3500
4500
5500
6500
Qevap,exp (W)
Q,e
vaps
im(W
)
Test 1Test 2Test 3Test 4
+7%
-7%
8000 10000 12000 14000 16000 180008000
10000
12000
14000
16000
18000
Qcond,exp (W)
Qco
nd,s
im(W
)Test 1Test 2Test 3Test 4
+7%
-7%
0
20
40
60
80
100
0 200 400 600 800 1000 1200 1400
Spee
d (m
ph)
Time (s)
2484, Page 6
17th International Refrigeration and Air Conditioning Conference at Purdue, July 9-12, 2018
During the normal operation, the compressor rotational speed is constant at 3,000 RPM. To avoid frost, the compressor rotational speed will reduce to 2,000 RPM when the supply air temperature to the cabin is below 1.5°C. The compressor rotational speed will increase to 3,000 RPM again when the supply air temperature is higher than 4.5°C. Other initial conditions for the transient simulation can be found in Table 3.
Table 3: Inputs for the transient simulation
Parameter Values Ambient Temperature [°C] 35 Ambient Relative Humidity [%] 40 Passenger 1 Internal Volume [𝑚𝑚3] 2.4 Collective Mass [kg] 150 Internal HT Area [𝑚𝑚2] 8.77 Outer HT Area [𝑚𝑚2] 14.9 Solar Radiation [𝑊𝑊/𝑚𝑚2] 1,000 Cabin Initial Temperature [°C] 35 Soak Temperature [°C] 0 Recirculation Rate [%] 100
Results
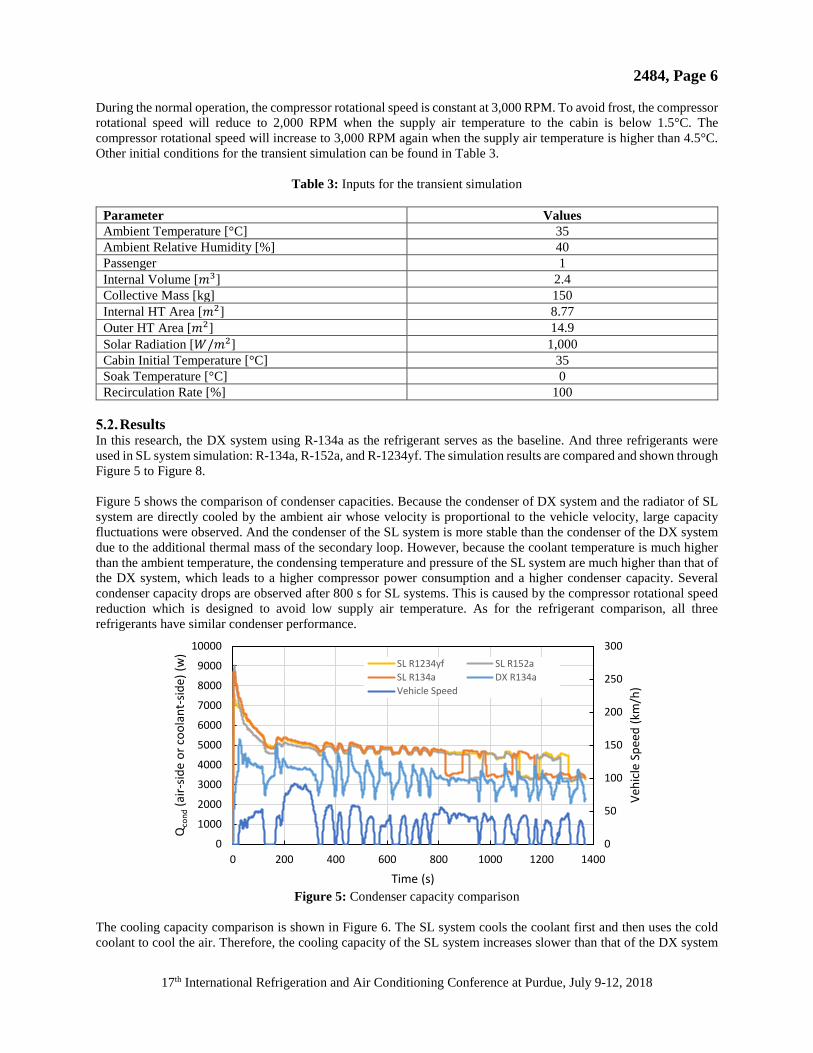
In this research, the DX system using R-134a as the refrigerant serves as the baseline. And three refrigerants were used in SL system simulation: R-134a, R-152a, and R-1234yf. The simulation results are compared and shown through Figure 5 to Figure 8. Figure 5 shows the comparison of condenser capacities. Because the condenser of DX system and the radiator of SL system are directly cooled by the ambient air whose velocity is proportional to the vehicle velocity, large capacity fluctuations were observed. And the condenser of the SL system is more stable than the condenser of the DX system due to the additional thermal mass of the secondary loop. However, because the coolant temperature is much higher than the ambient temperature, the condensing temperature and pressure of the SL system are much higher than that of the DX system, which leads to a higher compressor power consumption and a higher condenser capacity. Several condenser capacity drops are observed after 800 s for SL systems. This is caused by the compressor rotational speed reduction which is designed to avoid low supply air temperature. As for the refrigerant comparison, all three refrigerants have similar condenser performance.
Figure 5: Condenser capacity comparison
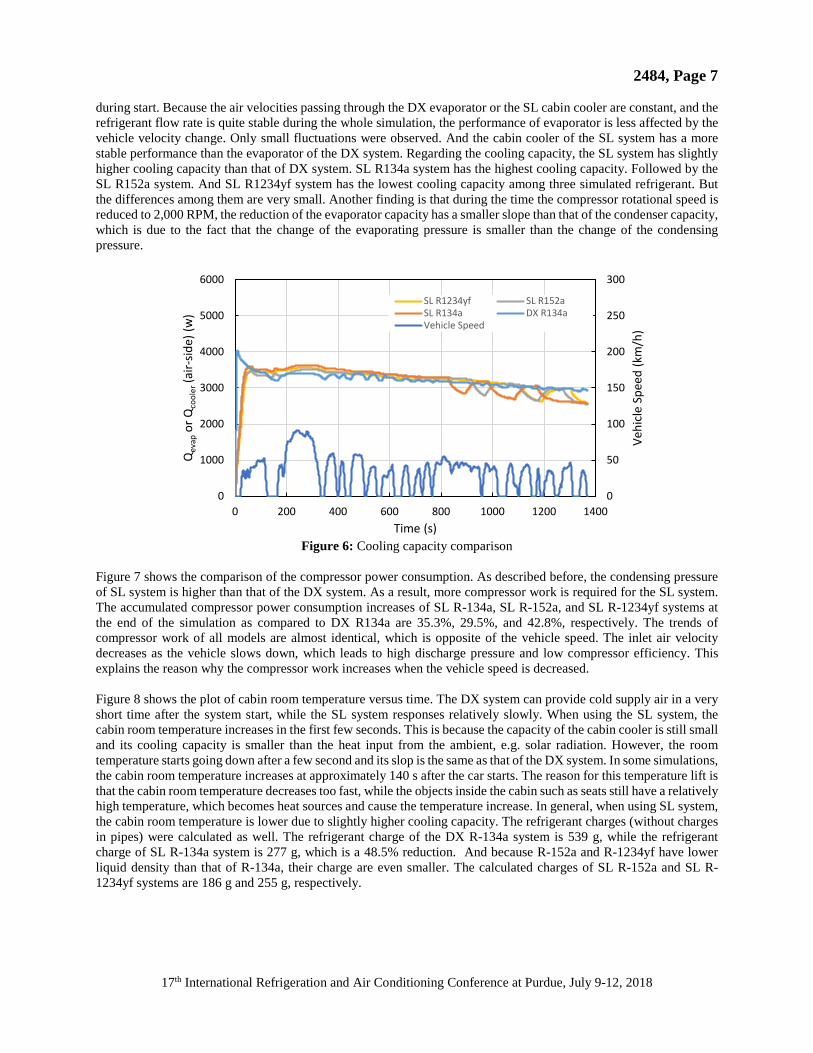
The cooling capacity comparison is shown in Figure 6. The SL system cools the coolant first and then uses the cold coolant to cool the air. Therefore, the cooling capacity of the SL system increases slower than that of the DX system
0
50
100
150
200
250
300
0
1000
2000
3000
4000
5000
6000
7000
8000
9000
10000
0 200 400 600 800 1000 1200 1400
Vehi
cle
Spee
d (k
m/h
)
Qco
nd(a
ir-sid
e or
coo
lant
-sid
e) (w
)
Time (s)
SL R1234yf SL R152aSL R134a DX R134aVehicle Speed
2484, Page 7
17th International Refrigeration and Air Conditioning Conference at Purdue, July 9-12, 2018
during start. Because the air velocities passing through the DX evaporator or the SL cabin cooler are constant, and the refrigerant flow rate is quite stable during the whole simulation, the performance of evaporator is less affected by the vehicle velocity change. Only small fluctuations were observed. And the cabin cooler of the SL system has a more stable performance than the evaporator of the DX system. Regarding the cooling capacity, the SL system has slightly higher cooling capacity than that of DX system. SL R134a system has the highest cooling capacity. Followed by the SL R152a system. And SL R1234yf system has the lowest cooling capacity among three simulated refrigerant. But the differences among them are very small. Another finding is that during the time the compressor rotational speed is reduced to 2,000 RPM, the reduction of the evaporator capacity has a smaller slope than that of the condenser capacity, which is due to the fact that the change of the evaporating pressure is smaller than the change of the condensing pressure.
Figure 6: Cooling capacity comparison
Figure 7 shows the comparison of the compressor power consumption. As described before, the condensing pressure of SL system is higher than that of the DX system. As a result, more compressor work is required for the SL system. The accumulated compressor power consumption increases of SL R-134a, SL R-152a, and SL R-1234yf systems at the end of the simulation as compared to DX R134a are 35.3%, 29.5%, and 42.8%, respectively. The trends of compressor work of all models are almost identical, which is opposite of the vehicle speed. The inlet air velocity decreases as the vehicle slows down, which leads to high discharge pressure and low compressor efficiency. This explains the reason why the compressor work increases when the vehicle speed is decreased. Figure 8 shows the plot of cabin room temperature versus time. The DX system can provide cold supply air in a very short time after the system start, while the SL system responses relatively slowly. When using the SL system, the cabin room temperature increases in the first few seconds. This is because the capacity of the cabin cooler is still small and its cooling capacity is smaller than the heat input from the ambient, e.g. solar radiation. However, the room temperature starts going down after a few second and its slop is the same as that of the DX system. In some simulations, the cabin room temperature increases at approximately 140 s after the car starts. The reason for this temperature lift is that the cabin room temperature decreases too fast, while the objects inside the cabin such as seats still have a relatively high temperature, which becomes heat sources and cause the temperature increase. In general, when using SL system, the cabin room temperature is lower due to slightly higher cooling capacity. The refrigerant charges (without charges in pipes) were calculated as well. The refrigerant charge of the DX R-134a system is 539 g, while the refrigerant charge of SL R-134a system is 277 g, which is a 48.5% reduction. And because R-152a and R-1234yf have lower liquid density than that of R-134a, their charge are even smaller. The calculated charges of SL R-152a and SL R-1234yf systems are 186 g and 255 g, respectively.
0
50
100
150
200
250
300
0
1000
2000
3000
4000
5000
6000
0 200 400 600 800 1000 1200 1400
Vehi
cle
Spee
d (k
m/h
)
Qev
apor
Qco
oler
(air-
side)
(w)
Time (s)
SL R1234yf SL R152aSL R134a DX R134aVehicle Speed

2484, Page 8
17th International Refrigeration and Air Conditioning Conference at Purdue, July 9-12, 2018
Figure 7: Compressor power comparison
Figure 8: Cabin room temperature comparison
6. CONCLUSIONS
A SL mobile air conditioning system with two secondary loops was investigated. This design has several advantages. First of all, the evaporator-side secondary loop isolates the refrigerant from the cabin, which provides a safe environment for passengers. Moreover, by introducing the secondary loops, the refrigerant charge of the system reduces significantly, which leads to low direct green gas emissions and low risk of refrigerant leakage in accidents. Furthermore, the secondary loop on the condenser side provides large amount of thermal mass which leads to a more stable condenser performance. Last but not least, the coolant loop not only can be used to cool the cabin, it also can be used to cool other heat producing components such as the battery module. However, because the introduction of secondary loop requires additional component and coolant loops, the SL system is less efficient and more complicated than the DX system. Transient simulations of both DX system and SL system were performed following UDDS. The results show that the SL system requires more compressor work to reach similar cooling capacity when using R-134a as the refrigerant. Both DX and SL systems have a similar response in the evaporator, while larger fluctuation is observed on the condenser side. R-152a has the best performance among three refrigerants simulated. Whereas the R-1234yf has poorer performance. Overall, the efficiency of SL system is lower than that of DX system and has poorer thermal performance. Therefore, researches to improve the system efficiency will be the focus of the future work.
0
50
100
150
200
250
300
0
500
1000
1500
2000
2500
0 200 400 600 800 1000 1200 1400
Vehi
cle
Spee
d (k
m/h
)
Wco
mp
(w)
Time (s)
SL R1234yf SL R152aSL R134a DX R134aVehicle Speed
0
5
10
15
20
25
30
35
40
0 200 400 600 800 1000 1200 1400
T roo
m(°
C)
Time (s)
SL R1234yf SL R152aSL R134a DX R134a
2484, Page 9
17th International Refrigeration and Air Conditioning Conference at Purdue, July 9-12, 2018
NOMENCLATURE 𝛼𝛼 air-side heat transfer coefficient W/m2-K ∆𝑝𝑝 pressure drop kPa 𝜂𝜂𝑣𝑣 volumetric efficiency - 𝜔𝜔 humidity ratio kg/kg 𝜌𝜌 density kg/m3 𝑐𝑐𝑑𝑑 specific heat capacity J/kg-K 𝐶𝐶𝑣𝑣 flow coefficient - A area m2 DX direct expansion system - h specific enthalpy J/kg ℎ𝑓𝑓𝑓𝑓,𝑟𝑟 enthalpy of vaporization J/kg ℎ𝑑𝑑𝑐𝑐 heat transfer coefficient W/m2-K IHX internal heat exchanger - 𝑅𝑅 mass kg �̇�𝑚 mass flow rate kg/s PE power element - �̇�𝑄 heat transfer rate W �̇�𝑄𝑑𝑑𝑑𝑑 passenger sensible load W RDTR radiator - RPM revolution per minute min-1
SL secondary loop system - t time s T temperature °C UDDS urban dynamometer driving schedule - u valve opening factor - 𝑉𝑉 volume m3 Subscribe a air amb ambient c core (collective mass inside cabin) disp displacement in inlet iv infiltration/ventilation o outer side r room s saturated sol solar radiation suc suction t tube w wall
REFERENCES Cabello, R., Sánchez, D., Llopis, R., Arauzo, I., and Torrella, E. 2015. Experimental comparison between R152a and
R134a working in a refrigeration facility equipped with a hermetic compressor. International Journal of Refrigeration, vol. 60: pp. 92–105.
Chang, Y.-J., and Wang, C.-C. 1997. A generalized heat transfer correlation for louver fin geometry. Int. J. Heat Mass Transfer, vol. 40: pp. 533–544.
2484, Page 10
17th International Refrigeration and Air Conditioning Conference at Purdue, July 9-12, 2018
Daviran, S., Kasaeian, A., Golzari, S., Mahian, O., Nasirivatan, S., and Wongwises, S. 2017. A comparative study on the performance of HFO-1234yf and HFC-134a as an alternative in automotive air conditioning systems. Applied Thermal Engineering, vol. 110: pp. 1091–1100.
Directive 2006/40/ec of the european parliament and of the council. 2006, May 17. Eisele, M. 2012. Transient performance evaluation of automotive secondary loop systems, PhD Dissertation.
University of Maryland, College Park. Ghodbane, M., Craig, T. D., and Baker, J. A. 2007. Demonstration of an energy-efficient secondary loop HFC-152a
mobile air conditioning system. Final Report for the US Environmental Protection Agency. Kim, B., and Sohn, B. 2006. An experimental study of flow boiling in a rectangular channel with offset strip fins.
International Journal of Heat and Fluid Flow, vol. 27, no. 3: pp. 514–521. Lee, G. H., and Yoo, J. Y. 2000. Performance analysis and simulation of automobile air conditioning system.
International Journal of Refrigeration, vol. 23, no. 3: pp. 243–254. Lee, H., Hwang, Y., Song, I., and Jang, K. 2015. Transient thermal model of passenger car’s cabin and implementation
to saturation cycle with alternative working fluids. Energy, vol. 90: pp. 1859–1868. Li, G., Eisele, M., Lee, H., Hwang, Y., and Radermacher, R. 2014. Experimental investigation of energy and exergy
performance of secondary loop automotive air-conditioning systems using low-GWP (global warming potential) refrigerants. Energy, vol. 68: pp. 819–831.
Malvicino, C., and Riccardo, S. 2010. Thermal Systems Integration for Fuel Economy - TIFFE. In Advanced Microsystems for Automotive Applications 2010 (pp. 109–119). Springer, Berlin, Heidelberg.
Manglik, R. M., and Bergles, A. E. 1995. Heat transfer and pressure drop correlations for the rectangular offset strip fin compact heat exchanger. Experimental Thermal and Fluid Science, vol. 10, no. 2: pp. 171–180.
Navarro-Esbrí, J., Mendoza-Miranda, J. M., Mota-Babiloni, A., Barragán-Cervera, A., and Belman-Flores, J. M. 2013. Experimental analysis of R1234yf as a drop-in replacement for R134a in a vapor compression system. International Journal of Refrigeration, vol. 36, no. 3: pp. 870–880.
Qiao, H. 2014. Transient modeling of two-stage and variable refrigerant flow vapor compression systems with frosting and defrosting, PhD Dissertation. University of Maryland, College Park.
US EPA, O. 2015, September 16. Dynamometer Drive Schedules [Data and Tools].
ACKNOWLEDGEMENT We gratefully acknowledge the support of Center for Environmental Energy Engineering (CEEE) and Hyundai Motor Company.