transit service planning and scheduling · transit service planning and scheduling training manual...
TRANSCRIPT
/
i
T R A N S I T S E R V I C E P L A N N I N G A N D S C H E D U L I N G
Training Manual
Lehman Center for Transportation Research Florida International University
10555 West Flagler Street, EC 3609 Miami, FL 33174
Tel: 305-348-3144 | Fax: 305-348-2802 Email: [email protected]
in association with
National Center for Transit Research
University of South Florida 4202 E. Fowler Ave., CUT100
Tampa, FL 33620 Tel: 813-974-3120 | Fax: 305-974-5168
Email: [email protected]
ii
Training Manual for Transit Service Planning and Scheduling
Copyright © 2015 by Lehman Center for Transportation Research
Lehman Center for Transportation Research
Florida International University
10555 West Flagler Street, EC 3609
Miami, FL 33174
All rights reserved. No part of this manual may be photocopied or reproduced in any form without written permission from the publisher. Moreover, no part of this publication can be stored in a retrieval system, transmitted by any means, or recorded or otherwise, without written permission from the author.
Limits of Liability and Disclaimer of Warranty
While every precaution has been taken in preparing this manual, including research, development, and testing, the publisher and author assume no responsibility for errors or omissions. No liability is assumed by either publisher or author for damages resulting in the use of this information.
Printed in the United States of America
iii
Foreword
The manual is intended for use by new transit staff, as well as seasoned professionals who want to review key concepts and best practices in the transit industry. The manual consists of two sections: Transit Planning and Transit Scheduling. It covers material for performing essential transit tasks. Although the focus is on the bus mode, the material also includes discussions that involve other transportation modes. Using detailed descriptions of typical work tasks, the manual can assist with the intricacies of transit planning and scheduling. We believe that the availability and wide use of this manual will be a valuable contribution to the transportation industry and help transit professionals become more productive and effective in fulfilling their professional responsibilities. The training manual is versatile and can easily be adapted and tailored to specific training contexts. We hope that you enjoy this manual and encourage you to provide feedback so that we can further improve and update the manual in future editions. Fabian Cevallos, Ph.D. Transit Program Director Associate Research Professor Lehman Center for Transportation Research Department of Civil and Environmental Engineering Tel: 305-348-3144 | Fax: 305-348-2802 Email: [email protected]
iv
Acknowledgements
This transit manual was funded by the National Center for Transit Research (NCTR) under the direction of Mr. Joel Volinski. We are particularly grateful to Mr. Robert Pearsall, Retired Chief of Service Planning and Scheduling at Miami-Dade Transit (MDT), for his guidance and support throughout the project. His contributions were important for the direction and pertinence of the training manual. We would like to thank Ms. Thalia Pickering for the design, layout, and formatting of this manual; Ms. Natalie Defraene, Editor, for the timely assistance with the proofreading; and many special thanks to the following students from the Lehman Center for Transportation Research (LCTR) at Florida International University (FIU) for their assistance with the manual: Shirin Noei, Yasamin Amirpour, and Junias Aldajuste. Their contributions are gratefully acknowledged. The reviews and insightful comments from Mr. Christopher Deannuntis, Ms. Ann Joslin, and Mr. Robert Gregg with the Center for Urban Transportation Research (CUTR), and from Mr. Steve Anderson and Ms. Jeannie Taylor with Palm Tran, are greatly appreciated. Finally, the project team would like to thank Dr. Fabian Cevallos for his direction and making this manual an overall success.
v
Introduction
Public transportation, also called mass transit, or transit, is a shared surface transportation mode that provides mobility for the general public. It carries a higher number of passengers than automobiles, is more energy-efficient, produces a lower impact on the environment, promotes sustainable development, and supports economic growth. Considering that transit is a labor-intensive service with expenses that can add up quickly, there is a need for efficiency in planning and scheduling. Transit planners and schedulers play a key role in the delivery of transit services. Their tasks and assignments, when done well, can improve the efficiency and quality of transit service. Hence, there is a need for a practical manual that includes key concepts for assisting transit professionals in performing the job efficiently and effectively. This manual is intended to provide the basic principles, methods, concepts and techniques for transit planners and schedulers. It is envisioned to serve as a guidance manual for many different users at transit agencies, consulting companies, and at universities for educational purposes. This manual is composed of two main parts: planning and scheduling. The planning portion of the manual emphasizes the process of exploring a number of opportunities for providing an efficient public transit service. It focuses on techniques that can help optimize the delivery of a sustainable transit service, based on existing conditions and available resources. The scheduling portion of the manual, on the other hand, accentuates the process where public transit vehicles are assigned at specific times to be at specific locations along a route. Each part of the manual contains several sections that cover specific topics related to its respective subjects to facilitate the utilization of this manual. For instance, the transit scheduling part of this manual covers many
vi
different aspects of transit scheduling, including external factors such as union contracts that the scheduler should consider when implementing a transit schedule. This transit manual is also intended to help its users stimulate innovative thinking and foster career development. The manual stresses the integration of service planning and scheduling. The service planner must understand the fundamentals of scheduling, as the schedulers need to be familiar with the service planning process. It is important that service planners and schedulers interact with each other through the entire service and schedule development process rather than being two disconnected functions. References and a glossary of terms are included at the end of the manual to provide information on useful transit documents and common key term definitions.
vii
Table of Contents
Foreword .............................................................................................................................................................. iii Acknowledgements ....................................................................................................................................... iv Introduction ......................................................................................................................................................... v Table of Contents ........................................................................................................................................... vii List of Figures ..................................................................................................................................................... xi List of Tables ..................................................................................................................................................... xii
Transit Service Planning ............................... 1
A. Introduction: What is Transit Planning? ................... 1
Transit and Transportation Planning.......................................................................................................... 1 Long-Range Transportation Plan ................................................................................................................ 3 Medium-Range Transportation Plan ......................................................................................................... 5 Short-Range Transportation Plan ............................................................................................................ 6 Service Planning ............................................................................................................................................... 7 Major Functions of a Transit Service Planner ..................................................................................... 10 Meet Agency Goals and Objectives .................................................................................................... 10 Service Requests ........................................................................................................................................... 12 Development and Updating Service Standards ........................................................................... 13 Collect and Analyze Data .......................................................................................................................... 14 Measure Performance vs. Standards ................................................................................................. 16 Gain Approval of Management and Stakeholders ...................................................................... 17
B. Agency Goals and Objectives ................................. 19
Provide Measurable Criteria to Evaluate Service Objectively ................................................ 19 Strategic and Business Plans ................................................................................................................. 23 Impacts of Budget and Funding on the Transit Planning Process ..................................... 25 External Forces Affecting Planning ...................................................................................................... 29
C. The Service Planning Process ................................. 30
Service standards and Performance Measures ........................................................................... 31 Types of Bus Service ................................................................................................................................... 32 Service Coverage .......................................................................................................................................... 37 Service Level and Schedule Design ................................................................................................... 40
viii
Service Delivery .............................................................................................................................................. 45 Evaluation of Service ................................................................................................................................... 56 Performance and Productivity Measures ......................................................................................... 58 Identify Services with Performance Issues ...................................................................................... 63 Evaluate Areas for Potential Service Expansion ........................................................................... 64
D. Data Collection ........................................................ 66
Types of Data and Information .................................... 66
Ridership ............................................................................................................................................................ 66 Public Input (Complaints and Suggestions) ................................................................................... 68 Market Research, Surveys ........................................................................................................................ 69 Demographic and Socio-Economic Data ........................................................................................ 71 Staff Input ........................................................................................................................................................... 72 Data Collection/Analysis Tools .............................................................................................................. 72 APC, AVL, Farebox ......................................................................................................................................... 72 GIS, Planning and Scheduling Software ........................................................................................... 74 Transportation Elasticity Models ........................................................................................................... 77 Application of Data in Service Planning ............................................................................................ 80 Extracting the Important Data for Service Planning ................................................................... 80 Applying Data Properly for Good Planning Decisions ............................................................... 80
E. Plan Development .......................................................... 82
Service Design ................................................................................................................................................ 82 Bus Service Networks and their Advantages/Disadvantages .............................................. 82 Geographic Characteristics ..................................................................................................................... 85 New Service and Service Enhancements ....................................................................................... 88 Development of Sketch Plans Including Service Characteristics ....................................... 91 Resource and Cost Estimation Process ............................................................................................ 92 Demand and Revenue Estimation ....................................................................................................... 95 Fine Tuning of Plans through Approval Process .......................................................................... 96 Rail Service Planning Related to Capacity ....................................................................................... 97 Improving Transit through Efficient Planning ................................................................................. 98 Making the Tough Decisions of Service Reduction .................................................................... 98 Improving Capacity by Increasing Travel Speed ....................................................................... 101 Planning and Scheduling Measures to Improve Reliability .................................................. 101 On-Time Performance .............................................................................................................................. 102 Coordination with Other Transportation Organizations .......................................................... 103
ix
F. Implementation of Service Plans .....................................106
Facilities Planning ....................................................................................................................................... 106 Operating Logistics..................................................................................................................................... 106 Bus Stop Issues ............................................................................................................................................ 107 Park-Ride Lots ............................................................................................................................................... 112 Americans with Disabilities Act (ADA) Requirements .............................................................. 114 Plan Approval/Acceptance .................................................................................................................... 115 Title VI ................................................................................................................................................................ 115 Management Concurrence ................................................................................................................... 116 Community Meetings and Public Hearings .................................................................................. 116 Staff Acceptance and Union Agreements ...................................................................................... 118 Agency Coordination ................................................................................................................................. 118 Planning Reports ......................................................................................................................................... 119 Periodic Ridership and Productivity Reports................................................................................. 119 Detailed Descriptions of All Service Change Proposals ......................................................... 120 Title VI Analysis of Service and Fare Changes ............................................................................. 120
G. Transit Service Monitoring .............................................122
Data Collection Plan .................................................................................................................................. 122 On-Time Performance .............................................................................................................................. 123 Passenger Complaints ............................................................................................................................. 124 Market Research .......................................................................................................................................... 124
H. Recommended Reading .........................................128
Transit Scheduling ..................................... 129
A. Introduction: What is Transit Scheduling? ...........129
B. Scheduling Process ...............................................131
Timetable Development .......................................................................................................................... 131 Blocking ............................................................................................................................................................ 131 Run-Cutting ..................................................................................................................................................... 132 Rostering (Crew Assignment) ............................................................................................................... 132 Major Functions of the Transit Scheduler ...................................................................................... 133 Timetable Development .......................................................................................................................... 135 Blocking (Vehicle Assignment) ............................................................................................................ 158 Run-cutting (Driver Assignment) ......................................................................................................... 178 Cost Components of Runs ..................................................................................................................... 182
x
Setting up the Run-Cutting Process .................................................................................................. 187 Rostering (Crew Assignment) ............................................................................................................... 201 Other Scheduling Considerations ...................................................................................................... 213 Schedule Reports ........................................................................................................................................ 214
C. Tools of the Transit Scheduler ..............................218
Technology, Software, Data Sources ............................................................................................... 218
D. Ideas for Transit Efficiency ...................................224
Improving Transit through Efficient Scheduling ......................................................................... 224
Improving On-Time Performance ....................................................................................................... 228
Cost/Benefit Analysis Process .............................................................................................................. 233
Route Design Considerations ............................................................................................................... 234
E. Rail Scheduling ......................................................236
Differences between Rail and Bus Scheduling ........................................................................... 236
Cost Differences (Between Bus and Light Rail) .......................................................................... 239
Track Structure, Merging, and Diverging of Lines...................................................................... 240
Blocking ............................................................................................................................................................ 241
Yard Balancing ............................................................................................................................................. 242
F. Recommended Reading .........................................243
References ................................................................................................................................................................. 244
Appendix A: Key National Organizations ................................................................................... 251
Appendix B: Glossary ...................................................................................................................................... 252
xi
List of Figures
Figure 1 - PDCA Cycle for Planning .......................................................................................................... 2
Figure 2 - Transit Modes (Source: PlanItMetro) .................................................................................. 2
Figure 3 - Planning Pyramid ........................................................................................................................ 6
Figure 4 - Service Planning Process ........................................................................................................ 8
Figure 5 - Transit Service Planning ........................................................................................................ 13
Figure 6 - Example of Goals and Objectives ...................................................................................... 21
Figure 7 - Example of a BRT Vehicle and Station (Source: The Rio Times) ........................... 32
Figure 8 - American Community Survey .............................................................................................. 36
Figure 9 - Real-time Bus Tracker using GIS Functionality (Palm Tran) ................................... 75
Figure 10 - Cincinnati Radial Network .................................................................................................. 82
Figure 11 - Portland Grid Network .......................................................................................................... 84
Figure 12 - Factors Influencing Mode Choice .................................................................................... 86
Figure 13 - Transit Service Planning Process .................................................................................... 97
Figure 14 - Far-Side, Near-Side, Midblock Bus Stop Example (TCRP 19) ........................... 109
Figure 15 - Example of Triangle Transit Productivity Report .................................................... 119
Figure 16 - Example of Service Change Proposal (Source: Transport for London) ........ 121
Figure 17 - Example of a Bus Rider Survey (Source: PSTA) ...................................................... 127
Figure 18 - Scheduling Process ............................................................................................................ 132
Figure 19 - Loops ........................................................................................................................................ 137
Figure 20 - Short Turns ............................................................................................................................. 137
Figure 21 - Branches ................................................................................................................................. 138
Figure 22 - Terminal Points ..................................................................................................................... 140
Figure 23 - Detailed Route Map for Route 46 .................................................................................. 141
Figure 24 - Interlining Opportunity ...................................................................................................... 163
Figure 25 - Blocking Graph ..................................................................................................................... 176
Figure 26 - Graphical Examples of Straight Runs ......................................................................... 181
Figure 27 - Typical Split Run................................................................................................................... 182
Figure 28 - Active Priority System ........................................................................................................ 233
xii
List of Tables
Table 1 - Performance-Based Planning .......................................................................................................... 11 Table 2 - Reasons for Performance Measurement .................................................................................. 17 Table 3 - Sample Agency’s Goals and Objectives .................................................................................... 20 Table 4 - Transit User’s Expectation .................................................................................................................. 22 Table 5 - Measurements of a Transit Agency’s Goals and Objectives ......................................... 23 Table 6 - Potential Public Transport Funding Options ........................................................................... 27 Table 7 - Different Bus Modes ............................................................................................................................... 33 Table 8 - Transit Network Design ....................................................................................................................... 39 Table 9 - Bus Stop Spacing (TCRP 19) ............................................................................................................. 40 Table 10 - Transit Service Standards ................................................................................................................ 48 Table 11 - Service Changes .................................................................................................................................... 49 Table 12 - Classification of Various Evaluation Standards ................................................................. 50 Table 13 - Illustration of Service Standards.................................................................................................. 52 Table 14 - Different Types of Service Change ............................................................................................. 54 Table 15 - Reasons for Monitoring Transit Service .................................................................................. 56 Table 16 - Financial Indicators .............................................................................................................................. 57 Table 17 - Non-Financial Indicators .................................................................................................................. 58 Table 18 - Performance Measures for Effectiveness .............................................................................. 60 Table 19 - Performance Measures for Efficiency ...................................................................................... 61 Table 20 - Ridership-Related Performance Measures ........................................................................... 67 Table 21 - GIS Benefits ............................................................................................................................................... 76 Table 22 - Service Standards ................................................................................................................................. 91 Table 23 - Disadvantages for Typical Stop Locations ......................................................................... 111 Table 24 - Advantages for Typical Stop Locations ................................................................................ 112 Table 25 - Running Times for Route 46 ......................................................................................................... 144 Table 26 - Summary of Information for Route 46 ................................................................................... 149 Table 27 - Route 46 Eastbound .......................................................................................................................... 149 Table 28 - Route 46 Eastbound .......................................................................................................................... 150 Table 29 - Route 46 Eastbound .......................................................................................................................... 150 Table 30 - Route 46 Eastbound .......................................................................................................................... 151 Table 31 - Route 46 Eastbound .......................................................................................................................... 151 Table 32 - Route 46 Eastbound .......................................................................................................................... 152
xiii
Table 33 - Route 46 Eastbound .......................................................................................................................... 153 Table 34 - Route 46 Eastbound .......................................................................................................................... 154 Table 35 - Route 46 Eastbound .......................................................................................................................... 155 Table 36 - Route 46 Master Schedule ............................................................................................................ 156 Table 37 - Route 46 Pull-out and Pull-in Allowances ............................................................................ 160 Table 38 - Example of a Blocking Sheet ...................................................................................................... 165 Table 39 - Master Schedule for Route 46 .................................................................................................... 166 Table 40 - Hooking Trips for Route 46 ........................................................................................................... 169 Table 41 - Route 46 Blocking Sheet ................................................................................................................ 170 Table 42 - Complete Vehicle Assignment for Block 4602 .................................................................. 171 Table 43 - Complete Vehicle Assignment for Block 4603 .................................................................. 172 Table 44 - Complete Vehicle Assignment for Block 4604 .................................................................. 172 Table 45 - Complete Vehicle Assignment for Block 4605 .................................................................. 173 Table 46 - Last Block 4606 .................................................................................................................................... 173 Table 47 - Completed Blocking Sheet for Route 46 .............................................................................. 174 Table 48 - Blocking Summary Table .............................................................................................................. 175 Table 49 - Different Types of Operator Reliefs ......................................................................................... 189 Table 50 - Chronological Block Summary .................................................................................................. 192 Table 51 - Run-Cutting Work Rules ................................................................................................................. 193 Table 52 - Sample Run Guide ............................................................................................................................. 195 Table 53 - Run Guide for Route 46 ................................................................................................................... 196 Table 54 - Run Guide for Route 46 ................................................................................................................... 196 Table 55 - Run Guide for Route 46 ................................................................................................................... 197 Table 56 - Assembling Block 4604 and 4605 ............................................................................................. 197 Table 57 - Assembling Block 4602 and 4606 ............................................................................................. 198 Table 58 - Complete Run-Guide ........................................................................................................................ 199 Table 59 - Example of Weekly Run Packages (Rosters) .................................................................... 201 Table 60 - Required Operators for 8-hour Runs ...................................................................................... 205 Table 61 - Days off Distribution ......................................................................................................................... 206 Table 62 - Operators required for 10-Hour Runs .................................................................................... 206 Table 63 - Days off Distribution ......................................................................................................................... 206 Table 64 - Required Operators for Route 46 (8-hour Runs) .............................................................. 207 Table 65 - Days off Distribution for Route 46 ............................................................................................. 207 Table 66- Weekly Roster* ........................................................................................................................................ 208 Table 67 - Variation # 1 ........................................................................................................................................... 209
xiv
Table 68 - Prominent Features of AVL and APC Systems ................................................................. 222 Table 69 - Operational Characteristics of Rail Transit Systems .................................................... 237
1
Transit Service Planning
The Transit Service Planning section engages in step-by-step procedures as follows:
A. Introduction: What is Transit Planning?
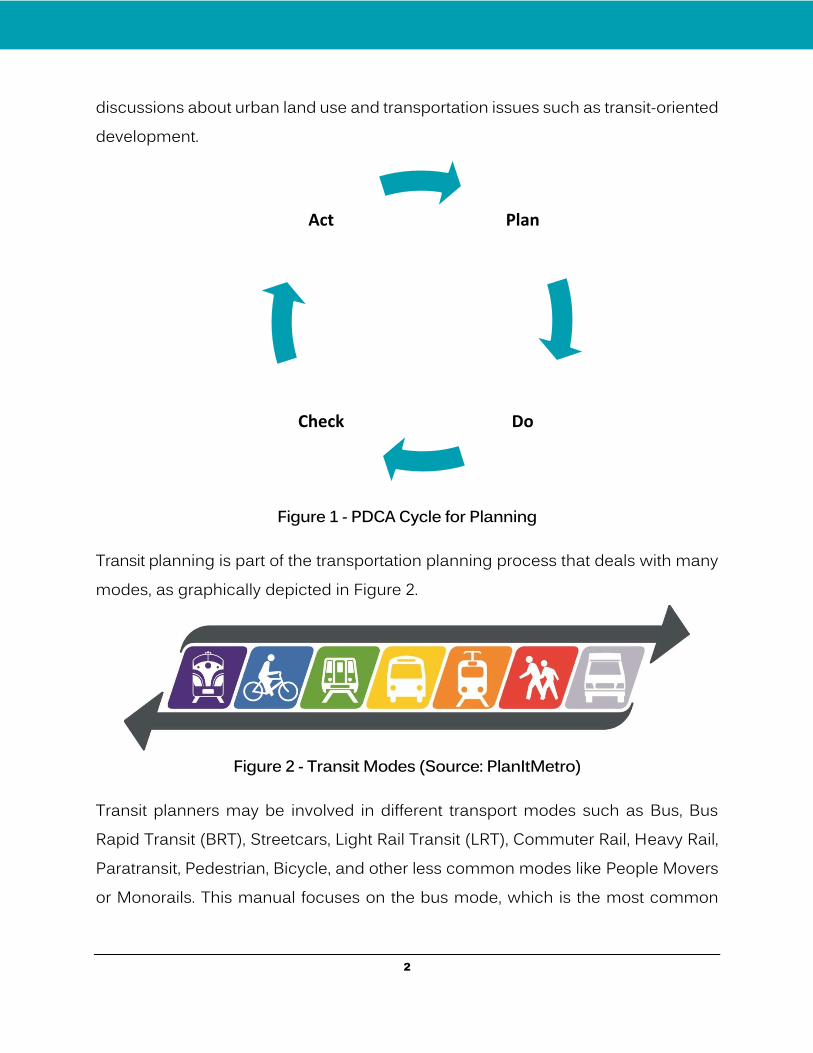
Transit Service Planning or Transit Planning is a key management function involving the formulation of one or more detailed plans to achieve the optimum balance of needs or demands with the available resources. The planning process identifies the goals or obje`ctives to be achieved, formulates strategies to achieve them, arranges or creates the means required, and implements, directs, and monitors all steps in the proper sequence. It also can be the control of development by a local authority, through regulation and licensing for land use changes and construction. Planning increases the efficiency of an organization, reduces the risks involved in modern business activities, and facilitates the evaluation of available time and resources. The Plan–Do–Check–Act Cycle (PDCA) depicted in Figure 1 is a four–step model commonly used in the planning process.
Transit and Transportation Planning
Transit service planning, transit operations planning, or transit planning is the professional discipline responsible for developing public transport systems. It is a hybrid discipline involving aspects of transportation engineering and traditional urban planning. Many transit planners find themselves involved in
Section
1
2
discussions about urban land use and transportation issues such as transit-oriented development.
Figure 1 - PDCA Cycle for Planning
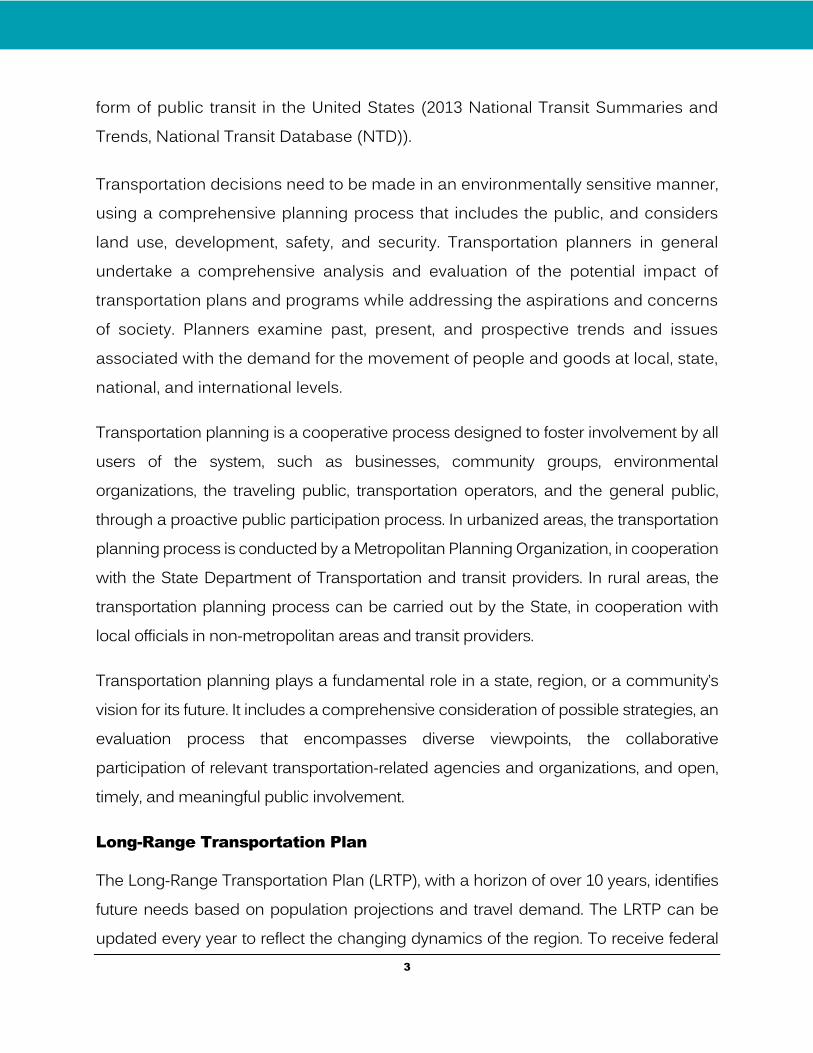
Transit planning is part of the transportation planning process that deals with many modes, as graphically depicted in Figure 2.
Figure 2 - Transit Modes (Source: PlanItMetro)
Transit planners may be involved in different transport modes such as Bus, Bus Rapid Transit (BRT), Streetcars, Light Rail Transit (LRT), Commuter Rail, Heavy Rail, Paratransit, Pedestrian, Bicycle, and other less common modes like People Movers or Monorails. This manual focuses on the bus mode, which is the most common
Plan
DoCheck
Act
3
form of public transit in the United States (2013 National Transit Summaries and Trends, National Transit Database (NTD)).
Transportation decisions need to be made in an environmentally sensitive manner, using a comprehensive planning process that includes the public, and considers land use, development, safety, and security. Transportation planners in general undertake a comprehensive analysis and evaluation of the potential impact of transportation plans and programs while addressing the aspirations and concerns of society. Planners examine past, present, and prospective trends and issues associated with the demand for the movement of people and goods at local, state, national, and international levels.
Transportation planning is a cooperative process designed to foster involvement by all users of the system, such as businesses, community groups, environmental organizations, the traveling public, transportation operators, and the general public, through a proactive public participation process. In urbanized areas, the transportation planning process is conducted by a Metropolitan Planning Organization, in cooperation with the State Department of Transportation and transit providers. In rural areas, the transportation planning process can be carried out by the State, in cooperation with local officials in non-metropolitan areas and transit providers.
Transportation planning plays a fundamental role in a state, region, or a community’s vision for its future. It includes a comprehensive consideration of possible strategies, an evaluation process that encompasses diverse viewpoints, the collaborative participation of relevant transportation-related agencies and organizations, and open, timely, and meaningful public involvement.
Long-Range Transportation Plan
The Long-Range Transportation Plan (LRTP), with a horizon of over 10 years, identifies future needs based on population projections and travel demand. The LRTP can be updated every year to reflect the changing dynamics of the region. To receive federal
4
funding, projects must be included in the LRTP. Creating a long-range transportation plan usually involves two key elements: the technical process and the public involvement process.
The technical process involves three phases, as follows:
1) Developing transportation models that will be used to project future travel demands.
2) Identifying the broad transportation needs and available funding options.
3) Producing a list of projects that are financially feasible by prioritizing current and future transportation needs, which are identified during the planning process.
The long-range planning process also includes community feedback. The agency’s governing board takes into consideration public input, as well as the recommendations of transportation planners for the adoption of the LRTP.
LRTP projects address long-term transportation issues. However, there is no guarantee that all projects will be built. Transportation projects in the long-range transportation plan require considerable analysis and funding commitments before moving forward to environmental assessment, preliminary design, final design, and construction.
The LRTP considers all modes of transportation, including highways, bus, rail, bicycle, pedestrian, ports, and air. The LRTP not only outlines the region's long-range transportation vision, but it also lists projects that the region anticipates to undertake in the future. The LRTP includes a list of projects that are critical to the region and require allocation of funding. Additionally, this list of transportation projects must be financially feasible, meaning that the organization cannot plan more than the existing or expected funding.
5
Medium-Range Transportation Plan
The Medium-Range Transportation Plan (MRTP) has similar goals and objectives in regards to the transportation system as the Long-Range Transportation Plan. The key areas are as follows:
Livability: To minimize the impact of transportation on the quality of life.
Economic development: To ensure that a transportation system supports and promotes economic development.
Land development interaction: To ensure that the transportation system is compatible with land use and promotes regional development.
Social equity: To ensure the equitable distribution of transportation services and costs.
System performance: To maintain the effectiveness and quality of the transportation service provided to the user.
System implementation: To ensure effective management of the regional transportation system.
Public accountability: To ensure effective participation of the public in the transportation planning process.
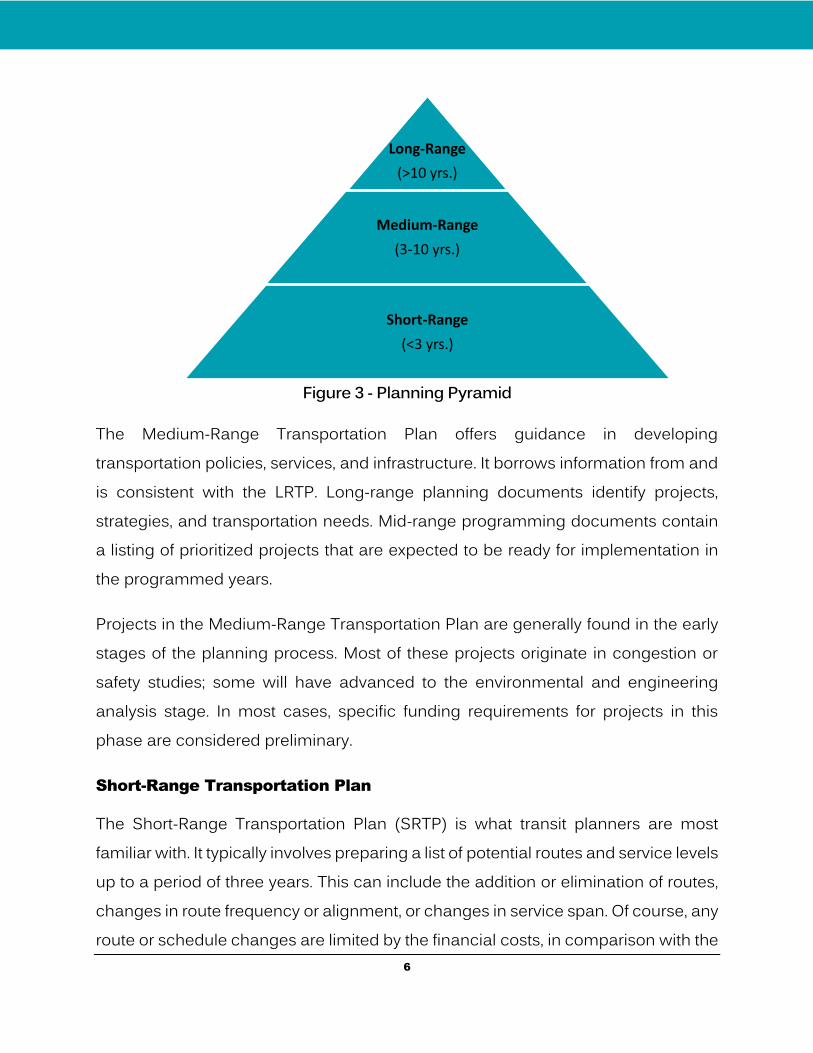
Medium-Range Transportation Plans cover a horizon of three to ten years. Figure 3 depicts Planning Pyramid of the commonly used time periods for the different plans: long-range, medium-range, and short-range.
6
Figure 3 - Planning Pyramid
The Medium-Range Transportation Plan offers guidance in developing transportation policies, services, and infrastructure. It borrows information from and is consistent with the LRTP. Long-range planning documents identify projects, strategies, and transportation needs. Mid-range programming documents contain a listing of prioritized projects that are expected to be ready for implementation in the programmed years.
Projects in the Medium-Range Transportation Plan are generally found in the early stages of the planning process. Most of these projects originate in congestion or safety studies; some will have advanced to the environmental and engineering analysis stage. In most cases, specific funding requirements for projects in this phase are considered preliminary.
Short-Range Transportation Plan
The Short-Range Transportation Plan (SRTP) is what transit planners are most familiar with. It typically involves preparing a list of potential routes and service levels up to a period of three years. This can include the addition or elimination of routes, changes in route frequency or alignment, or changes in service span. Of course, any route or schedule changes are limited by the financial costs, in comparison with the
Long-Range
(>10 yrs.)
Medium-Range
(3-10 yrs.)
Short-Range
(<3 yrs.)
7
expected agency operational funding available for the given period. The purpose of the SRTP is to establish a coordinated action strategy to guide future investments, monitor progress, and respond to changing conditions.
Unfortunately, in many cases, economic conditions require that changes involve service cuts or fare increases. In situations like this, transit planners use specific strategies to minimize ridership losses due to service cuts or fare increases.
Because public transit agencies struggle with the competing goals of generating revenues by increasing ridership and providing mobility to all areas in the community (even areas with low ridership), the job of a transit planner is not easy. It is difficult to focus on providing transportation to those with no other choice, and at the same time, attempt to be competitive. Service planning is frequently amplified by political interference in the transit planning process, which often forces transit agencies to operate an inefficient bus service, which can have a negative impact on the transit agency’s budget.
Service Planning
Service planners are responsible for developing routes and networks of routes for transit systems. This may follow one or more models, depending on the characteristics of the communities they serve. For example, in traditional urban areas, a system may attract enough ridership to support high frequencies of service. In less densely developed areas, transit service may operate somewhat infrequently. Transit service planners concentrate on short-term planning issues, and their work is interconnected with the work of schedulers. Transit service planners also deal with other tasks such as providing input for budgeting and cost analysis to offer the best transit service based on available resources.
Ridership data, either collected by surveyors or transit checkers that manually ride the bus routes and record the data, or collected by Automated Passenger Counter (APC) systems, are extensively used by transit planners to ensure that agency
8
resources are used in the most efficient way possible. In addition to ridership data, planners also use demographic and geographic data, often utilizing software such as Geographic Information Systems (GIS) to identify opportunities for new routes and service improvements.
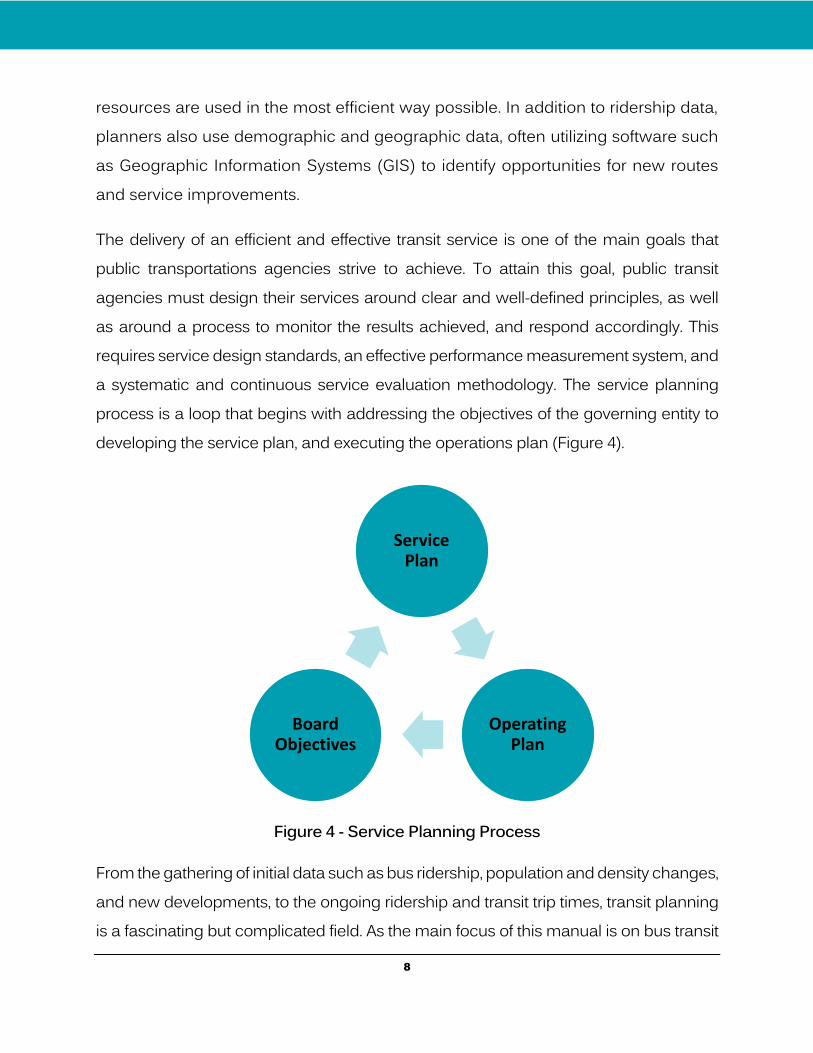
The delivery of an efficient and effective transit service is one of the main goals that public transportations agencies strive to achieve. To attain this goal, public transit agencies must design their services around clear and well-defined principles, as well as around a process to monitor the results achieved, and respond accordingly. This requires service design standards, an effective performance measurement system, and a systematic and continuous service evaluation methodology. The service planning process is a loop that begins with addressing the objectives of the governing entity to developing the service plan, and executing the operations plan (Figure 4).
Figure 4 - Service Planning Process
From the gathering of initial data such as bus ridership, population and density changes, and new developments, to the ongoing ridership and transit trip times, transit planning is a fascinating but complicated field. As the main focus of this manual is on bus transit
Service Plan
Operating Plan
Board Objectives
9
service planning and scheduling, there is information that can help with decisions, such as where routes should go, where bus stops should be placed, how often the routes should operate, how schedules are written and bus driver runs assigned, and how to reduce service when economic conditions arise. The process of planning and designing a public transit service is called “service planning.”
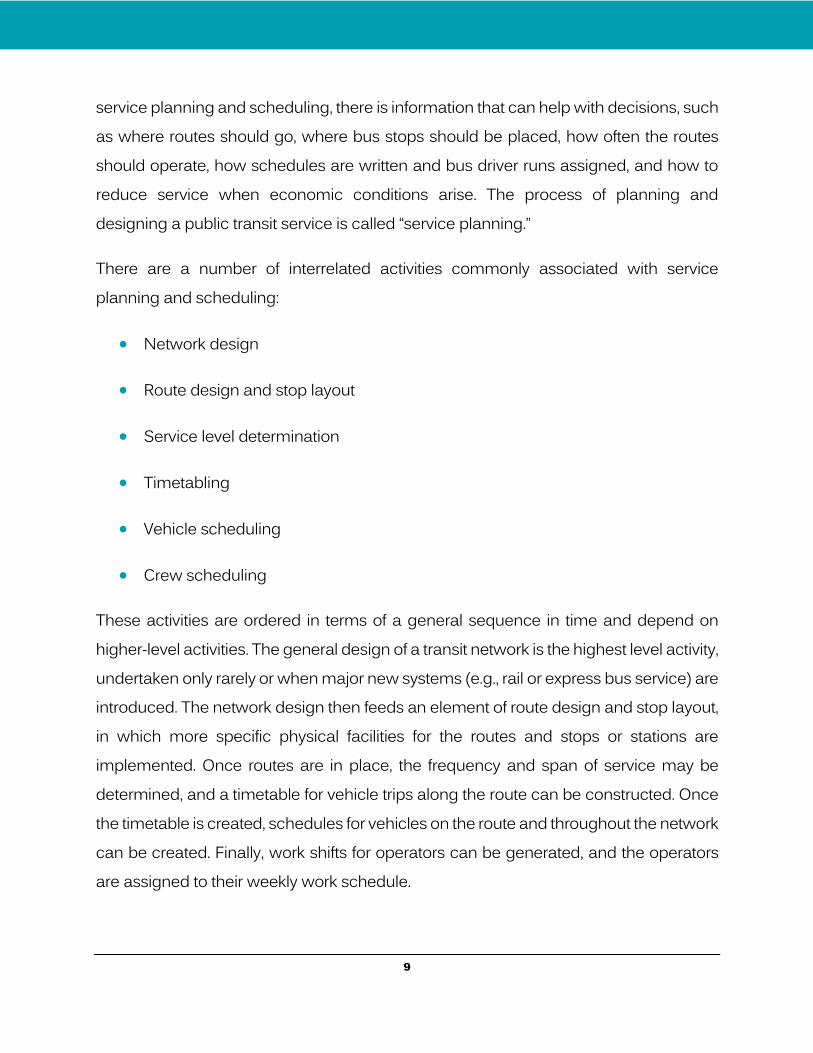
There are a number of interrelated activities commonly associated with service planning and scheduling:
Network design
Route design and stop layout
Service level determination
Timetabling
Vehicle scheduling
Crew scheduling
These activities are ordered in terms of a general sequence in time and depend on higher-level activities. The general design of a transit network is the highest level activity, undertaken only rarely or when major new systems (e.g., rail or express bus service) are introduced. The network design then feeds an element of route design and stop layout, in which more specific physical facilities for the routes and stops or stations are implemented. Once routes are in place, the frequency and span of service may be determined, and a timetable for vehicle trips along the route can be constructed. Once the timetable is created, schedules for vehicles on the route and throughout the network can be created. Finally, work shifts for operators can be generated, and the operators are assigned to their weekly work schedule.
10
The first activities in the network and route design and frequency determination tend to be more strategic in nature and may only be considered less frequently by transit planners. These decisions tend to be driven in part by political and budget considerations, and as such may require careful and strategic thinking on the part of transit planners.
The activities of timetabling and vehicle and crew scheduling are considered more tactical decisions, as these decisions are made as often as the transit agency may consider reviewing or changing schedules. In many cases, these tactical activities are assisted by software tools that can generate high quality solutions in a short period of time, often with direct interaction between schedulers and planners. These topics are discussed in Chapter 2 in the Transit Scheduling section.
Major Functions of a Transit Service Planner
Meet Agency Goals and Objectives
Transit agencies are increasingly incorporating a performance-based approach to their transportation planning to support agency goals and objectives. Therefore, service planners must develop strategies to ensure that the goals and objectives of the agency are met.
The transit service planner must perform a thorough assessment of the service provided to identify areas of improvement. Following service standards, the planner must evaluate the service using performance measures. Furthermore, the planner must know what kind of data is needed, how to collect or obtain the data, and how to use the data to comply with service standards and to develop solutions to problems, as well as present ideas for service improvements.
The planning process is linked to all key organizational processes such as budgeting, capital programming, and performance measurement. Therefore, it is important that the service planner have a good understanding of the agency’s short-
11
and long-term goals and objectives, and keep a global perspective in the decision-making and priority setting during the planning process.
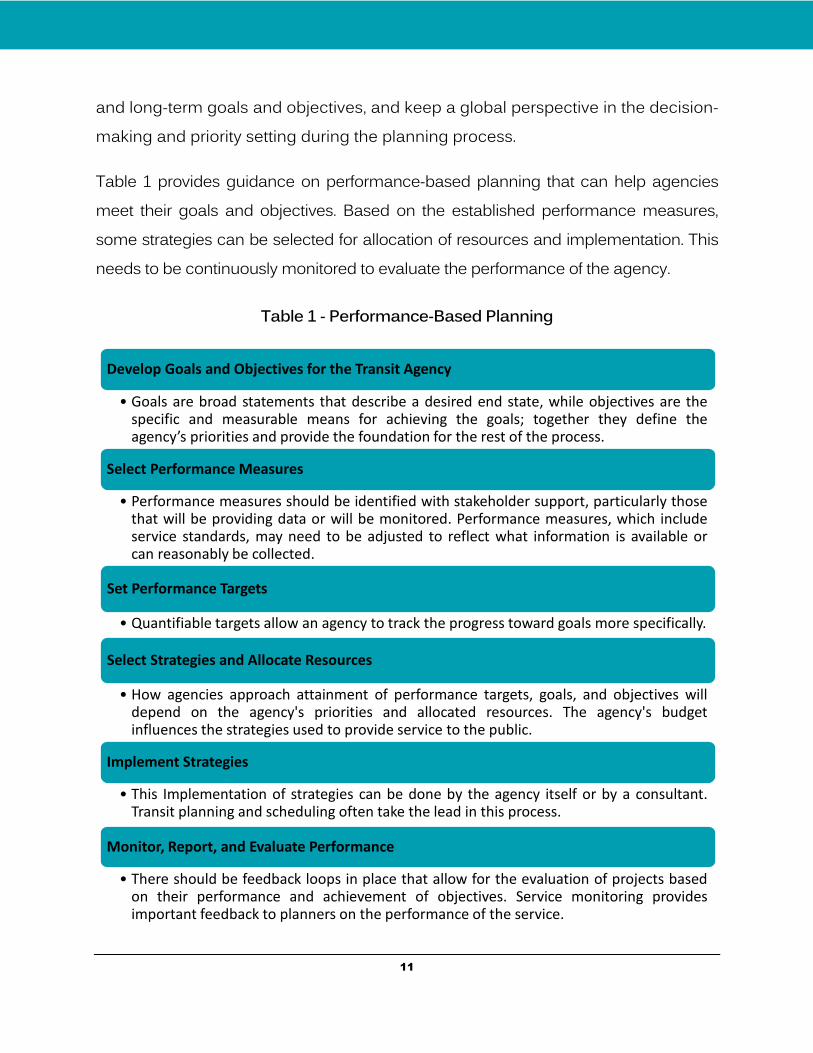
Table 1 provides guidance on performance-based planning that can help agencies meet their goals and objectives. Based on the established performance measures, some strategies can be selected for allocation of resources and implementation. This needs to be continuously monitored to evaluate the performance of the agency.
Table 1 - Performance-Based Planning
Develop Goals and Objectives for the Transit Agency
• Goals are broad statements that describe a desired end state, while objectives are thespecific and measurable means for achieving the goals; together they define theagency’s priorities and provide the foundation for the rest of the process.
Select Performance Measures
• Performance measures should be identified with stakeholder support, particularly thosethat will be providing data or will be monitored. Performance measures, which includeservice standards, may need to be adjusted to reflect what information is available orcan reasonably be collected.
Set Performance Targets
• Quantifiable targets allow an agency to track the progress toward goals more specifically.
Select Strategies and Allocate Resources
• How agencies approach attainment of performance targets, goals, and objectives willdepend on the agency's priorities and allocated resources. The agency's budgetinfluences the strategies used to provide service to the public.
Implement Strategies
• This Implementation of strategies can be done by the agency itself or by a consultant.Transit planning and scheduling often take the lead in this process.
Monitor, Report, and Evaluate Performance
• There should be feedback loops in place that allow for the evaluation of projects basedon their performance and achievement of objectives. Service monitoring providesimportant feedback to planners on the performance of the service.
12
Service Requests
It is important to review and analyze service requests from various sources, including the riding and non-riding public, operations, and stakeholders. In order to attract transit users, the transit agency must listen to its customers and the non-riding public. In addition, the following characteristics need to be considered:
Concentrated trip ends: Activities related to transit should be located close to transit stations or stops.
Quality access system: Provide safe, direct, and easy access to transit for pedestrians, bicyclists, and automobile users. It should also minimize distances from transit vehicles to buildings or from transit stops to destinations.
Transit-oriented street patterns: Allow through routing, direct service, and few turns. Controlling automobile traffic can be done if necessary.
Market orientation: Services are designed to maximize customer satisfaction and needs. Operate directly between origins and destinations without transfers for major ridership patterns, convenient schedules, competitive prices, clean, comfortable vehicles, and good user information and customer service.
Services should be designed to meet the needs of customers. User-oriented transit means that there is:
Direct service from the user’s trip origin to destination
No transfers, or no more than one transfer, if possible
Schedules that match customer needs
Reasonable costs
Good access on both ends of the trip
13
Development and Updating Service Standards
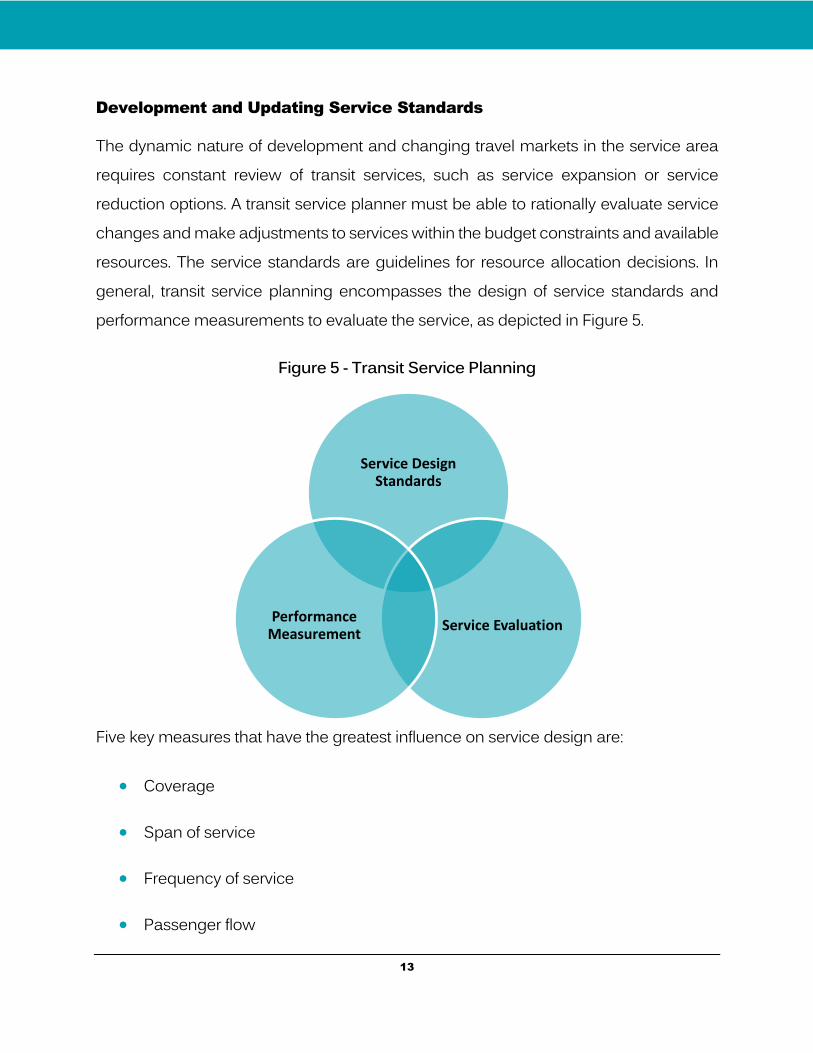
The dynamic nature of development and changing travel markets in the service area requires constant review of transit services, such as service expansion or service reduction options. A transit service planner must be able to rationally evaluate service changes and make adjustments to services within the budget constraints and available resources. The service standards are guidelines for resource allocation decisions. In general, transit service planning encompasses the design of service standards and performance measurements to evaluate the service, as depicted in Figure 5.
Figure 5 - Transit Service Planning
Five key measures that have the greatest influence on service design are:
Coverage
Span of service
Frequency of service
Passenger flow
Service Design Standards
Service EvaluationPerformance
Measurement
14
Minimum productivity
Transit service standards are policies that are used to make decisions about where transit vehicles should run and how often. They form the basis of professional recommendations regarding routing and service proposals. The application of service standards has two major advantages:
Identifies the best use of limited resources by comparing different alternatives for these resources.
Leads to a fair, equitable, open, and objective comparison of all requests and proposals from the general public, elected officials, and staff.
This manual outlines the standards and guidelines applied by most transit agencies, along with the process by which these standards are used to evaluate service changes. In order to provide a high level of transit service that is affordable to passengers and taxpayers, tradeoffs are required between the costs and the benefits achieved by providing the service. Service standards provide a formal mechanism for making these types of tradeoffs in an objective and equitable way. This process can involve both a continuous monitoring of services and annual reviews for possible changes. It allows for input from the general public and elected officials, and ensures that all service changes and proposals are treated fairly and equitably.
Collect and Analyze Data
A transit planner needs to take into account a large number of variables in order to make good decisions about the type of service the transit agency will operate in the future. In recent years, the types and amount of data available to transit planners has grown considerably, although some smaller systems still continue to collect data manually. Many planners now have demographic data (from the United States Census and American Community Survey), geographic data (from software such as ArcGIS), running time and schedule adherence data (from Automatic Vehicle Location systems),
15
passenger count data (from Automated Passenger Counting systems), and additional information from advanced fare collection systems or other systems. In some cases, the amount of data accessible to planners has become so vast that it is almost impossible to sort through everything. Because of the volume of data, it is important that planners spend their time wisely on the data that is most useful and relevant to what they are trying to accomplish.
Before the advent of technology, most transit planning decisions were based on the personal experience of transit professionals, many of whom spent years in the transit industry. Smaller systems that do not have access to data sources may continue to rely on this method as their primary source of information. Even with systems that can afford the latest gadgets in transit technology, personal observations of experienced staff should continue to play an important role in transit planning. Personal experience from different subjects allows planners to quickly identify the required datasets to address particular issues. Experience also helps to quickly detect errors in data collection or data outputs.
Data sources can provide good information about the transit service. For instance, the AVL system can help determine why a bus on a particular trip is consistently late. Is it late because there is not enough running time on that trip, or is it because the operator is driving too slowly? Personal observations and manual data collection are still important when there are no data available to address a particular issue or the data is suspicious. For example, transit agencies that acquire new passenger counters may want to continue collecting data manually until the accuracy of the automated data is validated and trusted.
Another source of information that transit planners should consider when creating or modifying routes and schedules is the input from other people. This input could come from members of the community and transit riders, or it could also come from peers from other transit agencies or from other employees, like bus operators and supervisors. They can all provide valuable information like the location of bus stops, bus punctuality,
16
or analyzing key performance measures. Since they are on the roads, drivers and supervisors can also offer valuable input. They can provide personal observations on the reasons why buses are late or identify issues at stops or stations.
Finally, community outreach is very important. Therefore, a plan should be developed to periodically seek feedback from the public. This can give the public the opportunity to voice their opinions on the current service provided and on expected service improvements in the future. Common topics that can be discussed in public meetings include route and schedule modifications, fare changes, funding needs, introduction of new transit modes, or the willingness to pay more taxes to support a transit initiative or fund the transit agency.
Measure Performance vs. Standards
Performance measures are used by transit agencies for three main reasons:
They are required
They are useful
Others outside the agency need to know what is going on
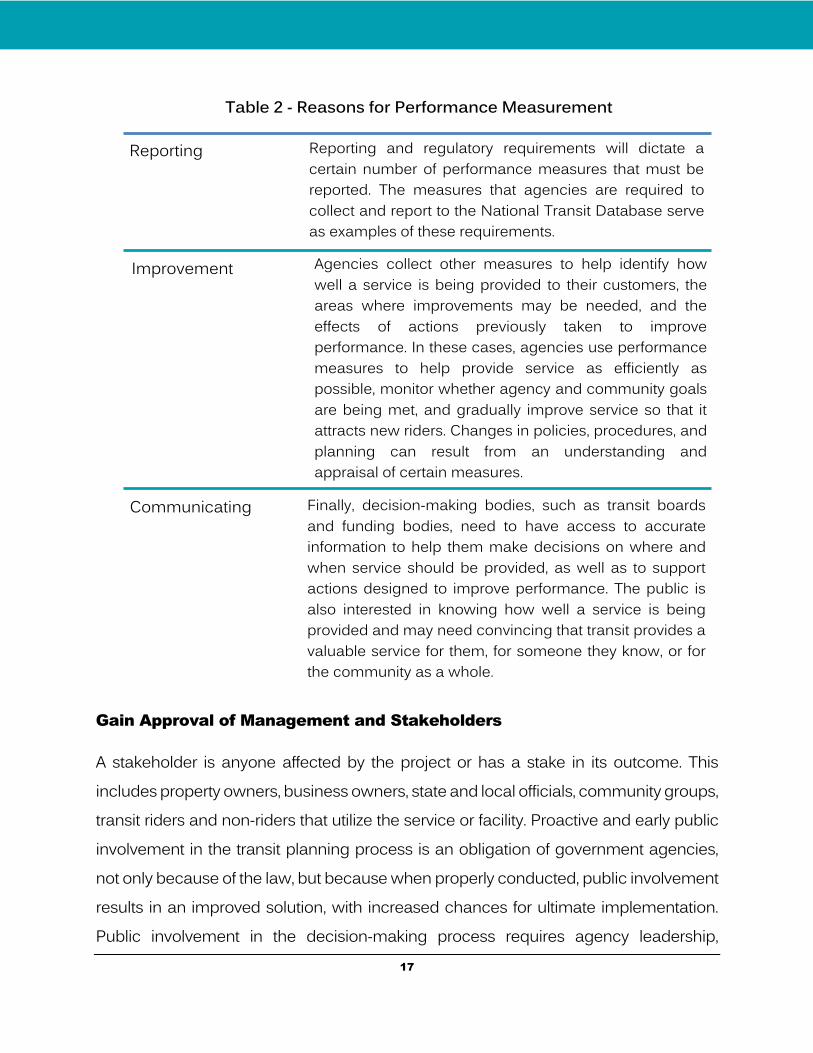
As illustrated in Table 2, reporting, improvements, and communication are the three major reasons for performance measurement. Performance measurement data provide transit agency management with objective assessments of current circumstances, past trends, existing concerns, and unmet needs. Key management use of a performance measurement system includes:
Service monitoring
Evaluation of system performance
Service and policy changes
17
Table 2 - Reasons for Performance Measurement
Gain Approval of Management and Stakeholders
A stakeholder is anyone affected by the project or has a stake in its outcome. This includes property owners, business owners, state and local officials, community groups, transit riders and non-riders that utilize the service or facility. Proactive and early public involvement in the transit planning process is an obligation of government agencies, not only because of the law, but because when properly conducted, public involvement results in an improved solution, with increased chances for ultimate implementation. Public involvement in the decision-making process requires agency leadership,
Reporting Reporting and regulatory requirements will dictate acertain number of performance measures that must bereported. The measures that agencies are required tocollect and report to the National Transit Database serveas examples of these requirements.
Improvement Agencies collect other measures to help identify howwell a service is being provided to their customers, theareas where improvements may be needed, and theeffects of actions previously taken to improveperformance. In these cases, agencies use performancemeasures to help provide service as efficiently aspossible, monitor whether agency and community goalsare being met, and gradually improve service so that itattracts new riders. Changes in policies, procedures, andplanning can result from an understanding andappraisal of certain measures.
Communicating Finally, decision-making bodies, such as transit boardsand funding bodies, need to have access to accurateinformation to help them make decisions on where andwhen service should be provided, as well as to supportactions designed to improve performance. The public isalso interested in knowing how well a service is beingprovided and may need convincing that transit provides avaluable service for them, for someone they know, or forthe community as a whole.

18
creative thinking and persistence, as it can be full of surprises, as well as a source of occasional delay. However, in the long run, addressing public concerns throughout the process legitimizes the final solution and concludes with considerably more popular and sustainable results.
19
B. Agency Goals and Objectives
Goals are observable and measurable end results having one or more objectives to be achieved within a more or less fixed timeframe. Objectives are specific results that a person or system aims to achieve within a time frame and with available resources. In general, objectives are more specific and easier to measure than goals. They are basic tools that underlie all planning and strategic activities, and serve as the basis for creating policies and evaluating performance. Some examples of business objectives include reducing costs, expanding service, and increasing revenue. Unlike goals, objectives are specific, measurable, and have a defined completion date. They are more specific and outline the “who, what, when, where, and how” of reaching goals.
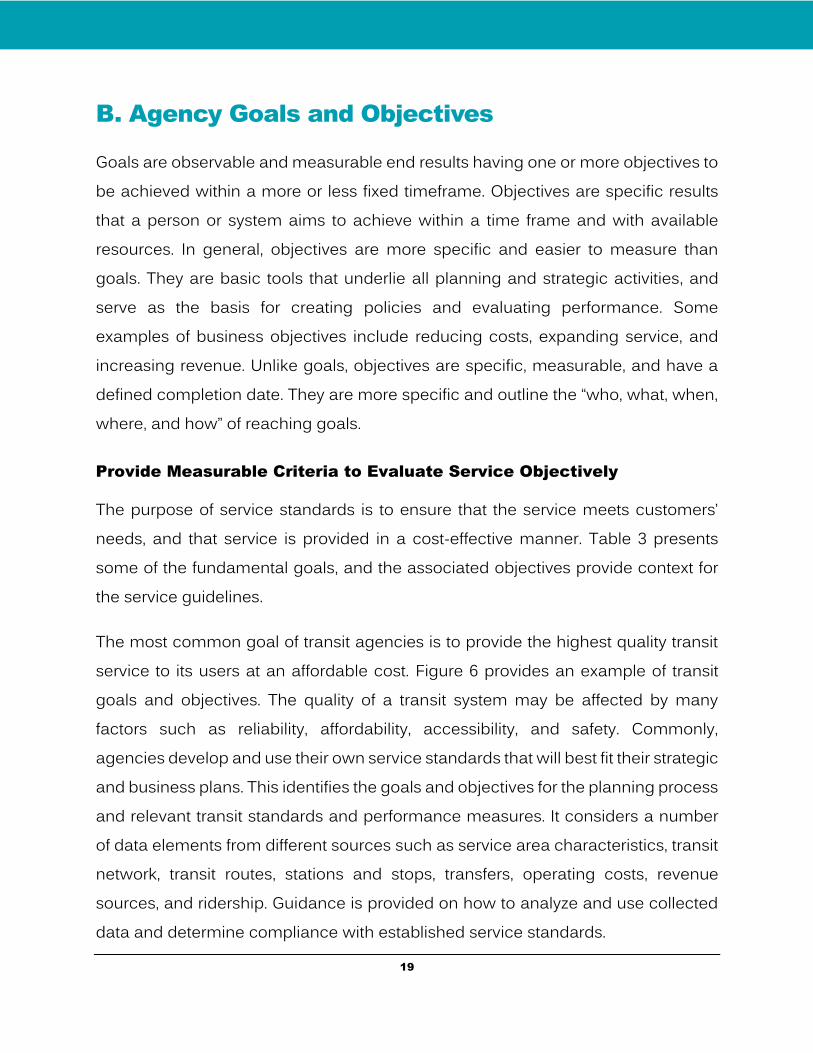
Provide Measurable Criteria to Evaluate Service Objectively
The purpose of service standards is to ensure that the service meets customers’ needs, and that service is provided in a cost-effective manner. Table 3 presents some of the fundamental goals, and the associated objectives provide context for the service guidelines.
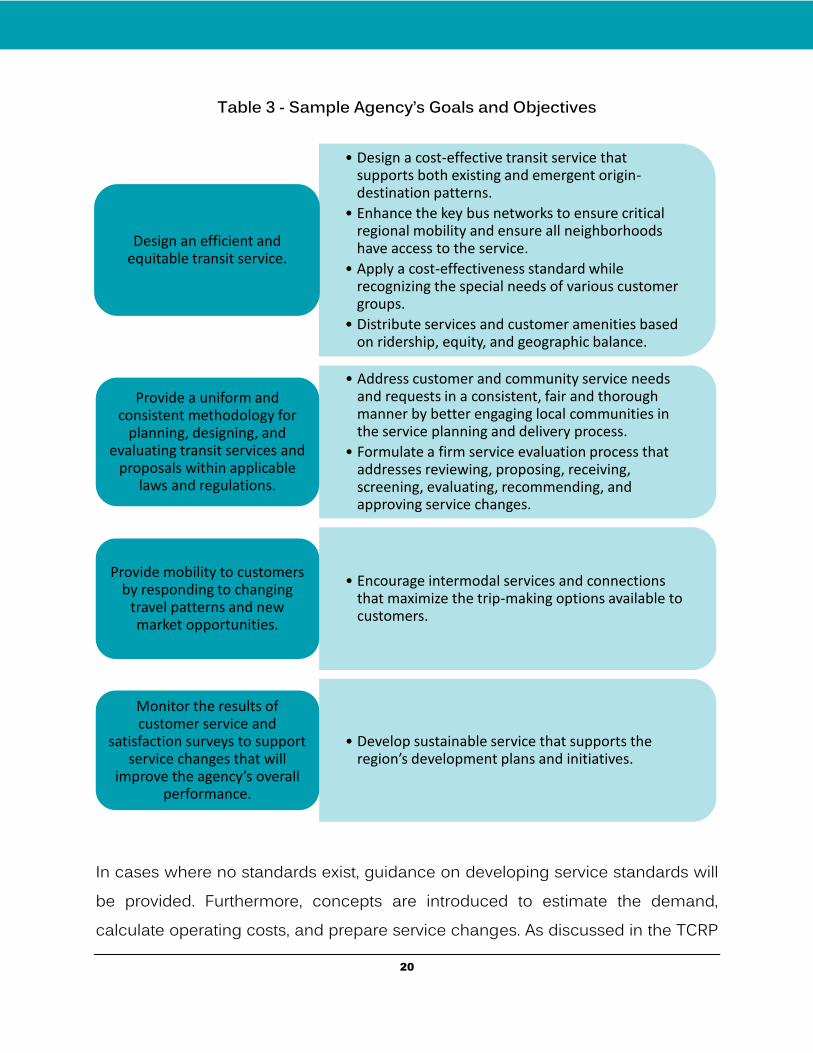
The most common goal of transit agencies is to provide the highest quality transit service to its users at an affordable cost. Figure 6 provides an example of transit goals and objectives. The quality of a transit system may be affected by many factors such as reliability, affordability, accessibility, and safety. Commonly, agencies develop and use their own service standards that will best fit their strategic and business plans. This identifies the goals and objectives for the planning process and relevant transit standards and performance measures. It considers a number of data elements from different sources such as service area characteristics, transit network, transit routes, stations and stops, transfers, operating costs, revenue sources, and ridership. Guidance is provided on how to analyze and use collected data and determine compliance with established service standards.
20
Table 3 - Sample Agency’s Goals and Objectives
In cases where no standards exist, guidance on developing service standards will be provided. Furthermore, concepts are introduced to estimate the demand, calculate operating costs, and prepare service changes. As discussed in the TCRP
• Design a cost-effective transit service that supports both existing and emergent origin-destination patterns.
• Enhance the key bus networks to ensure critical regional mobility and ensure all neighborhoods have access to the service.
• Apply a cost-effectiveness standard while recognizing the special needs of various customer groups.
• Distribute services and customer amenities based on ridership, equity, and geographic balance.
Design an efficient and equitable transit service.
• Address customer and community service needs and requests in a consistent, fair and thorough manner by better engaging local communities in the service planning and delivery process.
• Formulate a firm service evaluation process that addresses reviewing, proposing, receiving, screening, evaluating, recommending, and approving service changes.
Provide a uniform and consistent methodology for
planning, designing, and evaluating transit services and
proposals within applicable laws and regulations.
• Encourage intermodal services and connections that maximize the trip-making options available to customers.
Provide mobility to customers by responding to changing
travel patterns and new market opportunities.
• Develop sustainable service that supports the region’s development plans and initiatives.
Monitor the results of customer service and
satisfaction surveys to support service changes that will
improve the agency’s overall performance.
21
Report 100 titled “Transit Capacity and Quality of Service,” transit quality of service is measured by two important factors:
1. The degree to which transit service is available at given locations. 2. The comfort and convenience of the service provided to transit users.
Figure 6 - Example of Goals and Objectives
The goals and objectives for the Short-Range Transit Plan support the vision of the transit services that should be provided to the public. The development of the goals and objectives is one of the first and probably one of the most important steps in the planning process. The measures of effectiveness can be used to demonstrate whether or not the planned goals and objectives are being met. These measures can be either quantitative or qualitative. Quantitative measures use data and are
Provide a methodology for an efficient and equitable planning, designing, implementing, operating, and evaluating of transit services within available resources.
Develop a consistent process for improving transit service by considering potential demand and agency resources.
Address customer and community service needs in an appropriate manner.
Prepare a service evaluation process that addresses proposing, reviewing, evaluating, recommending, and approving service changes.
Evaluate and implement services consistent with the Americans with Disabilities Act (ADA).
22
evaluated on a technical basis. Qualitative measures such as public involvement, potential sources of revenue, and project alternatives are evaluated on a policy basis.
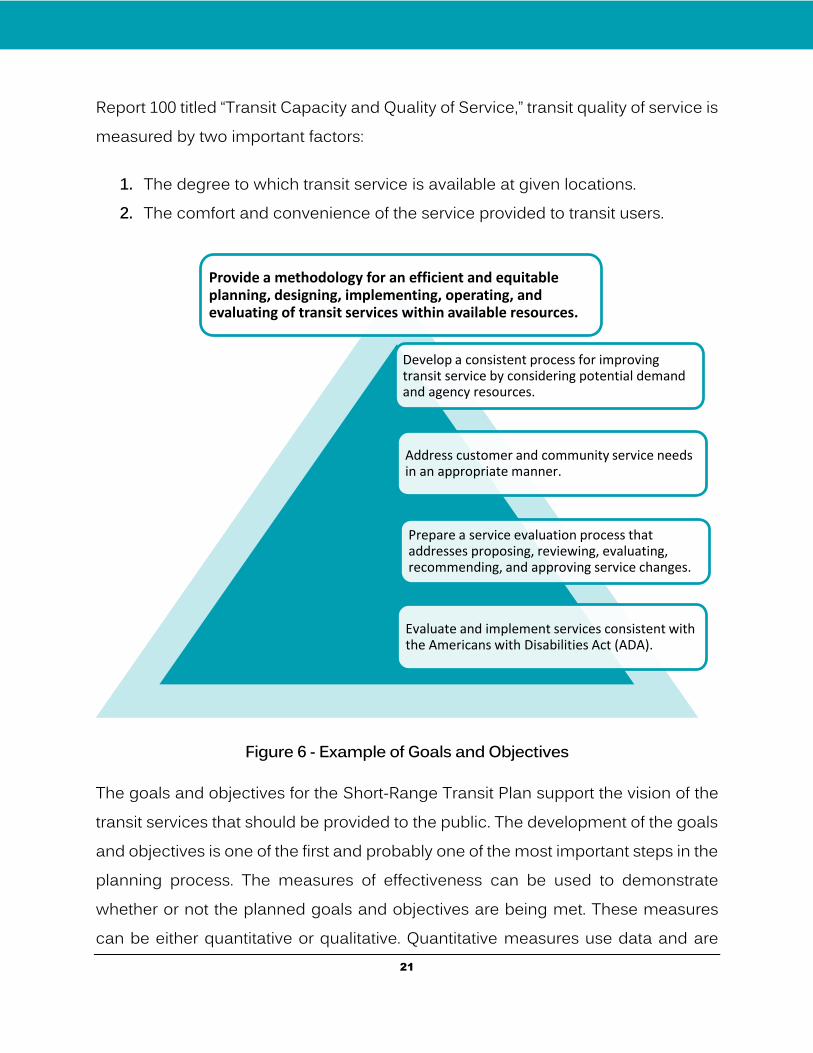
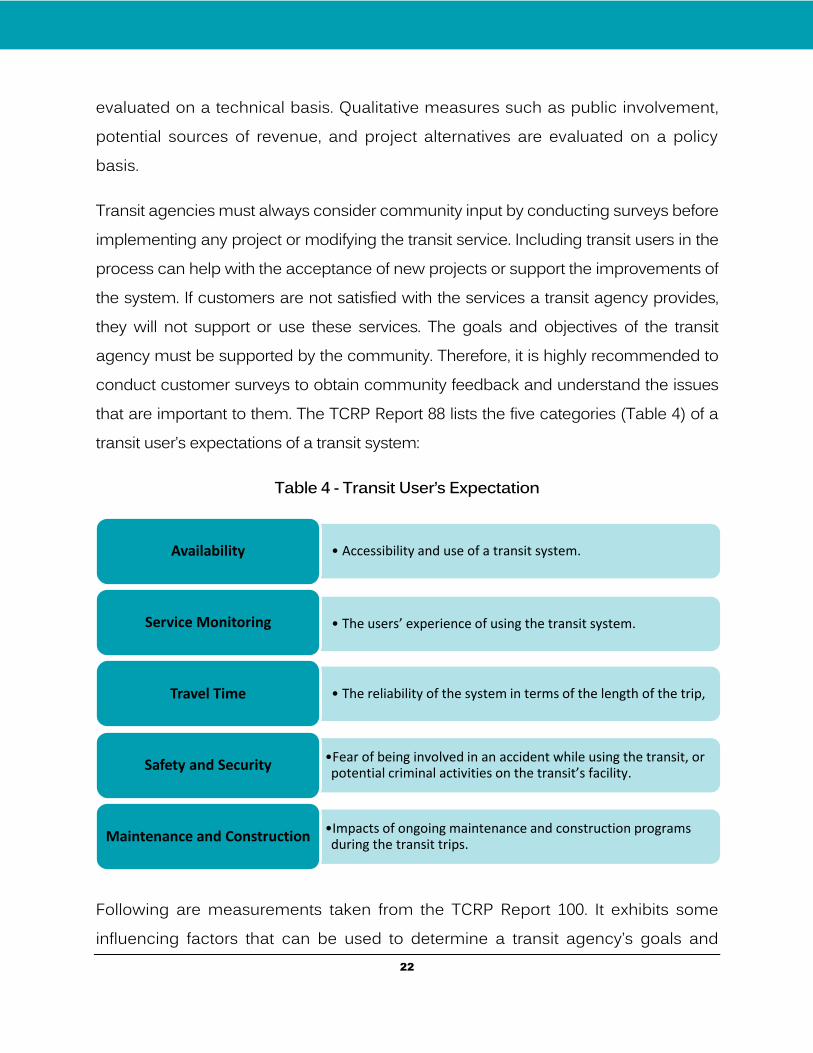
Transit agencies must always consider community input by conducting surveys before implementing any project or modifying the transit service. Including transit users in the process can help with the acceptance of new projects or support the improvements of the system. If customers are not satisfied with the services a transit agency provides, they will not support or use these services. The goals and objectives of the transit agency must be supported by the community. Therefore, it is highly recommended to conduct customer surveys to obtain community feedback and understand the issues that are important to them. The TCRP Report 88 lists the five categories (Table 4) of a transit user’s expectations of a transit system:
Table 4 - Transit User’s Expectation
Following are measurements taken from the TCRP Report 100. It exhibits some influencing factors that can be used to determine a transit agency’s goals and
• Accessibility and use of a transit system.Availability
• The users’ experience of using the transit system.Service Monitoring
• The reliability of the system in terms of the length of the trip,Travel Time
•Fear of being involved in an accident while using the transit, or potential criminal activities on the transit’s facility.
Safety and Security
•Impacts of ongoing maintenance and construction programs during the transit trips.
Maintenance and Construction
23
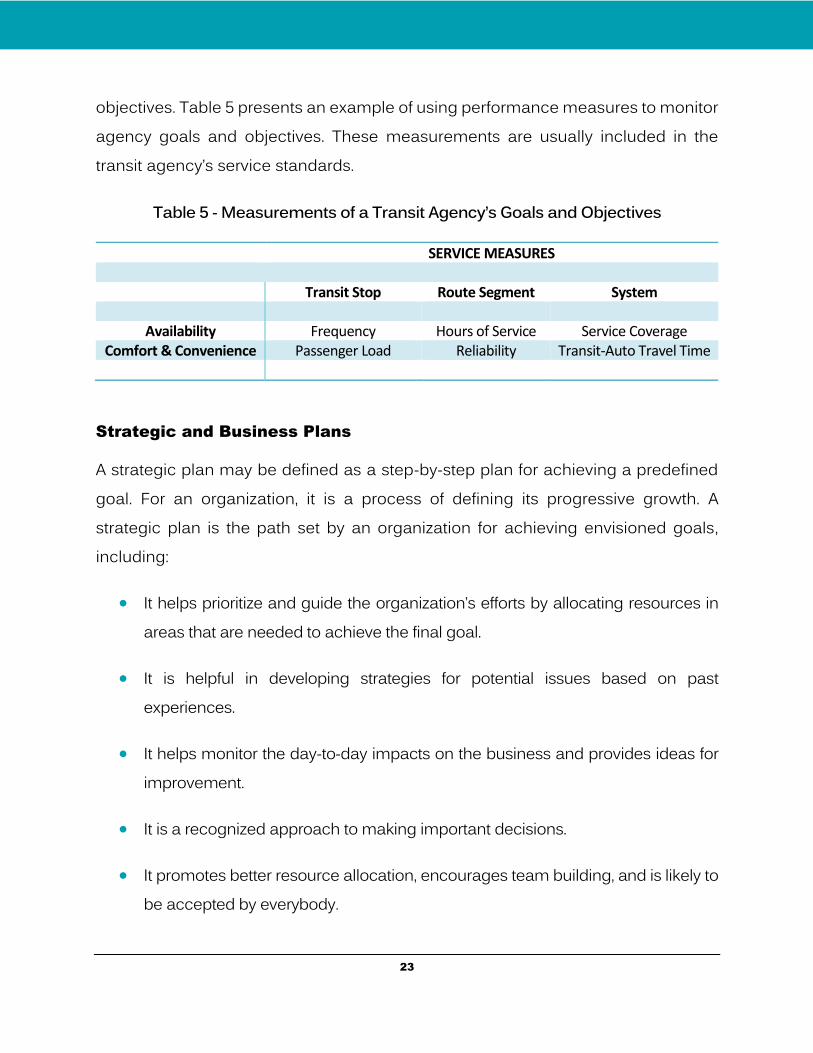
objectives. Table 5 presents an example of using performance measures to monitor agency goals and objectives. These measurements are usually included in the transit agency’s service standards.
Table 5 - Measurements of a Transit Agency’s Goals and Objectives
SERVICE MEASURES Transit Stop Route Segment System
Availability Frequency Hours of Service Service Coverage Comfort & Convenience Passenger Load Reliability Transit-Auto Travel Time
Strategic and Business Plans
A strategic plan may be defined as a step-by-step plan for achieving a predefined goal. For an organization, it is a process of defining its progressive growth. A strategic plan is the path set by an organization for achieving envisioned goals, including:
It helps prioritize and guide the organization’s efforts by allocating resources in areas that are needed to achieve the final goal.
It is helpful in developing strategies for potential issues based on past experiences.
It helps monitor the day-to-day impacts on the business and provides ideas for improvement.
It is a recognized approach to making important decisions.
It promotes better resource allocation, encourages team building, and is likely to be accepted by everybody.
24
Following is a selection of key items from the Miami-Dade Transit’s (MDT’s) Strategic Plan for accomplishing its mission to providing high quality transit service:
Provide reliable transportation Provide reliable transit service through tracking the departmental performance measures and key performance indicators (KPI).
Expand public transportation With existing funds, MDT has initiated a new bus route from Miami Beach to Miami International Airport (MIA) (Flyer 150), as well as a rail track extension to MIA.
Improve mobility for people with disabilities Provide better service for Special Transit Services (STS) individuals depending on public transit so that they have access to their destinations.
Ensure safety at public transit facilities
Provide easy access to transportation information Help passengers track real-time bus schedules with newly developed mobile apps.
Ensure excellent customer service to passengers
Provide attractive, well-maintained facilities and vehicles
County processes are improved through the use of information and technology by the following:
25
1. Replacement of transit operation systems.
2. Upgrading of net infrastructure to provide real-time transit tracking.
3. Development and implementation of automated systems with the
Human Resources division.
Retention of excellent employees by the following:
1. Enhance employee satisfaction and reduce turnover.
2. Recognize employee dedication by awarding the employee of the month and other recognitions.
Training programs and workshops
Impacts of Budget and Funding on the Transit Planning Process
The issue of transit funding is of utmost importance to the transportation industry; quite simply, without money, transit agencies cannot operate. The transit service planner must often adjust the amount of service on the street due to budgetary and economic conditions. Budget cuts are usually the driving force behind major service reductions. Following are several types of transit funding categories:
Capital and operating funding: Capital funding is used for infrastructure such as buses, garages, and rail lines, while operating funding is used to provide the service, such as operator salaries and fuel.
Farebox revenues: Revenue obtained from passenger fares.
26
Farebox recovery ratio: The percentage of total operating revenues to operating costs that passengers pay through fares. Most transit systems in the United States have farebox recovery ratios between 25% and 35%.
Transit subsidies: In the United States, the most common form of taxation for transit is the sales tax. Many states also offer some portion of gas tax revenues to transit. Property taxes, which are a more common form of transit subsidy in Canada, support public transportation in some states. Income and payroll taxes are rare instances, but provide important support to transit agencies in cities like New York City and Portland.
Federal transit support: At the federal level, a segment of the federal gasoline tax is used to support the programs of the Federal Transit Administration (FTA). The FTA supports transit development through such programs as the New Starts Program, which provides funding for new rapid transit projects and the rehabilitation of existing lines such as the Job Access and Reverse Commutes (JARC) program, which provides funding to assist the poor with accessing jobs in underserved communities, and operating subsidies to transit agencies in areas with populations less than 200,000, and directly to urbanized areas for populations at or above 200,000.
State transit support: Most states provide some support for transit, even though the recession in recent years has caused the support to diminish.
Local transit support: In recent years, most increases in public transit funding support have come at the local level. Almost all of these increases have come in the form of higher sales taxes approved by voters, and the vast majority of increases on the ballot have been approved by voters.
High quality public transit can provide various economical, social and environmental benefits, including direct user benefits and various indirect and external benefits. Residents of communities with high quality transit tend to own fewer motor vehicles, drive less, and spend less on transportation than they would
27
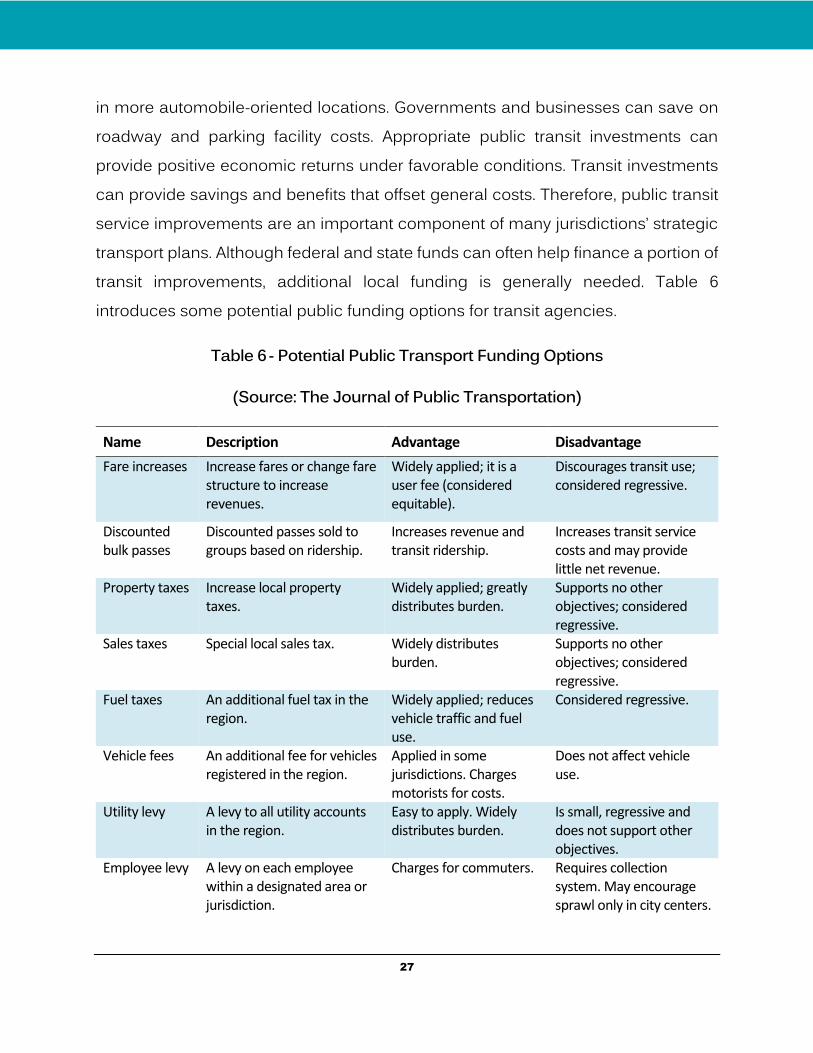
in more automobile-oriented locations. Governments and businesses can save on roadway and parking facility costs. Appropriate public transit investments can provide positive economic returns under favorable conditions. Transit investments can provide savings and benefits that offset general costs. Therefore, public transit service improvements are an important component of many jurisdictions’ strategic transport plans. Although federal and state funds can often help finance a portion of transit improvements, additional local funding is generally needed. Table 6 introduces some potential public funding options for transit agencies.
Table 6 - Potential Public Transport Funding Options
(Source: The Journal of Public Transportation)
Name Description Advantage Disadvantage
Fare increases Increase fares or change fare structure to increase revenues.
Widely applied; it is a user fee (considered equitable).
Discourages transit use; considered regressive.
Discounted bulk passes
Discounted passes sold to groups based on ridership.
Increases revenue and transit ridership.
Increases transit service costs and may provide little net revenue.
Property taxes Increase local property taxes.
Widely applied; greatly distributes burden.
Supports no other objectives; considered regressive.
Sales taxes Special local sales tax. Widely distributes burden.
Supports no other objectives; considered regressive.
Fuel taxes An additional fuel tax in the region.
Widely applied; reduces vehicle traffic and fuel use.
Considered regressive.
Vehicle fees An additional fee for vehicles registered in the region.
Applied in some jurisdictions. Charges motorists for costs.
Does not affect vehicle use.
Utility levy A levy to all utility accounts in the region.
Easy to apply. Widely distributes burden.
Is small, regressive and does not support other objectives.
Employee levy A levy on each employee within a designated area or jurisdiction.
Charges for commuters. Requires collection system. May encourage sprawl only in city centers.
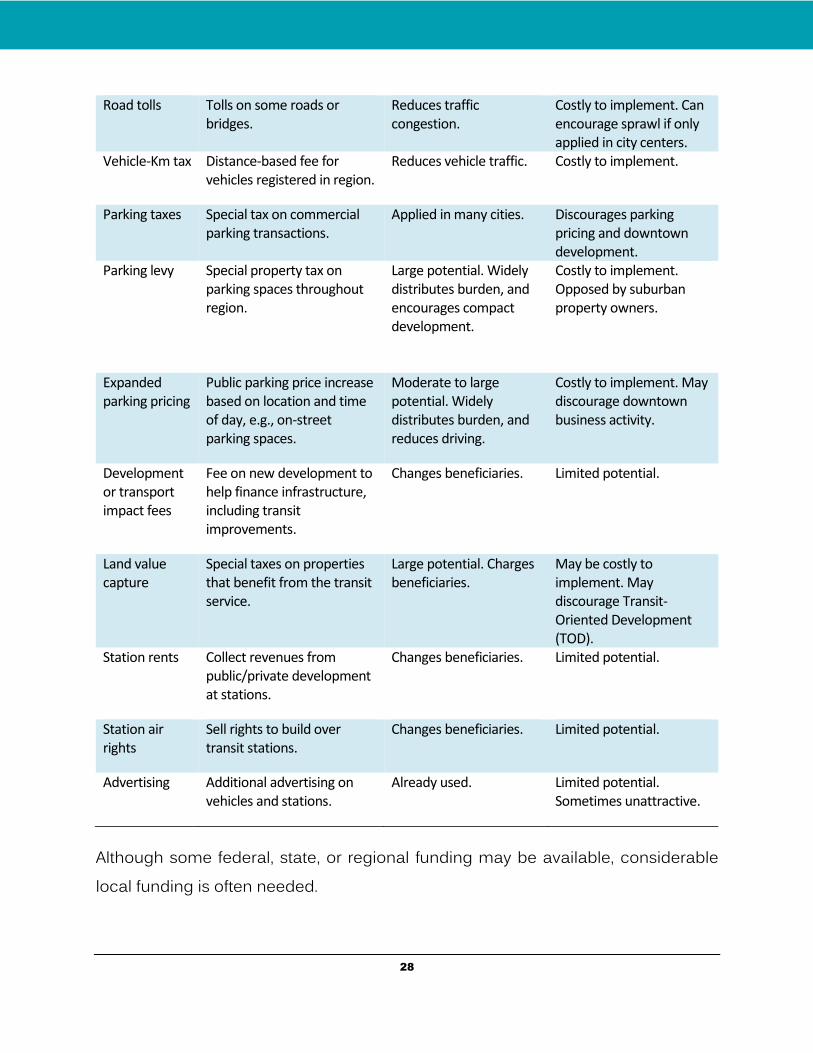
28
Road tolls Tolls on some roads or bridges.
Reduces traffic congestion.
Costly to implement. Can encourage sprawl if only applied in city centers.
Vehicle-Km tax Distance-based fee for vehicles registered in region.
Reduces vehicle traffic. Costly to implement.
Parking taxes Special tax on commercial parking transactions.
Applied in many cities. Discourages parking pricing and downtown development.
Parking levy Special property tax on parking spaces throughout region.
Large potential. Widely distributes burden, and encourages compact development.
Costly to implement. Opposed by suburban property owners.
Expanded parking pricing
Public parking price increase based on location and time of day, e.g., on-street parking spaces.
Moderate to large potential. Widely distributes burden, and reduces driving.
Costly to implement. May discourage downtown business activity.
Development or transport impact fees
Fee on new development to help finance infrastructure, including transit improvements.
Changes beneficiaries. Limited potential.
Land value capture
Special taxes on properties that benefit from the transit service.
Large potential. Charges beneficiaries.
May be costly to implement. May discourage Transit-Oriented Development (TOD).
Station rents Collect revenues from public/private development at stations.
Changes beneficiaries. Limited potential.
Station air rights
Sell rights to build over transit stations.
Changes beneficiaries. Limited potential.
Advertising Additional advertising on vehicles and stations.
Already used. Limited potential. Sometimes unattractive.
Although some federal, state, or regional funding may be available, considerable local funding is often needed.
29
External Forces Affecting Planning
External factors are outside influences that can impact an organization. Various external factors can affect the ability of a transit agency to achieve its strategic goals and objectives. These external factors might include competition, or social, legal and technological changes, as well as economic and political influences. Running a transit system would be relatively easy if the directors, managers, and staff only had to concentrate on running the agency. They could focus on internal decisions, such as determining routes, timetables, and operating buses. However, because of the external factors, the agency may need to address issues that can affect the original strategic goals and objectives. Therefore, planners need to fully understand these elements in order to effectively assist the agency in this process.
Many of these external changes may be completely outside the control of the agency, such as new legislation. For instance, Title VI of the Civil Rights Act requires that services are provided in an equitable manner and that changes do not have a disparate impact on minorities and low-income populations. Examples of external forces that are out of the transit agency’s control include gasoline prices, road construction, and even natural disasters like hurricanes, tropical storms, floods, tornadoes, or earthquakes.
30
C. The Service Planning Process
A service plan may be defined as a short-range operational plan. It involves changes in where, when, and how services run in response to changing factors like land use, travel patterns, and resources.
Service Goals:
To provide a network of quality transit services for citizens and tourists.
To measure the service delivered by the transit agency within the existing budget.
To promote a positive alternative to auto travel by encouraging choice riders to use transit, which in turn will help reduce traffic congestion, air pollution, and energy consumption.
To provide adequate service for the elderly, young, people with disabilities, and low-income populations.
To run buses in a safe, clean, and in a convenient way.
The bus system should provide the best possible service to all citizens in the midst of an agency’s budget constraints. Future service plans must consider the amount, type, and cost of services.
The fixed-route bus service should recognize the travel needs of the citizens in the service area. Planners should place emphasis on providing bus service to key activity areas such as employment, shopping, medical, and education, with consideration of the following elements:
A transit network with routes and stops consistent with current demands.
A convenient schedule that riders can easily understand.
31
A reliable transit service.
Coordinated transfer opportunities.
Effective integration with other public transportation systems like BRT or LRT.
Amenities at station and stops.
Reasonable fares.
Park-and-ride and parking facilities, when appropriate.
Service standards and Performance Measures
The service standards of public transit systems can include specific goals, objectives, or policies usually developed by planning departments to help evaluate and measure the transit service provided by the agency. The standards can include many areas, covering all parameters of a transit system. In general, they can be broadly classified into six types:
Classification of systems
Service availability
Travel time and capacity
Service delivery
Vehicle standards
Service equity
Most transit agencies use service standards. For instance, a survey directed by the Florida Department of Transportation (FDOT) found that almost 58% of transit agencies declared they had guidelines for various types of service. There are many
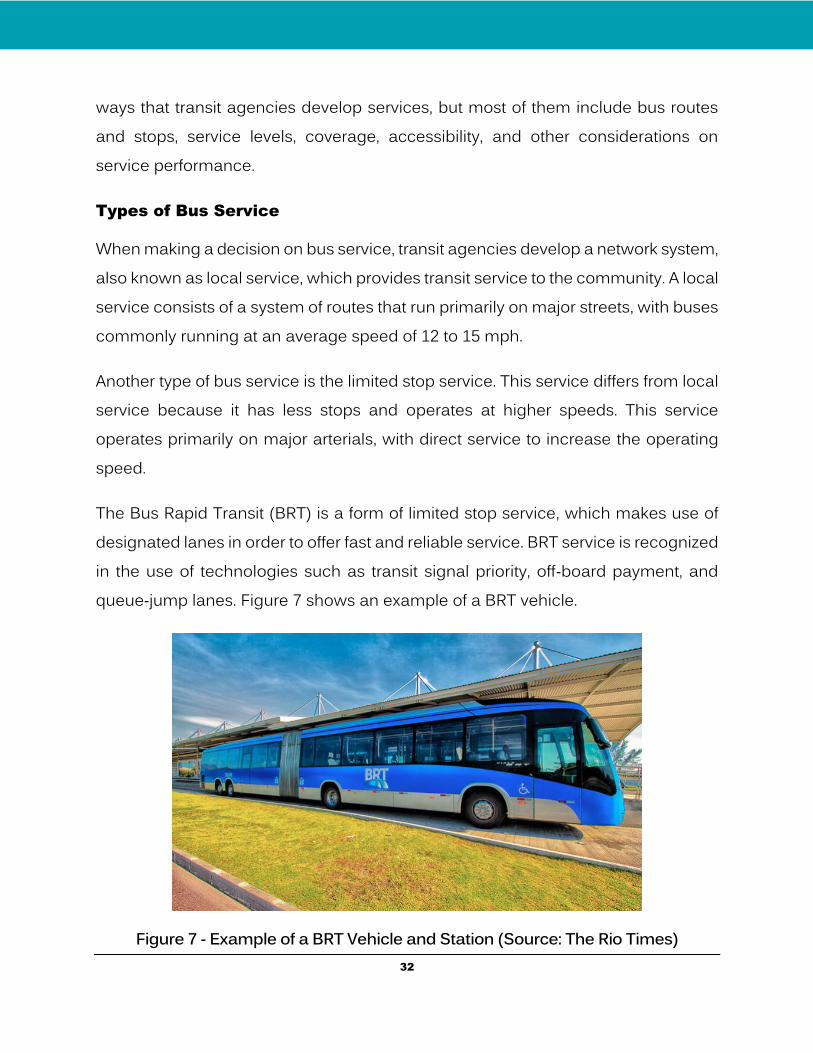
32
ways that transit agencies develop services, but most of them include bus routes and stops, service levels, coverage, accessibility, and other considerations on service performance.
Types of Bus Service
When making a decision on bus service, transit agencies develop a network system, also known as local service, which provides transit service to the community. A local service consists of a system of routes that run primarily on major streets, with buses commonly running at an average speed of 12 to 15 mph.
Another type of bus service is the limited stop service. This service differs from local service because it has less stops and operates at higher speeds. This service operates primarily on major arterials, with direct service to increase the operating speed.
The Bus Rapid Transit (BRT) is a form of limited stop service, which makes use of designated lanes in order to offer fast and reliable service. BRT service is recognized in the use of technologies such as transit signal priority, off‐board payment, and queue‐jump lanes. Figure 7 shows an example of a BRT vehicle.
Figure 7 - Example of a BRT Vehicle and Station (Source: The Rio Times)
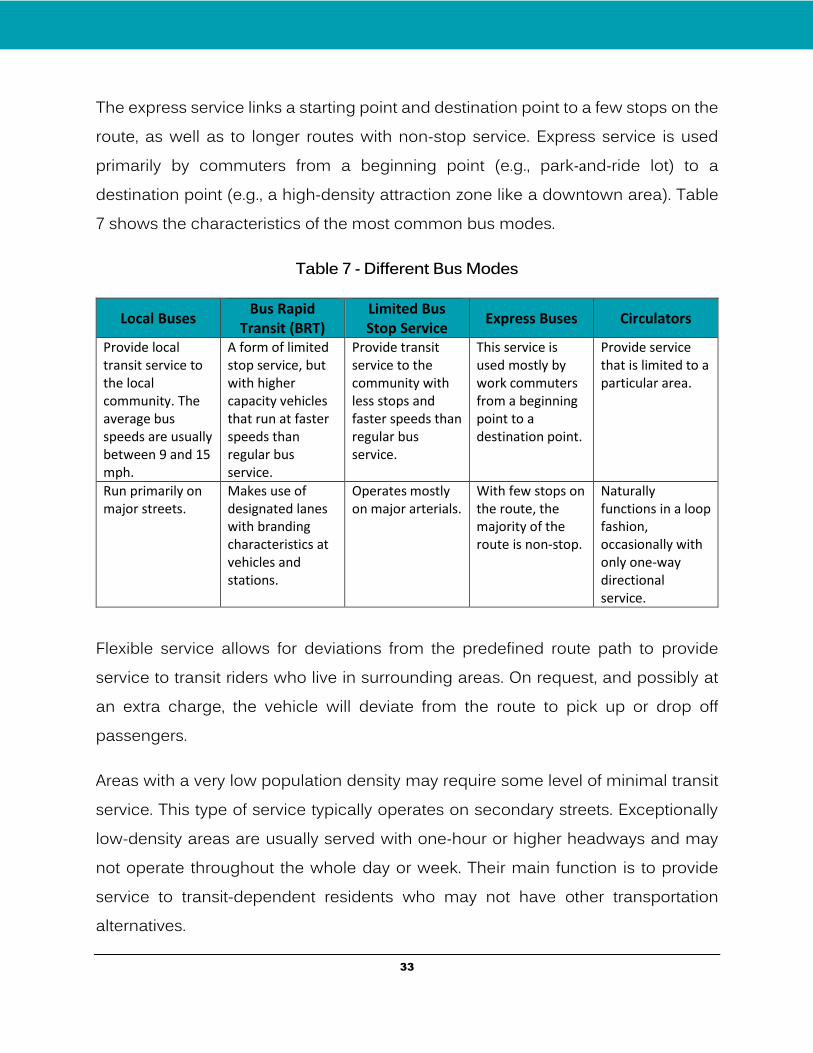
33
The express service links a starting point and destination point to a few stops on the route, as well as to longer routes with non-stop service. Express service is used primarily by commuters from a beginning point (e.g., park‐and‐ride lot) to a destination point (e.g., a high-density attraction zone like a downtown area). Table 7 shows the characteristics of the most common bus modes.
Table 7 - Different Bus Modes
Local Buses Bus Rapid
Transit (BRT) Limited Bus Stop Service
Express Buses Circulators
Provide local transit service to the local community. The average bus speeds are usually between 9 and 15 mph.
A form of limited stop service, but with higher capacity vehicles that run at faster speeds than regular bus service.
Provide transit service to the community with less stops and faster speeds than regular bus service.
This service is used mostly by work commuters from a beginning point to a destination point.
Provide service that is limited to a particular area.
Run primarily on major streets.
Makes use of designated lanes with branding characteristics at vehicles and stations.
Operates mostly on major arterials.
With few stops on the route, the majority of the route is non-stop.
Naturally functions in a loop fashion, occasionally with only one‐way directional service.
Flexible service allows for deviations from the predefined route path to provide service to transit riders who live in surrounding areas. On request, and possibly at an extra charge, the vehicle will deviate from the route to pick up or drop off passengers.
Areas with a very low population density may require some level of minimal transit service. This type of service typically operates on secondary streets. Exceptionally low-density areas are usually served with one‐hour or higher headways and may not operate throughout the whole day or week. Their main function is to provide service to transit-dependent residents who may not have other transportation alternatives.
34
Cities or municipalities often offer another type of service called a “community‐
based service.” This type of service is designed to serve a specific local community and targets transit-dependent populations such as seniors or persons with disabilities who are unable to use regular fixed-route transit.
Student‐based transportation is another type of service. Services operated by universities and educational institutions usually provide a high level of service with fewer stops, conventional routes, and at specific times of the day.
Another way to classify routes in a system is based on the route design. According to the TCRP Synthesis 10, 48% of systems set different criteria based on this classification. The most common classifications for the routes are radial, cross‐
town, circulator, feeder/shuttles, and regional routes.
Radial routes function largely along arterial streets. Radial routes characteristically serve the Central Business District (CBD) or metropolitan core and are considered the center of the transit network. These routes are characterized by regular stops, shorter trips for those traveling to the core and longer for those who do not, and relatively slow average bus speeds.
Cross‐town routes or grid-like routes are non‐radial in nature and do not serve the CBD directly. Cross‐town routes are used to link chief activity centers with through routing or serve high-density corridors outside the CBD. They normally overlap radial lines and should be coordinated to provide practical transfer networks. The circulator provides service that is limited to a particular area, normally downtown or residential zones. Circulators join main activity centers and allow travelers to transfer to different routes to gain access to the rest of the network. They naturally function in a loop fashion, occasionally with only one‐way directional service.
35
Feeder routes or shuttle routes provide service that caters to the high frequency of premium service routes in the system. Routing is generally as direct as possible to maximize traveler convenience.
Routes can also be classified by time of day. Transit systems frequently provide varying levels of service during peak periods and non‐peak periods, and evenings and weekends. Therefore, transit systems may have different standards based on these time periods.
The peak period service, which often persists for about three hours in the morning and three hours in the afternoon and evening, provides a better level of service for travelers. Non‐peak service refers to the hours of service between peak periods. The night service covers beyond normal transit operating times, and may also have a modified route structure.
Service availability measures a commuter’s ability to access and use transit. Standards for service availability include:
Service area characteristics
Service coverage
Route layout and design
Stop location and spacing
Service area characteristics include demographic and socioeconomic information that show the propensity to use transit. The establishment of standards in these areas is crucial so that transit systems can provide the most adequate level of service necessary to serve a particular area.
Demographic data from the U.S. Census Bureau is the most regularly used data source for service area characteristics. Population density signifies the number of
36
people living per square mile and is the most common measure used by agencies to gauge possible usage of the system. Information on population density, employment, or travel to work can be obtained from the “American Community Survey of the U.S. Census” (see Figure 8).
Minimum levels of development should exist before giving consideration to providing service. Transit service can be considered in residential zones with enough density and destinations with sufficient activity such as employment centers, shopping malls, and recreational areas. The development of service needs to consider socioeconomic data to assess the demand for transit service. Persons with no auto ownership have the propensity to ride transit more often than those who can choose to drive. This group of the population is referred to as “captive” riders, as opposed to “choice” riders who have other transportation alternatives.
Figure 8 - American Community Survey
37
Service Coverage
Service coverage measures the level of the defined area served by transit. Service coverage is commonly determined by a percentage of the population that live within a quarter mile of a bus stop. A quarter of a mile is the accepted distance that a passenger is willing to walk to a bus stop to use transit service. AC Transit, which provides service to the Alameda‐Contra Costa Transit District in California, uses the following criteria as walking distance to a transit stop:
20,000 persons/square mile or higher – a quarter-mile walking distance
10,000 - 20,000 persons/square mile – a quarter to half a mile
5,000 - 10,000 persons/square mile – a half mile to a three-quarter mile
0 - 5,000 extremely low density – one mile or greater
The route design within the network system can have an impact on service accessibility. One concern is the spacing between routes, which is measured by the average distance among parallel routes. Parallel routes operating nearer than a half mile of each other can result in splitting the demand for transit service. In zones categorized by low demand, this can result in a number of routes competing for the same commuters. Therefore, a trade‐off is needed to balance between the walking distance and the frequency of the service provided in these areas. Factors affecting route spacing include the geographical conditions, roadway layout, population density, and activity centers.
Service directness refers to the degree of which a route deviates from the shortest path of the route, from beginning to end. Service directness has an opposing relationship to service coverage. A route that deviates provides greater coverage than a less direct route, while a more direct route provides less coverage. Agencies
38
often provide criteria for service directness, so that routes operate as directly as possible to minimize travel time.
Roadways can affect the layout and design of routes. Narrow and winding residential streets are not conducive to large bus operation. Some systems use standards that specify the type of streets where transit can safely operate.
Service equity refers to the reasonable supply of services for all groups, in particular, service for diverse populations such as minorities and low-income. The FTA requires transit service policies and standards for five specific items: vehicle load, vehicle assignment, vehicle headway, distribution of transit amenities, and transit access. Local transit providers may develop and operate their own additional standards. Table 8 presents the different transit networks.
Stop location and spacing is another side of service distribution. The location of bus stops has been one of the more debated issues within the transit industry, as there is no consensus on which is better, far‐side or near‐side stops. Mid‐block stops are considered less than optimal, but they may be the best choice under certain circumstances.
Bus bays or turnouts are also considered when designing the location of stops. Off‐street turnouts allow buses to pull out of the traffic stream. Bus bays should not be placed at locations where there are sight distance problems. They can be an option for stops situated near major trip generators or transfer points where a bus is likely to have an extended stop or layover time. At bus stops with high activity (passenger boarding and alighting), bus bays can help reduce traffic congestion, as opposed to stopping in a through lane. However, too many stops in bus bays can slow down a bus, as it must wait for a gap in traffic to merge back onto the roadway and continue in service.
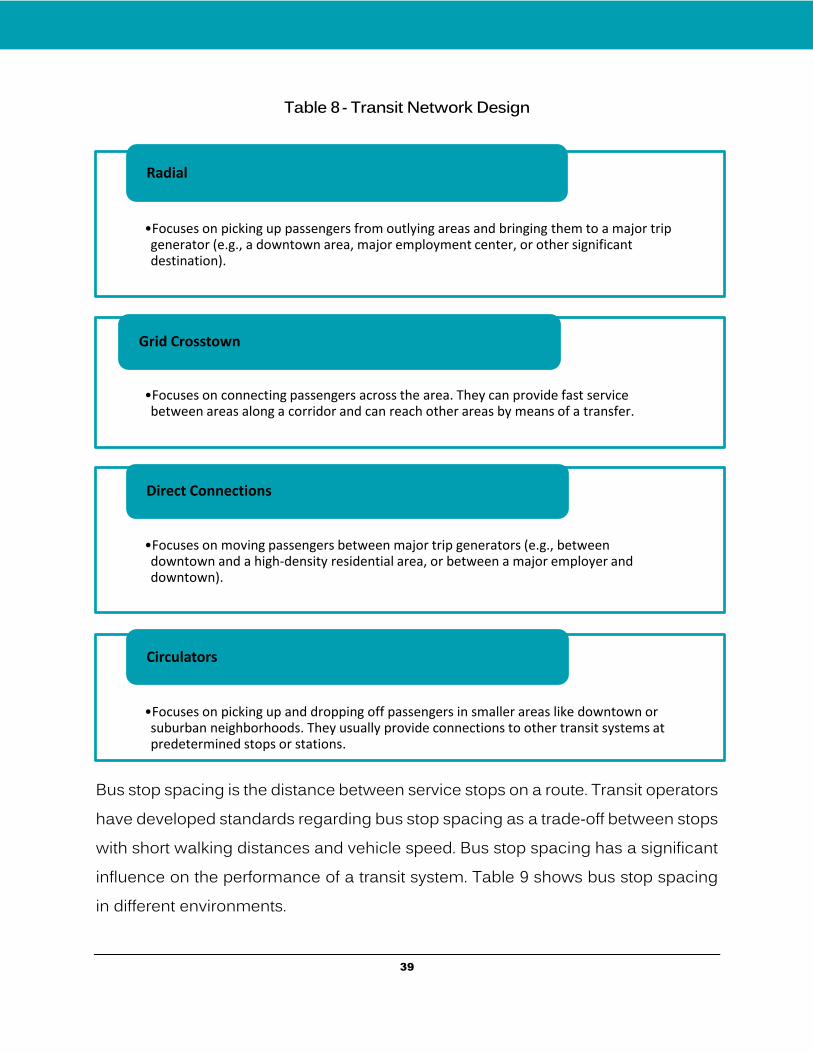
39
Table 8 - Transit Network Design
Bus stop spacing is the distance between service stops on a route. Transit operators have developed standards regarding bus stop spacing as a trade‐off between stops with short walking distances and vehicle speed. Bus stop spacing has a significant influence on the performance of a transit system. Table 9 shows bus stop spacing in different environments.
•Focuses on picking up passengers from outlying areas and bringing them to a major trip generator (e.g., a downtown area, major employment center, or other significant destination).
Radial
•Focuses on connecting passengers across the area. They can provide fast service between areas along a corridor and can reach other areas by means of a transfer.
Grid Crosstown
•Focuses on moving passengers between major trip generators (e.g., between downtown and a high-density residential area, or between a major employer and downtown).
Direct Connections
•Focuses on picking up and dropping off passengers in smaller areas like downtown or suburban neighborhoods. They usually provide connections to other transit systems at predetermined stops or stations.
Circulators
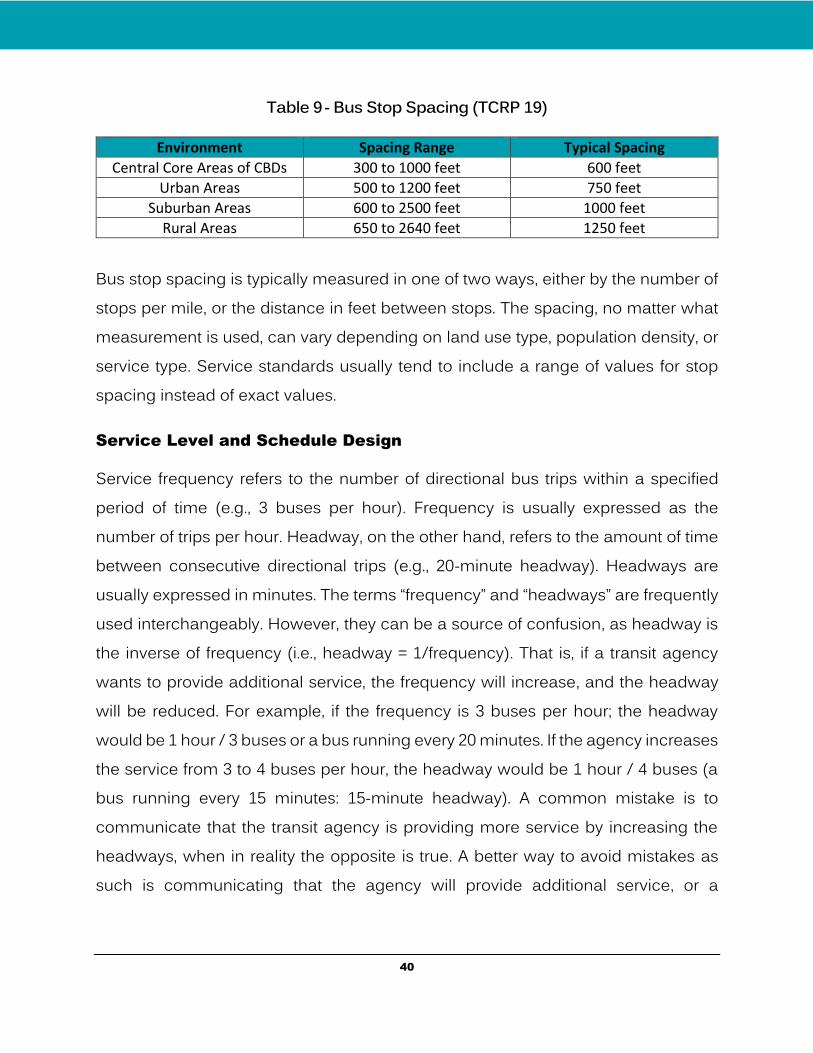
40
Table 9 - Bus Stop Spacing (TCRP 19)
Environment Spacing Range Typical Spacing
Central Core Areas of CBDs 300 to 1000 feet 600 feet
Urban Areas 500 to 1200 feet 750 feet
Suburban Areas 600 to 2500 feet 1000 feet
Rural Areas 650 to 2640 feet 1250 feet
Bus stop spacing is typically measured in one of two ways, either by the number of stops per mile, or the distance in feet between stops. The spacing, no matter what measurement is used, can vary depending on land use type, population density, or service type. Service standards usually tend to include a range of values for stop spacing instead of exact values.
Service Level and Schedule Design
Service frequency refers to the number of directional bus trips within a specified period of time (e.g., 3 buses per hour). Frequency is usually expressed as the number of trips per hour. Headway, on the other hand, refers to the amount of time between consecutive directional trips (e.g., 20-minute headway). Headways are usually expressed in minutes. The terms “frequency” and “headways” are frequently used interchangeably. However, they can be a source of confusion, as headway is the inverse of frequency (i.e., headway = 1/frequency). That is, if a transit agency wants to provide additional service, the frequency will increase, and the headway will be reduced. For example, if the frequency is 3 buses per hour; the headway would be 1 hour / 3 buses or a bus running every 20 minutes. If the agency increases the service from 3 to 4 buses per hour, the headway would be 1 hour / 4 buses (a bus running every 15 minutes: 15-minute headway). A common mistake is to communicate that the transit agency is providing more service by increasing the headways, when in reality the opposite is true. A better way to avoid mistakes as such is communicating that the agency will provide additional service, or a
41
particular route will be running more frequently. The planner can advise that the agency is reducing the headways to provide better service.
When dealing with headways, there are three different types to consider:
Headways based on policy
Headways based on demand
Headways based on the clock-face
Policy headways are normally the maximum headways to be used, as defined by the transit system policy, and usually vary by time of day or day of the week. They are typically used when passenger loads do not to conform to loading standards. Time of day is a major factor used in determining headways. A common practice is to add more service during peak hours and reduce service during off‐peak hours. An example of policy headways can be 30 minutes during peak hours and one hour during off‐peak hours. Headways for night service and Saturdays and Sundays usually match the off‐peak headways or can be greater (less service).
Some sources state that a 30-minute peak headway is the maximum headway that should be established to provide an adequate level of service in a dense urban area. Headways greater than 30 minutes are generally not acceptable from the perspective of the passenger and are insufficient to develop a solid, consistent base of ridership. Base, peak, and weekend service should not exceed one-hour headways.
Policy service levels are usually a compromise between economic efficiency and the functionality of the transit agency. Services that cannot meet the policy headways based on the minimum number of passengers per hour or other standards should be identified as candidates for service modifications or marketing for promoting the service. These service changes may include providing service
42
with longer headways if no other feasible alternative exists. Policy headways can also be established by the type of service. Bus Rapid Transit will typically have shorter headways, while neighborhood‐based circulators tend to have longer headways.
Demand‐based headways are based on passenger demand. This is used to provide the best possible service to passengers based on bus loading standards. Ridership overcapacity on a route is a sign that either bigger transit vehicles are needed, or a demand‐based headway should be implemented to provide better service.
Clock‐face headways refer to setting headways, so that they can run on consistent intervals (e.g., every hour). For instance, buses arrive at stops or stations at a given point of the clock-face (e.g., 7:30, 8:30, 9:30, etc.). Clock‐face headways make it easier for passengers to remember the arrival times of buses at particular stops, as times repeat during a time period or throughout the day.
Loading standards are created to ensure acceptable commuter loads on transit vehicles. Commuter loading limits have a direct link to headways. If buses are overloaded, then additional service may be warranted, resulting in shorter headways. Another alternative to increasing capacity is to operate larger buses. The load factor is an indicator of the extent of probable overcrowding or the need for additional vehicles. It is expressed as a percent of the seating capacity of a vehicle at the maximum load point of a specific route. By setting minimum and maximum load factors for different services by service periods, the operating level of service or headway should be determined by usage. Load factor calculations are the most important variables used to assess how buses can be effectively and efficiently allocated among different bus routes. If the load factor is set above 100 percent, it means that the system’s policies permit a reasonable amount of standees. Another loading standard that may be used is a course of action that limits the number of standees or does not allow for standees.
43
Span of service is another degree that relates to the capacity of the organization. Span of service is the number of hours and days that the service functions, i.e., the start of the service day until the end of the service day, as well as weekdays and weekends. The duration of service will usually vary by route depending on service type, the market area, and route performance. Generally, high‐performing routes will have longer service spans, and weekday spans of service are longer than weekends. Express routes generally operate on a time‐specific span of service, often during peak period service only. To determine span of service for new routes, the characteristics of the target market should be examined and compared with existing services.
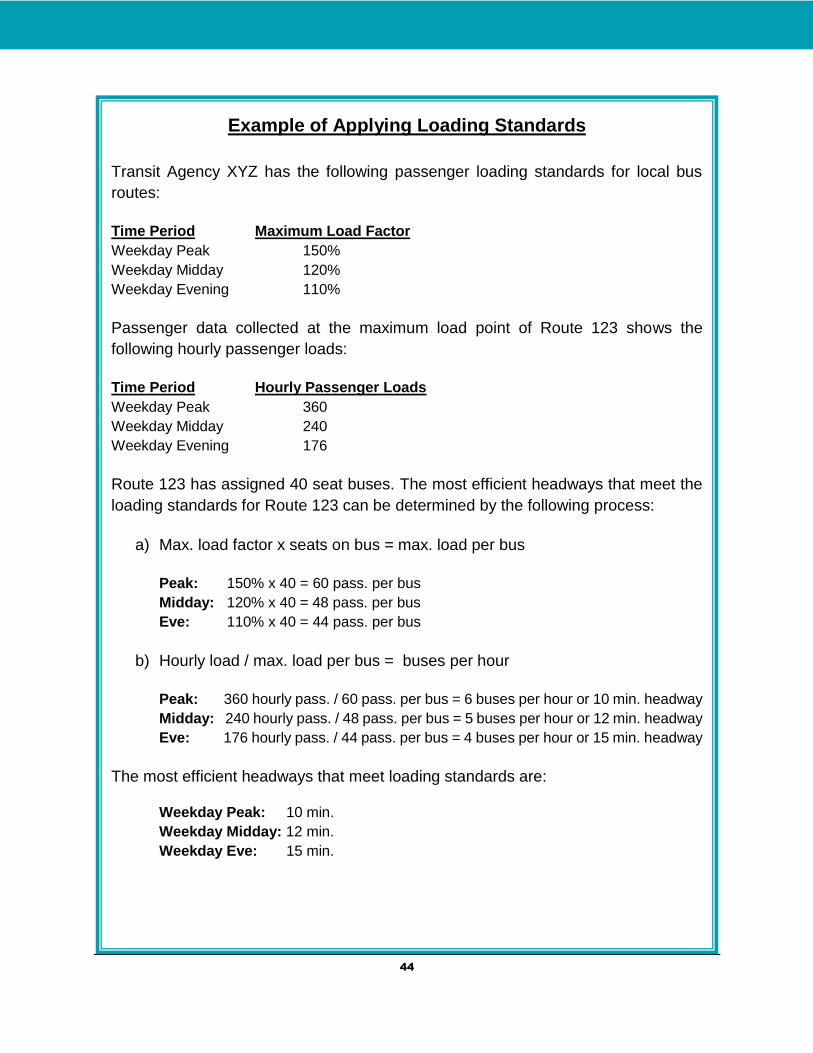
44
Example of Applying Loading Standards
Transit Agency XYZ has the following passenger loading standards for local bus
routes:
Time Period Maximum Load Factor
Weekday Peak 150%
Weekday Midday 120%
Weekday Evening 110%
Passenger data collected at the maximum load point of Route 123 shows the
following hourly passenger loads:
Time Period Hourly Passenger Loads
Weekday Peak 360
Weekday Midday 240
Weekday Evening 176
Route 123 has assigned 40 seat buses. The most efficient headways that meet the
loading standards for Route 123 can be determined by the following process:
a) Max. load factor x seats on bus = max. load per bus
Peak: 150% x 40 = 60 pass. per bus
Midday: 120% x 40 = 48 pass. per bus
Eve: 110% x 40 = 44 pass. per bus
b) Hourly load / max. load per bus = buses per hour
Peak: 360 hourly pass. / 60 pass. per bus = 6 buses per hour or 10 min. headway
Midday: 240 hourly pass. / 48 pass. per bus = 5 buses per hour or 12 min. headway
Eve: 176 hourly pass. / 44 pass. per bus = 4 buses per hour or 15 min. headway
The most efficient headways that meet loading standards are:
Weekday Peak: 10 min.
Weekday Midday: 12 min.
Weekday Eve: 15 min.
45
Service Delivery
Service delivery standards have a direct impact on how customers perceive the service. The standards include such aspects as:
On-time performance
Customer service
Safety issues
On‐time performance in the transit business is defined as the percentage of trips that arrive/depart within a definite time-frame at a specific published timepoint. A mainstream of systems define a route as being “late” if it departs more than five minutes after the scheduled time. Most systems explain a route as “early” if it is one minute early, while a few systems allow for a bus to arrive earlier without making allowance for an earlier arrival.
Customer service standards are restricted to what can easily be measured by the transit agency. One of the performance methods most commonly used to measure the level of customer service is the number of complaints. Other customer service concerns, such as commuter safety and satisfaction, are determined through market research. Organizations are not likely to have precise criteria governing these qualitative aspects.
Safety issues are a new area in which an organization is willing to maintain performance measures and set standards. Safety performance measures are generally kept on a system level and may not be accessible at the route level. Service planning has a small role to play in safety‐related criterion. The utmost common safety measure monitored by transit organizations is the number of accidents per miles operated.
46
Vehicle standards consider various service planning characteristics of operating transit vehicles, such as:
Assignment of vehicles
Utilization and efficiency
Reliability and condition
Assignment of vehicles is fairly straightforward. In a medium‐size or larger system, standard‐size buses (35‐40 feet) are allotted to most routes, while smaller buses (27‐
30 feet) are used in areas with a smaller number of commuters or within a zone service. Articulated buses (60 feet) are appropriate for higher volume express services. Systems that use automatic passenger counters (APC) for a portion of their fleet will have procedures in place on how to assign APC‐equipped buses in order to cover all routes within a definite time period.
The utilization and efficiency of vehicles are usually tracked in a performance observing program. Although organizations may set distinct standards, the most common vehicle measures are revenue miles/per vehicle and revenue hours/per vehicle.
The reliability and condition of vehicles are normally measured by vehicle miles between road calls or the percentage of scheduled service not in operation. An example of a vehicle dependability standard is more than 4,000 vehicle miles between road calls.
Service standards provide a framework for guiding decisions on the services that will best serve the customers’ varied travel needs while allowing the agency to remain within its budgetary limits. The service standards provide a framework for a consistent and fair evaluation of both existing and proposed services. Because markets, customer expectations, and the agency’s resources change over time,
47
service standards are evolutionary by nature. The agency must be responsive to these changes in order to retain current customers and achieve and sustain ridership growth. The agency must also be able to continuously evaluate the service and make necessary adjustments based on the available budget and resources. As shown in Table 11, service standards assist in the agency’s decision-making process.
The service standards document also contains guidelines for stop spacing, the distribution of facilities and customer amenities at bus stops, calculating service costs, and the public participation process. In support of the annual budget process, an annual service budget proposal is developed that proposes major, moderate, and minor service changes in accordance with the agency’s goals for the following year. Service proposals can only be implemented if supported by the budget. Table 10 describes some key transit service standards, and Table 11 explains major, moderate, and minor changes in service.
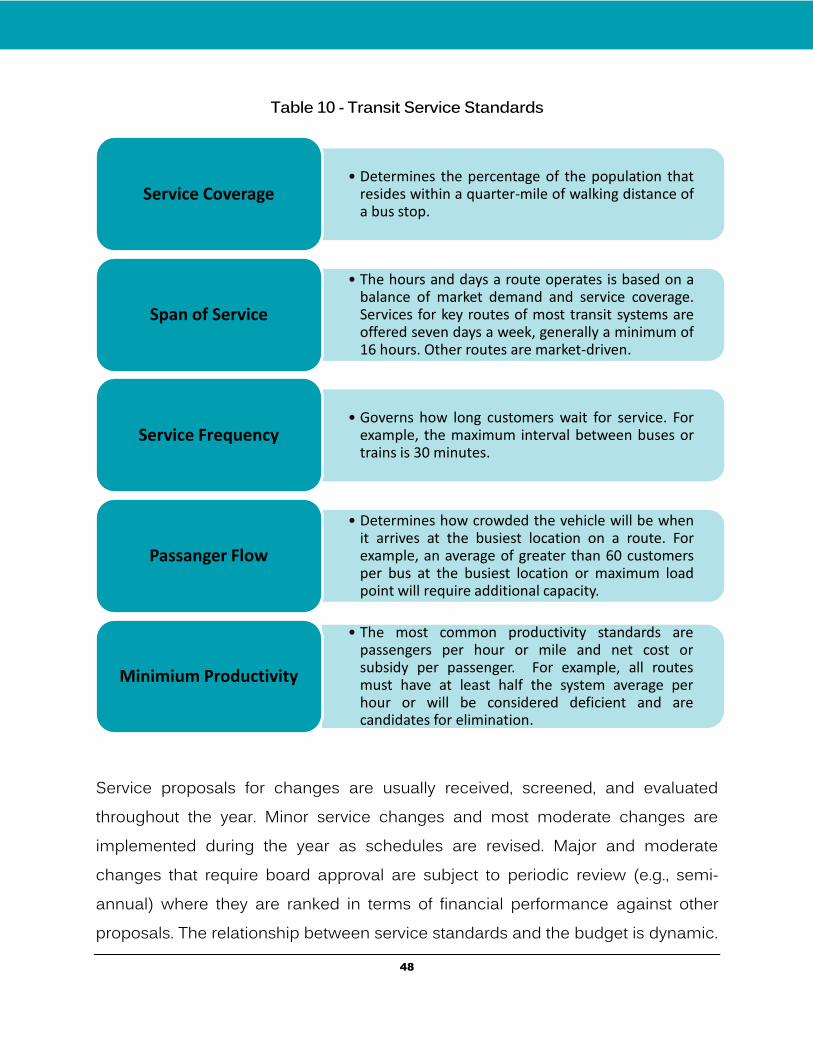
48
Table 10 - Transit Service Standards
Service proposals for changes are usually received, screened, and evaluated throughout the year. Minor service changes and most moderate changes are implemented during the year as schedules are revised. Major and moderate changes that require board approval are subject to periodic review (e.g., semi-annual) where they are ranked in terms of financial performance against other proposals. The relationship between service standards and the budget is dynamic.
• Determines the percentage of the population thatresides within a quarter-mile of walking distance ofa bus stop.
Service Coverage
• The hours and days a route operates is based on abalance of market demand and service coverage.Services for key routes of most transit systems areoffered seven days a week, generally a minimum of16 hours. Other routes are market-driven.
Span of Service
• Governs how long customers wait for service. Forexample, the maximum interval between buses ortrains is 30 minutes.
Service Frequency
• Determines how crowded the vehicle will be whenit arrives at the busiest location on a route. Forexample, an average of greater than 60 customersper bus at the busiest location or maximum loadpoint will require additional capacity.
Passanger Flow
• The most common productivity standards arepassengers per hour or mile and net cost orsubsidy per passenger. For example, all routesmust have at least half the system average perhour or will be considered deficient and arecandidates for elimination.
Minimium Productivity
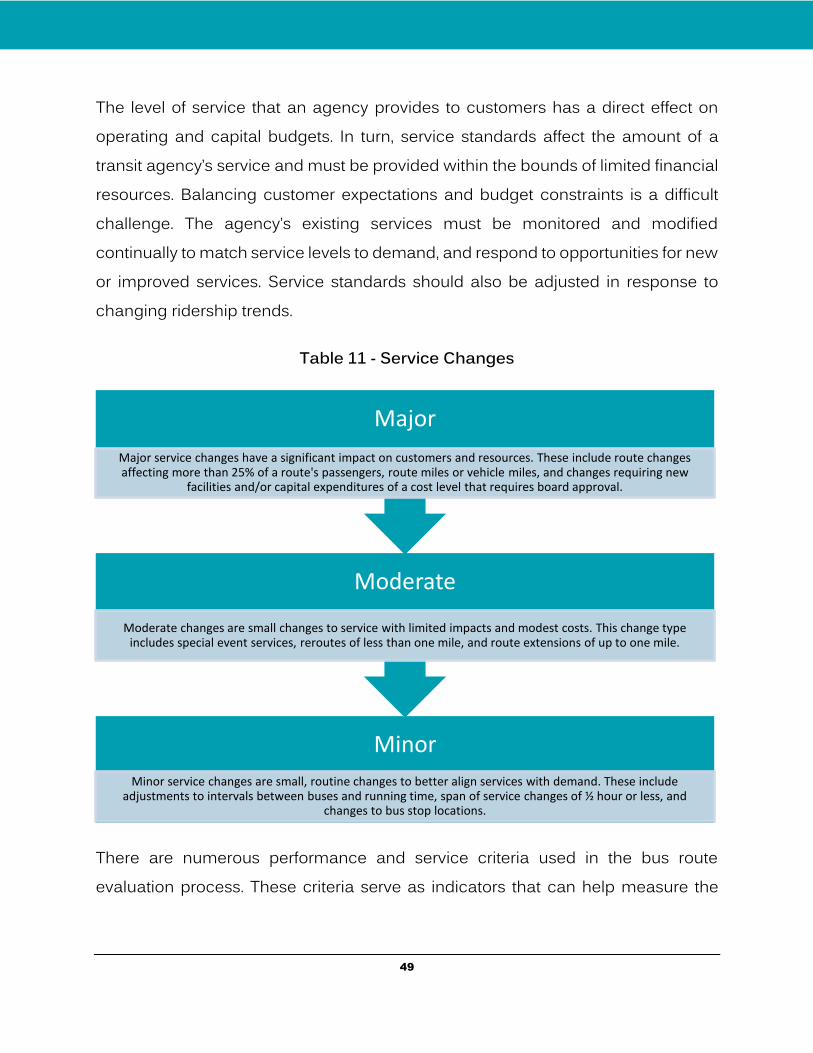
49
The level of service that an agency provides to customers has a direct effect on operating and capital budgets. In turn, service standards affect the amount of a transit agency’s service and must be provided within the bounds of limited financial resources. Balancing customer expectations and budget constraints is a difficult challenge. The agency’s existing services must be monitored and modified continually to match service levels to demand, and respond to opportunities for new or improved services. Service standards should also be adjusted in response to changing ridership trends.
Table 11 - Service Changes
There are numerous performance and service criteria used in the bus route evaluation process. These criteria serve as indicators that can help measure the
Minor
Minor service changes are small, routine changes to better align services with demand. These include adjustments to intervals between buses and running time, span of service changes of ½ hour or less, and
changes to bus stop locations.
Moderate
Moderate changes are small changes to service with limited impacts and modest costs. This change type includes special event services, reroutes of less than one mile, and route extensions of up to one mile.
Major
Major service changes have a significant impact on customers and resources. These include route changes affecting more than 25% of a route's passengers, route miles or vehicle miles, and changes requiring new
facilities and/or capital expenditures of a cost level that requires board approval.
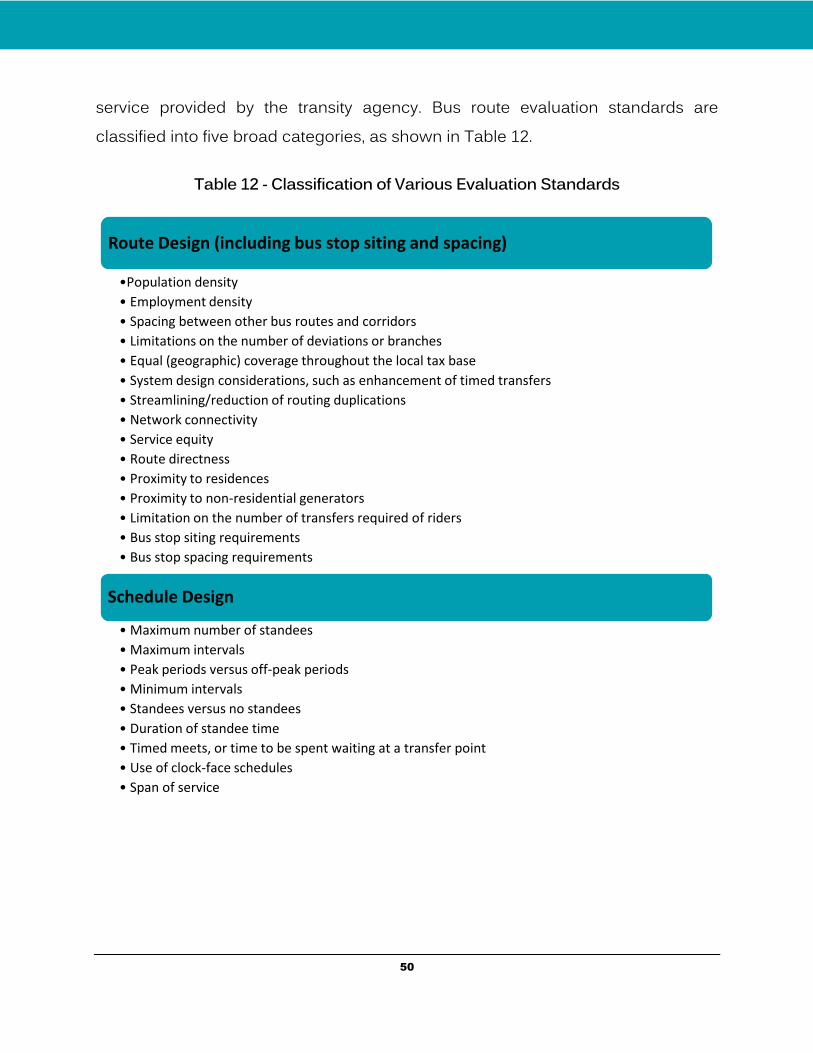
50
service provided by the transity agency. Bus route evaluation standards are classified into five broad categories, as shown in Table 12.
Table 12 - Classification of Various Evaluation Standards
Route Design (including bus stop siting and spacing)
•Population density
• Employment density
• Spacing between other bus routes and corridors
• Limitations on the number of deviations or branches
• Equal (geographic) coverage throughout the local tax base
• System design considerations, such as enhancement of timed transfers
• Streamlining/reduction of routing duplications
• Network connectivity
• Service equity
• Route directness
• Proximity to residences
• Proximity to non-residential generators
• Limitation on the number of transfers required of riders
• Bus stop siting requirements
• Bus stop spacing requirements
Schedule Design
• Maximum number of standees
• Maximum intervals
• Peak periods versus off-peak periods
• Minimum intervals
• Standees versus no standees
• Duration of standee time
• Timed meets, or time to be spent waiting at a transfer point
• Use of clock-face schedules
• Span of service
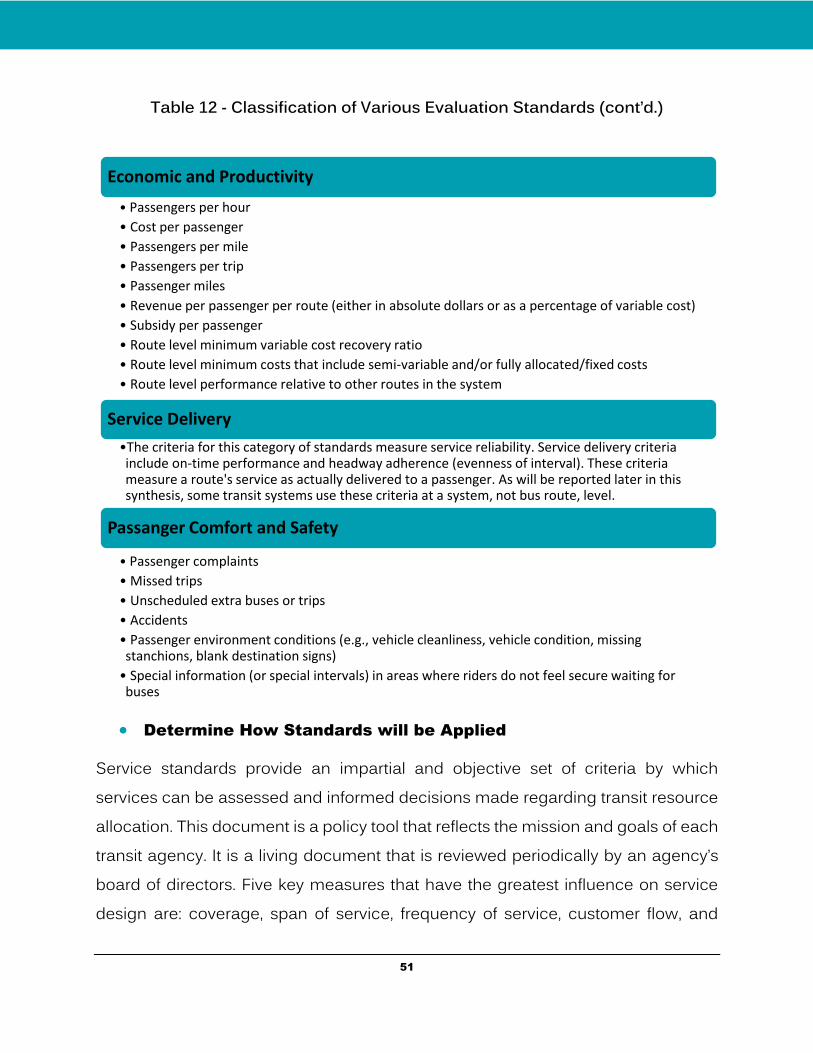
51
Table 12 - Classification of Various Evaluation Standards (cont’d.)
Determine How Standards will be Applied
Service standards provide an impartial and objective set of criteria by which services can be assessed and informed decisions made regarding transit resource allocation. This document is a policy tool that reflects the mission and goals of each transit agency. It is a living document that is reviewed periodically by an agency’s board of directors. Five key measures that have the greatest influence on service design are: coverage, span of service, frequency of service, customer flow, and
Economic and Productivity
• Passengers per hour
• Cost per passenger
• Passengers per mile
• Passengers per trip
• Passenger miles
• Revenue per passenger per route (either in absolute dollars or as a percentage of variable cost)
• Subsidy per passenger
• Route level minimum variable cost recovery ratio
• Route level minimum costs that include semi-variable and/or fully allocated/fixed costs
• Route level performance relative to other routes in the system
Service Delivery
•The criteria for this category of standards measure service reliability. Service delivery criteria include on-time performance and headway adherence (evenness of interval). These criteria measure a route's service as actually delivered to a passenger. As will be reported later in this synthesis, some transit systems use these criteria at a system, not bus route, level.
Passanger Comfort and Safety
• Passenger complaints
• Missed trips
• Unscheduled extra buses or trips
• Accidents
• Passenger environment conditions (e.g., vehicle cleanliness, vehicle condition, missing stanchions, blank destination signs)
• Special information (or special intervals) in areas where riders do not feel secure waiting for buses
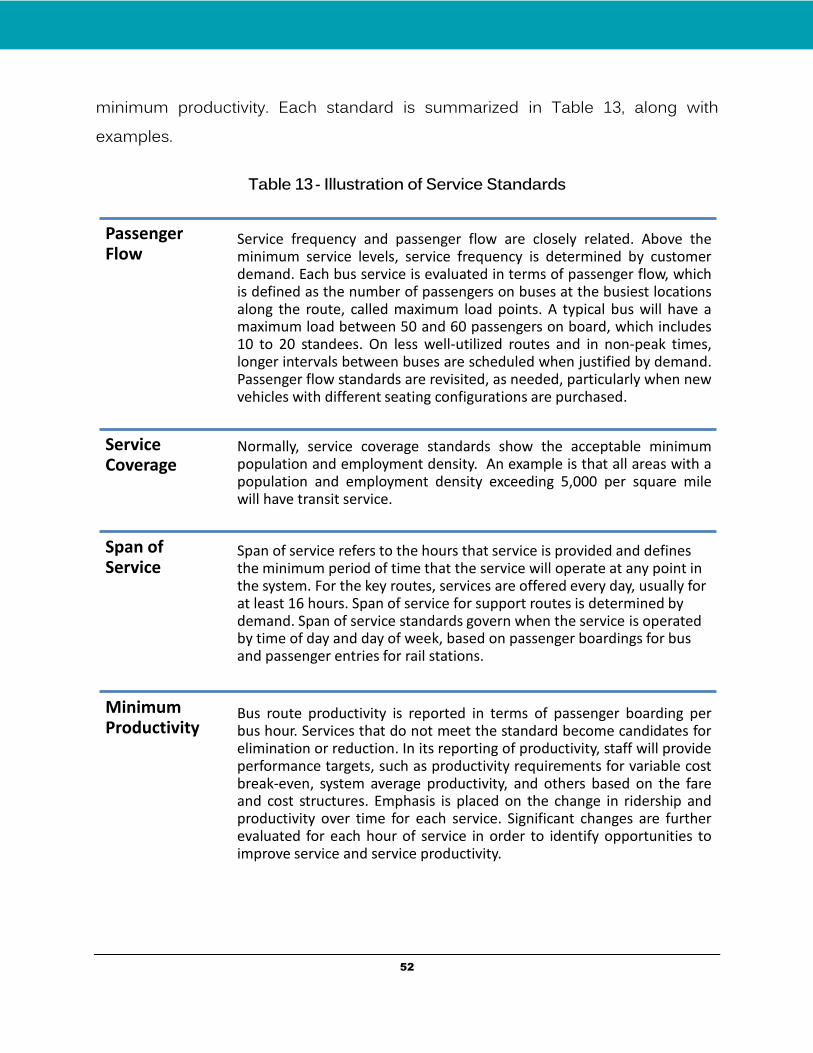
52
minimum productivity. Each standard is summarized in Table 13, along with examples.
Table 13 - Illustration of Service Standards
Passenger Flow
Service frequency and passenger flow are closely related. Above theminimum service levels, service frequency is determined by customerdemand. Each bus service is evaluated in terms of passenger flow, whichis defined as the number of passengers on buses at the busiest locationsalong the route, called maximum load points. A typical bus will have amaximum load between 50 and 60 passengers on board, which includes10 to 20 standees. On less well-utilized routes and in non-peak times,longer intervals between buses are scheduled when justified by demand.Passenger flow standards are revisited, as needed, particularly when newvehicles with different seating configurations are purchased.
Service Coverage
Normally, service coverage standards show the acceptable minimumpopulation and employment density. An example is that all areas with apopulation and employment density exceeding 5,000 per square milewill have transit service.
Span of Service
Span of service refers to the hours that service is provided and defines the minimum period of time that the service will operate at any point in the system. For the key routes, services are offered every day, usually for at least 16 hours. Span of service for support routes is determined by demand. Span of service standards govern when the service is operated by time of day and day of week, based on passenger boardings for bus and passenger entries for rail stations.
Minimum Productivity
Bus route productivity is reported in terms of passenger boarding perbus hour. Services that do not meet the standard become candidates forelimination or reduction. In its reporting of productivity, staff will provideperformance targets, such as productivity requirements for variable costbreak-even, system average productivity, and others based on the fareand cost structures. Emphasis is placed on the change in ridership andproductivity over time for each service. Significant changes are furtherevaluated for each hour of service in order to identify opportunities toimprove service and service productivity.
53
Obtain Concurrence of Stakeholders and Governing Board
Approval
The development of service standards should be open to the public, and they should be given the opportunity for input into the process. Once the standards are completed, they should be presented to the governing board for approval. This process validates the standards; the board understands that standards are the driving force for transit service decisions. Approved standards reduce political influence and provide the structure for making transit service changes.
As part of the ongoing performance review of all routes and services and consideration of service change proposals, moderate and major service changes are also brought to the board for approval. Table 14 shows some examples for each type of service changes.
Requests for service changes and new services can be proposed by anyone, including private citizens, elected officials, the agency’s employees, and employers. Requests can also be the result of ongoing monitoring and data collection. Often, the transit agency has an advisory group that meet as needed for service changes to address the following:
Identify issues, opportunities and concerns
Ensure that proposed service changes will operate reliably and safely
Identify actions that may be needed to implement changes
All proposals must be reviewed and analyzed by the planning and development staff. In order to efficiently screen, analyze, and evaluate the merits of service change proposals, the service change committee should be established. The process for evaluating and implementing service change proposals is dependent upon the magnitude of the change.
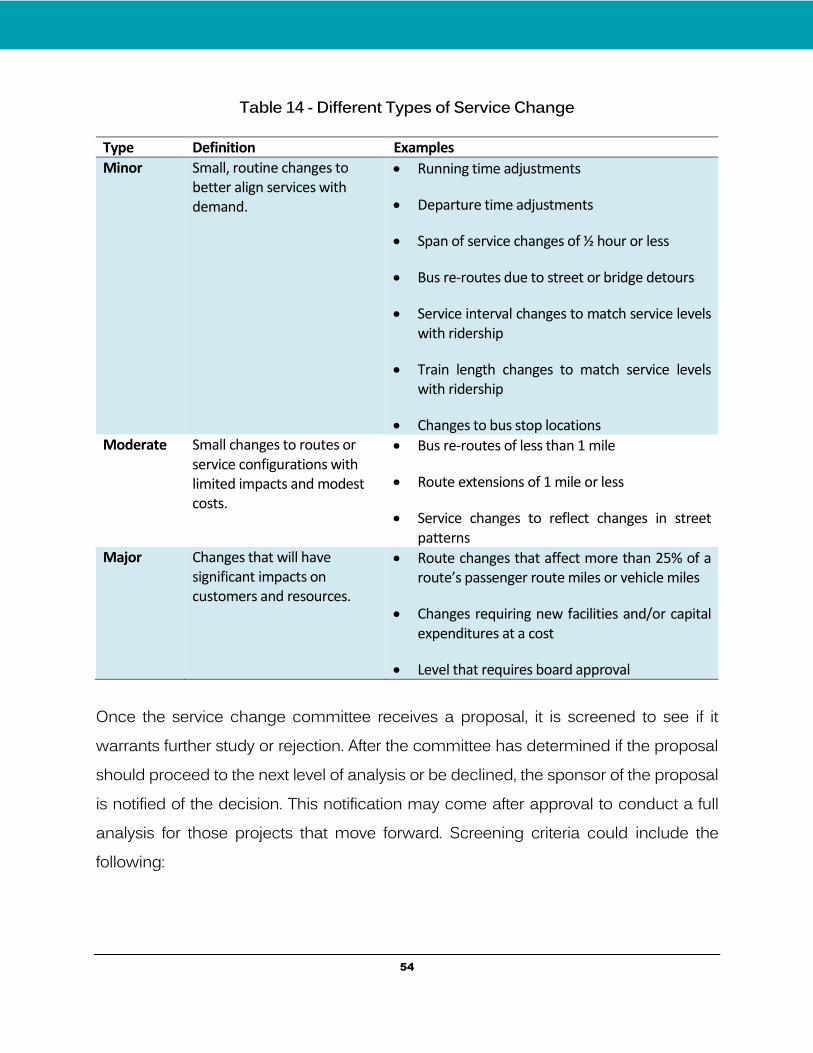
54
Table 14 - Different Types of Service Change
Type Definition Examples
Minor Small, routine changes to better align services with demand.
Running time adjustments
Departure time adjustments
Span of service changes of ½ hour or less
Bus re-routes due to street or bridge detours
Service interval changes to match service levels with ridership
Train length changes to match service levels with ridership
Changes to bus stop locations Moderate Small changes to routes or
service configurations with limited impacts and modest costs.
Bus re-routes of less than 1 mile
Route extensions of 1 mile or less
Service changes to reflect changes in street patterns
Major Changes that will have significant impacts on customers and resources.
Route changes that affect more than 25% of a route’s passenger route miles or vehicle miles
Changes requiring new facilities and/or capital expenditures at a cost
Level that requires board approval
Once the service change committee receives a proposal, it is screened to see if it warrants further study or rejection. After the committee has determined if the proposal should proceed to the next level of analysis or be declined, the sponsor of the proposal is notified of the decision. This notification may come after approval to conduct a full analysis for those projects that move forward. Screening criteria could include the following:
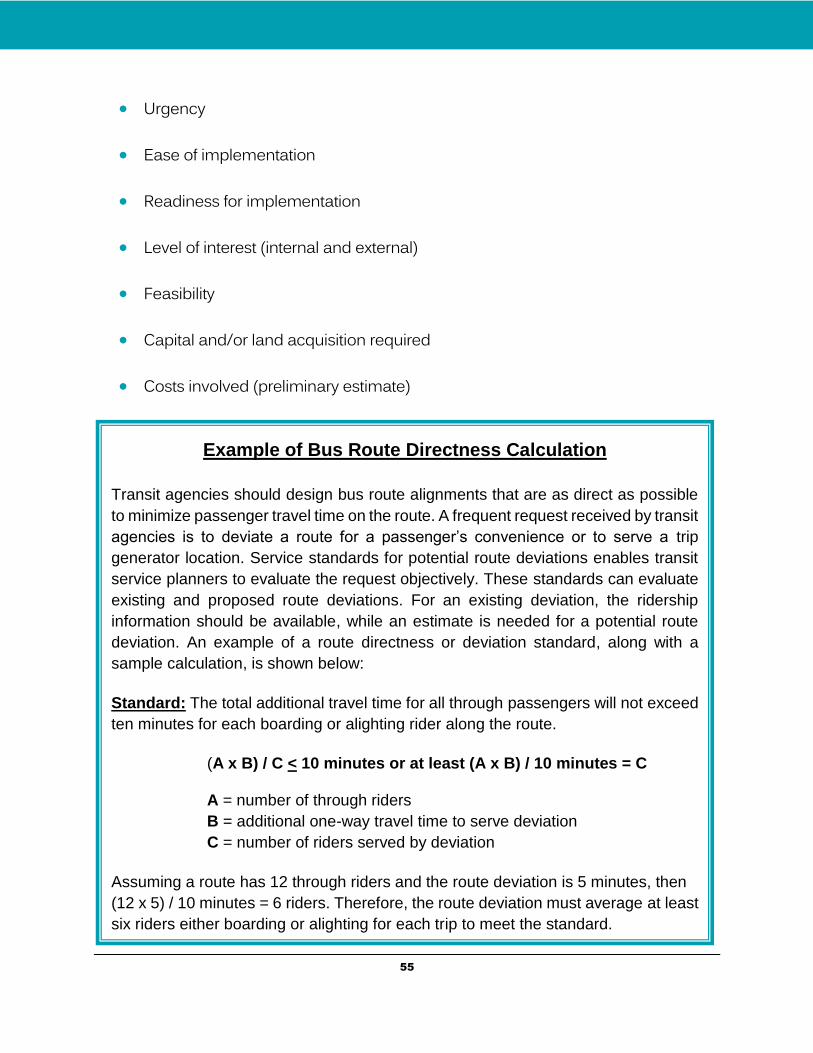
55
Urgency
Ease of implementation
Readiness for implementation
Level of interest (internal and external)
Feasibility
Capital and/or land acquisition required
Costs involved (preliminary estimate)
Example of Bus Route Directness Calculation
Transit agencies should design bus route alignments that are as direct as possible
to minimize passenger travel time on the route. A frequent request received by transit
agencies is to deviate a route for a passenger’s convenience or to serve a trip
generator location. Service standards for potential route deviations enables transit
service planners to evaluate the request objectively. These standards can evaluate
existing and proposed route deviations. For an existing deviation, the ridership
information should be available, while an estimate is needed for a potential route
deviation. An example of a route directness or deviation standard, along with a
sample calculation, is shown below:
Standard: The total additional travel time for all through passengers will not exceed
ten minutes for each boarding or alighting rider along the route.
(A x B) / C < 10 minutes or at least (A x B) / 10 minutes = C A = number of through riders
B = additional one-way travel time to serve deviation
C = number of riders served by deviation
Assuming a route has 12 through riders and the route deviation is 5 minutes, then
(12 x 5) / 10 minutes = 6 riders. Therefore, the route deviation must average at least
six riders either boarding or alighting for each trip to meet the standard.
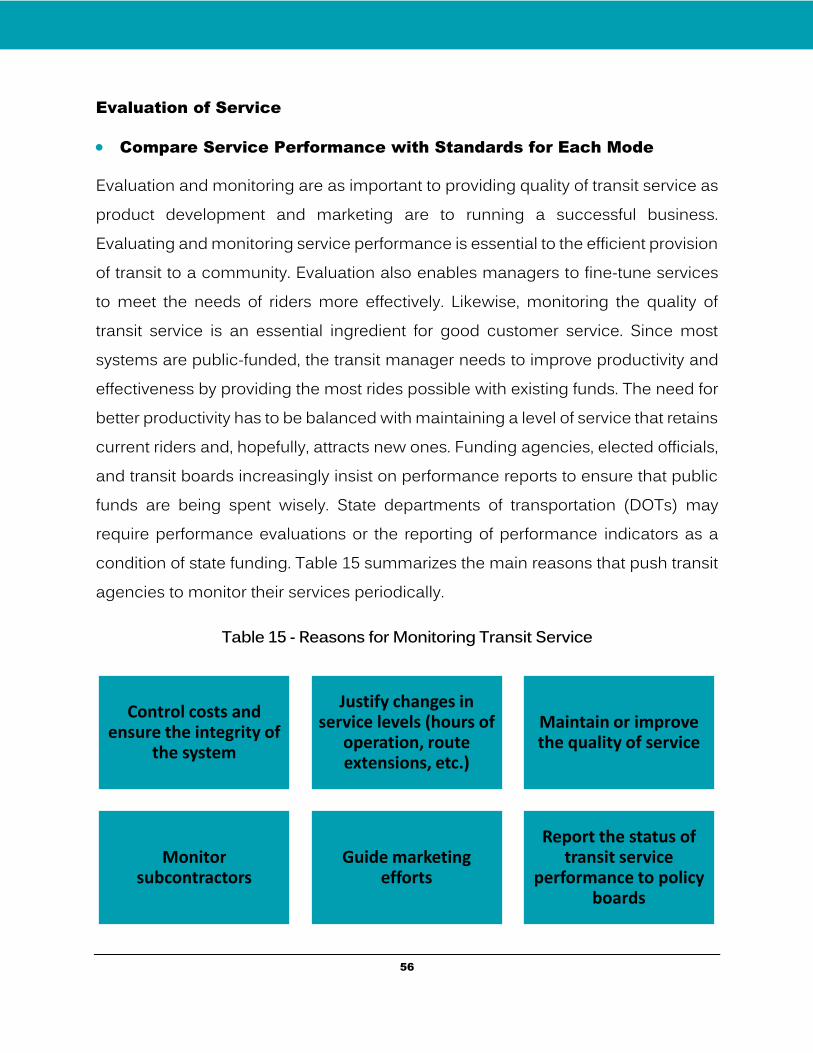
56
Evaluation of Service
Compare Service Performance with Standards for Each Mode
Evaluation and monitoring are as important to providing quality of transit service as product development and marketing are to running a successful business. Evaluating and monitoring service performance is essential to the efficient provision of transit to a community. Evaluation also enables managers to fine-tune services to meet the needs of riders more effectively. Likewise, monitoring the quality of transit service is an essential ingredient for good customer service. Since most systems are public-funded, the transit manager needs to improve productivity and effectiveness by providing the most rides possible with existing funds. The need for better productivity has to be balanced with maintaining a level of service that retains current riders and, hopefully, attracts new ones. Funding agencies, elected officials, and transit boards increasingly insist on performance reports to ensure that public funds are being spent wisely. State departments of transportation (DOTs) may require performance evaluations or the reporting of performance indicators as a condition of state funding. Table 15 summarizes the main reasons that push transit agencies to monitor their services periodically.
Table 15 - Reasons for Monitoring Transit Service
Control costs and ensure the integrity of
the system
Justify changes in service levels (hours of
operation, route extensions, etc.)
Maintain or improve the quality of service
Monitor subcontractors
Guide marketing efforts
Report the status of transit service
performance to policy boards
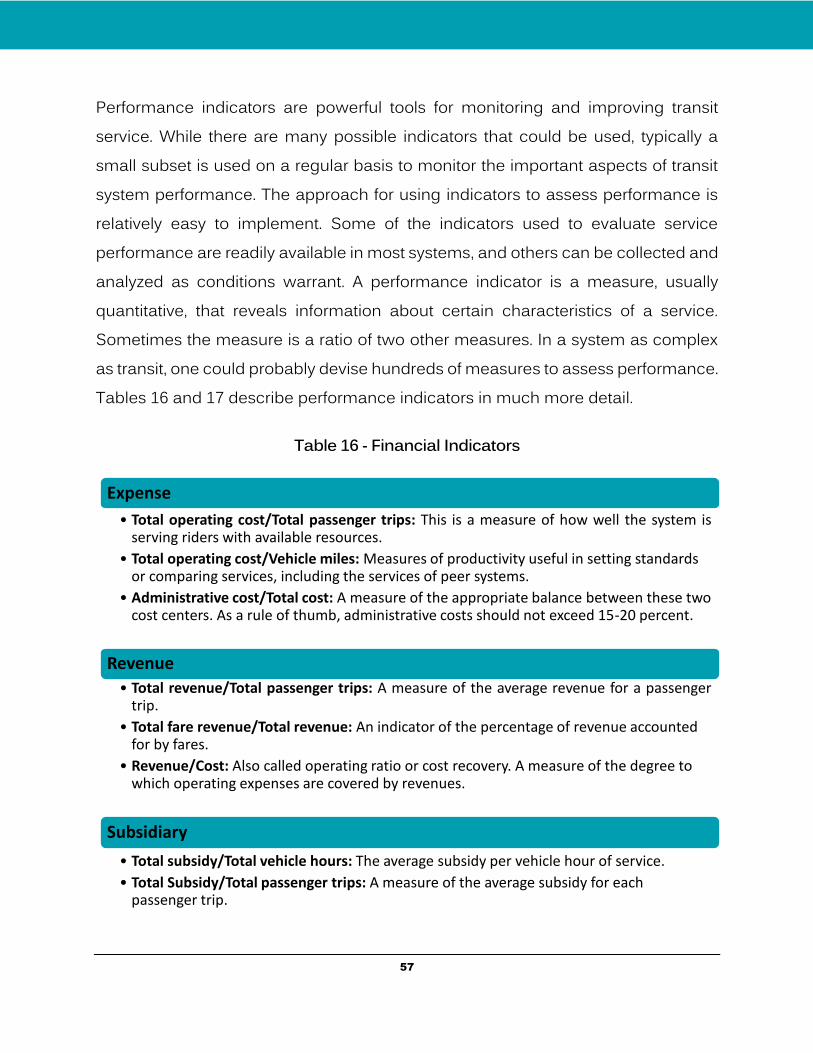
57
Performance indicators are powerful tools for monitoring and improving transit service. While there are many possible indicators that could be used, typically a small subset is used on a regular basis to monitor the important aspects of transit system performance. The approach for using indicators to assess performance is relatively easy to implement. Some of the indicators used to evaluate service performance are readily available in most systems, and others can be collected and analyzed as conditions warrant. A performance indicator is a measure, usually quantitative, that reveals information about certain characteristics of a service. Sometimes the measure is a ratio of two other measures. In a system as complex as transit, one could probably devise hundreds of measures to assess performance. Tables 16 and 17 describe performance indicators in much more detail.
Table 16 - Financial Indicators
Expense
• Total operating cost/Total passenger trips: This is a measure of how well the system isserving riders with available resources.
• Total operating cost/Vehicle miles: Measures of productivity useful in setting standards or comparing services, including the services of peer systems.
• Administrative cost/Total cost: A measure of the appropriate balance between these two cost centers. As a rule of thumb, administrative costs should not exceed 15-20 percent.
Revenue
• Total revenue/Total passenger trips: A measure of the average revenue for a passengertrip.
• Total fare revenue/Total revenue: An indicator of the percentage of revenue accounted for by fares.
• Revenue/Cost: Also called operating ratio or cost recovery. A measure of the degree to which operating expenses are covered by revenues.
Subsidiary
• Total subsidy/Total vehicle hours: The average subsidy per vehicle hour of service.
• Total Subsidy/Total passenger trips: A measure of the average subsidy for each passenger trip.
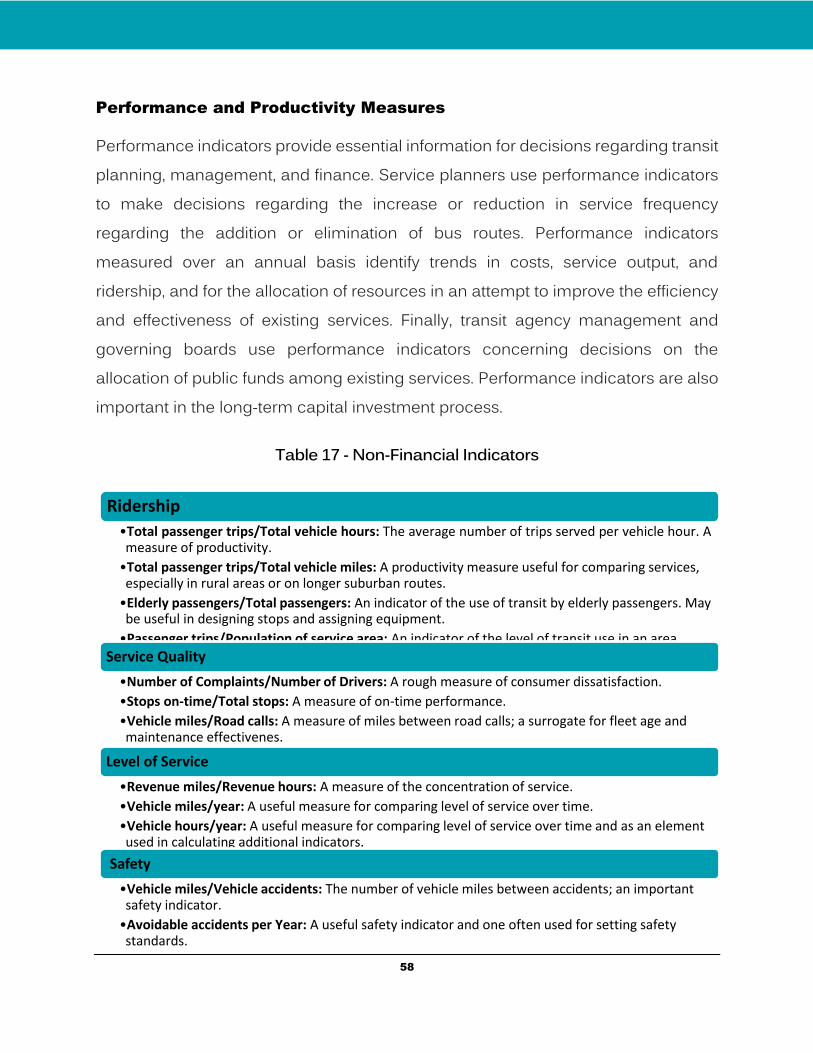
58
Performance and Productivity Measures
Performance indicators provide essential information for decisions regarding transit planning, management, and finance. Service planners use performance indicators to make decisions regarding the increase or reduction in service frequency regarding the addition or elimination of bus routes. Performance indicators measured over an annual basis identify trends in costs, service output, and ridership, and for the allocation of resources in an attempt to improve the efficiency and effectiveness of existing services. Finally, transit agency management and governing boards use performance indicators concerning decisions on the allocation of public funds among existing services. Performance indicators are also important in the long-term capital investment process.
Table 17 - Non-Financial Indicators
Ridership
•Total passenger trips/Total vehicle hours: The average number of trips served per vehicle hour. Ameasure of productivity.
•Total passenger trips/Total vehicle miles: A productivity measure useful for comparing services, especially in rural areas or on longer suburban routes.
•Elderly passengers/Total passengers: An indicator of the use of transit by elderly passengers. May be useful in designing stops and assigning equipment.
•Passenger trips/Population of service area: An indicator of the level of transit use in an area.
Service Quality
•Number of Complaints/Number of Drivers: A rough measure of consumer dissatisfaction.
•Stops on-time/Total stops: A measure of on-time performance.
•Vehicle miles/Road calls: A measure of miles between road calls; a surrogate for fleet age and maintenance effectivenes.
Level of Service
•Revenue miles/Revenue hours: A measure of the concentration of service.
•Vehicle miles/year: A useful measure for comparing level of service over time.
•Vehicle hours/year: A useful measure for comparing level of service over time and as an element used in calculating additional indicators.
Safety
•Vehicle miles/Vehicle accidents: The number of vehicle miles between accidents; an important safety indicator.
•Avoidable accidents per Year: A useful safety indicator and one often used for setting safety standards.
59
Performance indicators are usually organized into three related categories: measures of cost-efficiency, cost-effectiveness, and service effectiveness. Cost-efficiency indicators are calculated as the ratio of service inputs to service outputs, measuring the efficiency of allocation and use of resources within the organization. Cost-effectiveness indicators compare service inputs to service consumption, providing a measure of the amount of resources versus the level of transit actually used by the public. Service effectiveness indicators measure service consumption relative to service outputs, providing information about the capacity utilization of the service provided.
Service input statistics include the resources of the service, such as the number of operators, number of vehicles, service hours, or any other type of service input. An important measure is the total dollar cost of operating the service, using all types of input and reducing them to a single metric. Most transit properties measure service output in terms of revenue vehicle miles or revenue vehicle hours, while service consumption is measured most often as the number of passengers.
Cost-efficiency and service effectiveness indicators, which incorporate measures of service output, take into account the varying passenger capacities of the different sizes of buses, rail cars, and other transit vehicles. For example, directly comparing cost per bus revenue vehicle hour to cost per light rail car revenue vehicle hour does not take into account the different vehicle capacities of the two modes. Passenger capacity miles, incorporating seating capacity and an estimate of standing capacity are likely to be more useful as measures of service output. Indicators of cost-effectiveness and service effectiveness, which incorporate levels of service consumed, provide some means to consider the varying lengths of typical passenger trips on different modes. Tables 18 and 19 summarize performance measures for effectiveness and efficiency, respectively.
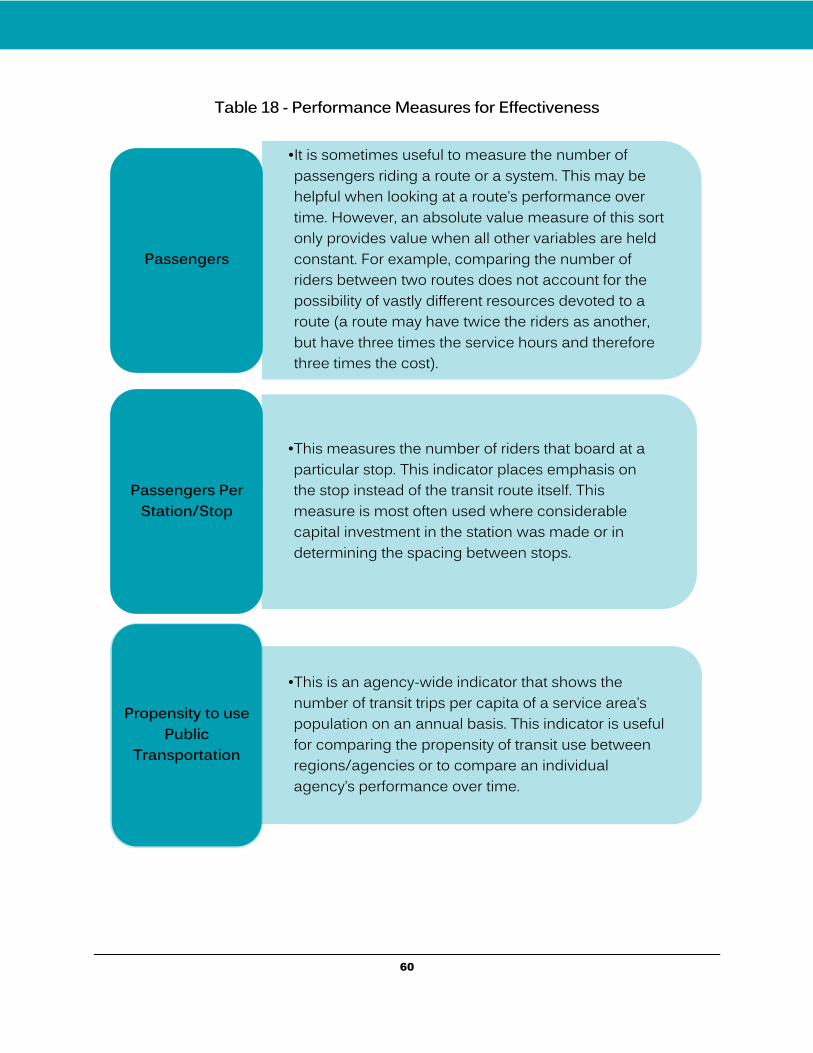
60
Table 18 - Performance Measures for Effectiveness
•It is sometimes useful to measure the number of passengers riding a route or a system. This may be helpful when looking at a route’s performance over time. However, an absolute value measure of this sort only provides value when all other variables are held constant. For example, comparing the number of riders between two routes does not account for the possibility of vastly different resources devoted to a route (a route may have twice the riders as another, but have three times the service hours and therefore three times the cost).
Passengers
•This measures the number of riders that board at a particular stop. This indicator places emphasis on the stop instead of the transit route itself. This measure is most often used where considerable capital investment in the station was made or indetermining the spacing between stops.
Passengers Per Station/Stop
•This is an agency-wide indicator that shows the number of transit trips per capita of a service area’s population on an annual basis. This indicator is useful for comparing the propensity of transit use between regions/agencies or to compare an individual agency’s performance over time.
Propensity to use Public
Transportation
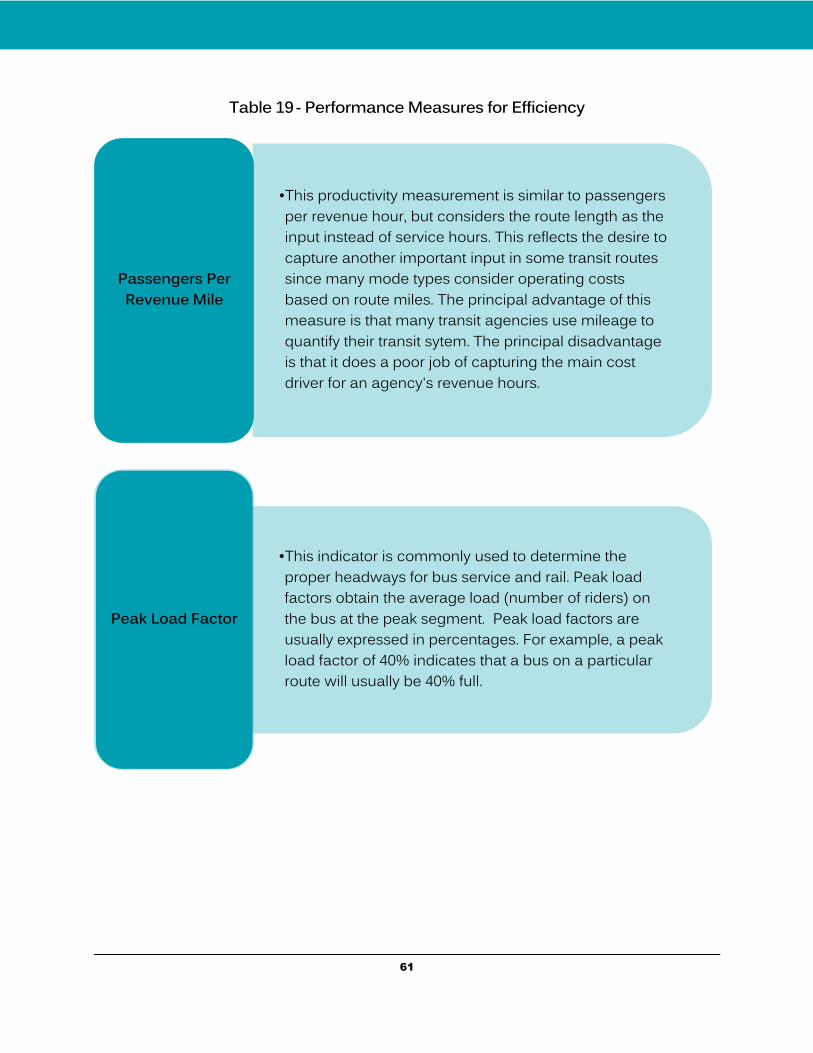
61
Table 19 - Performance Measures for Efficiency
•This productivity measurement is similar to passengers per revenue hour, but considers the route length as the input instead of service hours. This reflects the desire to capture another important input in some transit routes since many mode types consider operating costs based on route miles. The principal advantage of this measure is that many transit agencies use mileage to quantify their transit sytem. The principal disadvantage is that it does a poor job of capturing the main cost driver for an agency's revenue hours.
Passengers Per Revenue Mile
•This indicator is commonly used to determine the proper headways for bus service and rail. Peak load factors obtain the average load (number of riders) on the bus at the peak segment. Peak load factors are usually expressed in percentages. For example, a peak load factor of 40% indicates that a bus on a particular route will usually be 40% full.
Peak Load Factor
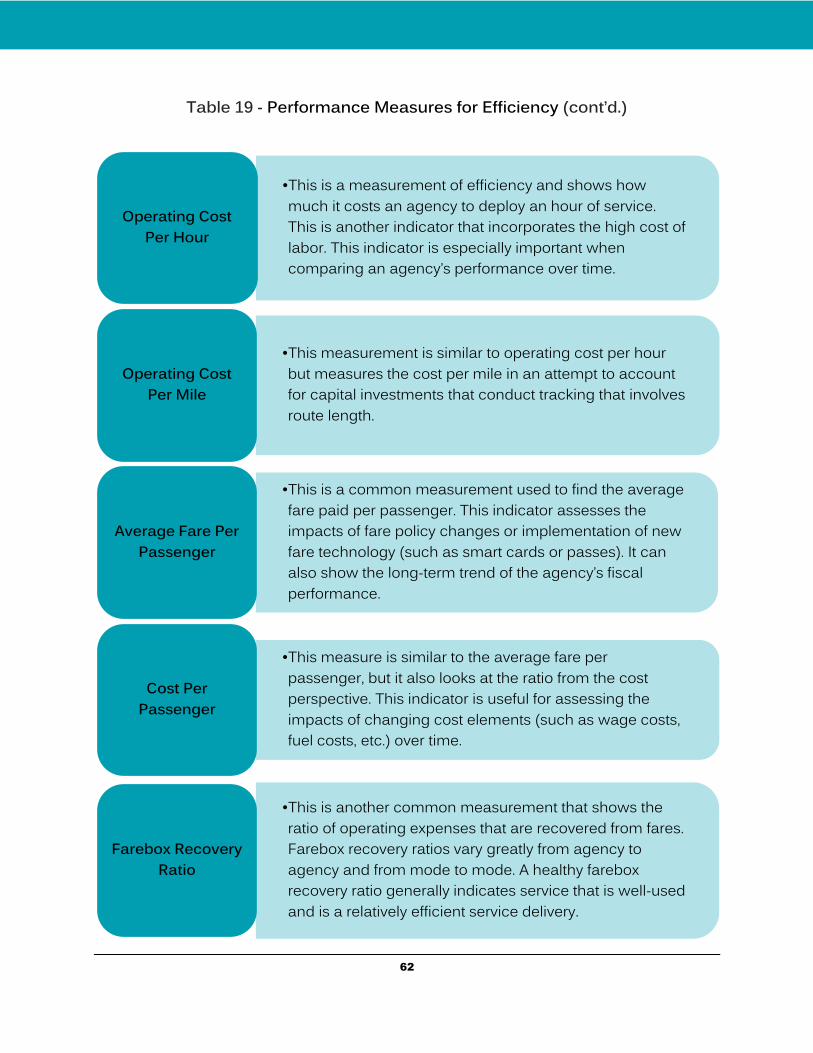
62
Table 19 - Performance Measures for Efficiency (cont’d.)
•This is a measurement of efficiency and shows how much it costs an agency to deploy an hour of service. This is another indicator that incorporates the high cost of labor. This indicator is especially important when comparing an agency’s performance over time.
Operating Cost Per Hour
•This measurement is similar to operating cost per hour but measures the cost per mile in an attempt to account for capital investments that conduct tracking that involves route length.
Operating Cost Per Mile
•This is a common measurement used to find the average fare paid per passenger. This indicator assesses the impacts of fare policy changes or implementation of new fare technology (such as smart cards or passes). It can also show the long-term trend of the agency’s fiscal performance.
Average Fare Per Passenger
•This measure is similar to the average fare per passenger, but it also looks at the ratio from the cost perspective. This indicator is useful for assessing the impacts of changing cost elements (such as wage costs, fuel costs, etc.) over time.
Cost Per Passenger
•This is another common measurement that shows the ratio of operating expenses that are recovered from fares. Farebox recovery ratios vary greatly from agency to agency and from mode to mode. A healthy farebox recovery ratio generally indicates service that is well-used and is a relatively efficient service delivery.
Farebox Recovery Ratio
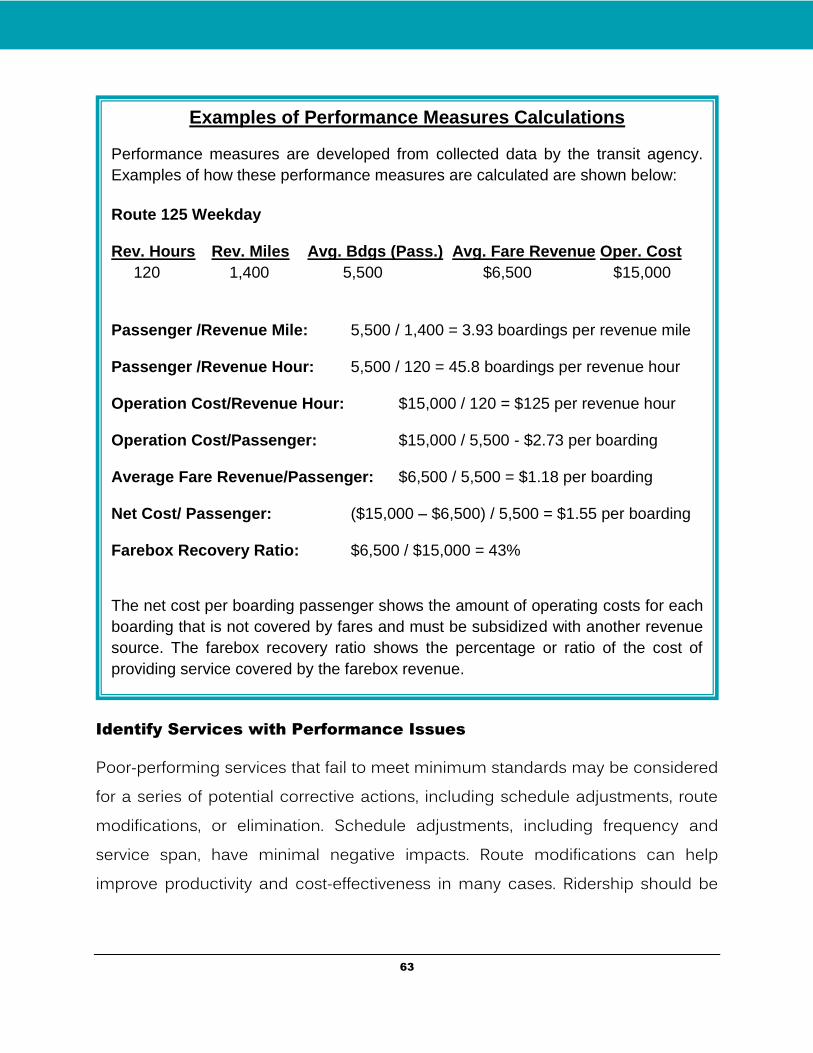
63
Identify Services with Performance Issues
Poor-performing services that fail to meet minimum standards may be considered for a series of potential corrective actions, including schedule adjustments, route modifications, or elimination. Schedule adjustments, including frequency and service span, have minimal negative impacts. Route modifications can help improve productivity and cost-effectiveness in many cases. Ridership should be
Examples of Performance Measures Calculations
Performance measures are developed from collected data by the transit agency.
Examples of how these performance measures are calculated are shown below:
Route 125 Weekday Rev. Hours Rev. Miles Avg. Bdgs (Pass.) Avg. Fare Revenue Oper. Cost
120 1,400 5,500 $6,500 $15,000
Passenger /Revenue Mile: 5,500 / 1,400 = 3.93 boardings per revenue mile Passenger /Revenue Hour: 5,500 / 120 = 45.8 boardings per revenue hour Operation Cost/Revenue Hour: $15,000 / 120 = $125 per revenue hour Operation Cost/Passenger: $15,000 / 5,500 - $2.73 per boarding Average Fare Revenue/Passenger: $6,500 / 5,500 = $1.18 per boarding Net Cost/ Passenger: ($15,000 – $6,500) / 5,500 = $1.55 per boarding Farebox Recovery Ratio: $6,500 / $15,000 = 43% The net cost per boarding passenger shows the amount of operating costs for each
boarding that is not covered by fares and must be subsidized with another revenue
source. The farebox recovery ratio shows the percentage or ratio of the cost of
providing service covered by the farebox revenue.
64
closely examined at the stop level to identify unproductive segments or service gaps. Route extensions or minor realignments may improve access to destinations.
Route consolidations or short-turns may reduce duplicative or excess service. Service elimination may be considered if ridership is consistently underperforming with a minimal likelihood for sufficient future growth. All alternative means of maintaining service should be considered before proposing elimination. Elimination does not preclude restoration of service at a later time; however, proven ridership demand must exist before such a step is considered. Service alternatives may be considered in low-density areas with moderate ridership potential. Demand-response service may carry a small passenger market more cost-effectively than a traditional fixed-route bus service. Vanpools may be a suitable alternative for feeder or connector service.
Evaluate Areas for Potential Service Expansion
In the case of existing services, the standards are used to identify underperforming lines that may be the subject of recommendations for improvement or elimination. For new services, the standards are used to develop recommendations for service refinements, modal alterations, or other potential improvements. Because the process of identifying and solving problems is continuous, the performance evaluation framework described here is also continuous, whereby the results of specific actions are further evaluated using the performance measures used to quantify the goals and objectives set for the system.
The evaluation of new service proposals will take place as proposals are received or needs are identified. Ridership and cost projections for new and altered services should be prepared whenever service changes are proposed. New services should meet minimum standards within one year. Staff may make fine-tune adjustments during this period. New services are implemented on a trial basis, with the length of the trial period determined at the time of implementation.
65
The final and most important step in the evaluation process is the corrective actions that will be taken by the manager or policy board to increase the efficiency or effectiveness of the system. This step is certainly the most challenging and creative part of the process, but it also may require difficult choices regarding the level of service offered or the resources used to provide the service. Once the corrective actions are implemented, the evaluation cycle begins again with a review of the goals, indicators, and data collection. Then, during the next review cycle, the results of the previously implemented corrective actions are evaluated using the next period's performance results, and additional corrective actions can be taken as needed.
66
D. Data Collection
Types of Data and Information
Ridership
Transit agencies want people to ride transit. As more people ride transit, public benefits increase, creating more positive impacts on communities. The agency benefits from additional fare revenue, which when spread over the total number of riders, reduces the average cost per rider.
In public transport, ridership is the number of passengers boarding a mode of the public transit system. The concept should not be confused with the loading capacity of a particular vehicle or the whole transit system. The gathered or predicted ridership data is usually used by transit planners to change a route, as well as to decide on the type of vehicle to be employed.
Transit ridership is the direct measurement of how well a transit system is operating. Transit ridership is measured by the number of boardings at each stop along each bus route or rail line. This information is collected and maintained by the agency, which is important when considering the type and amount of service to provide. Types of transit ridership information used by planners include ridership by system, route, day, specific bus trip, per hour and per bus stop.
One of the most common types of service planning concepts involves the increase of service frequencies in order to increase ridership. This type of scenario could provide a general idea of how much ridership can expect to increase with the increase of service frequencies to the routes on a system-wide level. Performance measures could include estimated annual ridership, boarding per service mile, and boarding per service hour. If boarding per service mile and boarding per service hour increase in addition to ridership, then it is a strong indication that the proposed
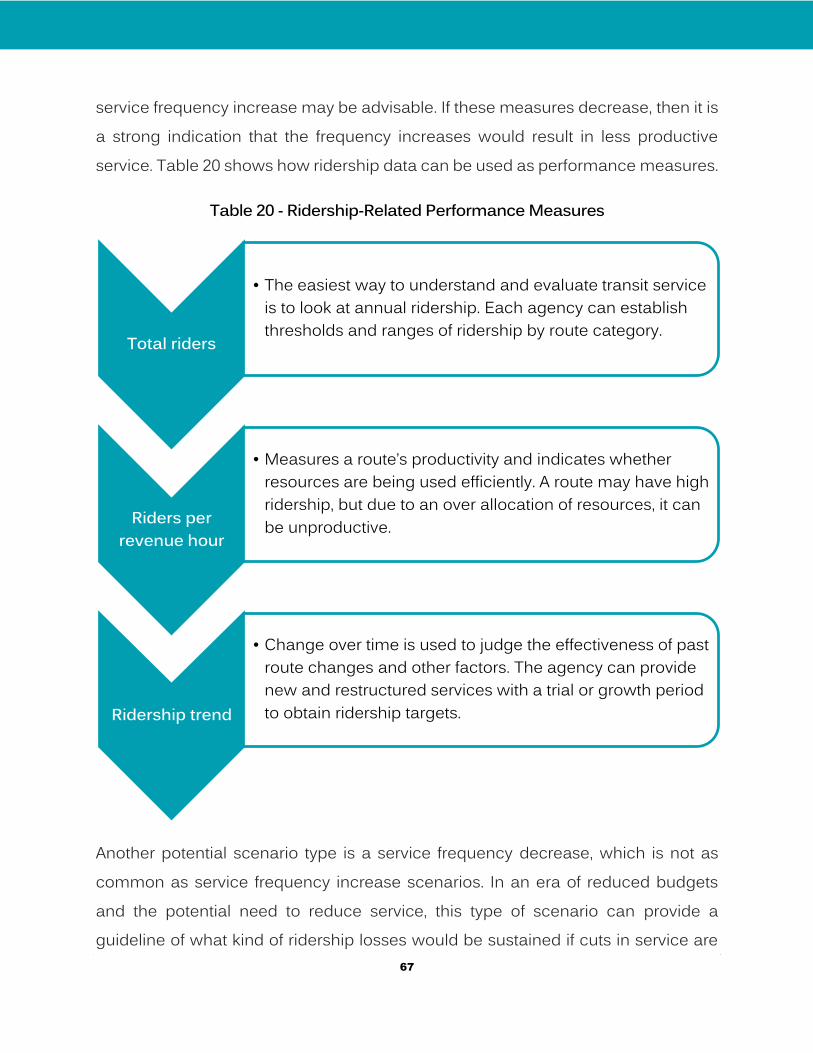
67
service frequency increase may be advisable. If these measures decrease, then it is a strong indication that the frequency increases would result in less productive service. Table 20 shows how ridership data can be used as performance measures.
Table 20 - Ridership-Related Performance Measures
Another potential scenario type is a service frequency decrease, which is not as common as service frequency increase scenarios. In an era of reduced budgets and the potential need to reduce service, this type of scenario can provide a guideline of what kind of ridership losses would be sustained if cuts in service are
Total riders
• The easiest way to understand and evaluate transit service is to look at annual ridership. Each agency can establishthresholds and ranges of ridership by route category.
Riders per revenue hour
• Measures a route’s productivity and indicates whether resources are being used efficiently. A route may have high ridership, but due to an over allocation of resources, it can be unproductive.
Ridership trend
• Change over time is used to judge the effectiveness of past route changes and other factors. The agency can provide new and restructured services with a trial or growth period to obtain ridership targets.
68
required. Performance measures in this scenario include estimated annual ridership, estimated scenario operating cost, net operating cost per service mile, and net operating cost per passenger trip. If the costs saved by reducing service were proportionally greater than the estimated loss of ridership, service productivity would increase.
Public Input (Complaints and Suggestions)
Public involvement is critical for successful planning and is often required based on agency or governmental policies. Public participation requires an understanding of the various communication methods that the riding and non-riding public wish to interact with, as well as a willingness to receive the public’s input. It is about being sensitive to disparate needs and conflicting priorities. It provides the public with the opportunity to be involved in transportation decision-making.
Public participation is an integral part of the transit planning process, which ensures that decisions are made in consideration of and to benefit public needs and preferences. Early and continuous public involvement brings diverse viewpoints and values into the decision-making process. This process enables agencies to make better informed decisions through collaborative efforts and builds a mutual understanding and trust between the agencies and the public they serve. Successful public participation is a continuous process, consisting of a series of activities and actions to inform the public and stakeholders, and to obtain input from both, which influence decisions that affect their lives.
Sources of public input that transit service planners depend on include community meetings, correspondence with the agency, complaints and requests to customer service representatives, observations and information received by transit drivers, concerns through public officials, and other organizations interested in their community’s transit system.
69
Public input activities provide more value when they are open, relevant, timely, and appropriate for the intended goal of the service development process. Providing a balanced approach with the representation of all stakeholders, and including measures to seek out and consider the needs of all stakeholders, especially those that are traditionally underserved by past and current transportation programs, facilities, or services, is crucial to this process.
Market Research, Surveys
Passenger surveys are a critical source of information that guide decisions regarding transit planning, marketing and customer service. Transit customer service can be conducted in a number of ways (at bus stops, at transit centers, by phone). However, experience has shown that an onboard survey is generally the most effective way to capture a representative sampling of all riders. An onboard survey can be used to collect a wide variety of data, including:
Origin and destination information
Transit use characteristics of passengers
Demographic passenger profile
Passenger satisfaction/attitudes
Comparison/contrast of ridership segments
Specific passenger comments
While conducting an onboard survey seems like a simple task to many, executing a high-quality study that provides useful, representative data requires significant effort and a high level of supervision.
70
In order to make transit more attractive to customers, it is necessary to gain a better understanding of the needs and wants of individual customers. Given the fact that a majority of the traveling public does not use transit and prefers other travel alternatives, attracting riders to transit is possible only if transit services are positioned as more desirable than the competing options.
A community-wide market segmentation study can measure the awareness, knowledge and image of the transit system. In addition, it can assess the level of potential for increased transit usage and identify the measures required to capture that potential. Conducting a stratified sample and branched questionnaire in a cost-effective manner is essential to collecting detailed, comparative information about riders, potential riders and non-riders. In-depth profiles of each group should also be created while maintaining an overall sample that accurately reflects the attitudes, behavior and characteristics of the total community. Iterative analysis processes, user-friendly reports, and results-oriented recommendations then turn the data into useful information for transit managers, planners and marketers.
Focus groups are a cost-effective means of exploring the attitudes of a specific target group (users, potential users, voters or employees). In-depth, personal interviews can provide valuable perspectives on the demand for public transit services among various constituencies. They can also gauge overall attitudes toward transit and be useful in identifying issues to be further studied.
When focus groups are implemented effectively, community involvement is a valuable qualitative research tool. Participation in community workshops, stakeholder meetings and other outreach efforts is an opportunity to understand the needs and views of all sectors of a community’s population. E-surveys can also be conducted by target groups with high levels of internet access, such as college students and employees at major worksites.
71
Demographic and Socio-Economic Data
The assessment of demographic and social trends clearly highlights the fact that potential transit customer markets are disaggregated, and should be viewed as such. Transit agencies need to invest in better understanding its markets through market segmentation and how they are likely to evolve. An understanding of demographic trends and the future evolution of customer segments in one’s markets are starting points in service development, especially new service. Several demographic variables are correlated to transit planning, although the strength of those correlations is the subject of considerable debate. These variables are:
Overall population
Age distribution
Race and ethnicity
Household composition, number of people in household and family distribution
Household income
Education level
Residence location
Personal vehicles per household
While most of the work in system-wide performance measures is focused on business measures, such as revenue to cost ratios, there is also a need for transit systems to use social indicators. An example of a type of social indicator is what proportion of households without vehicles have access to transit services of a specified quality. One particularly helpful social measure is an estimate of the number of households with particular social characteristics in a transit district within
72
a quarter mile of a bus stop (this is a five-minute walk at three miles per hour). For example, one can determine the proportion of households without vehicles served by daytime service, the proportion of households with direct access by transit to grocery stores, and the proportion of jobs in the transit service territory.
Staff Input
Transit operations personnel are responsible for fleet management, maintenance operations, and scheduling activities of the transit system. These different roles represent a variety of individuals in the transit industry. Within the transit industry, the person responsible for fleet management is known by many names: street supervisor, starter, dispatcher, supervisor, traffic controller, and transportation coordinator. This person actively monitors, controls, and modifies the transit fleet routes and schedules on a day-to-day basis (dynamic scheduling). The modifications will take abnormal situations into account, such as vehicle breakdown, vehicle delay, detours around work zones or incidents (detour management, connection protection, and service restoration), and other causes of route or schedule deviations. Transit operations personnel are also responsible for demand-responsive transit operation. In addition, the transit operations personnel may be responsible for assigning vehicle operators to routes, checking vehicle operators in and out, and managing transit stop issues. Input from transit operations personnel is a critical component for the planning, development, and management of transit routes and schedules.
Data Collection/Analysis Tools
APC, AVL, Farebox
An Automated Passenger Counter (APC) is an electronic device available for installation on transit vehicles, including buses and rail vehicles, which accurately record boarding and alighting data. This technology can improve the accuracy and reliability of tracking transit ridership over traditional methods of manual counting
73
by drivers or checkers, as well as estimation through random surveying. These devices are becoming more common among American transit operators seeking to improve the accuracy of reporting patronage, as well as analyzing transit use patterns by linking boarding and alighting data with stop or station location.
APCs function through the use of infrared lights above or across the doorways of a vehicle, as a set of invisible (to the human eye) beams of infrared light. The presence of a person entering or exiting the vehicle breaks the beam. Except in extreme crush-loads, the accuracy of this technology is quite high. The APC computer can also integrate with an on-board GPS system to link passenger data to vehicle location. This provides a wealth of data for agencies to analyze the utilization of the system based on location, direction of travel, and time. Like many other data-collection applications onboard transit vehicles, the information can be transmitted wirelessly to a server when a bus is garaged for the day, or may need to be downloaded through a physical connection, or could be uploaded in real time.
APCs also provide a wealth of information to transit service planners, including boardings per trip, entries and exits per stop, and passenger miles. This information has enabled planners to make decisions based on data and not intuition.
Automatic Vehicle Location (AVL) describes the use of computers and Global Positioning Systems (GPS) in dispatching and tracking transit vehicles. AVL is accompanied by the added costs of operating and maintaining additional computer equipment, but transit agencies benefit from improvements to customer service through real-time information. Because AVL is becoming commonplace, such as on bus rapid transit systems, it is increasingly becoming a standard for fixed-route systems. AVL systems can vary widely in cost -- from $100 to $7,000 per bus, depending on the type of technology being used.
74
AVL systems provide planners and schedulers with critical data such as on-time performance and actual running times. AVL has a significant impact on improving schedule reliability.
Automated fareboxes are also an important source of information for planners. These fareboxes accept dollar bills, coins, tokens, magnetic-stripe tickets or smart cards. Magnetic-stripe tickets are similar in size to a credit card. One side of the magnetic ticket has a stripe that contains the encoded ticket information that is read by the farebox. Magnetic-stripe tickets are either "dipped" or "swiped" in the farebox, depending on the ticket type. Most transit systems, including those with APCs, base their official ridership numbers on the automated fare collection system. Advanced systems can provide helpful data on passenger trips such as route-to-route transfers.
GIS, Planning and Scheduling Software
Public transit is key to meeting transportation challenges presented by rapidly growing cities, rising fuel prices, budget constraints, and global environmental issues. Global Information System (GIS) visualization and analysis tools can help integrate critical information for effective public transit planning, operations, monitoring, and delivery. For cost-effective route planning, GIS needs to take into account the street network, ridership demand, and demographic and socio-economic data. GIS software for the web enables online public access to interactive maps and real-time arrival information.
Fleet and dispatch managers need to know when, where, and how quickly tasks are completed to keep operations running smoothly and at the lowest cost. GIS technology manages these business processes with real-time tracking, scheduling, and optimum routing tools.
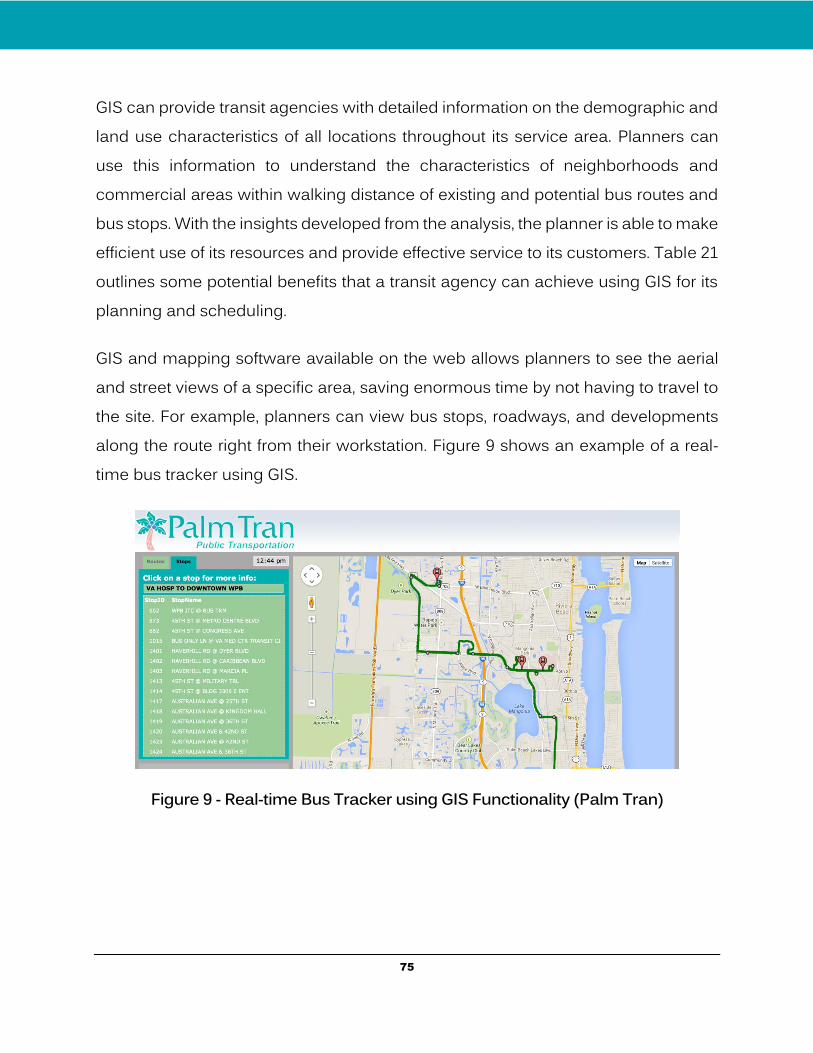
75
GIS can provide transit agencies with detailed information on the demographic and land use characteristics of all locations throughout its service area. Planners can use this information to understand the characteristics of neighborhoods and commercial areas within walking distance of existing and potential bus routes and bus stops. With the insights developed from the analysis, the planner is able to make efficient use of its resources and provide effective service to its customers. Table 21 outlines some potential benefits that a transit agency can achieve using GIS for its planning and scheduling.
GIS and mapping software available on the web allows planners to see the aerial and street views of a specific area, saving enormous time by not having to travel to the site. For example, planners can view bus stops, roadways, and developments along the route right from their workstation. Figure 9 shows an example of a real-time bus tracker using GIS.
Figure 9 - Real-time Bus Tracker using GIS Functionality (Palm Tran)
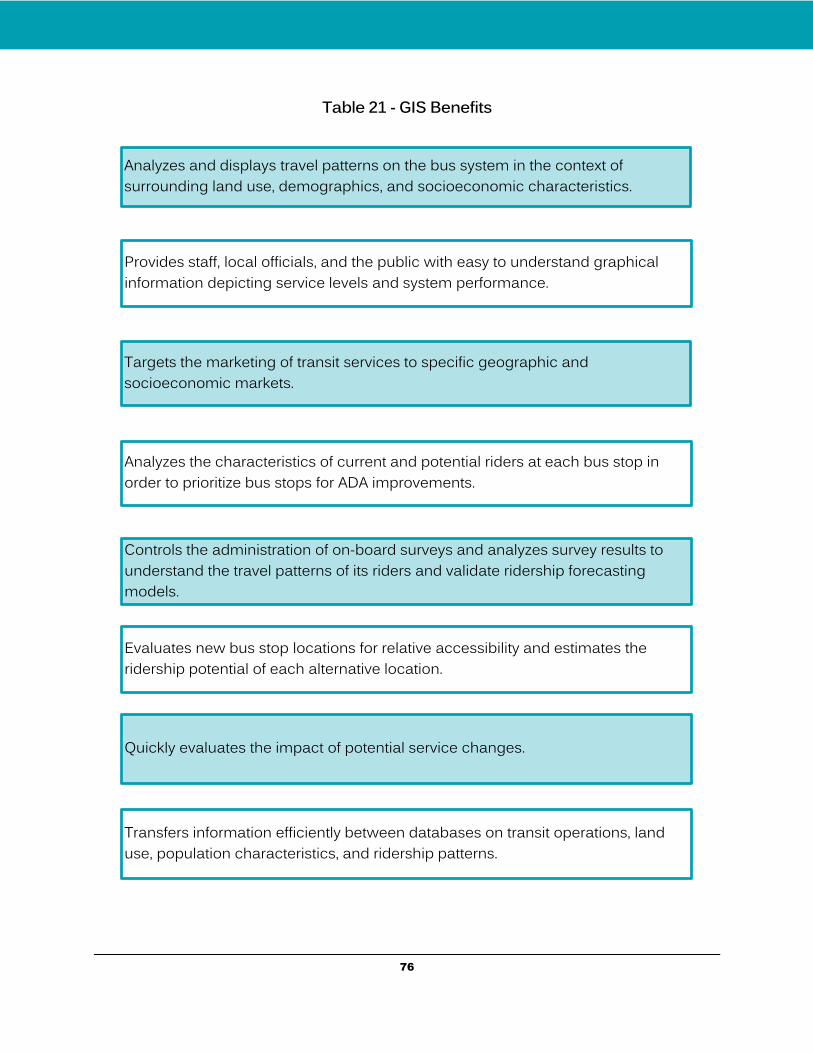
76
Table 21 - GIS Benefits
Analyzes and displays travel patterns on the bus system in the context of surrounding land use, demographics, and socioeconomic characteristics.
Provides staff, local officials, and the public with easy to understand graphical information depicting service levels and system performance.
Targets the marketing of transit services to specific geographic and socioeconomic markets.
Analyzes the characteristics of current and potential riders at each bus stop in order to prioritize bus stops for ADA improvements.
Controls the administration of on-board surveys and analyzes survey results to understand the travel patterns of its riders and validate ridership forecasting models.
Evaluates new bus stop locations for relative accessibility and estimates the ridership potential of each alternative location.
Quickly evaluates the impact of potential service changes.
Transfers information efficiently between databases on transit operations, land use, population characteristics, and ridership patterns.
77
Transportation Elasticity Models
When transport prices decline, mobility tends to increase, and if prices increase, mobility decreases. Research has shown that transport price changes affect trip frequency, route, mode, destination, scheduling, vehicle type, parking location, and type of service. Planners use this information to predict how demographic and economic trends will affect future travel activity. Policy makers and businesses can predict how fuel tax, parking fee, road toll and transit fare changes affect travel activities and revenues. This information is used to evaluate various Transportation Demand Management (TDM, also called mobility management) intended to change travel activity in order to achieve various planning objectives.
Price sensitivity is often measured using “elasticities,” defined as the percentage of change of goods consumption caused by each one-percent change in price or other characteristics, such as travel speed or transit service. A negative sign indicates that the effect is opposite from the cause, for example, a -0.5 elasticity of vehicle use with respect to vehicle operating expenses means that each 1% expense increase causes vehicle travel to decline 0.5%. Similarly, transit service elasticity is defined as the percentage of change in transit ridership resulting from each 1% change in transit service, such as bus-miles or frequency. This elasticity usually has a positive value since more service increases ridership. Elasticities can also be calculated based on ratios, such as between transit fares and automobile operating costs, or between vehicle costs and average incomes or wages.
Elasticity values are classified by their magnitude. Unit elasticity refers to 1.0 absolute value (1.0 or 1.0) elasticity, meaning that price changes cause proportional consumption changes. Elasticities of less than a 1.0 absolute value are called “inelastic,” meaning that prices cause less than proportional consumption changes. Elasticity values greater than a 1.0 absolute value are called “elastic,” meaning that price changes cause more than proportional consumption changes. For example, both 0.5 and –0.5 values are considered inelastic because their absolute values are
78
less than 1.0, while both 1.5 and –1.5 values are considered elastic, because their absolute values are greater than 1.0.
Cross-elasticities refer to the percentage change in the consumption of a good resulting from a price change in another related good. For example, automobile travel is complementary to vehicle parking, and is a substitute for transit travel. As a result, an increase in the price of driving tends to reduce the demand for parking and increase the demand for transit travel. To help analyze cross-elasticities, it is useful to estimate mode substitution factors, such as the change in automobile trips resulting from a change in transit trips. These factors vary depending on circumstances.
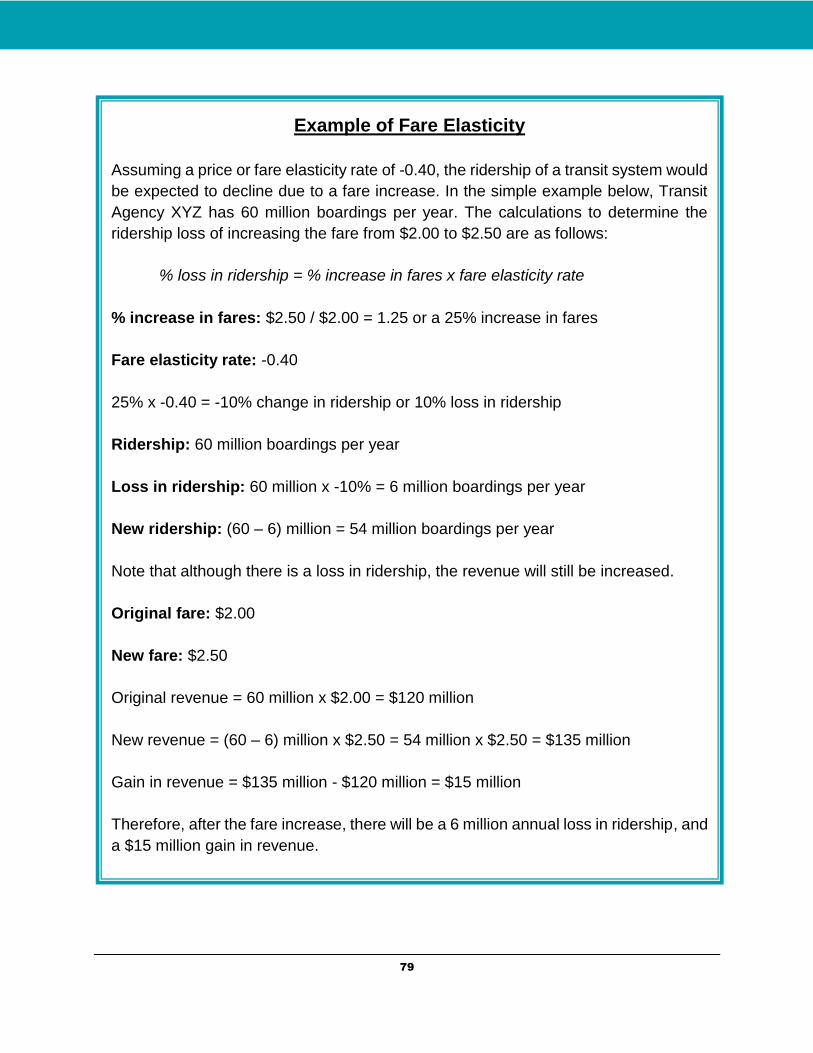
79
Example of Fare Elasticity
Assuming a price or fare elasticity rate of -0.40, the ridership of a transit system would
be expected to decline due to a fare increase. In the simple example below, Transit
Agency XYZ has 60 million boardings per year. The calculations to determine the
ridership loss of increasing the fare from $2.00 to $2.50 are as follows:
% loss in ridership = % increase in fares x fare elasticity rate
% increase in fares: $2.50 / $2.00 = 1.25 or a 25% increase in fares
Fare elasticity rate: -0.40
25% x -0.40 = -10% change in ridership or 10% loss in ridership
Ridership: 60 million boardings per year
Loss in ridership: 60 million x -10% = 6 million boardings per year
New ridership: (60 – 6) million = 54 million boardings per year
Note that although there is a loss in ridership, the revenue will still be increased.
Original fare: $2.00
New fare: $2.50
Original revenue = 60 million x $2.00 = $120 million
New revenue = (60 – 6) million x $2.50 = 54 million x $2.50 = $135 million
Gain in revenue = $135 million - $120 million = $15 million
Therefore, after the fare increase, there will be a 6 million annual loss in ridership, and
a $15 million gain in revenue.
80
Application of Data in Service Planning
Extracting the Important Data for Service Planning
Analysis can be seen as the process by which useful information is drawn from data. This includes different ways to estimate a given measure and different measures and displays that illuminate various aspects of the data. One purpose of this synthesis is to summarize the types of service monitoring analyses used in transit agencies. Particular attention is given to methods used to estimate system-level ridership, passenger miles, service reliability, and passenger transfers. The statistical accuracy of methods involving sampling is addressed as well.
Applying Data Properly for Good Planning Decisions
Transit-related data should be collected, maintained, managed, analyzed, and interpreted for transit planning from a wide variety of internal and external sources. To have an effective decision-making process, transit planner should consider the following:
Gather ridership and performance data for various transit services.
Retrieve data from Automatic Passenger Counters, Automatic Vehicle Location systems, fare boxes, and other sources.
Develop existing data collection instruments and methodologies for improved efficiency or accuracy.
Ensure data integrity; research and correct the cause of inconsistencies.
Perform database management and organization of public transit data.
Provide statistical information and report analysis of public transit data.
81
Respond to data requests promptly and accurately for internal queries, as well as those of local, state, and federal agencies.
Develop, maintain, and submit monthly, quarterly, and annual operational reports for internal, local, state, and federal agencies, such as the Federal Transit Administration and the National Transit Database.
Ensure requirements are met and documents are submitted for continued eligibility for grant funding.
Provide current detailed Geographic Information Systems data maps for a variety of purposes, including scheduling software-based mapping, bus stop inventory, display-quality route maps, and demographic representations.
Develop and present complex data in an accessible and understandable form.
Support special projects and research transit-related topics as needed.
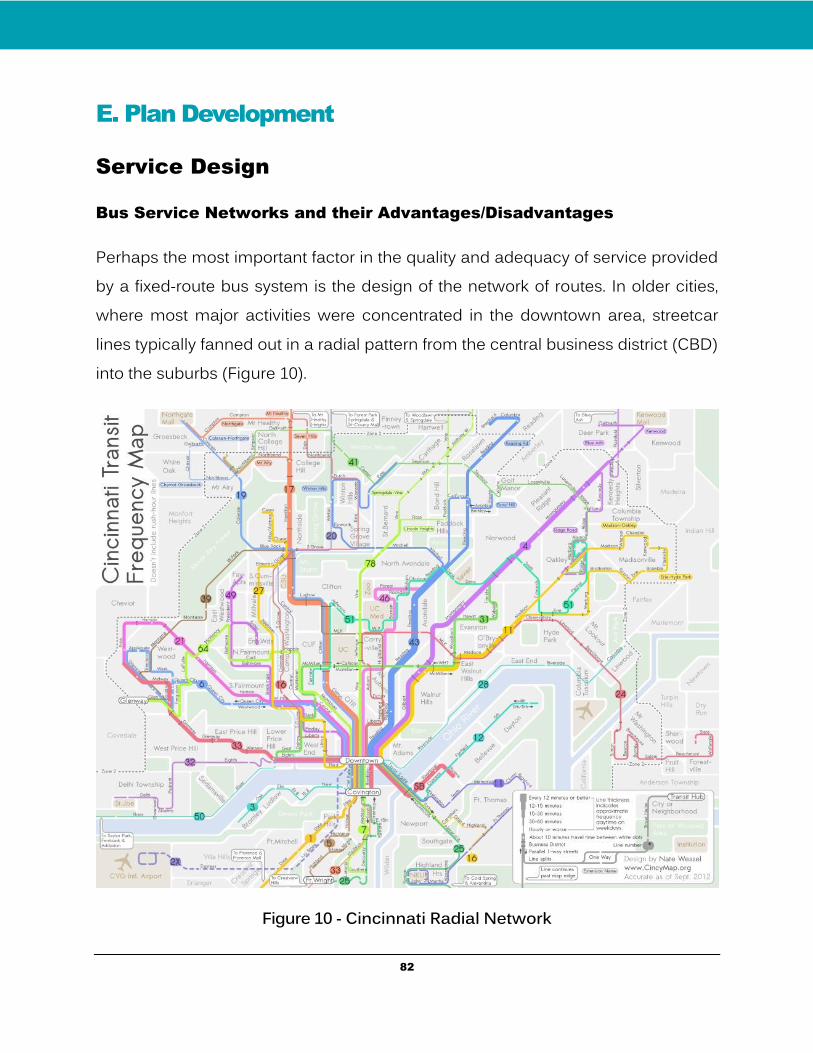
82
E. Plan Development
Service Design
Bus Service Networks and their Advantages/Disadvantages
Perhaps the most important factor in the quality and adequacy of service provided by a fixed-route bus system is the design of the network of routes. In older cities, where most major activities were concentrated in the downtown area, streetcar lines typically fanned out in a radial pattern from the central business district (CBD) into the suburbs (Figure 10).
Figure 10 - Cincinnati Radial Network
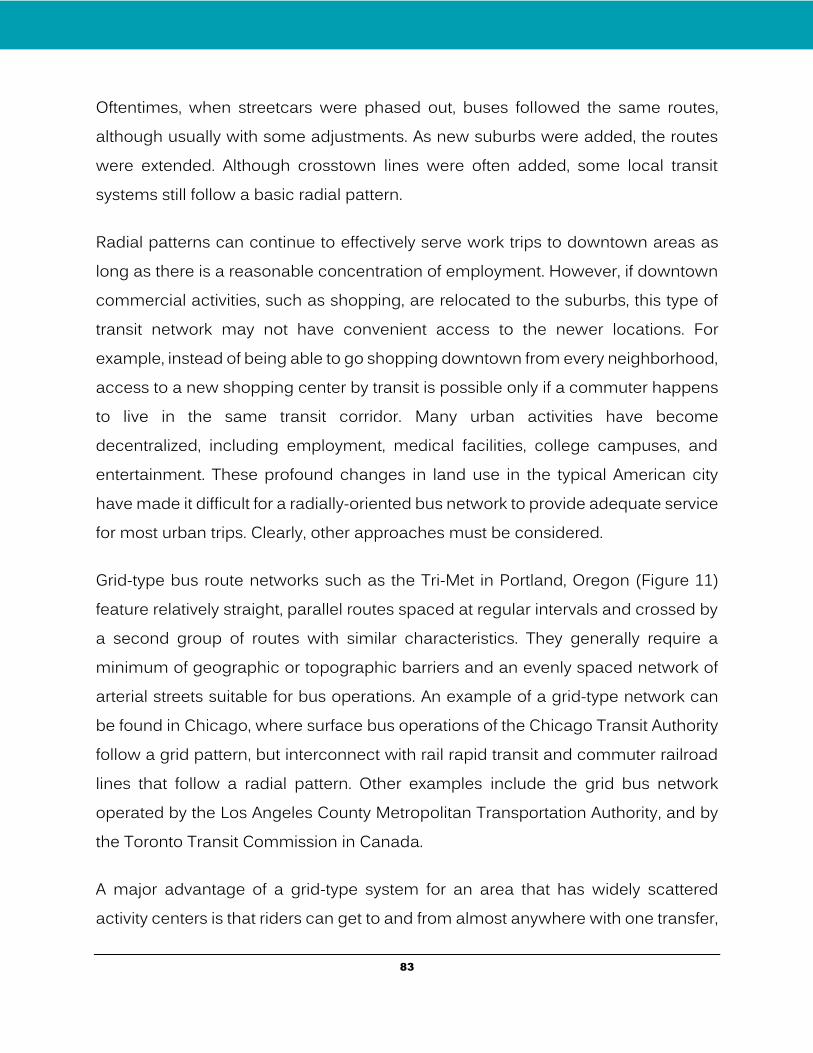
83
Oftentimes, when streetcars were phased out, buses followed the same routes, although usually with some adjustments. As new suburbs were added, the routes were extended. Although crosstown lines were often added, some local transit systems still follow a basic radial pattern.
Radial patterns can continue to effectively serve work trips to downtown areas as long as there is a reasonable concentration of employment. However, if downtown commercial activities, such as shopping, are relocated to the suburbs, this type of transit network may not have convenient access to the newer locations. For example, instead of being able to go shopping downtown from every neighborhood, access to a new shopping center by transit is possible only if a commuter happens to live in the same transit corridor. Many urban activities have become decentralized, including employment, medical facilities, college campuses, and entertainment. These profound changes in land use in the typical American city have made it difficult for a radially-oriented bus network to provide adequate service for most urban trips. Clearly, other approaches must be considered.
Grid-type bus route networks such as the Tri-Met in Portland, Oregon (Figure 11) feature relatively straight, parallel routes spaced at regular intervals and crossed by a second group of routes with similar characteristics. They generally require a minimum of geographic or topographic barriers and an evenly spaced network of arterial streets suitable for bus operations. An example of a grid-type network can be found in Chicago, where surface bus operations of the Chicago Transit Authority follow a grid pattern, but interconnect with rail rapid transit and commuter railroad lines that follow a radial pattern. Other examples include the grid bus network operated by the Los Angeles County Metropolitan Transportation Authority, and by the Toronto Transit Commission in Canada.
A major advantage of a grid-type system for an area that has widely scattered activity centers is that riders can get to and from almost anywhere with one transfer,
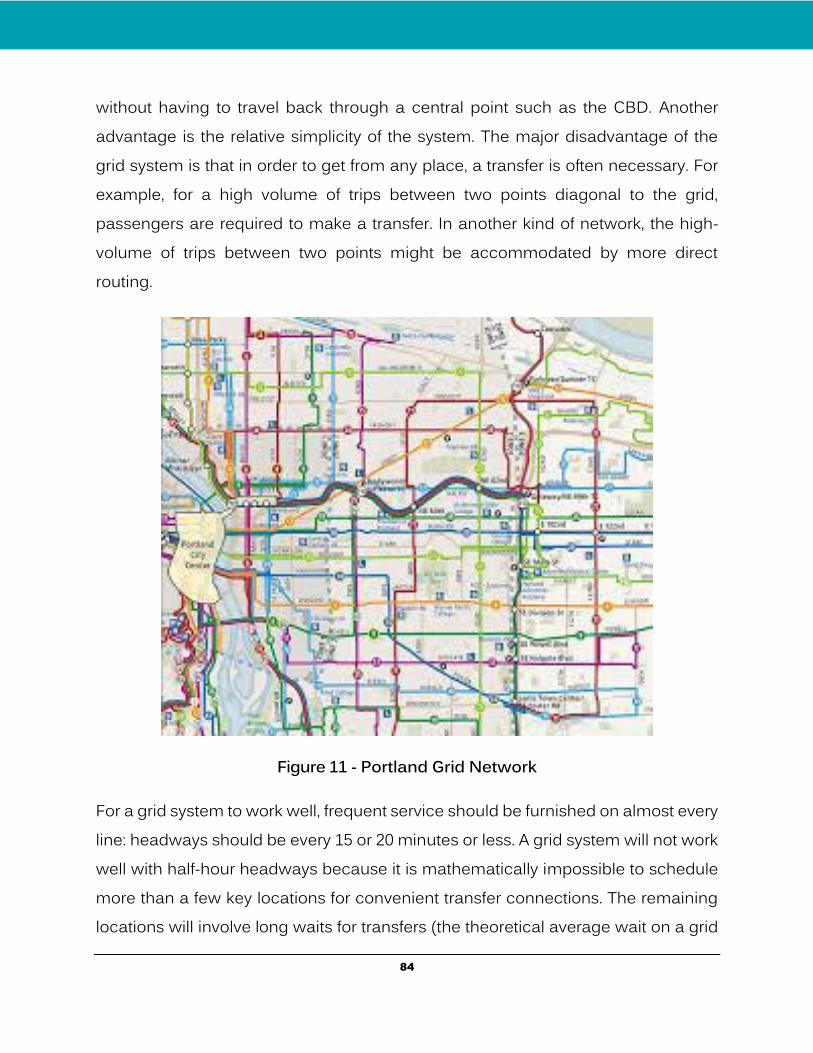
84
without having to travel back through a central point such as the CBD. Another advantage is the relative simplicity of the system. The major disadvantage of the grid system is that in order to get from any place, a transfer is often necessary. For example, for a high volume of trips between two points diagonal to the grid, passengers are required to make a transfer. In another kind of network, the high-volume of trips between two points might be accommodated by more direct routing.
Figure 11 - Portland Grid Network
For a grid system to work well, frequent service should be furnished on almost every line: headways should be every 15 or 20 minutes or less. A grid system will not work well with half-hour headways because it is mathematically impossible to schedule more than a few key locations for convenient transfer connections. The remaining locations will involve long waits for transfers (the theoretical average wait on a grid
85
system is half of the headway). A successful grid system depends on good connections and frequent headways. If population density or ridership is low and will not support frequent headways, it is doubtful that a grid system will be very successful.
One way to obtain certain characteristics of a grid system and still maintain the benefits of a radial system is to use a modified grid system that crisscrosses the lines and provides additional points where lines converge, such as at shopping centers or colleges. By crisscrossing, the lines also provide grid-type transfer opportunities to intermediate locations. Under a pure grid system, there may be no direct service from the CBD to major activity centers.
Geographic Characteristics
Mode choice is the process where the means of traveling is determined. The means of travel is referred to as the travel mode, which may be by private automobile, public transportation, walking, bicycling, or other means. In most travel models, mode choice is applied to travel that has already been estimated, meaning that mode choice is applied to a trip, or group of trips, where the origin and destination are already known.
There are many land use factors that impact travel mode. They include regional accessibility, density, mixture of land use, roadway design and connectivity, and parking supply and management. Population density, when combined with employment density, has a significant impact on mode choice and ridership. Roadway design that is radial with winding roads is not conducive to developing a grid route system. However, ridership demand is more dependent on demographic and socio-economic trends. In general, transit planners adapt their system to fit the land use.
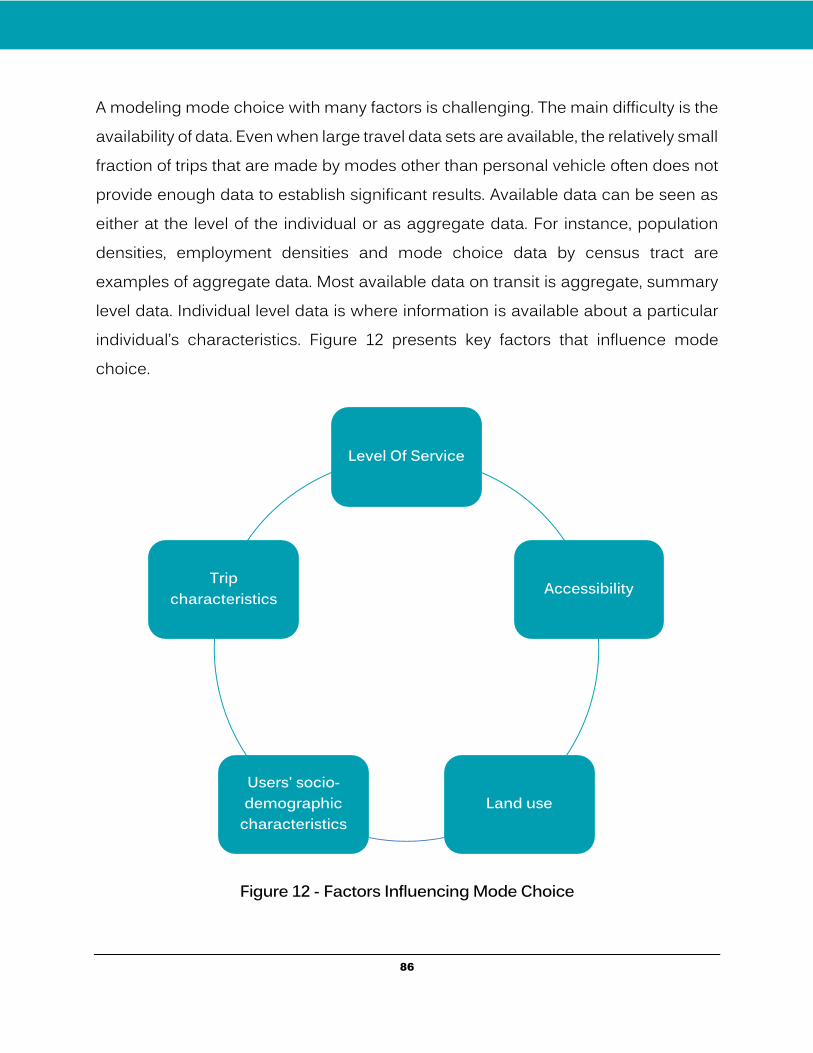
86
A modeling mode choice with many factors is challenging. The main difficulty is the availability of data. Even when large travel data sets are available, the relatively small fraction of trips that are made by modes other than personal vehicle often does not provide enough data to establish significant results. Available data can be seen as either at the level of the individual or as aggregate data. For instance, population densities, employment densities and mode choice data by census tract are examples of aggregate data. Most available data on transit is aggregate, summary level data. Individual level data is where information is available about a particular individual’s characteristics. Figure 12 presents key factors that influence mode choice.
Figure 12 - Factors Influencing Mode Choice
Level Of Service
Accessibility
Land useUsers' socio-demographic
characteristics
Trip characteristics
87
Land use/urban design examples:
Sidewalks
Population density
Employment density
Parking fees / parking availability
Availability of parking
Average commute time
Housing density
Retail, commercial, service, industrial, employment density
Average parcel size
Pedestrian environment factors
Transit system service plans refine and detail the recommendations for transit services set forth in the Five-Year Transit Development Plan. The transit service provider in the region prepares these plans. More specifically, the plans are intended to serve the following four major purposes:
Evaluate the performance of an existing transit system, including the effectiveness of the existing bus route structure and services, and the financial performance of the system and its component bus routes so as to identify areas of effective and efficient transit service operation, along with areas of ineffective and/or inefficient operation. Transit services that do not meet service standards should be analyzed in detail to identify reasons for deficiencies.
88
Identify the transit service needs of residents that are not being met or are not being met well by the existing transit system, including travel that cannot be made within reasonable travel times on the existing system, or cannot be made on the existing system at all.
Design and evaluate transit system improvement alternatives that address the service problems and deficiencies of the existing system identified in the performance evaluation and the unmet transit service needs. These needs can often be rectified by reallocating resources from inefficient service without increasing system costs.
Identifying and reducing duplicative service, which can have a positive impact on the productivity of the system.
New Service and Service Enhancements
The service planning process starts by using service standards to evaluate current service. Many planning and design elements are taken into account when considering a service change. Service changes address issues of route efficiency, cost-effectiveness, operational feasibility, and the availability of resources. Service standards are applied in order to:
improve route productivity while keeping customer impacts to a minimum;
assure that service is provided in a fair, consistent, and equitable manner, with consideration for transit-dependent areas / regions; and
provide a baseline for the service planning of bus route alignments, and scheduling frequencies for all transit modes.
Data collected on the agency’s service is compared with the service standards to determine whether existing services perform at acceptable levels. Remedial action plans are developed to bring the service up to standard if they are not acceptable.
89
Ridership data is collected using Automatic Passenger Counters (APC), Automatic Vehicle Location (AVL), GPS, or manual ride checks. As part of the process, these data are evaluated to perform the following remedial actions:
Enhance/Reduce per-route service span
Increase/Decrease frequency
Modify/Eliminate duplicative service
Modify/Eliminate low ridership route segments
Modify/Eliminate weekend service (Saturday, Sunday or both)
Modify/Eliminate off-peak service
Modify/Eliminate low productivity trips
Market/Promote low ridership routes
The service planning process identifies and documents service deficiencies. If continued remedial actions cannot bring a service up to standard, it may be an indication of changes in demand or travel patterns. Reallocating the resources may be the only alternative to resolving such service deficiencies. Transit agencies should continuously evaluate the performance of its services, analyze data and develop recommendations for service changes as justified using service delivery standards. Applying the service standard process assures that available resources are deployed in the most effective manner. Although the service routes and schedules should be evaluated continuously, major service changes (above the 25% threshold) can be implemented with the approval of the administration. Minor changes are defined as modifications affecting less than a quarter (25%) of a route. The 25% threshold refers to service changes that increase or decrease route miles by 25% or change headways by 25%.
90
The service planning process targets only short-range plans, which are six to eight months into the future. Long-range plans, such as the Transportation Improvement Program (TIP), the Transit Development Plan (TDP), and the Long-Range Transportation Plan (LRTP), are incorporated into the short-range planning process in order to align long-term visions with short-term goals. Transit agencies can work toward the implementation of route and scheduling service changes with input and collaboration from other divisions within the department. These divisions can assist in the planning, scheduling, and implementation of the various modes of transit service. Each division works as a team to plan the design and deliver optimal transit services to its community. There are two main types of standards: Design standards and Performance standards. Table 22 shows examples of these standards.
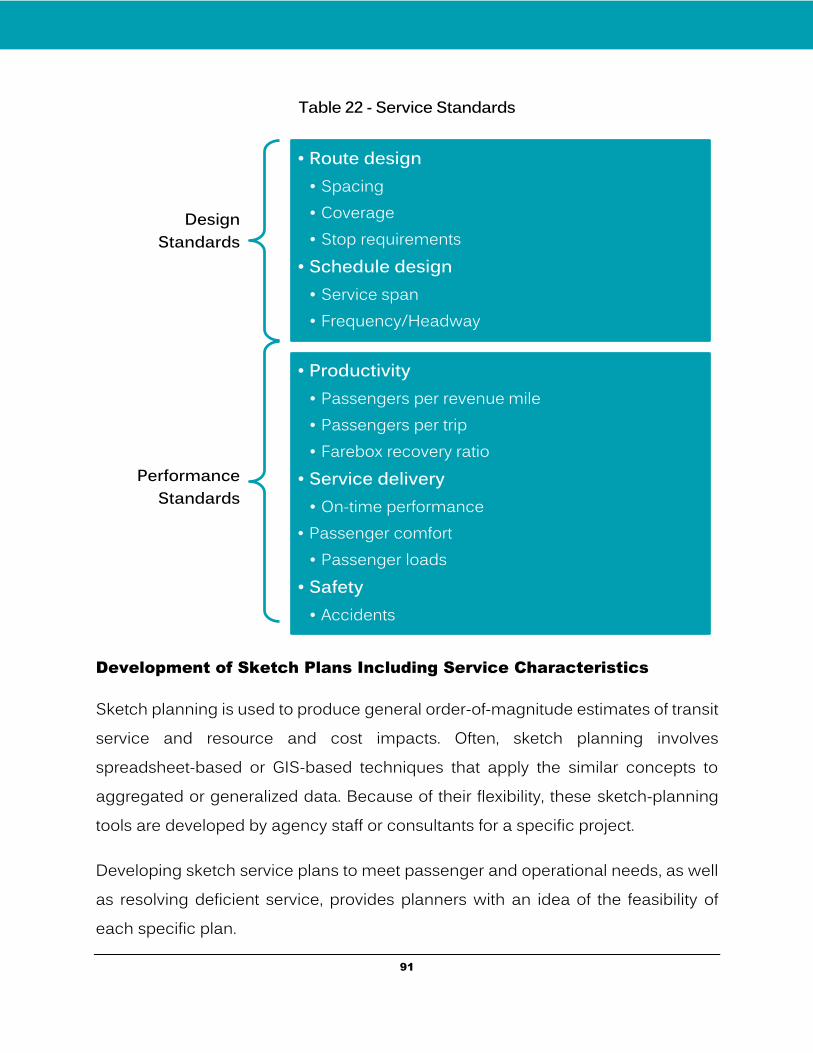
91
Table 22 - Service Standards
Development of Sketch Plans Including Service Characteristics
Sketch planning is used to produce general order-of-magnitude estimates of transit service and resource and cost impacts. Often, sketch planning involves spreadsheet-based or GIS-based techniques that apply the similar concepts to aggregated or generalized data. Because of their flexibility, these sketch-planning tools are developed by agency staff or consultants for a specific project.
Developing sketch service plans to meet passenger and operational needs, as well as resolving deficient service, provides planners with an idea of the feasibility of each specific plan.
Design Standards
• Route design• Spacing• Coverage• Stop requirements
• Schedule design• Service span• Frequency/Headway
Performance Standards
• Productivity• Passengers per revenue mile• Passengers per trip• Farebox recovery ratio
• Service delivery• On-time performance
• Passenger comfort• Passenger loads
• Safety• Accidents
92
Resource and Cost Estimation Process
An important task associated with transit service performance is the allocation of costs and revenues among services. This information provides insight into the relative performance of service and can provide the basis for making decisions regarding transit resource allocation. Cost determination is the process of identifying the total cost of providing the service. The goal of this process is to produce an estimate of the revenue and expenses of a proposed service. The basic source of information for this cost determination is the estimated change in resource requirements for each proposal.
Expenses should be allocated to miles (maintenance wages and fringe, parts, fuel, tires, and accidents), hours (driver wages and fringe), and vehicles (management, advertising, legal fees, office supplies, training, overhead items, and utilities).
To create a cost model for transit planning, a variety of approaches are used, depending on the situation, from sketch planning to the detailed budget analysis.
Simple extreme: Average system cost per unit of service, i.e., total cost/hour or total cost per mile, used for quick calculation, and analysis of a new system. This method tends to overestimate the potential savings of a service cut or costs of a service expansion since it includes fixed and variable costs.
Complex extreme: Reschedule the whole system to look at the effects of a change and run-cutting. This is used to implement services, as well as for budgeting the next system change.
Intermediate: Cost models with a limited number of variables per hour, per mile, and per vehicle.
A complete performance evaluation requires revenue and expense estimates for each individual service component being analyzed. For example, to perform a
93
comprehensive diagnosis of a system's operating problems, the planner needs a separate analysis of each service sector or type of service within the operation to determine if one part of the operation is dragging down the performance of the whole system.
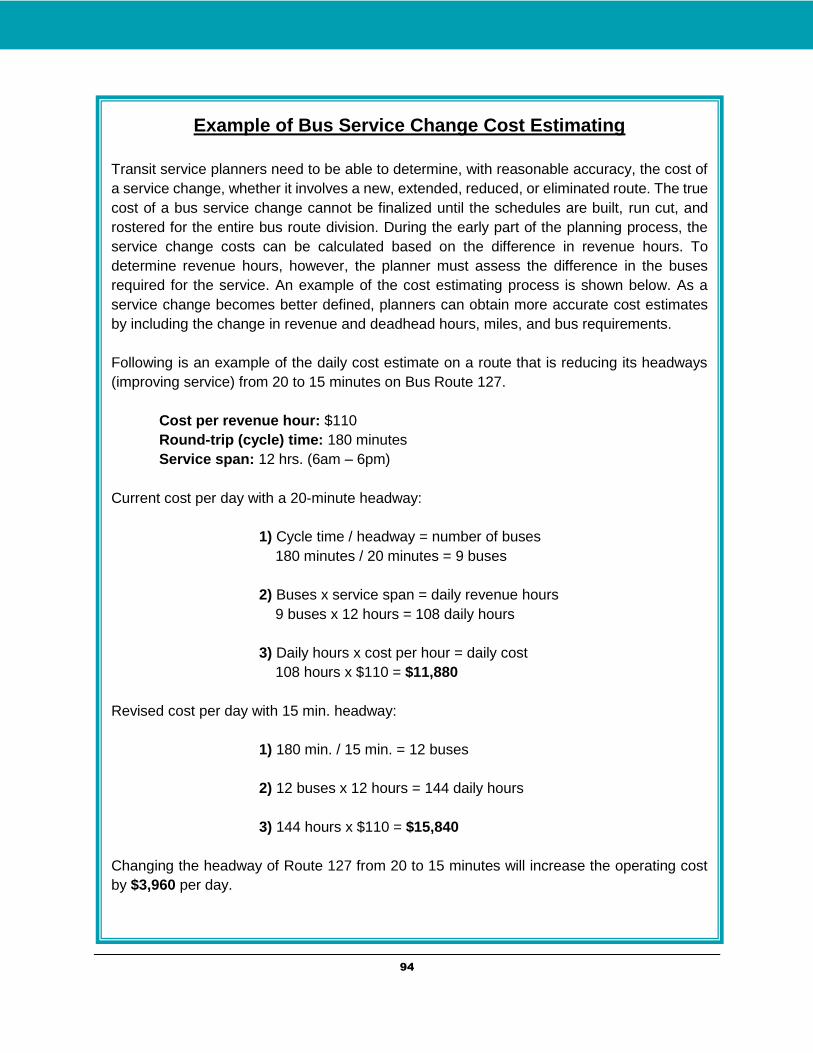
94
Example of Bus Service Change Cost Estimating
Transit service planners need to be able to determine, with reasonable accuracy, the cost of
a service change, whether it involves a new, extended, reduced, or eliminated route. The true
cost of a bus service change cannot be finalized until the schedules are built, run cut, and
rostered for the entire bus route division. During the early part of the planning process, the
service change costs can be calculated based on the difference in revenue hours. To
determine revenue hours, however, the planner must assess the difference in the buses
required for the service. An example of the cost estimating process is shown below. As a
service change becomes better defined, planners can obtain more accurate cost estimates
by including the change in revenue and deadhead hours, miles, and bus requirements.
Following is an example of the daily cost estimate on a route that is reducing its headways
(improving service) from 20 to 15 minutes on Bus Route 127.
Cost per revenue hour: $110
Round-trip (cycle) time: 180 minutes
Service span: 12 hrs. (6am – 6pm)
Current cost per day with a 20-minute headway:
1) Cycle time / headway = number of buses
180 minutes / 20 minutes = 9 buses
2) Buses x service span = daily revenue hours
9 buses x 12 hours = 108 daily hours
3) Daily hours x cost per hour = daily cost
108 hours x $110 = $11,880
Revised cost per day with 15 min. headway:
1) 180 min. / 15 min. = 12 buses
2) 12 buses x 12 hours = 144 daily hours
3) 144 hours x $110 = $15,840
Changing the headway of Route 127 from 20 to 15 minutes will increase the operating cost
by $3,960 per day.
95
Demand and Revenue Estimation
Transit use is generally measured through the metrics of unlinked passenger trips and passenger miles. These are the most commonly reported measures for public transit use in the U.S., as all agencies that receive federal support are required to report to the Federal Transit Administration at least annually. Transit agencies generally collect this information using a common device called a ride check. A sample of the vehicle trips (trips from one route terminal to another) is selected, and a person (the “checker”) is placed on the vehicle for the sampled scheduled trip(s). That person records the location and the number of people who get on (board) and who get off (alight) the vehicle at that location. Passenger counters have replaced this manual system since most medium and large transit systems provide more data at a lower cost.
One of the more common issues for transit planners is how to estimate demand changes that might occur if various service characteristics or fares are changed. There are a wide variety of tools that could be used to estimate changes in demand, but one must be sure to apply a tool that fits the desired purpose. For a short planning horizon and only one variable change, elasticities work reasonably well.
When introducing major projects such as a rail extension or Bus Rapid Transit, more sophisticated demand models are needed. This is because such changes induce much larger changes in traveler behavior, such as possible changes in overall trip-making, origins, destinations, modes of travel, routes, and time of travel (among others). Perhaps most controversial in the area of transit demand estimation is the forecasting of future ridership (unlinked trips) on proposed new service. Many forecasts have been overly optimistic in their forecasts of transit ridership, while underestimating the actual costs. From these forecasting experiences, one might make a few observations.
96
There will be errors in any ridership forecast. Some forecasts have strongly over-predicted the actual ridership, while others have under predicted the ridership. There are many sources of errors in these forecasts. Either more transparency is needed about these possible errors, or sensitivity analysis on assumptions in the models need to be performed, which can be useful in explaining uncertainties.
In the past, there were incentives to over predict ridership to make the major transit investments seem more cost-effective in attracting riders to transit. This is especially true when the federal share of the capital costs (which often range in the hundreds of millions to billions of dollars) can be up to 80% or more. There are a large number of factors that can be considered in developing new transit systems. Attracting new riders to public transit remains only one of many possible factors that could influence the political decisions of new transit systems. Specifically, political, economic, and social welfare considerations can often weigh heavily in the decision to develop new rail transit systems.
Fine Tuning of Plans through Approval Process
Planning decisions are made in a continuing, cooperative and comprehensive fashion. “Continuing” means planning decisions are made and revisited over time to ensure the decisions still make sense and are the best courses of action. “Cooperative” means there are many people, interest groups, agencies, and stakeholders involved. Everyone has a right to voice their opinion on the proposed decision. After hearing and carefully weighing all of the opinions, the decision-making authority makes the planning decision. The decision-making authority is usually an elected or appointed board of people that represent the public at large. “Comprehensive” means that all relevant information and factors are considered in making the decision.
Public involvement in transportation planning is an integral part of the transit planning process. Through public workshops, hearings, open houses, task forces,
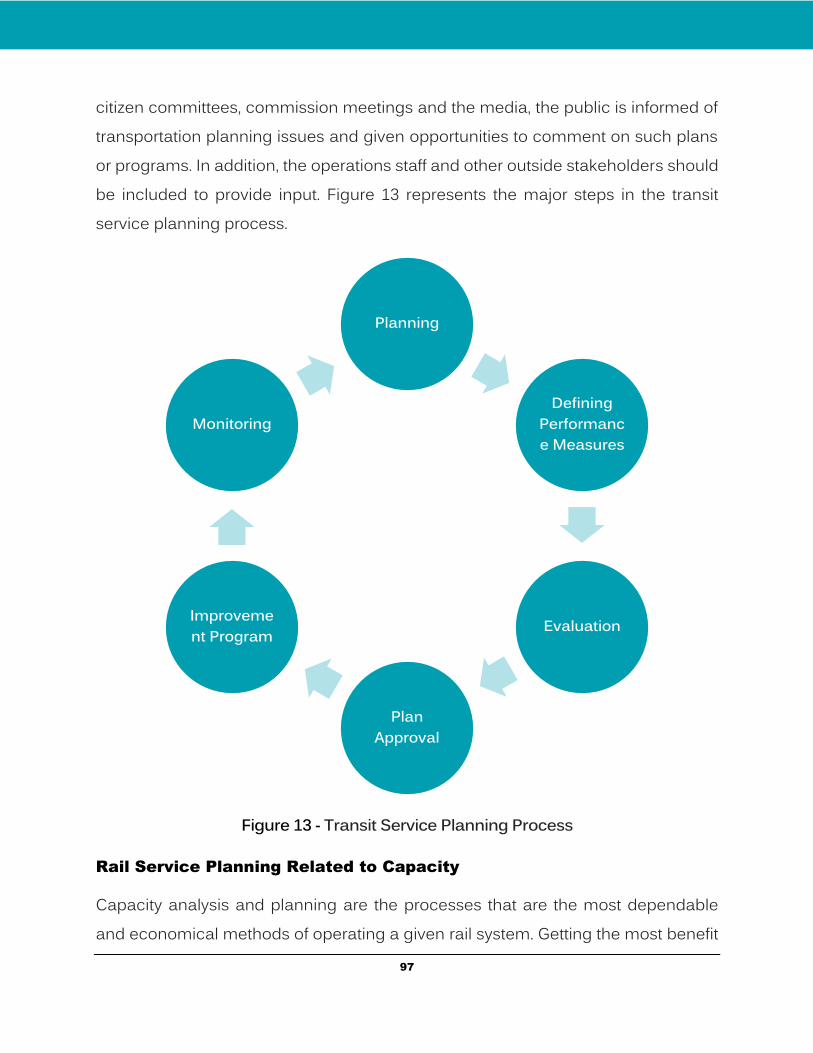
97
citizen committees, commission meetings and the media, the public is informed of transportation planning issues and given opportunities to comment on such plans or programs. In addition, the operations staff and other outside stakeholders should be included to provide input. Figure 13 represents the major steps in the transit service planning process.
Figure 13 - Transit Service Planning Process
Rail Service Planning Related to Capacity
Capacity analysis and planning are the processes that are the most dependable and economical methods of operating a given rail system. Getting the most benefit
Planning
Defining Performance Measures
Evaluation
Plan Approval
Improvement Program
Monitoring
98
from capital dollars requires careful planning. Adding more rail cars may eliminate overcrowding and delays at that location.
Infrastructure in general is expensive. The rail infrastructure may not be able to produce results defined by a market-driven schedule, resulting in delays, expenses, and dissatisfied customers. The schedule analysis is used to investigate each step required to provide transportation. It can be static, as in the development of the operating plan and the customer schedules, or it can be dynamic, as in creating the plan necessary to recover from unforeseen events ranging from an online mechanical failure to a derailment or natural event that results in the closure of the line for a period of time. The result is the schedule or operating plan that can be reliably met at the least expense.
Improving Transit through Efficient Planning
All transit systems desire cost-efficient and cost-effective service that meets their goals and uses taxpayers’ money wisely. To achieve this, transit agencies must design their services to be consistent with their standards and policies. Monitoring the service and identifying inefficient service, and then correcting it is essential for a productive transit system.
Making the Tough Decisions of Service Reduction
There are some occasions when transit systems are forced to cut service, raise fares, have layoffs, or sometimes do all of these simultaneously, despite a continued demand for service (due to rapid increases in fuel prices resulting in increased demand for service and increased operating costs). When a financial collapse affects economic conditions across the country, public transit systems are confronted with budgetary pressures, which are made even worse by declining revenue from local, regional and state sources.
99
Cutting transit service is one of the most difficult tasks undertaken by service planners. The goal of service reduction is to reduce costs with a minimum impact on passengers, especially those with limited or no alternative transportation. The service planner must balance service reductions that have a major impact on a smaller number of riders versus a minor impact on a larger number of riders. The decision is oftentimes whether to increase the headway on a route that barely meets standards or discontinue a poor route with fewer riders with no transit alternative.
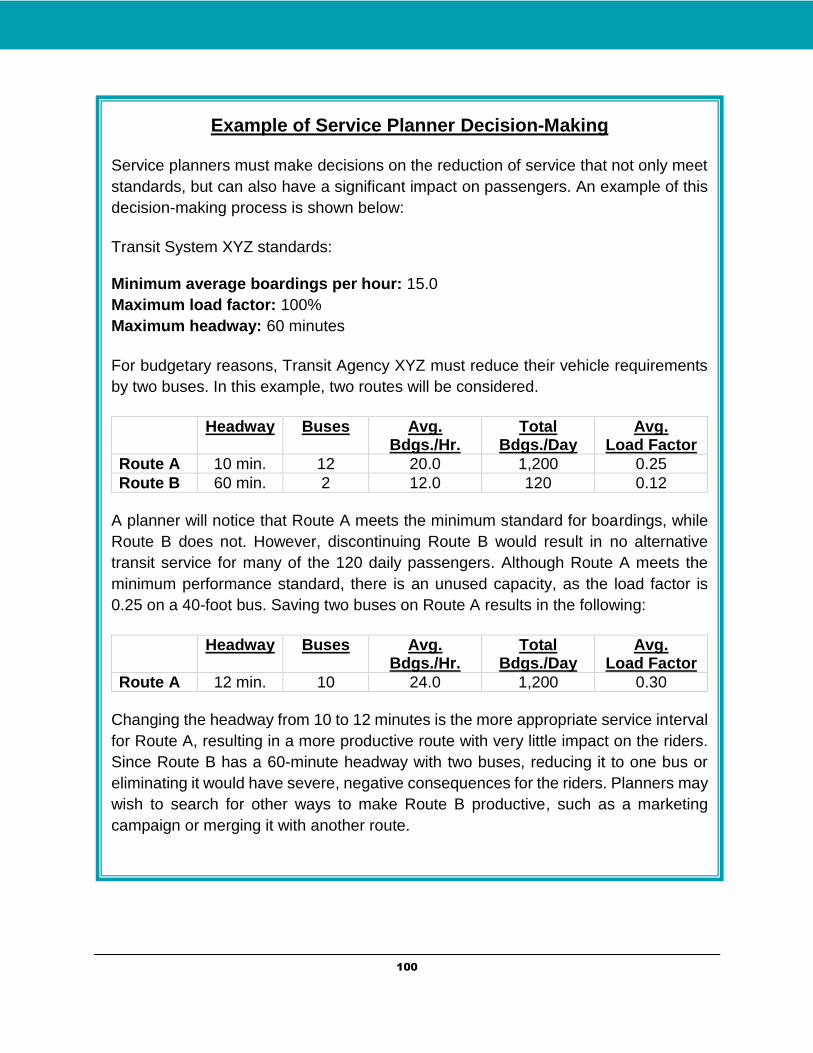
100
Example of Service Planner Decision-Making
Service planners must make decisions on the reduction of service that not only meet
standards, but can also have a significant impact on passengers. An example of this
decision-making process is shown below:
Transit System XYZ standards: Minimum average boardings per hour: 15.0
Maximum load factor: 100%
Maximum headway: 60 minutes
For budgetary reasons, Transit Agency XYZ must reduce their vehicle requirements
by two buses. In this example, two routes will be considered.
Headway Buses Avg. Bdgs./Hr.
Total Bdgs./Day
Avg. Load Factor
Route A 10 min. 12 20.0 1,200 0.25
Route B 60 min. 2 12.0 120 0.12
A planner will notice that Route A meets the minimum standard for boardings, while
Route B does not. However, discontinuing Route B would result in no alternative
transit service for many of the 120 daily passengers. Although Route A meets the
minimum performance standard, there is an unused capacity, as the load factor is
0.25 on a 40-foot bus. Saving two buses on Route A results in the following:
Headway Buses Avg. Bdgs./Hr.
Total Bdgs./Day
Avg. Load Factor
Route A 12 min. 10 24.0 1,200 0.30
Changing the headway from 10 to 12 minutes is the more appropriate service interval
for Route A, resulting in a more productive route with very little impact on the riders.
Since Route B has a 60-minute headway with two buses, reducing it to one bus or
eliminating it would have severe, negative consequences for the riders. Planners may
wish to search for other ways to make Route B productive, such as a marketing
campaign or merging it with another route.
101
Improving Capacity by Increasing Travel Speed
The capacity on a bus route is the product of the route’s frequency and the number of passengers on each bus. To obtain a higher capacity, one may increase the frequency of buses or increase the passenger-carrying capacity of each bus, or both. Improved speeds can result in a better headway at no additional cost if the average speed of a route can be increased by either reducing bus stops or providing priority to transit.
Planning and Scheduling Measures to Improve Reliability
Reliability is one of the service characteristics most important to transit customers, while service quality and customer satisfaction have been linked to higher levels of retention, and possibly even ridership gain. Interestingly, studies of travel behavior suggest, depending on trip length and total travel time, the cost of unreliable service may actually be greater than the cost of travel time. Over time, the inconvenience, uncertainty, and added time costs of unreliable service diminish user confidence and may result in decreased ridership. Thus, improving the consistency of transit waiting and travel time might foster a larger, more satisfied, and more committed base of customers.
In theory, improving transit service reliability has been linked to increases in transit demand for particular routes and should also increase service productivity, given accurate schedules. Reliability is the ability of the transit system to adhere to a schedule or maintain regular headways and a consistent travel time. In other words, reliability can be defined as the variability in the system’s performance measured over a period of time.
Methods for improving transit service reliability include: implementing changes in driver behavior (through training), better matches of schedules to actual service, implementing control actions such as bus holding at timepoints, implementing
102
transit signal priority (TSP), and modifying route design (route length, bus stop consolidation, and relocation).
On-Time Performance
Transit agencies often use the following measures in an attempt to improve the schedule adherence of their routes:
Modify schedules by adding a running time, known as schedule padding. This is the most common solution, but agencies often add a running time by cutting the layover time, which adversely affects the ability to recover from unplanned incidents. If the layover time is to remain the same, it may require an increased expenditure in the system's budget or a slight reduction in the number of trips.
Cutting other underperforming services. The savings generated from eliminating or reducing other services may be used to improve service reliability on other higher-performing routes.
Modifying routes to a route where buses can be less obstructed, provided this does not interfere with the ability of riders to reach their buses.
Splitting a long route into two or more shorter ones, as shorter routes are more likely to remain on schedule.
Some cities have introduced bus rapid transit services or limited stop lines on long, overcrowded routes. This involves the use of part of the route's budget to operate another line on the same route that stops only at key points. While the overall frequency of the original route is reduced, riders traveling over a longer distance have the option of taking a quicker trip on the limited-stop line.
Differences also exist between how reliability is perceived by transit agencies versus passengers. A reliable service for a passenger is one that can be easily accessed at both the origin and destination and arrives predictably, resulting in a shorter waiting
103
time, has a short in-vehicle time, and has low variance in run time. This means that any deviation from these factors results in a decline in reliability, and the key difference between the two perspectives is run time. In this case, an efficient transit planning and, particularly, scheduling can improve reliability. The service planner and scheduler must balance schedule reliability with system efficiency. For example, increasing route recovery time can improve on-time performance, but recovery is non-revenue time and the route becomes less efficient.
Coordination with Other Transportation Organizations
To truly serve the future transportation market, transit service will need to become less stratified and more regional, with seamless connections for passengers traveling between one provider and the next. Coordinating public transportation across traditional agency or jurisdictional boundaries, in many instances, will require new paradigms of service delivery.
A coordinated public transportation system efficiently provides comprehensive and user-friendly public and private transportation services. Transportation programs share resources, facilities, and information, as well as coordinate trip reservations, scheduling, dispatching, and passenger trips. Currently, many social service programs that serve the elderly, children, low-income, and people with disabilities are faced with funding and/or programmatic barriers that discourage coordinated transportation services. These barriers often result in the duplication of transportation services, or result in riders’ unmet transportation needs. Removing these institutional barriers is often the first step to offering coordinated transportation services.
Coordination is not a goal in itself; it is a tool to be used in meeting the overall goal of better mobility and an increased cost-effectiveness of services. A successful coordination effort will lead to changes in institutional structures (e.g., numbers of providers, funding sources used, etc.); services (e.g., service types, hours per day,
104
areas covered, etc.); and performance (e.g., efficiency, effectiveness, and cost-effectiveness). When implemented correctly, these changes will lead to the ultimate goal of increasing consumer satisfaction through greater community mobility.
The benefits resulting from coordination efforts depend on the type and degree of coordination and on the characteristics of the region. In developing a coordination plan, stakeholders may want to emphasize some benefits as particular goals for their region. Some potential benefits of transit coordination efforts are listed below:
Benefits to transit riders/travelers:
More travel alternatives for commuters
Increased mobility and independence for people who do not drive
Improved availability and convenience of medical trips
Benefits to transit providers:
Improved cost-effectiveness and use of resources
Expansion of service area and client base
Improved visibility of transit service in the community
Ability to leverage new funding sources
Benefits to transportation system:
Reduction in vehicle emissions
Additional travel capacity without building more lane miles
Benefits to employers and the workforce:
Opportunity to attract new workers
105
Reduced need for parking facilities
Potential element of corporate pollution-reduction programs
106
F. Implementation of Service Plans
Facilities Planning
Operating Logistics
The primary area within the street devoted to bus movements is called the “bus zone,” which allows the vehicle to pull over to the curb for the purpose of loading and unloading passengers. The geometry of the street should accommodate both transit and general traffic. Bus transit requires a stop location within the roadway that provides the vehicle sufficient space for deceleration and acceleration (to exit and reenter traffic flow), and requires a clear area to discharge and receive passengers efficiently and safely.
A bus terminus is a designated place where a bus starts or ends its scheduled route. Termini can be located at bus stations, interchanges, bus garages or bus stops. Termini can start and stop at the same place, or may be in different locations for starting and finishing a route.
At the end of a route, a bus turnaround should be provided to enable the buses to return to the service routes. Ideally, this should be beyond the last stop at an off-street location. A bus turnaround is a roadway facility that expedites a bus return to the roadway or bus route, and can be incorporated into designs for new developments to allow the buses to operate on the site.
Bus turnaround facilities may be used as an off-street waiting and service area for transit passengers, and should be designed so the bus can be turned in a counter-clockwise direction for better visual capabilities for bus operators. They should also be designed for adequate space for a bus to pass a standing transit bus.
107
Bus Stop Issues
A high-quality transit stop is one that is well connected to the neighborhood or community it serves, accommodates the needs of all transit passengers safely and comfortably, and permits efficient and cost-effective transit operations. Stop spacing refers to the distance between stops along a route, and reflects a trade-off between transit accessibility (convenient access to frequent stops) and operating efficiency. Simply put, additional stops along a route make it more accessible by walk-up riders, but cause the route to operate more slowly for riders already in the vehicle. This impairs the transit service’s efficiency and cost-effectiveness, and makes it less attractive to riders.
The design of bus stop waiting areas and provision of amenities that enhance security and comfort plays a significant role in a person’s decision to use transit. Passenger amenities are installed at selected bus stops to improve passenger comfort and the relative attractiveness of transit as a transportation alternative. The selection of bus stops at which to install amenities takes into account a number of factors, including:
Average daily boardings
Proximity to major trip generators
Passenger activity
Surrounding land uses
Planned neighborhood improvements
Transit corridor marketing efforts
Equity among communities in the valley
108
Proximity of other nearby sheltered areas
Proximity to other bus stops on the opposite side of the street
Customer and community requests
The proper location of bus stops is critical to the safety of passengers and motorists, and to the proper operation of the transit system. Bus stops are generally located at intersections where they maximize pedestrian accessibility from both sides of the street and provide connections to intersecting bus routes. The first design determination in bus stop placement is whether stops should be near-side (before the intersection), far-side (after the intersection), or mid-block. Bus turning movement and the location of major generators frequently dictate the placement of stops at or near an intersection.
Far-side bus stops (Figure 14) are located immediately after an intersection, allowing the vehicle to pass through the intersection before stopping for passenger loading and unloading. When the bus reenters the traffic stream, the upstream signal regularly generates gaps in traffic, allowing buses to reenter the traffic lane. Far-side stops require shorter deceleration distances and provide for additional right-turn capacity by eliminating bus blockage within the curb lane on the approach to the intersection. Additionally, the location of the stop encourages pedestrians to cross behind the bus. These safety and capacity benefits are the reasons that far-side stops are often preferred by transit agencies if traffic signal and geometry conditions are favorable (Bureau of Local Roads & Streets Manual, Special Design Elements, IDOT, pg. 41-4(1), 2006).
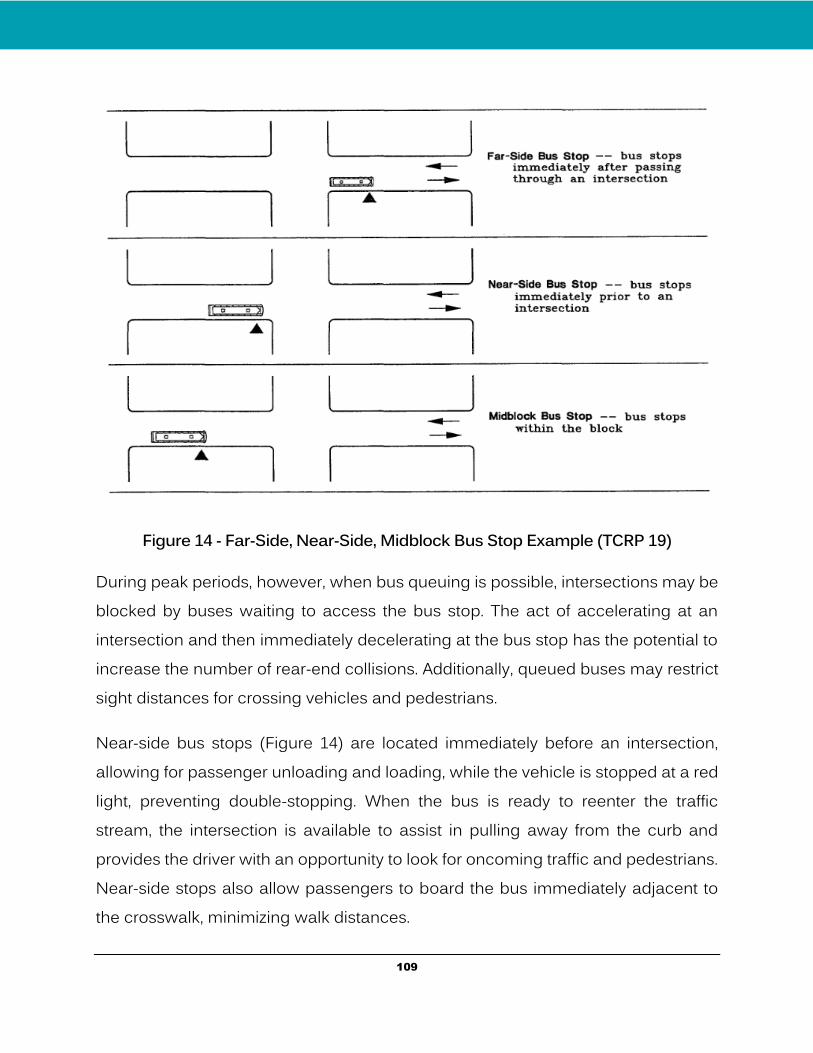
109
Figure 14 - Far-Side, Near-Side, Midblock Bus Stop Example (TCRP 19)
During peak periods, however, when bus queuing is possible, intersections may be blocked by buses waiting to access the bus stop. The act of accelerating at an intersection and then immediately decelerating at the bus stop has the potential to increase the number of rear-end collisions. Additionally, queued buses may restrict sight distances for crossing vehicles and pedestrians.
Near-side bus stops (Figure 14) are located immediately before an intersection, allowing for passenger unloading and loading, while the vehicle is stopped at a red light, preventing double-stopping. When the bus is ready to reenter the traffic stream, the intersection is available to assist in pulling away from the curb and provides the driver with an opportunity to look for oncoming traffic and pedestrians. Near-side stops also allow passengers to board the bus immediately adjacent to the crosswalk, minimizing walk distances.
110
During peak periods, however, queued buses may block the through lane on the approach to the intersection, potentially disrupting traffic flow. The stop configuration also generates conflicts with right-turning vehicles, and delays associated with loading and unloading may lead to unsafe driving, in which right-turning vehicles drive around the transit vehicle to make a right turn in front of a bus. Additionally, queued buses may restrict sight distances for crossing pedestrians.
Mid-block bus stops (Figure 14) are located in between intersections, which are generally less congested locations than intersection stop locations. As pedestrian crossings are less common at mid-block stops, vehicle and pedestrian sight distance concerns are typically minimized, but the distance passengers must travel between the bus and a protected crosswalk is increased. These stops can be paired with major mid-block generators to reduce walking distances for the majority of transit uses at the stop.
Mid-block stops should generally be used only under special circumstances. However, they increase walking distances for transit users crossing at the nearest intersection, and even encourage illegal mid-block street crossings. Additionally, mid-block stops require both deceleration and acceleration areas, requiring either additional no-parking restrictions or increased turnout construction costs, compared to intersection stops. Tables 23 and 24 give a better understanding of the comparison of these types of bus stop locations.
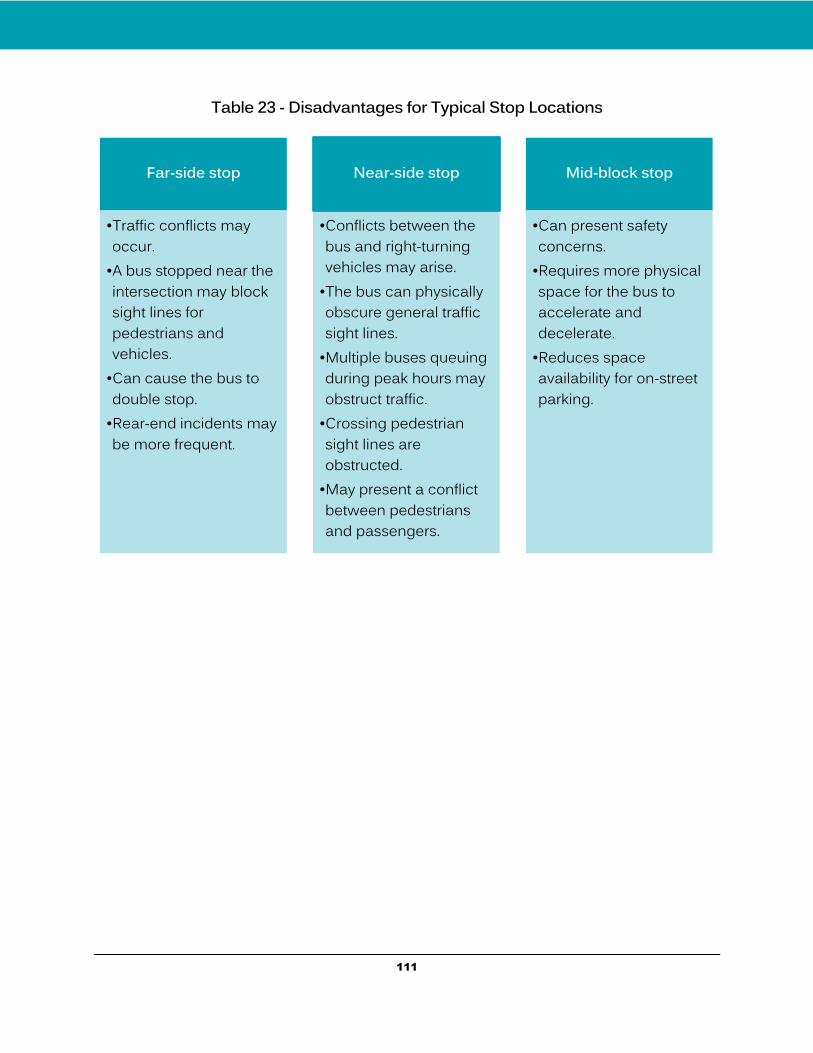
111
Table 23 - Disadvantages for Typical Stop Locations
Far-side stop
•Traffic conflicts may occur.
•A bus stopped near the intersection may block sight lines for pedestrians and vehicles.
•Can cause the bus to double stop.
•Rear-end incidents may be more frequent.
Near-side stop
•Conflicts between the bus and right-turning vehicles may arise.
•The bus can physically obscure general traffic sight lines.
•Multiple buses queuing during peak hours may obstruct traffic.
•Crossing pedestrian sight lines are obstructed.
•May present a conflict between pedestrians and passengers.
Mid-block stop
•Can present safety concerns.
•Requires more physical space for the bus to accelerate and decelerate.
•Reduces space availability for on-street parking.
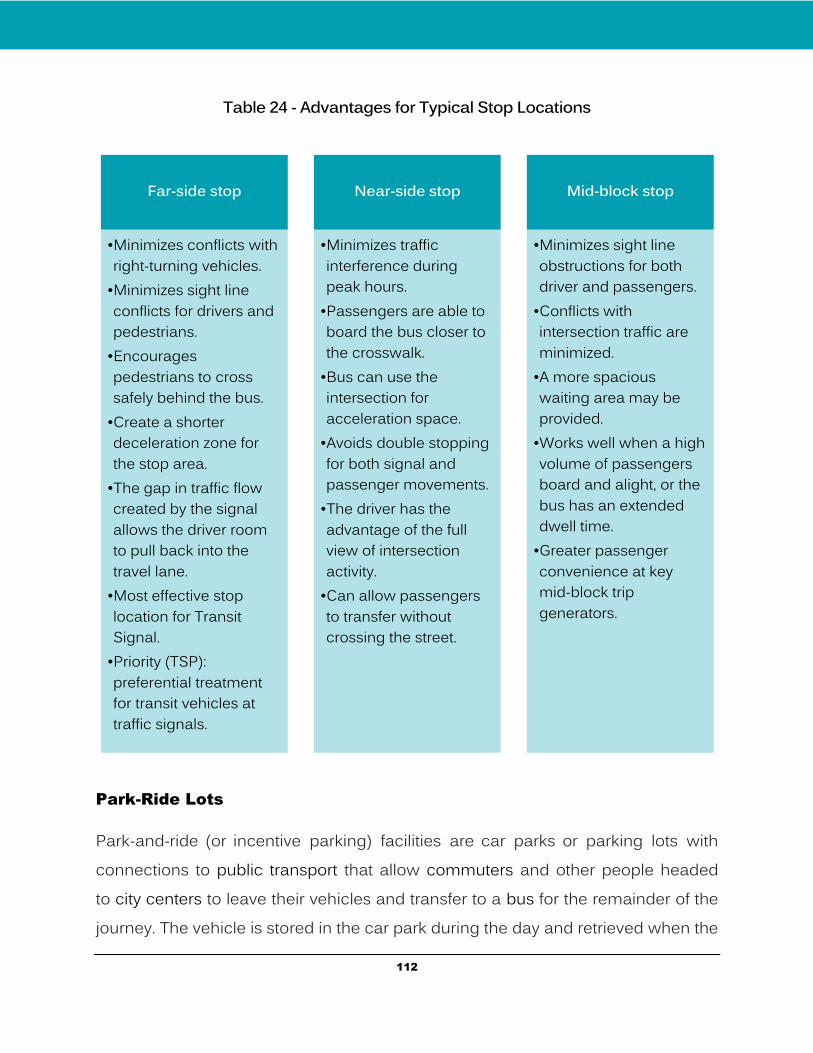
112
Table 24 - Advantages for Typical Stop Locations
Park-Ride Lots
Park-and-ride (or incentive parking) facilities are car parks or parking lots with connections to public transport that allow commuters and other people headed to city centers to leave their vehicles and transfer to a bus for the remainder of the journey. The vehicle is stored in the car park during the day and retrieved when the
Far-side stop
•Minimizes conflicts with right-turning vehicles.
•Minimizes sight line conflicts for drivers and pedestrians.
•Encourages pedestrians to cross safely behind the bus.
•Create a shorter deceleration zone for the stop area.
•The gap in traffic flow created by the signal allows the driver room to pull back into the travel lane.
•Most effective stop location for Transit Signal.
•Priority (TSP): preferential treatment for transit vehicles at traffic signals.
Near-side stop
•Minimizes traffic interference during peak hours.
•Passengers are able to board the bus closer to the crosswalk.
•Bus can use the intersection for acceleration space.
•Avoids double stopping for both signal and passenger movements.
•The driver has the advantage of the full view of intersection activity.
•Can allow passengers to transfer without crossing the street.
Mid-block stop
•Minimizes sight line obstructions for both driver and passengers.
•Conflicts with intersection traffic are minimized.
•A more spacious waiting area may be provided.
•Works well when a high volume of passengers board and alight, or the bus has an extended dwell time.
•Greater passenger convenience at key mid-block trip generators.
113
owner returns. Park-and-rides are generally located in the suburbs of metropolitan areas or on the outer edges of large cities. Park-and-ride is abbreviated as "P+R" on road signs.
In theory, park-and-ride facilities allow commuters to avoid the stress of driving a congested part of their journey and facing scarce, expensive city-center parking. These facilities are meant to avoid congestion by encouraging people to use public transportation as opposed to their own personal vehicles. They do so by making it easier for people to use public transportation in an urban area with traffic congestion. Park-and-ride facilities serve the needs of commuters who live beyond a practical walking distance from a bus stop, which offers service to the city center.
Park-and-ride facilities may suit commuters with alternative fuel vehicles, which often have a reduced range, since the facility may be closer to home than the ultimate destination. They also are useful as a fixed meeting place for car-sharing and car-pooling. Also, some transit operators use park-and-ride facilities to encourage more efficient driving practices by reserving parking spaces for low emission designs, high-occupancy vehicles, or car-sharing.
Many facilities provide convenient services such as passenger waiting areas and toilets. At larger facilities, additional services such as a travel office, food shop, car wash, cafeteria, or other shops and services may be provided. These are often encouraged by municipal operators to improve the attraction of using park-and-ride.
A bus station is a structure where city or intercity buses stop to pick up and drop off passengers. It is larger than a bus stop, which is usually simply a place on the roadside where buses can stop. It may be intended as a terminal station for a number of routes, or as a transfer station where the routes continue. Bus station platforms may be assigned to fixed bus lines, or vary in combination with a dynamic passenger information system.
114
Americans with Disabilities Act (ADA) Requirements
The Department of Transportation has issued regulations mandating accessible public transit vehicles and facilities. The regulations include requirements that specify that all new fixed-route, public transit buses be accessible, and that supplementary paratransit services be provided for individuals with disabilities that cannot use the fixed-route bus service.
The ADA Title II applies to public transportation services such as public city buses and rail transit systems, like Amtrak, commuter rails, and subway systems. Public transportation agencies may not discriminate against individuals with disabilities. They must also abide by a number of other ADA requirements, such as providing disability access in new vehicles, and providing the disabled with access to bus stops.
In addition, the ADA requires public transportation agencies to provide paratransit services. Typically, this is a van transportation service that assists individuals who are unable to use public transportation due to a physical or mental impairment; the individuals are picked up and dropped off at their destinations. The paratransit service must be comparable to the city's fixed bus system, in terms of routes and availability.
In complying with the ADA's requirements, the United States Department of Transportation (USDOT) has issued minimum guidelines for accessibility on public transit vehicles. Some important vehicle regulations in assisting Americans with disabilities are:
Platform barriers to prevent wheelchairs from rolling off
Strong and large handrails
Vehicle ramps or bridge plates
115
Lift equipment to load wheelchairs
Priority seating for the disabled
Proper and clear doorways and pathways in subways
Proper lighting on ramps and doorways
In addition, the ADA has several requirements for bus stops, shelters, access to stops and transit stations, all of which the transit planner must be familiar with.
Plan Approval/Acceptance
Title VI
The Federal Transit Administration (FTA) issued Circular 4702.1A in 2007, which defines Title VI and Environmental Justice compliance procedures for recipients of FTA-administered transit program funds. Specifically, the FTA requires recipients to evaluate significant system-wide service changes and proposed improvements at the planning and programming stages to determine whether those changes have a discriminatory impact.
According to Section 601 of Title VI, ‘’No person in the United States shall, on the ground of race, color, or national origin, be excluded from participation in, be denied the benefits of, or be subjected to discrimination under any program or activity receiving Federal Financial assistance.”
Disparate Impact: The Federal Transit Administration defines “disparate impacts” as neutral policies or practices that have the effect of disproportionately excluding or adversely affecting members of a group protected under Title VI, and the recipient’s policy or practice lacks a substantial legitimate justification. If the results of the analysis indicate a potential for disparate impacts, further investigation is performed. This investigation uses qualitative assessments and/or the “four-fifths
116
rule” to determine whether disparate impacts exist. In this analysis, if the quantitative results indicate that the Concept Plan service changes provide benefits to minority/low-income groups at a rate of less than 80 percent of the benefits provided to non-minority/non-low-income groups, there could be evidence of disparate impacts. If disparate impacts are found using this threshold, mitigation measures should be identified and implemented if it meets the same legitimate justification with less disparate impact.
Management Concurrence
An agency can prepare an annual Service Implementation Plan to document route performance and identify pending and potential changes and improvements to bus services for the next several years. The plan identifies near-term strategies for service improvement to implement a comprehensive plan for public transportation. Service changes allow the modification of existing route alignments, schedules, bus stops and facilities in order to improve overall service. For minor changes, it is typical for the process to remain internal to the agency. No public comment or board approval is needed. For major changes, public input, committees, and board approval all become part of the process. Whether the changes are major or minor, service planners must obtain the approval of management before going to the public.
Community Meetings and Public Hearings
The components of the public input process can vary from agency to agency, but involves some method for the public to be involved and voice concerns about any major proposed service changes. Agencies may use public hearings (the most common method), neighborhood meetings, open houses, and focus groups as ways to gather interested customers together. In addition, onboard customer surveys are another method used to gauge public opinions. Transit agencies employ committees as a process to refine service plans, and eventually to make
117
recommendations to the board. Committees can be internal to the transit agency and can be composed of members of service planning and operations (including bus drivers). Other transit departments may also be consulted during this process. External committees include the Citizen’s Advisory Committees (CACs) and Technical Advisory Committees (TACs). It may be required by the local city or county government that agencies present service changes to these committees prior to presenting to the board. It is nearly a universal practice among all transit systems that major service changes must be approved by the local city or county board.
In an effort to gather input from the public and to inform transit users of all scheduled changes to the service, the agency will gather input continually from the public through telephone conversations, letters, e-mails, and regularly scheduled Community Outreach meetings. In addition, surveys may be conducted for users and employers/employees that have requested some modification to the transit service.
Prior to finalizing any service change, an agency will conduct Community Outreach meetings in areas that will be most directly affected by the change. When a proposed change would eliminate a route or significantly reduce the span of service or frequency of service along a route, the agency can actively solicit and consider input from the affected area through neighborhood meetings and/or onboard surveys. A significant reduction in the span of service on a route is often defined as the elimination of a time period (such as midday service) or weekend service. A significant reduction in the frequency of service on a route can be defined as a 100% increase or more in the headway of the route. A major service reduction is defined as a decrease in annualized service hours by more than 25% on a route.
Prior to each service change, the modifications are presented to the board for their information or approval. Such meetings are open to the public.
118
Staff Acceptance and Union Agreements
A Union agreement is a written, legally enforceable contract for a specified period (usually one year), between the management of the agency and its employees represented by an independent trade union. It sets down and defines conditions of employment (wages, working hours and conditions, overtime payments, holidays, and vacations benefits) and procedures for dispute resolution.
To initiate the implementation of a transit plan, agreements are made between the parties who are either representing the transit agency or the employees. The collective bargaining agreement must be adhered to, but implementing service changes will go smoother if the union is involved and buy-in to the process.
Agency Coordination
Transit operators are most likely to achieve measurable improvement in the safety, efficiency, and quality of service that users experience in their day-to-day use of transit systems when they work together to develop strategies and tactics. The successful conception, development, implementation, and execution of these strategies and tactics may be used to achieve an intra-agency functionality in the transportation system.
Collaboration should go beyond solving a problem. Its purpose should be that of combining the knowledge, expertise, and information of many disciplines within the agency to produce and operate an efficient transportation system. Service planning must support operations by informing transit operators of changes in routes. Operator training must be fully aware of upcoming service changes to advise operating personnel. Planning also must coordinate with marketing on the best way to provide the changes to the riding public.
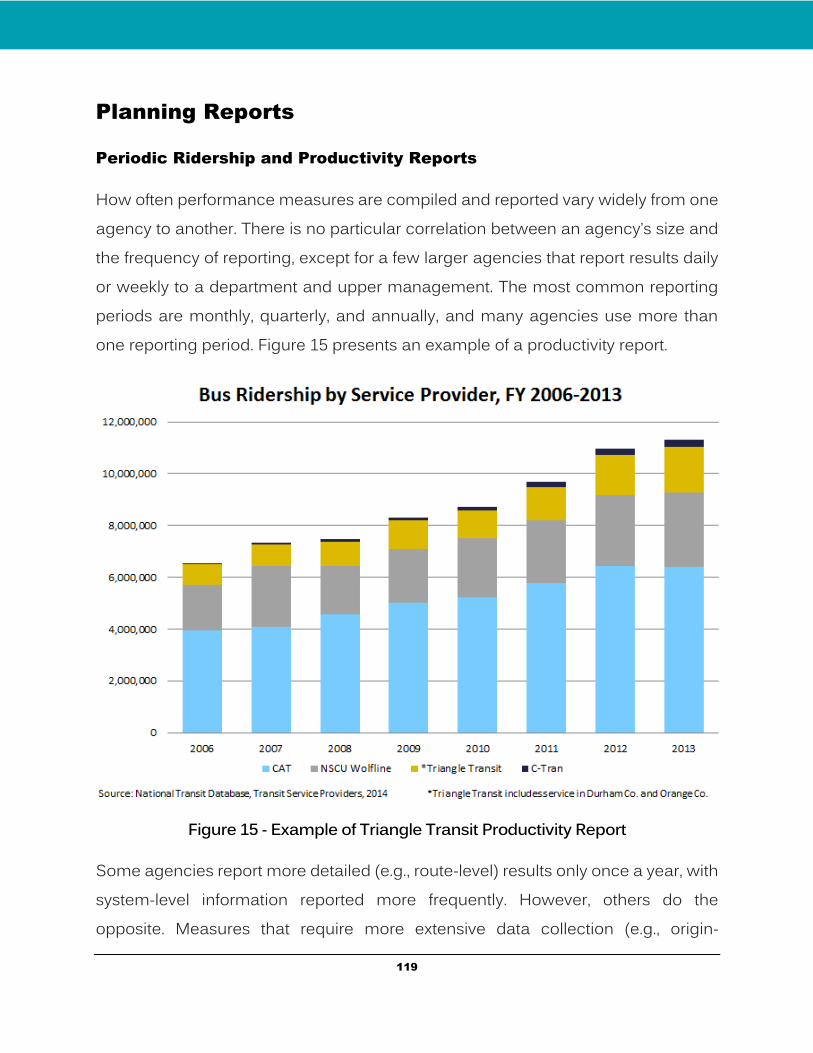
119
Planning Reports
Periodic Ridership and Productivity Reports
How often performance measures are compiled and reported vary widely from one agency to another. There is no particular correlation between an agency’s size and the frequency of reporting, except for a few larger agencies that report results daily or weekly to a department and upper management. The most common reporting periods are monthly, quarterly, and annually, and many agencies use more than one reporting period. Figure 15 presents an example of a productivity report.
Figure 15 - Example of Triangle Transit Productivity Report
Some agencies report more detailed (e.g., route-level) results only once a year, with system-level information reported more frequently. However, others do the opposite. Measures that require more extensive data collection (e.g., origin-
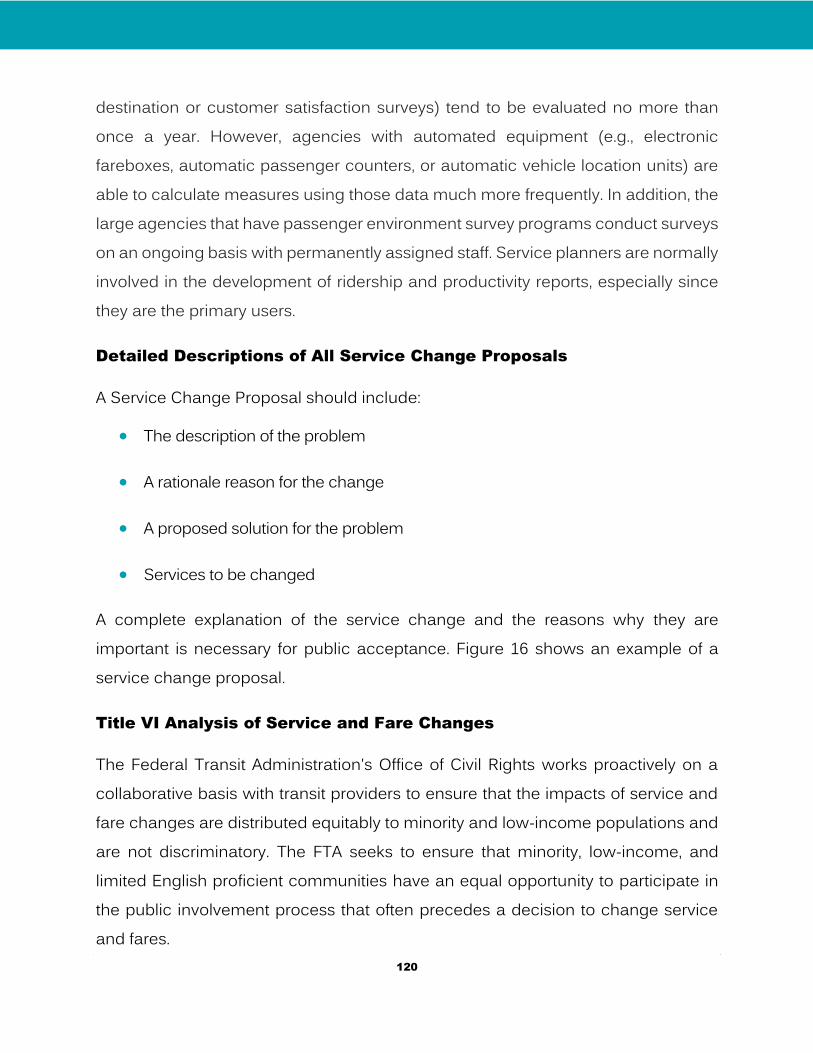
120
destination or customer satisfaction surveys) tend to be evaluated no more than once a year. However, agencies with automated equipment (e.g., electronic fareboxes, automatic passenger counters, or automatic vehicle location units) are able to calculate measures using those data much more frequently. In addition, the large agencies that have passenger environment survey programs conduct surveys on an ongoing basis with permanently assigned staff. Service planners are normally involved in the development of ridership and productivity reports, especially since they are the primary users.
Detailed Descriptions of All Service Change Proposals
A Service Change Proposal should include:
The description of the problem
A rationale reason for the change
A proposed solution for the problem
Services to be changed
A complete explanation of the service change and the reasons why they are important is necessary for public acceptance. Figure 16 shows an example of a service change proposal.
Title VI Analysis of Service and Fare Changes
The Federal Transit Administration's Office of Civil Rights works proactively on a collaborative basis with transit providers to ensure that the impacts of service and fare changes are distributed equitably to minority and low-income populations and are not discriminatory. The FTA seeks to ensure that minority, low-income, and limited English proficient communities have an equal opportunity to participate in the public involvement process that often precedes a decision to change service and fares.
121
Figure 16 - Example of Service Change Proposal (Source: Transport for London)
The Title VI Requirements and Guidelines for Federal Transit Administration Recipients provides service and fare equity guidance to transit agencies with 50 additional fixed route vehicles in peak service in large urbanized areas (over 200,000 in population). Public transportation providers must follow Title VI’s guidelines prior to the implementation of fare changes to ensure that minority and low-income populations are not unfairly affected. The written procedures and results of service and/or fare equity analyses shall be included in the transit provider’s Title VI Program. For service changes, this requirement applies to “major service changes” only. Service planners conduct the analysis to determine if there are disparate impacts and prepares the justifications for the major service change.
122
G. Transit Service Monitoring
Data Collection Plan
The two broad categories of service monitoring activities are ridership monitoring and route/branch performance monitoring. Ridership monitoring helps control if the service provided is adequate to the passenger demand. Data collection and analysis activities for this type of monitoring include point checks, ride checks, and analysis of data to determine passenger boardings. Ridership monitoring permits quick response to demand changes. Route/branch performance monitoring ensures the effectiveness of existing services with respect to their variable operating costs and usage. Data collection and analysis activities for performance monitoring include running time checks, point checks, bus productivity analysis, and analysis of data.
The National Transit Database (NTD) was established to accumulate financial and operating data on mass transit. A transit agency with ten or more vehicles in peak service must submit reports to the NTD. An agency with 100 or more vehicles, or lying within an urbanized area greater than 200,000 persons, has greater reporting requirements than a smaller property. The Federal Transit Administration (FTA) uses the information for many purposes, such as making “formula” grants under the Urbanized Area Formula Program. Formula grants are apportioned according to an agency’s operating expense, passenger miles and revenue miles. An agency should provide annual boardings, passenger miles, revenue miles and revenue hours for fixed-route service. There are specific requirements in seeking approval from FTA:
Written sampling plan to clearly describe the sampling and factoring methodology.
Written calibration plan to identify outlying data and ensure proper counting operation.
123
Concurrent application of NTD reporting by new and old methodologies over a fiscal year, and a comparison between the two methods.
Certification by a qualified statistician that the methodology meets or exceeds FTA’s prescribed confidence and precision level of 95% +/- 10%.
Once transit agencies submit their data to the NTD, an FTA contractor performs data validation procedures to confirm that the data are complete and do not vary 10 percent more or less from the previous year’s data. The contractor notifies the transit agency of any data issues discovered during the validation process, and then the agency reports the data (such as revenues, expenses, and transit service characteristics) to the NTD. FTA validates transit agencies’ NTD data using automatic checks and a manual validation process. Using NTD data, FTA runs annual formula calculations to determine the allocation of formula grant funds to the urbanized areas. Transit agencies in each urbanized area decide how to divide the funding from the formula grant.
On-Time Performance
On-time performance or schedule reliability directly impacts transit passengers; it is considered a key measure of transit service. It is a measure of system reliability and influences customer satisfaction. On-time performance is normally calculated by randomly sampling timepoints and recording whether the transit service is on-time, late, or early. Some systems consider departure from scheduled time to five minutes late to be “on-time.” However, there are no industry standards. There are systems that consider a range from two minutes early to five minutes late to be on-time, while others use one minute early and five minutes late.
In general, on-time performance standards for U.S. transit systems range from 75% to 95%. Aside from the manual collection of random timepoint samples, most large transit systems use AVL or APC data to determine on-time performance.
124
Passenger Complaints
During the normal course of providing service to the community, it is possible that passengers and/or members of the public will desire to lodge complaints about the quality of new or revised transit service or the manner in which transit service is delivered. Every effort should be made to handle these issues quickly, courteously and fairly. All employees should be reminded that everyone in the community has the right to express concerns about transit operations. One should also remember that the mere allegation of impropriety, however, does not establish proof that a violation has occurred. Every effort will be made to address and resolve customer complaints as quickly as possible.
A complaint is an allegation by a member of the public that there has been a specific violation, misinterpretation, or inappropriate act by a member of the transit agency. There are toll-free complaint lines (to the drivers, station managers, track workers and other employees) for buses. Complaints are entered into a database and are then forwarded to the relevant department for investigation. Passengers can also go to walk-in centers or mail complaint letters to the agency’s address (or email through the agency’s website). Agencies have a systemic way of handling complaints up the chain of command.
Market Research
Market research is a key factor to maintaining competitiveness among competitors. It provides important information that identifies and analyzes the market need, market size and competition from both riders and non-riders. Market research, which includes social and opinion research, is the systematic gathering and interpretation of information about individuals or organizations using statistical and analytical methods and techniques of the applied social sciences to gain insight or support decision making.
125
Transit agencies use market research for a variety of purposes:
scheduling and operations planning
long-range planning and design
performance analyses
market penetration and market segmentation analyses
data gathering on mode choice and travel patterns
consumer perceptions and preferences
pricing elasticity
customer satisfaction
trip planning
supply and demand
crime mapping
new product and service evaluations
In addition, market research shows where to target resources to have the greatest impact on maintaining and increasing ridership. Because the data are used extensively throughout the major departments within transit agencies, reliable and cost-effective market research is a priority.
Figure 17 shows an example of a bus rider survey used by PSTA.
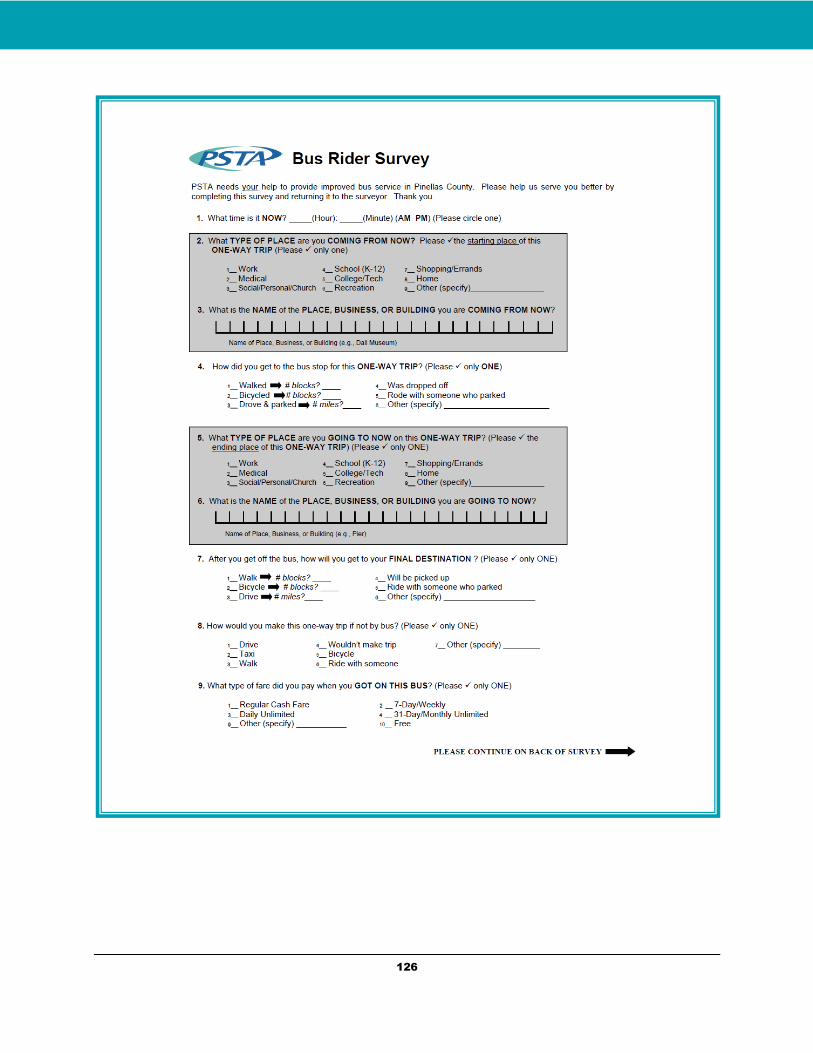
126
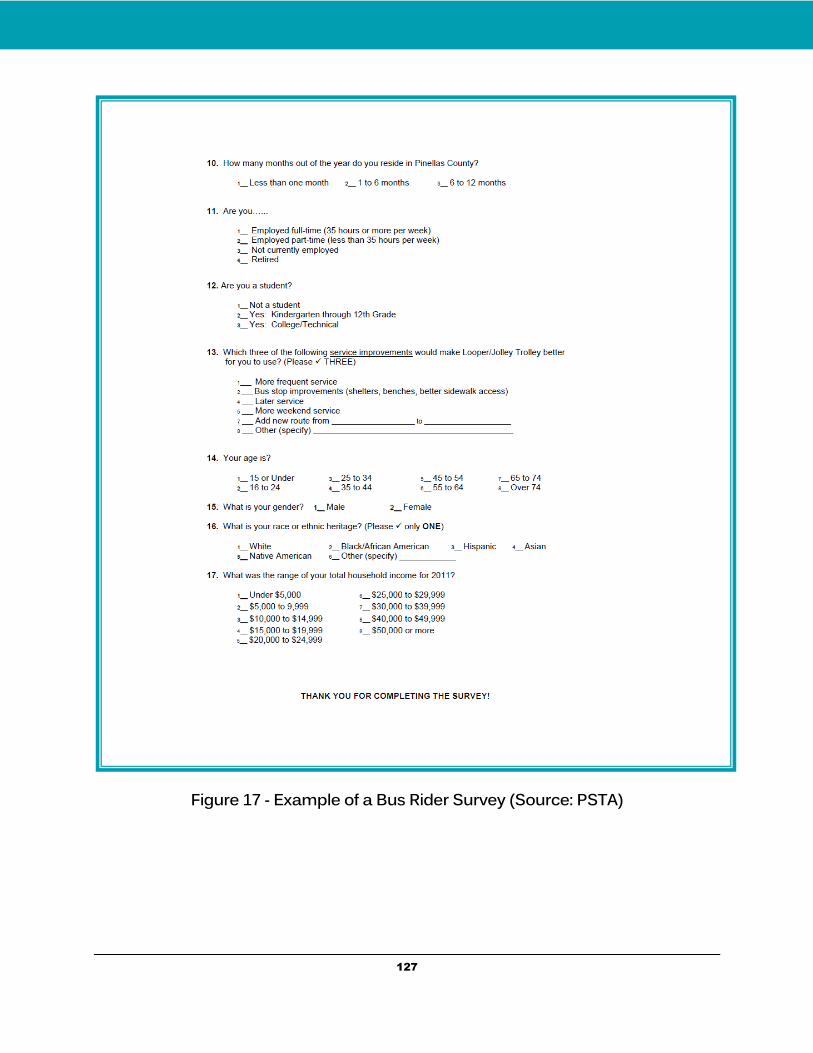
127
Figure 17 - Example of a Bus Rider Survey (Source: PSTA)
128
H. Recommended Reading
American Public Transportation Association (APTA). (2014). Transit fact book. American Public Transit Association
Gray George E. and Lester A. Hoel. (1992). Public Transportation 2nd. Ed. Prentice Hall, Englewood Cliffs, New Jersey.
Canadian Urban Transit Association (CUTA). (1993). The Canadian Transit Handbook (Third ed.).
Transportation Research Board of the National Academies, 1996. Guidelines for the Location and Design of Bus Stops. TCRP Report 19. Washington, DC.
Transportation Research Board, National Research Council. (1999). Data Analysis for Bus Planning and Monitoring (A Synthesis of Transit Practice), Boston, Massachusetts.
Furth, P., B. Hemily, T. Muller, and J. Strathman (2006). Using Archived AVL-APC Data to Improve Transit Performance and Management (TCRP Report 113). Transportation Research Board of the National Academies , Wasington, D.C.
For additional information on subjects related to transit planning, please refer to the different sources included in the References section of this manual.
129
Transit Scheduling
The Transit Scheduling section engages in step-by-step procedures, as follows:
A. Introduction: What is Transit Scheduling?
Scheduling is a profession that requires a combination of art and knowledge; although it requires pragmatism as an inevitable part, creativity also should be added in order to improve it. Scheduling can be performed either manually or with the help of computer-aided software tools. Either way, the scheduler is the key element. Since there is no specific and unique solution for scheduling, success is reached by continuous work and analysis to maximize both efficiency and profit. The continuity of scheduling originates from frequent changes. Even a small change in passenger demand, service policy, or traffic condition may necessitate producing a new schedule. Preparing accurate and efficient schedules helps to enhance the quality of public service. A good scheduler must rationally evaluate feasible options to maximize the efficiency of services.
Transit scheduling is a very challenging task because it requires a scheduler to have knowledge of both internal (transit operations) and external factors (agency policies and collective bargaining agreement). Transit schedulers should always remember that the effectiveness of the transit schedule is heavily influenced by the agency’s service standards and policies, which establish guidelines on how services should be implemented. As a result, it is a time-consuming process for transit schedulers
Section
2
130
to create efficient and cost-effective schedules; however, there are computer-aided tools that assist transit schedulers in finding optimal solutions presented by these influencing factors. The most common issue of transit scheduling is vehicle and driver assignment due to some constraints presented by labor union agreements. It should be mentioned that computer aided tools help the scheduler speed up the process and do the work accurately. Utilizing these tools, however, does not eliminate the need for knowledge and understanding of the entire process.
131
B. Scheduling Process
There are four steps involved in scheduling (See Figure 18):
Timetable Development
In this step, the scheduler develops a service schedule for a particular route. The scheduler assembles information to develop a timetable, including span of service, headway, timepoints, running times, round-trip cycle time, and layover/recovery time. The use of reliable information is critical in this step, as it affects the quality of service.
Blocking
Once the master schedule (document that includes the timepoints, trips, and times along the routes) is ready, the scheduler begins the blocking process. Blocking involves assigning trips to specific vehicles. In this step, the scheduler determines the number of vehicles needed to operate all trips in the timetable. Once the timetable is created, the scheduler starts to link trips together to create work assignments that later must be assigned to vehicles. To accomplish this, schedulers use blocking sheets as a tool to manually enter the detailed information, including block number, pull-in times, trip numbers, departure and arrival times at terminal points, and pull-out times. Blocking is an important process because it affects operating costs.
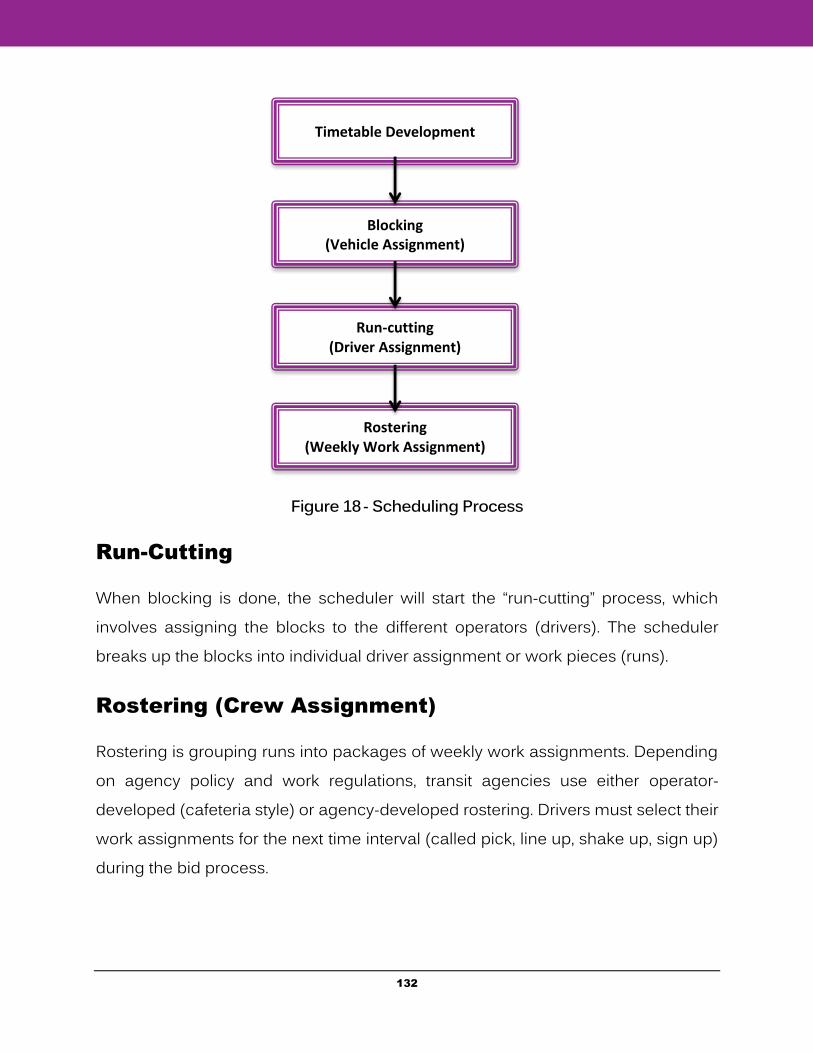
132
Figure 18 - Scheduling Process
Run-Cutting
When blocking is done, the scheduler will start the “run-cutting” process, which involves assigning the blocks to the different operators (drivers). The scheduler breaks up the blocks into individual driver assignment or work pieces (runs).
Rostering (Crew Assignment)
Rostering is grouping runs into packages of weekly work assignments. Depending on agency policy and work regulations, transit agencies use either operator-developed (cafeteria style) or agency-developed rostering. Drivers must select their work assignments for the next time interval (called pick, line up, shake up, sign up) during the bid process.
Timetable Development
Blocking (Vehicle Assignment)
Run-cutting (Driver Assignment)
Rostering (Weekly Work Assignment)
133
Major Functions of the Transit Scheduler
Adhering to Appl icable Rules, Standards, and Pol ic ies
Schedulers must adhere to agency policies, budget and collective bargaining agreements. They should be informed of the issues surrounding their work, as well as of the objectives and goals of the agency. Schedulers must have an understanding of the transit agency, structures, policies, objectives and other related issues.
Collective bargaining agreements or Union contracts contain particular requirements that impact the scheduling process in terms of how the service is scheduled, blocked, and cut into driver runs. Therefore, it is important that the scheduler fully understands the labor agreement, as well as the “past practice” of the agency concerning scheduling.
Developing Schedule Scenarios for Planning Purposes
Schedulers develop scheduling scenarios for planning purposes and participate in the service planning process. Although service planners plan routes that meet the required criteria, schedulers make the route work operationally. The connection between service planners and schedulers is highly essential in order to develop routes and schedules that are compatible with the agency’s objectives.
Building Reliable Schedules
Schedulers must develop reliable schedules. They have an important role in providing a reliable quality service to the riding public by developing accurate schedules.
Customer Service is directly affected by the reliability of the transit schedules. Schedules provide essential information to riders, including departure, arrival and trip duration times, which are required to plan a trip. Therefore, optimized and
134
accurate schedules can greatly increase the level of the agency’s customer satisfaction and improve the image of the agency.
Providing Good Working Condit ions in Operators
Assignments
Schedulers should prepare route schedules and operators’ assignments in a manner that provides good working conditions for drivers. Since transit schedules include operators’ workday assignments, providing a good schedule can minimize operators’ level of stress and absenteeism. Since operators directly interact with customers, running and layover times may affect this interaction. Agencies benefit from improved quality of customer service through satisfied operators.
Supporting Other Organizational Sections
The scheduling section also supports other processes in the organization related to the service. Scheduling provides information and data to support other sectors, including administration, marketing, planning, operations, and many downstream systems such as the transit call center. Therefore, the transit agency as a whole depends on schedules to be accurate and reliable.
Estimating Service Costs and Requirements
Scheduling information is needed to estimate operating costs, vehicle requirements, and operator staffing needs for proposed service changes. The major expense that transit agencies deal with is operating costs. It is the responsibility of the scheduler to be cognizant of operating resources and minimize them in such a way that does not affect reliability in terms of required service frequency, operating speed, and safety.
135
Timetable Development
What is a Timetable?
The general idea behind timetabling is generating a schedule for services operated by public transit vehicles. A timetable can be defined as a schedule showing the arrival and departure times of buses from specified locations, called timepoints. Timetables are published for public usage. Transit passengers must refer to timetables in order to plan their trips. Traditionally, transit agencies prepare service schedules in printed form. Nowadays, public timetables are also available in a variety of electronic formats.
Timetable inputs require the necessary data to develop route information and service times. This data includes the headway of service for a given route, the expected running times between timepoints, and the span of service.
Service Standards and Policies
Each transit organization has a particular set of service standards, guidelines and policies, all of which greatly impact the scheduling process. These standards and policies, which vary from one organization to another, provide certain instructions, which must be followed while timetabling, blocking, and cutting runs into operator assignments. In other words, an agency’s standards and policies place some restrictions on the scheduling process.
Which sections of timetable development are mostly affected by service standards and policies?
In terms of the timetabling process, organizational guidelines and policies greatly affect route patterns, service frequencies, and service timing.
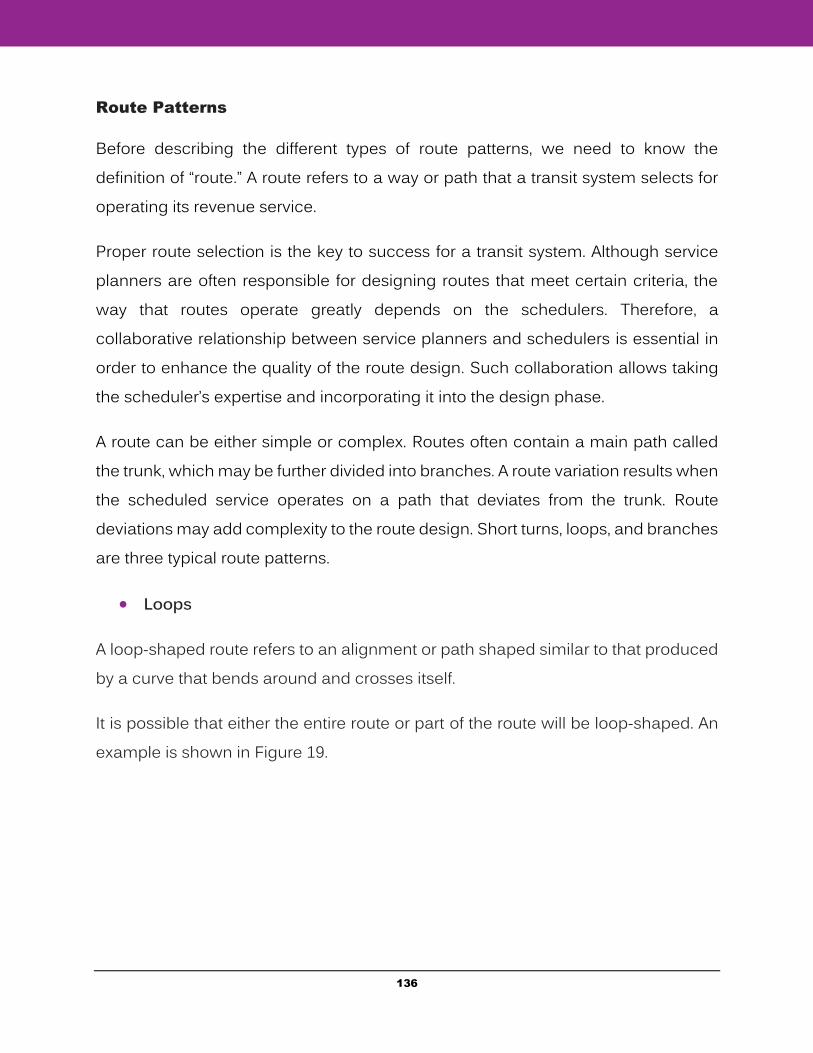
136
Route Patterns
Before describing the different types of route patterns, we need to know the definition of “route.” A route refers to a way or path that a transit system selects for operating its revenue service.
Proper route selection is the key to success for a transit system. Although service planners are often responsible for designing routes that meet certain criteria, the way that routes operate greatly depends on the schedulers. Therefore, a collaborative relationship between service planners and schedulers is essential in order to enhance the quality of the route design. Such collaboration allows taking the scheduler’s expertise and incorporating it into the design phase.
A route can be either simple or complex. Routes often contain a main path called the trunk, which may be further divided into branches. A route variation results when the scheduled service operates on a path that deviates from the trunk. Route deviations may add complexity to the route design. Short turns, loops, and branches are three typical route patterns.
Loops
A loop-shaped route refers to an alignment or path shaped similar to that produced by a curve that bends around and crosses itself.
It is possible that either the entire route or part of the route will be loop-shaped. An example is shown in Figure 19.
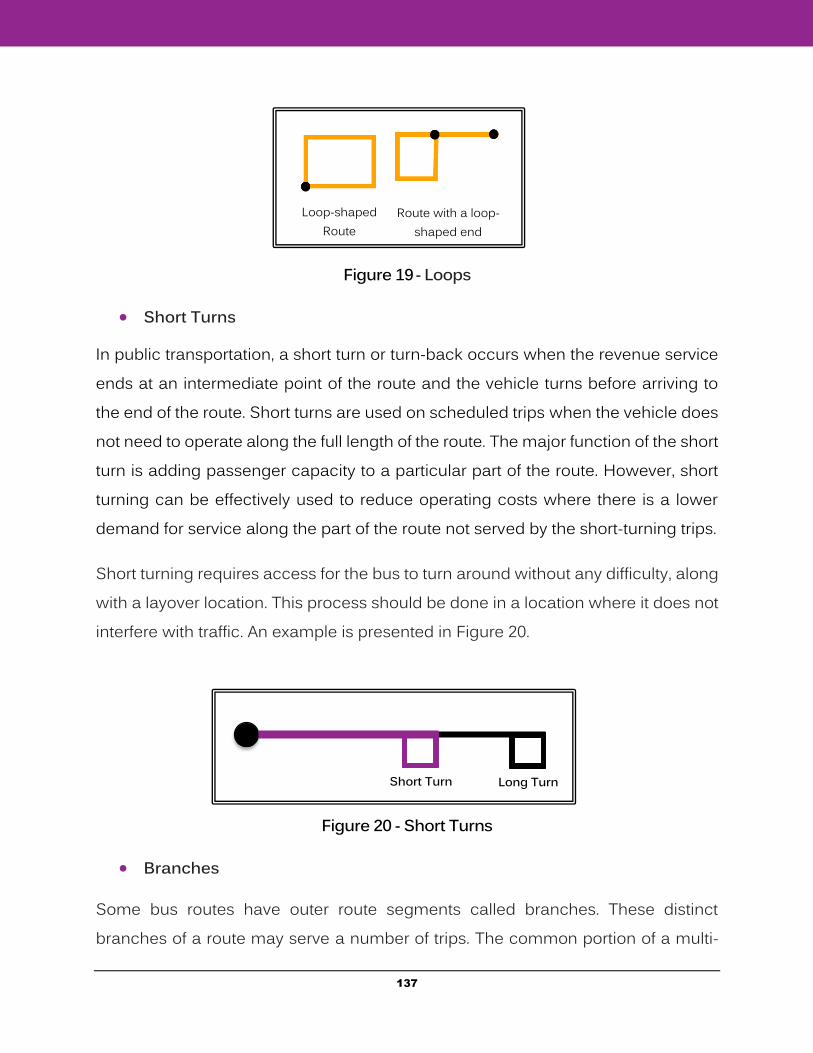
137
Figure 19 - Loops
Short Turns
In public transportation, a short turn or turn-back occurs when the revenue service ends at an intermediate point of the route and the vehicle turns before arriving to the end of the route. Short turns are used on scheduled trips when the vehicle does not need to operate along the full length of the route. The major function of the short turn is adding passenger capacity to a particular part of the route. However, short turning can be effectively used to reduce operating costs where there is a lower demand for service along the part of the route not served by the short-turning trips.
Short turning requires access for the bus to turn around without any difficulty, along with a layover location. This process should be done in a location where it does not interfere with traffic. An example is presented in Figure 20.
Figure 20 - Short Turns
Branches
Some bus routes have outer route segments called branches. These distinct branches of a route may serve a number of trips. The common portion of a multi-
Loop-shaped Route
Route with a loop-shaped end
Short Turn Long Turn
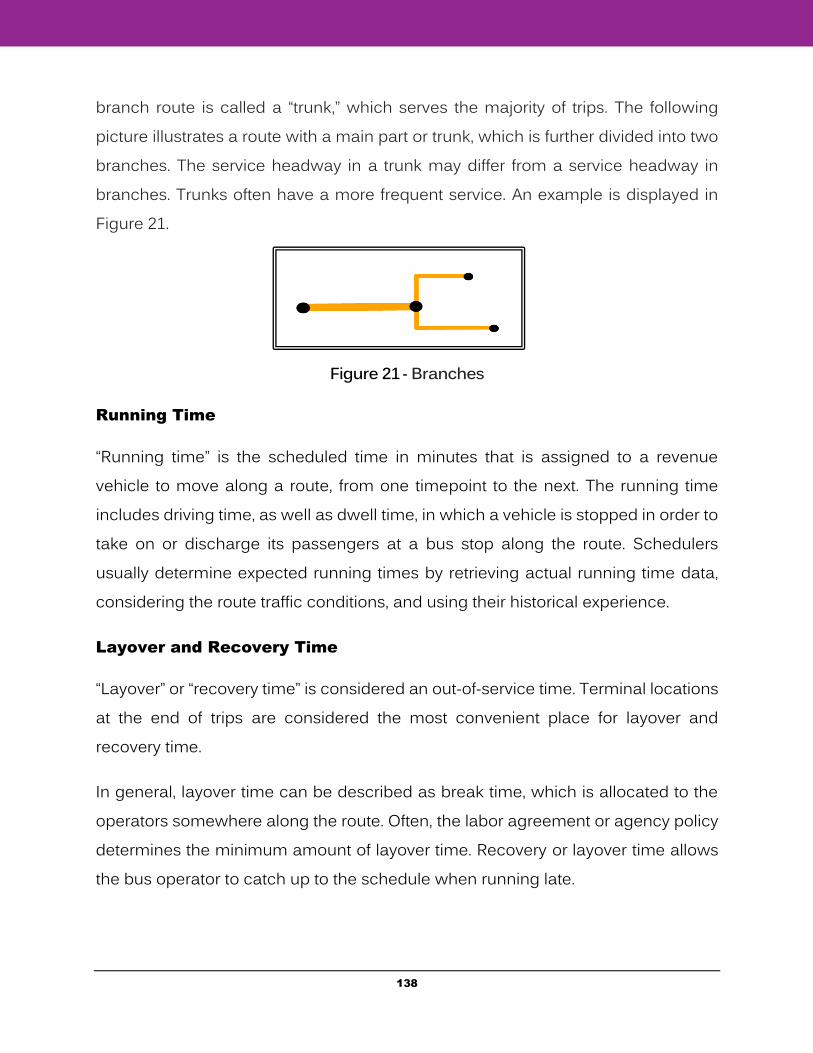
138
branch route is called a “trunk,” which serves the majority of trips. The following picture illustrates a route with a main part or trunk, which is further divided into two branches. The service headway in a trunk may differ from a service headway in branches. Trunks often have a more frequent service. An example is displayed in Figure 21.
Figure 21 - Branches
Running Time
“Running time” is the scheduled time in minutes that is assigned to a revenue vehicle to move along a route, from one timepoint to the next. The running time includes driving time, as well as dwell time, in which a vehicle is stopped in order to take on or discharge its passengers at a bus stop along the route. Schedulers usually determine expected running times by retrieving actual running time data, considering the route traffic conditions, and using their historical experience.
Layover and Recovery Time
“Layover” or “recovery time” is considered an out-of-service time. Terminal locations at the end of trips are considered the most convenient place for layover and recovery time.
In general, layover time can be described as break time, which is allocated to the operators somewhere along the route. Often, the labor agreement or agency policy determines the minimum amount of layover time. Recovery or layover time allows the bus operator to catch up to the schedule when running late.
139
Since layover and recovery time provide extra time, it allows operators to change head signs, make trip sheet entries, and perform other tasks. Although layover and recovery times are often used indiscriminately, they are different. Recovery time is a type of time allowance, which is mainly used to maintain the schedules, and also gives operators a break. On the other hand, a layover is a mandatory time during which drivers are supposed to take a break.
Labor agreements and agency policies usually determine the minimum layover and recovery time that is required for a round trip. For example, it may be stated in the labor agreement that a minimum of a 10% layover/recovery time must be allocated for every trip. In this case, if the round trip takes 76 minutes, at least 8 minutes must be assigned for layover or recovery time (76 * 10% = 7.6 ≅ 8 min).
Cycle Time
The scheduler should analyze the available data to determine the accurate running/travel time needed for vehicles to run from one end of the route to the other and return. The cycle time is determined after calculating the travel time (running time) and the layover/recovery time; it is the result of the sum of the running time and the layover/recovery time. Therefore, the total number of minutes required for a round trip on the route is called “cycle time,” and it includes layover and recovery time.
NOTE:
Cycle time = Round-trip running time + Layover/Recovery time
The general preference is that schedules maintain a constant headway or interval time between the revenue service that move in the same direction on the route. Schedulers usually assign a cycle time other than the agency’s minimum requirement. The new extended cycle time is known as available cycle time.
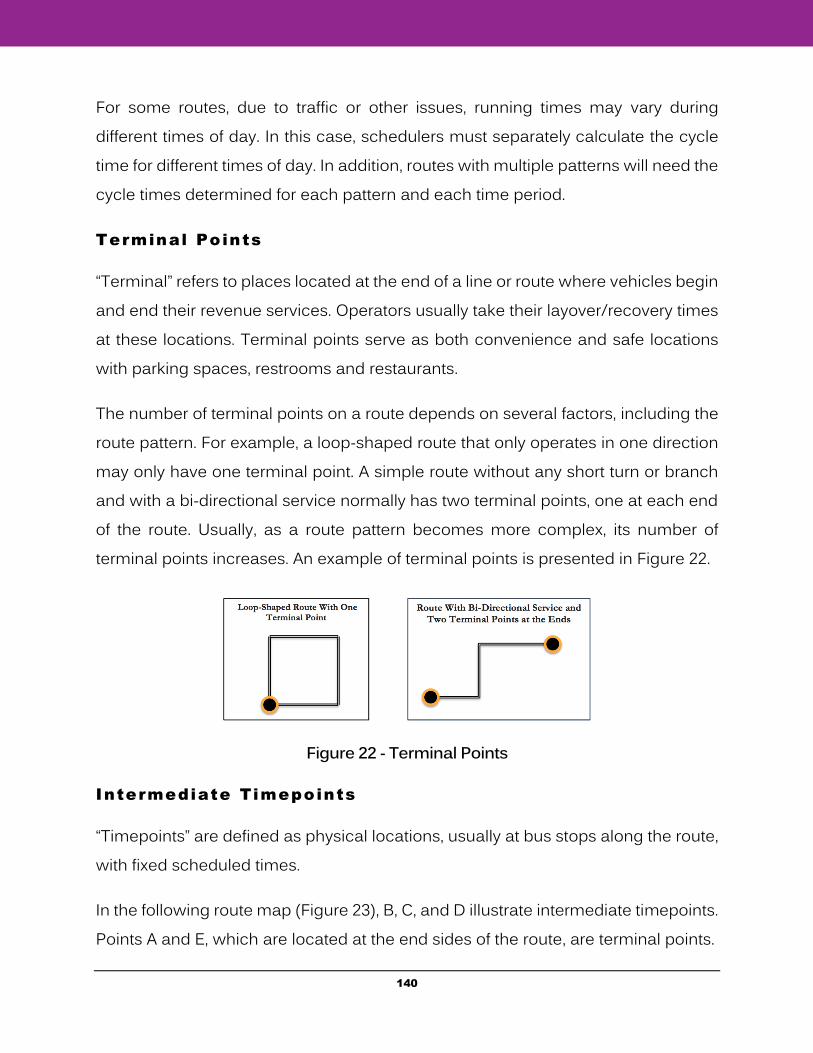
140
For some routes, due to traffic or other issues, running times may vary during different times of day. In this case, schedulers must separately calculate the cycle time for different times of day. In addition, routes with multiple patterns will need the cycle times determined for each pattern and each time period.
Terminal Points
“Terminal” refers to places located at the end of a line or route where vehicles begin and end their revenue services. Operators usually take their layover/recovery times at these locations. Terminal points serve as both convenience and safe locations with parking spaces, restrooms and restaurants.
The number of terminal points on a route depends on several factors, including the route pattern. For example, a loop-shaped route that only operates in one direction may only have one terminal point. A simple route without any short turn or branch and with a bi-directional service normally has two terminal points, one at each end of the route. Usually, as a route pattern becomes more complex, its number of terminal points increases. An example of terminal points is presented in Figure 22.
Figure 22 - Terminal Points
Intermediate Timepoints
“Timepoints” are defined as physical locations, usually at bus stops along the route, with fixed scheduled times.
In the following route map (Figure 23), B, C, and D illustrate intermediate timepoints. Points A and E, which are located at the end sides of the route, are terminal points.
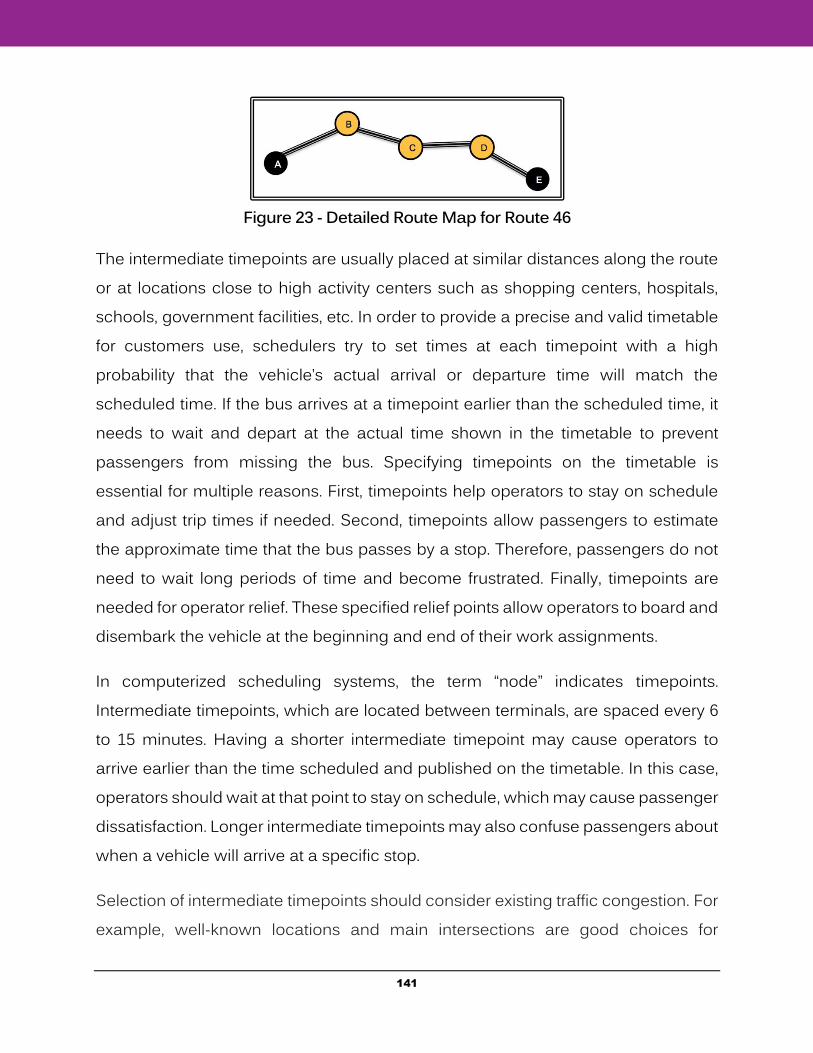
141
Figure 23 - Detailed Route Map for Route 46
The intermediate timepoints are usually placed at similar distances along the route or at locations close to high activity centers such as shopping centers, hospitals, schools, government facilities, etc. In order to provide a precise and valid timetable for customers use, schedulers try to set times at each timepoint with a high probability that the vehicle’s actual arrival or departure time will match the scheduled time. If the bus arrives at a timepoint earlier than the scheduled time, it needs to wait and depart at the actual time shown in the timetable to prevent passengers from missing the bus. Specifying timepoints on the timetable is essential for multiple reasons. First, timepoints help operators to stay on schedule and adjust trip times if needed. Second, timepoints allow passengers to estimate the approximate time that the bus passes by a stop. Therefore, passengers do not need to wait long periods of time and become frustrated. Finally, timepoints are needed for operator relief. These specified relief points allow operators to board and disembark the vehicle at the beginning and end of their work assignments.
In computerized scheduling systems, the term “node” indicates timepoints. Intermediate timepoints, which are located between terminals, are spaced every 6 to 15 minutes. Having a shorter intermediate timepoint may cause operators to arrive earlier than the time scheduled and published on the timetable. In this case, operators should wait at that point to stay on schedule, which may cause passenger dissatisfaction. Longer intermediate timepoints may also confuse passengers about when a vehicle will arrive at a specific stop.
Selection of intermediate timepoints should consider existing traffic congestion. For example, well-known locations and main intersections are good choices for
142
timepoints. Other good locations may be close to shopping centers, government and employment centers and hospitals.
Internal Timepoints
An “internal timepoint” is defined as particular points that are provided to help operators adhere to the schedule. Since these points are only 3 to 5 minutes apart, they provide more accurate and detailed information for location and timing. These points are not shown on public timetables; they are only shown on operators’ schedules. The function of internal timepoints is to serve as a reference for operators and supervisors to assess schedule adherence and determine if a trip is running either early or late.
Relief Points
“Relief points” are locations along the route where an operator’s work shift terminates and another operator begins a new work shift to operate the revenue vehicle. Depending on the availability of relief opportunity, an operator relief point may be scheduled to occur at a terminal point or other location along the route. Although operators typically start their work shifts at the agency’s garage facility, sometimes an operator is required to start their shift by relieving another operator at a particular location along the route. Relief must occur at pre-specified relief points. Operator relief is often planned when the scheduled number of hours for a vehicle exceeds the number of hours an operator is scheduled to work in a day.
Transfer Points
“Transfer points” are the locations where transit routes intersect, allowing passengers to disembark one vehicle and board another vehicle. Revenue vehicles operating on different routes are scheduled to accommodate as many transferring passengers as possible. In some situations, schedulers can eliminate the need to transfer by interlining two or more routes that share a common terminal.
143
Developing Routing and Deadhead Instructions
Schedulers should develop routing and deadhead instructions for the timetables. The deadhead routing process includes evaluating and selecting the most cost-effective path, which takes into consideration minimum distance and time for the trip.
Tr ip Shifting
In some scheduling circumstances, it may be necessary to shift one or more trips forward or backward in time. This process is known as “trip shifting” or “slipping and sliding.” The reason behind trip shifting can be a lack of a proper place for a layover, adjusting schedule times, or meeting circumstances like school bell time. Trip shifting is also used to reduce bus requirements during the timetable development and blocking steps.
Transit ioning
The main concept of transitioning is implementing the changes in running time, headway, or both, in a gradual manner. The purpose of this action is to develop a quality schedule. For example, the headway for a specific route may be 15 minutes during peak hours and 30 minutes during base hours. In this case, smoothing out the process of changing the headway from 15 minutes to 30 minutes allows service to gradually change into the new desirable pattern.
Master Schedule
A document that includes all detailed trip information by direction is called a “master schedule.” Creating a master schedule for a route involves the inclusion of all individual trips on that route. Master schedules contain all service days for a given route.
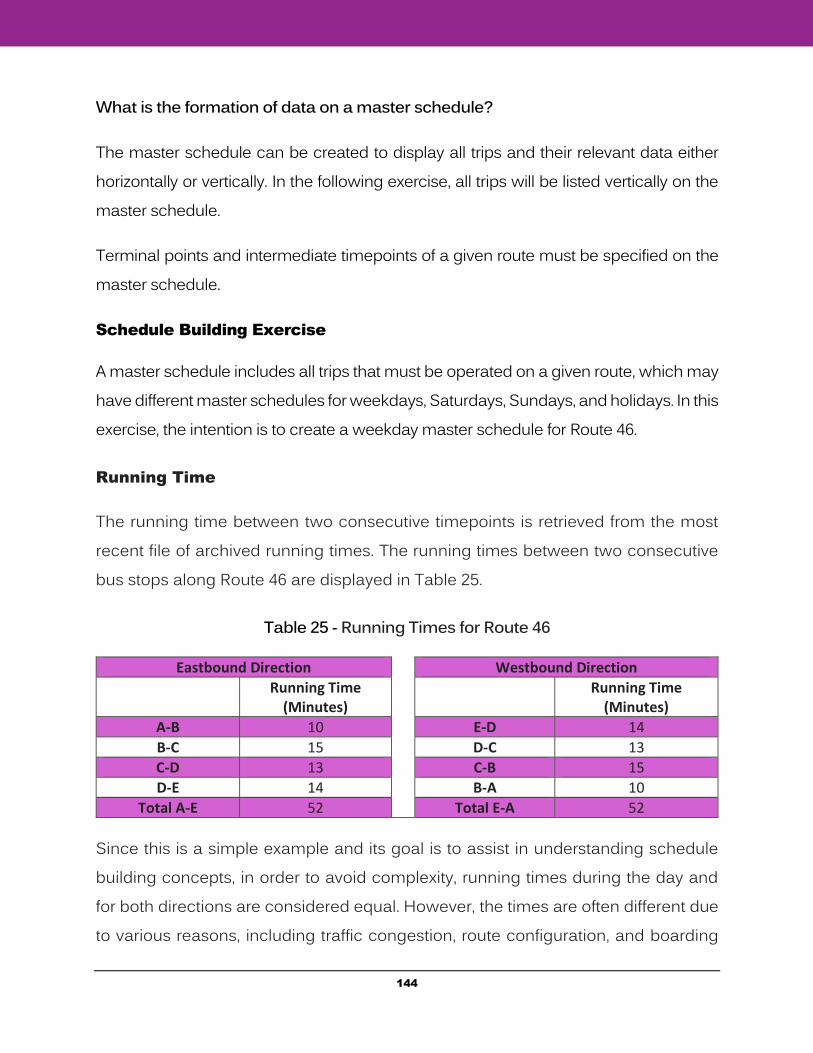
144
What is the formation of data on a master schedule?
The master schedule can be created to display all trips and their relevant data either horizontally or vertically. In the following exercise, all trips will be listed vertically on the master schedule.
Terminal points and intermediate timepoints of a given route must be specified on the master schedule.
Schedule Building Exercise
A master schedule includes all trips that must be operated on a given route, which may have different master schedules for weekdays, Saturdays, Sundays, and holidays. In this exercise, the intention is to create a weekday master schedule for Route 46.
Running Time
The running time between two consecutive timepoints is retrieved from the most recent file of archived running times. The running times between two consecutive bus stops along Route 46 are displayed in Table 25.
Table 25 - Running Times for Route 46
Eastbound Direction Westbound Direction
Running Time (Minutes)
Running Time (Minutes)
A-B 10 E-D 14
B-C 15 D-C 13
C-D 13 C-B 15
D-E 14 B-A 10
Total A-E 52 Total E-A 52
Since this is a simple example and its goal is to assist in understanding schedule building concepts, in order to avoid complexity, running times during the day and for both directions are considered equal. However, the times are often different due to various reasons, including traffic congestion, route configuration, and boarding
145
levels along the route. For example, it may take 10 minutes for a bus to travel from point A to point B during rush or peak-hour traffic, while the time may be shorter during off-peak hours. The configuration of the route may also be different for eastbound and westbound directions. Another reason for a running time difference can be existence of a loop at the end of the route. In this case, when the vehicle reaches the end of the route, it may take more or less time to return.
Headway
As previously mentioned, headway is the time difference between two consecutive vehicles operating in the same direction and on the same route. Clock-face headways are convenient for passengers because the service is consistent every hour. Since passenger demand is higher during peak hours, the headways are frequently smaller. Yet the opposite is true during off-peak hours, when the headway may be greater, which is more suitable for the expected lower passenger demand. Headway depends on the passenger load and the capacity of the vehicle.
In this exercise, Route 46 is supposed to maintain a base 60-minute headway during the day. The service span is from 6:00 AM to 9:00 PM. Peak hours for the route are defined as 6:00 AM to 9:00 AM and 3:00 PM to 6:00 PM. Due to an increase in customer demand, the desired peak headway is 30 minutes.
Round-Trip Cycle Time
This is the most important part in building a schedule. As previously stated, the formula for calculating a round-trip cycle time is as follows:
NOTE:
Cycle time = Round-trip running time + Layover/Recovery time
146
As shown in the Cycle time formula, first there is a need to determine the round-trip running time and the Layover/Recovery time.
Round-trip running time calculation:
The ”total round-trip running time” refers to the number of minutes in which the vehicle is in operation and travels between timepoints. It can be calculated by using the following formula.
Round-trip running time = Running Time from A to E + Running Time from E to A = (52 + 52) = 104
Minimum Layover/Recovery Time:
The minimum required layover/recovery time is considered 10% of the total round-trip running time, according to the labor agreement.
Minimum Layover/Recovery Time = 104 * 10% = 10.4 ~ 11 minutes
In this example, 10% of 104 minutes is equal to 10.4, but we need to round it up to 11, which is the next round number.
Now, if we add 11 minutes, which is the minimum Layover/Recovery time, to 104 minutes, which is the round-trip running time, we obtain 115 minutes as the minimum cycle time (104+11=115).
Available Cycle Time
Are we able to operate the required 60-minute headway with a 115 minutes of cycle time?
The answer is no, because the cycle time always must be a multiple of the headway. In this example, the headway is 60, so cycle time can be 60, 120, etc.
147
Consideration needs to be given to the cycle time calculated in the previous example because it is the minimum amount required and cannot be shortened. With this consideration, we need to change the minimum cycle time (115) to the next highest 60-minute multiple. Thus, the cycle time will need to be changed to 120 minutes. The 120-minute cycle time is called “available cycle time.”
You may still wonder why the cycle time must be a multiple of the headway. The reason is the number of vehicles. The formula for calculating the number of vehicles is as follows:
NOTE:
Number of Vehicles = Cycle Time
Desired Headway
If we choose 115 minutes as the cycle time, according to the formula for calculating the required buses to operate the service, the number of buses needed to operate a 60-minute headway will be 1.92. Obviously, it is impossible to operate 1.92 vehicles.
Number of Vehicles = Cycle Time
Desired Headway =
115
60 = 1.92 (Not Acceptable)
Therefore, to obtain a round number of vehicles, we choose a 120-minute cycle time. Then, the number of operated vehicles will be 2.
Number of Vehicles = Cycle Time
Desired Headway =
120
60 = 2
Hence, in order to operate the 60-minute base headway, we need 2 vehicles. At this point, we need to calculate the number of vehicles for peak-hours with a 30-minute headway.
Number of Vehicles = Cycle Time
Desired Headway =
120
30 = 4
148
The answer is 4, which means that 4 vehicles are needed to operate a 30-minute headway in peak hours. For the base headway, which is 60 minutes, two vehicles are utilized the whole day and during the peak hours. Therefore, the route needs to have 2 additional vehicles during the peak hours.
Applicable Layover/Recovery T ime:
The 120-minute cycle time will change the 11-minute layover/recovery time to 16 minutes.
The applicable 16-minute layover/recovery time can also be obtained by adding the excess layover/recovery time, which is the difference between the available cycle time and minimum cycle time, to the minimum layover/recovery time.
Minimum Layover /recovery time = 11 minutes Excess layover/recovery time = 120 – 115 = 5 minutes
Applicable Layover/recovery time = 11+ 5 = 16 minutes
Developing the Master Schedule for Route 46
Table 26 summarizes the information that we need to use in order to develop the service schedule for Route 46.
We had: Cycle time = Round-trip running time + Layover/Recovery time
So: Layover/Recovery time = Cycle time - Round-trip running time = 120 – 104 = 16
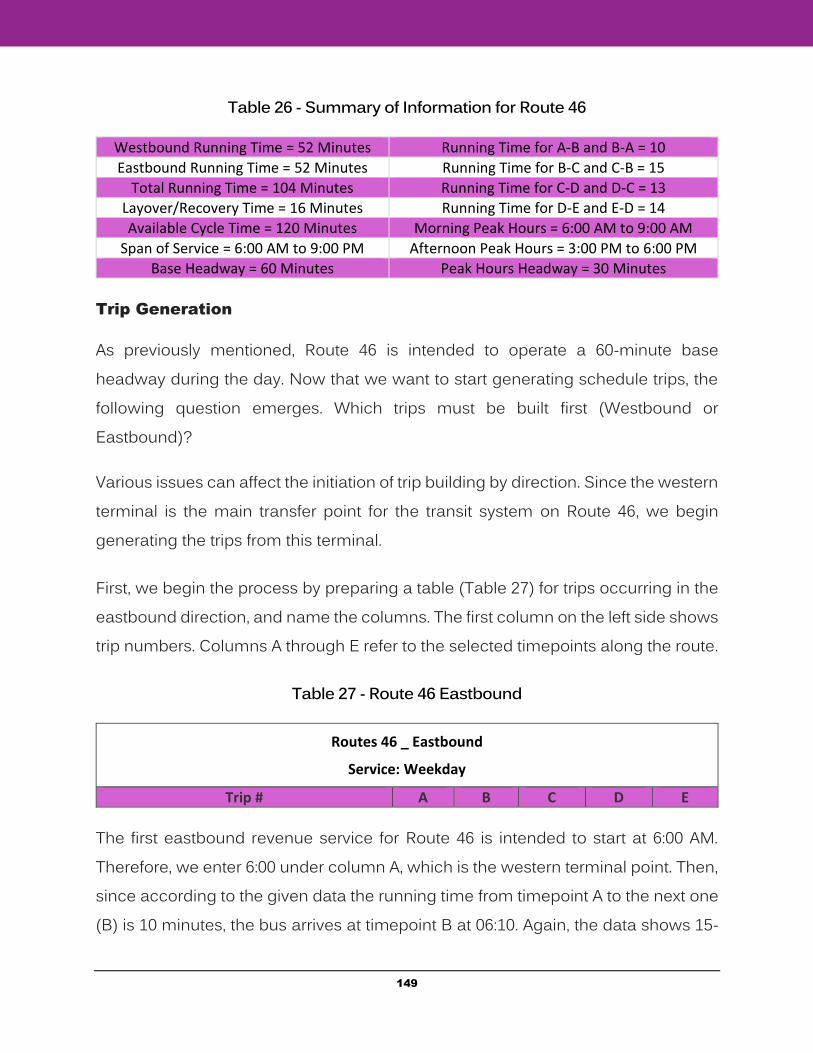
149
Table 26 - Summary of Information for Route 46
Westbound Running Time = 52 Minutes Running Time for A-B and B-A = 10
Eastbound Running Time = 52 Minutes Running Time for B-C and C-B = 15
Total Running Time = 104 Minutes Running Time for C-D and D-C = 13
Layover/Recovery Time = 16 Minutes Running Time for D-E and E-D = 14
Available Cycle Time = 120 Minutes Morning Peak Hours = 6:00 AM to 9:00 AM
Span of Service = 6:00 AM to 9:00 PM Afternoon Peak Hours = 3:00 PM to 6:00 PM
Base Headway = 60 Minutes Peak Hours Headway = 30 Minutes
Trip Generation
As previously mentioned, Route 46 is intended to operate a 60-minute base headway during the day. Now that we want to start generating schedule trips, the following question emerges. Which trips must be built first (Westbound or Eastbound)?
Various issues can affect the initiation of trip building by direction. Since the western terminal is the main transfer point for the transit system on Route 46, we begin generating the trips from this terminal.
First, we begin the process by preparing a table (Table 27) for trips occurring in the eastbound direction, and name the columns. The first column on the left side shows trip numbers. Columns A through E refer to the selected timepoints along the route.
Table 27 - Route 46 Eastbound
Routes 46 _ Eastbound
Service: Weekday
Trip # A B C D E
The first eastbound revenue service for Route 46 is intended to start at 6:00 AM. Therefore, we enter 6:00 under column A, which is the western terminal point. Then, since according to the given data the running time from timepoint A to the next one (B) is 10 minutes, the bus arrives at timepoint B at 06:10. Again, the data shows 15-
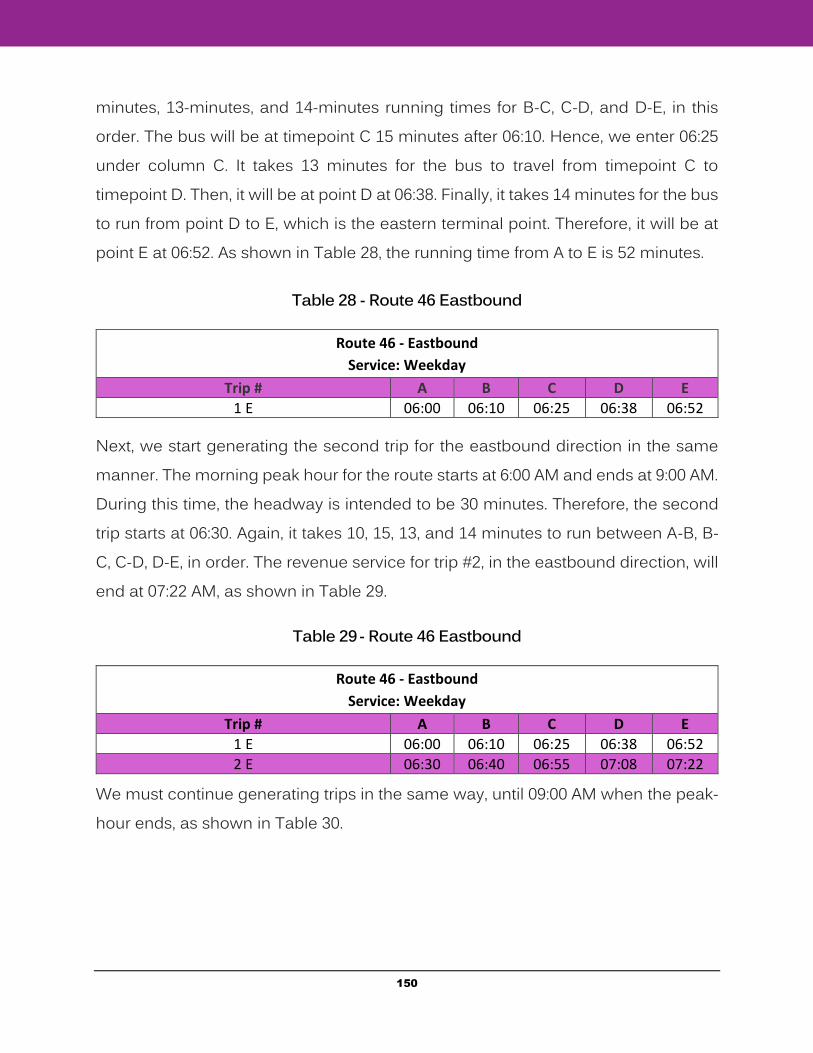
150
minutes, 13-minutes, and 14-minutes running times for B-C, C-D, and D-E, in this order. The bus will be at timepoint C 15 minutes after 06:10. Hence, we enter 06:25 under column C. It takes 13 minutes for the bus to travel from timepoint C to timepoint D. Then, it will be at point D at 06:38. Finally, it takes 14 minutes for the bus to run from point D to E, which is the eastern terminal point. Therefore, it will be at point E at 06:52. As shown in Table 28, the running time from A to E is 52 minutes.
Table 28 - Route 46 Eastbound
Route 46 - Eastbound
Service: Weekday
Trip # A B C D E
1 E 06:00 06:10 06:25 06:38 06:52
Next, we start generating the second trip for the eastbound direction in the same manner. The morning peak hour for the route starts at 6:00 AM and ends at 9:00 AM. During this time, the headway is intended to be 30 minutes. Therefore, the second trip starts at 06:30. Again, it takes 10, 15, 13, and 14 minutes to run between A-B, B-C, C-D, D-E, in order. The revenue service for trip #2, in the eastbound direction, will end at 07:22 AM, as shown in Table 29.
Table 29 - Route 46 Eastbound
Route 46 - Eastbound
Service: Weekday
Trip # A B C D E
1 E 06:00 06:10 06:25 06:38 06:52
2 E 06:30 06:40 06:55 07:08 07:22
We must continue generating trips in the same way, until 09:00 AM when the peak-hour ends, as shown in Table 30.
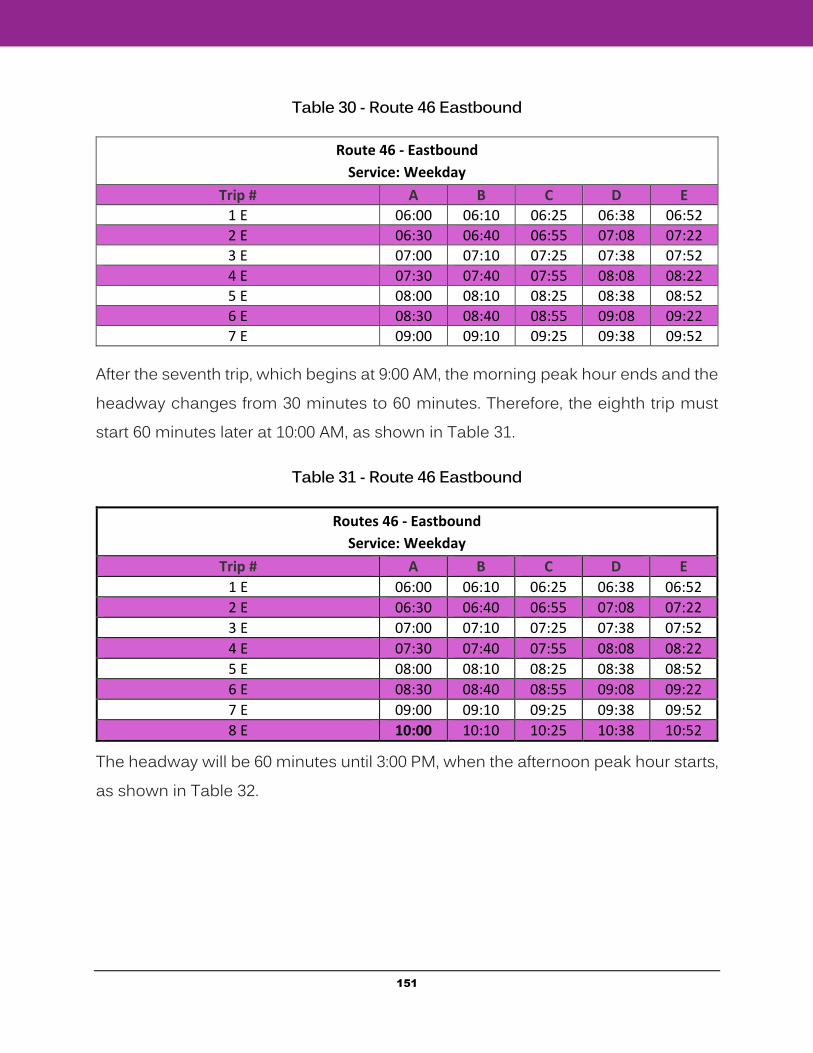
151
Table 30 - Route 46 Eastbound
Route 46 - Eastbound
Service: Weekday
Trip # A B C D E
1 E 06:00 06:10 06:25 06:38 06:52
2 E 06:30 06:40 06:55 07:08 07:22
3 E 07:00 07:10 07:25 07:38 07:52
4 E 07:30 07:40 07:55 08:08 08:22
5 E 08:00 08:10 08:25 08:38 08:52
6 E 08:30 08:40 08:55 09:08 09:22
7 E 09:00 09:10 09:25 09:38 09:52
After the seventh trip, which begins at 9:00 AM, the morning peak hour ends and the headway changes from 30 minutes to 60 minutes. Therefore, the eighth trip must start 60 minutes later at 10:00 AM, as shown in Table 31.
Table 31 - Route 46 Eastbound
Routes 46 - Eastbound
Service: Weekday
Trip # A B C D E
1 E 06:00 06:10 06:25 06:38 06:52
2 E 06:30 06:40 06:55 07:08 07:22
3 E 07:00 07:10 07:25 07:38 07:52
4 E 07:30 07:40 07:55 08:08 08:22
5 E 08:00 08:10 08:25 08:38 08:52
6 E 08:30 08:40 08:55 09:08 09:22
7 E 09:00 09:10 09:25 09:38 09:52
8 E 10:00 10:10 10:25 10:38 10:52
The headway will be 60 minutes until 3:00 PM, when the afternoon peak hour starts, as shown in Table 32.
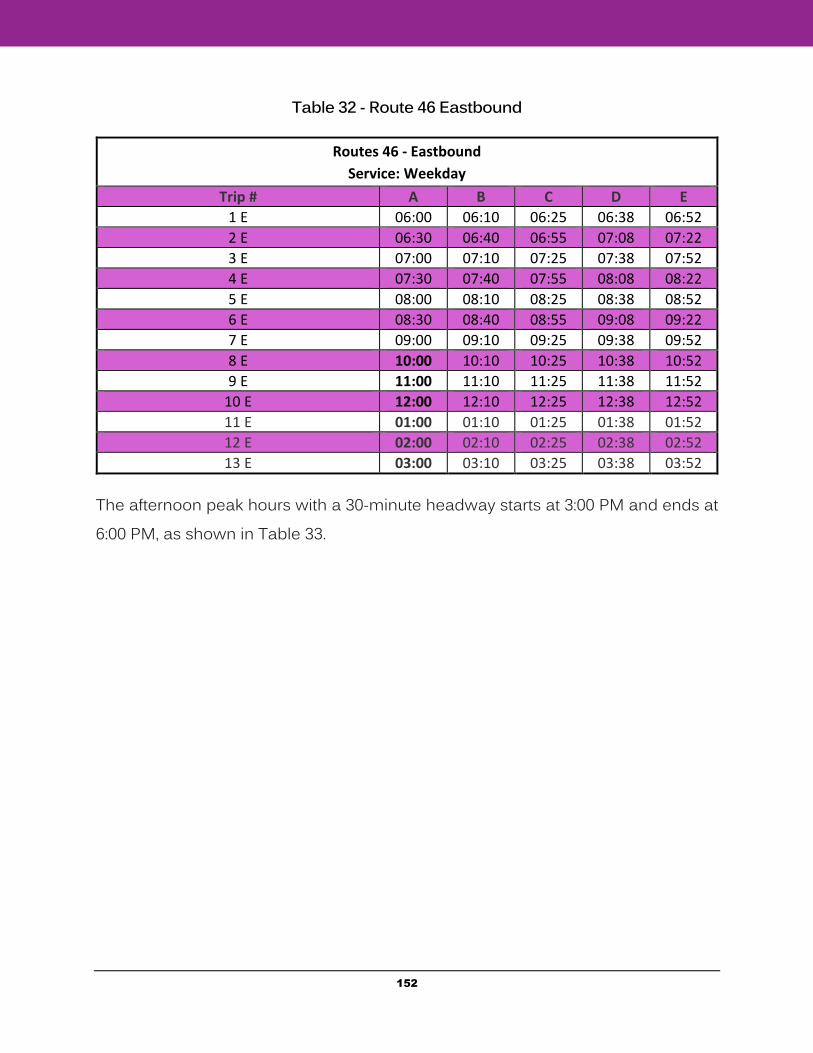
152
Table 32 - Route 46 Eastbound
Routes 46 - Eastbound
Service: Weekday
Trip # A B C D E
1 E 06:00 06:10 06:25 06:38 06:52
2 E 06:30 06:40 06:55 07:08 07:22
3 E 07:00 07:10 07:25 07:38 07:52
4 E 07:30 07:40 07:55 08:08 08:22
5 E 08:00 08:10 08:25 08:38 08:52
6 E 08:30 08:40 08:55 09:08 09:22
7 E 09:00 09:10 09:25 09:38 09:52
8 E 10:00 10:10 10:25 10:38 10:52
9 E 11:00 11:10 11:25 11:38 11:52
10 E 12:00 12:10 12:25 12:38 12:52
11 E 01:00 01:10 01:25 01:38 01:52
12 E 02:00 02:10 02:25 02:38 02:52
13 E 03:00 03:10 03:25 03:38 03:52
The afternoon peak hours with a 30-minute headway starts at 3:00 PM and ends at 6:00 PM, as shown in Table 33.
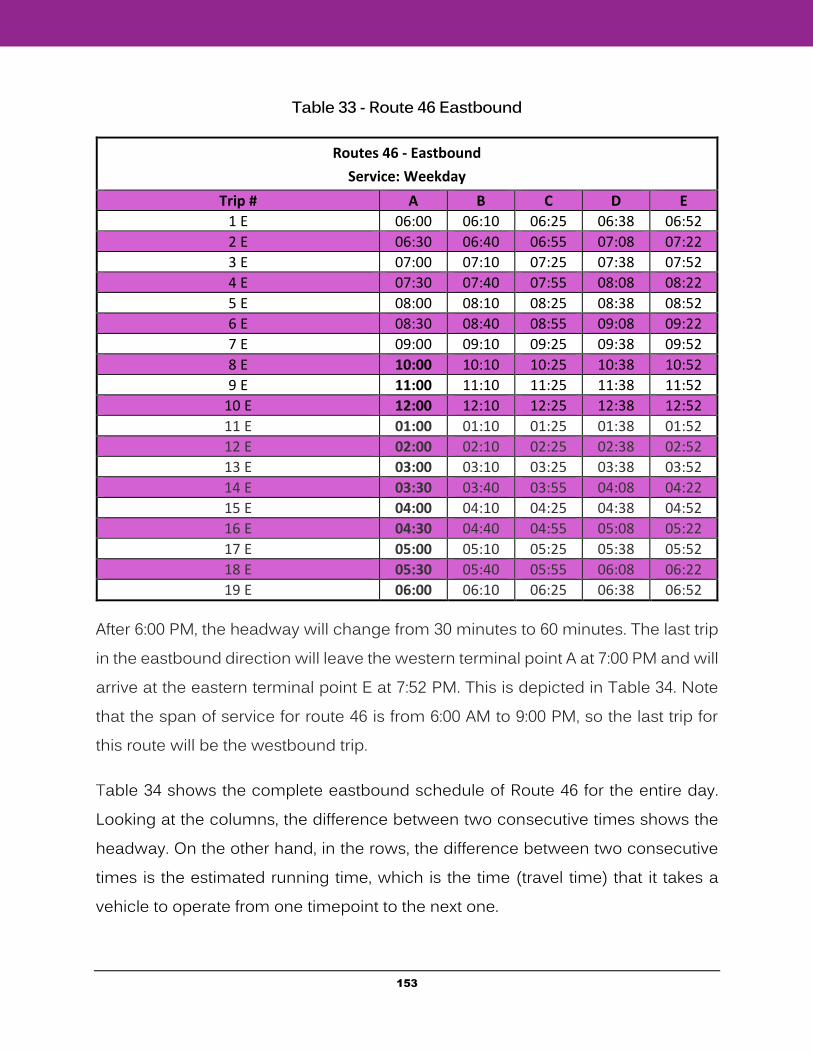
153
Table 33 - Route 46 Eastbound
Routes 46 - Eastbound
Service: Weekday
Trip # A B C D E
1 E 06:00 06:10 06:25 06:38 06:52
2 E 06:30 06:40 06:55 07:08 07:22
3 E 07:00 07:10 07:25 07:38 07:52
4 E 07:30 07:40 07:55 08:08 08:22
5 E 08:00 08:10 08:25 08:38 08:52
6 E 08:30 08:40 08:55 09:08 09:22
7 E 09:00 09:10 09:25 09:38 09:52
8 E 10:00 10:10 10:25 10:38 10:52
9 E 11:00 11:10 11:25 11:38 11:52
10 E 12:00 12:10 12:25 12:38 12:52
11 E 01:00 01:10 01:25 01:38 01:52
12 E 02:00 02:10 02:25 02:38 02:52
13 E 03:00 03:10 03:25 03:38 03:52
14 E 03:30 03:40 03:55 04:08 04:22
15 E 04:00 04:10 04:25 04:38 04:52
16 E 04:30 04:40 04:55 05:08 05:22
17 E 05:00 05:10 05:25 05:38 05:52
18 E 05:30 05:40 05:55 06:08 06:22
19 E 06:00 06:10 06:25 06:38 06:52
After 6:00 PM, the headway will change from 30 minutes to 60 minutes. The last trip in the eastbound direction will leave the western terminal point A at 7:00 PM and will arrive at the eastern terminal point E at 7:52 PM. This is depicted in Table 34. Note that the span of service for route 46 is from 6:00 AM to 9:00 PM, so the last trip for this route will be the westbound trip.
Table 34 shows the complete eastbound schedule of Route 46 for the entire day. Looking at the columns, the difference between two consecutive times shows the headway. On the other hand, in the rows, the difference between two consecutive times is the estimated running time, which is the time (travel time) that it takes a vehicle to operate from one timepoint to the next one.
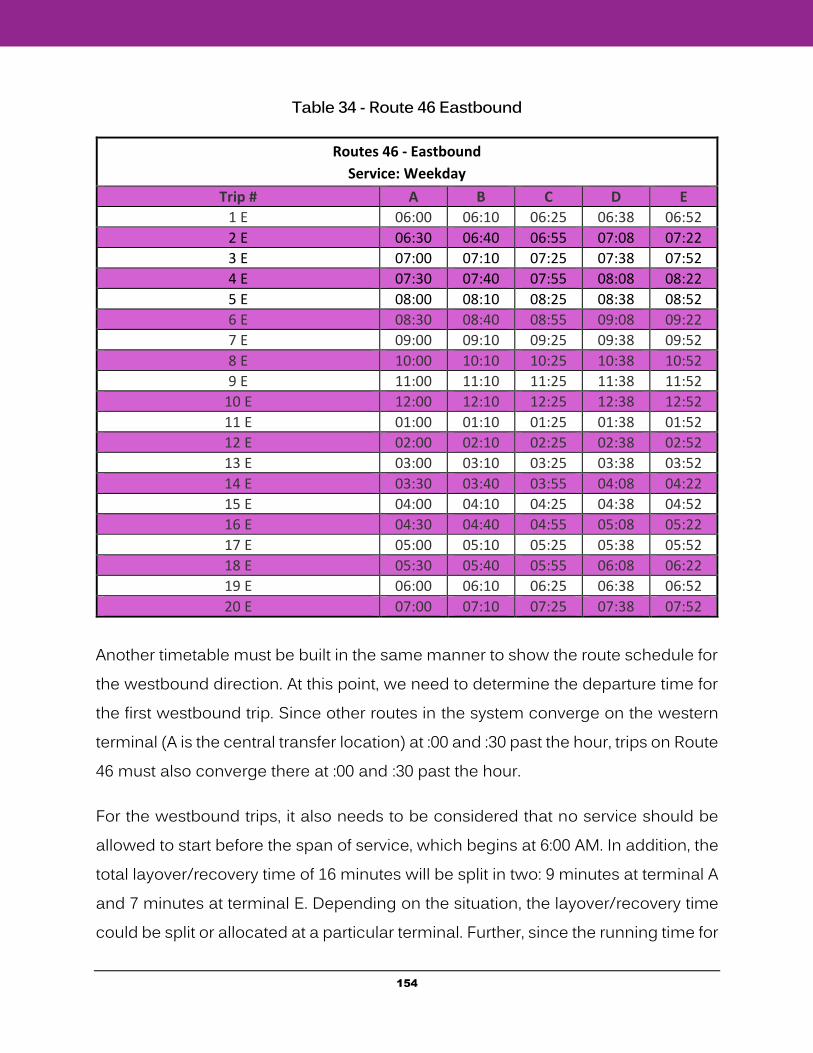
154
Table 34 - Route 46 Eastbound
Routes 46 - Eastbound
Service: Weekday
Trip # A B C D E
1 E 06:00 06:10 06:25 06:38 06:52
2 E 06:30 06:40 06:55 07:08 07:22
3 E 07:00 07:10 07:25 07:38 07:52
4 E 07:30 07:40 07:55 08:08 08:22
5 E 08:00 08:10 08:25 08:38 08:52
6 E 08:30 08:40 08:55 09:08 09:22
7 E 09:00 09:10 09:25 09:38 09:52
8 E 10:00 10:10 10:25 10:38 10:52
9 E 11:00 11:10 11:25 11:38 11:52
10 E 12:00 12:10 12:25 12:38 12:52
11 E 01:00 01:10 01:25 01:38 01:52
12 E 02:00 02:10 02:25 02:38 02:52
13 E 03:00 03:10 03:25 03:38 03:52
14 E 03:30 03:40 03:55 04:08 04:22
15 E 04:00 04:10 04:25 04:38 04:52
16 E 04:30 04:40 04:55 05:08 05:22
17 E 05:00 05:10 05:25 05:38 05:52
18 E 05:30 05:40 05:55 06:08 06:22
19 E 06:00 06:10 06:25 06:38 06:52
20 E 07:00 07:10 07:25 07:38 07:52
Another timetable must be built in the same manner to show the route schedule for the westbound direction. At this point, we need to determine the departure time for the first westbound trip. Since other routes in the system converge on the western terminal (A is the central transfer location) at :00 and :30 past the hour, trips on Route 46 must also converge there at :00 and :30 past the hour.
For the westbound trips, it also needs to be considered that no service should be allowed to start before the span of service, which begins at 6:00 AM. In addition, the total layover/recovery time of 16 minutes will be split in two: 9 minutes at terminal A and 7 minutes at terminal E. Depending on the situation, the layover/recovery time could be split or allocated at a particular terminal. Further, since the running time for
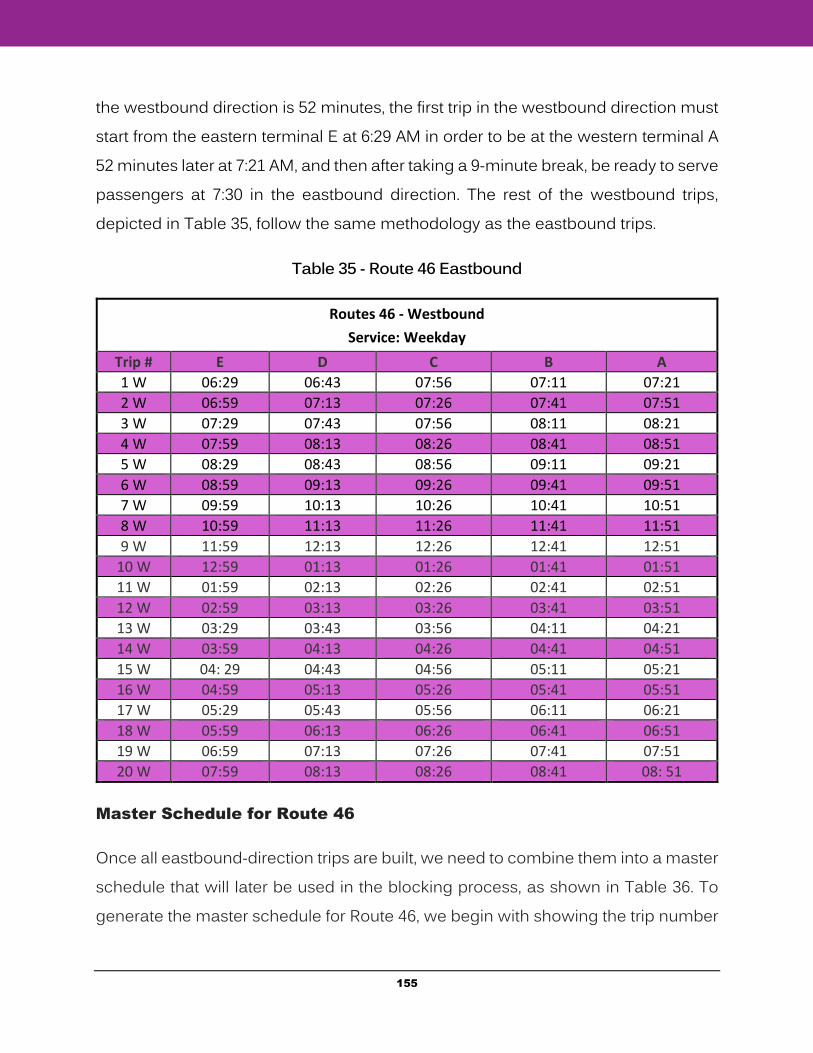
155
the westbound direction is 52 minutes, the first trip in the westbound direction must start from the eastern terminal E at 6:29 AM in order to be at the western terminal A 52 minutes later at 7:21 AM, and then after taking a 9-minute break, be ready to serve passengers at 7:30 in the eastbound direction. The rest of the westbound trips, depicted in Table 35, follow the same methodology as the eastbound trips.
Table 35 - Route 46 Eastbound
Routes 46 - Westbound
Service: Weekday
Trip # E D C B A
1 W 06:29 06:43 07:56 07:11 07:21
2 W 06:59 07:13 07:26 07:41 07:51
3 W 07:29 07:43 07:56 08:11 08:21
4 W 07:59 08:13 08:26 08:41 08:51
5 W 08:29 08:43 08:56 09:11 09:21
6 W 08:59 09:13 09:26 09:41 09:51
7 W 09:59 10:13 10:26 10:41 10:51
8 W 10:59 11:13 11:26 11:41 11:51
9 W 11:59 12:13 12:26 12:41 12:51
10 W 12:59 01:13 01:26 01:41 01:51
11 W 01:59 02:13 02:26 02:41 02:51
12 W 02:59 03:13 03:26 03:41 03:51
13 W 03:29 03:43 03:56 04:11 04:21
14 W 03:59 04:13 04:26 04:41 04:51
15 W 04: 29 04:43 04:56 05:11 05:21
16 W 04:59 05:13 05:26 05:41 05:51
17 W 05:29 05:43 05:56 06:11 06:21
18 W 05:59 06:13 06:26 06:41 06:51
19 W 06:59 07:13 07:26 07:41 07:51
20 W 07:59 08:13 08:26 08:41 08: 51
Master Schedule for Route 46
Once all eastbound-direction trips are built, we need to combine them into a master schedule that will later be used in the blocking process, as shown in Table 36. To generate the master schedule for Route 46, we begin with showing the trip number
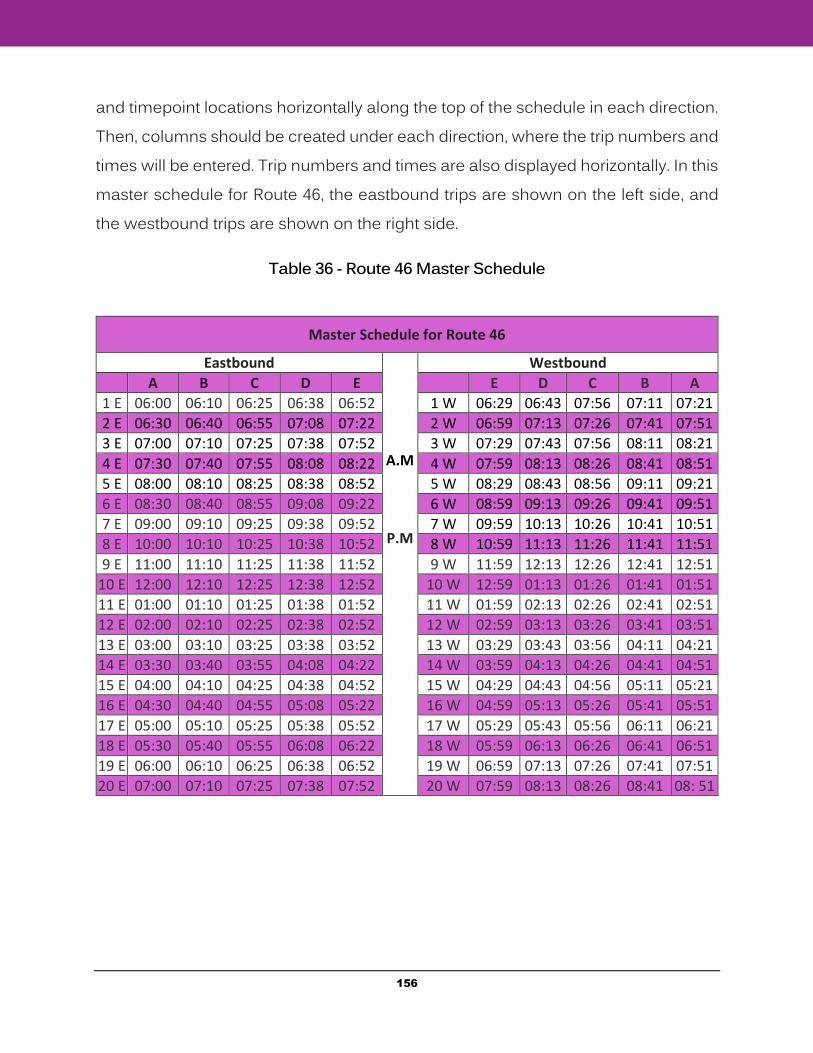
156
and timepoint locations horizontally along the top of the schedule in each direction. Then, columns should be created under each direction, where the trip numbers and times will be entered. Trip numbers and times are also displayed horizontally. In this master schedule for Route 46, the eastbound trips are shown on the left side, and the westbound trips are shown on the right side.
Table 36 - Route 46 Master Schedule
Master Schedule for Route 46
Eastbound
A.M
P.M
Westbound
A B C D E E D C B A
1 E 06:00 06:10 06:25 06:38 06:52 1 W 06:29 06:43 07:56 07:11 07:21
2 E 06:30 06:40 06:55 07:08 07:22 2 W 06:59 07:13 07:26 07:41 07:51
3 E 07:00 07:10 07:25 07:38 07:52 3 W 07:29 07:43 07:56 08:11 08:21
4 E 07:30 07:40 07:55 08:08 08:22 4 W 07:59 08:13 08:26 08:41 08:51
5 E 08:00 08:10 08:25 08:38 08:52 5 W 08:29 08:43 08:56 09:11 09:21
6 E 08:30 08:40 08:55 09:08 09:22 6 W 08:59 09:13 09:26 09:41 09:51
7 E 09:00 09:10 09:25 09:38 09:52 7 W 09:59 10:13 10:26 10:41 10:51
8 E 10:00 10:10 10:25 10:38 10:52 8 W 10:59 11:13 11:26 11:41 11:51
9 E 11:00 11:10 11:25 11:38 11:52 9 W 11:59 12:13 12:26 12:41 12:51
10 E 12:00 12:10 12:25 12:38 12:52 10 W 12:59 01:13 01:26 01:41 01:51
11 E 01:00 01:10 01:25 01:38 01:52 11 W 01:59 02:13 02:26 02:41 02:51
12 E 02:00 02:10 02:25 02:38 02:52 12 W 02:59 03:13 03:26 03:41 03:51
13 E 03:00 03:10 03:25 03:38 03:52 13 W 03:29 03:43 03:56 04:11 04:21
14 E 03:30 03:40 03:55 04:08 04:22 14 W 03:59 04:13 04:26 04:41 04:51
15 E 04:00 04:10 04:25 04:38 04:52 15 W 04:29 04:43 04:56 05:11 05:21
16 E 04:30 04:40 04:55 05:08 05:22 16 W 04:59 05:13 05:26 05:41 05:51
17 E 05:00 05:10 05:25 05:38 05:52 17 W 05:29 05:43 05:56 06:11 06:21
18 E 05:30 05:40 05:55 06:08 06:22 18 W 05:59 06:13 06:26 06:41 06:51
19 E 06:00 06:10 06:25 06:38 06:52 19 W 06:59 07:13 07:26 07:41 07:51
20 E 07:00 07:10 07:25 07:38 07:52 20 W 07:59 08:13 08:26 08:41 08: 51
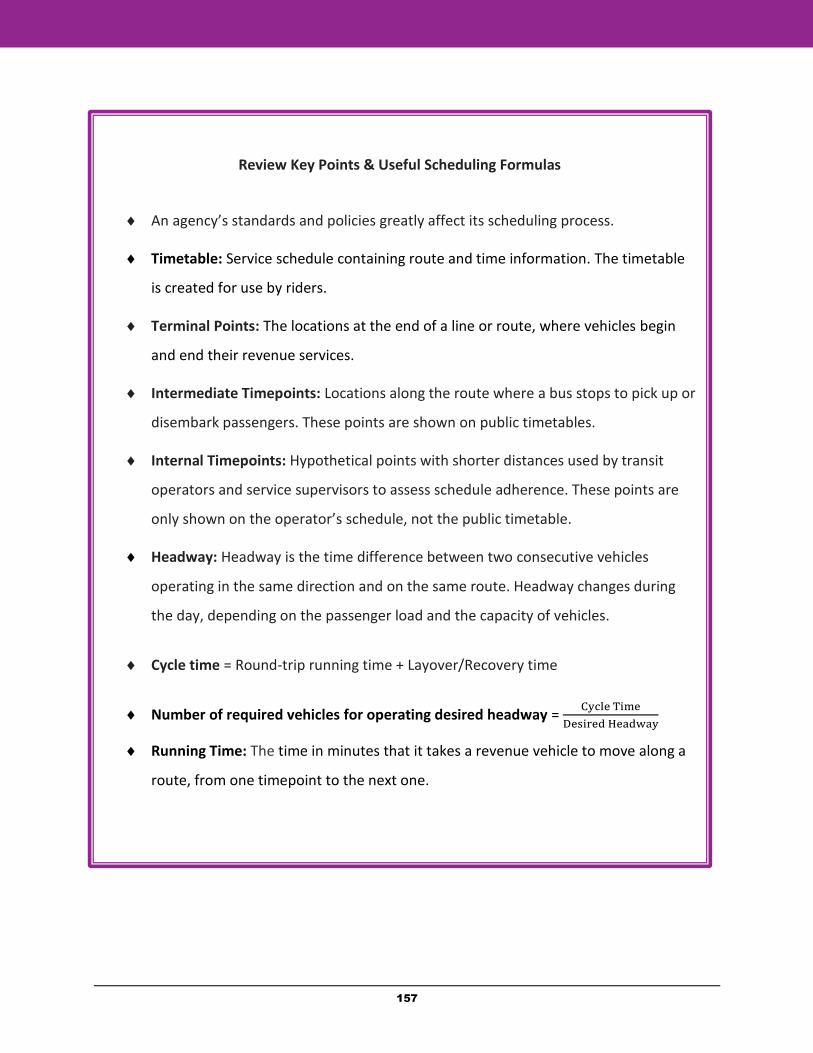
157
Review Key Points & Useful Scheduling Formulas
An agency’s standards and policies greatly affect its scheduling process.
Timetable: Service schedule containing route and time information. The timetable
is created for use by riders.
Terminal Points: The locations at the end of a line or route, where vehicles begin
and end their revenue services.
Intermediate Timepoints: Locations along the route where a bus stops to pick up or
disembark passengers. These points are shown on public timetables.
Internal Timepoints: Hypothetical points with shorter distances used by transit
operators and service supervisors to assess schedule adherence. These points are
only shown on the operator’s schedule, not the public timetable.
Headway: Headway is the time difference between two consecutive vehicles
operating in the same direction and on the same route. Headway changes during
the day, depending on the passenger load and the capacity of vehicles.
Cycle time = Round-trip running time + Layover/Recovery time
Number of required vehicles for operating desired headway = Cycle Time
Desired Headway
Running Time: The time in minutes that it takes a revenue vehicle to move along a
route, from one timepoint to the next one.
158
Blocking (Vehicle Assignment)
In vehicle scheduling, buses are assigned to various bus routes, and every single bus has a fixed timesheet to follow throughout the day. Since buses can be taken out of revenue service for various reasons, such as breakdown or scheduled maintenance works, buses are operated in shifts. Vehicle scheduling or blocking assignments for individual vehicles become developed in the most logical and efficient manner. Vehicle assignments are also known as “blocks,” and include a series of trips. These trips are linked together and assigned to a single vehicle. The block is a daily work assignment for a specified vehicle. Each block may consist of multiple routes or can be operated by different operators.
Why is Vehicle Scheduling/Blocking Important?
Efficient blocking is important in terms of minimizing the number of vehicles needed to operate a given level of service. Since blocking affects the costs associated with operating the revenue service vehicle, as well as the cost associated with work assignments for operators, it greatly impacts an agency’s operation costs.
Setting Up the Blocking Process
As the first step in the process of blocking, setting up a complete and thorough master schedule for each route is required. Before starting the process, the scheduler should have detailed knowledge of all directives and policies regarding blocking. Three agency policies that greatly affect the blocking process are layover recovery time, layover locations, and interlining. Although a competent scheduler considers all the aspects of scheduling throughout the process, when creating blocks, it is extremely important to have a thorough knowledge of the regulations related to run-cutting, which is defined as assigning work to operators. Blocks that are “run-cut friendly” increase the efficiency of the entire scheduling process. Therefore, the scheduler may adjust the master schedule in order to optimize efficiency.
159
Vehicle Size Consideration
Road vehicles used for public transportation range from small vans or minibuses to double-articulated buses with a higher capacity. Each type of vehicle has a role and at the end, they all complement each other as parts of the overall public transportation system.
The selection of the vehicle size can be influenced by different factors, such as the volume of traffic, passenger loads, accessibility, and the characteristics of the roadway system. Since scheduling includes assigning vehicles to each route, the scheduler must be familiar with the different types of vehicles and their standing and sitting capacity. Schedulers must look at ridership data to evaluate whether several small vehicles or one large vehicle meets the requirements of passengers and operators more efficiently in a given situation.
Operating Range
“Operation range” is related to the service hours of a route, as well as the levels of service during operating hours on weekdays and weekends. Policy headways identify the minimum required service levels or frequency. These dictated rules are set without considering issues such as demand and capacity. For example, the general policy may state that all routes must operate every 30 minutes during peak hours, when ridership is highest, and every 60 minutes during base periods.
Loading Standards
The realistic method used to identify the headway must be based on ridership demand. In this method, passenger loads determine the required headway to be operated on the route. Passenger loads should be analyzed for each route during various time periods of the day. In order to calculate the standard average peak load, planners and schedulers must evaluate ridership information in detail.
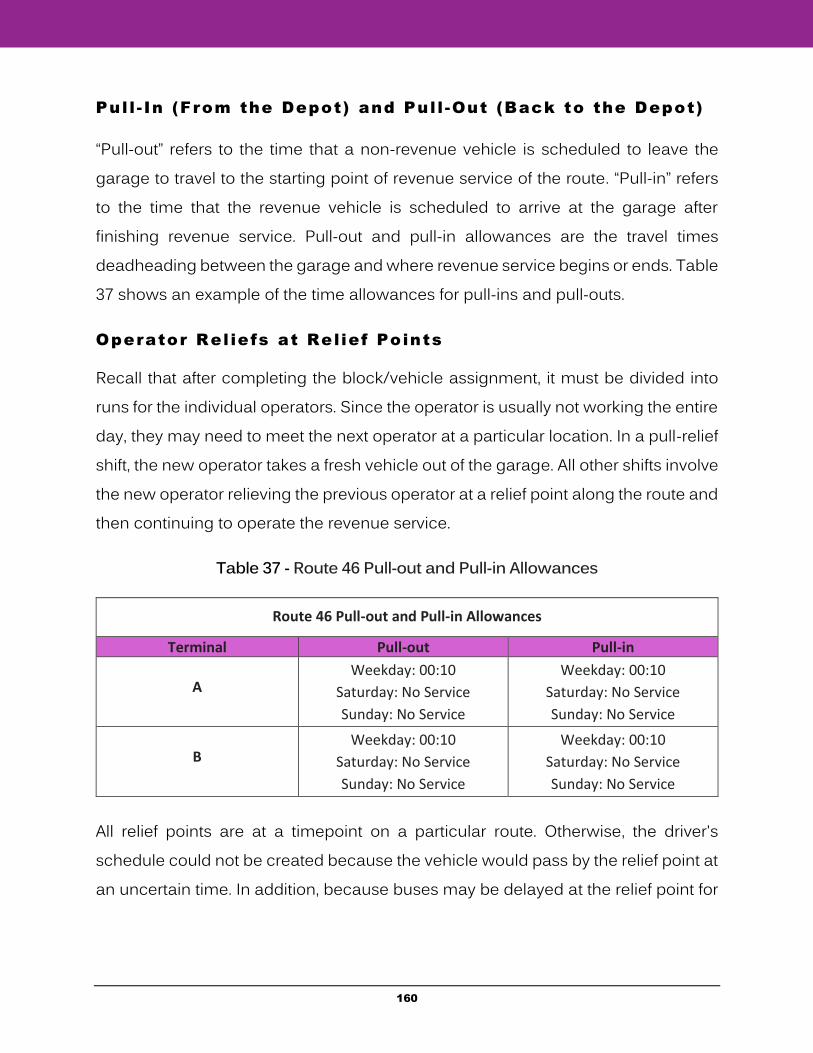
160
Pull - In (From the Depot) and Pul l -Out (Back to the Depot)
“Pull-out” refers to the time that a non-revenue vehicle is scheduled to leave the garage to travel to the starting point of revenue service of the route. “Pull-in” refers to the time that the revenue vehicle is scheduled to arrive at the garage after finishing revenue service. Pull-out and pull-in allowances are the travel times deadheading between the garage and where revenue service begins or ends. Table 37 shows an example of the time allowances for pull-ins and pull-outs.
Operator Rel iefs at Relief Points
Recall that after completing the block/vehicle assignment, it must be divided into runs for the individual operators. Since the operator is usually not working the entire day, they may need to meet the next operator at a particular location. In a pull-relief shift, the new operator takes a fresh vehicle out of the garage. All other shifts involve the new operator relieving the previous operator at a relief point along the route and then continuing to operate the revenue service.
Table 37 - Route 46 Pull-out and Pull-in Allowances
Route 46 Pull-out and Pull-in Allowances
Terminal Pull-out Pull-in
A
Weekday: 00:10
Saturday: No Service
Sunday: No Service
Weekday: 00:10
Saturday: No Service
Sunday: No Service
B
Weekday: 00:10
Saturday: No Service
Sunday: No Service
Weekday: 00:10
Saturday: No Service
Sunday: No Service
All relief points are at a timepoint on a particular route. Otherwise, the driver's schedule could not be created because the vehicle would pass by the relief point at an uncertain time. In addition, because buses may be delayed at the relief point for
161
a few minutes due to the change of drivers, relief points need to meet many of the same requirements as layover locations.
Aside the abovementioned, many transit agencies have relief points along a route at the closest points from the garage. It results in minimizing agency costs by reducing the time that it takes the driver to commute between the garage and relief point.
In some circumstances, relief points may change depending on the time of day and day of the week. For example, if connecting vehicles do not operate very often on the weekend, then the normal relief point could be changed to something that is easier to access on transit. Operator safety may require that some relief points are not to be used at night. Many transit agencies stipulate that operator relief cannot occur after a certain time.
Due to the time it takes for new drivers to set themselves up in the seat and start operating the revenue service, from a passenger’s perspective, it is better that operator relief occurs at the route terminus. Switching drivers at the end of the route means that the layover time can be used for setup, which helps avoid passenger delays that occur during mid-route driver changes.
Deadheading Vs. Revenue Service
“Deadheading” refers to the distance and time for a transit vehicle to travel from the garage to the first stop where it picks up passengers, or to travel from the last stop where it drops off the passengers to the garage. Sometimes deadheading is also required when a vehicle needs to travel from one point to another point without carrying passengers. Oppositely, revenue service refers to a time that a vehicle is in operation along a route and is available to the public.
Unlike revenue service, deadheading does not generate benefits for agencies, and it can be costly due to operating expenses, especially the operator cost. Although
162
deadheading is costly for agencies, it is still required in order to support revenue service.
Transit schedulers should skillfully reduce the amount of deadheading time by grabbing the opportunity to reduce the number of times that vehicles must travel back to the garage, reduce the distances the vehicle has to travel from the garage to its first timepoint, and from its last timepoint back to the garage. For example, an agency that has multiple garages can reduce the deadheading time by assigning the closest garage for a vehicle’s return.
Interl in ing (Route A to Route B)
Interlining refers to the utilization of the same vehicle and operator for a block operating on more than one route. With interlining, the operator is not required to return to the garage before changing to another route. When a vehicle is scheduled to move from one route to another, the routes are interlined.
Since most transit agencies operate more than one route, implementing optimal interlining can be a benefit by reducing vehicle requirements and costs, as well as providing ease and convenience to passengers. Interlining can be scheduled because of the following reasons:
Absence of a proper layover location: In some areas, it may not be feasible for the operator to find a proper location to park the bus during a layover. In this situation, by implementing interlining, the operator is able to postpone the layover at a suitable location on another route.
Obtaining optimized cycle times: When two routes that share a common segment have unfavorable cycle times, scheduling interlining may allow for improved cycle times for both routes, often resulting in cost savings.
Declining passenger transfers: When interlining is not scheduled, there is an inconvenience to passengers that travel to locations that require them to disembark from one vehicle and board another vehicle. In such situations,
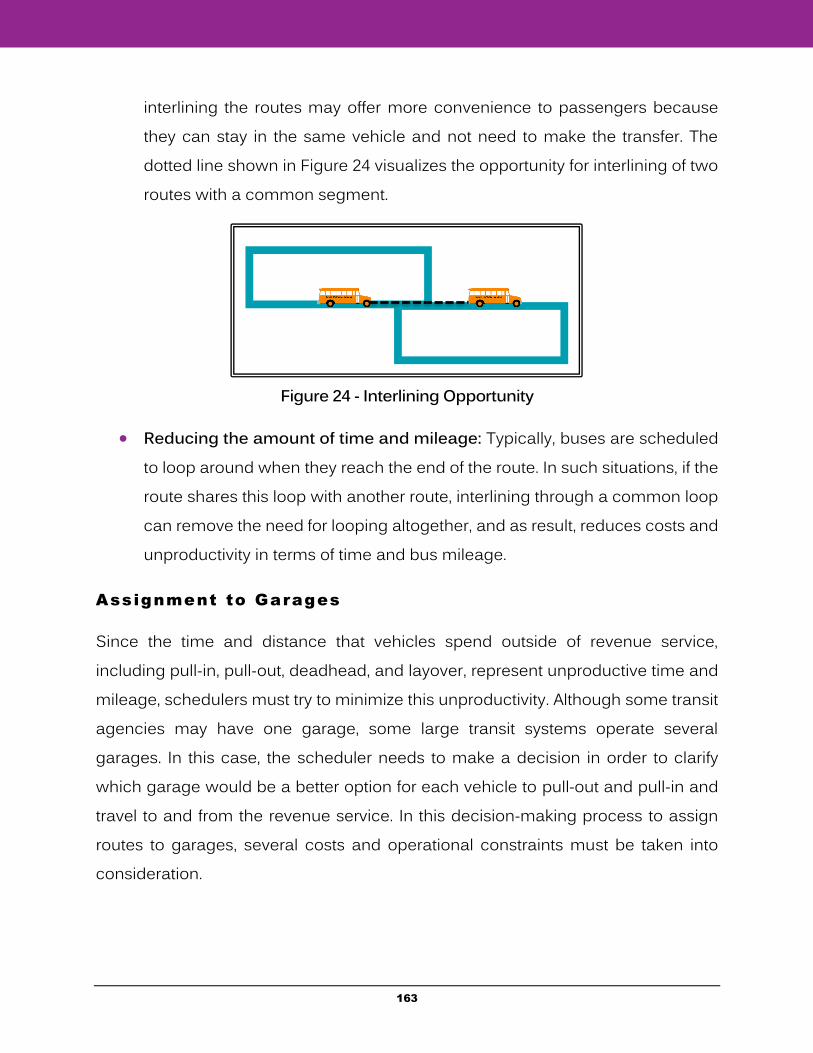
163
interlining the routes may offer more convenience to passengers because they can stay in the same vehicle and not need to make the transfer. The dotted line shown in Figure 24 visualizes the opportunity for interlining of two routes with a common segment.
Figure 24 - Interlining Opportunity
Reducing the amount of time and mileage: Typically, buses are scheduled to loop around when they reach the end of the route. In such situations, if the route shares this loop with another route, interlining through a common loop can remove the need for looping altogether, and as result, reduces costs and unproductivity in terms of time and bus mileage.
Assignment to Garages
Since the time and distance that vehicles spend outside of revenue service, including pull-in, pull-out, deadhead, and layover, represent unproductive time and mileage, schedulers must try to minimize this unproductivity. Although some transit agencies may have one garage, some large transit systems operate several garages. In this case, the scheduler needs to make a decision in order to clarify which garage would be a better option for each vehicle to pull-out and pull-in and travel to and from the revenue service. In this decision-making process to assign routes to garages, several costs and operational constraints must be taken into consideration.
164
Peak and Base Vehicle Requirements
A scheduler must determine the number of vehicles needed to operate the service with the desired headway on a given route. The headway usually varies throughout the day. For example, for Route 46, the headway is 30 minutes during morning and evening rush hours, while it is 1 hour during the midday and evening hours. After identifying the required headway, schedulers need to determine peak and base vehicle requirements and make sure that vehicles are available during the peak hours.
Block Reevaluation and Consider Run -Cutt ing Process
One important characteristic of a good scheduler is the willingness to constantly evaluate schedules and apply the necessary changes needed to improve and optimize the schedules. Even at a time when a scheduler may think the blocking process is done, spending more time to re-evaluate and revise it while considering the run-cutting process may significantly benefit and enhance the scheduling process. In general, schedulers must consider all aspects of scheduling while working on a specific problem.
Blocking Sheet
A ”blocking sheet” is required for processing blocking manually. By using a blocking sheet, schedulers are able to document a trip’s start and end times associated with each vehicle. Every blocking sheet illustrates the assignment for a specific vehicle. The blocking sheet should include route number, service day (weekday or weekend), date, and special blocking instructions should be written on the top part of the blocking sheet. The following is a list of other information that must be provided on a blocking sheet:
Block number
Pull-in times
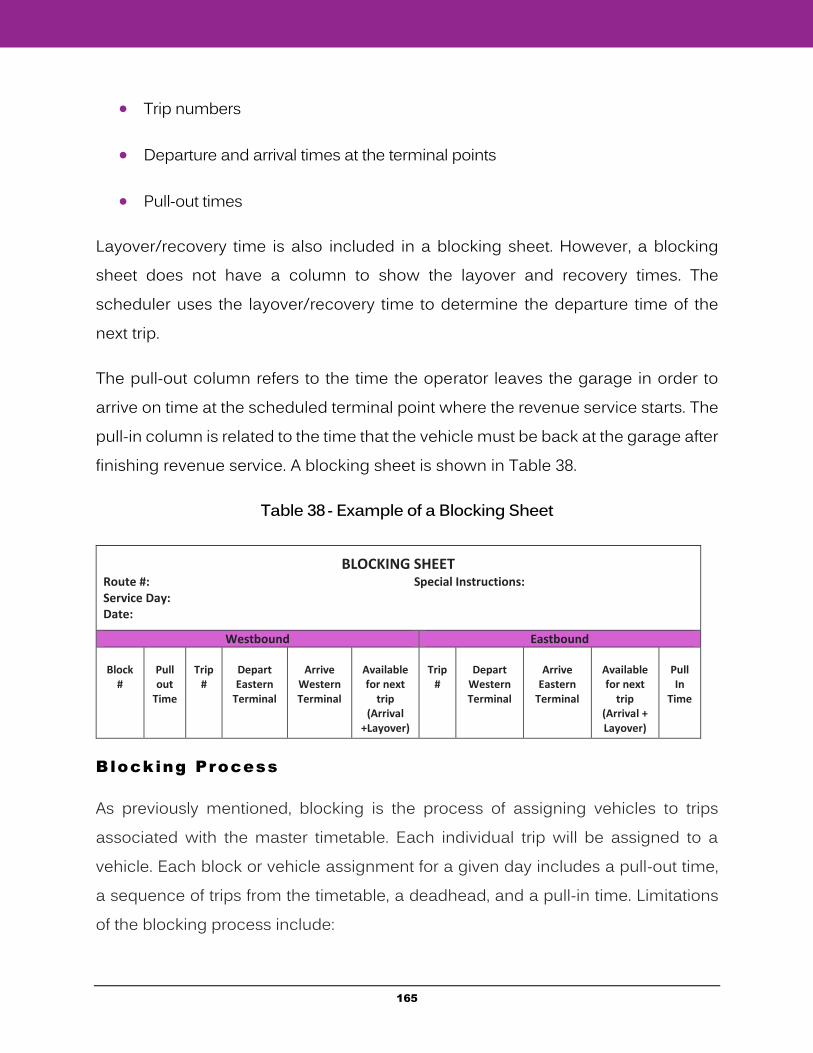
165
Trip numbers
Departure and arrival times at the terminal points
Pull-out times
Layover/recovery time is also included in a blocking sheet. However, a blocking sheet does not have a column to show the layover and recovery times. The scheduler uses the layover/recovery time to determine the departure time of the next trip.
The pull-out column refers to the time the operator leaves the garage in order to arrive on time at the scheduled terminal point where the revenue service starts. The pull-in column is related to the time that the vehicle must be back at the garage after finishing revenue service. A blocking sheet is shown in Table 38.
Table 38 - Example of a Blocking Sheet
Blocking Process
As previously mentioned, blocking is the process of assigning vehicles to trips associated with the master timetable. Each individual trip will be assigned to a vehicle. Each block or vehicle assignment for a given day includes a pull-out time, a sequence of trips from the timetable, a deadhead, and a pull-in time. Limitations of the blocking process include:
BLOCKING SHEET Route #: Special Instructions: Service Day: Date:
Westbound Eastbound
Block #
Pull out
Time
Trip
#
Depart Eastern
Terminal
Arrive
Western Terminal
Available for next
trip (Arrival
+Layover)
Trip
#
Depart
Western Terminal
Arrive
Eastern Terminal
Available for next
trip (Arrival + Layover)
Pull In
Time
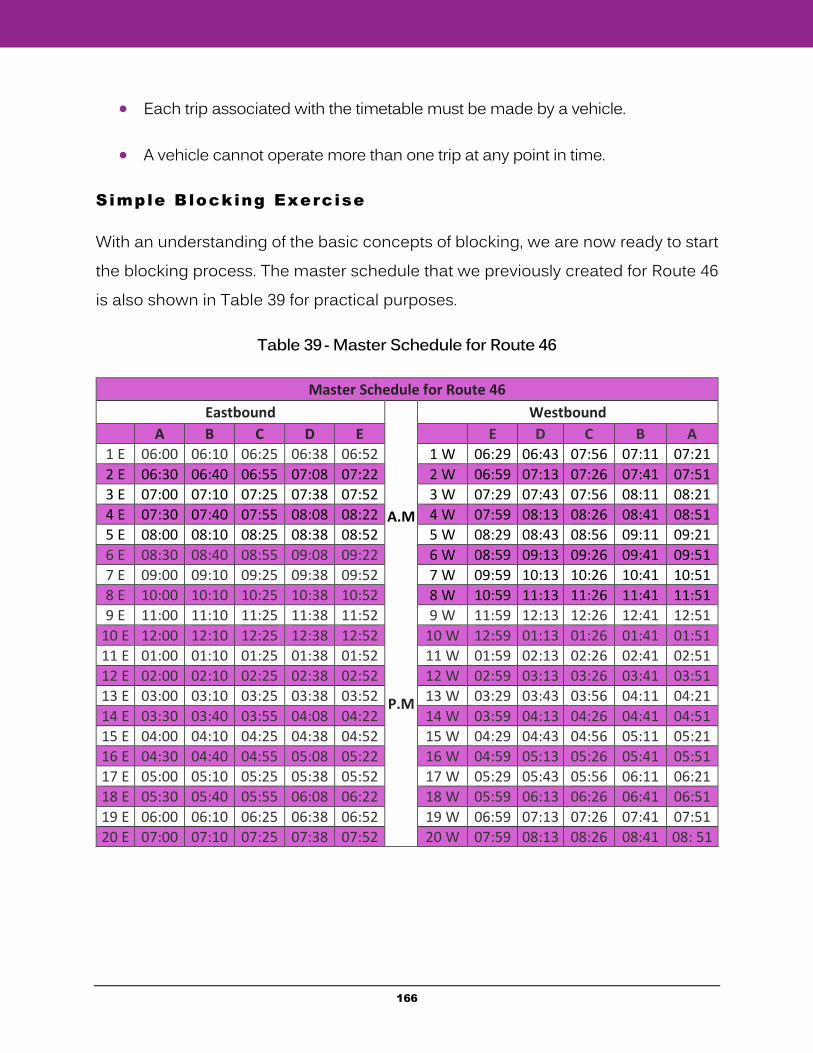
166
Each trip associated with the timetable must be made by a vehicle.
A vehicle cannot operate more than one trip at any point in time.
Simple Blocking Exercise
With an understanding of the basic concepts of blocking, we are now ready to start the blocking process. The master schedule that we previously created for Route 46 is also shown in Table 39 for practical purposes.
Table 39 - Master Schedule for Route 46
Master Schedule for Route 46
Eastbound
A.M
P.M
Westbound
A B C D E E D C B A
1 E 06:00 06:10 06:25 06:38 06:52 1 W 06:29 06:43 07:56 07:11 07:21
2 E 06:30 06:40 06:55 07:08 07:22 2 W 06:59 07:13 07:26 07:41 07:51
3 E 07:00 07:10 07:25 07:38 07:52 3 W 07:29 07:43 07:56 08:11 08:21
4 E 07:30 07:40 07:55 08:08 08:22 4 W 07:59 08:13 08:26 08:41 08:51
5 E 08:00 08:10 08:25 08:38 08:52 5 W 08:29 08:43 08:56 09:11 09:21
6 E 08:30 08:40 08:55 09:08 09:22 6 W 08:59 09:13 09:26 09:41 09:51
7 E 09:00 09:10 09:25 09:38 09:52 7 W 09:59 10:13 10:26 10:41 10:51
8 E 10:00 10:10 10:25 10:38 10:52 8 W 10:59 11:13 11:26 11:41 11:51
9 E 11:00 11:10 11:25 11:38 11:52 9 W 11:59 12:13 12:26 12:41 12:51
10 E 12:00 12:10 12:25 12:38 12:52 10 W 12:59 01:13 01:26 01:41 01:51
11 E 01:00 01:10 01:25 01:38 01:52 11 W 01:59 02:13 02:26 02:41 02:51
12 E 02:00 02:10 02:25 02:38 02:52 12 W 02:59 03:13 03:26 03:41 03:51
13 E 03:00 03:10 03:25 03:38 03:52 13 W 03:29 03:43 03:56 04:11 04:21
14 E 03:30 03:40 03:55 04:08 04:22 14 W 03:59 04:13 04:26 04:41 04:51
15 E 04:00 04:10 04:25 04:38 04:52 15 W 04:29 04:43 04:56 05:11 05:21
16 E 04:30 04:40 04:55 05:08 05:22 16 W 04:59 05:13 05:26 05:41 05:51
17 E 05:00 05:10 05:25 05:38 05:52 17 W 05:29 05:43 05:56 06:11 06:21
18 E 05:30 05:40 05:55 06:08 06:22 18 W 05:59 06:13 06:26 06:41 06:51
19 E 06:00 06:10 06:25 06:38 06:52 19 W 06:59 07:13 07:26 07:41 07:51
20 E 07:00 07:10 07:25 07:38 07:52 20 W 07:59 08:13 08:26 08:41 08: 51
167
Looking at the master schedule, the first trip of the day is the eastbound trip, which starts at 6:00 AM, and the last trip is the westbound trip, which starts at 7:59 PM and ends at 8:51 PM.
Base Vehicle Requirements
As mentioned in the previous chapter, the number of vehicles needed to operate a given service can be retrieved by the following formula:
In this example, a total of two vehicles are required to cover a base 60-minute headway on this timetable.
Number of Vehicle to Operate the Base Headway = Cycle Time
Base Headway = 120
60 = 2
Peak Vehicle Requirements
As calculated in the previous chapter, a total of four vehicles are needed to operate the 30-minute headway during morning and afternoon peak hours.
Number of Vehicle to Operate the Peak Headway = Cycle Time
Peak Headway = 120
60 = 4
These four required vehicles for operating peak hours include the two vehicles used to operate the entire span, along with two additional vehicles for the shorter headway during peak hours.
Hooking Trips
Running Time (Travel time) for Eastbound Direction (A to E): 52 minutes
Running Time (Travel time) for Westbound Direction (E to A): 52 minutes
Number of Vehicle to Operate the Base Headway = Cycle Time
Base Headway
168
Layover/Recovery Time: 16 minutes. (9 minutes should be taken at terminal A and 7 minutes at terminal E)
Base Headway: 60 minutes
Peak-hour Headway: 30 minutes
Cycle Time: 120 minutes
Base Vehicle Requirements: 2
Peak Vehicle Requirements: 4
The blocking process starts with hooking trips. “Hooking” refers to the process of attaching the end of a trip in one direction to the beginning of a trip in the opposite direction. On paper, this is done by using colored pencils or highlighters, which make the process easier. Four different colors are used on the master schedule, as shown in Table 40.
Each color corresponds to a specific vehicle that operates on the route. For example, the blue color corresponds to the first vehicle of the day, departing the western terminal (A) at 6:00 AM. It will arrive at the eastern terminal (E) at 6:52 AM. The operator is supposed to take a 7-minute layover/recovery time at terminal E. The vehicle will be available to start the westbound trip at 06:59 AM. Therefore, it will be hooked to the second trip in westbound direction that starts at 06:59 AM. For the second westbound trip, the vehicle leaves the eastern terminal at 6:59 AM and will arrive 52 minutes later, specifically at 07:51 AM at the western terminal. After that, one round-trip is completed. The vehicle takes a 9-minute layover/recovery time at terminal A, and then leaves the western terminal at 8:00 AM in order to operate the next trip, which is considered the second eastbound trip for the vehicle. The process of hooking the trips is continued in this manner. All that is needed to be done is to start from the beginning of each trip and consider the arrival time to the other
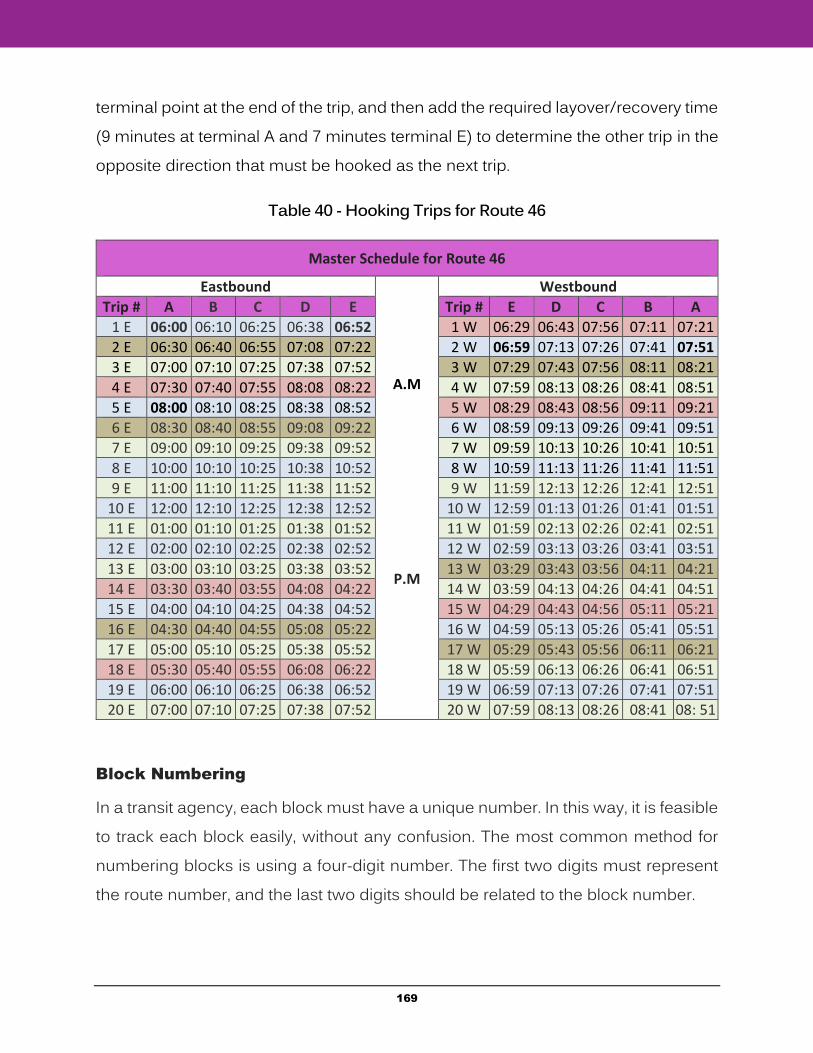
169
terminal point at the end of the trip, and then add the required layover/recovery time (9 minutes at terminal A and 7 minutes terminal E) to determine the other trip in the opposite direction that must be hooked as the next trip.
Table 40 - Hooking Trips for Route 46
Master Schedule for Route 46
Eastbound
A.M
P.M
Westbound
Trip # A B C D E Trip # E D C B A
1 E 06:00 06:10 06:25 06:38 06:52 1 W 06:29 06:43 07:56 07:11 07:21
2 E 06:30 06:40 06:55 07:08 07:22 2 W 06:59 07:13 07:26 07:41 07:51
3 E 07:00 07:10 07:25 07:38 07:52 3 W 07:29 07:43 07:56 08:11 08:21
4 E 07:30 07:40 07:55 08:08 08:22 4 W 07:59 08:13 08:26 08:41 08:51
5 E 08:00 08:10 08:25 08:38 08:52 5 W 08:29 08:43 08:56 09:11 09:21
6 E 08:30 08:40 08:55 09:08 09:22 6 W 08:59 09:13 09:26 09:41 09:51
7 E 09:00 09:10 09:25 09:38 09:52 7 W 09:59 10:13 10:26 10:41 10:51
8 E 10:00 10:10 10:25 10:38 10:52 8 W 10:59 11:13 11:26 11:41 11:51
9 E 11:00 11:10 11:25 11:38 11:52 9 W 11:59 12:13 12:26 12:41 12:51
10 E 12:00 12:10 12:25 12:38 12:52 10 W 12:59 01:13 01:26 01:41 01:51
11 E 01:00 01:10 01:25 01:38 01:52 11 W 01:59 02:13 02:26 02:41 02:51
12 E 02:00 02:10 02:25 02:38 02:52 12 W 02:59 03:13 03:26 03:41 03:51
13 E 03:00 03:10 03:25 03:38 03:52 13 W 03:29 03:43 03:56 04:11 04:21
14 E 03:30 03:40 03:55 04:08 04:22 14 W 03:59 04:13 04:26 04:41 04:51
15 E 04:00 04:10 04:25 04:38 04:52 15 W 04:29 04:43 04:56 05:11 05:21
16 E 04:30 04:40 04:55 05:08 05:22 16 W 04:59 05:13 05:26 05:41 05:51
17 E 05:00 05:10 05:25 05:38 05:52 17 W 05:29 05:43 05:56 06:11 06:21
18 E 05:30 05:40 05:55 06:08 06:22 18 W 05:59 06:13 06:26 06:41 06:51
19 E 06:00 06:10 06:25 06:38 06:52 19 W 06:59 07:13 07:26 07:41 07:51
20 E 07:00 07:10 07:25 07:38 07:52 20 W 07:59 08:13 08:26 08:41 08: 51
Block Numbering
In a transit agency, each block must have a unique number. In this way, it is feasible to track each block easily, without any confusion. The most common method for numbering blocks is using a four-digit number. The first two digits must represent the route number, and the last two digits should be related to the block number.
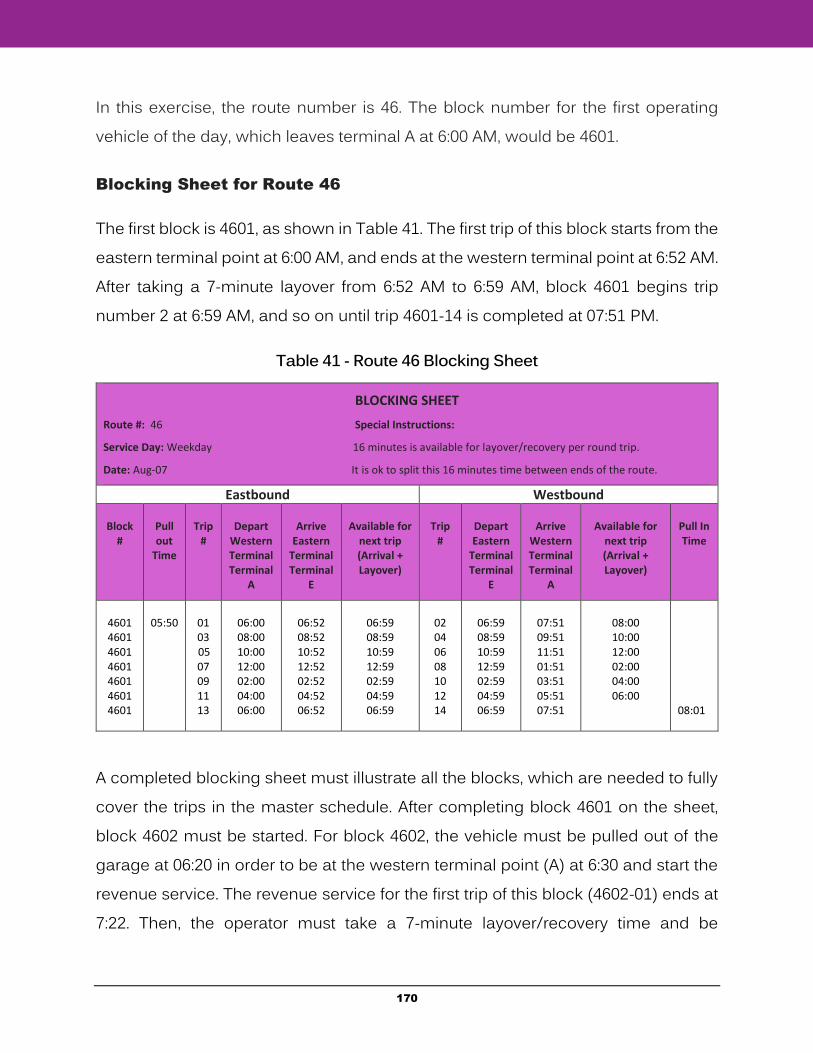
170
In this exercise, the route number is 46. The block number for the first operating vehicle of the day, which leaves terminal A at 6:00 AM, would be 4601.
Blocking Sheet for Route 46
The first block is 4601, as shown in Table 41. The first trip of this block starts from the eastern terminal point at 6:00 AM, and ends at the western terminal point at 6:52 AM. After taking a 7-minute layover from 6:52 AM to 6:59 AM, block 4601 begins trip number 2 at 6:59 AM, and so on until trip 4601-14 is completed at 07:51 PM.
Table 41 - Route 46 Blocking Sheet
A completed blocking sheet must illustrate all the blocks, which are needed to fully cover the trips in the master schedule. After completing block 4601 on the sheet, block 4602 must be started. For block 4602, the vehicle must be pulled out of the garage at 06:20 in order to be at the western terminal point (A) at 6:30 and start the revenue service. The revenue service for the first trip of this block (4602-01) ends at 7:22. Then, the operator must take a 7-minute layover/recovery time and be
BLOCKING SHEET
Route #: 46 Special Instructions:
Service Day: Weekday 16 minutes is available for layover/recovery per round trip.
Date: Aug-07 It is ok to split this 16 minutes time between ends of the route.
Eastbound Westbound
Block #
Pull out
Time
Trip
#
Depart
Western Terminal Terminal
A
Arrive
Eastern Terminal Terminal
E
Available for
next trip (Arrival + Layover)
Trip
#
Depart Eastern
Terminal Terminal
E
Arrive
Western Terminal Terminal
A
Available for
next trip (Arrival + Layover)
Pull In Time
4601 4601 4601 4601 4601 4601 4601
05:50
01 03
05 07 09 11 13
06:00 08:00 10:00 12:00 02:00 04:00 06:00
06:52 08:52 10:52 12:52 02:52 04:52 06:52
06:59 08:59 10:59 12:59 02:59 04:59 06:59
02 04 06 08 10 12 14
06:59 08:59 10:59 12:59 02:59 04:59 06:59
07:51 09:51 11:51 01:51 03:51 05:51 07:51
08:00 10:00 12:00 02:00 04:00 06:00
08:01
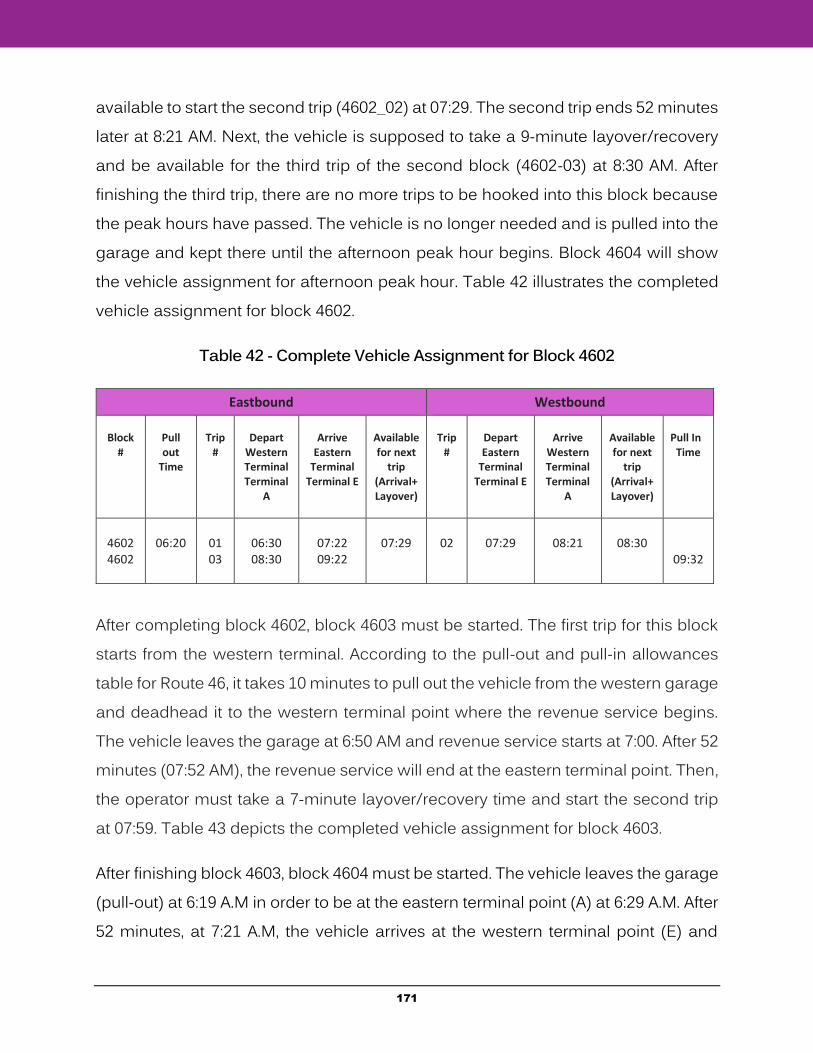
171
available to start the second trip (4602_02) at 07:29. The second trip ends 52 minutes later at 8:21 AM. Next, the vehicle is supposed to take a 9-minute layover/recovery and be available for the third trip of the second block (4602-03) at 8:30 AM. After finishing the third trip, there are no more trips to be hooked into this block because the peak hours have passed. The vehicle is no longer needed and is pulled into the garage and kept there until the afternoon peak hour begins. Block 4604 will show the vehicle assignment for afternoon peak hour. Table 42 illustrates the completed vehicle assignment for block 4602.
Table 42 - Complete Vehicle Assignment for Block 4602
After completing block 4602, block 4603 must be started. The first trip for this block starts from the western terminal. According to the pull-out and pull-in allowances table for Route 46, it takes 10 minutes to pull out the vehicle from the western garage and deadhead it to the western terminal point where the revenue service begins. The vehicle leaves the garage at 6:50 AM and revenue service starts at 7:00. After 52 minutes (07:52 AM), the revenue service will end at the eastern terminal point. Then, the operator must take a 7-minute layover/recovery time and start the second trip at 07:59. Table 43 depicts the completed vehicle assignment for block 4603.
After finishing block 4603, block 4604 must be started. The vehicle leaves the garage (pull-out) at 6:19 A.M in order to be at the eastern terminal point (A) at 6:29 A.M. After 52 minutes, at 7:21 A.M, the vehicle arrives at the western terminal point (E) and
Eastbound Westbound
Block
#
Pull out
Time
Trip
#
Depart
Western Terminal Terminal
A
Arrive
Eastern Terminal
Terminal E
Available for next
trip (Arrival+Layover)
Trip
#
Depart Eastern
Terminal Terminal E
Arrive
Western Terminal Terminal
A
Available for next
trip (Arrival+Layover)
Pull In
Time
4602 4602
06:20
01 03
06:30 08:30
07:22 09:22
07:29
02
07:29
08:21
08:30
09:32
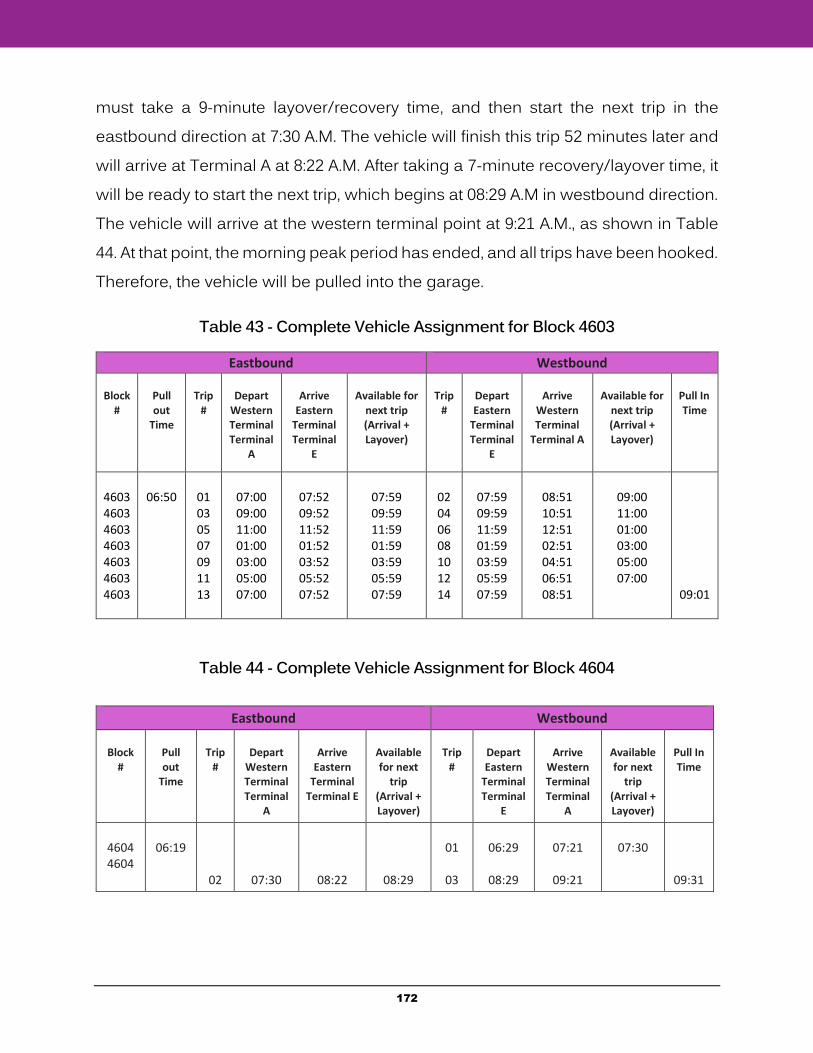
172
must take a 9-minute layover/recovery time, and then start the next trip in the eastbound direction at 7:30 A.M. The vehicle will finish this trip 52 minutes later and will arrive at Terminal A at 8:22 A.M. After taking a 7-minute recovery/layover time, it will be ready to start the next trip, which begins at 08:29 A.M in westbound direction. The vehicle will arrive at the western terminal point at 9:21 A.M., as shown in Table 44. At that point, the morning peak period has ended, and all trips have been hooked. Therefore, the vehicle will be pulled into the garage.
Table 43 - Complete Vehicle Assignment for Block 4603
Table 44 - Complete Vehicle Assignment for Block 4604
Eastbound Westbound
Block #
Pull out
Time
Trip
#
Depart
Western Terminal Terminal
A
Arrive
Eastern Terminal Terminal
E
Available for
next trip (Arrival + Layover)
Trip
#
Depart Eastern
Terminal Terminal
E
Arrive
Western Terminal
Terminal A
Available for
next trip (Arrival + Layover)
Pull In Time
4603 4603 4603 4603 4603 4603 4603
06:50
01 03 05 07 09 11 13
07:00 09:00 11:00 01:00 03:00 05:00 07:00
07:52 09:52 11:52 01:52 03:52 05:52 07:52
07:59 09:59 11:59 01:59 03:59 05:59 07:59
02 04 06 08 10 12 14
07:59 09:59 11:59 01:59 03:59 05:59 07:59
08:51 10:51 12:51 02:51 04:51 06:51 08:51
09:00 11:00 01:00 03:00 05:00 07:00
09:01
Eastbound Westbound
Block
#
Pull out
Time
Trip
#
Depart
Western Terminal Terminal
A
Arrive
Eastern Terminal
Terminal E
Available for next
trip (Arrival + Layover)
Trip
#
Depart Eastern
Terminal Terminal
E
Arrive
Western Terminal Terminal
A
Available for next
trip (Arrival + Layover)
Pull In Time
4604 4604
06:19
02
07:30
08:22
08:29
01
03
06:29
08:29
07:21
09:21
07:30
09:31
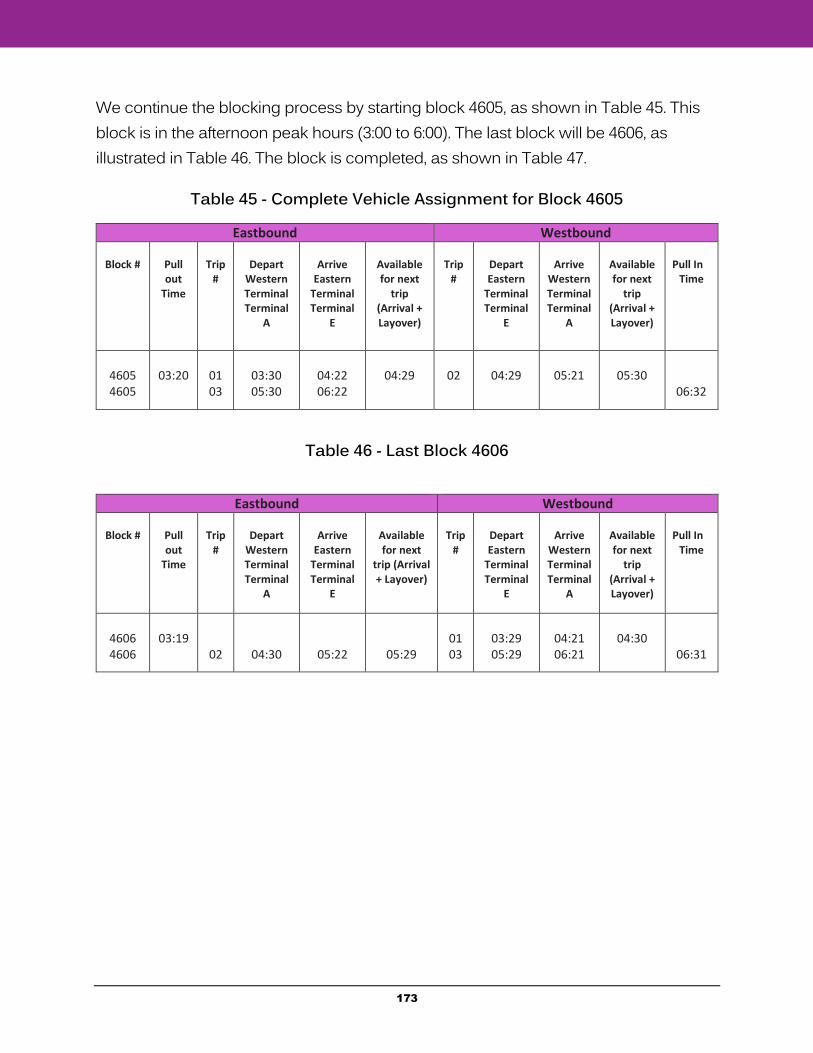
173
We continue the blocking process by starting block 4605, as shown in Table 45. This block is in the afternoon peak hours (3:00 to 6:00). The last block will be 4606, as illustrated in Table 46. The block is completed, as shown in Table 47.
Table 45 - Complete Vehicle Assignment for Block 4605
Table 46 - Last Block 4606
Eastbound Westbound
Block #
Pull out
Time
Trip
#
Depart
Western Terminal Terminal
A
Arrive
Eastern Terminal Terminal
E
Available for next
trip (Arrival + Layover)
Trip
#
Depart Eastern
Terminal Terminal
E
Arrive
Western Terminal Terminal
A
Available for next
trip (Arrival + Layover)
Pull In
Time
4605 4605
03:20
01 03
03:30 05:30
04:22 06:22
04:29
02
04:29
05:21
05:30
06:32
Eastbound Westbound
Block #
Pull out
Time
Trip
#
Depart
Western Terminal Terminal
A
Arrive
Eastern Terminal Terminal
E
Available for next
trip (Arrival + Layover)
Trip
#
Depart Eastern
Terminal Terminal
E
Arrive
Western Terminal Terminal
A
Available for next
trip (Arrival + Layover)
Pull In
Time
4606 4606
03:19
02
04:30
05:22
05:29
01 03
03:29 05:29
04:21 06:21
04:30
06:31
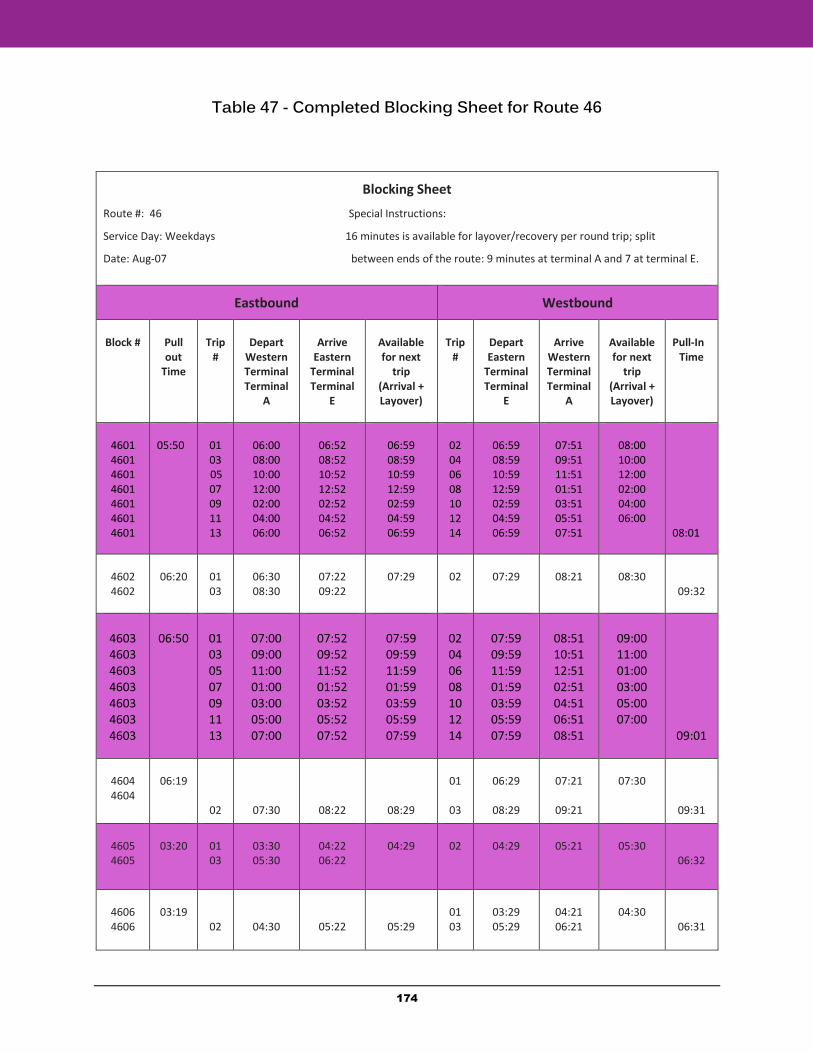
174
Table 47 - Completed Blocking Sheet for Route 46
Blocking Sheet
Route #: 46 Special Instructions:
Service Day: Weekdays 16 minutes is available for layover/recovery per round trip; split
Date: Aug-07 between ends of the route: 9 minutes at terminal A and 7 at terminal E.
Eastbound Westbound
Block #
Pull out
Time
Trip
#
Depart
Western Terminal Terminal
A
Arrive
Eastern Terminal Terminal
E
Available for next
trip (Arrival + Layover)
Trip
#
Depart Eastern
Terminal Terminal
E
Arrive
Western Terminal Terminal
A
Available for next
trip (Arrival + Layover)
Pull-In
Time
4601 4601 4601 4601 4601 4601 4601
05:50
01 03
05 07 09 11 13
06:00 08:00 10:00 12:00 02:00 04:00 06:00
06:52 08:52 10:52 12:52 02:52 04:52 06:52
06:59 08:59 10:59 12:59 02:59 04:59 06:59
02 04 06 08 10 12 14
06:59 08:59 10:59 12:59 02:59 04:59 06:59
07:51 09:51 11:51 01:51 03:51 05:51 07:51
08:00 10:00 12:00 02:00 04:00 06:00
08:01
4602 4602
06:20
01 03
06:30 08:30
07:22 09:22
07:29
02
07:29
08:21
08:30
09:32
4603 4603 4603 4603 4603 4603 4603
06:50
01 03 05 07 09 11 13
07:00 09:00 11:00 01:00 03:00 05:00 07:00
07:52 09:52 11:52 01:52 03:52 05:52 07:52
07:59 09:59 11:59 01:59 03:59 05:59 07:59
02 04 06 08 10 12 14
07:59 09:59 11:59 01:59 03:59 05:59 07:59
08:51 10:51 12:51 02:51 04:51 06:51 08:51
09:00 11:00 01:00 03:00 05:00 07:00
09:01
4604 4604
06:19
02
07:30
08:22
08:29
01
03
06:29
08:29
07:21
09:21
07:30
09:31
4605 4605
03:20
01 03
03:30 05:30
04:22 06:22
04:29
02
04:29
05:21
05:30
06:32
4606 4606
03:19
02
04:30
05:22
05:29
01 03
03:29 05:29
04:21 06:21
04:30
06:31
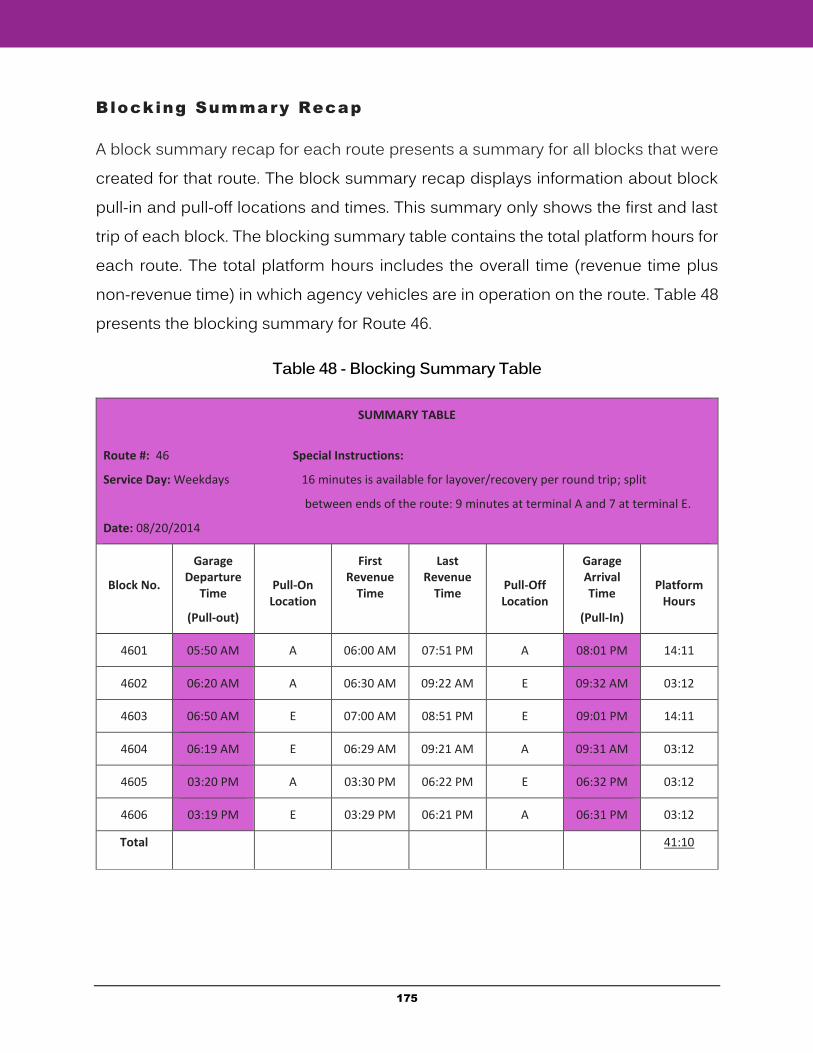
175
Blocking Summary Recap
A block summary recap for each route presents a summary for all blocks that were created for that route. The block summary recap displays information about block pull-in and pull-off locations and times. This summary only shows the first and last trip of each block. The blocking summary table contains the total platform hours for each route. The total platform hours includes the overall time (revenue time plus non-revenue time) in which agency vehicles are in operation on the route. Table 48 presents the blocking summary for Route 46.
Table 48 - Blocking Summary Table
SUMMARY TABLE
Route #: 46 Special Instructions:
Service Day: Weekdays 16 minutes is available for layover/recovery per round trip; split
between ends of the route: 9 minutes at terminal A and 7 at terminal E.
Date: 08/20/2014
Block No.
Garage Departure
Time
(Pull-out)
Pull-On Location
First Revenue
Time
Last Revenue
Time
Pull-Off Location
Garage Arrival Time
(Pull-In)
Platform Hours
4601 05:50 AM A 06:00 AM 07:51 PM A 08:01 PM 14:11
4602 06:20 AM A 06:30 AM 09:22 AM E 09:32 AM 03:12
4603 06:50 AM E 07:00 AM 08:51 PM E 09:01 PM 14:11
4604 06:19 AM E 06:29 AM 09:21 AM A 09:31 AM 03:12
4605 03:20 PM A 03:30 PM 06:22 PM E 06:32 PM 03:12
4606 03:19 PM E 03:29 PM 06:21 PM A 06:31 PM 03:12
Total 41:10
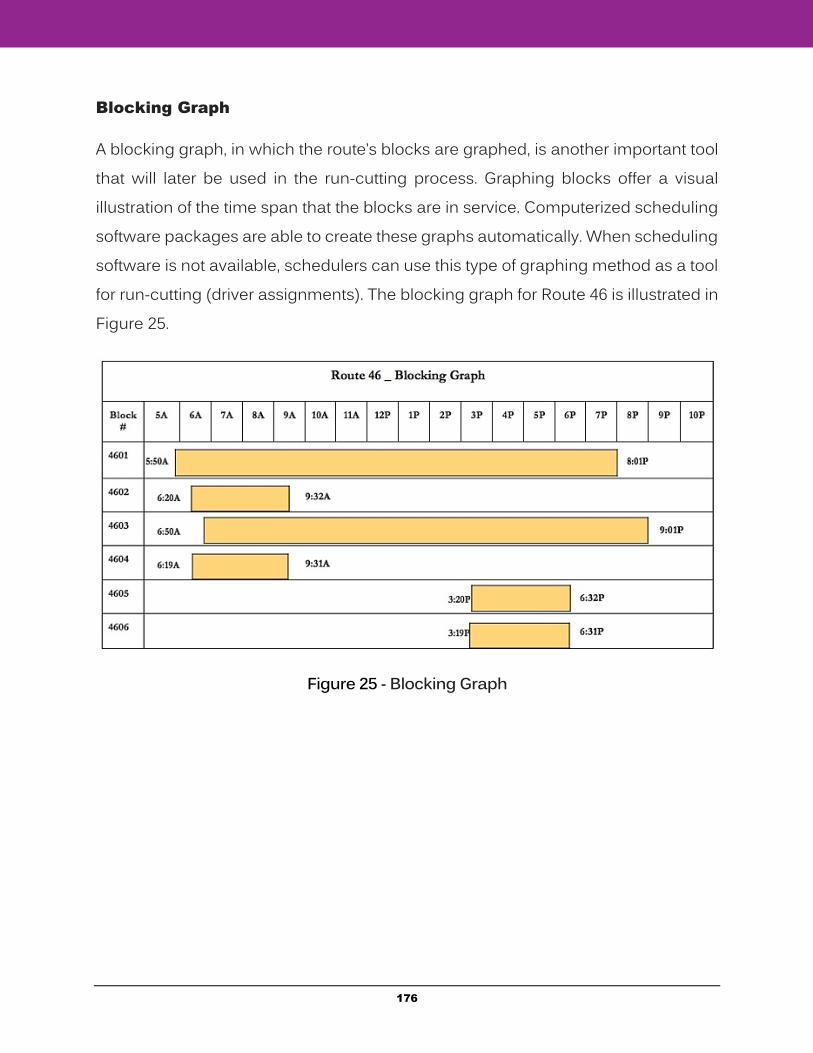
176
Blocking Graph
A blocking graph, in which the route’s blocks are graphed, is another important tool that will later be used in the run-cutting process. Graphing blocks offer a visual illustration of the time span that the blocks are in service. Computerized scheduling software packages are able to create these graphs automatically. When scheduling software is not available, schedulers can use this type of graphing method as a tool for run-cutting (driver assignments). The blocking graph for Route 46 is illustrated in Figure 25.
Figure 25 - Blocking Graph
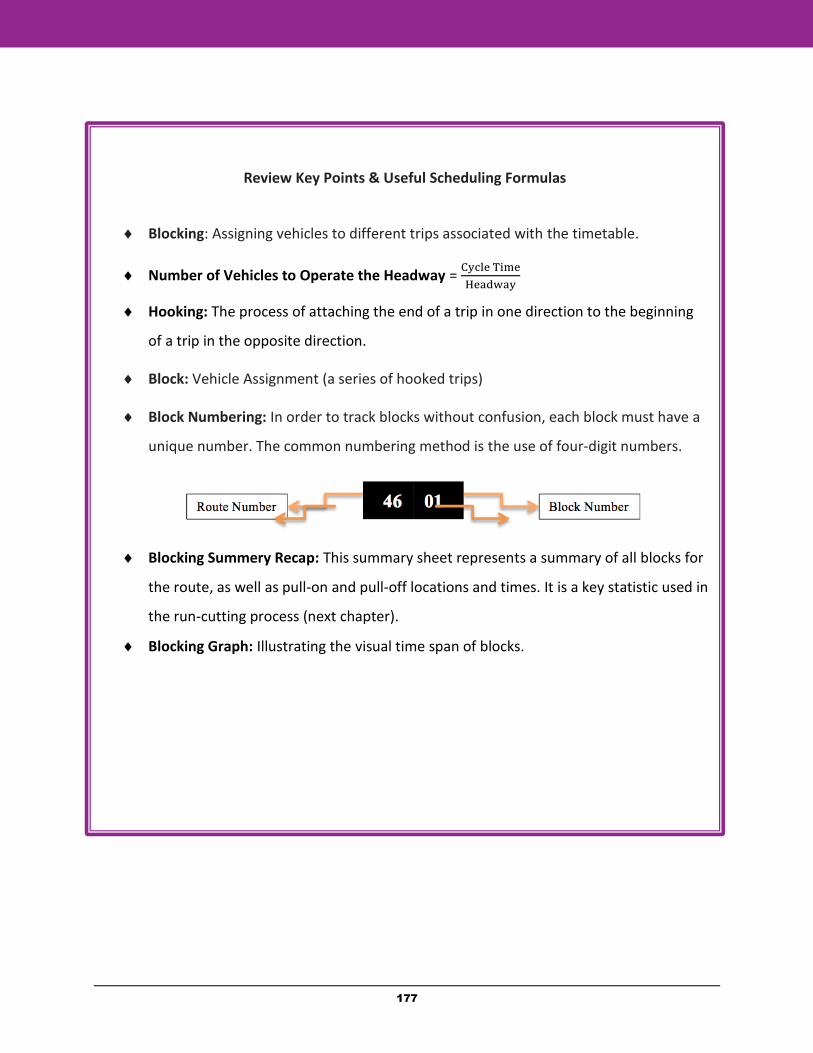
177
Review Key Points & Useful Scheduling Formulas
Blocking: Assigning vehicles to different trips associated with the timetable.
Number of Vehicles to Operate the Headway = Cycle Time
Headway
Hooking: The process of attaching the end of a trip in one direction to the beginning
of a trip in the opposite direction.
Block: Vehicle Assignment (a series of hooked trips)
Block Numbering: In order to track blocks without confusion, each block must have a
unique number. The common numbering method is the use of four-digit numbers.
Blocking Summery Recap: This summary sheet represents a summary of all blocks for
the route, as well as pull-on and pull-off locations and times. It is a key statistic used in
the run-cutting process (next chapter).
Blocking Graph: Illustrating the visual time span of blocks.
178
Run-cutting (Driver Assignment)
What is run?
A “run” refers to a work assignment for a driver. Normally, a run is a whole day’s work assignment.
What is Run-Cutting?
“Run-cutting” is the process of creating operator (driver) assignments through cutting vehicle blocks from the master schedule of a given route.
When the blocking process is done, the scheduler starts the run-cutting process, which involves assigning the blocks to different operators. The scheduler must break up the blocks into individual assignments or work pieces (runs).
Each operator assignment (run) may be made of one complete block or parts of multiple blocks. All blocks from the master schedule must be cut and assembled in an efficient way to create runs.
Importance of Run-Cutting
As previously mentioned, transit agencies consider operator costs a major part of the total operating cost; which usually accounts for more than half of the total operating costs. Run-cutting is a crucial process, as it determines the ultimate number of operators needed to operate the service reflected in the master schedule. In general, the basic objective of the run-cutting process is to minimize driver costs. Transit schedulers must utilize their creativity and skills to efficiently assign all of the block pieces to the fewest number of operator runs. In order to properly carry out the run-cutting process, it is highly important that the scheduler be fully familiar with types of runs, labor agreement provisions, and the operator pay calculation methodology.
179
Run-Cutting Objectives
Transit agencies may have a variety of run-cutting objectives. Knowing the agency’s relevant objectives is required to assess the success of a run-cut. Some typical agency objectives that the scheduler needs to actualize in run-cutting solutions includes:
Efficiency: Schedulers must do their best to obtain an efficient run-cutting solution. Since driver costs are more than half of the entire operating costs, the run-cutting efficiency affects operating efficiencies.
Legality: Runs (driver assignments) that adhere to all related guidelines and rules are called legal runs. It is important that run-cuts be legal and conform to all safety, driving, and break requirements.
Equilibrium (Balance): Since runs are operators’ work assignments, the work life of operators will be greatly affected by the way the runs are cut. Therefore, schedulers must try to offer solutions that provide a convenient work condition for operators. However, at the same time, the scheduler is obligated to consider the agency’s priorities and benefits. To comply with both concepts, the scheduler must skillfully create a balance between an agency’s priorities and the working condition of operators.
Run-Cutt ing Methods
Before the advent of the computer, transit schedulers had to go through a time-consuming practice of manually preparing the entire scheduling process, including the run-cutting phase. To create the assignment of operators, they literally had no choice other than to physically get involved in the process of run-cutting and cut blocks into pieces. They put pieces of paper, which represented the blocks, on the wall and cut them into individual pieces.
180
As public transit systems started to take advantage of computerized systems, the quality of the scheduling process improved considerably. Initially, Microsoft Excel was used to schedule vehicles and runs. Nowadays, almost all public transit agencies take advantage of one of the two available and highly specialized scheduling software packages: Trapeze and Hastus. Using scheduling software makes this process easier and reduces the time for performing the run-cutting process from weeks to a few days. However, even the best computerized run-cut optimizers cannot cut all blocks efficiently, especially when it requires solving complex run-cutting problems.
Labor Agreements
The run-cutting process may become more complicated at times, as it has to follow certain agency policies, rules, restrictions, as well as provisions included in union contracts. For example, run-cut restrictions may specify a minimum percentage of straight runs, maximum spread, and maximum platform hours before meal break, maximum platform hours per work assignment, and minimum platform hours per biddable assignment. Agencies are required to limit the number of split runs and may forbid these runs from starting before or ending after specific times.
Union contracts define employment conditions, work rules, etc. Even the transit systems without unions have particular regulations that have been created and developed over time.
Types of Runs
The runs operated by public transit agencies have three main types of runs, as follows:
Straight Runs
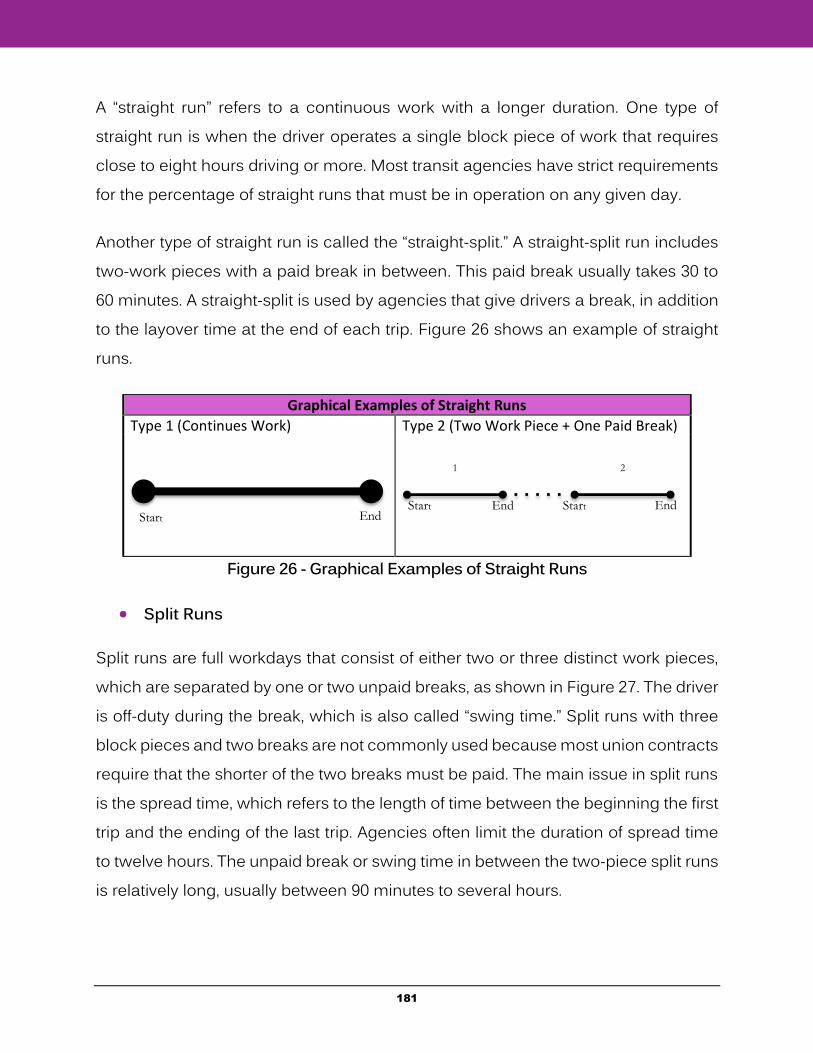
181
A “straight run” refers to a continuous work with a longer duration. One type of straight run is when the driver operates a single block piece of work that requires close to eight hours driving or more. Most transit agencies have strict requirements for the percentage of straight runs that must be in operation on any given day.
Another type of straight run is called the “straight-split.” A straight-split run includes two-work pieces with a paid break in between. This paid break usually takes 30 to 60 minutes. A straight-split is used by agencies that give drivers a break, in addition to the layover time at the end of each trip. Figure 26 shows an example of straight runs.
Graphical Examples of Straight Runs
Type 1 (Continues Work) Type 2 (Two Work Piece + One Paid Break)
Figure 26 - Graphical Examples of Straight Runs
Split Runs
Split runs are full workdays that consist of either two or three distinct work pieces, which are separated by one or two unpaid breaks, as shown in Figure 27. The driver is off-duty during the break, which is also called “swing time.” Split runs with three block pieces and two breaks are not commonly used because most union contracts require that the shorter of the two breaks must be paid. The main issue in split runs is the spread time, which refers to the length of time between the beginning the first trip and the ending of the last trip. Agencies often limit the duration of spread time to twelve hours. The unpaid break or swing time in between the two-piece split runs is relatively long, usually between 90 minutes to several hours.
Start Start End End Start
End
1 2
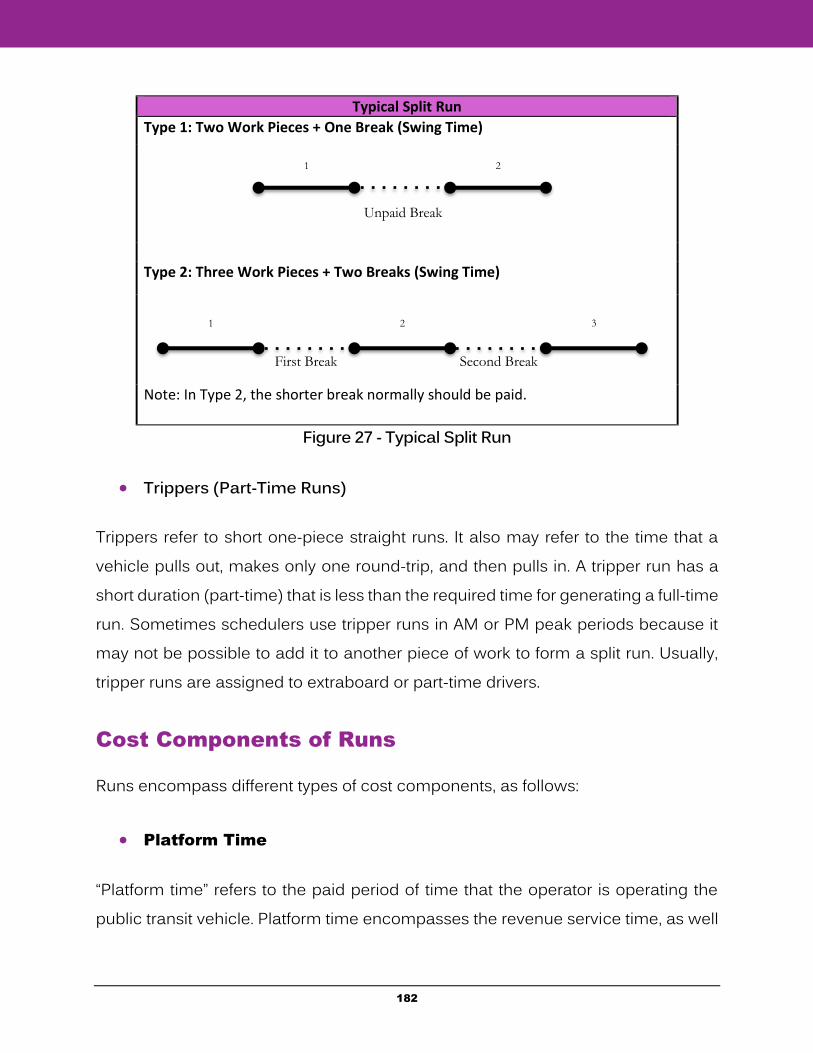
182
Typical Split Run
Type 1: Two Work Pieces + One Break (Swing Time)
Type 2: Three Work Pieces + Two Breaks (Swing Time)
Note: In Type 2, the shorter break normally should be paid.
Figure 27 - Typical Split Run
Trippers (Part-Time Runs)
Trippers refer to short one-piece straight runs. It also may refer to the time that a vehicle pulls out, makes only one round-trip, and then pulls in. A tripper run has a short duration (part-time) that is less than the required time for generating a full-time run. Sometimes schedulers use tripper runs in AM or PM peak periods because it may not be possible to add it to another piece of work to form a split run. Usually, tripper runs are assigned to extraboard or part-time drivers.
Cost Components of Runs
Runs encompass different types of cost components, as follows:
Platform Time
“Platform time” refers to the paid period of time that the operator is operating the public transit vehicle. Platform time encompasses the revenue service time, as well
1 2
Unpaid Break
1 2 3
First Break Second Break
183
as the required time to support it, including the layover time, the needed time to transfer or deadhead the vehicle from the garage to the beginning of the route where revenue service begins operating (pull-out time) and the required time for pull-in, and returning the vehicle to the garage or depot. Platform time does not include travel time, report time, and turn-in time.
Travel Time
“Travel time” refers to the paid time intended to allow drivers to travel between garages and relief points. When the only purpose of travel is relief and is not part of the pull-in or pull-out process, the travel time should be calculated separately, and it should not be included in the platform time.
To make it clear, imagine an operator that is supposed to finish their workday and be relieved by another operator at a specific timepoint. Suppose that the relief action occurs on the street, then the operator that finished their workday must travel to the garage and sign off. The time that it takes for the operator to reach to the garage is called travel time. This time must be paid and is not added to the platform time. Travel time may also be needed when operators begin their run or piece of work by relieving another operator on the route rather than the garage. In this case, the operator must be transferred from the garage to the relief location.
There are certain factors that schedulers must consider while determining travel time, as follows:
Relief type (car, walk, taxi, bus, etc.): It is important that schedulers differentiate travel times in accordance with the available relief type. The reason is that operator relief can occur in different ways. When an operator is supposed to begin or finish their run or work piece at an intermediate timepoint, they can commute between the garage and time-point by car,
184
walk, bus, etc., depending on a range of factors. The type of relief commute may affect the required travel time.
Time of the Day: Schedulers must pay attention to the time of the relief. Assuming that the location of two reliefs is the same, their required travel time for returning to the garage may still be different as a result of occurring at different times of the day.
Allocating real time: Considering that real time is important, especially when the operator is transferring from the garage to the relief point to begin their run. In such situations, allocating an average time instead of real time may result in operators not having enough time and arrive at the relief location late. If the relief operator is traveling on a route in the revenue service, the scheduler must allocate wait time, the bus route schedule time, and any walk time to or from the garage.
Bus positioning: Schedulers must allocate enough time required for positioning the vehicle at a proper location for relief. This allocated time may be different, depending on the vehicle’s direction and location of the bus stop.
Report and Turn -In Allowances
“Report allowance” refers to the amount of time paid to an operator from sign-in time to the beginning of the pull-out. Throughout this paid time, an operator receives the relevant instructions and supplies pertinent to their particular run, locate their assigned bus, and carry out an inspection before starting the trip. In this manual, a 15-minute report allowance will be allocated for Route 46.
“Turn-in allowance” refers to the amount of time paid to an operator for reporting to the dispatcher and signing off. When operators end their trip by pulling the vehicle into the garage, the turn-in allowance starts after the pull-in. In cases where the operators end their work by being relieved at another place along the route, the turn-
185
in allowance begins after the travel time and upon reaching the garage. In this manual, we will consider a 10-minute turn-in allowance for Route 46.
Intervening Time (Swing Time)
“Intervening” or “swing time” is the time between the pieces of a split run. Swing time is usually unpaid time, but if it is paid, then it is called “inside time.”
Guarantee Time (Make-Up Time)
“Make-up” or “guarantee time” refers to the payment for a time that an operator did not work. Transit agencies allocate make-up time to the operator’s schedule when the total paid time for a run must become equal to a minimum daily or weekly guarantee. For example, when the minimum daily pay hours is equals 8, and if a driver’s run totals 7:53, including all platform and report and turn-in allowances, 7 minutes of make-up time will be granted to complete the total 8 hours.
Many union contracts state that operators will be paid for a minimum of eight hours of work. In this case, even if an operator’s assigned work only takes seven hours, the agency must pay for eight hours. The additional hour is considered guarantee time. Since an ineffective run-cutting may result in too much guarantee time, the scheduler’s level of skills can ultimately cause the transit agency to move toward either financial stability or financial catastrophe.
Overtime Premium
The daily full-time work hours for individual operators may be 8 hours (5 workdays per week) or 10 hours (4 workdays per week), depending on the agency and its policy. It clearly means that a full week is equal to 40 hours. When an operator’s work hours exceed the mentioned daily or weekly threshold, the agency pays at a higher rate for the extra hours. The premium or additional amount paid to
186
employees for the overtime hours is usually 1.5 times or “time and a half” higher than the normal rate.
Spread Premium (Excess Spread)
A “spread premium” refers to a higher pay rate of all of the time in excess of the specified maximum spread time and is different from the overtime premium. The spread premium is related to a particular maximum spread time, which is specified in the union contract.
The spread premium can even have multi layers. For example, an operator can be paid more at the rate of 1.5 times for all time up to 60 minutes over the specified maximum spread time, and 1.75 times for all times that exceed 60 minutes over the maximum spread time.
Overtime Example:
If a driver's hourly pay rate is $10 per hour and they work 44 hours in a week, the overtime premium is $5 per hour. Calculate the operator’s salary for 44 work hours.
Total Hours = 44
Full Work Hours per Week = 40
Overtime hours = 44 – 40 = 4
Amount paid for each overtime hour = $ 10 * 1.5 = $ 15
Total Amount Paid to Operator = (40 full time) * ($10) + (4 overtime hrs.) * ($15)
= $400 + $ 60 = $460
187
Shift Premium
Some labor agreements provide premium pay for less desirable shifts. For example, a premium or night differential can be paid to an operator working after a designated time in the evening.
Setting up the Run-Cutting Process
Before starting the run-cutting process, schedulers need to provide a complete master schedule, blocking sheet and block summary recap for each route. In order to attain efficient run-cutting, it is important that the scheduler be knowledgeable about every single applicable work rule and agency policy that affects the run-cutting process. Although scheduling work rules relevant to run-cutting may vary, five examples of work rules that are applicable to the run-cutting process are provided below.
Minimum and Maximum Platform Time
Report time and Turn-in time Allowances
Spread Time and Spread Penalty
Run Type Percentages
Make-up Time
Run-Cutt ing Data
To achieve an effective and successful run-cutting, the collected information that will be used as input into the run-cutting process must be accurate and well-defined. Selecting a good run-cutting methodology is required prior to starting the process. Regardless of the run-cutting problem and its size, information that includes a complete set of trips and vehicle blocks, complete defined work rules, relief types,
188
relief locations, travel times, and cost limits, must be collected in advance either for manual or computerized run-cutting. Concerning computerized methods, a scheduler must verify that all data is included in the package. For a spreadsheet-based method, having a checklist and a methodical approach to evaluate details is necessary in order to confirm that the scheduling process is fully and properly undertaken.
Operator Reliefs, Deadheading, Car reliefs, Meal breaks
Operator Reliefs
“Relief points” refer to the locations where relief operators report to relieve other operators whose shifts end. Relief points are required when the time that the vehicle operates in a given day is longer than the permitted working hours for an operator. They are also necessary when the agency schedules split shifts. A relief allowance equal to travel time is typically considered paid time to operators who are required to travel from the relief location to the garage or vice versa. A benefit of operator relief is that a transit agency’s PVR (Peak Vehicle Requirement) can be lower versus a higher amount of pull-ins and pull-outs.
Relief Locations
Relief location refers to a designated point on routes where drivers must either begin or end their run or a piece of their run. An operator relief can be conducted either at a garage (depot) or at other safe and appropriate locations. Schedulers take several factors into consideration in determining relief locations. Relief locations must be chosen in a way that minimizes travel times. It is important that the relief locations be close to the facilities. Schedulers also need to determine the type of reliefs and consider related issues, such as the availability of relief cars and buses in that location, as well as time.
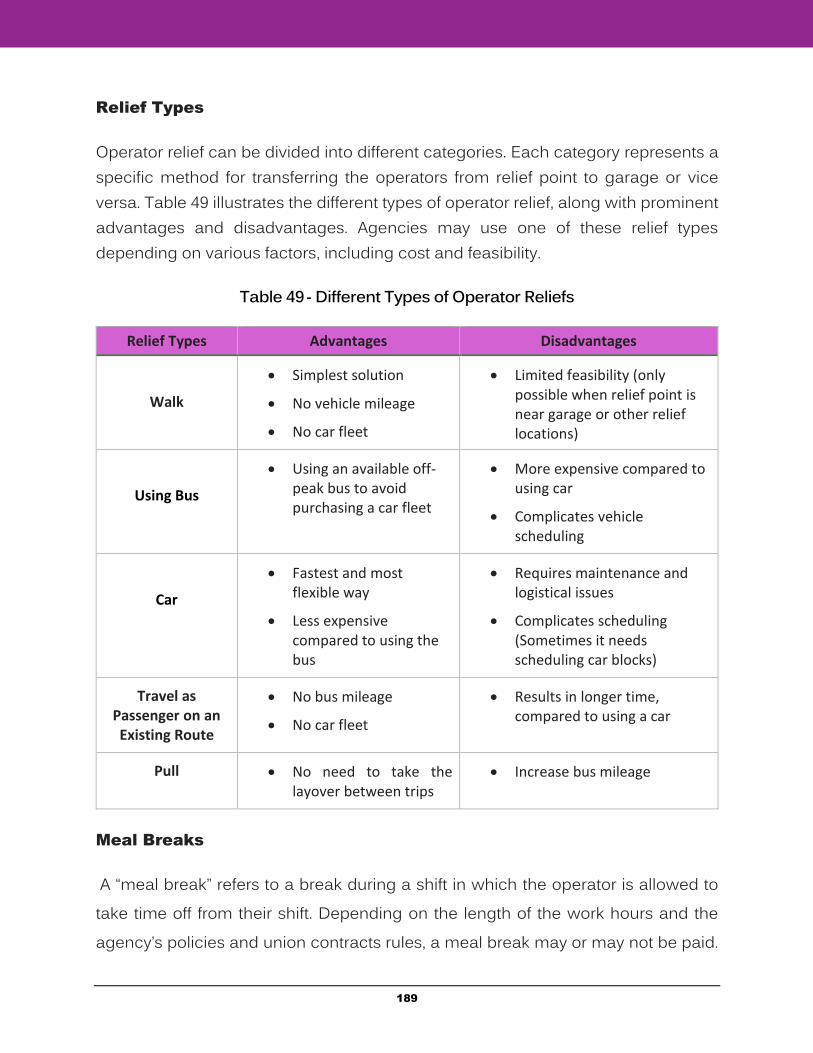
189
Relief Types
Operator relief can be divided into different categories. Each category represents a specific method for transferring the operators from relief point to garage or vice versa. Table 49 illustrates the different types of operator relief, along with prominent advantages and disadvantages. Agencies may use one of these relief types depending on various factors, including cost and feasibility.
Table 49 - Different Types of Operator Reliefs
Relief Types Advantages Disadvantages
Walk
Simplest solution
No vehicle mileage
No car fleet
Limited feasibility (only possible when relief point is near garage or other relief locations)
Using Bus
Using an available off-peak bus to avoid purchasing a car fleet
More expensive compared to using car
Complicates vehicle scheduling
Car
Fastest and most flexible way
Less expensive compared to using the bus
Requires maintenance and logistical issues
Complicates scheduling (Sometimes it needs scheduling car blocks)
Travel as Passenger on an Existing Route
No bus mileage
No car fleet
Results in longer time, compared to using a car
Pull No need to take the layover between trips
Increase bus mileage
Meal Breaks
A “meal break” refers to a break during a shift in which the operator is allowed to take time off from their shift. Depending on the length of the work hours and the agency’s policies and union contracts rules, a meal break may or may not be paid.
190
The unpaid meal breaks have a low-cost impact and should not be considered unproductive time. Meanwhile, paid meal breaks should be added to unproductive time because they have a high impact on operation costs by increasing paid hours, operator requirements, and it reduces productive time.
How to Create Runs and Recut for Higher Quality Run-Cuts
Creating Runs
Although a run-cutting problem has many possible solutions, there may be no specific and unique correct answer for it. In the run-cutting process, the scheduler must start working on the blocks that have been listed chronologically. The scheduler uses a table (e.g., Table 55) to record the work and pay components of the runs. This table allows the scheduler to collect the information related to all runs in one place and review the runs both individually and collectively. On some levels, it is feasible for the scheduler to evaluate the runs and incorporate some adjustments to optimize the run-cutting process. Sometimes, schedulers need to re-cut the blocks and compare the pay components of the new run-cutting solution with the pay components of the previous one to choose a higher quality run-cut.
During the optimization process, the scheduler must pay attention to the following issues:
Provide the desired level of service with the fewest number of runs.
Cutting runs in such a way that platform times become equal or close to pay hours.
Ensuring that runs comply with collected work rules, which encompass relevant agency policies and labor agreement conditions.
191
Run-Cutting Exercise
Before starting the process of run-cutting, the scheduler must check that all required inputs are in place. These inputs include trips and vehicle blocks, regulations and restrictions, relief types, and travel times.
Observation:
Looking at the chronological list of blocks in Table 50, the following points can be determined:
Two blocks (4601 & 4603) on Route 46 are base blocks (all day).
Since these two blocks are base, it is possible to cut them to generate straight runs (continuous work of longer duration).
Blocks 4602, 4604, 4605, and 4606 are not base blocks. For these blocks, considering the duration of time between the end of AM services and beginning of PM services (swing time) can assist in determining that creating straight runs is not possible.
Since the number of AM blocks is the same as the number of PM blocks, there is piece balance, and it may be possible to assemble them two by two and create spilt runs.
Note: Piece balance occurs when: Number of AM blocks = Number of PM blocks
If the AM and PM blocks are successfully assembled two by two and create lawful runs, the result is two split runs.
No piece is left.
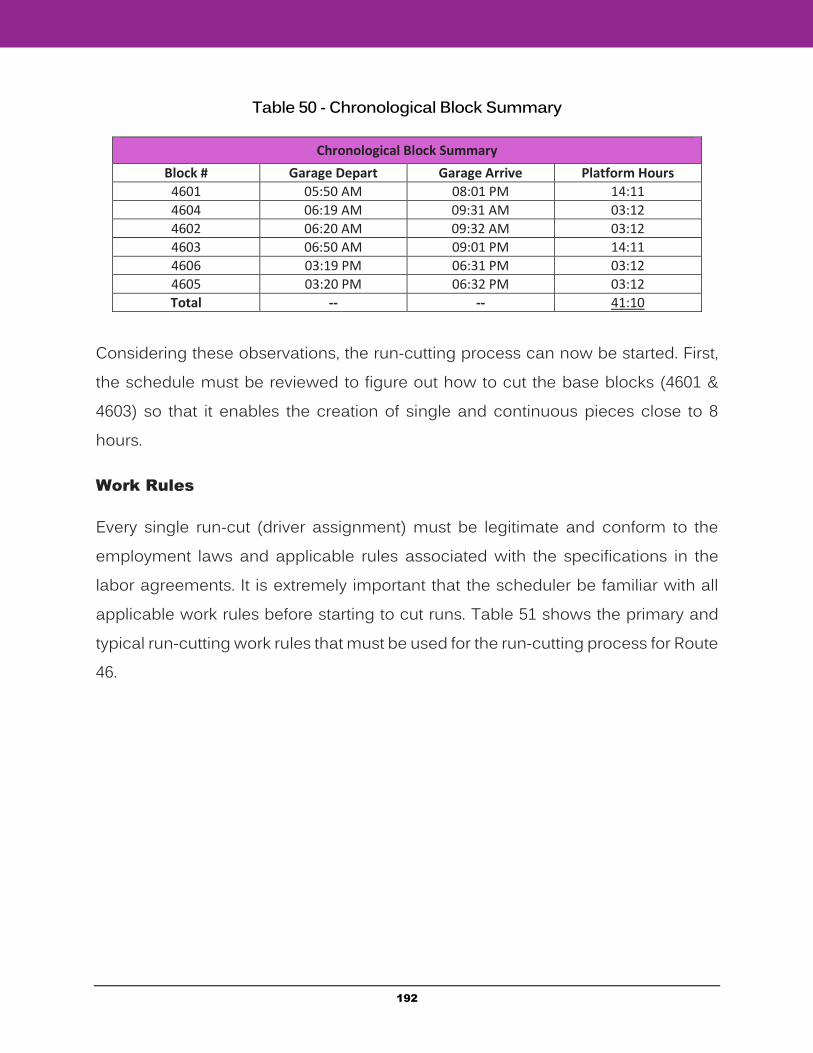
192
Table 50 - Chronological Block Summary
Chronological Block Summary
Block # Garage Depart Garage Arrive Platform Hours
4601 05:50 AM 08:01 PM 14:11
4604 06:19 AM 09:31 AM 03:12
4602 06:20 AM 09:32 AM 03:12
4603 06:50 AM 09:01 PM 14:11
4606 03:19 PM 06:31 PM 03:12
4605 03:20 PM 06:32 PM 03:12
Total -- -- 41:10
Considering these observations, the run-cutting process can now be started. First, the schedule must be reviewed to figure out how to cut the base blocks (4601 & 4603) so that it enables the creation of single and continuous pieces close to 8 hours.
Work Rules
Every single run-cut (driver assignment) must be legitimate and conform to the employment laws and applicable rules associated with the specifications in the labor agreements. It is extremely important that the scheduler be familiar with all applicable work rules before starting to cut runs. Table 51 shows the primary and typical run-cutting work rules that must be used for the run-cutting process for Route 46.
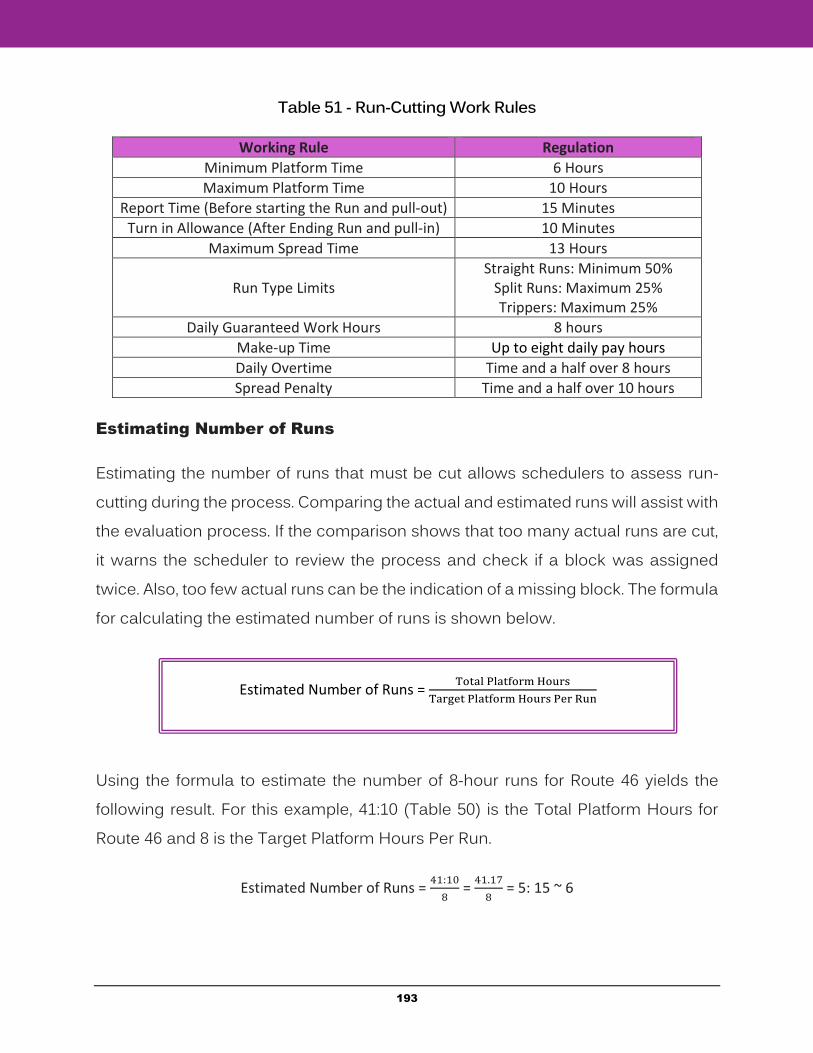
193
Table 51 - Run-Cutting Work Rules
Working Rule Regulation
Minimum Platform Time 6 Hours
Maximum Platform Time 10 Hours
Report Time (Before starting the Run and pull-out) 15 Minutes
Turn in Allowance (After Ending Run and pull-in) 10 Minutes
Maximum Spread Time 13 Hours
Run Type Limits
Straight Runs: Minimum 50% Split Runs: Maximum 25% Trippers: Maximum 25%
Daily Guaranteed Work Hours 8 hours
Make-up Time Up to eight daily pay hours
Daily Overtime Time and a half over 8 hours
Spread Penalty Time and a half over 10 hours
Estimating Number of Runs
Estimating the number of runs that must be cut allows schedulers to assess run-cutting during the process. Comparing the actual and estimated runs will assist with the evaluation process. If the comparison shows that too many actual runs are cut, it warns the scheduler to review the process and check if a block was assigned twice. Also, too few actual runs can be the indication of a missing block. The formula for calculating the estimated number of runs is shown below.
Using the formula to estimate the number of 8-hour runs for Route 46 yields the following result. For this example, 41:10 (Table 50) is the Total Platform Hours for Route 46 and 8 is the Target Platform Hours Per Run.
Estimated Number of Runs = 41:10
8 =
41.17
8 = 5: 15 ~ 6
Estimated Number of Runs = Total Platform Hours
Target Platform Hours Per Run
194
Since the number is a decimal, it must be round up to the next number, which is 6. Therefore, 6 runs should be cut by the end of the run-cutting process.
Run Guide
A “run guide” refers to a summary sheet of runs. It includes start/finish locations, work hours, and cost element breakdowns. A run guide is an important document that illustrates all of the runs that will be available for picking or mark-up during the run-cutting process. Table 52 is a sample run guide. The column on the left side contains a run number, type, and block number. The second column is related to the report time. An operator must sign in earlier depending on the report allowance. The report allowance is payable and will be included in the total spread column. Column 3 illustrates the scheduled time, place, and type of start for the run. For example, one run may start from the garage. In this case, the starting place is the garage and the type is pull-out. Sometimes, runs start at an intermediate point, and one operator begins their run by relieving the previous operator. In these cases, the type of start would be “street.” Column 4 shows the time, place, and type of ending of each run. Column 5 is related to the operator sign-off time, which again is payable. After ending the run at column 4, the required sign-off allowance should be added to the end time to determine the sign-off time. Column 6 contains the platform, report, travel, and total hours. Platform hours include revenue time, as well as garage pull-out and/or pull-in time. The total report time can be calculated by adding the report allowance before starting the trip at the required time for sign-off after ending the run. In column 6, “travel” refers to the required time for the operator to return to the garage after ending their run. The total from the platform, report, and travel time must be calculated and placed under column 7, which is the total spread time. Depending on the agency’s particular rules and regulations, the guarantee, overtime, and spread penalty must be calculated for columns 8, 9, and 10.
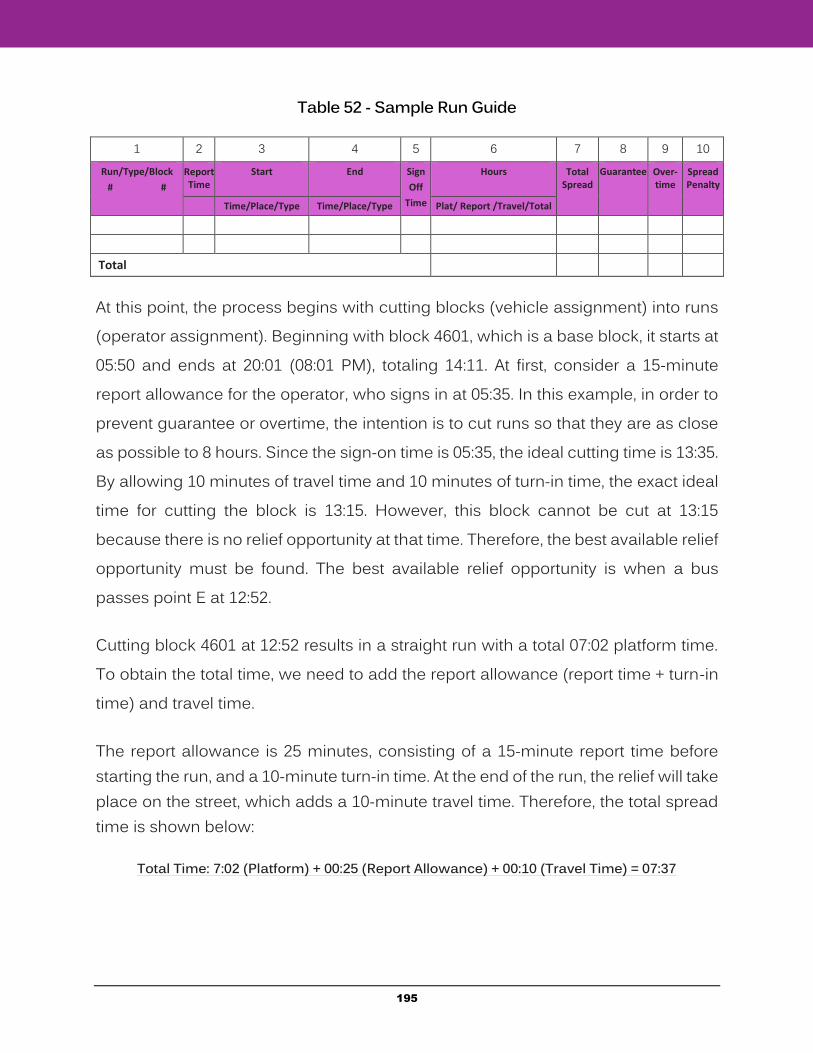
195
Table 52 - Sample Run Guide
1 2 3 4 5 6 7 8 9 10 Run/Type/Block
# #
Report Time
Start End Sign
Off
Time
Hours
Total Spread
Guarantee Over-time
Spread Penalty
Time/Place/Type Time/Place/Type Plat/ Report /Travel/Total
Total
At this point, the process begins with cutting blocks (vehicle assignment) into runs (operator assignment). Beginning with block 4601, which is a base block, it starts at 05:50 and ends at 20:01 (08:01 PM), totaling 14:11. At first, consider a 15-minute report allowance for the operator, who signs in at 05:35. In this example, in order to prevent guarantee or overtime, the intention is to cut runs so that they are as close as possible to 8 hours. Since the sign-on time is 05:35, the ideal cutting time is 13:35. By allowing 10 minutes of travel time and 10 minutes of turn-in time, the exact ideal time for cutting the block is 13:15. However, this block cannot be cut at 13:15 because there is no relief opportunity at that time. Therefore, the best available relief opportunity must be found. The best available relief opportunity is when a bus passes point E at 12:52.
Cutting block 4601 at 12:52 results in a straight run with a total 07:02 platform time. To obtain the total time, we need to add the report allowance (report time + turn-in time) and travel time.
The report allowance is 25 minutes, consisting of a 15-minute report time before starting the run, and a 10-minute turn-in time. At the end of the run, the relief will take place on the street, which adds a 10-minute travel time. Therefore, the total spread time is shown below:
Total Time: 7:02 (Platform) + 00:25 (Report Allowance) + 00:10 (Travel Time) = 07:37
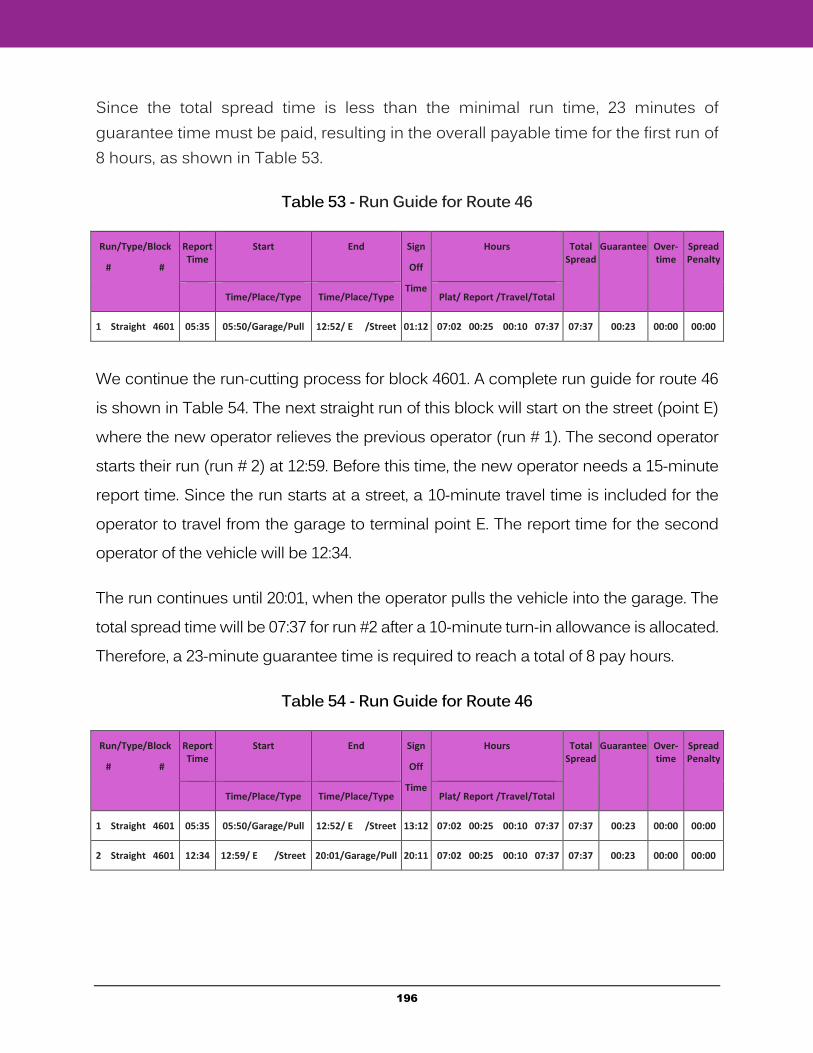
196
Since the total spread time is less than the minimal run time, 23 minutes of guarantee time must be paid, resulting in the overall payable time for the first run of 8 hours, as shown in Table 53.
Table 53 - Run Guide for Route 46
Run/Type/Block
# #
Report Time
Start End Sign
Off
Time
Hours
Total Spread
Guarantee Over-time
Spread Penalty
Time/Place/Type Time/Place/Type Plat/ Report /Travel/Total
1 Straight 4601 05:35 05:50/Garage/Pull 12:52/ E /Street 01:12 07:02 00:25 00:10 07:37 07:37 00:23 00:00 00:00
We continue the run-cutting process for block 4601. A complete run guide for route 46 is shown in Table 54. The next straight run of this block will start on the street (point E) where the new operator relieves the previous operator (run # 1). The second operator starts their run (run # 2) at 12:59. Before this time, the new operator needs a 15-minute report time. Since the run starts at a street, a 10-minute travel time is included for the operator to travel from the garage to terminal point E. The report time for the second operator of the vehicle will be 12:34.
The run continues until 20:01, when the operator pulls the vehicle into the garage. The total spread time will be 07:37 for run #2 after a 10-minute turn-in allowance is allocated. Therefore, a 23-minute guarantee time is required to reach a total of 8 pay hours.
Table 54 - Run Guide for Route 46
Run/Type/Block
# #
Report Time
Start End Sign
Off
Time
Hours
Total Spread
Guarantee Over-time
Spread Penalty
Time/Place/Type Time/Place/Type Plat/ Report /Travel/Total
1 Straight 4601 05:35 05:50/Garage/Pull 12:52/ E /Street 13:12 07:02 00:25 00:10 07:37 07:37 00:23 00:00 00:00
2 Straight 4601 12:34 12:59/ E /Street 20:01/Garage/Pull 20:11 07:02 00:25 00:10 07:37 07:37 00:23 00:00 00:00
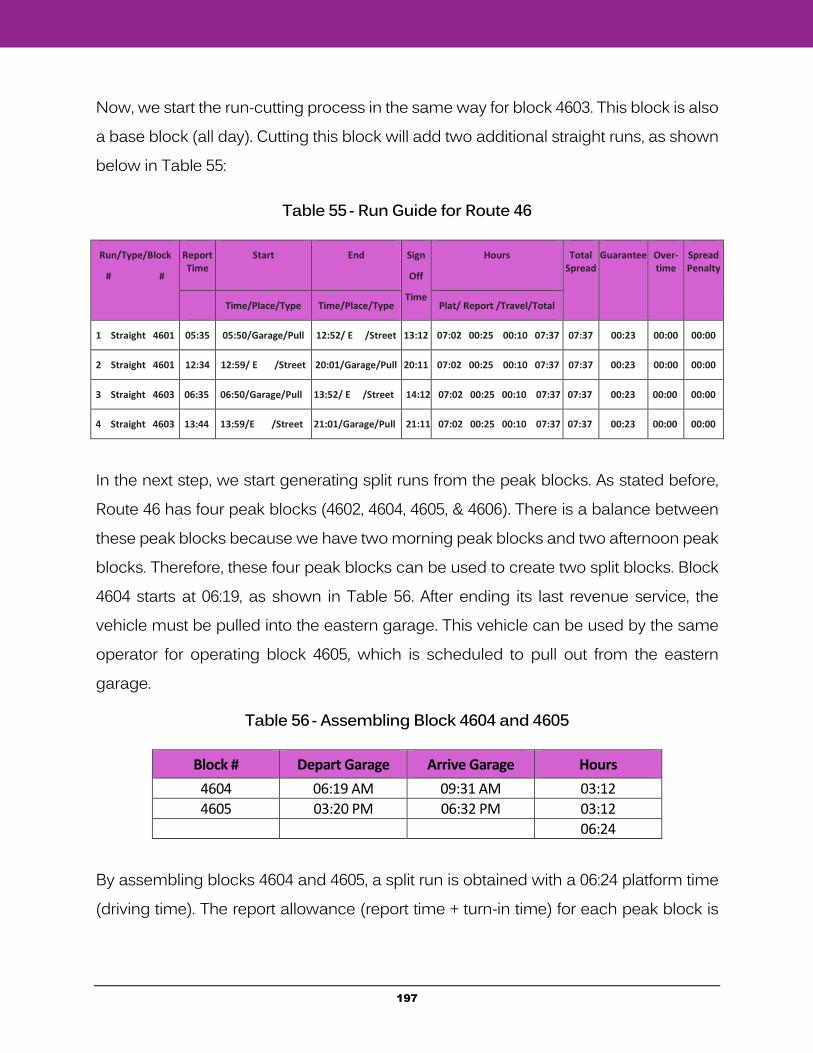
197
Now, we start the run-cutting process in the same way for block 4603. This block is also a base block (all day). Cutting this block will add two additional straight runs, as shown below in Table 55:
Table 55 - Run Guide for Route 46
Run/Type/Block
# #
Report Time
Start End Sign
Off
Time
Hours
Total Spread
Guarantee Over-time
Spread Penalty
Time/Place/Type Time/Place/Type Plat/ Report /Travel/Total
1 Straight 4601 05:35 05:50/Garage/Pull 12:52/ E /Street 13:12 07:02 00:25 00:10 07:37 07:37 00:23 00:00 00:00
2 Straight 4601 12:34 12:59/ E /Street 20:01/Garage/Pull 20:11 07:02 00:25 00:10 07:37 07:37 00:23 00:00 00:00
3 Straight 4603 06:35 06:50/Garage/Pull 13:52/ E /Street 14:12 07:02 00:25 00:10 07:37 07:37 00:23 00:00 00:00
4 Straight 4603 13:44 13:59/E /Street 21:01/Garage/Pull 21:11 07:02 00:25 00:10 07:37 07:37 00:23 00:00 00:00
In the next step, we start generating split runs from the peak blocks. As stated before, Route 46 has four peak blocks (4602, 4604, 4605, & 4606). There is a balance between these peak blocks because we have two morning peak blocks and two afternoon peak blocks. Therefore, these four peak blocks can be used to create two split blocks. Block 4604 starts at 06:19, as shown in Table 56. After ending its last revenue service, the vehicle must be pulled into the eastern garage. This vehicle can be used by the same operator for operating block 4605, which is scheduled to pull out from the eastern garage.
Table 56 - Assembling Block 4604 and 4605
Block # Depart Garage Arrive Garage Hours
4604 06:19 AM 09:31 AM 03:12
4605 03:20 PM 06:32 PM 03:12
06:24
By assembling blocks 4604 and 4605, a split run is obtained with a 06:24 platform time (driving time). The report allowance (report time + turn-in time) for each peak block is
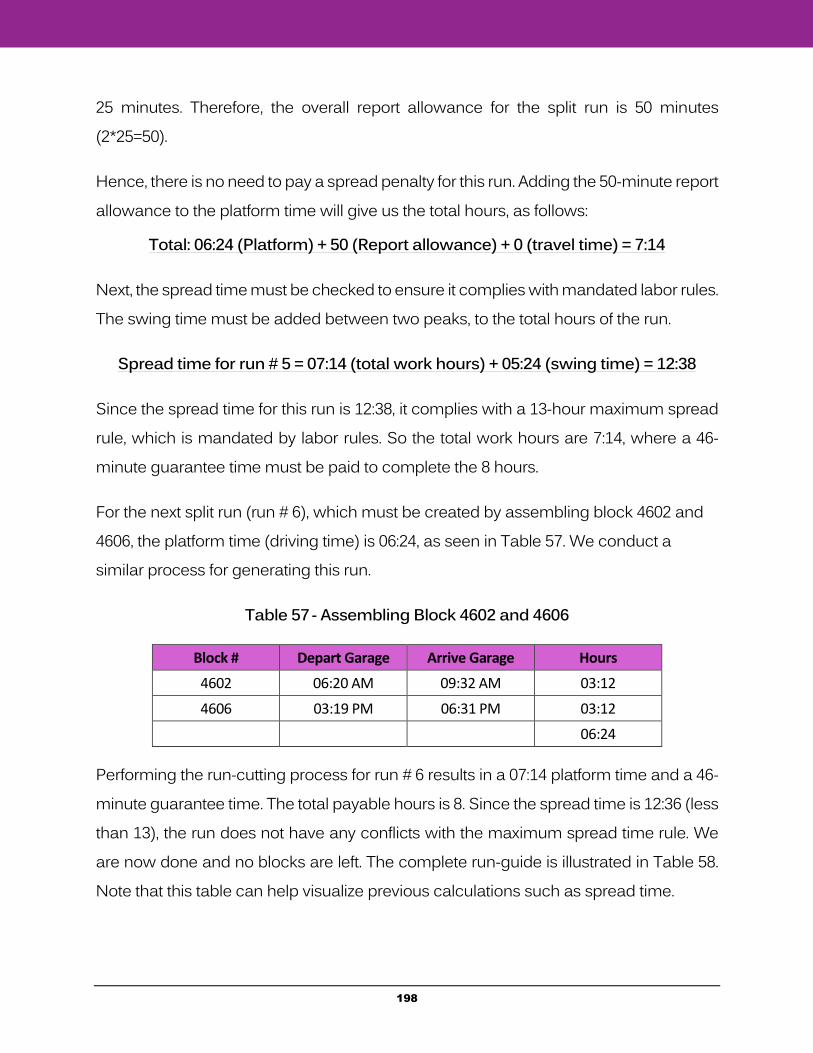
198
25 minutes. Therefore, the overall report allowance for the split run is 50 minutes (2*25=50).
Hence, there is no need to pay a spread penalty for this run. Adding the 50-minute report allowance to the platform time will give us the total hours, as follows:
Total: 06:24 (Platform) + 50 (Report allowance) + 0 (travel time) = 7:14
Next, the spread time must be checked to ensure it complies with mandated labor rules. The swing time must be added between two peaks, to the total hours of the run.
Spread time for run # 5 = 07:14 (total work hours) + 05:24 (swing time) = 12:38
Since the spread time for this run is 12:38, it complies with a 13-hour maximum spread rule, which is mandated by labor rules. So the total work hours are 7:14, where a 46-minute guarantee time must be paid to complete the 8 hours.
For the next split run (run # 6), which must be created by assembling block 4602 and 4606, the platform time (driving time) is 06:24, as seen in Table 57. We conduct a similar process for generating this run.
Table 57 - Assembling Block 4602 and 4606
Block # Depart Garage Arrive Garage Hours
4602 06:20 AM 09:32 AM 03:12
4606 03:19 PM 06:31 PM 03:12
06:24
Performing the run-cutting process for run # 6 results in a 07:14 platform time and a 46-minute guarantee time. The total payable hours is 8. Since the spread time is 12:36 (less than 13), the run does not have any conflicts with the maximum spread time rule. We are now done and no blocks are left. The complete run-guide is illustrated in Table 58. Note that this table can help visualize previous calculations such as spread time.
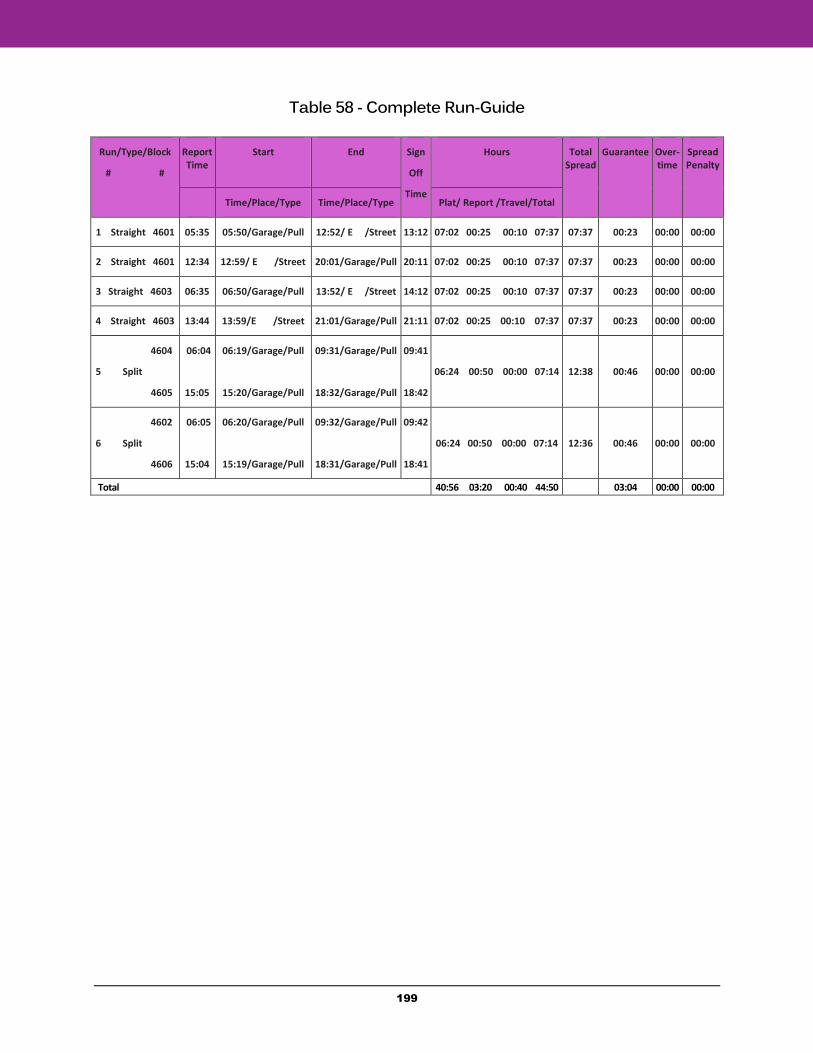
199
Table 58 - Complete Run-Guide
Run/Type/Block
# #
Report Time
Start End Sign
Off
Time
Hours
Total Spread
Guarantee Over-time
Spread Penalty
Time/Place/Type Time/Place/Type Plat/ Report /Travel/Total
1 Straight 4601 05:35 05:50/Garage/Pull 12:52/ E /Street 13:12 07:02 00:25 00:10 07:37 07:37 00:23 00:00 00:00
2 Straight 4601 12:34 12:59/ E /Street 20:01/Garage/Pull 20:11 07:02 00:25 00:10 07:37 07:37 00:23 00:00 00:00
3 Straight 4603 06:35 06:50/Garage/Pull 13:52/ E /Street 14:12 07:02 00:25 00:10 07:37 07:37 00:23 00:00 00:00
4 Straight 4603 13:44 13:59/E /Street 21:01/Garage/Pull 21:11 07:02 00:25 00:10 07:37 07:37 00:23 00:00 00:00
4604
5 Split
4605
06:04
15:05
06:19/Garage/Pull
15:20/Garage/Pull
09:31/Garage/Pull
18:32/Garage/Pull
09:41
18:42
06:24 00:50 00:00 07:14
12:38
00:46
00:00
00:00
4602
6 Split
4606
06:05
15:04
06:20/Garage/Pull
15:19/Garage/Pull
09:32/Garage/Pull
18:31/Garage/Pull
09:42
18:41
06:24 00:50 00:00 07:14
12:36
00:46
00:00
00:00
Total 40:56 03:20 00:40 44:50 03:04 00:00 00:00
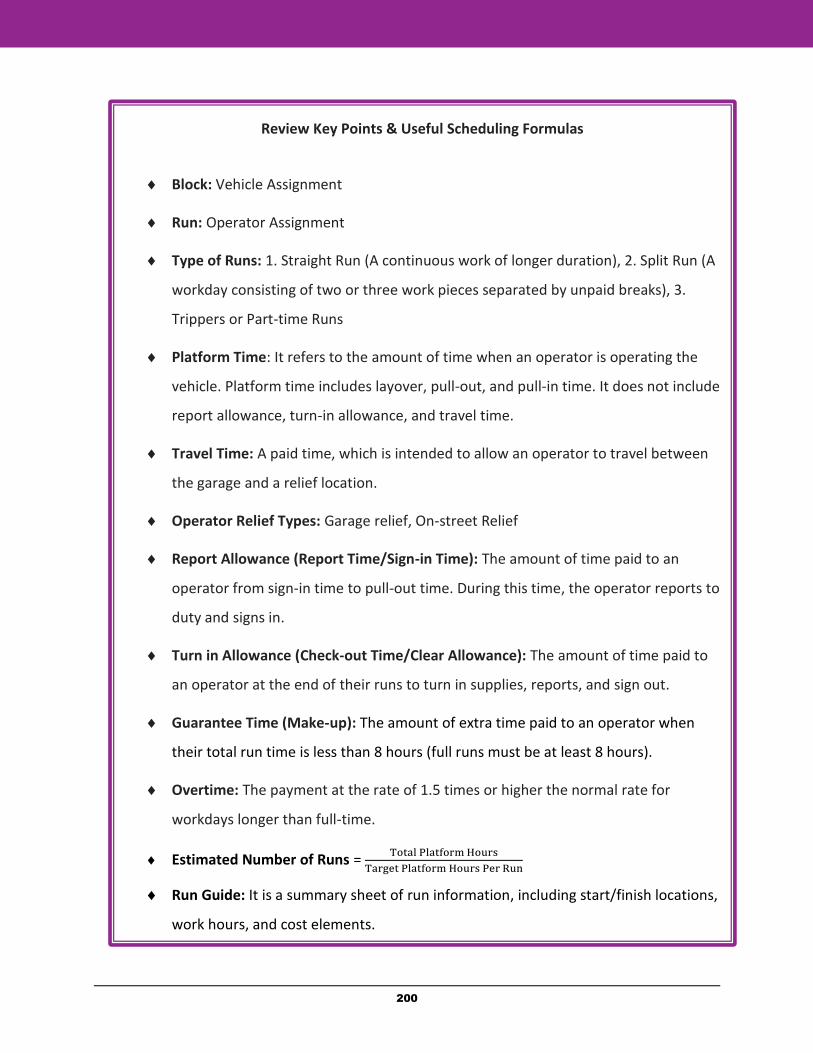
200
Review Key Points & Useful Scheduling Formulas
Block: Vehicle Assignment
Run: Operator Assignment
Type of Runs: 1. Straight Run (A continuous work of longer duration), 2. Split Run (A
workday consisting of two or three work pieces separated by unpaid breaks), 3.
Trippers or Part-time Runs
Platform Time: It refers to the amount of time when an operator is operating the
vehicle. Platform time includes layover, pull-out, and pull-in time. It does not include
report allowance, turn-in allowance, and travel time.
Travel Time: A paid time, which is intended to allow an operator to travel between
the garage and a relief location.
Operator Relief Types: Garage relief, On-street Relief
Report Allowance (Report Time/Sign-in Time): The amount of time paid to an
operator from sign-in time to pull-out time. During this time, the operator reports to
duty and signs in.
Turn in Allowance (Check-out Time/Clear Allowance): The amount of time paid to
an operator at the end of their runs to turn in supplies, reports, and sign out.
Guarantee Time (Make-up): The amount of extra time paid to an operator when
their total run time is less than 8 hours (full runs must be at least 8 hours).
Overtime: The payment at the rate of 1.5 times or higher the normal rate for
workdays longer than full-time.
Estimated Number of Runs = Total Platform Hours
Target Platform Hours Per Run
Run Guide: It is a summary sheet of run information, including start/finish locations,
work hours, and cost elements.
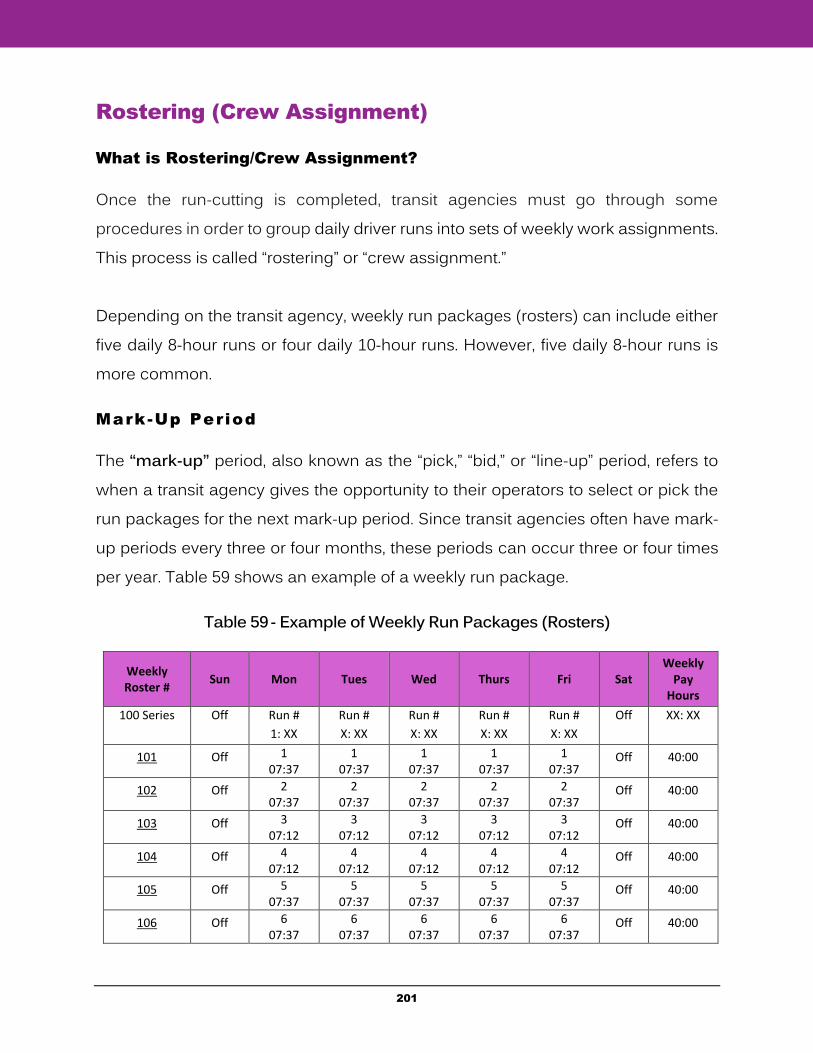
201
Rostering (Crew Assignment)
What is Rostering/Crew Assignment?
Once the run-cutting is completed, transit agencies must go through some procedures in order to group daily driver runs into sets of weekly work assignments. This process is called “rostering” or “crew assignment.” Depending on the transit agency, weekly run packages (rosters) can include either five daily 8-hour runs or four daily 10-hour runs. However, five daily 8-hour runs is more common.
Mark-Up Period
The “mark-up” period, also known as the “pick,” “bid,” or “line-up” period, refers to when a transit agency gives the opportunity to their operators to select or pick the run packages for the next mark-up period. Since transit agencies often have mark-up periods every three or four months, these periods can occur three or four times per year. Table 59 shows an example of a weekly run package.
Table 59 - Example of Weekly Run Packages (Rosters)
Weekly Roster #
Sun Mon Tues Wed Thurs Fri Sat Weekly
Pay Hours
100 Series Off Run #
1: XX
Run #
X: XX
Run #
X: XX
Run #
X: XX
Run #
X: XX
Off XX: XX
101 Off 1 07:37
1 07:37
1 07:37
1 07:37
1 07:37
Off 40:00
102 Off 2 07:37
2 07:37
2 07:37
2 07:37
2 07:37
Off 40:00
103 Off 3 07:12
3 07:12
3 07:12
3 07:12
3 07:12
Off 40:00
104 Off 4 07:12
4 07:12
4 07:12
4 07:12
4 07:12
Off 40:00
105 Off 5 07:37
5 07:37
5 07:37
5 07:37
5 07:37
Off 40:00
106 Off 6 07:37
6 07:37
6 07:37
6 07:37
6 07:37
Off 40:00
202
Rostering Types
Depending on agency policy and work regulations, different transit agencies may have different methods for rostering or grouping daily operator runs into weekly run packages. Transit agencies use the two following methods to create a roster of weekly assignments.
Operator-developed
Agency-developed
These two methods differ in terms of the development of grouping assignments.
Agency-Developed Rostering
In agency-developed rostering, drivers can only pick from a set of pre-scheduled weekly packages. In this rostering type, the agency groups all daily runs into weekly run packages before beginning the process of the operator mark-up period (also known as pick, line up, etc.)
This allows the scheduler to plan a more efficient roster versus allowing drivers to choose their own days off. From the operators’ perspective, it means that some of their convenience is sacrificed, as the rosters will be designed without each operator’s direct input on desired runs and days off. However, at many agencies, the operator’s union will review and provide input for the rostering process. In the past, many transit agencies did not use the agency-developed approach because there was no way to quickly generate a good set of rosters. With the help of computerized scheduling, it is possible to obtain an efficient set of rosters, with less interference with an agency’s preferences, including controls on the levels of overtime.
203
Operator -Developed Rostering (Cafeteria Style)
In operator-developed rostering, operators have the opportunity to pick both specific daily runs and days off from a master list, which includes all runs and available days off. Operator-developed rostering is also called “cafeteria style” because the way that drivers select their weekly assignment packages is similar to the manner that customers choose individual food items to create their own meal tray.
The selection is based on seniority, and since senior operators have the priority, agencies create a list that includes the names of all operators in seniority order and a time slot, which represents the period that they need to pick their runs. Senior drivers pick their desired daily runs, as well as their preferred days off. The remaining runs are left for drivers with lower seniority. This process continues until all runs are chosen.
In operator-developed rostering, drivers are able to create their weekly work packages, but the agency’s staff must monitor the pick process to make sure that operators select work according to seniority and all applicable rules. Such applicable rules and restrictions in the rostering process may include:
Days off must be consecutive.
Mixing straight and split run types may not be permitted until it is needed to create full weekly packages.
Mixing routes in a weekly package may not be allowed until the time that the same route is not available to cover all workdays of the week.
Taking a minimum number of off-duty hours may be mandatory between each daily run.
204
Operator-developed or cafeteria rostering is often specified in detail in labor agreements.
Comparing Costs between Rostering Methods
Using an agency-developed rostering method allows transit agencies to have more control over the rostering process. This control may lead agencies to cleverly develop cost-effective rosters. In this case, since drivers cannot directly create or group their desired weekly duties, some part of driver convenience may be sacrificed. However, at the end, there may be a lower amount of leftover runs that cannot be legally combined. Therefore, the agency-developed rostering method benefits agencies by reducing costly part-time and overtime work due to providing less leftover runs.
Before the introduction of automated scheduling, most transit agencies did not use agency-developed methods. Today, with the help of computerized scheduling technologies, agencies can effectively adapt to this method. These technologies provide different techniques that allow agencies to develop rosters that adhere to operator work rules through maximizing consecutive days off and minimizing leftover work.
Although operator-developed rostering may lead to a higher degree of inequity in the number of weekly work hours between drivers, some agencies still employ this method. There are two potential reasons. First, employing cafeteria-style picking may be required to comply with labor agreements. Second, some agencies believe that the level of operator empowerment may increase due to the opportunity that an agency provides when choosing their daily runs. These agencies claim that by implementing operator-developed rostering, their agency benefits through improved operator satisfaction. A disadvantage of the cafeteria-style roster is that it may result in work hours that cannot be considered full-time with others having too
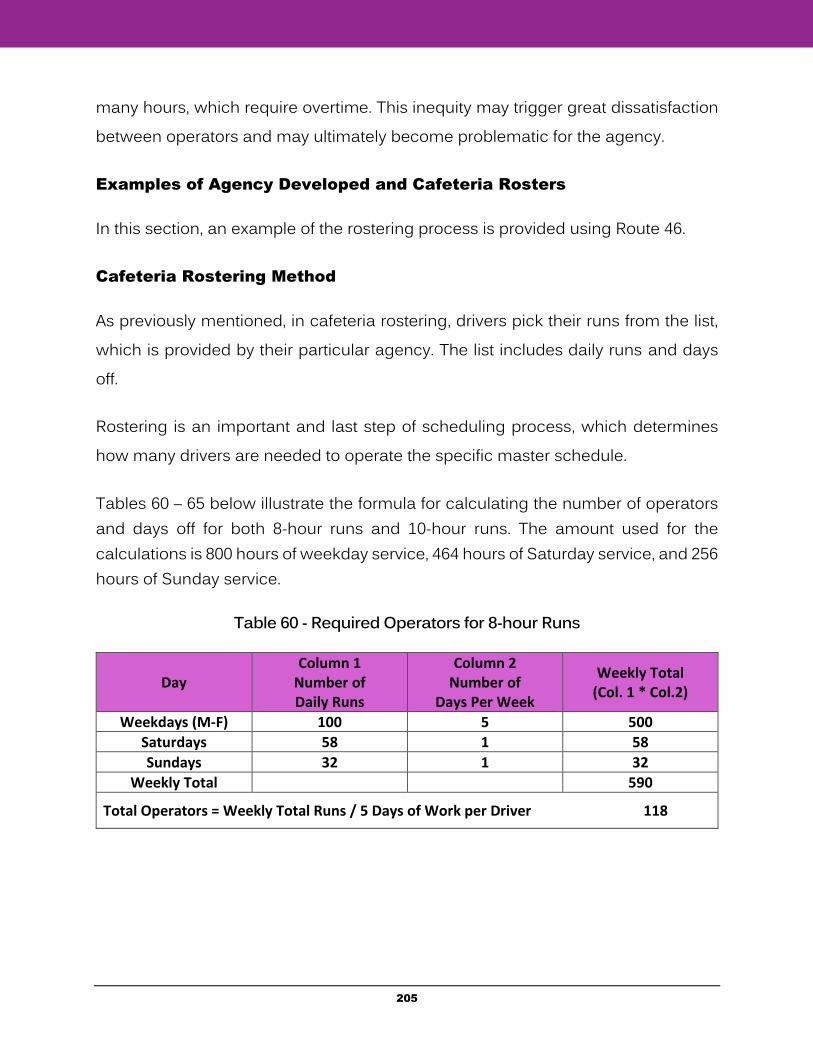
205
many hours, which require overtime. This inequity may trigger great dissatisfaction between operators and may ultimately become problematic for the agency.
Examples of Agency Developed and Cafeteria Rosters
In this section, an example of the rostering process is provided using Route 46.
Cafeteria Rostering Method
As previously mentioned, in cafeteria rostering, drivers pick their runs from the list, which is provided by their particular agency. The list includes daily runs and days off.
Rostering is an important and last step of scheduling process, which determines how many drivers are needed to operate the specific master schedule.
Tables 60 – 65 below illustrate the formula for calculating the number of operators and days off for both 8-hour runs and 10-hour runs. The amount used for the calculations is 800 hours of weekday service, 464 hours of Saturday service, and 256 hours of Sunday service.
Table 60 - Required Operators for 8-hour Runs
Day
Column 1 Number of Daily Runs
Column 2 Number of
Days Per Week
Weekly Total (Col. 1 * Col.2)
Weekdays (M-F) 100 5 500
Saturdays 58 1 58
Sundays 32 1 32
Weekly Total 590
Total Operators = Weekly Total Runs / 5 Days of Work per Driver 118
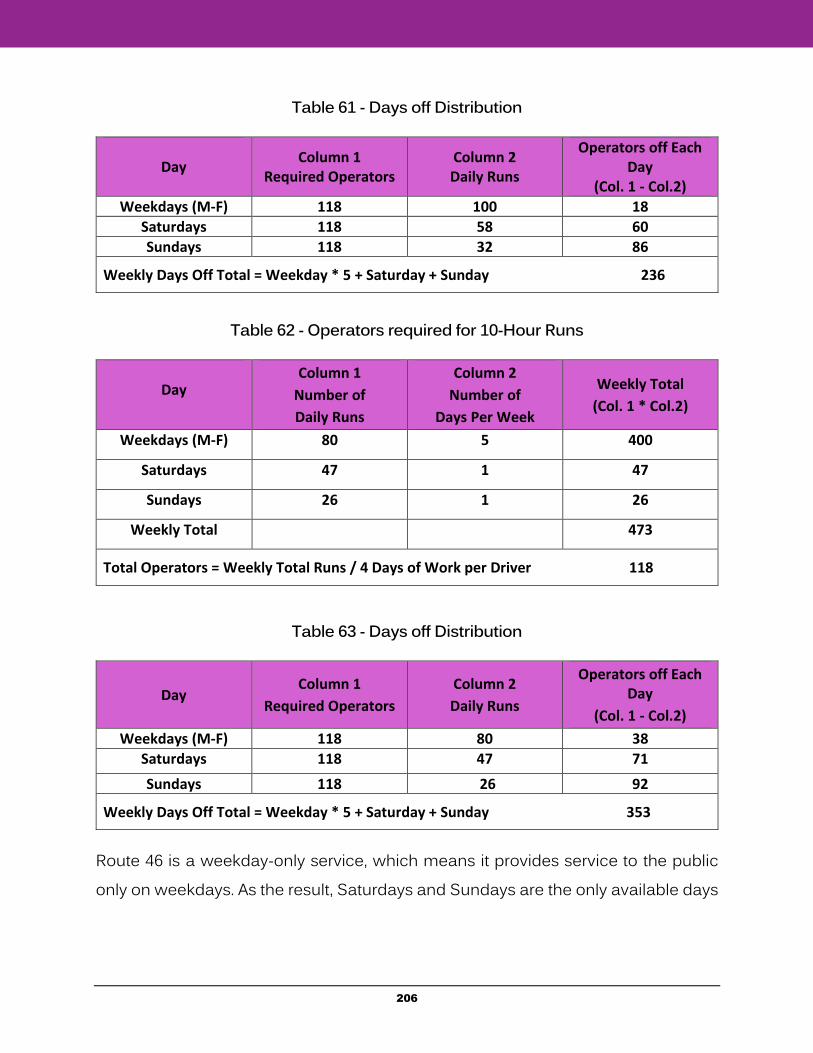
206
Table 61 - Days off Distribution
Day
Column 1 Required Operators
Column 2 Daily Runs
Operators off Each Day
(Col. 1 - Col.2)
Weekdays (M-F) 118 100 18
Saturdays 118 58 60
Sundays 118 32 86
Weekly Days Off Total = Weekday * 5 + Saturday + Sunday 236
Table 62 - Operators required for 10-Hour Runs
Day
Column 1
Number of
Daily Runs
Column 2
Number of
Days Per Week
Weekly Total
(Col. 1 * Col.2)
Weekdays (M-F) 80 5 400
Saturdays 47 1 47
Sundays 26 1 26
Weekly Total 473
Total Operators = Weekly Total Runs / 4 Days of Work per Driver 118
Table 63 - Days off Distribution
Day Column 1
Required Operators
Column 2
Daily Runs
Operators off Each Day
(Col. 1 - Col.2)
Weekdays (M-F) 118 80 38
Saturdays 118 47 71
Sundays 118 26 92
Weekly Days Off Total = Weekday * 5 + Saturday + Sunday 353
Route 46 is a weekday-only service, which means it provides service to the public only on weekdays. As the result, Saturdays and Sundays are the only available days
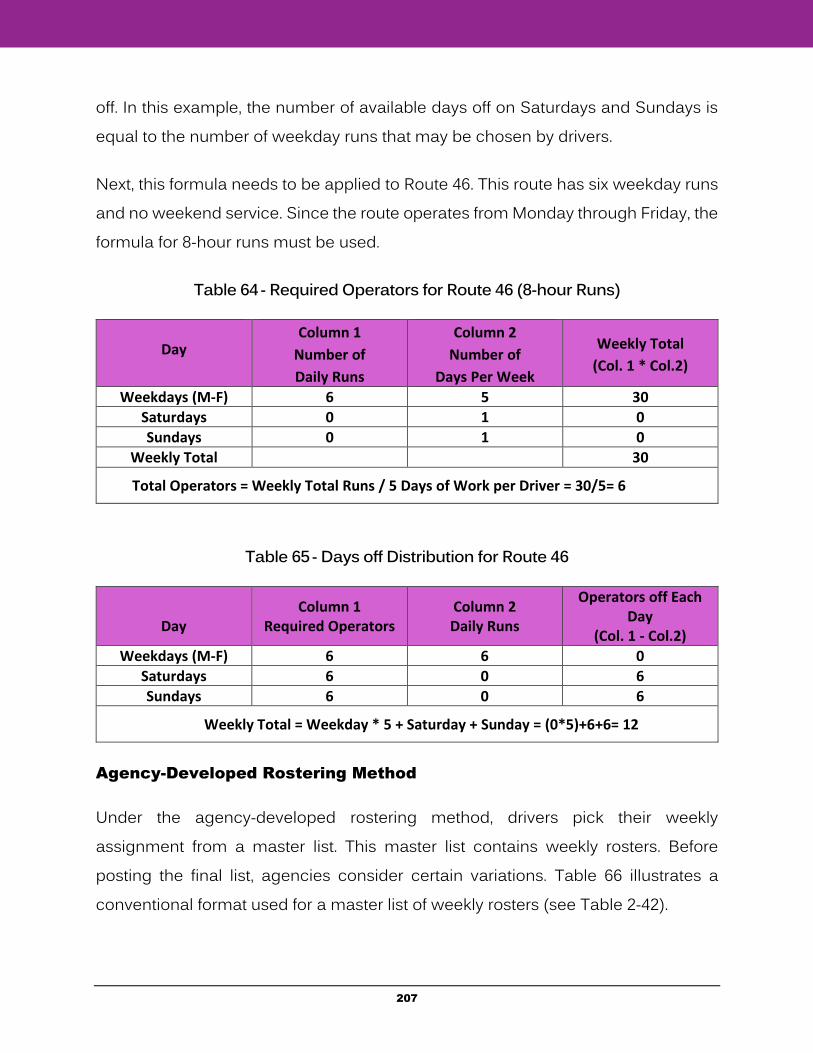
207
off. In this example, the number of available days off on Saturdays and Sundays is equal to the number of weekday runs that may be chosen by drivers.
Next, this formula needs to be applied to Route 46. This route has six weekday runs and no weekend service. Since the route operates from Monday through Friday, the formula for 8-hour runs must be used.
Table 64 - Required Operators for Route 46 (8-hour Runs)
Day
Column 1
Number of
Daily Runs
Column 2
Number of
Days Per Week
Weekly Total
(Col. 1 * Col.2)
Weekdays (M-F) 6 5 30
Saturdays 0 1 0
Sundays 0 1 0
Weekly Total 30
Total Operators = Weekly Total Runs / 5 Days of Work per Driver = 30/5= 6
Table 65 - Days off Distribution for Route 46
Day
Column 1 Required Operators
Column 2 Daily Runs
Operators off Each Day
(Col. 1 - Col.2)
Weekdays (M-F) 6 6 0
Saturdays 6 0 6
Sundays 6 0 6
Weekly Total = Weekday * 5 + Saturday + Sunday = (0*5)+6+6= 12
Agency-Developed Rostering Method
Under the agency-developed rostering method, drivers pick their weekly assignment from a master list. This master list contains weekly rosters. Before posting the final list, agencies consider certain variations. Table 66 illustrates a conventional format used for a master list of weekly rosters (see Table 2-42).
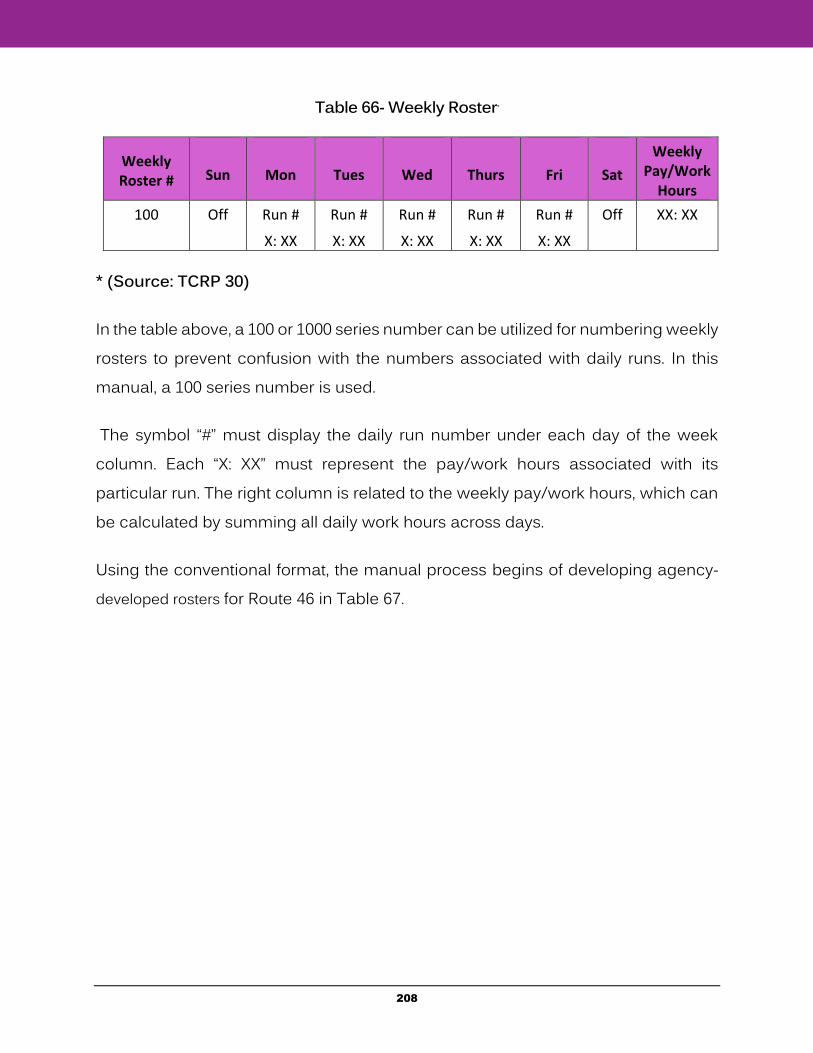
208
Table 66- Weekly Roster*
Weekly Roster #
Sun
Mon
Tues
Wed
Thurs
Fri
Sat
Weekly Pay/Work
Hours
100 Off Run #
X: XX
Run #
X: XX
Run #
X: XX
Run #
X: XX
Run #
X: XX
Off XX: XX
* (Source: TCRP 30)
In the table above, a 100 or 1000 series number can be utilized for numbering weekly rosters to prevent confusion with the numbers associated with daily runs. In this manual, a 100 series number is used.
The symbol “#” must display the daily run number under each day of the week column. Each “X: XX” must represent the pay/work hours associated with its particular run. The right column is related to the weekly pay/work hours, which can be calculated by summing all daily work hours across days.
Using the conventional format, the manual process begins of developing agency-developed rosters for Route 46 in Table 67.
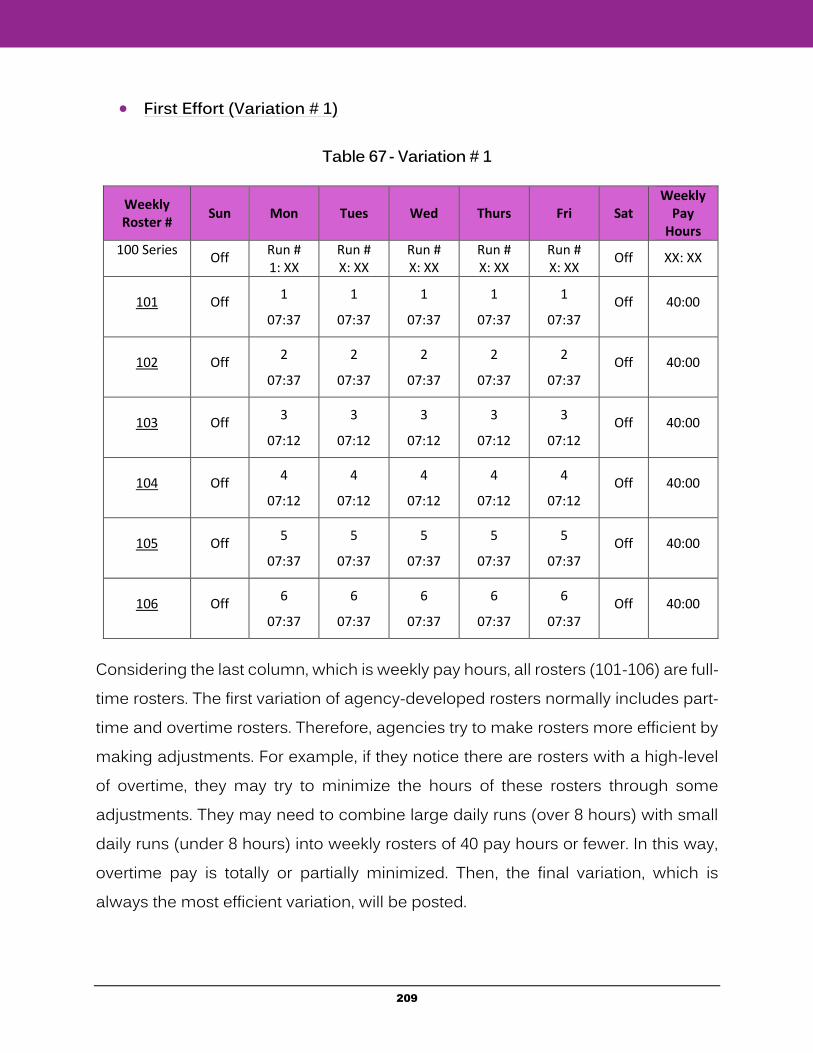
209
First Effort (Variation # 1)
Table 67 - Variation # 1
Weekly Roster #
Sun Mon Tues Wed Thurs Fri Sat Weekly
Pay Hours
100 Series Off
Run # 1: XX
Run # X: XX
Run # X: XX
Run # X: XX
Run # X: XX
Off XX: XX
101 Off 1
07:37
1
07:37
1
07:37
1
07:37
1
07:37 Off 40:00
102 Off 2
07:37
2
07:37
2
07:37
2
07:37
2
07:37 Off 40:00
103 Off 3
07:12
3
07:12
3
07:12
3
07:12
3
07:12 Off 40:00
104 Off 4
07:12
4
07:12
4
07:12
4
07:12
4
07:12 Off 40:00
105 Off 5
07:37
5
07:37
5
07:37
5
07:37
5
07:37 Off 40:00
106 Off 6
07:37
6
07:37
6
07:37
6
07:37
6
07:37 Off 40:00
Considering the last column, which is weekly pay hours, all rosters (101-106) are full-time rosters. The first variation of agency-developed rosters normally includes part-time and overtime rosters. Therefore, agencies try to make rosters more efficient by making adjustments. For example, if they notice there are rosters with a high-level of overtime, they may try to minimize the hours of these rosters through some adjustments. They may need to combine large daily runs (over 8 hours) with small daily runs (under 8 hours) into weekly rosters of 40 pay hours or fewer. In this way, overtime pay is totally or partially minimized. Then, the final variation, which is always the most efficient variation, will be posted.
210
Transit agencies deal with certain issues when it comes to solving a rostering problem. First, agencies do not like rosters with a high-level of overtime. They prefer having rosters as close as possible to 40 weekly hours. On the other hand, paying overtime sometimes results in minimizing the number of operators. Minimizing the number of operators means less operator costs, including salary, medical premium, and pension obligations for agencies. Therefore, agencies usually prefer paying some overtime in favor of minimizing the number of operators. However, there is an argument that minimizing the number of operators, which sometimes can be translated as a high-level of overtime, results in an increased number of accidents and operators’ absenteeism, due to fatigue and long working hours.
Overall, since it was not easy to manually generate efficient rosters in the past, transit agencies preferred using the cafeteria or operator-developed approach. Currently, it is feasible for transit agencies to produce efficient agency-developed rosters by using rostering software.
Extraboard Operators
While transit agencies attempt to employ sufficient regular bus operators to provide scheduled service, they also employ extraboard or back-up operators to cover work assignments that are temporarily unfilled because of vacations, illness or absences, insufficient manpower, attrition (retirements, etc.), or for work that is unassignable/open in the course of normal labor practices. The time that an operator waits at the garage to receive an assignment is called “stand-by time.” An “extraboard” bus operator is another name for a backup driver. Extraboard operations may be generally defined as the process of utilizing available manpower to perform work assignments in accordance with labor agreement provisions and work rules to ensure the provision of scheduled transit service. The challenge is to assign manpower to open scheduled work, ensuring scheduled service delivery
211
with minimum costs. Significant cost savings can result from proper extraboard management.
Four general parameters define extraboard management: available manpower, open work, labor agreement provisions, and work rules. For any given open work and given available manpower situations, there are normally several alternative decision paths. Such decisions are affected by two conditions: those established by prior actions of the transit system such as scheduling and workforce planning, and those that change daily. Both have service delivery and/or financial implications. Opportunities exist to improve the efficiency and effectiveness of extraboard management.
Part-Time Operators
Part-time or reduced-hour operators refers to drivers that are not full-time and work less than 40 hours per week. The maximum number of hours that a part-time driver can work is clearly specified in the contract. Compared to full-time operators, part-time operators often receive fewer benefits, and their salaries are paid at a lower wage rate. Besides these savings, part-time operators allow more flexibility in run-cutting and rostering, especially for agencies with a high peak to base ratio.
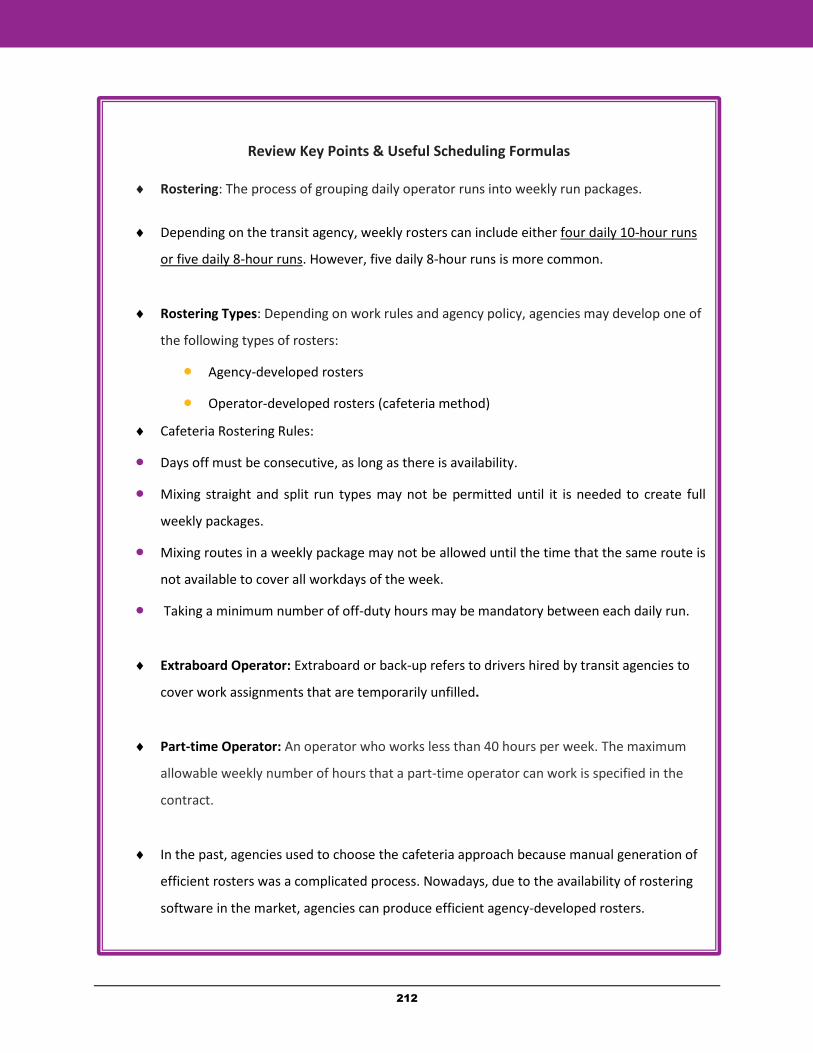
212
Review Key Points & Useful Scheduling Formulas
Rostering: The process of grouping daily operator runs into weekly run packages.
Depending on the transit agency, weekly rosters can include either four daily 10-hour runs
or five daily 8-hour runs. However, five daily 8-hour runs is more common.
Rostering Types: Depending on work rules and agency policy, agencies may develop one of
the following types of rosters:
Agency-developed rosters
Operator-developed rosters (cafeteria method)
Cafeteria Rostering Rules:
Days off must be consecutive, as long as there is availability.
Mixing straight and split run types may not be permitted until it is needed to create full
weekly packages.
Mixing routes in a weekly package may not be allowed until the time that the same route is
not available to cover all workdays of the week.
Taking a minimum number of off-duty hours may be mandatory between each daily run.
Extraboard Operator: Extraboard or back-up refers to drivers hired by transit agencies to
cover work assignments that are temporarily unfilled.
Part-time Operator: An operator who works less than 40 hours per week. The maximum
allowable weekly number of hours that a part-time operator can work is specified in the
contract.
In the past, agencies used to choose the cafeteria approach because manual generation of
efficient rosters was a complicated process. Nowadays, due to the availability of rostering
software in the market, agencies can produce efficient agency-developed rosters.
213
Other Scheduling Considerations
Automating the Picking Process
Since many union contracts state that drivers should be paid for a minimum of eight hours of work, ineffective rostering/run-cutting will result in either too much overtime or too much guaranteed time. Using an automated staff rostering to solve scheduling problems may benefit transit agencies by producing more efficient operator assignments.
Extraboard Sizing
The most important operational issue that requires transit agencies to have extraboard staffing is “open work,” as the result of the following:
Unassigned service
Operators’ absenteeism due to vacation or sickness
Equipment issues
Open work can change daily and even throughout the day, requiring transit managers to employ and maintain a certain size of extraboard operators. Determining the optimum number of required extraboard drivers is very important for the agency, especially when an extraboard driver is hired as a full-time employee (guaranteed 40 hours per week). Employing too many extraboard operators may result in paying them for doing nothing. On the other hand, using too few extraboard operators may cause overtime.
Maximizing the utilization of the hired extraboard operators through maintaining a hierarchy of duties to be performed may allow for efficient implementation of resources. For example, an extraboard operator may be utilized for replacing buses in a service and/or plug service that must be operated during service interruptions.
214
Aside from these, if extraboard operators are not needed to cover any service, then it may be possible to place them at a station equipped with a telephone to take calls from customers and provide route and schedule information.
In order to delegate open work, many transit agency practitioners determine the extraboard size based on historical trends (reviewing scheduled and unscheduled leave) and experience factors. However, some studies attempt to develop optimum extraboard sizing tools and strategies, which can help a broad base of transit agencies manage and estimate their extraboard size.
Schedule Reports
After a scheduler assembles all of the data and prepares the transit schedule, they create a series of reports for the agency. Reports are prepared by the scheduler to meet the needs of each transit agency. If needed, the scheduler updates, based on inputs, and adjusts the reports, and provides the agency with final reports. Some of the common reports include the following:
System, Division, and Individual Route Information
For each given route, the scheduler must prepare a report, which includes system, division, and route information.
Schedules for Staff and The Public
As previously mentioned, a scheduler must provide a timetable for service on a given route. Typically, a timetable lists the times when a service is scheduled to arrive at and depart from specified locations called “timepoints” or bus stations. The timetable produced by the scheduler will be used by the transit agency to inform customers about a route’s service schedule. Traditionally, agencies provided timetables in printed forms, like a leaflet or poster. At present, timetables are often available in a variety of electronic formats such as dynamic electronic displays,
215
which may be located at a central place and which list the next few departures for each line, or all departures in the next hour. Displays on platforms usually just show the next departure(s) from that platform.
In addition to the timetable, transit schedulers must prepare a schedule, which will be used by operators and supervisors. This type of schedule requires more detailed information. For example, besides timepoints, an operator’s schedule contains internal timepoints to enhance schedule adherence.
In many modern transit systems, public timetables and staff schedules are generated by computerized software. In this regard, the transit scheduler must specify the required operating span, minimum frequencies, route length/time, and other factors as inputs to the software.
Bid Package or Roster for Picking Work
The scheduling department must prepare driver rosters according to the service schedule and specific rules. A driver roster covers a combination of both work shifts and days off for a specific period. It is important that driver rosters be generated in accordance with management considerations, union work rules, and driver preferences.
Reports for Operations
The scheduling department must prepare reports for operations such as dispatch sheets, operator paddles, and bus assignments. Dispatchers are personnel responsible for receiving and transmitting reliable messages, tracking vehicles and equipment, and recording other important information. Transit bus dispatchers are obligated to coordinate transportation schedules with scheduling departments. In this regard, the scheduling department must provide dispatchers with dispatch sheets, which contain essential information that allows dispatchers to monitor the
216
schedules of their bus fleet and address any problems that arise during their operations. An operator paddle refers to a particular schedule that an individual bus or rail operator carries for their run. In addition to timepoints, an operator paddle shows the scheduled arrival/departure times for each timepoint of a particular run.
Transit Operator Payroll Information
Transit agencies generate and modify operators’ payroll sheets (posted work assignments), reconcile information, compare operators’ daily logs to work assignments, and maintain a copy of operator payroll records. It is important that transit agencies consistently supervise the payroll documents.
Transit employees use the Transportation Management Information System (TMIS) payroll system to record bus operator schedules and input hours worked. The complexity of the payroll process greatly depends on the number of employees and the variation in contract terms in the collective bargaining agreements.
Automated time-keeping systems help transit agencies reduce potential errors and adjustments. Transit agencies that have a manual payroll process may find it time-consuming due to a high volume of payroll documents and complex union contract rules. The manual payroll process includes:
Reporting and reviewing attendance records, including bus drivers’ trip sheets, time cards, time sheets, and leave forms.
Inputting payroll hours worked and leave time in the TMIS program
Validating hours
Distributing payroll checks
217
Peak and Base Vehicle Requirements
Transit schedulers determine the number of peak-hour and base-hour vehicles required to operate the service on the route. After that, based on the determined requirements, they prepare a report in order to assure the availability of vehicles, especially during peak hours with a higher frequency of service.
Route Costing
Transit agencies prepare reports containing information about costs associated with each individual route. Such reports can later be useful in the process of analyzing and determining the most cost-effective replacement schedule for the route.
218
C. Tools of the Transit Scheduler
Technology, Software, Data Sources
This section contains information related to data sources, tools, and available scheduling technologies in the market. Utilizing these tools and technologies assists schedulers in performing their work tasks more effectively. However, without qualified and skillful schedulers, even the best tools and technologies cannot help transit agencies effectively operate the scheduling process.
Computerized Scheduling Software Packages
Computerized scheduling software packages are tools that help schedulers build efficient and cost-effective schedules. Since these computerized packages are tools that only facilitate the scheduling process for schedulers, they cannot function as a solution and address all of the existing scheduling issues.
There is no way to find a substitute for the skills and knowledge of a professional scheduler. To better understand this, just imagine that a university professor gives their students Microsoft Word and expects them to write and submit well-written papers. This expectation is extremely irrational. The same idea applies to transit agencies and scheduling software. If transit agencies provide the best scheduling software packages for their schedulers, it does not necessarily mean that they can produce high-quality and seamless schedules. Therefore, besides providing computerized scheduling packages, in order to achieve high-quality schedules, agencies must assure that their schedulers possess enough proficiency and a high degree of competence to perform their tasks.
There are certain unquestionable benefits that can be obtained through employing computerized scheduling systems. These kinds of benefits include:
219
Reduction of time-consuming manual tasks
Speeding up the scheduling process
Increasing accuracy via decreasing manual data entries and calculations
Enables the scheduler to analyze the process and test other alternatives
In the past, schedulers had to go through all of the scheduling processes manually. Most of the time, they did not have enough time to analyze the process and implement “what-if” testing of other alternatives to maximize effectiveness. This is possible today with the help of computerized scheduling systems.
Major Schedul ing Software Packages Used in the Publ ic
Transit Industry
In addition to the common Microsoft Office software suite, scheduling departments at public transit agencies take advantage of several specialized software packages. The most commonly used scheduling software packages are Hastus and Trapeze FX, both of which were developed by Canadian companies. Hastus from Giro and Trapeze FX from Trapeze provide comprehensive software solutions for the transit industry. They both include sophisticated algorithms that can improve the efficiency of transit agencies. According to their websites, both companies, GIRO and Trapeze, have worldwide offices since their products are used all over the world.
Advantages and Disadvantages of Computerized
Scheduling Software
Using automated scheduling software at transit systems can yield various improvements in the scheduling process. Scheduling software is beneficial, due to the flexibility, functionality, and control that they provide for schedulers. Utilizing the software reduces mistakes, improves vehicle and operator efficiencies, reduces
220
staff time on tedious activities, and provides better reporting capabilities.
In general, costs associated with acquiring and installing scheduling software are the greatest barriers to achieving automation of the scheduling process. In addition, the capability of the scheduling and ITS staff must be taken into account. Small- to medium-sized properties typically do not have adequate resources or budgets to justify the purchase of automated scheduling software. In addition, the learning curve and extensive setup time required is a potential obstacle for small- to mid-sized systems.
Data Sources for Scheduling
Nowadays, transit operators look for new technologies with the ability to assist with the growing problem of traffic congestion and passenger demands. Since these technologies allow agencies to obtain accurate data, they can enhance the quality and reliability of their services. Automatic vehicle location (AVL) and automatic passenger counter (APC) are two available data-gathering sources. Employing AVL and APC systems makes it possible to collect an enormous quantity and variety of operational, spatial, and temporal data. If agencies effectively capture, archive, and analyze these data, they can considerably enhance transit functionality by improving management practices in different sections, including route planning, scheduling, and service performance monitoring.
Automatic Vehicle Location (AVL)
An automatic vehicle location (AVL) system is a computer-based tracking system capable of measuring the real-time location of vehicles equipped with Global Positioning Satellite (GPS) receivers. The system transfers the collected data to the transit center through cellular communications or radio. The data can be used immediately to correct scheduling or any other operational deviation. This system is mostly utilized for fleet management because it identifies the location of the vehicle for several reasons, including:
221
Improving dispatch
Operational efficiency
Faster response times to disruptions in service
AVL data can also be applied to analyze running time, schedule adherence, headway regularity, and passenger waiting time. The data can be archived and be utilized for further analysis.
Automatic Passenger Counter (APC)
Automatic passenger counter (APCs) systems count the patrons entering and exiting a transit vehicle. Before the invention of this system, transit systems needed schedule checkers that were responsible for manually collecting ridership information. APCs typically use one of two counting technologies, treadle mats or infrared beams. Other technologies include optical sensors to detect passenger boarding. Sensors and algorithms automatically provide a count of the number of passengers that board and disembark at each bus stop during a trip. The central processing unit of this system is an onboard microcomputer, which analyzes the signals received from real-time sensors and generates an electronic record at each bus stop, and then stores it in memory. Data stored in the memory include:
Vehicle location
Route Number
Date and Time
Ridership (number of passengers boarding and disembarking)
Times that doors open and close
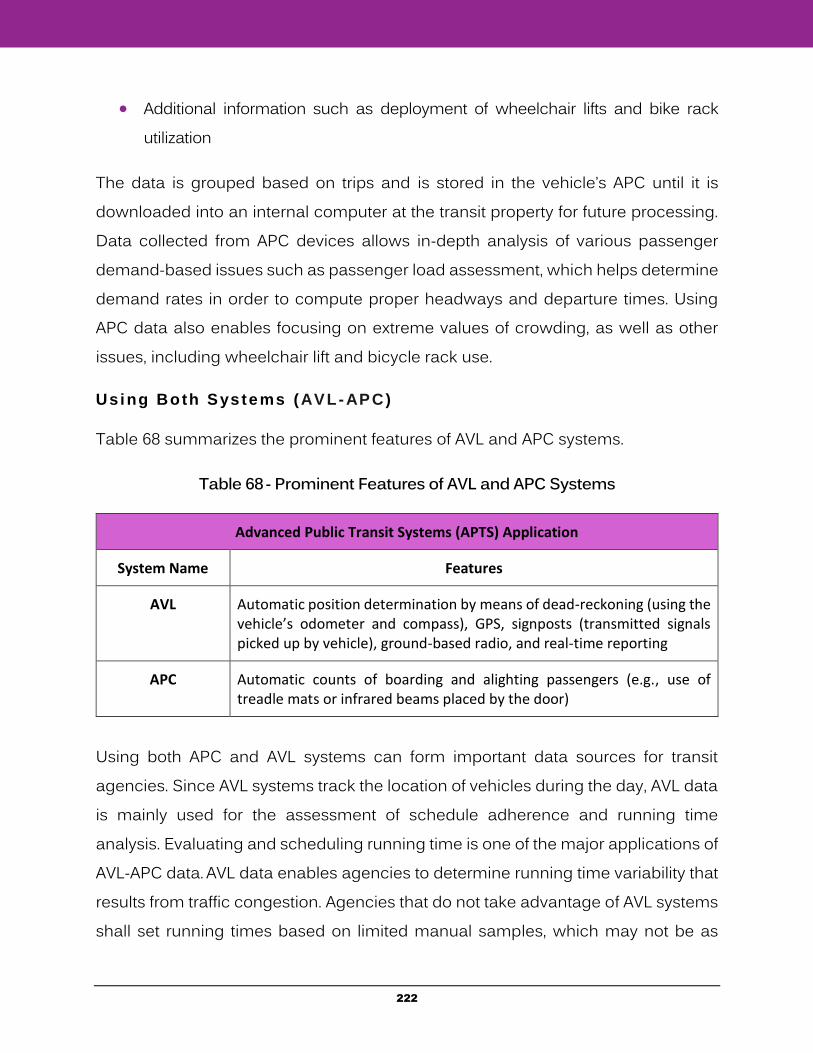
222
Additional information such as deployment of wheelchair lifts and bike rack utilization
The data is grouped based on trips and is stored in the vehicle’s APC until it is downloaded into an internal computer at the transit property for future processing. Data collected from APC devices allows in-depth analysis of various passenger demand-based issues such as passenger load assessment, which helps determine demand rates in order to compute proper headways and departure times. Using APC data also enables focusing on extreme values of crowding, as well as other issues, including wheelchair lift and bicycle rack use.
Using Both Sys tems (AVL-APC)
Table 68 summarizes the prominent features of AVL and APC systems.
Table 68 - Prominent Features of AVL and APC Systems
Advanced Public Transit Systems (APTS) Application
System Name Features
AVL Automatic position determination by means of dead-reckoning (using the vehicle’s odometer and compass), GPS, signposts (transmitted signals picked up by vehicle), ground-based radio, and real-time reporting
APC Automatic counts of boarding and alighting passengers (e.g., use of treadle mats or infrared beams placed by the door)
Using both APC and AVL systems can form important data sources for transit agencies. Since AVL systems track the location of vehicles during the day, AVL data is mainly used for the assessment of schedule adherence and running time analysis. Evaluating and scheduling running time is one of the major applications of AVL-APC data. AVL data enables agencies to determine running time variability that results from traffic congestion. Agencies that do not take advantage of AVL systems shall set running times based on limited manual samples, which may not be as
223
accurate as AVL systems and cannot account for the variability of running time.
Using APC systems along with AVL offers data validation and reporting capabilities that can improve the reliability and efficiency of AVL data. Analyzing archived AVL-APC data allows transit agencies to find hidden trends that may assist in clarifying the reason behind the irregularities of transit operations. An example of operational irregularities is an irregular headway, which can initiate patrons’ complaints and discouragement. Identifying the reasons through AVL-APC systems offers new solutions to eliminate or minimize the irregularities. Automated data collection systems can only assist schedulers with what is occurring on the street but cannot determine the reason(s). Therefore, schedulers may still need to obtain observations from fieldwork and operations staff for further clarification.
Operator Input
Operator interviews are useful for acquiring information needed for schedule adjustments. However, this method may sometimes not be a precise manner of gaining exact and accurate quantitative data. Transit operators who are familiar with a particular route are important sources of information. Conducting interviews with experienced transit operators will result in obtaining essential information, such as critical safety issues, places where extended dwell requirements are called for, and passenger crowding locations.
224
D. Ideas for Transit Efficiency
Improving Transit through Efficient Scheduling
Union Work Rules
Collective bargaining agreements include many provisions and work rules, which can limit the scheduling process. Work rules negotiated with a union more or less dictate everything, such as the way that operator assignments are made, complaints must be handled, and paychecks distributed. For operators, strict and inflexible union rules offer stable work assignments. However, for transit managers, these rules can create limitations in running the transit system in an efficient, flexible, and cost-effective manner.
The following topics present several areas that should be considered to help transit agencies enhance their efficiency.
Four-Day Work Week
Some transit agencies have found that a combination of five-day and four-day work weeks in the roster can improve overall efficiency. Four-day 10-hour shifts can decrease non-productive time such as report, deadhead, and guarantee. Larger transit agencies are more likely to see cost savings with a four-day week, as there are more runs to develop efficient run cuts. With operators driving 10 hours a day, transit agencies must be cognizant of possible safety issues due to fatigue.
If union rules are more flexible in authorizing agencies to generate operator assignments for both four 10-hour shifts per week and five 8-hour shifts per week, transit productivity could increase.
225
Hiring Part-Timers
Due to the increased passenger demand, extra buses are normally scheduled to operate during the peak hours of the morning and afternoon. These extra buses can operate revenue service during peak hours for more than two or three hours at a time. For transit agencies without part-time operators, regular full-time operators must drive these runs. These runs are often paired up with another run to form a split shift, or operators drive them in addition to their regular shift, resulting in overtime pay. Transit agencies can save money and avoid incurring the high costs of overtime by hiring part-time drivers to operate these runs and pay them for actual time worked. In addition, part-time operators are frequently paid at a lower hourly rate and have fewer benefits than full-time operators.
Bus operator unions, in general, oppose the hiring of part-time operators, as it can reduce overtime for full-time operators. However, for an agency, part-time operators are usually a major issue at the bargaining table as management attempts to get a higher percentage of part-timers.
Not Mandating a Minimum Percentage for Straight Runs
Most union contracts specify that a minimum percentage of all runs should be straight. Therefore, considering that sometimes bus schedules cannot be generated for straight runs, complying with this mandatory minimum percentage may force transit schedulers to create straight runs that cause excessive overtime and penalty time. For that reason, transit efficiency can be increased if union contracts negotiate with transit agencies to generate a certain minimum percentage of straight runs.
On-Time Performance
On-time performance is a measure of how well buses adhere to schedules. Keeping the buses running on time is also one of the main goals for transit agencies. However, due to the existence of potential obstacles or road conditions that affect
226
on-time performance, the arrival or departure of late buses or occasional early buses is almost inevitable. The following issues are some of the potential factors that may trigger regular or occasional delays.
Accident: Accidents may slow or even temporarily shut down the traffic flow and cause considerable service delay.
Breakdown: It is important that agencies consider having replacement vehicles available in case of unexpected breakdowns.
Bus Bunching: One of the primary challenges for the urban bus is maintaining constant headways between successive buses. Even a short delay may cause the buses to bunch together after a while. In such cases, while one bus may have a high level of passenger demand, one or more of the subsequent buses may pass the already cleared stops. Therefore, while one bus is full of passengers, the subsequent buses may jump ahead of their scheduled time and run nearly empty. Bus bunching may disrupt the spacing of buses on the schedule and trigger long waiting times for passengers. Many transit agencies attempt to use new technologies and tools to reduce both bus bunching and long waiting times between buses. One of the new technologies is the Bus Transit Management System. It allows for real-time monitoring of transit vehicles and enhances communication between operators and the transit control center. The system enables the control center to steer operators, help spread transit vehicles along routes, and help operators stay on schedule.
Construction/Detours: Operators facing construction work and temporary detours on bus routes usually need additional running time not originally provided in the schedule.
Communication Problems: Transit control centers should be able to inform drivers in case of major accidents or detours on the route. Operators also may
227
need to reach the control center or dispatch to obtain directions or report problems such as breakdowns. These can only be accomplished through having a proper communication system. Effective communication to drivers will minimize delays by allowing advanced time to plan.
Late Pull-Out: Sometimes bus operators cause service delays as the result of a late pull-out from the garage or depot. Transit agencies needs to have strict policies and mechanisms in place for preventing this type of issue.
Passenger load/unload time: Since dwell time usually takes a large part of bus travel time, a large variability in dwell time makes it difficult to predict the accurate arrival and travel times. During special events (movie, church, concert, school dismissals, or other events), the bus service may experience higher ridership levels than usual. Therefore, the duration of dwell time increases and the bus requires longer passenger boarding/alighting time.
Traffic Condition: The road traffic conditions can impact actual bus arrival and departure times. High traffic volume on a particular road may cause a service delay by reducing the operator’s ability to stay on schedule. Roads without obstruction may cause services to arrive on time or even earlier than the time specified on the schedule. Traffic conditions usually vary depending on the time of the day or other factors, including road construction, detours, and special events.
Impractical scheduling: In an effort to reduce costs, transit agencies may try to maximize their services by shortening travel time and layover time. This practice may result in creating unrealistic schedules and consequently, serious service delays on a regular basis. This situation may also trigger passenger complaints.
228
Weather Condition: Because of severe weather conditions, operators and other drivers may take precautionary measures into consideration since the traffic may move slower than normal, resulting in service delays.
Improving On-Time Performance
An important performance measure for transit agencies is "on-time performance." This measure represents the percentage of buses that arrive or depart on time, according to the published schedule. In general, on-time performance standards for U.S. transit systems range from 75% to 95%. Aside from the manual collection of random timepoint samples, most large transit systems use AVL or APC data to determine on-time performance.
Monitoring on-time performance allows a transit system to discover whether or not the service they provide is reliable. If the performance is relatively unreliable (e.g., below 70% on-time), the transit system needs to identify trends and detect problems with individual routes, trips, operators, etc. to identify potential solutions, which may require more resources or oversight.
Identifying and improving bus routes that are performing poorly may enable transit agencies to provide better service to their riders. More reliable and faster service can usually help improve a transit system’s bottom line and increase ridership. Passengers appreciate a system that keeps the buses running on time, as it reduces the stress and uncertainty of arriving at their destination on time. Following are some actions that transit agencies can take to improve bus speeds and the reliability of their services.
Solutions to Improve On-time Performance
Adjusting Schedules
Adjusting schedules improves schedule adherence, which greatly impacts on-time performance. By modifying a schedule’s running time, layover-recovery times can
229
help enhance schedule adherence, improve service reliability, and reduce the number of vehicles running early.
Transit agencies usually attempt to enhance the schedule adherence by schedule padding. To accomplish this, the agency adds time to the running time to make it longer. However, to avoid producing extra costs for the system or prevent decreasing the number of trips, they often provide this additional time by cutting operators’ layover time. Since layover time and recovery time are usually combined, this practice reduces the operators’ recovery ability in the case of unexpected incidents.
Another strategy is to create “tight” schedules with a slightly reduced running time. This will prevent buses from arriving or departing early and ensure buses arrive on time or slightly late. If needed, additional time can be added to the layover and recovery time.
Proper Maintenance
Implementing vehicle maintenance standards and preventive maintenance significantly impacts operational costs, safety, and reliability. The average number of miles per breakdown (Transit Revenue Miles Between Failures) is used as an indicator of maintenance standards. Employing proper preventive maintenance programs helps prevent premature equipment failures and enhances service regularity and equipment availability. A preventive maintenance program includes replacing vehicle parts before they fail, checking fluid levels, making required adjustments, and tightening loose fastenings. Overall, a preventive maintenance strategy is more effective and less expensive than a reactive basis maintenance strategy. In general, maintenance departments need to perform quality repairs to prevent repeated breakdowns and costs.
230
Vehicle Changes
Some vehicle changes may improve on-time performance by smoothing the process; utilizing smaller buses may help operators maneuver more easily in traffic, and using ramps can speed up the loading of wheelchairs and bicycles. It has also been proved that utilizing low-floor buses can reduce the passenger loading and alighting times.
Consolidate Stops
Consolidating bus stops refers to the process of evaluating bus stop patterns along a bus route, identifying the infrequently used stops that could be removed or combined, and creating a new optimal bus stop pattern. Transit agencies use various bus stop consolidation solutions, including focusing on pilot corridors and gradually phasing the changes. Some agencies try to move bus stops to the far side of intersections to prevent problems at stoplights. Some may also adopt physical changes, such as longer bus stops or bulb-outs to accelerate passenger boarding and increase convenience. Implementing proper bus stop consolidation allows accelerating bus services and maximizing the operating efficiency and ridership on routes.
Fare Policy
Changing the fare payment methods can assist in improving on-time performance. Possible solutions in this regard can include collecting fares before passenger boarding, or allowing passengers to board at both vehicle doors.
Computer-Aided Dispatch and AVL System
Transit dispatch serves as the control center of operations to ensure the availability of a daily consistent traffic service on the route. Dispatchers are the primary source of directions for bus drivers. Transit dispatchers are responsible for the availability
231
of adequate labor and equipment to operate the scheduled service. Using new technologies such as the computer-aided dispatch (CAD) system and Automatic Vehicle Location (AVL) significantly impacts the efficiency of dispatching. GPS tracking techniques allow for real-time tracking and immediate service adjustments. Therefore, dispatchers can monitor schedule adherence based on real-time bus location.
Using a bus AVL system improves situational awareness, and provides additional voice communications management capability for dispatchers. AVL systems also improve the security via covert alarm monitoring that supports the ability for drivers to immediately inform a control center in case of an onboard emergency. In these situations, AVL enables dispatchers to know the exact vehicle location. In addition, AVL systems benefit transit systems by transferring schedule adherence feedback to dispatch, operators, and supervisors in order to enhance on-time performance and reliability of the service. It allows dispatchers and supervisors to proactively address the operational issues.
Signal Timing
Synchronizing stoplights along transit routes enhances on-time performance by allowing more green lights than red, resulting in more continuous traffic flows and less stops.
Driver Counseling and Reward
Bus operators that operate a service schedule that does not provide adequate running time may not have enough control over schedule adherence issues. However, if the bus operator intentionally disregards the schedule adherence, then they should be counseled on the importance of keeping buses running on time. On the other hand, operators that constantly maintain their schedule should be rewarded. Some transit operators have mechanisms in place that either reward
232
operators monetarily, give them a symbolic recognition, or both. This type of effort gives incentives to operators to adhere to the schedule, which can also benefit the riding public.
Express Lane Service
Using express lane services on freeways has a great impact on speeding up transit vehicles, making transit more competitive than the automobile.
Streamlining Bus Routes
Streamlining bus routes increases efficiency by providing faster travel trips and accelerating the service. Straightening routes, trimming deviations, eliminating duplication, and shortening routes are possible solutions to achieving streamlined bus routes.
Transit Signal Priority
Bus priority, which is known as transit signal priority (TSP), refers to various techniques that can be utilized by agencies to improve service and reduce delays for mass transit vehicles at intersections controlled by traffic signals. TSP techniques are mostly associated with buses, but can also be used with the streetcar, tram, or light rail lines that conflict with general traffic. Agencies that take advantage of signal priority can change stoplights for approaching buses. As a result of TSP, a moderate increase in bus speeds is expected.
According to the Federal Department of Transportation, utilizing TSP improvements reduces travel times, improves schedule adherence, and increases transit efficiency.
In general, transit signal priority techniques can be divided as "active" or "passive." Passive techniques are used to optimize signal timing or coordinate successive signals to generate a green wave for traffic along the service route. Implementing
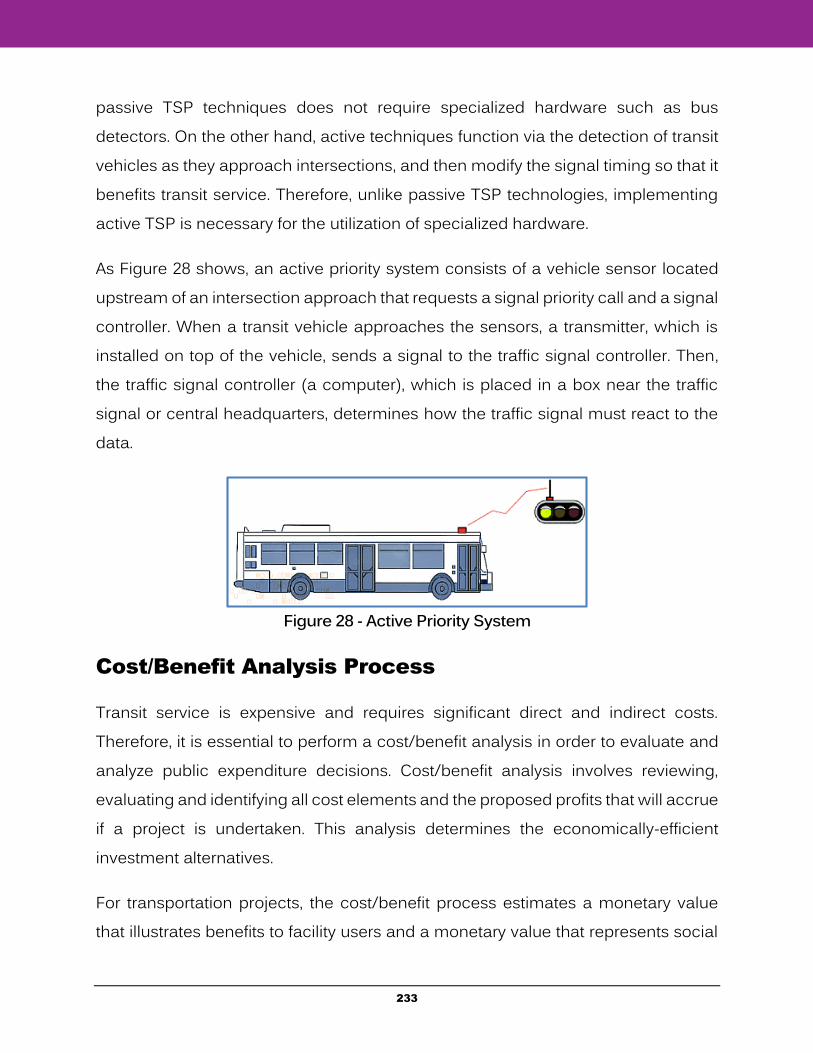
233
passive TSP techniques does not require specialized hardware such as bus detectors. On the other hand, active techniques function via the detection of transit vehicles as they approach intersections, and then modify the signal timing so that it benefits transit service. Therefore, unlike passive TSP technologies, implementing active TSP is necessary for the utilization of specialized hardware.
As Figure 28 shows, an active priority system consists of a vehicle sensor located upstream of an intersection approach that requests a signal priority call and a signal controller. When a transit vehicle approaches the sensors, a transmitter, which is installed on top of the vehicle, sends a signal to the traffic signal controller. Then, the traffic signal controller (a computer), which is placed in a box near the traffic signal or central headquarters, determines how the traffic signal must react to the data.
Figure 28 - Active Priority System
Cost/Benefit Analysis Process
Transit service is expensive and requires significant direct and indirect costs. Therefore, it is essential to perform a cost/benefit analysis in order to evaluate and analyze public expenditure decisions. Cost/benefit analysis involves reviewing, evaluating and identifying all cost elements and the proposed profits that will accrue if a project is undertaken. This analysis determines the economically-efficient investment alternatives.
For transportation projects, the cost/benefit process estimates a monetary value that illustrates benefits to facility users and a monetary value that represents social
234
benefits. To develop a comprehensive evaluation framework for a cost/benefit analysis, it is important to consider estimating different kinds of impacts (benefits and costs) including benefits, a project’s capital and costs (including facility costs), operational costs, maintenance costs, and various external costs such as risk of accident. At the end, total costs should be deducted from the total benefits to retrieve the net profit.
Route Design Considerations
Proper route design is the key to success for a given bus line, and it can significantly impact the efficiency of the schedule. To improve transit efficiency, bus routes must be designed to maximize the in-service time and minimize the out-of-service time. The length of the route and the time that it takes for a transit vehicle to fulfill each trip impacts the duration of the required layover, as well as the number of buses needed to provide the service.
Before starting a new route’s design, a transit planner needs to have a complete understanding of the current route structure and demographic data of the service area. Demographic data ensures that there is adequate population density to support the new service. Transit agencies often have service standards that mandate that a percentage of the service area’s population and employment be within a certain distance from the closest bus stop.
After identifying an area that requires a new bus line, it is time to consider the location of terminals. As previously mentioned, bus terminals are points where a bus route starts or ends. Since passenger boarding and alighting occurs at terminals, significant trip generator locations such as hospitals, shopping malls, downtown areas, transfer centers, and universities may be considered terminal locations.
Generating shorter routes as much as possible improves adherence to the schedule. Creating deviations to serve notable trip generator locations is fine as long
235
as the deviation’s ridership percentage of the overall ridership is greater than the percentage of the additional required running time to serve the deviation of the total running time.
Preferably, selecting streets with traffic calming strategies such as speed bumps should be avoided, unless after performing an evaluation, the transit planner finds no other option.
236
E. Rail Scheduling
Differences between Rail and Bus Scheduling
In this section, the basic concepts of rail scheduling are examined. Rail scheduling differs from bus scheduling in a variety of ways. Unlike buses, trams or light rail, rapid transit systems operate on an exclusive right-of-way, which is usually grade-separated in tunnels or elevated railways.
In general, rail scheduling is not as volatile as bus scheduling. There is a fixed guideway, which determines the way that the route should be operated. The guideway must be followed from the yard, which is equivalent to a “garage” in bus scheduling, to the beginning of the route.
Unlike bus scheduling, there are variations within rail scheduling because there are various types of rail operating systems. Following are descriptions of types of train rail modes.
Streetcars: Transit vehicles in revenue service that operate on rails and commonly travel in mixed traffic along roadways.
Light Rail Transit (LRT): Light rail is typically an urban form of public transport powered by overhead electrical wires. LRT operates mainly on fixed rails on rights-of-way that are often separated from other traffic. Light rail has a lighter frame compared to a traditional train. Due to its lighter size and turning radius, light rail has the ability to operate along city streets and urban corridors.
Heavy Rail: An electric railway with the capacity to handle a heavy volume of traffic. The term is often used to distinguish it from light rail systems, which usually handle a smaller volume of passengers. Heavy rail, also called the metro or subway, runs on an exclusive right-of-way. And like LRT, heavy rail systems have underground or elevated sections.
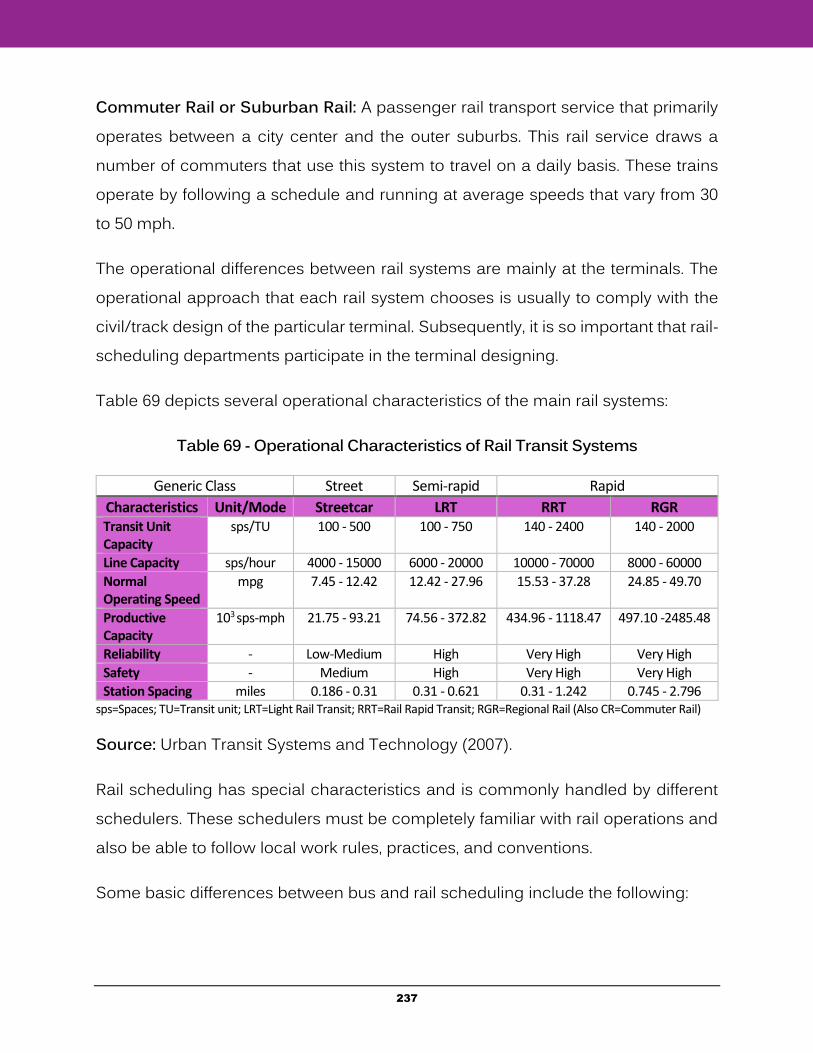
237
Commuter Rail or Suburban Rail: A passenger rail transport service that primarily operates between a city center and the outer suburbs. This rail service draws a number of commuters that use this system to travel on a daily basis. These trains operate by following a schedule and running at average speeds that vary from 30 to 50 mph.
The operational differences between rail systems are mainly at the terminals. The operational approach that each rail system chooses is usually to comply with the civil/track design of the particular terminal. Subsequently, it is so important that rail-scheduling departments participate in the terminal designing.
Table 69 depicts several operational characteristics of the main rail systems:
Table 69 - Operational Characteristics of Rail Transit Systems
Generic Class Street Semi-rapid Rapid
Characteristics Unit/Mode Streetcar LRT RRT RGR Transit Unit Capacity
sps/TU 100 - 500 100 - 750 140 - 2400 140 - 2000
Line Capacity sps/hour 4000 - 15000 6000 - 20000 10000 - 70000 8000 - 60000
Normal Operating Speed
mpg 7.45 - 12.42 12.42 - 27.96 15.53 - 37.28 24.85 - 49.70
Productive Capacity
103 sps-mph 21.75 - 93.21 74.56 - 372.82 434.96 - 1118.47 497.10 -2485.48
Reliability - Low-Medium High Very High Very High
Safety - Medium High Very High Very High
Station Spacing miles 0.186 - 0.31 0.31 - 0.621 0.31 - 1.242 0.745 - 2.796 sps=Spaces; TU=Transit unit; LRT=Light Rail Transit; RRT=Rail Rapid Transit; RGR=Regional Rail (Also CR=Commuter Rail)
Source: Urban Transit Systems and Technology (2007).
Rail scheduling has special characteristics and is commonly handled by different schedulers. These schedulers must be completely familiar with rail operations and also be able to follow local work rules, practices, and conventions.
Some basic differences between bus and rail scheduling include the following:
238
All heavy rail and most light rail require scheduling trains. “Train” refers to a connected series of rail cars that move along the track. The number of cars in a train is called a “consist.” Most rail systems possess more than one car. Some light rail and heavy rail systems add and cut the cars of the train as the day progresses, depending on the situation and passenger demand.
In general, since in rail scheduling each station has a timepoint, rail schedules have more timepoints, compared to bus schedules.
Unlike bus scheduling, rail scheduling is less likely to have running time changes. Normally, most of the running times do not vary throughout the day. In some situations, the rail system may have single-track operation with passing sidings to provide a regular interval between meets, and it is extremely important to maintain a constant running time throughout the day.
Rail schedulers usually prepare work assignments for rail yard staff that move trains for maintenance and switch cars for longer or shorter trains.
Unlike bus scheduling, pull-outs and pull-ins shall be scheduled into the timetable that is used by the public.
In terms of maintenance location, unlike buses that should be assigned to a specific garage for maintenance, railways have line-based maintenance. In rail systems, it is the responsibility of maintenance departments to determine the locations and times of maintenance.
Rail systems, especially systems with a longer rail length, may have two yards, one at the each end of the rail route. Therefore, considering that they have line-based maintenance, it is possible to cut down and save time and mileage by assigning pull-ins and pull-outs to the nearest yard.
239
Rail systems utilize drop-backs or fallbacks, which refers to the time when the train operator (crew/conductor) disembarks from the train, takes a layover, and then is ready to operate the next arriving train. Using drop-backs is most common with short headways when there is not enough time for the train operator to take their layover and continue operating the same train. In some cases, even double drop-backs may be scheduled if frequent service is needed, and then the number of trains in service must be maximized.
Rail systems with double tracks often have track maintenance on weekends and evenings, which require single tracking. Rail schedulers develop special schedules for these situations. In some systems, a rail scheduler is assigned full-time to prepare these special schedulers, as track maintenance is ongoing.
Cost Differences (Between Bus and Light Rail)
Capital Costs: In terms of capital costs, light rail systems cost more than bus systems. This is due to its requirement for tracks, electric catenary, electrical substations, and other infrastructure that buses do not need. Furthermore, light rail lines require their own yards, while bus transit systems store and maintain their vehicles at garages or depots.
Operating Costs: In terms of operating costs, some believe that operating a bus system can be more expensive compared to light rail. The logic behind this belief is that the capacity of buses is less than light rail trains. Therefore, for the same number of passengers on light rail trains, a greater number of operating buses are needed.
However, it should also be considered that operating a light rail train can be more costly than operating a bus. Consequently, only in circumstances where there is enough passenger demand, which requires more frequent operation of buses, replacing the bus transit system with a light rail system would result in a reduction in operating costs. Otherwise, it cannot be justified that a transit system construct and operate a light rail system if not supported by an adequate ridership demand.
240
Nevertheless, aside from demand, there are other considerations in the selection of the appropriate mode. Each mode has its own characteristics and purpose.
Track Structure, Merging, and Diverging of Lines
The structure of a track contains rails, fasteners, railroad, ballast, and the underlying subgrade. The track guides the conical, flanged wheels, which support a single, or multi-consist on the track. As a result, the need for active steering is eliminated.
Tracks are made of two parallel steel rails, anchored perpendicular to members called ties or sleepers that can be made of timber, concrete, steel, or plastic to maintain a consistent distance apart, or rail gauge. Rail gauge has different categories, such as standard gauge and narrow gauge. To prevent potential incidents and meet safety requirements, tracks must be laid to conform to a loading gauge, which restricts the maximum height and width for railroad vehicles and their particular loads.
There are different configurations of tracks, such as “double track” and “crossover.” Double track, as is obvious from its name, includes two adjacent tracks on the rail bed. Unlike a single-track railway, where trains in both directions share the same track, a double-track railway usually involves running one track in each direction. Therefore, double tracks are bi-directional, especially older ones that use each track exclusively in one direction. This bi-directional feature allows for the flow of operating trains in opposite directions without any obstructions. Double track, as the most common and simplest layout of railways, simplifies the signaling systems, which are used to safely direct railway traffic to prevent trains from colliding.
“Crossover” is another track configuration. It is a pair of switches that connects two parallel rail tracks, allowing a train on one track to cross over to the other. These type of tracks are usually built close to the terminating station on the rail line. Due to
241
the fact that crossover tracks can be used by trains in both directions for reversing at the end of the line, schedulers pay specific attention to crossover locations in order to avoid accidents that occur as a result of coincident arrival.
Junction Points: Junction refers to a location and point at which two or more rail routes either merge into a common track or diverge into different tracks. Therefore, at such points, there is a physical connection between the tracks of the routes, assuming they use the same gauge. To transfer the train from one route to the other, a simple junction is needed at locations where two tracks meet each other. In order to allow trains to switch and pass from one line to the other line after joining a junction point, a more complicated layout such as a triangular track layout may be designed and built. On systems that have junctions on the rail routes, rail scheduling requires unique and special safety consideration when two or more routes merge onto a single track. Common tracks can be confusing for train passengers because merging onto a common track requires that several routes serve a common stop.
Blocking
As previously mentioned in the blocking section, “blocking” refers to the process of creating vehicle assignments or blocks. The process involves providing each vehicle (bus) a fixed timesheet to follow throughout the day. Therefore, each bus covers a set of trips from the master schedule.
Train scheduling also requires blocking as part of the process. Rail trips require the same blocking procedure as bus trips. The generated blocks are known as “train blocks.” Hence, a complete train block contains a series of rail trips operated by each train. In other words, in order to operate a particular complete block, a scheduled train pulls out from the yard, operates one or more revenue trips and then pulls back into the yard.
242
In railroad scheduling, aside from the train blocks, transit schedulers are required to prepare "crew blocks," which sometimes do not follow the train all day.
Yard Balancing
In order to reduce the amount of time and mileage for unnecessary trips that are intended to transfer the train out of or into the yard, long-length rail lines usually possess two yards; one located at each end of the line. Therefore, since rail maintenance is line-based, it is possible that after operating the revenue service, a train is assigned to pull into the nearest yard, and later a train is assigned to pull out from the nearest yard, which is not the same one that was previously used for pull-in. If the number of cars that pulled out of a specific yard at the beginning of the service day is different from the number of cars that pulled in at the end of the service day, the system incurs expensive yard deadheading costs in the middle of the night. In order to prevent such costs, the scheduler must keep track of yard counts, as well as car and train counts, and makes sure that the number of train cars scheduled to be pulled into a particular yard at the end of the service day is equal to the number that pulled out at the beginning of the service day. This responsibility of the scheduler is called “Yard Balancing.”
243
F. Recommended Reading
Pine, R., Niemeyer, J., & Chisholm, R. (1998). Transit Scheduing: Basic and Advanced Manuals (TCRP Report 30). Transportation Research Board . Washington, D.C: National Academy Press.
Boyle, D., Pappas, J., Boyle, P., Nelson, B., Sharfarz, D., & Benn, H. (2009). Controlling System Costs: Basic and Advanced Scheduling Manuals and Contemporary Issues in Transit Scheduling (TCRP Report 135). Transportation Research Board of the National Academies, Transit Cooperative Research Program, Washington, D.C.
For additional information, scheduling staff are encouraged to look in the References section for topics related to transit scheduling.
244
References
1. Altshuler, A., Womack, J. P., & Pucher, J. R., 1980. The Urban Transportation System: Politics and Policy Innovation. Journal of Economic Literature, 18(3).
2. American Planning Association (Ed.). Steiner F., Butler, K., 2006. Planning and
Urban Design Standards. John Wiley & Sons. 3. American Public Transportation Association (APTA), 2014. Transit Fact Book.
American Public Transit Association.
4. Antti P. Talvitie & Kofi Obeng, 1991.Transportation Planning and Technology. Routledge. http://www.tandfonline.com/doi/pdf/10.1080/03081069108717452. Accessed November 10, 2014.
5. A.T. Ernst, H. Jiang., 2004. Staff Scheduling and Rostering: A Review of
Applications, Methods and Models. Elsevier. Volume 153, Issue 1, Pages 3-27. http://www.sciencedirect.com/science/article/pii/0967070X94900132. Accessed June 26, 2014.
6. Berechman, J., 2013. Public Transit Economics and Deregulation Policy.
Elsevier. 7. Bernick, M., & Cervero, R., 1997. Transit Villages in the 21st Century. McGraw-Hill. 8. Black, A., 1995. Urban Mass Transportation Planning. McGraw-Hill. 9. Black, J., 1981. Urban Transport Planning: Theory and Practice. The Johns
Hopkins University Press. 10. Boarnet, M. G., & Crane, R., 2001. Travel by Design the Influence of Urban Form
on Travel. Oxford University Press, Inc. New York, NY.
245
11. Boyle, D., Pappas, J., Boyle, P., Nelson, B., Sharfarz, D., & Benn, H., 2009. Controlling System Costs: Basic and Advanced Scheduling Manuals and Contemporary Issues in Transit Scheduling (TCRP Report 135). Transportation Research Board of the National Academies, Transit Cooperative Research Program, Washington, D.C.
12. Canadian Urban Transit Association (CUTA), 1993. The Canadian Transit
Handbook (Third ed.).
13. Ceder, A., 2007. Public Transit Planning and Operation: Theory, Modeling and Practice. Taylor & Francis.
14. Center for Urban Transportation Research (CUTR). Justin Begley, Rodney Bunner, Mark Mistretta, Steven Polzin., 2011. TBEST - Guidelines for Transit Development Plan Ridership Estimation Review and Reporting. http://tbest.org/wp-content/uploads/2012/01/TDPReviewandReporting_Final-1-19-2012.pdf
15. Cervero, R., 1994. Transit-Based Housing in California: Evidence on Ridership
Impacts. Transport Policy, Volume 1, Issue 3, Pages 174-183. Chicago, IL http://www.sciencedirect.com/science/article/pii/0967070X94900132 Accessed April 22, 2014.
16. Chada, S., Newland, R., 2002. National Center of Transit Research (NCTR),
Center for Urban Transportation Research, University of South Florida. Effectiveness of Bus Signal Priority. Tampa/FL. http://www.nctr.usf.edu/pdf/BSP%20Final%20Report.pdf. Accessed December 12, 2014.
17. Christopher P. DeAnnuntis.,William P. Morris., 2007. National Center for
Transit Research (NCTR), Center for Urban Transportation Research, University of South FloridaTransit Extraboard Management Optimum Sizing & Strategies. http://www.nctr.usf.edu/pdf/77707.pdf. Accessed December 12, 2014.
246
18. Christopher P. DeAnnuntis.,William P. Morris., 2012. National Center for Transit Research; University of South Florida (USF). Best Practices in Bus Dispatch Final Report. http://www.nctr.usf.edu/wp-content/uploads/2012/11/77930.pdf. Accessed December 12, 2014.
19. Collective Bargaining Agreement Between Miami-Dade County and
Transport Workers Union, Local 291. (n.d.). http://www.miamidade.gov/humanresources/library/labor-relations-twu-local-291.pdf
20. Desrochers, M., Rousseau, J. M., Beckmann, M. J., & Krelle, W., 1992. Computer-
Aided Transit Scheduling: Proceedings of the Fifth International Workshop on Computer-Aided Scheduling of Public Transport Held in Montreal, Canada, August 19-23, 1990. Springer Science & Business Media.
21. Dunphy, R. T., Cervero, R., Dock, F. C., McAvery, M., Porter, D. R., & Swenson, C.
J., 2004. Developing around Transit: Strategies and Solutions that Work. Urban Land Institute.
22. Edwards, J. D. (Ed.)., 1992. Transportation Planning Handbook. Prentice Hall. 23. Fielding, G. J., 1987. Managing Public Transit Strategically. A Comprehensive
Approach to Strengthening Service and Monitoring Performance. Jossey-Bass. 24. Flyvbjerg, B., Holm, M. S., & Buhl, S., 2002. Underestimating Costs in Public
Works Projects: Error or Lie? Journal of the American Planning Association, Volume 68, Issue 3, Pages 279-295. Chicago, IL. http://flyvbjerg.plan.aau.dk/JAPAASPUBLISHED.pdf. Accessed May 16, 2014.
25. Federal Transit Administration 2013. National Transit Database (NTD). Transit Summaries and Trends. U.S. Department of Transportation. http://www.ntdprogram.gov/ntdprogram/pubs/NTST/2013%20NTST%20Storylines.pdf Accessed June 26, 2015.
247
26. Furth, P., B. Hemily, T. Muller, and J. Strathman, 2006. Using Archived AVL-APC Data to Improve Transit Performance and Management (TCRP Report 113). Transportation Research Board of the National Academies, Wasington, D.C.
27. Gray George E. and Lester A. Hoel., 1992. Public Transportation 2nd. Ed. Prentice Hall, Englewood Cliffs, New Jersey.
28. Hamer, A. M., 1976. The Selling of Rail Rapid Transit: A Critical Look at Urban
Transportation Planning. Lexington Books. 29. Hampton Roads Transit., 2011. Hampton Roads Transit: Service and
Schedule Efficiency Review https://gohrt.com/public-records/Planning-and-Development-Documents/hrt-final-report-appendix-3-28-11.pdf. Accessed March 5, 2015.
30. Hanson, S., & Giuliano, G. (Eds.), 2004. The Geography of Urban Transportation.
Guilford Press. 31. Harriet R.Smith, P. Brendon Hemily, Miomir Ivanovic., 2005. Transit Signal
Priority (TSP) A Planning and Implementation Handbook. ITS America. 32. Irving, J. H., Bernstein, H., Olson, C. L., & Buyan, J., 1978. Fundamentals of
Personal Rapid Transit. Lexington Books. 33. Jenks, M., & Burgess, R. (Eds.)., 2000. Compact Cities: Sustainable Urban Forms
for Developing Countries. Spon Press and Taylor & Francis.
34. Juergensmeyer, J. C., & Roberts, T. E., 2003. Land Use Planning and Development Regulation Law (p. 152). St. Paul, MN. Thomson/West.
35. Kostof, S., 1991. The City Shaped Urban Patterns and Meaning Throughout
History. Bulfinch, Boston.
248
36. Lam, W. H., & Bell, M. G., 2003. Advanced Modeling for Transit Operations and Service Planning. Emerald Group Publishing Limited.
37. Lehman Center for Transportation Research (LCTR). (n.d.). The Florida
Advanced Public Transportation Systems Program (APTS). http://floridaapts.lctr.org/. Accessed November 5, 2014.
38. Levinson, D. M., & Krizek, K. J., 2005. Access to Destinations. Elsevier.
39. Meead Saberi and Ali Zockaie K., Wei Feng., Ahmed El-Geneidy., 2013.
Definition and Properties of Alternative Bus Service Reliability Measures at the Stop Level. Volume 16, Issue 1. http://tram.mcgill.ca/Research/Publications/BusReliability.pdf. Accessed December 12, 2014.
40. Mistretta, M., 2005. Fixed Route Transit Scheduling in Florida: The State of
the Industry. State of Florida Department of Transportation, Tallahassee, FL. http://www.nctr.usf.edu/pdf/527-01-3.pdf. Accessed December 12, 2014.
41. Parker, T. C., 1988. Community Involvement and Planning for Transit. From the
book Transit, Land Use & Urban Form. 42. Pine, R., Niemeyer, J., & Chisholm, R., 1998. Transit Scheduing: Basic and
Advanced Manuals (TCRP Report 30). Transportation Research Board. Washington, D.C: National Academy Press.
43. Public Transport Victoria. Research and Statistics.
http://ptv.vic.gov.au/about-ptv/ptv-data-and-reports/research-and-statistics/. Accessed November 11, 2014.
44. R. Vickerman, 1994. Transport Policy, Volume 1, Issue 3, Pages 174-183.
http://www.sciencedirect.com/science/article/pii/0967070X94900132. Accessed June 26, 2014.
249
45. Rousseau, J. M., 1985. Computer Scheduling of Public Transport 2. North-Holland.
46. Skamris, M. K., & Flyvbjerg, B., 1997. Inaccuracy of Traffic Forecasts and Cost
Estimates on Large Transport Projects. Transport policy, Volume 4, Issue 3, Pages 141-146.
47. Spiess, H., & Florian, M., 1989. Optimal Strategies: A New Assignment Model for
Transit Networks. Transportation Research Part B: Methodological, Volume 23, Issue 2, Pages 83-102.
48. Taylor Brian D., Miller D., Iseki H., Fink C., Transportation Research Part A: Policy and Practice, 2009. Volume 43, Issue 1, Pages 60-70. Elsevier. http://www.sciencedirect.com/science/article/pii/S0965856408001274. Accessed February 5, 2014.
49. Litman, T., 2014. The Journal of Public Transportation. Evaluating Public Transportation Local Funding Options, Volume 17, Number 1, Pages 43-74.
50. Torrance, K., Haire, A. R., & Machemehl, R. B., 2009. Vehicle and Driver
Scheduling for Public Transit. Southwest Region University Transportation Center, Center for Transportation Research, University of Texas at Austin Austin, Texas.
51. Transit Glossary. (n.d.), AC Transit-Alameda- Contra Costa Transit District.
www.actransit.org. Accessed August 30, 2014. 52. Transportation Research Board of the National Academies, 2013. Transit
Capacity and Quality of Service Manual, Third Edition. Washington, D.C. 53. Transportation Research Board National Academies, 2013. TCRP Report
165. Transit Capacity and Quality of Service Manual. Wasington, D.C.
250
54. Transportation Research Board, National Research Council, 2000. A Synthesis of Transit Practice. Data Analysis for Bus Planning and Monitoring. Boston, Massachusetts.
55. Transportation Research Board of the National Academies, 2006. TCRP SYNTHESIS 66. Fixed-Route Transit Ridership Forecasting and Service Planning Methods. Wasington, D.C.
56. Transportation Research Board of the National Academies, 1996. Guidelines for the Location and Design of Bus Stops. TCRP Report 19. Washington, DC.
57. U.S. Environmental Protection Agency, 2011. Guide to Sustainable Transportation Performance Measures. http://www.epa.gov/dced/pdf/Sustainable_Transpo_Performance.pdf. Accessed July 9, 2014.
58. Vuchic, Vukan. R., 2005. Urban Transit: Operations, Planning, and
Economics. John Wiley & Sons, Inc. 59. Vuchic, Vukan. R., 2007. Urban Transit Systems and Technology. John Wiley &
Sons, Inc. 60. Xlerate Technologies, 2014. Public Transport Scheduling & Rostering.
http://xlerate.co.nz/. Accessed September 02, 2014.
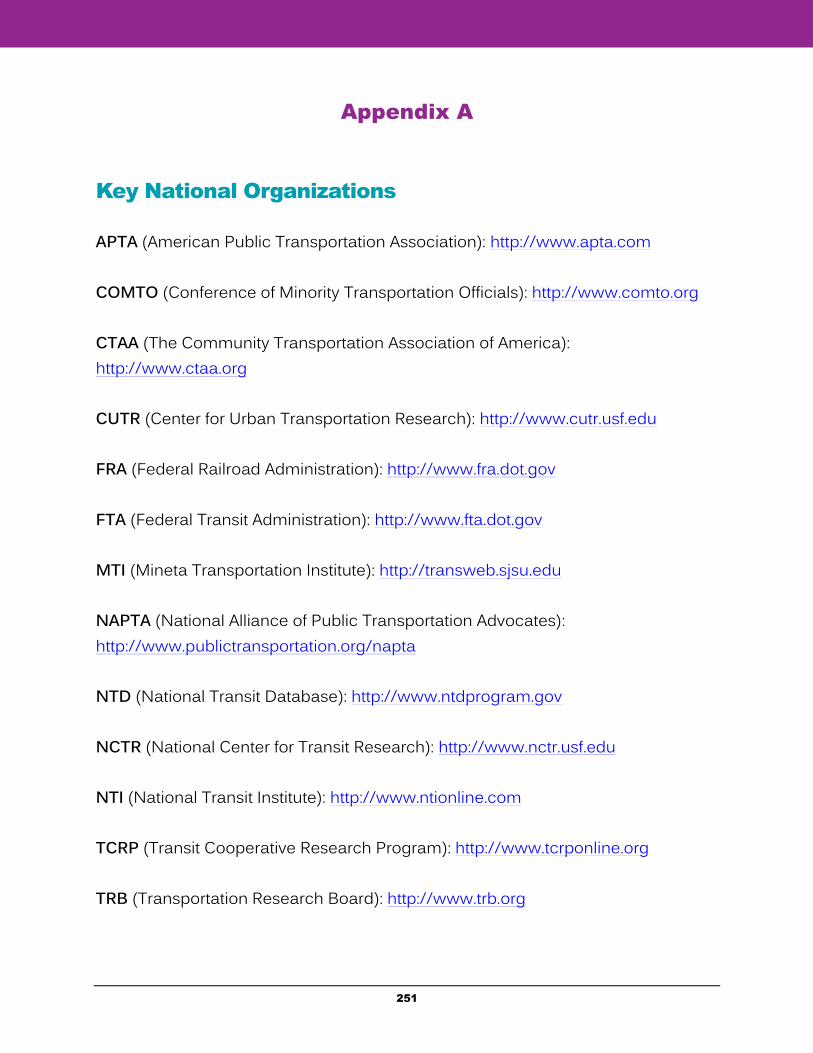
251
Appendix A
Key National Organizations
APTA (American Public Transportation Association): http://www.apta.com COMTO (Conference of Minority Transportation Officials): http://www.comto.org CTAA (The Community Transportation Association of America): http://www.ctaa.org CUTR (Center for Urban Transportation Research): http://www.cutr.usf.edu FRA (Federal Railroad Administration): http://www.fra.dot.gov FTA (Federal Transit Administration): http://www.fta.dot.gov MTI (Mineta Transportation Institute): http://transweb.sjsu.edu NAPTA (National Alliance of Public Transportation Advocates): http://www.publictransportation.org/napta NTD (National Transit Database): http://www.ntdprogram.gov NCTR (National Center for Transit Research): http://www.nctr.usf.edu NTI (National Transit Institute): http://www.ntionline.com TCRP (Transit Cooperative Research Program): http://www.tcrponline.org TRB (Transportation Research Board): http://www.trb.org
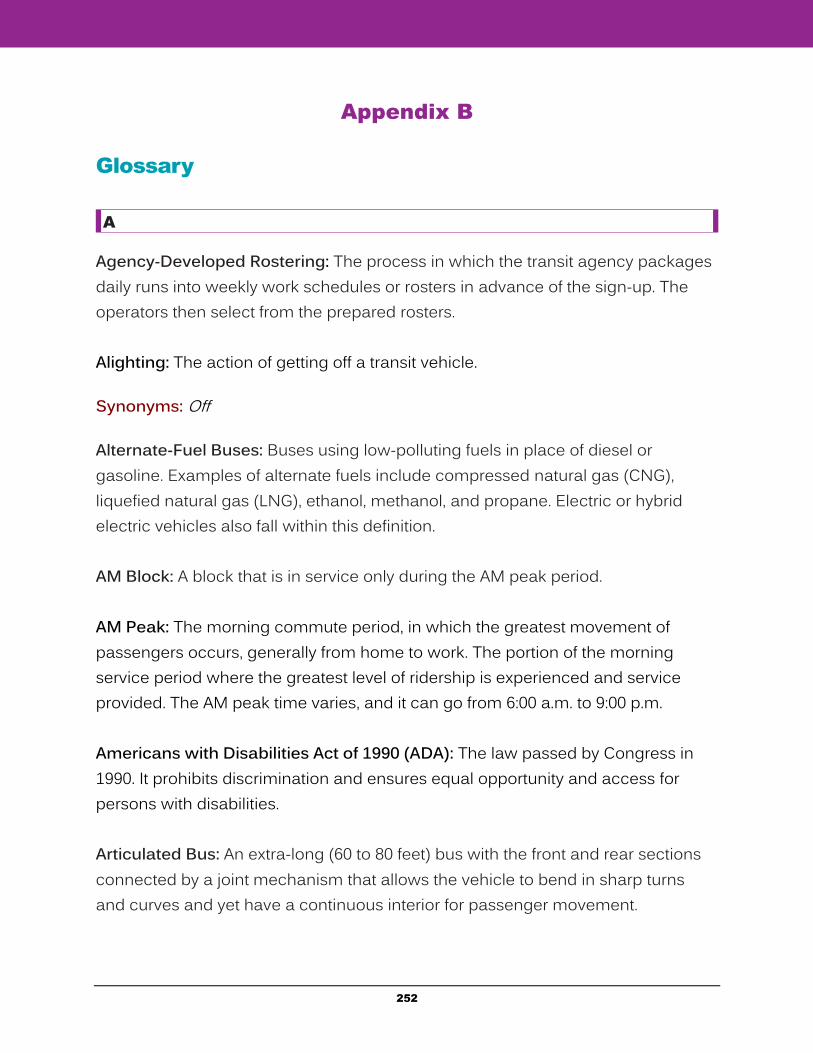
252
Appendix B
Glossary
A
Agency-Developed Rostering: The process in which the transit agency packages daily runs into weekly work schedules or rosters in advance of the sign-up. The operators then select from the prepared rosters. Alighting: The action of getting off a transit vehicle.
Synonyms: Off
Alternate-Fuel Buses: Buses using low-polluting fuels in place of diesel or gasoline. Examples of alternate fuels include compressed natural gas (CNG), liquefied natural gas (LNG), ethanol, methanol, and propane. Electric or hybrid electric vehicles also fall within this definition. AM Block: A block that is in service only during the AM peak period. AM Peak: The morning commute period, in which the greatest movement of passengers occurs, generally from home to work. The portion of the morning service period where the greatest level of ridership is experienced and service provided. The AM peak time varies, and it can go from 6:00 a.m. to 9:00 p.m. Americans with Disabilities Act of 1990 (ADA): The law passed by Congress in 1990. It prohibits discrimination and ensures equal opportunity and access for persons with disabilities. Articulated Bus: An extra-long (60 to 80 feet) bus with the front and rear sections connected by a joint mechanism that allows the vehicle to bend in sharp turns and curves and yet have a continuous interior for passenger movement.
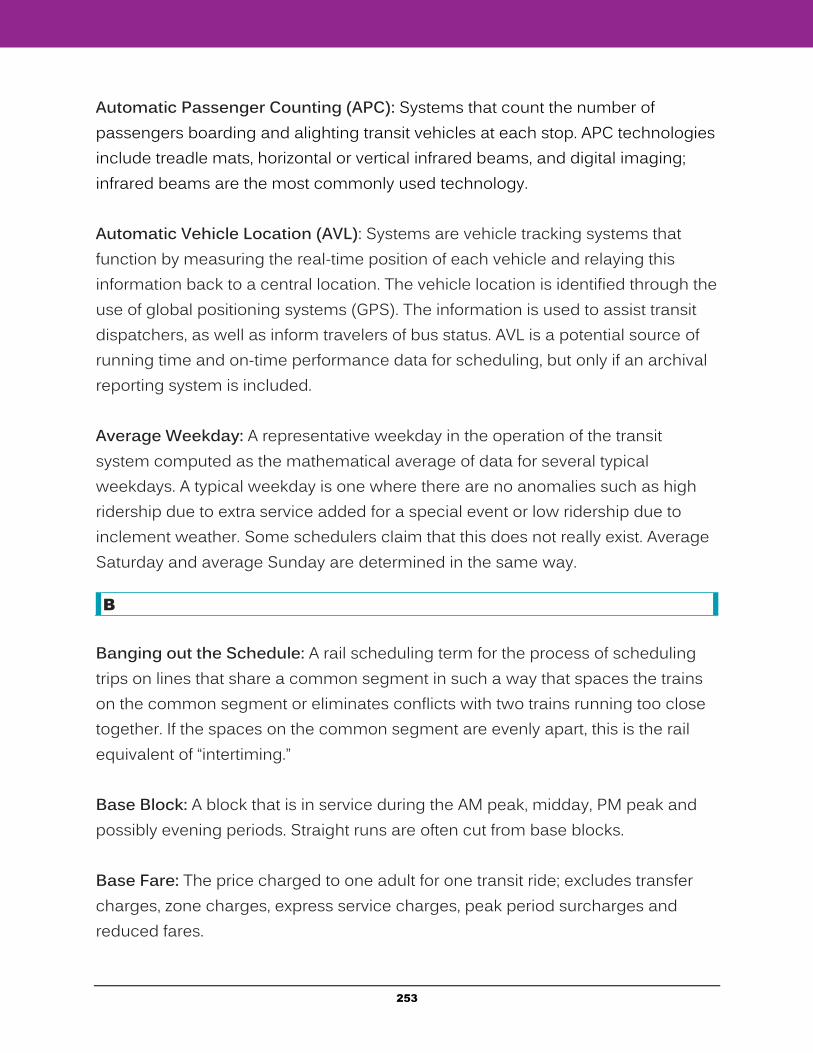
253
Automatic Passenger Counting (APC): Systems that count the number of passengers boarding and alighting transit vehicles at each stop. APC technologies include treadle mats, horizontal or vertical infrared beams, and digital imaging; infrared beams are the most commonly used technology. Automatic Vehicle Location (AVL): Systems are vehicle tracking systems that function by measuring the real-time position of each vehicle and relaying this information back to a central location. The vehicle location is identified through the use of global positioning systems (GPS). The information is used to assist transit dispatchers, as well as inform travelers of bus status. AVL is a potential source of running time and on-time performance data for scheduling, but only if an archival reporting system is included. Average Weekday: A representative weekday in the operation of the transit system computed as the mathematical average of data for several typical weekdays. A typical weekday is one where there are no anomalies such as high ridership due to extra service added for a special event or low ridership due to inclement weather. Some schedulers claim that this does not really exist. Average Saturday and average Sunday are determined in the same way.
B
Banging out the Schedule: A rail scheduling term for the process of scheduling trips on lines that share a common segment in such a way that spaces the trains on the common segment or eliminates conflicts with two trains running too close together. If the spaces on the common segment are evenly apart, this is the rail equivalent of “intertiming.” Base Block: A block that is in service during the AM peak, midday, PM peak and possibly evening periods. Straight runs are often cut from base blocks. Base Fare: The price charged to one adult for one transit ride; excludes transfer charges, zone charges, express service charges, peak period surcharges and reduced fares.
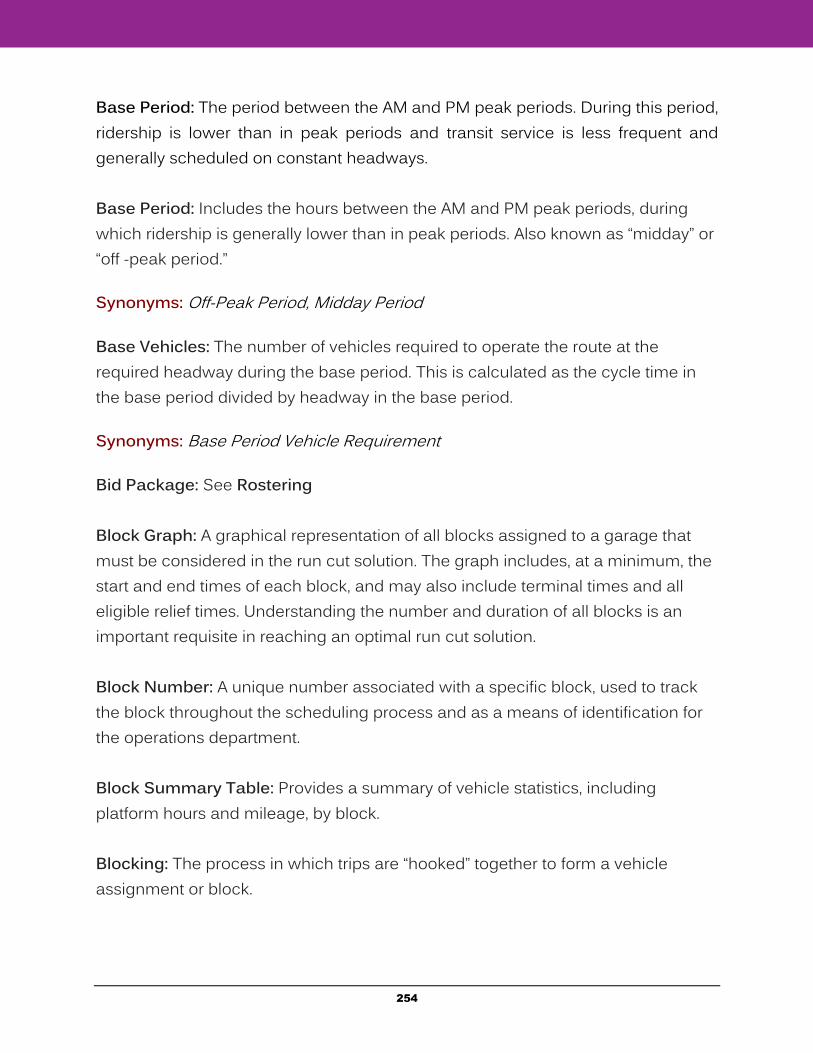
254
Base Period: The period between the AM and PM peak periods. During this period, ridership is lower than in peak periods and transit service is less frequent and generally scheduled on constant headways. Base Period: Includes the hours between the AM and PM peak periods, during which ridership is generally lower than in peak periods. Also known as “midday” or “off -peak period.”
Synonyms: Off-Peak Period, Midday Period
Base Vehicles: The number of vehicles required to operate the route at the required headway during the base period. This is calculated as the cycle time in the base period divided by headway in the base period.
Synonyms: Base Period Vehicle Requirement
Bid Package: See Rostering Block Graph: A graphical representation of all blocks assigned to a garage that must be considered in the run cut solution. The graph includes, at a minimum, the start and end times of each block, and may also include terminal times and all eligible relief times. Understanding the number and duration of all blocks is an important requisite in reaching an optimal run cut solution. Block Number: A unique number associated with a specific block, used to track the block throughout the scheduling process and as a means of identification for the operations department. Block Summary Table: Provides a summary of vehicle statistics, including platform hours and mileage, by block. Blocking: The process in which trips are “hooked” together to form a vehicle assignment or block.
255
Blocking Sheet: A sheet listing all blocks, which also includes the trips and times for all trips within each block.
Board: To go onto or into a transit vehicle.
Boarding: A passenger getting into a transit vehicle.
Synonyms: On
Branch: An outer route deviation served by a single route. Bus: A rubber-tired road vehicle designed to carry a substantial number of passengers (i.e., 10 or more), commonly operated on streets and highways for public transportation service. Bus Hours: See Vehicle Hours Bus Rapid Transit (BRT): A rubber-tired bus service that, through improvements to infrastructure, vehicles, and other branding characteristics, is intended to enhance the service quality compared to regular bus service. BRT systems may include exclusive right-of-way, transit signal priority, higher-capacity vehicles, enhanced stations, and off -bus fare collection systems. Bus Stop: A curbside place where passengers board or alight transit.
C
Cafeteria-Style Rostering: The process in which operators create their own rosters by selecting daily runs and days off from a master list. Car Hours: See Vehicle Hours Car Pooling: The use of an automobile to ferry more than one operator between the garage and a relief location, or even between two relief locations.
256
Clear Allowance: The amount of time paid to an operator at the conclusion of the run to turn in transfers, fare media, or other supplies and reports.
Synonyms: Turn-In Allowance, Check Out time
Collaterals: Includes all of the various types of penalties and premiums that might be required to make legal runs. Consist: A rail term that refers collectively to the rail cars comprising a train, i.e., a four-car train is a four-car consist. Crew Block: The series of trips operated by each train crew from pull-out to pull-in. The crew block will differ from the train block if drop-backs are scheduled for the crews. Crosstown Route: A non-radial route that typically does not serve downtown areas.
Cycle Time: The total of the round-trip running time that includes the layover or recovery time.
Synonyms: Round-Trip Cycle Time, Round-Trip Time
D
Deadhead: The time and distance that a bus travels in no-revenue service and will not pick up passengers. Deadheading normally allows buses to get to and from their garage or to travel from one route to another as part of the daily service. Deadhead Hours: Include pull-in time, pull-out time, and deadhead time from one route or point to another.
Synonyms: Non-Revenue Travel
Deadhead Miles: The miles a vehicle travels in no-revenue service. Deadhead Time: The hours a vehicle travels in no-revenue service.
257
Destination: The location where a passenger ends their trip. Dispatch Sheet: A list of all runs or blocks sorted by start time, typically used by operations to track staff and vehicle movements throughout the day. Division: See Garage. A division may represent a group of garages with some common labor and/or management organization. Downtime: The time when a vehicle is inoperative due to repairs or maintenance. Drop-back: A technique where the operator or train crew gets off an arriving vehicle at a terminal, takes a layover, and assumes operation of the next vehicle to arrive. Most common on frequent rail lines where close headways do not allow sufficient layover time for the train crew, this technique is also used for special events to maximize the number of trains in service. If service is very frequent, the train crew may not board the next train, but instead, the train after that; this is called a “double drop-back.”
Synonyms: Fall-Back
Dwell Time: The scheduled time a vehicle or train is allowed to discharge and take on passengers at a stop, including opening and closing doors. E
Early AM: The time period before 7:00 a.m. Exception Scheduling: Scheduling activity undertaken to address major construction detours or delays, sporting events, holiday service, or other special situations. Express Service: A service generally connecting residential areas with activity centers via a high-speed and non-stop route with limited stops at each end for
258
collection and distribution. Park-and-ride lots, at the residential end of the route, are a common feature of the express service. Extraboard: A group of operators that provide coverage of vacant runs and other work on a daily or weekly basis. Operators may pick the extraboard during a sign-up or may be assigned to the extraboard if no additional runs are available. Also known as “the Board.” F
Fare Box Recovery Ratio: Measure of the proportion of operating expenses covered by passenger fares; found by dividing Fare Box Revenue by total Operating Expenses for each mode and/or systemwide. Fare Box Revenue: The value of cash, tickets, tokens and pass receipts that passengers use as payment for rides; excludes charter revenue. Fare Elasticity: The extent to which ridership responds to fare increases or decreases. Federal Transit Administration (FTA, formerly UMTA, Urban Mass Transit Administration): A part of the U.S. Department of Transportation (DOT) that administers the federal program of financial assistance to public transit. Feeder Service or Feeder Route: A service that picks up passengers and transports them to another transit mode, transit station, park-and-ride, or other transfer facility. Fixed-Route Service: A service provided on a fixed-schedule along a specific route where vehicles stop to pick up and drop off passengers. Free running time: The absence of a specified running time along a given segment, with an estimated arrival time at the end of the segment. Frequently used on the express portion of an express bus trip, free running time is a
259
component of headway-based schedules and is sometimes included on the last segment of a local route. Frequency: The number of vehicles passing a point on a route within a given unit of time, usually expressed as vehicles per hour. See also “headway.” Headway is the inverse of frequency (e.g., a service frequency of four buses per hour is equivalent to headway of 15 minutes). Full-time operator: An operator available to work full-time and eligible to receive full benefits. A full-time operator is usually guaranteed 40 hours of work per week. Full-time run: A work assignment whose total hours equal or exceed the guaranteed minimum number of hours for a full-time operator.
Synonyms: Regular Run
G
Garage: The place where revenue vehicles are stored and maintained; an area where vehicles are dispatched and recovered for the delivery of scheduled service.
Synonyms: Barn, Base, Depot, District, Division, Station, Yard, Storage Lot
Garage: The place where vehicles are stored and maintained, and where operators report for their assignments. Garage Relief: An operator relief that occurs at the garage. Global Positioning System (GPS): A satellite-based navigation system that provides accurate and continuous location information. Tunnels, terminals, and urban street canyons can limit GPS accuracy.
H
Headway: The time between two consecutive vehicles running in the same
260
direction on the same route, usually expressed in minutes. See also “frequency.” Frequency is the inverse of headway. Headway Sheet: A document that displays all timepoints and trips on a route. Usually includes run numbers, block numbers, and pull-in and pull-out times. Used interchangeably in this manual with “master schedule.”
Synonyms: Recap, Rotation, Master Schedule
Heavy Rail (HR): Transit service that uses rail cars with self-contained, self-propelled motive capability, driven by electric power usually drawn from a third rail, and operated on an exclusive right-of-way with level platform boarding. Heavy rail generally utilizes longer trains and longer spacing between stations than Light Rail. High Occupancy Vehicle (HOV): Vehicles that can carry more than two persons. Examples of high occupancy vehicles are a bus, vanpool and carpool. Hooking: The process of attaching the end of a trip in one direction to the beginning of a trip the other direction. A block is a series of hooked trips. Also see Rehooking. Hot: A term used to describe a trip that leaves a timepoint early. Such a trip is called “running hot.” Hybrid bus: A bus that runs on hybrid propulsion that combines an internal combustion engine and an electric propulsion system. The most common are hybrid diesel-electric buses, which consume less energy and have lower emissions that regular diesel buses.
I
Interlining: Interlining is used two different ways: Interlining allows the use of the same revenue vehicle and/or operator on more than one route without going back to the garage. Interlining is often considered a means to minimize vehicle
261
requirements, as well as a method to provide transfer enhancement for passengers. For interlining to be feasible, two (or more) routes must share a common terminus or be reasonably proximate to each other (see Deadhead).
Synonyms: Through Routes, Interlock Routes, Interlocking
Interlining: The use of the same vehicle and/or operator on more than one route without going back to the garage. This is most often done at common bus terminals where routes meet. Interlining is often considered a means to minimize vehicle requirements, as well as a method to minimize transfers for passengers. J
K
Kiss and Ride: A place where commuters are driven and dropped off at a station to board a public transportation vehicle. L
Layover: Layover time gives operators a rest or a break between trips. Layover time is often determined by labor agreements that require off-duty time after a certain amount of driving time. Often used interchangeably with “recovery time,” although technically speaking, layover time is rest time for the operator between trips, while recovery time is time built into the schedule to ensure an on-time departure for the next trip.
Synonyms: Recovery Time
Light Tail: A fixed-guideway mode of transit service using electrically propelled rail cars that draw current from overhead wires, are operated on reserved but not necessarily grade-separated right-of-way. Light rail generally utilizes shorter trains (at times one-car trains) and shorter spacing between stations than heavy rail, and may also operate in streets with mixed traffic.
262
Limited Service: A bus service that makes stops only at major points along the route. It is similar to express service, but without very long non-stop segments. Limited-Stop Service: A bus service that normally operates on main arterials, and makes stops only at major points along the route. It is similar to express service, but without very long non-stop segments. Line of Work: A weekly work package developed during rostering, which consists of a fixed set of runs and days off for a set workweek. Line Pick: A sign-up held in between scheduled sign-ups to fill one or more runs permanently vacated due to illness, disability, or termination. Only operators with less seniority than the prior holder of the vacated run are eligible to bid. Also, a special sign-up held on one route only due to a significant schedule change on the route during the sign-up period. Linked Passenger Trips: A linked passenger trip is a trip from origin to destination. Even if a passenger makes several transfers, the trip is counted as one linked trip. Unlinked passenger trips, on the other hand, count each boarding as a separate trip. Load Factor: The ratio of passengers carried versus the total seating capacity of the vehicle. A load factor greater than 1.0 indicates that there are standees on that vehicle. Loading Standard: An agency performance measure for passenger loads. The loading standard is usually expressed as a percentage of the seated capacity, as the maximum number of standees, or as the maximum load. Loading standards can be used to limit the number of standees and can be different during peak times. Low-floor Bus: A vehicle that has no stairs at its doorways. This allows faster boardings and alightings for all passengers and provides easier access to people
263
with mobility difficulties. The tradeoff is that due to the low floor, the wheels take up space within the passenger compartment, reducing the number of seats. Light Rail Transit (LRT): A transit mode (also called streetcar, tramway, or trolley) that typically is an electric railway with a light volume traffic capacity, compared to heavy rail. There is no standard definition, but in the United States, light rail operates primarily along exclusive rights-of-way at ground level, on aerial structures, in subways, or occasionally, in streets, and uses either individual tramcars or multiple units coupled to form a train. LRT vehicles are typically driven electrically, with power being drawn from an overhead electric line via a trolley or a pantograph and driven by an operator on board the vehicle. LRT vehicles tend to have relatively smooth and comfortable operation, easy boarding, attractive station areas, and easy-to-understand routes and schedules.
M
Make-Up Time: Time added to an operator’s work hours to bring the total up to the guaranteed minimum (usually eight hours per day or 40 hours per week). Full-time operators often have an eight-hour guarantee, even if their runs are short of eight hours.
Synonyms: Guarantee Time, Boost Time, Bonus Time, Pad Time
Master Run List: A list containing all weekday, Saturday, and Sunday runs. The Master Run List may be the Run Guide or some variation of the Run Guide. Typically used in cafeteria rostering. Master Schedule: A document that displays all timepoints and trips on a route. Usually includes run numbers, block numbers, and pull-in and pull-out times. Used interchangeably in this manual with “headway sheet,” and also known as “recap” or “rotation.” Match-Up Sheet: A listing of all arrival and leave times of all routes at a particular terminal. This sheet simplifies the process of interlining trips.
264
Maximum Load: The largest number of passengers aboard a vehicle at any given point along the trip. Maximum Load Factor: The maximum number of passengers aboard a vehicle, divided by the vehicle’s seating capacity, and expressed as a percentage (e.g., 100% corresponds to a fully seated load with no standees). Maximum Load Point: The location along the route where the passenger load is the greatest. The maximum load point can vary by direction and by time of day. Long or complex routes may have multiple maximum load points, or one for each segment.
Synonyms: Peak Load Point
Maximum Load Point: The location(s) along a route where the vehicle passenger load is the greatest. The maximum load point(s) generally differ by direction and may also be unique to each of the daily operating periods. Long or complex routes may have multiple maximum load points. Meet: When two trains on two different tracks (in single-track operation, one train is on a passing siding) converge at the same location. Midday: The weekday time period between 9:00 a.m. and 4:00 p.m. On most lines, headways remain fairly constant during this period of the day. Miss Out: The term applied when a scheduled operator does not report on time for his/her assignment.
Synonyms: No Show, Miss
Missed Trip: A schedule trip that did not operate for a variety of reasons, including operator absence, vehicle failure, dispatch error, traffic, accident or other unforeseen reason.
265
Mode: A type of transit service characterized by vehicle or operational features. Common transit modes include motorbus, trolleybus, light rail, heavy rail, commuter rail, and demand-response. Multipiece Runs: Runs made up of pieces from multiple blocks. In most cases, split runs are inherently multi-piece runs. However, either half of a split run could itself have multiple pieces, cut from multiple blocks. Multipiece Straight: See Straight Run
N
Night: The weekday time period after 6:00 p.m. No-show: A term used to describe a scheduled trip that was not cancelled by the passenger but when the driver arrived to pick up the passenger, he or she was not available for the trip. Note: Text associated with a trip or a specific timepoint on a trip. Typically reported on scheduling outputs such as headway sheets and paddles, it can be an essential part of posting information for the operator’s pick. A subset of notes may also be exported to public timetables. Notes often describe exceptions, e.g., “trip does not operate when school is closed” or “trip departs from Gate X”.
Synonyms: Comments
O
Off-Peak: Non-rush periods of the day when travel activity is generally lower and less transit service is scheduled.
On-Street Relief: The process where, at a specific time during a specific trip on a block, one operator’s run ends, and another operator’s run begins. The relief may occur at a terminal or at a designated point along the route (possibly close to the garage). On-street relief is used to minimize pull-out and pull-in miles and hours.
266
Operators are usually paid travel time between the garage and the relief point. Reliefs may also occur at the garage; these are known as “garage reliefs.” On Time: A trip is considered on time if it arrives or departs from a timepoint within a specified range of time. This is defined specifically by each system, and there are no standards, as the on-time parameters can vary from 2 minutes early to 5 minutes late. A bus that leaves a timepoint early is referred to as “running hot.” Open Run: A run that was not bid at the previous sign-up or has been vacated during a sign-up due to retirements, terminations, long-term illnesses, etc.
Operating: Maintaining the ongoing functions of an agency or service. “Operating expenses” include wages, benefits, supplies, and services. “Operating assistance” is used to pay for the cost of providing public transit service.
Operating Assistance: Financial assistance for transit operating expenses (not capital costs); such aid may originate with federal, local or state governments.
Operating Cost: The total costs to operate and maintain a transit system, including labor, fuel, maintenance, wages and salaries, employee benefits, taxes, etc.
Operating Deficit: The difference of operating expenses and operating revenues. Operating Expense: Expenses associated with the operation of the transit agency, and goods and services purchased for system operation. Operating Revenue: Revenue derived mainly from passenger fares, but it can also include revenue from advertising and other services provided to other agencies or organizations. Origin: The location where a passenger begins a trip.
267
Overtime Premium: Higher pay rate than the normal rate for work performed in excess of normal daily or weekly hours, usually after eight or ten hours per day, or 40 hours per week. Owl: A run that operates during the late night/early morning hours to provide all-night service.
Synonyms: Hawk
P
Paddle: An output of the scheduling process that provides the operator with information regarding his or her workday—what time the workday starts/ends, how to get to/from relief locations, the trips to be operated, times at all timepoints, and notes. If an operator drives on more than one route in the day, the paddle will have all trips shown sequentially, as well as travel paths between routes, if needed. The paddle may also include a list of route turns, route maps, farebox, headsign, and radio codes, and key intersections and stops that must be announced.
Synonyms: Trip Sheet, Board, Manifest, Schedule
Paratransit Service: Transit service offered to individuals with disabilities who are unable to use fixed route transportation systems. It is also called demand response and uses automobiles, vans or small buses to provide service. Passengers must apply for eligibility and trips needs to be scheduled in advance. Park-and-Ride: A facility where transit passengers can park their vehicle to catch a bus, vanpool, or carpool to reach their final destination. Part-Time Operator: An operator who works less than the local definition of full-time. A part-time operator may not receive the full benefits of a full-time operator, and may be paid at a lower wage rate. Part-Time Run: See Tripper
268
Passenger: A person who rides a transportation vehicle, excluding the driver. Passenger Check: A check (count) made of passengers arriving at, boarding and alighting, leaving from, or passing through one or more points on a route. Checks are conducted by riding (ride check) or at specific locations (point check). Passenger checks are conducted in order to obtain information on passenger riding, which will assist in determining both appropriate directional headways on a route and the effectiveness of the route alignment. Passenger checks are also undertaken to meet FTA National Transit database (NTD) reporting requirements.
Synonyms:Tally
Passenger Load: The number of passengers divided by the number of seats on the bus. Passenger load is expressed as a ratio and is measured at points along the route. Of particular interest is the maximum passenger load on a route or segment. Passenger Miles: The total number of miles traveled by passengers on transit vehicles; this is determined by multiplying the number of unlinked passenger trips times the average length of their trips. Passengers Per Minute (PPM): The measurement of how many people accumulate every minute at all bus stops waiting for service in the direction being analyzed. Patch: A temporary modification to a trip or series of trips on a route implemented during the sign-up period to account for a detour or to address minor running time problems. Pattern: See Service Pattern and Schedule Pattern Pay Hours: The number of hours that an operator is paid at his/her rate. Pay hours include work hours, make up time, overtime premium, spread premium, and any other adjustments called for in the contract.
269
Pay-to-Platform Ratio: The ratio of pay hours to platform time. Peak Express Route: An express route that commonly provides service between an outlying area and the city center. Peak/Base Ratio: The number of vehicles operated in revenue service during the peak period divided by the number operated during the base period.
Peak Hour/Peak Period: The period with the highest ridership during the entire service day, generally referring to either the peak hour or peak several hours (peak period).
Synonyms: Commission Hour
Peak Period: Hours during which ridership is highest, usually in the morning and afternoon commute times. Peak-to-Base Ratio: The ratio between the number of transit vehicles required to operate during the higher of the peak periods divided by the number of vehicles required in the base period. Peak Vehicles: The maximum number of vehicles required to operate the route at the required headway. Quickly calculated as round-trip cycle time divided by headway. Also referred to as “peak vehicle requirement.”
Synonyms: Peak Vehicle Requirement
Pick: The selection process by which operators are allowed to select their work assignments.
Synonyms: Bid, Mark-up, Line-up, Shake-up, Sign-up
Piece Balancing: The process in which the scheduler strives to balance the number of AM and PM pieces to increase the possibility of creating split runs that
270
are in accord with formal and informal rules, and to leave a balanced number of AM and PM trippers for the extraboard to cover. Pieces: Portions of a run, especially distinct portions separated by a break. Platform Time: A phrase derived from the days when motormen and conductors operated from the “platform” of a streetcar; includes all times when the operator is operating the vehicle. Layover time and pull-in and pull-out times are part of the platform time; however, report allowance and clear allowance, and travel time (unless part of a pull-in or pull-out) are not. Similarly, platform miles include all miles traveled while the operator is operating the vehicle. Also known as “vehicle hours.” Platform (Vehicle) Hours: The number of hours that buses are on the road, from the time vehicles pull out to the time they pull in. This includes revenue time, layover time, and deadhead time. Annual Platform (Vehicle) Hours: The number of platform hours operated during a calendar year for a given route. PM Block: A block that is in service only during the PM peak period. PM Peak: The afternoon period in which the greatest movement of passengers occurs, generally from work to home. The PM peak time varies and it can go from 3:00 p.m. to 6:00 p.m. Point Check: A technique to collect information about passenger loads and schedule adherence at a single location (or point), typically a timepoint or a location where branches of a route diverge. Synonyms: Line Check Posting: The term used for notification to operators of all work assignments that will be available for selection during the next sign-up. Runs are posted for cafeteria
271
rostering; rosters are posted for agency-developed rostering. Runs and rosters are posted days prior to the start of actual bidding to provide time for operators to study their options before making their selection. Premium Pay: Payment to an operator that is over and above the straight time pay rate; includes overtime premium, spread premium, shift premium, and any other operating premiums as defined by the contract. Pull-In: The non-revenue movement of a vehicle from its last scheduled terminal or stop to the garage. Pull-In Miles: The distance the vehicle travels from the route to the garage, and are included in vehicle miles, but not in revenue miles. Collectively, pull-in miles and pull-out miles are also known as pull miles and are components of deadhead miles. Pull-In Time: The time the vehicle spends traveling from the route to the garage. Pull-in time is included in vehicle hours, but not in revenue hours. Pull-in time and pull-out time are also known as deadhead time.
Synonyms: Turn-In Time, Deadhead Time, Run-off Time
Pull Miles: See Pull-In Miles and Pull-Out Miles Pull-Off Location: The place on a route where a vehicle ends revenue service.
Pull-On Location: The place on a route where a vehicle begins revenue service.
Synonyms: Fit-In Point
Pull-Out: The non-revenue movement of a vehicle from the garage to its first scheduled terminal or stop. Pull-Out Miles: The distance the vehicle travels from the garage to the route, and are included in vehicle miles, but not in revenue miles. Collectively, pull-in miles
272
and pull-out miles are also known as pull miles and are components of deadhead miles. Pull-Out Time: The time the vehicle spends traveling from the garage to the route. Pull-out time is included in vehicle hours, but not in revenue hours. Pull-in time and pull-out time are also known as deadhead time. Synonyms: Deadhead Time Pull Reliefs: Reliefs made by pulling out one vehicle and pulling in another vehicle. Pull Time: See Pull-In Time and Pull-Out Time Q
R
Radial Route: A route that radiates from the city center to the outer areas.
. Recovery Time: The scheduled time at an identified location, usually a terminal at the end of the line, to ensure an on-time departure for the next trip. This helps a route return back to schedule and recover from traffic, loading, or other conditions.
Synonyms: Layover Time
Rehooking: The process of changing how trips are linked into a block. This is done when evaluating blocks, as well as during the run-cutting process. Relief: The replacement of one operator on a vehicle by another operator on the same vehicle. The first operator may be going on a break or may be ending his/her workday. The second operator may be starting his/her workday or coming back from a break.
273
Relief Location: A designated point on a route where operators or crews may be scheduled to begin or end their run or a piece of their run. This can include the garage itself.
Synonyms: Relief Point
Relief Opportunities: Times within a block when relief can be scheduled, typically at the end of a trip or when the vehicle passes a specified relief location.
Relief Point: Refers to a list of locations where bus operators begin their respective run assignments when scheduled to relieve an operator who is already in service on a route. Each division has specific relief locations for its routes.
Synonyms: Relief Location
Relief Run: A run that is available as a result of other operators’ day off selections. Some rosters are made up of several different relief runs. Report Allowance: The amount of time that an operator is paid, from sign-in time to pull-out time. During this time, the operator may obtain instructions and supplies pertinent to his/her run, locate the assigned vehicle, and perform a pre-trip inspection. Report Time: Sometimes used to refer to report allowance. See Sign-In Time.
Revenue: Receipts derived from or for the operation of transit service, including fare box revenue, revenue from other commercial sources, and operating assistance from governments. Fare box revenue includes all fare, transfer charges, and zone charges paid by transit passengers.
Revenue Hours: The number of hours in revenue service. It includes layover/recovery time, but excludes deadhead hours.
274
Revenue Miles: The number of miles of service available to passengers for transport on the routes. Excludes deadhead miles. Calculated for each route and for the system as a whole.
Revenue Service: Service that is available when a revenue vehicle is in operation over a route and is available to the public for transport.
Revenue Vehicle Hour: The measurement of scheduled hours of service available to passengers for transport on the routes, equivalent to one transit vehicle traveling in one hour in revenue service, excluding deadhead hours, but including recovery/layover time. Calculated for each route.
Ride: A single passenger using a single transit vehicle for a segment of their trip. Ride Check: A technique to collect information about boarding and alighting at every stop, in addition to passenger loads and schedule adherence at all timepoints. Ride checks may also include data collection on the type of fare paid, stop announcements, or other information of interest to the agency. Ride checks are more labor-intensive than point checks, but provide more complete data for a given route.
Synonyms: On-Board Count, On-Board Tally
Ridership: The number of rides taken by people using a public transportation system in a given time period. Rostering: The process of grouping daily operator runs into packages of weekly work assignments. The finished package is known as a roster, a bid package or lines of work. Rotating (Rotary) Roster: A roster where operators cycle through the weekly Lines of Work over the course of the sign-up period. Round-Trip: A trip that travels along a route and then returns to its original starting point; a combination of two one-way trips on a route.
275
Route: A specified path taken by a transit vehicle usually designated by a number or a name, along which passengers are picked up or discharged.
Synonyms: Line Run: A work assignment for an operator. Most often, “run” refers to a whole day’s work assignment. Run Guide: A summary of runs that describes start/finish locations, work hours, and cost element breakdowns. The Run Guide is the principal document that describes all of the runs available for bid. Synonyms: Bid Sheet, Run List Run Number: The number assigned to each work assignment on a specific day. At some systems, the run number is unique only when used in combination with a designator for the garage or the route or route group number. Run Summary: A list of runs showing start/finish times, hours worked, and paid hours. Payroll systems use the Run Summary. Run-cutting: The process of converting (or cutting) vehicle blocks into work assignments for operators. The finished product is referred to as a run-cut. Running Time: The time it takes for a vehicle to travel the length of a route or between two specific points on a route. One-way running time is time in one direction along the route. Round-trip running time is time in both directions combined. Running time does not include layover/recovery time.
Synonyms: Travel Time
S
Schedule: [From the transit agency (not the public timetable)] A document that, at a minimum, shows the time of each revenue trip through the designated
276
timepoints. Many properties include additional information such as route descriptions, deadhead times and amounts, interline information, run numbers, block numbers, etc.
Synonyms: Headway, Master Schedule, Timetable, Operating Schedule, Recap/ Supervisor’s Guide
Schedule: A document that shows trip times at timepoints along a route. The schedule may also include additional information such as route descriptions, deadhead times, interline information, run numbers, and block numbers. Schedule Efficiency: The ratio of revenue hours to vehicle hours. A measure of the degree to which deadhead and recovery time are kept from consuming too high a proportion of total vehicle hours. Schedule Pattern: A summary of the schedule in terms of running times between timepoints and layover time at terminals. The schedule pattern can be repeated throughout the day or can change as running times and layover times change during the day. Scheduled Recovery Time: The scheduled time a bus or light-rail car sits at the end of the trip in order to provide schedule restoration and allow the operator to take a break. It is often referred to as “layover time.” Schedule Reliability: A performance measure that transit agencies use to determine the percentage of buses that arrive or depart on time. In general, on-time performance standards for U.S. transit systems range from 75% to 95%.
Synonyms: Reliability, on-time performance
Scheduled Running Time: The scheduled time it takes a bus (or rail car) to travel over a given route segment.
277
Scheduling: The planning of vehicle arrivals and departures, and operator scheduling for these vehicles to meet consumer demand along specified routes. School Trips: Additional scheduled trips at school bell times to accommodate the heavy loads associated with student ridership along a route. School trips are typically inserted into the schedule for no longer than necessary to address ridership demand. As with other services, these trips are scheduled to meet demand, are open to the public, and are included on public timetables.
Synonyms: School Extras, School Trippers, School Trips, School Service
Service Area: The geographic area where a transit agency provides service. Service Coverage: Measures the extent to which the defined service area is being served. Service Curve: A plot of the number of buses in service by hour. See also Vehicles in Operation Graph. Service Hours: The scheduled time where vehicles provide service. It includes revenue hours, plus layover/recovery time. It excludes deadhead time. Service Pattern: The unique sequence of stops associated with each type of trip on a route. If all trips operate from one end to the other on a common path, the route has one service pattern. Branches, deviations or short turns introduce additional service patterns. Service patterns are a fundamental component of scheduling and provide the framework for tracking running time, generating revenue trips, and identifying deadhead movements for the route.
Synonyms: Trip Pattern, Variant, Path
Service Span: The span of hours over which service is operated, e.g., 6 a.m. to 10 p.m. or 24 hours (owl). Service span often varies by weekday, or by Saturday or Sunday.
278
Synonyms: Span of Service, Service Day
Service Standards: A benchmark by which service operations performance is evaluated. Service standards are normally established in areas such route and schedule design, service delivery, passenger comfort and safety, and route performance and productivity.
Synonyms: Service Guidelines
Shift Premium: A premium paid to operators for working during times of the day that are subject to special pay differentials, e.g., an owl (late night/early morning) run. Short Turn: A trip that terminates at an intermediate point instead of traveling the full length of the route. Short turning is frequently used to add capacity to a specific segment of the route.
Synonyms: Short Line, TurnBack
Show-Up: An assignment for an extraboard operator to be at a specific location to fill in for another operator or to do other work. A certain amount of stand-by time is paid in the event that the operator does not receive a run.
Synonyms: Report
Sign-In Time: The time an operator is assigned to report for duty at the start of each piece of a run. The operator may be required to sign in or may be acknowledged by the dispatcher as having reported.
Synonyms: Report Time, Sign-On Time, Show-Up Time
Sign-Up: The process whereby operators select work assignments. Most agencies have three or four sign-ups each year. Synonyms: Bid, Line-Up, Pick, Shake-Up, Mark-up
279
Sign-Up Period: The period of time that a specific sign-up is in effect, usually three or four months. Slipping and Sliding: The process of shifting one or more trips forward or backward in time to achieve a specific purpose. Synonyms: Trip Shifting Small Bus: A bus that is slightly narrower than a typical bus. Small buses have significantly better maneuverability than standard or articulated buses. They commonly have seats for 30 or fewer passengers. Span of Service: The length of time, from the beginning of the first trip to the end of the last trip, during which service operates on the street. Span of service can be expressed for a route or for the system as a whole. Span of Service: The amount of time each day in which the route is operating. Span of Service can be expressed generally in terms of hours per day or more specifically by stating the time of the first and last trips of the day. Split Run: A run containing two or more pieces of work separated by a break over one hour in length. At some systems, three-piece split runs are allowed, but one of the breaks (or “swings”) is usually paid, whereas in two-piece split runs the break is generally not paid. Split runs tend to be used to allow both peaks to be covered by one operator, since the workday would otherwise be too long for a straight run.
Synonyms: Swing Run
Spread Premium: Pay at the rate equal to one-half or more of all minutes in excess of a specified maximum spread time, in addition to regular straight pay. Spread premium is separate and distinct from overtime premium. Synonyms: Spread Penalty, Spread Bonus, Spread Pay
280
Spread Time: The total time between the start of the first piece and the end of the last piece of a split run with two or more pieces. Synonyms: Outside Time Stand-By Time: The time that an operator spends at the garage at the agency’s direction awaiting the assignment of a run or a piece of work. Usually associated with a report by an extraboard operator, stand-by is intended to provide a pool of operators that will be available to fill runs vacated by unscheduled absences. Standard Bus: Normally a 35- to 40-foot long single body bus that provides seats for 34 to 44 passengers. Storage Lot: A bus storage area remote from a garage, used to minimize deadhead mileage or due to capacity constraints. Straight Run: A run in which trips are consecutive without interruption. Straight runs do not contain any breaks (except for meal breaks in some systems) for the operator. Any break in a straight run is usually less than one hour in length. A straight run with a break is referred to as a two-piece straight or multi-piece straight. Swing Time: The elapsed time (usually unpaid) between the pieces of a split run. If swing time is paid, it is sometimes called “inside time.”
Synonyms: Intervening Time
System Sign-Up: A scheduled sign-up during which operators may transfer from one garage to another. System sign-ups are usually held no more than once a year. At intermodal agencies, the system sign-up may also allow an operator to transfer between modes.
Synonyms: System Bid, System Mark-Up, System Pick, System Shake-Up, System Line-Up
281
T
Terminal: One end point of a route where trips usually begin and end. Short turns and branches introduce additional terminals. Synonyms: End of the Line or EOL
Three-Piece Run: A run made up of three pieces of work separated by two intervals of time. Generally, one of the intervals in a three-piece run is paid time.
Through-Routing: A form of interlining in which a vehicle switches from inbound service on one route to outbound service on another route while continuing in service throughout the day. Time Point: A designated location on a route used to control the spacing of vehicles along the route. A route may contain several timepoints along the route, designated where possible at major intersections, major trip generators, and key destinations.
Timed Transfer: A point or location where two or more routes come together at the same time to provide positive transfer connections. A short layover may be provided at the timed transfer point to enhance the connection. Timed transfers have had increasing application, as service frequencies have been reduced below 15 to 20 minutes and hub-and-spoke network deployment has grown.
Synonyms: Pulse Transfer, Positive Transfer
Timed Transfer: A transfer made easier and more certain for passengers by the process of scheduling two or more routes to meet at a given location at a specific time. A short layover may be provided at the timed transfer point to ensure that connections can be made even if one vehicle is running slightly behind schedule. Timed transfers have become more important with the growth of hub-and-spoke network designs. Also known as a “pulse transfer.”
282
Timepoint: A designated location and time that a bus or LR vehicle can arrive before but not leave earlier than the stated time, as indicated in the route schedule.
Timetable: A document containing route and time information produced for use by riders.
Total Miles: The total number of miles a vehicle travels, including revenue, deadhead, and yard (maintenance and servicing) miles. Traffic Check: A generic term used to describe any technique to collect ridership and time-related data. Point checks and ride checks can also be referred to as traffic checks. Traffic Checkers: Individuals that conduct ride checks or point checks to collect ridership and time-related data. Train: See Block Train Block: The series of trips operated by each train from the time it pulls out to the time it pulls in. A complete block includes a pull-out trip from the yard, followed by one or (usually) more revenue trips, and concluding with a pull-in trip back to the yard. Transfer: Occurs when a passenger must change buses in order to complete their trip. Transfer Center: A fixed location to facilitate passenger connections from one route or vehicle to another. Bus schedules are often coordinated at transit centers to minimize transfer times between certain routes. Synonyms: Transfer Center, Pulse Center, Hub, Transit Hub, Node.
283
Transit Center: A fixed location where passengers transfer from one route to another.
Transit Terminal: A facility where transit passengers board or alight transit vehicles, wait to board, or purchase tickets. The facility usually includes other passenger amenities such as shelters, benches, bike racks, restrooms, and kiosks with schedules and maps. Synonyms: Transit Station, Transit Center, Terminal Travel Time: The time that an operator travels between the garage and a relief point.
Synonyms: Relief Time, Travel Allowance, Relief Allowance, Paid Relief
Transfer Window: The layover time scheduled at timed transfer locations to ensure that transfer connections can be made, and may also refer to the amount of time past its scheduled departure time that a vehicle can be held at a transfer location to wait for a late-arriving vehicle. Trip: The one-way operation of a revenue vehicle, between two end points on a route. Trips are usually noted as inbound, outbound, eastbound, westbound, etc., to identify directionality.
Synonyms: Journey, One-Way Trip
Trip Sheet: See Paddle and Headway Sheet Tripper: A short piece of work whose total time is less than that specified as constituting a full-time run. A tripper is often a piece of work in the AM or PM peak period that cannot be combined with another piece of work to form a split run because of insufficient hours, excessive swing time, or excessive spread time. Trippers are often operated by extraboard or part-time operators. Tripper can also refer to a vehicle that pulls out, makes no more than one round-trip, and pulls in.
284
Synonyms: Part-Time Run
Trolley bus: An electrically powered bus. The power is transmitted through a system of overhead wires. Trunk: The common portion of a route with branches; more broadly, a section of a corridor served by multiple routes or trip types. Turnback: The location where a short turn trip turns around to begin service in the opposite direction. Sometimes used to refer to the short turn trip itself. Two-Piece Run: A run made up of two pieces of work separated by an interval of time. The pieces will usually be on different blocks and may be on different routes. Two-Piece Straight: See Straight Run U
Unlinked Passenger Trips: The number of passengers that board public transportation vehicles. Passengers are counted each time they board a vehicle, no matter how many vehicles they use to travel from their origin to their destination.
V
Variable Cost: A cost that varies in relation to the level of operational activity.
Variant: A series of stops that describe a unique path. See “Service Pattern.” A service pattern follows one or more variants. Vehicle Hours: The hours traveled by a vehicle, including revenue service, layover time, and deadhead travel. Also known as “bus hours” for bus and “car hours” for rail.
285
Vehicle Miles: The miles traveled by a vehicle. It includes both revenue and deadhead travel. Vehicles in Operation Graph: A graphical representation of the number of vehicles in operation by time of day, typically by route, but also by garage or system. See also Service Curve. W
Work Hours: The total hours worked by an operator, not including fringe benefit hours such as sick leave, holiday, etc. Work hours include only labor hours associated with the requirements of putting the runs in service and operating the service. X
Y
Yard: The rail equivalent of a “garage,” where the rail vehicles are stored and maintained. Yard balancing: The process of ensuring that the number of train cars pulling into a specific yard at the end of the service day equals the number that pulled out at the beginning of the service day. On rail lines served by more than one yard, the same vehicles do not necessarily return to the same yard. Only the count in each yard must be the same at the end of the day as the beginning. Z
Zone: A defined geographic area used to determine passenger fares. Zones are also used in demand-responsive service for dispatching purposes.

286
Zone Fares: A system of fares where the service area is divided into zones and specified rates apply. Fares are determined according to the number of zones traveled.

287
288