transit signal priority (tsp): a planning and implementation
TRANSCRIPT

Transit Signal Priority (TSP):
A Planning and Implementation Handbook
TransitSignal
Priority
May 2005 Y Funded by the United States Department of Transportation
Prepared by:
Harriet R. SmithBrendon Hemily, PhDMiomir Ivanovic, Gannett Fleming, Inc.

Transit Signal Priority (TSP):
A Planning and Implementation Handbook
May 2005
Funded by the United States Department of Transportation
Prepared by:
Harriet R. Smith
Brendon Hemily, PhD
Miomir Ivanovic, Gannett Fleming, Inc.

The authors would like to thank a long list ofprofessionals who have made this documentpossible. Volunteers from the transportationindustry (both traffic and transit) have:
Y Made presentations and worked with partici-
pants in hands-on workshops that brought out
valuable information
Y Provided detailed information in writing and
through interviews to help create the case
studies
Y Reviewed the document several times and pro-
vided detailed comments and/or
Y Actively participated in long conference calls
with the authors and other professionals debat-
ing issues and revisions to the document
Industry Volunteers
Ronald Atherley, King County (Seattle) Departmentof Transportation, Washington
Michael Baltes, Mitretek Systems formerly Centerfor Urban Transportation Research (CUTR)
Thomas Bauer, PTV America, Inc.
James A. Bunch, Mitretek Systems
John Collura, UMass/Amherst formerly VaTech
James Dale, PTV America, Inc.
William B. Finger, Charlotte Department ofTransportation, North Carolina
Rex Gephart, Los Angeles County MetropolitanTransportation Authority
Doug Hansen, Fairfax County, Virginia
Dennis Hinebaugh, Center for Urban TransportationResearch (CUTR)
Bob Huffman, PACE, Chicago area, Illinois
James T. Jarzab, Santa Clara Valley TransportationAuthority, California
Peter Koonce, Kittelson & Associates, Inc.
Chris Larson, City of Tacoma (Washington) PublicWorks
Duana Love, Regional Transportation Authority, Chicago, Illinois
Jamie Lu, 3M Traffic Safety Systems Division
Jon Lutterman, TriMet, Portland, Oregon
Doug Maas, County of Sacramento, California
Kathy Meyerkord, Civiltech
Taqhi Mohammed, PACE, Chicago area, Illinois
Richard J. Montanez, City of Philadelphia,Pennsylvania
Kornel Mucsi, City of Ottawa
Paul Powell, 3M Traffic Safety Systems Division
Eric Phillips, Pierce Transit, Tacoma, Washington
Cesar Pujol, AC Transit, Oakland, California
Willie Rotich, City of Portland, Oregon
Bob Sheehan, Virginia Department of Transportation
Jim Sinikas, Toronto Transit Commission
Sean Skehan, Los Angeles Department of Transportation, California
Gloria Stoppenhagen, PBS&J
Sonja Sun, California Department of Transportation
John Toone, King County (Seattle) Department ofTransportation, Washington
Jon Twichell, AC Transit, Oakland, California
Hansel Wang, TransLink, Vancouver, BritishColumbia
Joe Weesner, H.W. Lochner, Inc.
Wei-Bin Zhang, California PATH
We thank Steve Kuciemba (ITS America) for his
patient and positive support and accommodating
management of the project from start to finish.
The U.S. Department of Transportation financed the
entire TSP project including workshops, case stud-
ies, and all document development. The authors
would like to thank Sean Ricketson (Federal Transit
Administration) for his support and presentations;
Yehuda Gross (Joint Program Office) for providing
invaluable oversight and making the project possible
through financing; and Brian Cronin (Federal Transit
Administration) for his unsurpassed professional
guidance and leadership, and unfailing ability to
understand the transportation industry’s needs and
to advocate for improvements.
ii Y Transit Signal Priority Handbook
AcknowledgementsAcknowledgements

EXECUTIVE SUMMARY vii
PART I: TSP PLANNING & IMPLEMENTATION
1 INTRODUCTION 31.1 Objectives 31.2 Audience 4
2 BACKGROUND ON TRANSIT SIGNAL PRIORITY (TSP) 42.1 What is TSP and What are its Objectives? 42.2 TSP Benefits and Costs 52.3 Key Components of TSP System 62.4 Potential TSP Control Strategies 7
2.4.1 Passive Priority 72.4.2 Active Priority 72.4.3 TSP Operating in Real-Time 8
2.4.3.1 TSP with Adaptive Signal Control Systems 82.4.3.2 Adaptive Signal Priority 9
3 A SYSTEMS ENGINEERING APPROACH TO TSP 93.1 Systems Engineering Approach 93.2 Simplified Process for TSP at Isolated Intersections 9
4 TSP PROJECT PLANNING 104.1 Introduction to TSP Project Planning 10
4.1.1 Regional and Corporate Goals 114.1.2 TSP as it Relates to the Regional ITS Architecture and Other
Transit ITS Projects 134.1.3 Regional and National ITS Architecture Conformity 134.1.4 Standards (NTCIP and TCIP) 134.1.5 Relations between Transit and Traffic Staff 154.1.6 Traffic Engineering Support 15
4.2 TSP Project Planning 164.2.1 Needs Assessment [Why TSP?] 16
4.2.1.1 Potential Benefits: Traffic Signal Delay and its Impact on Transit TravelTimes and Reliability 16
4.2.1.2 Transit and Traffic Data Collection 174.2.1.3 TSP Project/Program Costs - Preliminary Assessment 174.2.1.4 TSP Project/Program – Needs Assessment and Business Case 18
4.2.2 Stakeholders: Roles and Responsibilities [Who is to be involved?] 184.2.2.1 Identifying Stakeholders 184.2.2.2 Managing Stakeholders 194.2.2.3 Project Management 20
4.2.3 Concept of Operations (ConOps) and Requirements Document [What will TSP do?] 20
4.2.3.1 TSP Project Goals, Objectives, and Vision 204.2.3.2 Measures of Effectiveness (MOE) Resulting from Objectives 21
Transit Signal Priority Handbook Y iii
Table of ContentsTable of Contents

4.2.3.3 TSP Concept of Operations (ConOps) 224.2.3.4 Requirements Document 25
4.2.4 Corridors and Intersections [Where will TSP be implemented?] 264.2.5 Technology Alternatives Analysis and System Architecture
[How will TSP work?] 274.2.5.1 Definition of TSP System Architecture 274.2.5.2 TSP Technology Alternatives Analysis 27
5 TSP PROJECT DESIGN 285.1 Detailed Data Collection and Inventory of Traffic Control System 285.2 Detailed Design and Engineering for Central Control and
Communications Systems Components 295.3 Detailed Design and Engineering by Intersection 295.4 Detailed Design and Engineering of On-Board Equipment 295.5 Optimization and Preparation of Timing Plans 305.6 Use of Micro-Simulation Model to Design TSP Control Strategy in
Special Cases 305.7 Special Considerations 30
5.7.1 Developing and Deploying New or Enhanced TSP Technologies 305.7.2 Integration with Planned Transit
ITS Project 305.7.3 Integration with EMS Pre-emption 31
6 TSP PROJECT IMPLEMENTATION 316.1 Procurement 31
6.1.1 Project Management – Procurement and Deployment 316.1.2 Procurement Strategy 316.1.3 Preparation of RFP’s and/or Bids (procurement documents) 326.1.4 Vendor Selection Process 33
6.2 Installation 346.2.1 Equipment Installation 34
6.2.1.1 Installation of Bus Equipment 346.2.1.2 Installation of Field Equipment 34
6.2.2 Training 356.2.3 Internal Communications 356.2.4 Publicity 36
6.3 Verification and Validation 366.3.1 Testing of Equipment 366.3.2 Testing of System 366.3.3 Validation of Detection Distances and Accuracy 36
7 OPERATIONS AND MAINTENANCE 367.1 Ongoing Performance Monitoring and Management 367.2 Procedures to Ensure System is Operating 377.3 Maintenance 38
8 EVALUATION, VERIFICATION, VALIDATION AND BUILDING ON TSP 388.1 Evaluation Study 388.2 Ongoing Data Collection 398.3 Building on TSP Benefits through Transit Scheduling 408.4 Fine-Tuning TSP Design 40
iv Y Transit Signal Priority Handbook

Transit Signal Priority Handbook Y v
9 KEYS TO SUCCESS 41
PART II – STATE OF THE PRACTICE 45
10 SURVEY ON TSP STATE OF THE PRACTICE 4510.1 Introduction 45
10.1.1 Identification of Agencies/Cities with TSP and Emergency Vehicle Pre-emption 45
10.1.2 Inventory and Classification of TSP Systems 4510.2 Summary of Findings on State of the Practice 48
10.2.1 General Findings 4810.2.1.1 Type of Transit Application 4810.2.1.2 Year of Deployment 48
10.2.2 Route Characteristics of TSP Applications 4910.2.2.1 Route Type 4910.2.2.2 Number of Routes 4910.2.2.3 Number of Signalized Intersections 5010.2.2.4 Location of Bus Stops 5010.2.2.5 Peak Hour Headways 50
10.2.3 Hardware for TSP Deployments 5010.2.3.1 Traffic Signal Controllers 5010.2.3.2 Vehicle Detection Systems 50
10.2.4 Software for TSP Deployments 5010.2.5 TSP Strategies 5310.2.6 Challenges and Lessons Learned 54
10.2.6.1 Use of Existing Signal Controller Systems 5410.2.6.2 Coordination with Traffic Engineers 5410.2.6.3 Measures of Success 5410.2.6.4 Traffic Signal Warrants for Busways 54
11 CASE STUDIES SUMMARY 54
12 FUTURE DIRECTIONS 55
PART III – TECHNICAL SUPPORT 59
13 TSP SYSTEM ARCHITECTURE, EQUIPMENT, SOFTWARE, ANDCOMMUNICATIONS 5913.1 TSP System Architecture 60
13.1.1 Priority Request Generator 6113.1.2 Communications System 6113.1.3 Traffic Signal Control System 61
13.2 Traffic Control System Components and TSP 6213.2.1 Traffic Signal Controller Hardware 62
13.2.1.1 Electromechanical Controllers 6313.2.1.2 NEMA Controllers 6313.2.1.3 Type 170 Controllers 6313.2.1.4 Advanced Transportation Controllers 63
13.2.2 Traffic Signal Controller Software (with TSP functionality) 6413.2.2.1 Software for NEMA Controllers 6413.2.2.2 Software for Type 170 and 2070 Controllers 64
13.2.3 Transit Vehicle Detection Systems 66

13.2.3.1 Hard-wired loop Detection 6713.2.3.2 Light-based (infrared) Detection 6713.2.3.3 Sound-based Detection 6813.2.3.4 Radio-based Detection 6813.2.3.5 Satellite (GPS)-based Detection 68
13.2.4 Communications Systems 69
14 TRAFFIC ENGINEERING TERMINOLOGY 7014.1 Key Traffic Engineering and TSP-Related Concepts 70
14.1.1 General Traffic Engineering Terminology 7014.1.2 Traffic Signal Timing Terminology 7214.1.3 Signal Coordination Terminology 73
14.2 Basic TSP Terminology 7414.3 Key Traffic Engineering and TSP Concepts 75
14.3.1 Coordinated vs. Free Operations 7514.3.2 Cycle Lengths 7614.3.3 Phasing (Two-Phase vs. Multi-Phase Signals) 7614.3.4 Splits 7714.3.5 Pedestrian Timing 77
14.4 Transit Signal Priority Examples 77
15 SIMULATION AND OPTIMIZATION TOOLS FOR TSP 8015.1 Introduction 8015.2 Simulation 80
15.2.1 What Is Simulation? 8015.2.2 The Need for Simulation 8015.2.3 How to Conduct a Simulation 81
15.2.3.1 Selecting a Model 8115.2.3.2 Collecting Data 8315.2.3.3 Developing the Network for Simulation 8315.2.3.4 Warm up time 8515.2.3.5 Number of simulation runs 8515.2.3.6 Analyzing the outputs 85
15.3 Optimization 8615.3.1 What Is Optimization? 8615.3.2 The Need for Optimization 8615.3.3 How to Conduct an Optimization of Traffic Signals 86
15.4 Summary 87
16 TRANSIT TERMINOLOGY 88
17 REFERENCES FOR PART III 93
APPENDICES 97A1 Resources 97A2 Glossary 98A3 Case Study Details 100A4 Transit Signal Priority (TSP) Survey Forms 173
vi Y Transit Signal Priority Handbook

Introduction
Our streets and highways are getting more congested as the population grows and more carsenter the transportation system. It is in the best interest of all to improve public transit serviceso that more travelers will utilize transit freeing up space on our streets, diminishing our depend-ence on fossil fuels, and improving air quality.
Transit Signal Priority (TSP) is a tool that can be used to help make transit service more reliable,faster, and more cost effective. TSP has little impact on general traffic and is an inexpensive wayto make transit more competitive with the automobile. It is used extensively in other parts ofthe world, and is rapidly becoming more popular in the United States.
The U.S. Department of Transportation (U.S. DOT) has made it easier to choose TSP by financingworkshops and documents to educate traffic engineers and transit planners on TSP implementa-tion. This handbook is one of a series of documents created for that purpose. The first, entitledOverview of Transit Signal Priority, was a multi-year effort and was written entirely by volunteersunder the leadership of ITS America. The volunteer authors included one traffic engineer andone transit planner for each chapter. Because it was co-authored by transit and traffic engineers,it was a ground-breaking effort that represented a new level of cooperation and consensus con-cerning the benefits of implementing TSP.
Capitalizing on the momentum created by the document, U.S. DOT financed a series of work-shops to identify further research and educational needs and to reach out to the transportationcommunity. Practitioners shared their experiences and worked with workshop participants toanswer questions and build action plans for the participants’ own communities.
The Overview of Transit Signal Priority was updated and expanded with information gatheredfrom the workshops. The revised Overview of Transit Signal Priority was published in 2004 andis available on the ITS America Web site at http://www.itsa.org/tsp.html.
This handbook goes deeper into TSP and provides technical guidance. It does not repeat every-thing in the overview and is meant to be a companion document. The overview is a high-leveldocument that explains what TSP is, why it is important, what the benefits are, and the impor-tant issues surrounding the topic. The handbook contains the steps one should follow to imple-ment a successful TSP project. It relies heavily on eight case studies in which a great deal ofinformation was gathered on topics related to planning, design, implementation, evaluation,technology, institutional issues, public reaction, and much more.
TSP projects are often complex enough to require professional engineering assistance. Thishandbook will help the public sector project manager provide better oversight. It explains a sys-tems engineering approach with a logical sequence of steps that should be followed. It edu-cates the reader on the inestimable benefits of working closely with stakeholders from day oneto avoid problems later on. It equips the reader with vocabulary to communicate with both the
Executive SummaryExecutive Summary
PART I | TSP PLANNING AND IMPLEMENTATION EEXX
EECC
UUTTII
VVEE
SSUU
MMMM
AARR
YY
Transit Signal Priority Handbook Y vii

transit and the traffic community. The handbook is a tool to help you navigate through a TSP proj-ect. Refer to it often. It is hoped that you will find in it the information you need to move youand your region toward TSP implementation.
Objectives
This handbook, prepared for the U.S. DOT, has four objectives:
Y To outline a comprehensive process for planning and implementing TSP, based on a systemsengineering approach, that identifies many of the issues that may need to be addressed in aTSP project
Y To provide more extensive information on the current state of the practice of TSP in NorthAmerica
Y To document a number of case studies of communities that have implemented TSP in orderto highlight the variety of issues that arise and solutions that have been developed
Y To provide a number of resources to those interested in TSP, including primers on traffic con-trol equipment and systems, on key concepts (e.g. simulation and optimization), as well ason traffic engineering and transit terminology, to assist transit planners and traffic engineersin understanding one another
Background on Transit Signal Priority (TSP)
TSP is an operational strategy that facilitates the movement of transit vehicles (usually those in-service), either buses or streetcars, through traffic-signal controlled intersections. Objectives ofTSP include improved schedule adherence and improved transit travel time efficiency while mini-mizing impacts to normal traffic operations.
Examples of measured benefits:
Y In Tacoma, Washington the combination of TSP and signal optimization reduced transit signaldelay about 40% in two corridors.
Y TriMet (Portland, Oregon) was able to avoid adding one more bus by using TSP and experi-enced a 10% improvement in travel time and up to a 19% reduction in travel time variability.Due to increased reliability, TriMet has been able to reduce scheduled recovery time.
Y In Chicago, PACE buses realized an average of 15% reduction (three minutes) in runningtime. Actual running time reductions varied from 7% to 20% depending on the time of day.
Y With the implementation of TSP and through more efficient run cutting, Pace (Chicago) wasable to realize a savings of one weekday bus while maintaining the same frequency of service.
Y Los Angeles experienced up to 25% reduction in bus travel times with TSP.
TSP is made up of four components. There is (1) a detection system that lets the TSP systemknow where the vehicle requesting signal priority is located. The detection system communi-cates with a (2) priority request generator that alerts the traffic control system that the vehiclewould like to receive priority. There is software that processes the request and decides whetherand how to grant priority based on the programmed (3) priority control strategies. And there issoftware that (4) manages the system, collects data, and generates reports.
There are a variety of technical approaches that can be used as control strategies. This hand-book provides information on the control strategies.
viii Y Transit Signal Priority Handbook
EEXX
EECC
UUTTII
VVEE
SSUU
MMMM
AARR
YY
A Systems Engineering Approach to TSP
This handbook encourages a systems engineering approach to implementing TSP. The stepsinclude:
Y PlanningY DesignY ImplementationY Operations and MaintenanceY Evaluation, Verification, Validation and Building on TSP
This is a logical approach that is essential for a successful engineering project. The processshould proceed from plan to design and address operations and maintenance issues as part ofthe implementation. Evaluation helps to monitor results against objectives, and to subsequentlyrefine the system. However, in complex projects is it easy to get lost in details and forgetessential steps. Forgetting steps leads to cost overruns, miscommunications, and failed proj-ects. Project managers who follow and communicate a clear systems engineering approach canstay on target and avoid unpleasant surprises. Each of the steps is discussed in the handbook.
Planning
TSP planning does not happen in a vacuum. TSP should be a response to a problem (such asbuses experiencing delay at traffic signals) and should be consistent with regional and corporategoals (such as increased mobility). A TSP project is often the first opportunity to form a goodworking relationship between transit and traffic staff. It requires support from the traffic engi-neering office and the transit agency. One of the most important elements of the planningprocess is early identification and involvement of stakeholders. Stakeholders (internal and exter-nal to the transit agency) can provide support or create road-blocks. Good management willhelp lead to support.
During the planning process the stakeholders will identify project goals, and create a Concept ofOperations (ConOps) which will help all partners understand and agree on what TSP will be ableto do and how it should function.
Design
Project design will begin after a thorough planning process and will continue to involve stake-holders. The design will begin with data collection and will include a detailed design and engi-neering of each intersection and related road-side equipment; design and engineering of on-board equipment; optimization and preparation of signal timing plans; and perhaps modeling.
Implementation
Procurement is the first step of TSP project implementation. Most TSP procurements are handledthrough the RFP process. This handbook outlines a long list of elements that should be included inthe RFP. After the vendors respond to the RFP and a selection is made, installation begins.
Transit Signal Priority Handbook Y ix
EEXX
EECC
UUTTII
VVEE
SSUU
MMMM
AARR
YY

Installation
Installation involves managerial and technical staffs in various departments of the traffic engi-neering agency and the transit agency. A high level of cooperation is needed because mostpeople are understandably uneasy about allowing others access to equipment for which they areresponsible. If good relationships have been built among stakeholders through the planningprocess, equipment installation will go more smoothly. After equipment is tested and validatedthe system will be ready to "go live."
Operations and Maintenance
Most practitioners have found that operations and maintenance (O&M) of TSP has not been bur-densome. Signal technicians add the on-street TSP technology to their maintenance program andthe bus maintenance personnel add the on-vehicle equipment to their normal O&M. However, itis important that all impacted organizations have written agreements on who maintains (andupgrades) what equipment and software.
Lessons Learned from PractitionersY Early stakeholder involvement is critical.Y Good communication among the stakeholders is important.Y One or more champions are needed to move the project forward.Y Demonstrations and pilot projects help test the TSP and build trust for full implemen
tations.Y Good before and after studies can produce convincing evidence of benefits.Y Pitching the right ideas from the beginning can help ensure success.Y Interjurisdictional partnerships will help with coordination and implementation.Y It is important to keep the momentum going even when problems surface.Y Standardizing equipment will save time and money in the long run.Y Keep the project simple _ especially in the beginning.Y It helps to remember to keep TSP objectives simple and build incrementally.
A survey was conducted of TSP systems in North America with 24 agencies responding to fullinterviews. The interviews consisted of a standard questionnaire regarding the physical andoperational characteristics of the transit route; the technical details of the traffic signal con-trollers, TSP software and vehicle detection systems; and other questions about the generaldetails of the deployments (year deployed, number of signalized intersections, etc.).
The survey of the remaining 24 agencies demonstrates a wide variety of TSP applications.Several of the agencies indicated the use of very sophisticated TSP applications with advancedTSP hardware and software that utilize more sophisticated TSP strategies. At the same time,there are other agencies that are using TSP1 in targeted applications. Additionally, three agenciesreported the use of traffic signal pre-emption (rather than priority) strategies with their Light RailTransit (LRT) and bus systems. Several agencies reported one or more routes/corridors with TSPsystems currently in the deployment process that are not yet operational. The findings along withtechnical information about hardware and software are detailed in this document.
x Y Transit Signal Priority Handbook
EEXX
EECC
UUTTII
VVEE
SSUU
MMMM
AARR
YY
PART II | STATE OF THE PRACTICE
1 Preemption requires terminating normal traffic control to provide the service needs of a special task such as a fire truck or railroad crossing.

Transit Signal Priority Handbook Y xi
EEXX
EECC
UUTTII
VVEE
SSUU
MMMM
AARR
YY
Eight in-depth case studies were conducted in systems around North America. The systemsranged in size, application, and geographic location. Size varied from 15 to 654 intersections andfrom 12 to 1,400 buses. Some systems were centralized, some decentralized, and some distrib-uted. Various methods were used for detection and communications. Two are integrated with AVLand five have some integration with Emergency Pre-emption. Costs for implementation and O&Mvaried and benefits were noted. All stated that the non-priority street impact was negligible.
This section includes a wide range of technical information to assist transit and traffic agency
staff planning TSP, including information about: TSP system architecture; traffic signal controlequipment and software; and detection systems; communications systems.
Sections on traffic engineering terminology and key concepts are designed to help the transitplanner understand and communicate better with traffic engineers. And a section on transit ter-minology is designed to help the traffic engineer communicate better with the transit planner.
Simulation and Optimization Tools for TSP
Some practitioners are strong proponents of using computer simulation to study and understandTSP before implementing it in the field. All agree that TSP works best when signal timing isoptimized. One of the primary problems with the existing signal timing models is that they aredesigned solely for vehicular traffic rather than transit, pedestrians or freight. The implementa-tion of TSP is an additional level of complexity that requires additional understanding of the sig-nal controller’s logic and even modification in some cases. Traffic simulation models provide anopportunity to assess the impact of transit signal priority. This document gives the reader a briefoverview of these tools.
In the appendices the reader will find a list of resources; a glossary; a full reporting of the eightcase studies, and the detailed TSP survey forms.
APPENDICES
PART III | TECHNICAL SUPPORT

Part I: Transit Signal
Priority (TSP) gives transit
vehicles a little extra green
time or a little less red time
at traffic signals to reduce
the time they are slowed
down by traffic signals. It is
a cost-effective method to
enhance regional mobility
by improving transit travel
times and reliability.
Part1

TSP Planning & Implementation
Transit Signal Priority (TSP) gives transit vehicles a lit-
tle extra green time or a little less red time at traffic
signals to reduce the time they are slowed down by
traffic signals. It is a cost-effective method to
enhance regional mobility by improving transit travel
times and reliability, thereby increasing the attractive-
ness of transit as an alternative to single-occupant vehi-
cle travel. Its use is common in Europe, and is rapidly
growing across North America. The growing interest in
TSP led to the publishing of a document entitled, An
Overview of Transit Signal Priority, which was a joint
effort of the Advanced Traffic Management Systems
Committee and the Advanced Public Transportation
Systems Committee of the Intelligent Transportation
Society of America (ITS America). Through the spon-
sorship of the U.S. Department of Transportation’s Joint
Program Office and Federal Transit Administration, dis-
semination concerning TSP was enhanced through the
organization of several regional workshops and the
updating of the overview document.
An Overview of Transit Signal Priority, available at
http://www.itsa.org/tsp.html, provides a high-level
introductory guide to implementing TSP and is a
companion document to this handbook. While the
overview does not have all the information one
would need before embarking on a TSP project, it
enables the reader to establish a basis of relevant
knowledge and raises an awareness of many of the
issues surrounding TSP planning, implementation
and operation. It is intended as a first step for poli-
cymakers, managers, and technical staff with an
interest in TSP.
Discussions among experts and interested parties
identified a pressing need to assemble a more tech-
nically-oriented handbook, based on best available
information and practices, to assist technical staff in
the planning and implementing of a TSP project in
their own community.
This handbook, prepared for the U.S. DOT, has
four objectives:
Y To outline a comprehensive process for plan-
ning and implementing TSP, based on a
systems engineering approach, that identifies
many of the issues that may need to be
addressed in a TSP project
Y To provide more extensive information on the
current state of the practice of TSP in North
America
Y To document a number of case studies of com-
munities that have implemented TSP in order to
highlight the variety of issues that arise and
solutions that have been developed
Y To provide a number of resources to those
interested in TSP, including primers on traffic
control equipment and systems, on key con-
cepts (e.g. simulation and optimization), as well
as on traffic engineering and transit terminolo-
gy, to assist transit planners and traffic
engineers in understanding one another
TSP can range from simple applications to very
complex multi-technology and multi-jurisdictional
programs. This handbook does not provide all of
the technical solutions to actually carry out a do-it-
yourself TSP project. An array of various kinds of
technical expertise is needed to plan and deploy
sophisticated technological solutions for integrating
the simultaneous requirements of both transit and
traffic engineering. However, the handbook does
provide, based on best existing practice, extensive
insight into the steps required and the issues that
may need to be addressed during the planning and
implementation of a TSP project or program.
Transit Signal Priority Handbook Y 3
TSP Planning & Implementation
PPAA
RRTT
II
INTRODUCTION
Objectives
1

1.2 Audience
This paper draws upon the existing body of knowl-
edge embodied in the experiences and perspectives
of practitioners. Anyone interested in TSP is encour-
aged to read the previously mentioned document,
An Overview of Transit Signal Priority, to obtain an
initial understanding of TSP. This handbook is intend-
ed for the more technically-oriented transit and traf-
fic engineering management and staff members
who wish to gain insight into the experiences with
TSP in order to prepare for the planning and imple-
mentation of a TSP project or program.
TSP involves the development of a technical solu-
tion that includes both transit vehicles and systems,
and traffic control equipment and their respective
systems. In order to succeed, TSP must involve a
partnership of transit and traffic engineering staff,
and this document provides balanced information to
both the transit and traffic engineering communities
in order to enhance their knowledge about the pos-
sible benefits, alternative approaches, and issues
concerning TSP. This broader knowledge will
encourage better understanding among these com-
munities and more effective TSP initiatives.
BACKGROUND ON TRANSITSIGNAL PRIORITY (TSP)
2.1 What is TSP and What Are its Objectives?
TSP is an operational strategy that facilitates the
movement of transit vehicles (usually those in-serv-
ice), either buses or streetcars, through traffic-signal
controlled intersections. Although signal priority
and signal pre-emption are often used synonymous-
ly, they are in fact different processes. While they
may utilize similar equipment, signal priority modi-
fies the normal signal operation process to better
accommodate transit vehicles, while pre-emption
interrupts the normal process for special events
such as an approaching train or responding fire
4 Y Transit Signal Priority Handbook
Preemption: Per NTCIP 1202 Version 2, the transfer of the nor-
mal control (operation) of traffic signals to a special signal control
mode for the putttrpose of servicing railroad crossings, emergency
vehicle passage, mass transit vehicle passage, and other special
tasks, the control of which requires terminating normal traffic
control to provide the service needs of the special task.
Priority: The preferential treatment of one vehicle class (such as a
transit vehicle, emergency service vehicle or a commercial fleet
vehicle) over another vehicle class at a signalized intersection with-
out causing the traffic signal controllers to drop from coordinated
operations. Priority may be accomplished by a number of methods
including the beginning and end times of greens on identified
phases, the phase sequence, inclusion of special phases, without
interrupting the general timing relationship between specific green
indications at adjacent intersections.
NTCIP2 STANDARDS DEFINE TRAFFIC SIGNALPREEMPTION AND PRIORITY AS FOLLOWS:
PPAA
RRTT
II
2 National Transportation Communications for Intelligent Transportation Systems Protocol (NTCIP)
USING THIS DOCUMENT:HOW TO AVOID BEING OVERWHELMED
This handbook is a reference that contains a
large collection of information for a diverse
audience. It is divided into three parts.
Part I – TSP Implementation – This part out-
lines the steps needed to implement a suc-
cessful TSP project. It is based on a sys-
tems engineering approach which is
straightforward and logical.
Part II – State of the Practice – This part
describes what is actually in the field.
Most of the information was gathered
through extensive surveys and interviews.
Part III – Technical Assistance – This part pro-
vides good background information on
traffic control equipment and software, and
pertinent traffic and transit terminology.
The appendices contain a variety of valuable
resources including:
Y References
Y Glossary
Y Full case studies and surveys outlining TSP
experience from across North America.
Throughout the document you will find boxes
containing Key Questions. We hope these
boxes will add to your knowledge base and will
help you on your way to TSP implementation.
2

Transit Signal Priority Handbook Y 5
PPAA
RRTT
II
WHAT ARE THE QUANTIFIABLE BENEFITS OF TSP?
There are many. Case studies revealed the following:
Y In Tacoma, WA the combination of TSP and signal optimization reduced transit signal delay about
40% in two corridors.
Y TriMet (Portland, OR) was able to avoid adding one more bus by using TSP and experienced a 10%
improvement in travel time and up to a 19% reduction in travel time variability. Due to increased reli-
ability, TriMet has been able to reduce scheduled recovery time.
Y In Chicago PACE buses realized an average of 15% reduction (3 minutes) in running time. Actual
running time reductions varied from 7 to 20% depending on the time of day.
Y With the implementation of TSP and through more efficient run cutting, Pace (Chicago) was able to
realize a savings of one weekday bus while maintaining the same frequency of service.
Y Los Angeles experienced up to 25% reduction in bus travel times with TSP.
HOW DO WE DEAL WITH POTENTIAL DISRUPTION OF TRAFFIC AND SYNCHRONIZATION?
Most agencies will not grant TSP at the same intersection in which TSP has just been granted until the sig-
nals are back in synchronization. That usually takes one or two cycles. Some agencies report that synchro-
nization is never disrupted because TSP steals a small number of seconds from the non-priority street green
and therefore stays in sync with the corridor.
It was uniformly reported that the impact to the non-priority street flow was extremely small or imperceptible.
The number of seconds taken from non-priority street green is so small, it is rarely noticed.
engine. Objectives of emergency vehicle pre-emp-
tion include reducing response time to emergen-
cies, improving safety and stress levels of emer-
gency vehicle personnel, and reducing accidents
involving emergency vehicles at intersections. Light
rail systems are also often equipped with pre-emp-
tion at grade crossings or intersections to reduce
accidents. On the other hand, objectives of TSP
include improved schedule adherence and improved
transit travel time efficiency while minimizing
impacts to normal traffic operations.
2.2 TSP Benefits and Costs
Expected benefits of TSP vary depending on the
application, but include improved schedule adher-
ence and reliability and reduced travel time for
buses, leading to increased transit quality of serv-
ice. Potential negative impacts consist primarily of
delays to non-priority traffic, and these delays have
proven to be minimal. Experiences from prior
deployments generally indicate bus travel time sav-
ings on the order of 15% (depending on the exiting
signal delay) with very minor impacts on the overall
intersection operations. However, substantial vari-
ability exists in the nature of deployments and mag-
nitude of impacts. At the end of this Handbook
there are a number of case studies which demon-
strate the commonalities and differences in TSP
deployments. Costs are dependent on the configu-
ration of the system, with somewhat higher costs
associated with signal upgrades, equipment/soft-
ware for the intersection, vehicles, or the central
Key Questions:

management system. Many TSP systems have
been implemented without costly upgrades.
Because costs can be substantially affected by the
desired functionality, comparisons with other TSP
systems with different capabilities should be con-
sidered with caution.
Given these excellent benefits, one might wonder
about potential detriments. Does TSP cause prob-
lems and disruptions? That, in fact, is a key question,
especially for traffic engineers who are rightly con-
cerned about potential negative impacts on the traffic
system. TSP deployments from around the country
report uniformly that there is very little disruption to
traffic flow. In fact, because so many cities included
signal re-timing in their TSP projects, traffic flow
became smoother and delays were reduced.
2.3 Key Components of TSP System
TSP systems may involve the interaction of four
major elements, the transit vehicle, transit fleet man-
agement, traffic control, and traffic control manage-
ment. These four sub-systems are then enhanced
with four functional applications of vehicle detection,
priority request generation (PRG), priority request
server (PRS), and TSP control. Or more specifically:
Y Detection - A system to deliver vehicle data,
(location, arrival time, approach, etc.) to a device
that is routed to a Priority Request Generator.
Y Priority Request Generator/Server - A system
to request priority from the traffic control sys-
tem and triage multiple requests as necessary.
Y Priority Control Strategies - A traffic control sys-
tem software enhancement (ideally more ver-
satile than pre-emption) that provides a range
6 Y Transit Signal Priority Handbook
The general steps involved in providingpriority are as follows:
Y The bus approaching the intersection is detect-
ed at some point Pd upstream of the intersec-
tion (various detection methods exist).
Y The Priority Request Generator unit is notified
of the approaching bus and alerts the traffic
control system that the vehicle would like to
receive priority. The system processes the
request and decides whether to grant priority
based on defined conditions. The traffic con-
troller C then initiates action to provide priority
based on the defined priority control strategies.
Typically, if the intersection signals are already
displaying a green phase for the approach being
used by the bus, the controller will extend the
length of the green phase to enable the bus to
pass through the intersection on that phase. If
the intersection signals are displaying a red
phase on the bus approach, the controller will
shorten the green phase on the cross street
(e.g., truncate the red phase) to provide an ear-
lier green phase for the bus approach.
Y When the bus passes through the intersection,
clearance is detected by the bus detection sys-
tem Pc and a communication is sent to the
traffic controller that the bus has cleared the
intersection.
Y On being notified that the bus has cleared the
intersection, the controller C restores the nor-
mal signal timing through a predetermined
logic.
PPAA
RRTT
II
C
PcPd
FIGURE 1:TRANSIT PRIORITY AT TRAFFIC SIGNALS – A SIMPLIFIED REPRESENTATION
Derived from O’Brien, W. “Design and Implementation of TransitPriority at Signalized Intersections: A Primer for Transit Managersand a Review of North American Experience”. Canadian UrbanTransit Association STRP Report 15, Toronto, Canada, 2000, p.31.

“TSP Control Strategies” that address the func-
tional requirements of the traffic jurisdiction.
Y TSP System Management – Incorporates both
traffic and transit TSP functions in both the tran-
sit management and traffic control manage-
ment that can configure settings, log events,
and provide reporting capabilities.
The concepts of Priority Request Generator (PRG)
and Priority Request server (PRS) and their various
configurations in a system architecture are dis-
cussed in more detail in Part III.
2.4 Potential TSP Control Strategies
Transit Signal Priority can be implemented in a vari-
ety of ways including passive, active and adaptive
priority treatments as discussed below:
2.4.1 Passive Priority
Passive priority does not require the hardware and
software investment of active and adaptive priority
treatments. Passive priority operates continuously,
regardless, based on knowledge of transit route and
ridership patterns, and does not require a transit
detection / priority request generation system. In
general, when transit operations are predictable
with a good understanding of routes, passenger
loads, schedule, and/or dwell times, passive priority
strategies can be an efficient form of TSP. One
such passive priority strategy is establishing signal
progression for transit. In this application, the sig-
nal timing plan would account for operational char-
acteristics such as the average dwell time at transit
stops, or considering that dwell times are highly
variable, use as low a cycle length as possible. For
example, in Denver the signal system uses cycle
lengths based on the travel speed of the buses on
the Denver Transit Mall so that the buses can stay
in sync with the signals and so that the cross
streets can be coordinated across the mall.
Since the signals are coordinated for the flow of
transit vehicles and not other traffic, other traffic
may experience unnecessary delays, stops, and
frustration (i.e., phone calls to the signal operators).
Therefore, the volume of traffic parallel to the TSP
movements should also be considered with a tran-
sit signal progression approach. It is important to
note that other “passive” improvements may also
be of benefit to transit. Operational improvements
to signal timing plans, such as retiming, reducing
cycle lengths, or coordinating signals on a corridor,
may improve traffic flow and reduce transit travel
time as well. Simply timing the intersection to min-
imize person delay, as opposed to vehicle delay,
would be considered a passive strategy.
2.4.2 Active Priority
Active priority strategies provide priority treatment
to a specific transit vehicle following detection and
subsequent priority request activation. Various
types of active priority strategies may be used if
available within the traffic control environment.
A green extension strategy extends the green time
for the TSP movement when a TSP-equipped vehi-
cle is approaching. This strategy only applies when
the signal is green for the approaching TSP-
equipped vehicle. Green extension is one of the
most effective forms of TSP since a green exten-
sion does not require additional clearance intervals,
yet allows a transit vehicle to be served and signifi-
cantly reduces the delay to that vehicle relative to
waiting for an early green or special transit phase.
An early green strategy shortens the green time of
preceding phases to expedite the return to green
(i.e., red truncation) for the movement where a TSP-
equipped vehicle has been detected. This strategy
only applies when the signal is red for the approach-
ing TSP-equipped vehicle.
Generally early green and green extension strate-gies are available together within TSP enhancedcontrol environments but are not applied at thesame time. By definition3 a “TSP” capable signalcontroller providing an early green or green exten-sion will not negatively effect coordination.
The following Active strategies are generally avail-
able in most traffic control environments and may
Transit Signal Priority Handbook Y 7
PPAA
RRTT
II
3 NTCIP 1211 Definition of Priority

not require a sophisticated “TSP enhanced” con-
troller per NTCIP 12114 definition.
Actuated transit phases are only displayed when a
transit vehicle is detected at the intersection. An
example would be an exclusive left turn lane for
transit vehicles. The left turn phase is only dis-
played when a transit vehicle is detected in the
lane. Another example would be the use of a
queue jump phase that would allow a transit vehi-
cle to enter the downstream link ahead of the nor-
mal traffic stream. A queue jump phase shows a
signal (such as a white bar) that is intended for the
transit vehicle only and allows the transit vehicle to
move ahead of the rest of the traffic that is waiting
for a green at the intersection. An application might
be the location of a near-side bus bay; the queue
jump phase allows the bus to re-enter the main-
stream lane before the general traffic is given a
green phase to move forward.
When a special priority phase is inserted within the
normal signal sequence, it is referred to as phase
insertion. The phase can only be inserted when a
transit vehicle is detected and requests priority for
this phase. An example would be the insertion of a
leading left-turn-only phase for transit vehicles
entering an off-street terminal on the opposite side
of the street.
The order of signal phases can also be “rotated”
(i.e., phase rotation) to provide TSP. For example, a
northbound left-turn phase could normally be a lag-
ging phase, meaning it follows the opposing
through signal phase. A northbound left turning bus
requesting priority that arrives before the start of
the green phase for the through movement could
request the left-turn phase. With the phase rotation
concept, the left-turn phase could be served as a
leading phase in order to expedite the passage of
the transit vehicle.
2.4.3 TSP Operating in Real-Time
There are subtle differences between TSP with
Adaptive Signal Control Systems and Adaptive
Signal Priority, as described below. These are very
sophisticated and complex systems and therefore
not yet common. They provide a level of traffic con-
trol beyond what most of us experience today, but
they are possibly the wave of the future.
Although an Adaptive Signal Priority built on top of
an adaptive signal control system may offer more
benefits, Adaptive Signal Priority does not have to
be built on top of an adaptive signal control system.
The work conducted in NCHRP Project 3-665 shows
that Adaptive Signal Priority can be achieved upon
the closed-loop system, although additional efforts
are needed to address the insufficiency, incapability
or inflexibility of traffic detection means, communi-
cation and signal controllers employed in the
closed-loop system.
The priority strategies such as early green, green
extension and phase insertion listed under the catego-
ry of Active Priority apply to adaptive systems as well.
2.4.3.1 TSP with Adaptive Signal Control Systems
TSP with Adaptive Signal Control Systems pro-
vides priority while simultaneously trying to opti-
mize given traffic performance criteria. Adaptive
Signal Control Systems continuously monitor traffic
conditions and adjust control strategies. When
using Adaptive Signal Control Systems, it is possible
to take into account person delay, transit delay,
vehicle delay, and/or a combination of these criteria.
To take advantage of Adaptive Signal Control
Systems TSP would typically require early detection
of a transit vehicle in order to provide more time to
adjust the signals to provide priority while minimiz-
ing traffic impacts. Adaptive systems combined
with TSP also may require the ability to update the
transit vehicle’s arrival time, which can vary due to
the number of stops and traffic conditions. The
updated arrival time can then be fed back into the
process of adjusting the signal timings.
8 Y Transit Signal Priority Handbook
PPAA
RRTT
II
4 See NTCIP Standards Bulletin B0096 from the Joint AASHTO/ITE/NEMA Committee on the NTCIP, dated August 16, 2004 and found athttp://www.ntcip.org/new/NTCIP_1211_SB.pdf#search='ntcip%201211
5 National Cooperative Highway Research Program -- Project 3-66, FY 2002, Traffic Signal State Transition Logic Using Enhanced Sensor Information:http://www4.trb.org/trb/crp.nsf/All+Projects/NCHRP+3-66

2.4.3.2 Adaptive Signal Priority
Adaptive Signal Priority is a strategy that takes
into consideration the trade-offs between transit
and traffic delay and allows graceful adjustments of
signal timing by adapting the movement of the tran-
sit vehicle and the prevailing traffic condition.
Typically, an adaptive TSP needs to have the follow-
ing components: 1) a detection means that allows
accurate prediction of bus time-to-arrival to the inter-
section in real-time when vehicle is within a speci-
fied range 2) traffic detection system; 3) a signal
control algorithm that adjusts the signals to provide
priority while explicitly considering the impacts on
the rest of the traffic and ensuring pedestrian safety;
4) vehicle to infrastructure communication links; pri-
ority request generator(s) (PRG), a priority request
sever (PRS) and a control system with real-time sig-
nal timing strategies to facilitate adaptive TSP.
The rest of the Handbook will focus on the applica-
tion of active priority systems to transit vehicles in
mixed traffic.
A SYSTEMS ENGINEERINGAPPROACH TO TSP
3.1 Systems Engineering Approach
TSP projects range significantly in their level of
complexity. At their simplest, one can implement
the insertion of a left-turn phase, actuated by a bus
loop, that helps bus turning movements. At their
most complex, a TSP program may involve the follow-
ing: technological integration with a comprehensive
transit ITS project (e.g. GPS, AVL, customer informa-
tion systems, etc.); technological integration with
EMS pre-emption; sophisticated conditional priority
based on varying conditions of schedule adherence,
complex communications from transit vehicle to con-
troller via both the transit and traffic centers; multiple
technological controller interfaces; and implementa-
tion involving a multiplicity of jurisdictions. It is clear
that the project management requirements for a TSP
project will vary greatly between these two extremes.
Irrespective of the size and complexity of the TSP
project, it is important to use a systematic approach
to the planning and implementation process. This
Handbook recommends an approach that is consis-
tent with good systems engineering, and is required
by U.S. DOT for any federally funded ITS project6.
The proposed steps are:
1. Planning
2. Design
3. Implementation
4. Operations and Maintenance
5. Evaluation, Verification, Validation and
Building on TSP
Each of these steps is discussed in the following
sections focusing in particular on the TSP-specific
aspects of each of these standard systems engi-
neering steps. The issues identified are based on
information gathered from the in-depth case studies
of successful TSP implementations in North
America and from telephone interviews (full text is
found in the Appendices), as well as from multiple
discussions with experts.
3.2 Simplified Process for TSP at Isolated Intersections
The discussion of the steps involved in the planning
and implementation of TSP, and the issues that may
arise, has been structured to be as comprehensive as
possible. It is worth noting however that a simple
form of TSP can be used very effectively to address
significant bus delay at isolated intersections.
Examples include:
Y The insertion of left-turn phases, actuated by bus
detection, at major arterial intersections,
Y The use of green extension or red truncation,
actuated by buses emerging from minor cross
streets (such as from residential subdivisions)
onto major arterials, where standard timings for
Transit Signal Priority Handbook Y 9
PPAA
RRTT
II
6 For those interested in more information on ITS Systems Engineering, the ITS Professional Capacity Building (PCB) Program of the U.S.DOT has initiated a curriculum, entitled the ITS/SE Series, which is comprised of systems engineering courses designed for professionalsinvolved in the implementation of advanced technologies for transportation: http://www.pcb.its.dot.gov/brochures/ITS_SE.htm
Another useful reference is entitled Building Quality Intelligent Transportation Systems Through Systems Engineering, prepared by MitretekSystems Inc. for the ITS Joint Program Office of US DOT in 2002: http://www.its.dot.gov/JPODOCS/REPTS_TE/13620.html
3

low volume minor streets results in excessive
delay for buses,
Y The insertion of special bus-actuated bus-only
turning phases for buses entering or exiting off-
street terminals, etc.
In such cases, if the existing controller has the capa-
bility, the inclusion of relative simple TSP functionality
actuated by simple bus detection (e.g. embedded
loops in left-turn lanes or strobe emitters) can be a rel-
atively straightforward initiative, not requiring consult-
ant involvement or lengthy process for planning, pro-
curement, installation, etc.
TSP PROJECT PLANNING
4.1 Introduction to TSP Project Planning
Transit Signal Priority (TSP) is a tool, and how it is
applied can vary tremendously:
Y It can be used as a straightforward tool to
address significant delay experienced by transit
vehicles at isolated intersections.
Y It can be used to improve transit travel times
and reliability along an entire corridor.
Y It can be combined with other tools, proce-
dures, and technologies to create a whole new
10 Y Transit Signal Priority Handbook
PPAA
RRTT
II
WHAT ARE THE STEPS FOR PLANNING AND IMPLEMENTING A TSP SYSTEM?
TSP Project Planning
Y Needs Assessment [Why TSP?]Y Stakeholders: Roles and Responsibilities [Who is to be involved?]Y Concept of Operations (ConOps) and Requirements Document [What will TSP do?]Y Corridors and Intersections [Where will TSP be implemented?]Y Technology Alternatives Analysis and System Architecture [How will TSP work?]
TSP Project DesignY Detailed Data Collection and Inventory of Traffic Control SystemY Detailed Design and Engineering for Central Control and Communications Y Systems ComponentsY Detailed Design and Engineering by Intersection Detailed Design and Engineering of On-Board
EquipmentY Optimization and Preparation of Timing PlansY Use of Micro-Simulation Model to Design TSP Control Strategy in Special Cases
TSP Project ImplementationY ProcurementY InstallationY Verification and Validation
Operations and MaintenanceY Ongoing Performance Monitoring and ManagementY Procedures to Ensure System is OperatingY Maintenance
Evaluation, Verification, Validation and Building on TSPY Evaluation StudyY Ongoing Data CollectionY Building on TSP Benefits through Transit Scheduling
Key Question:
4

transit product line, as in the case of Bus
Rapid Transit (BRT).
Y It can be integrated system-wide with other ITS
systems to deploy region-wide conditional TSP
and pre-emption for EMS vehicles.
4.1.1 Regional and Corporate Goals
To create a well functioning transportation system,
all transportation projects should be consistent with
regional goals. Isolated projects can actually disrupt
the transportation system and confuse drivers and
transit passengers who have expectations of a
smooth and seamless transportation system. As a
practical point, a project that is consistent with
regional and corporate goals is an “easier sell.” In
the absence of the support that consistent goals
lend, it is hard to get a project off the ground.
Regional transportation goals are established by the
local Metropolitan Planning Organization (MPO),
Council of Government (COG), traffic agency or
other regional or local authorities. They should be
listed in regional planning documents, the Regional
Transportation Plan, the Transportation Improvement
Program, the regional ITS architecture, etc. If you
are uncertain of what the regional transportation
goals are, or where they can be found, you may be
able to find them with a web search using keywords
like regional+transportation+goal+yourcity or your-
county, or by contacting the agencies listed above.
If you want to champion a TSP project and you are
in a region that does not have “Transit First” or tran-
sit-friendly goals, you may want to work to establish
more transit-friendly goals in your region. However,
a web search of regional transportation goals
revealed that virtually every region has stated some
transit-friendly goals such as:
Y Minimise adverse environmental impacts
Y Provide adequate mobility for all persons
Y Be cost-effective
Y Provide for efficient travel
Y Integrate various modes of travel
These goals as well as broad and sweeping goals
like “improving air quality” or “increasing mobility”
(to which it is difficult to imagine opposition) can be
the basis for initiating a TSP project. TSP projects
(when applied to corridors or intersections in which
transit vehicles are experiencing delays due to traffic
signals) are proven to improve transit service, which
leads to increased mobility and improved air quality.
Transit Signal Priority Handbook Y 11
PPAA
RRTT
II
HOW DOES TSP RELATE TO AND ENHANCE BRT?
BRT is generally associated with a whole package of improvements including the combining of physical and
signal priority measures (e.g. reserved bus lanes and TSP) with modified service attributes, such as increased
stop spacing, enhanced stop design, level boarding, increased frequency of service, enhanced customer infor-
mation (both on-board and at stops), new service control procedures (e.g. headway management rather than
scheduled time points), attractive branding, exclusive lanes, etc. TSP is just one component in this toolbox.
If traffic signals are slowing buses, TSP is an obvious tool for speeding them up. Although many cities have
implemented TSP without BRT, few have implemented BRT without TSP.
HOW DOES TSP FIT IN WITH REGIONAL INTEGRATION AND PLANNING?
TSP should fit into the goals and objectives that have been outlined for your region. If improving mobility
through bus service is a priority for your region, you will want to conduct a study (which could be an in-
house study) to determine what you need to do to improve bus service. If you would like to decrease transit
travel times or increase transit reliability, and you determine through a Needs Assessment that traffic signals
are slowing down your bus service, you will want to consider implementing TSP. As you begin to plan for
TSP you will need to engage the regional stakeholders. You, along with your regional stakeholders, will
work together to ensure that TSP is integrated into regional plans.
Key Question:
Key Question:

In addition to helping to meet regional goals, TSP
projects should be consistent with corporate goals.
That is to say the TSP projects should be consistent
with the goals of the transit agency, traffic agency,
and the affected jurisdictions. Consistency with
these goals is needed for the same reasons as the
consistency with regional goals. This consistency
will help produce a smoother transportation system
and will make the TSP project a much easier sell.
Hopefully, the traffic agencies and jurisdiction have
adopted transit-friendly goals similar to the goals
mentioned above. Again, remember that a simple
goal such as “increased mobility” is a transit-friend-
ly goal. More specific goals such as “reduce inter-
section delay,” “improve corridor travel time,”
“reduce transit operating cost” are especially sup-
portive of TSP. These goals can be met with a num-
ber of objectives such as reducing travel time,
improving reliability, staying on schedule, maintain-
ing transit headways, improving efficiency, and
improving person throughput.
It is therefore important, prior to launching a TSP
project, to identify pertinent regional and corporate
goals in the local context, and to assess to what
extent they support TSP, and alternatively to what
extent TSP addresses these goals.
4.1.2 TSP as it Relates to the Regional ITSArchitecture and Other Transit ITS Projects
TSP can be a stand alone system, or it can be inte-
grated with a wide variety of other ITS projects (e.g.
transit AVL, EMS pre-emption, etc.) As a result, the
regional ITS architecture is an important resource and
12 Y Transit Signal Priority Handbook
PPAA
RRTT
II
Key Questions:
ARE THERE EXISTING PLANS FOR AN AUTOMATIC VEHICLE LOCATION(AVL) SYSTEM, AND IF SO, IS TSP TO BE INTEGRATED WITH THE AVLSYSTEM, AND THE ITS REGIONAL ARCHITECTURE?
There are many potential advantages for integrating the TSP and AVL systems. For example, this enables
the possibility for lateness conditionality, as mentioned before. It opens up an expanded set of technological pos-
sibilities for the PRG/PRS system and for data collection, which is a major concern for TSP systems. However,
it also greatly increases the complexity of the project, and will inevitably introduce major delays for TSP
deployment. There are many facets to this question that need to be assessed based on local considerations:
Y the urgency of implementing TSP,
Y the status of the AVL project,
Y the stated ITS priorities within the regional ITS architecture,
Y the relative risks associated with stand-alone versus integrated projects,
Y technological options available under different timeframes,
Y the ability to integrate an existing TSP system into a future AVL system, etc.
The question of integrating TSP and AVL is very complex and all transit systems considering both AVL
and TSP will need to grapple with it. The outcome of this process should then be incorporated into the
ITS regional architecture.
ARE THERE PLANS TO PROVIDE EMS VEHICLES WITH SIGNAL PRIORITY/PRE-EMPTION?
Although the connection between AVL and TSP is obvious to transit agency staff, it is equally important to
ascertain whether EMS pre-emption/pre-emption is being planned and whether any transit TSP project will
need to be integrated with any existing or planned EMS initiative. This needs to be determined at the outset
because it will affect objectives, stakeholders to be involved, technological choices, and design engineering.
The regional ITS architecture may provide an answer to this question, or it may have to become a key point
of discussion in defining the TSP project’s goals.

it will be important to review this document. If this
document has been fully developed, it should provide
guidance on numerous pertinent issues, including:
Y the role of TSP and its priority,
Y the stakeholders that will need to be involved,
Y the status of other transit ITS, traffic engineer-
ing, and EMS pre-emption projects,
Y funding priorities,
Y projects in the pipeline,
Y etc.
If it does not address these issues, the updating of
the regional ITS architecture will need to be includ-
ed as a task in the TSP project.
4.1.3 Regional and National ITSArchitecture Conformity
The National ITS Architecture was developed to provide a
unifying framework for ITS infrastructure deployment to
ensure that technologies can work together smoothly and
effectively. The National ITS Architecture and Standards
Final Rule issued on January 8, 2001 requires that ITS proj-
ects funded by the Highway Trust Fund and the Mass
Transit Account conform to the National ITS Architecture,
as well as to U.S. DOT adopted ITS Standards.7
Specifically, most State departments of transportation and
metropolitan areas are required to develop a regional ITS
architecture using the National ITS Architecture as a
resource and to use a systems engineering approach for
developing ITS projects. The deadline for completing a
regional ITS architecture is April 8, 2005.8
The National ITS Architecture and Standards Final
Rule means that:
Y Regions currently implementing ITS projects
must have a regional ITS architecture in place in
four years. Regions not currently implementing
ITS projects must develop a regional ITS archi-
tecture within four years from the date their
first ITS project advances to final design.
Y ITS projects funded by the Highway Trust Fund
and the Mass Transit Account must conform to
a regional ITS architecture.
Y Major ITS projects should move forward based
on a project level architecture that clearly reflects
consistency with the National ITS architecture.
Y Projects must use U.S. DOT adopted ITS stan-
dards as appropriate. To date, the U. S. DOT
has not adopted any ITS standards, and a for-
mal rulemaking process will precede any U.S.
DOT ITS standard adoption.
Y Compliance with the regional ITS architecture
will be in accordance with U.S. DOT over-
sight and Federal-aid procedures, similar to
non-ITS projects.
4.1.4 Standards (NTCIP and TCIP)
The transportation industry has recognized a need to
provide voluntary standards to help reduce costs and
decrease risk in TSP implementations. Without stan-
dards public agencies are sometimes hesitant to pur-
chase equipment because they are not sure if it is
compatible with existing equipment and software
and because they might be “locked into” the same
vendor in the foreseeable future. Standards will
allow procurements of TSP hardware and software
without concern for compatibility and will help open
the market place for competition and price reduction.
The ITS traffic standards come under the umbrella
of National Transportation Communications for ITS
Protocol (NTCIP). From www.ntcip.org we find:
The NTCIP is a family of standards that pro-
vides both the rules for communicating
(called protocols) and the vocabulary (called
objects) necessary to allow electronic traf-
fic control equipment from different manu-
facturers to operate with each other as a
system. The NTCIP is the first set of stan-
dards for the transportation industry that
allows traffic control systems to be built
using a “mix and match” approach with
equipment from different manufacturers.
Therefore, NTCIP standards reduce the
need for reliance on specific equipment
vendors and customized one-of-a-kind soft-
Transit Signal Priority Handbook Y 13
PPAA
RRTT
II
7 US Department of Transportation, Federal Highway Administration, ITS Architecture Implementation Program, web pagehttp://www.ops.fhwa.dot.gov/its_arch_imp/asflyer.htm as of March 9, 2005.
8 Source: US Department of Transportation, Federal Highway Administration, Facilitating Intelligent Transportation Systems Deployment, webpage http://ops.fhwa.dot.gov/aboutus/one_pagers/its_deploy.htm as of March 9, 2005.

ware. To assure both manufacturer and
user community support, NTCIP is a joint
product of the National Electronics
Manufacturers Association (NEMA), the
American Association of State Highway and
Transportation Officials (AASHTO), and the
Institute of Transportation Engineers (ITE).
The NTCIP originated as the National
Transportation Communications for
Intelligent Transportation System (ITS)
Protocol (NTCIP).9
This NTCIP data dictionary defines the
management information base for Signal
Control and Prioritization (SCP) systems
through parameters that represent the
configuration, status, and control informa-
tion. NTCIP 1211 defines the functional
entities of a Priority Request Generator
and a Priority Request Server, which
respectively originates and performs triage
on requests. After performing triage in
terms of importance and priority, the
requests are sent to the Coordinator entity
in a Traffic Signal Controller.
NTCIP 1211:
Y defines data elements used for information
management and operations of signal control
prioritization (SCP).
Y organizes functional requirements and user
requirements, and contains scenarios and
use cases. The NTCIP SCP WG invented the
functional entities of a “Priority Request
Generator” and a “Priority Request Server,”
which respectively originates and performs
triage on requests. After performing triage in
terms of importance and priority, the requests
are sent to the Coordinator entity in a Traffic
Signal Controller.
Y includes the management of multiple
requests for priority or preferential treatment
of different classes of vehicles, such as tran
sit, emergency service, and commercial fleet
vehicles. This SCP standard defines a method
of granting priority to one signal while main-
taining coordination with adjacent intersections.
Y is intended to work in conjunction with the
coordination object definitions and functions
defined in NTCIP 1202, Object Definitions for
Actuated Signal Controllers.
Y The NTCIP 1211 was developed by the Joint
NTCIP-TCIP Signal Control and Prioritization (SCP)
WG. The WG is chaired by Ron Atherley
(Seattle/King County Metro). The SCP Working
Group purpose is to develop objects to control
traffic signal systems in priority applications.10
In addition to NTCIP standards which are being
developed for and by the traffic industry, Transit
Communications Interface Profiles (TCIP) are being
developed for and by the transit industry. One of the
business areas of TCIP is TSP. A DRAFT report by the
TCIP Technical Working Group on TSP states in part:
As the public transit vehicle (PTV) operates
on its trips it may encounter intersections
that are equipped to provide priority treat-
ment to PTVs (e.g. early green, extended
green, phase rotation) to allow the PTV to
operate more efficiently. Equipped inter-
sections and agreeing on acceptable
strategies for TSP requires extensive coor-
dination between transit agencies, traffic
management, and traffic engineering.
Although a Priority Request Generator may
request priority treatment; the traffic man-
agement system is not obliged to, and
may not, grant it.
Commentary: The TCIP TSP business area
draws heavily from dialogs, data and con-
cepts defined in NTCIP 1211. This includes
the Priority Request Generator (PRG).
Priority Request Server (PRS), and all items
defined in TCIP beginning with ‘SCP’. . .
14 Y Transit Signal Priority Handbook
PPAA
RRTT
II
9 Source: The National Transportation Communications for ITS Protocol ONLINE RESOURCE… http://www.ntcip.org/info/default.asp as ofMay 24, 2005.
10 Source: The National Transportation Communications for ITS Protocol ONLINE RESOURCE…http://www.ntcip.org/library/standards/default.asp?documents=yes&qreport=no&standard=1211 as of May 24, 2005.

Priority Request Generators may consider
any or all of the following in creating a pri-
ority request (based on data available to
the PRG at the time the request
is generated):
Y Business Rules
Y Schedule Adherence Status of PTV
Y Time of Day
Y Equipment Type at Intersection
Y Passenger Loading on PTV
Y Scheduled time for PTV’s current trip to arrive intersection (many agencies do not schedule to this level)11
The TCIP information above comes from a “draft
Standard intended for review by the TCIP Technical
Working Groups and other interested industry par-
ties. It has not been approved and does not reflect
APTA or U.S. DOT policy.”12
All standards are voluntary but as stated above, the
National ITS Architecture and Standards Final Rule
issued on January 8, 2001 requires that ITS proj-
ects funded by the Highway Trust Fund and the
Mass Transit Account conform to the National ITS
Architecture, as well as to U.S. DOT adopted
ITS Standards.13
Those who are interested in implementing TSP will
want to stay abreast of the status of emerging
NTCIP and TCIP.
4.1.5 Relations between Transit and Traffic Staff
TSP can only be implemented through a solid part-
nership of the transit and traffic agencies respective
staff. This requires a continuous dialogue and solid
working relationship. Unfortunately, it is all too
common to observe a total lack of communications
between transit and traffic agency staff, for a variety
of reasons:
Y Their institutional structures are often divergent
with transit operating an independent (oftenregional) authority, and traffic staff being part ofcity, county or state departments, with few rea-sons to interact.
Y Their focus is often different (vehicle versuspeople movement), as are their respectiveobjectives. Some successful TSP implementa-tion jurisdictions have reached agreement thatgreater people movement (transit) reducesvehicles (traffic) and therefore benefits both.
Y Their training, common tools, and professionalterminology are also different.
Nonetheless, to succeed, TSP requires a solid part-
nership. In many instances, the TSP projects repre-
sent the first time transit and traffic staff work
together, and therefore require the cautious building
of a relationship. The more solid the relationship is
before the initiation of a TSP project, the easier it
will be to pursue, as will other projects such as
physical priority measures. Building such a partner-
ship at the outset will help ensure the success of
planning and implementing TSP
4.1.6 Traffic Engineering Support
TSP projects vary considerably in their complexity.
However, with the exception of very simple deploy-
ments at isolated intersections, or in very large agen-
cies with deep expertise in all areas, it is likely that
external consultant expertise will be required at some
point in the process of planning and implementing
TSP. It may be valuable as part of the local “pre-plan-
ning” assessment to review what expertise exists
locally, and where external expertise may be required.
Potential external support may involve one or more
of the following activities:
Y Needs Assessment
Y Evaluation and recommendation of where to
deploy TSP (e.g. specific corridors and intersec-
tions) to meet project criteria
Y Baseline (“before”) studies for general traffic
and transit conditions and delay
Y Detailed intersection inventory and assessment
Transit Signal Priority Handbook Y 15
PPAA
RRTT
II
11 5.3.4.2.6 Transit Signal Priority (TSP), APTA TCIP-S-001 D2.6.1, APTA DRAFT Standard for Transit Communications Interface Profiles.Document referenced May 25, 2005.
12 Ibid.
13 US Department of Transportation, Federal Highway Administration, ITS Architecture Implementation Program, web pagehttp://www.ops.fhwa.dot.gov/its_arch_imp/asflyer.htm as of March 9, 2005.

Y Pre-TSP signal optimization and development of
signal timing plans
Y Development/calibration of simulation models
for special assessments
Y Detailed TSP timing plans for each intersection
Y Technical support for field equipment installa-
tion (PRG, PRS, controller upgrades, con-
troller connections)
Y “After” data collection
Y Evaluation study
Y Periodic reviews of performance
4.2 TSP Project Planning
The first phase of the TSP project or program is
planning. At its heart, this phase is designed to
answer a number of key questions concerning the
structuring of the project, including:
Y Why TSP?
Y Who is to be involved?
Y What will TSP do?
Y Where will TSP be implemented?
Y How will TSP work?
4.2.1 Needs Assessment [Why TSP?]
The first step is to assess the need for TSP. There
are a variety of methods for conducting the Needs
Assessment, depending on local practices in project
justification. A comprehensive Needs Assessment
might provide an evaluation of:
Y the potential benefits of TSP,Y an assessment of feasibility,Y an initial assessment of costs and budget
requirements, andY the potential business case (benefits versus
costs) for a TSP project / program. This couldinclude a Return on Investment (ROI) analysis.
It is clear that such an evaluation will depend on the
information available. If there is considerable uncer-
tainty concerning how to scope the project (both
technologically and geographically) and who will be
involved, or insufficient information to conduct a
meaningful benefit / cost analysis; then it may be
necessary to first perform a broad high-level Needs
Assessment, and prepare a the business case later
on the project, once the Concept of Operations
(ConOps) has been structured, and technology
choices have been made.
The following provides some thoughts about infor-
mation needed for the Needs Assessment.
4.2.1.1 Potential Benefits:Traffic Signal Delay and
its Impact on Transit Travel Times and Reliability
Benefits that are directly related to corporate goals
can be measured and evaluated more easily than
generic benefits. For example, if the corporate poli-
cy objective is to increase transit modal share, we
know, based on industry experience, that by
improving transit travel times (relative to car travel
times) we will increase transit’s modal share. If the
primary objective is to decrease costs to the transit
agency and/or taxpayer, we need to ask ourselves a
question (create a goal) that will help yield a meas-
urable benefit concerning costs.
We can begin our assessment of traffic signal delay
and its impact on transit travel times and reliability
by taking field measurements or analyzing appropri-
ate reports. Most transit systems do not have good
information on the impact of traffic signal delay on
their operations.
Transit planners need to ask questions such as:
Y Is there measurable delay or unreliability due to
traffic signals?
Y How much delay could we save on a particular
route by providing TSP?
Y Has the cost (capital and operating) of intersec-
tion delay and congestion to the transit system
been calculated?
Y Have transit schedulers been consulted about
the locations and extent of intersection delay?
Y Has data on intersection bus delay already
been collected?
Y If not, are alternative approaches/sources avail-
able to collect time-distance data and measure
intersection delay (for example, current
AVL/APC systems can provide distribution of
running times by route segment, by time of
day, and day-of-week that can be used to
measure vehicle speed and intersection delay)?
Answering these questions and assessing the mag-
nitude of intersection delay will be the basis for
assessing the potential benefits that may be
derived from TSP. Posing the questions in a quan-
16 Y Transit Signal Priority Handbook
PPAA
RRTT
II

tifiable format will make it possible to measure
the benefits.
4.2.1.2 Transit and Traffic Data Collection
At the same time, in order to assess the costs of a
TSP project and its feasibility, background informa-
tion will need to be collected concerning the traffic
control systems in pertinent jurisdictions. Examples
of information to collect include:
Y Initial survey of applicable traffic control and
communications systems
Y Characteristics of traffic control systems by
jurisdiction (e.g. centralized, distributed, coordi-
nation, communication links, use of loops, EMS
pre-emption, etc.)
Y Types of controllers in use (or planned) by juris-
dictions (and prevailing standard if any), and
TSP compatibility
Y Status of optimization of timing plans (time of
day, areas, peak direction)
In addition, data related to bus operations will need
to be collected, including:
Y Capacity/level of service by time of day for
major intersections along bus corridors
Y Identification of any saturated intersections
along major bus corridors
Y Data on extent and impact of intersection delay
on buses
At some point, detailed traffic data on intersection
delay and queues will have to be collected. For the
purposes of this model process, this data collection
effort can take place during the “before” study of the
Design phase. However, if the scope and location of
the planned TSP deployment is known from the outset,
then it may be feasible (and cost-effective) to collect
that data during the initial Needs Assessment step.
Depending on the scope of the TSP project, it may
be feasible to collect the background information
through an in-house study in which technicians or
planners observe and record pertinent informa-
tion. There is no magic formula for the number
of days this information should be collected or
the times of day, but it is generally agreed that
traffic data should be collected at high traffic
times. Therefore, the best days of the week are
usually Tuesday through Thursday and best times
might be AM and PM peak hours. This depends
on local circumstances.
4.2.1.3 TSP Project/Program Costs -
Preliminary Assessment
The next step is to use the background information
on the traffic control system as a basis for estimat-
ing the costs of implementing TSP. The background
information will indicate whether existing traffic
control software and controllers are TSP-compatible
or not. The need to upgrade or replace traffic soft-
ware and controllers is a critical issue to consider,
since it represents the most significant cost items
in the observed TSP projects. If existing software
and controller equipment can be used, costs can be
under $5,000 per intersection but rise to $20,000-
$30,000 per intersection if traffic control equipment
and/or systems need to be replaced.
Transit Signal Priority Handbook Y 17
PPAA
RRTT
II
KKeeyy QQuueessttiioonn::
ARE THERE PLANS TO UPGRADE OR REPLACE THE TRAFFIC CONTROLSYSTEM AND/OR TRAFFIC CONTROLLERS?
TSP by definition involves the integration of vehicle detection and action taken by the traffic control sys-
tem. A major hurdle identified in many case studies was the inadequacy or lack of capability of the traffic
controllers and/or of the traffic control software to actually receive priority requests and to be able to grant
priority. The review of traffic equipment and software in Part III illustrates the complexity of this issue. In
many cases, TSP can only be implemented by upgrading or replacing traffic control software and/or conr-
toller equipment. It is critical that transit system staff interested in implementing TSP make themselves
aware of the status of any plans related to the various traffic control systems in pertinent jurisdictions, so
that the efforts can be integrated. This might include development of a standardized contoller for the
region that may be initiated by the state DOT (e.g. Portland). I may be difficult or cost-prohibitive to intro-
duce TSP after the fact.

The more specific the scope of the TSP project is
from the outset, the more realistic can be the esti-
mate of costs. Major cost elements include:
Y Equipment - Detection/PRG (on-board or wayside)Y Equipment (PRS/interface to controller) and
controllers (if required)Y Equipment - CommunicationsY TSP software (and traffic control system soft-
ware if required)Y Installation and construction (if required)Y Traffic Engineering (traffic data collection, simu-
lation, optimization, timing plans)Y Evaluation Studies (Before/After)Y Development Work (if required)
The costs can vary dramatically depending on the
type of project and the extent to which field equip-
ment must be upgraded. The traffic engineering
staff should be able to give the team a good idea of
the cost of upgrading the traffic equipment, if
upgrading is required.
If the scope of the project is not yet determined,
then the cost analysis can only be done at a high
level, using ballpark assumptions. [The case studies
in the Appendices provide some insights into actual
experience with TSP costs.]
4.2.1.4 TSP Project/Program – Needs
Assessment and Business Case
The above information on benefits and costs can in
turn be used to assess the benefit cost ratio, return
on investment, or other methodology used locally to
evaluate capital investment decisions. The previous
estimate of costs also provides a first cut at budget-
ary requirements. This can then be used to assess
potential sources of funding, and to develop the
necessary process for budgeting, programming,
and securing funding.
4.2.2 Stakeholders: Roles and Responsibilities[Who is to be Involved?]
4.2.2.1 Identifying Stakeholders
The stakeholders will become the team that makes
the TSP project happen. The old adage “a stitch in
time saves nine” applies well to the stakeholder
process. In the early stages of project develop-
ment, it seems unnecessary and counter-productive
to involve all the stakeholders. After all, it is much
easier to accomplish any task in which there are no
differing opinions. But later in the process, the
value of early stakeholder involvement will become
patently obvious. Stakeholders represent areas in
which help is needed throughout the planning,
design, procurement, installation, operation, and
maintenance periods. Stakeholders also represent
groups that can assist or bog down and even stop a
project. The best way to ensure full implementation
and operational success is to involve all the stake-
holders in the beginning. Stakeholders who help
define a project possess the irreplaceable feeling of
ownership, and usually become the “Champions”
of TSP for their agency.
The stakeholders will include representatives from
the traffic departments of every jurisdiction in which
you wish to have TSP, and representatives from
every transit agency that will participate in TSP if it
is a regional initiative. If you wish to integrate with
EMS, you will need to bring in stakeholders from
fire, emergency medical services, and police agen-
cies as well. Many agencies have found that it is
helpful to include representatives from the state and
county departments of transportation, and metropol-
itan planning organization(s) (MPO) or councils of
government (COG), in particular if they are the stew-
ards of the regional ITS architecture. The extent of
your stakeholder involvement will depend on the
scope of your project and the players necessary to
ensure funding, implementation, and maintenance.
Stakeholders internal to the transit agency include
one or more representatives from planning, sched-
uling, administration, equal opportunity, contracts
and procurement, risk assessment, quality assur-
ance, operations, maintenance, finance and budget,
engineering, IT, training, public affairs, and any other
department or division that may be impacted by the
project, or involved in its procurement. It may be
useful to create in some cases sub-committees in
order to focus the energy and involvement of some
internal stakeholders on specific issues (e.g. pro-
curement, training, publicity). Early involvement
helps shape the project in ways that encourage
stakeholders to find value in it and that allow stake-
holders to understand the project and their role in it.
PPAA
RRTT
II
18 Y Transit Signal Priority Handbook

The importance of this early involvement really can-
not be overstated. Many projects stumble or fail
because of internal misunderstandings and turf bat-
tles. These stumbling blocks often can be avoided
with early stakeholder involvement.
If the TSP project is complex, in addition to gather-
ing the local stakeholders, it may be advantageous
to create a peer review team from around the coun-
try. U.S. DOT will provide assistance to grantees,
and ITS America will help members create such a
team. The lead agency could use resources listed
in this book including the case studies and the tran-
sit survey forms to form a team. The peer review
team can help review RFP’s, bids, proposals, and
also answer questions by phone and e-mail.
4.2.2.2 Managing Stakeholders
The first step in managing stakeholders is to identi-
fy the players and invite them to a meeting. You
may have a high response rate right from the begin-
ning. If you do not get a good response, you may
need assistance. You will know better how to make
that happen in your region. Perhaps you can enlist
the help of regional players who have some influ-
ence. The president of your ITS State Chapter or
your local ITE Section may be able to help. To get the
interest of the traffic department, you may have to
offer an incentive such as the potential for upgraded
or new traffic signal controllers for the department.
Generally, internal and external stakeholder meet-
ings will be held separately because the two groups
have a different focus. The first meeting of the
stakeholders groups will set the tone for future
meetings. As with all well planned meetings, invita-
tions should be sent several weeks in advance
clearly stating:
Y Meeting purpose
Y Meeting location with directions
Y Agenda
Y Start and end time
PPAA
RRTT
II
Transit Signal Priority Handbook Y 19
KKeeyy QQuueessttiioonn::
WE HAVE TO DEAL WITH MANY JURISDICTIONS. HOW DO WE GET THESTAKEHOLDERS TOGETHER?
There is no one way to build the professional relationships necessary to get the stakeholders to the table. In
some areas, other projects have paved the way for cooperation. In other areas, the TSP champion had to
start from scratch – trying to establish relationships between and among agencies that have historically been
antagonistic because they have competed with one another for funding. Some have found that building
relationships through local organizations such as ITE Sections and ITS State Chapters has helped bring
people together for a common goal. Some organizations have hired professional facilitators to help lead
visioning and/or planning sessions. One TSP champion says, “Never underestimate the power of stopping
by the traffic engineer’s office with a box of doughnuts.”
In order to get “buy-in” from the traffic department, the transit agency may have to offer an incentive such
as offering to fund a traffic study involving the re-optimization of signal timings, or upgrading or buying
new traffic signal controllers for the department.
In other words, building relationships for the purpose of completing TSP projects is no different from
building relationships in all other aspects of life. It takes a willingness to step forward and offer the hand of
cooperation for the greater good. If all else fails, the ITS architecture points out that all stakeholders need
to be at the table to discuss ITS project implementation. You may be able to get some support or ideas from
your Metropolitan Planning Organization (MPO), Council of Government (COG), federal DOT represen-
tative, or ITS America.
Check the case studies at the end of this book to see how other implementers answered the question, “What
were the institutional barriers?” and “How did you overcome them?”

Y Any materials or preparation needed
Y Contact information for the person setting up
the meeting
Y A request to respond to the invitation
The meeting should start and end on time, begin
with a statement of purpose and introductions of all
participants, and end with action items, next steps,
and the date for a follow-up meeting if necessary.
A signup sheet should be circulated and someone
should be assigned the responsibility for taking
notes. Action items should be assigned to specific
participants with specific deadlines. If a meeting
ends without any action items, it is a good indica-
tion that the meeting was unnecessary and could
have been handled with a mailing (e-mail or other
form); or that the meeting was not conducted well
and therefore was not concluded as planned.
Following the meeting, notes or minutes should be
distributed to all participants and should reiterate
action items, deadlines, next steps, and the next
meeting date and location.
These ideas are presented to make the planning
easier, not to add complication. Use your own judg-
ment and remember that all is not lost if the above
outline is not followed.
4.2.2.3 Project Management
Regional TSP projects are often made complex
because of the multiple jurisdictions and agencies
that need to be involved. The more complex the
institutional setting for the project, the more critical
is the project management function. Some of the
issues that will need to be addressed include:
Y Identification of Project Lead (champion)Y Definition of TSP planning project team and
respective roles, responsibilities, and expec-tations
Y Management of communications among stakeholderst Ground rules for communications, includ-
ing roles for dissemination of internal information to an agency’s non-projectteam members.
t Meeting frequencyt Notification of operating changest Milestones
Y Memorandum of Understanding / interagency
agreements for planning, funding, installation,and ongoing maintenance (routine and non-rou-tine). Agreements should also state when,how, and how much priority will be granted.
Y Integration with regional transportation plan-ning and planning requirements
Y Linkage to the Regional ITS ArchitectureY Linkage to other Transit ITS projectsY Integration with traffic control system upgradesY Identification of pertinent experience with
TSP in the region, state, or nationally onwhich to draw
Y External consultant support requirements(what, when, and how?)
Depending on the complexity of the project, you
may want to bring in more engineering expertise at
any point along the way in the planning or design
process. Some TSP projects can be completed
using only in-house expertise with assistance from
stakeholders. Other projects may require hiring
outside expertise early on.
4.2.3 Concept of Operations (ConOps) and Requirements Document [What will TSP do?]
With an understanding of regional and corporate
goals, and an understanding of the need for and ben-
efits of TSP, the stakeholders can develop a ConOps,
which defines what the TSP system will do.
4.2.3.1 TSP Project Goals, Objectives, and Vision
The first step is to have the stakeholder team define
the goals and objectives of the proposed TSP project.
Y Goals that have been stated in various TSP proj-
ects include:
Y Improve travel times or reliability system-wide.
Y Improve air quality by encouraging modal shift
Y Improve travel time along strategic corridors
through the combined use of different
priority measures
Y Create new BRT product line
Examples of more specific objectives include:
Y Reduced excessive transit delay at
particular intersections
Y Reduced excessive transit delay along
particular corridors
PPAA
RRTT
II
20 Y Transit Signal Priority Handbook

Y Improved reliability (schedule adherence or
headway management)
Y Improved efficiency (reduction in buses and
labor required)
Y Improved person throughput (person vs. vehi-
cle-based philosophy)
Y Improve signal timings for main street
general traffic
Y Minimize impact on general traffic on
intersecting streets
Having defined the goals and objectives, it may be
useful to define a TSP Program Vision Statement that
can help articulate the reasons for implementing TSP
and the scope of the program. It is also helpful in
labeling, defining, and communicating the program.
The amount of potential funding will determine the
extent and scope of the project. The vision may call
for a much larger project than that which can be
funded. In that case the project can be implement-
ed in phases as funding becomes available. The
case studies that are included in this handbook will
give you an idea of what size project can be funded
with the amount of money available.
Frequently, the vision and scope statement are craft-
ed by the project champion or a task force formed
from the stakeholders. The scope and vision would
then be brought to the larger stakeholder groups for
consensus. The funding agency will have final
authority, but consensus among stakeholders can
help move the project more smoothly.
4.2.3.2 Measures of Effectiveness (MOE)Resulting from Objectives
Using the revised objectives, the stakeholder team
can identify the MOEs related to the objectives.
The MOEs will be important later on, when the
project is evaluated. You want to choose MOEs that
are meaningful and that help you determine
whether you have met your stated goals. To find
that a project is not meeting the goals you had
hoped to meet is not necessarily a failure, but
PPAA
RRTT
II
Transit Signal Priority Handbook Y 21
ARE OTHER PRIORITY MEASURES TO BE EVALUATED AND IMPLEMENTEDALONG WITH TSP?
If a goal is to improve transit travel times, a variety of other measures could be considered, evaluated, and
possibly simultaneously implemented along with TSP, including:
Y Increased bus stop spacingY Updating signal timing plansY Passive priority (retiming for signal progression for transit vehicles)Y Physical priority in traffic flow (separated bus lane)Y Reserved bus lanesY Parking removal or prohibitionsY Turning prohibitions for general traffic with exemptions for transitY Queue jumpsY Bus Bulbs (for stopping in-lane)Y Yield-to-Bus legislationY Off-board fare collectionY Use of low floor busesY Raised platforms for level boarding
In Europe and New Zealand, one frequently observes the combination of various priority measures (physi-
cal and signal) along strategic corridors that are renamed as “red routes” or “green routes”. In other com-
munities (e.g. Ottawa), a systematic effort is made to reduce transit delays at intersections by all measures
short of signal priority, before introducing TSP. The transit system needs to assess to what extent a combi-
nation of measures can be implemented in an integrated fashion because this would be more effective over-
all, but would also change the nature of a TSP project or program.
Key Question:

rather a new understanding of what works in cer-
tain situations. No matter how well the project
meets goals, a good evaluation will give you infor-
mation to help you decide future actions.
MOEs that have been used in TSP projects include:
Y Reduced travel time for buses
Y Reduced stop and signal delay for buses
Y Reduced variability in operations or schedule
adherence for buses
Y Reduced recovery time at end of run
Y Fuel savings
Y Air quality benefits
Y Reduced operating resources required
Y Number of signal cycles to clear a queue
before/after granting TSP
Y Reduced queue on mainline
Y Minimal delay to other vehicles
Y Reduced accidents (pre-emption)
Y Decreased travel time of emergency
vehicles (pre-emption)
Y Public response
4.2.3.3 TSP Concept of Operations (ConOps)
Having defined the goals and objectives of the TSP
project / program, and the MOE’s that result from
these objectives, the stakeholders will need to review,
discuss, and define the actual ConOps. This will define
what the stakeholders want the system to be able to
do from the users’ point of view, and how it should
function. The ConOps will later be used to define func-
tional requirements and guide the choice of technology.
The Concept of Operations will clarify what the system will
do from the users’ point of view, and how it will be used.
This will include a description, at a high level, of the major
entities within the TSP system, the flows of information
among those entities and to entities external to the sys-
tem, the high-level capabilities of the system, and the main
daily operational occurrences for the system, in particular
through the definition of operational scenarios. There are
various approaches to articulating operational scenarios,
including the use of flow diagrams, or a more narrative
approach, as in a “day in the life of the system…”14
PPAA
RRTT
II
22 Y Transit Signal Priority Handbook
14 Building Quality Intelligent Transportation Systems Through Systems Engineering, prepared by Mitretek Systems Inc. for the ITS JointProgram Office of US DOT in 2002: http://www.its.dot.gov/JPODOCS/REPTS_TE/13620.html
WHAT IS MORE IMPORTANT FOR THE TRANSIT SYSTEM TO OBTAIN THROUGHTSP: IMPROVED TRAVEL TIME OR IMPROVED SERVICE RELIABILITY?
To the extent that improved service reliability is a critical objective, and that the variability entails both early
and late running buses, then priority should only be granted “conditionally” based on vehicle schedule adher-
ence (or headway interval). This serves to assist late buses and reduce the variability of buses running ‘hot’.
However, a requirement to grant priority based on a determined lateness condition requires a mechanism for
continuously monitoring schedule adherence (or headway interval in cases where “headway management” is
the basis of service control). An Automatic Vehicle Location (AVL) system can perform this function (e.g.
Portland or Vancouver), or it can be structured through a sophisticated central traffic control system (e.g. Los
Angeles). The information on conditionality will also need to be conveyed to the PRG/PRS system, increas-
ing the communications requirement. In any case, a requirement for a “lateness conditionality” will result in
a more sophisticated system and have strategic implications for the structuring of the TSP project/program.
On the other hand, if the goal is to simply decrease travel time, the system can grant priority to each bus
that arrives at an equipped intersection within certain parameters. Those traffic system-related priority
request criteria (e.g. recovery) allow the engineers to be more aggressive with the signal timing, since each
bus is not requesting priority. Recovery generally takes one or two cycles. After the signals have recovered,
they will grant priority to the next bus that arrives. This type of priority can be handled with signal soft-
ware and does not require AVL, and therefore is much simpler and less costly to implement.
Key Question:

In order to define the ConOps, stakeholders will
have to examine and decide on a wide range of ele-
ments of the system that will define the system
and how it operates.
Examples of system elements that will need to be
defined might include:
Y Centralized versus distributed control
Y Integration with EMS pre-emption (Yes/No)
Y Request Generator (PRG) conditionalityrequirment (Yes / No)
Y If required, basis of conditionality:
t Type of service (express or local)t Schedule adherencet Headway management
Y Active Priority strategy choices
t green extensiont early green (red truncation)t actuated transit phase (access, egress
from off-street terminal)t phase insertion (e.g. queue-jump)t phase rotationt phase skipping
Y TSP Control Strategy Parameters (by intersection)
t Extension timet Truncation timet Phase insertion pointst Intersecting transit corridors (and rules for
PRG/PRS, if yes)t Ability to use different levels of “low” priority
Y Detection distance capability
Y Check-in / Check-out mechanisms
Y Traffic control system conditions
t Handling of coordinationt Windows in cycles for priority requests –
frequency and durationt Recovery process (e.g. lock out of
requests, other)t Jurisdictional Rulest Data to be collected
Determining the actual combination of operational
functionalities and characteristics that best meet
local requirements of the stakeholders may take
considerable discussion and iterations.
The ConOps should also include an explanation of
how the TSP project will be integrated with any perti-
nent traffic systems and procedures and EMS pre-
emption requirements, as well as with transit systems
and procedures. As discussed, this should also include
consideration of the relationship of TSP implementation
to any existing plans to modify/ upgrade/replace traffic
control equipment and systems.
Having decided on the above key elements of the
TSP system, a ConOps Document can be prepared
and describe, based on the decisions made by the
stakeholders, the TSP system and how it will func-
tion, as well as the operational and support environ-
ments that complete the picture of the TSP concept
of operations. Elements to be included in the docu-
ment include high-level descriptions of:
PPAA
RRTT
II
Transit Signal Priority Handbook Y 23
HOW MUCH PRIORITY CAN BE GRANTED?
This depends on many variables, including cycle length, complexity of phases, traffic on intersecting streets,
protection of minimum clearance times for pedestrians, accuracy of check-out mechanism, etc. This will be
the subject of considerable discussion between stakeholders. In addition, standard times granted for exten-
sion/truncation will have to be tailored to the specific conditions at individual intersections. The case stud-
ies in the Appendices provide examples.
However, once agreed upon, it is important to have this agreement on how much priority is to be granted for-
mally documented in the Memorandum of Understanding or Interagency Agreement. In some jurisdictions,
the seconds of priority granted (mysteriously) diminish over time and the TSP project is left with granting lit-
tle actual priority. This can be avoided by having a written agreement that will help clarify expectations for
the transit agency and traffic engineers, combined with an ongoing data collection/monitoring system. These
mechanisms will be especially valuable as original participants are replaced by newcomers over time.
Key Question:

Y Operational procedures describing what the users,
and system components are performing, and under
which specific conditions,
(i.e. the operational scenarios),
Y Equipment necessary for the system to be
operational (e.g. signal controllers, loops, vehi-
cle detectors, on-board equipment, etc.),
Y Hardware necessary for system deployment,
Y Software necessary for system operations,
Y Interfaces with other ITS systems,
Y Personnel necessary to operate and maintain
the system,
Y Facilities necessary to meet the needs of the
fully functional system, in particular if TSP is to
be combined with other priority measures (e.g.
relocated bus stops, bus bays, turn lanes, etc.),
Y Other support necessary,
Y etc.
4.2.3.4 Requirements Document
The ConOps defines the operations of the TSP sys-
tem and the control strategies the TSP system
should be able to perform. This can be used to
define the requirements for the system from a tech-
nical point of view, which will in turn be used to
select the most effective technological solution for
the defined requirements. Requirements should be
clear statements of what is desired.
Developing Functional Requirements for ITS (FHWA-
OP-02-047. April 2002.) defines Require-
ments as being, “…statements of the capabilities that
a system must have, geared to addressing the [needs]
that a system must satisfy.”
PPAA
RRTT
II
24 Y Transit Signal Priority Handbook
WHAT SHOULD BE IN A CONOPS DOCUMENT?
In much of the literature on ITS systems engineering, the ConOps Document actually serves to summarize
many of the decisions and core elements of the planning phase, including: scope, needs / justification, identi-
fied stakeholders, operational overview and scenarios, etc.. The ANSI/AIAA Guide for the Preparation of
Operational Concept Documents (ANSI/AIAA G-043-1993) for example, provides a visual description of the
core elements that might be contained in a ConOps document.
The specific contents of the ConOps document will likely vary from location to location, as well as over time, as
experience with ITS systems engineering grows. What is most important is that there be a systematic process
for answering the basic questions asked in this handbook, and that this be clearly docu mented.
Key Question:
1. Scope.System identification, purpose and overview. Contents, intention, and audience for OCD.
2. Referenced Documents.
4. Operational Needs.Mission and personnel needs that drive the requirements for the system.
5. System Overview.Scope; users; interfaces; states and modes; capabilities; goals and objectives; system achitecture.
6. Operational Environment.
7. Support Environment.
3. User-Oriented Operational Devices.How mission accomplished: strategies, tactics, policies, constraints. Who users are and what they do:
✹ When and in what order operations take place✹ Personnel profile; organizational structure✹ Personnel interactions; activities✹ Operational process models; sequence, interrelationships.
8. Operational Scenarios.Detailed sequences of user, system, and environmental events:
✹ Normal conditions✹ Failure events✹ Handling anomalies/exceptions
✹ "Stress conditions"✹ Maintenance mode
Describes system characteristics from an operational perspective
"What does it look like from my point of view?"
Concept ofOperations
Concept ofOperations
1
2
1
3
4
5
8
67

Generally, there are two levels of Requirements:
functional and non-functional Requirements.
Requirements Engineering defines the differ-
ence as being, “…functional Requirements
describe what the system should do and non-
functional Requirements place constraints on
how these functional Requirements are imple-
mented.” It is often the case, however, that
these are combined into one general statement
of overall system requirements.15
The Requirements Document will describe in much
greater detail the concepts that were developed in
the ConOps. The ConOps is for a general audience
and the Requirements Document is for an engineer-
ing audience. It needs to contain sufficiently clear
detail to allow the engineers to design, build, and
operate a system. A Requirement is a statement of
system functionality that conveys some task or
objective that the system must perform or meet.
Similar to the Concept of Operations development
process, the Requirements development process is
iterative.16 As an example, the City of Seattle
requires that controller software meet the following
requirements for offering transit signal priority:
Y Traffic signals shall extend their green intervalfor approaching priority vehicles
Y Traffic signals shall shorten red displays forapproaching priority vehicles
PPAA
RRTT
II
Transit Signal Priority Handbook Y 25
WHAT ARE EXAMPLES OF TSP SYSTEM FUNCTIONAL REQUIREMENTS?
The following provides an illustration of examples of more specific types of requirements that may be
outlined in the Requirements Document.
TSP Operation:
Two types of TSP operation shall be provided during both “Free” and “Coordinated” modes.
Y TSP operation during “Free” operation shall increase the green time provided to transit phase/s and
decrease the green time to the non-transit phase/s without interrupting the normal phase sequence.
Y TSP operation during coordination shall increase the green time provided to transit phase/s and
decrease the green time to the non-transit phase/s without adverse impact to signal coordination.
TSP Functional Features:
Y TPR controller inputs shall be programmable to allow one or more phases to be selected for priority treatment.
Y Any phase or compatible phase pair shall be programmable as the TSP phase(s)
Y Provide capability to extend green intervals for the priority phase(s) (programmable by time-of-day )
Y Provide capability to shorten green displays using programmable minimum phase duration for non-pri-
ority phases (programmable by time-of-day )
Y Provide capability to retain normal vehicle and pedestrian clearance intervals. (programmable by time-of-day )
Y Provide capability to serve all signal phases without changing phase sequencing.
Y Provide transition back from priority mode that retains coordination.
Y Provide override of priority input upon conflicting high-priority (emergency vehicle) call,
Y Provide timer that prohibits the reservice of a priority treatment, (programmable by time-of-day )
Y Provide delay timer that delays acting on the TPR input (programmable by time-of-day)
Y Provide locking detection of TPR input, with release of lock upon serving priority phase
Y Provide capability to operate during main street walk rest operation
Y Provide a minimum of four (4) TSP Alternate Split Plans/TPR Input
These are merely examples provided for illustrative purposes, and the specific requirements in any given
TSP implementation will need to be discussed and decided by the stakeholders.
Key Question:
15 TMC Pooled Fund Study: Developing and Using Concept of Operations in Transportation Management Systems, Chapter 6. The Next Step:Using the concept of Operations to Drive Requirements, December 16, 2004, page 3. Found athttp://tmcpfs.ops.fhwa.dot.gov/cfprojects/uploaded_files/Chapter6_Final_Dec16_2004.doc May 26, 2005.
16 Ibid.

Y Traffic signals shall not shorten any minimum orclearance intervals
Y Traffic signals shall not skip any phasesY Traffic signals shall not break coordination
It should be noted that the ConOps requirements
might vary across different jurisdictions because
of different traffic control software or controller
equipment, or because of local policy. These vari-
ations will need to be reflected in the
Requirements document.
4.2.4 Corridors and Intersections [Wherewill TSP be implemented?]
The next step is to define where TSP is to be imple-
mented. This has been defined at a high level in
the ConOps. (See “Boundaries on the Scope of the
System.”) The selection process depends on the
vision and scope of the project. In some cases, the
stakeholders can identify trouble spots immediately
and the project can be structured to address these.
In other instances, a corridor is pre-determined
because it has already been chosen as a BRT corri-
dor. Regardless, it may be necessary to perform an
engineering analysis to prove to decision-makers
and Board members that the project is warranted
and likely to produce the desired results.
There may be opportunity for TSP deployment in
conjunction with a new arterial management project
or Transportation Management Center development.
Stakeholders may be able to identify other projects
in the region that will be complemented by or
enhanced by TSP deployment.
The engineering analysis does not have to be an
expensive endeavor. It is likely that the Needs
Assessment that was done early on will suffice,
since the data gathered may well match closely the
first-hand knowledge stated by the stakeholders.
But decision-makers often need documented evi-
dence to back up funding decisions.
Insomesituations, suchas the implementationofa
TSPprogram ina largemetropolitan region, itmaybe
necessary toconducta full-scalestudy inorder toeval-
uateandselect themostappropriateTSPcorridors
within thenetwork. Thesestudiesmay relyonvarious
criteria (e.g. timesavingsbenefits, service reliability
benefits, transit use, transit potential basedoncensus
data, transit dependence,etc.). In somecases, specif-
icevaluation toolshavebeendeveloped toevaluate
potentialTSPdeploymentsites–suchasKingCounty
Metro’sTIMbenefit / costmodelor the IllinoisRTA’s
regional assessmentbasedonsimulation tools.
4.2.5 Technology Alternatives Analysis and System Architecture [How will TSP work?]
The final step in the TSP planning phase is to select
the most appropriate technology solution to meet the
defined requirements, i.e. how the TSP system will
work. This involves first defining a TSP system architec-
ture, and then evaluating the alternative TSP technolo-
gies in light of the requirements and TSP architecture.
PPAA
RRTT
II
26 Y Transit Signal Priority Handbook
HOW DO WE PICK THE RIGHT SITES (INDIVIDUAL SITES, CORRIDORS,NETWORK) FOR TSP?
Picking the right sites relates directly to the goals and objectives of your project. Each intersection should
present a problem (such as causing transit delay) that TSP can help resolve. Although every agency seems
to have a slightly different set of criteria for picking TSP sites, nearly everyone agrees that you don’t want
to implement TSP at an intersection in which there is no delay caused by the traffic signal. Criteria listed
by successful deployments vary widely and include: potential for bus rapid transit or express service; heavy
traffic volume; number of passengers per hour; service frequency; amount of service disruption; level of
transit use; transit potential based on census data; and transit dependence.
Key Question:

4.2.5.1 Definition of TSP System Architecture
Building on the ConOps and Requirements docu-ments, the stakeholder team will need to develop theTSP System Architecture within which the technologywill operate. A system architecture describes theoverall framework of the system you are building. Itrefers to the physical system environment (hardware,networks, facilities) and the logical constructs (subsys-tems) that function in the pysical environment. It pro-vides the blueprint on which to design the system17.
For a TSP system architecture, this involves identify-
ing the relationships between the vehicle, PRG,
PRS, controller, and/or transit and traffic centers (as
appropriate), as well as the required communica-
tions to link them.
The development of the architecture is likely to be
an iterative process because it is co-related to the
selection of the specific technologies for PRG/PRS
and communications.
Figure 2 provides an illustration of one such architecture.
4.2.5.2 TSP Technology Alternatives Analysis
Special local conditions may affect the approach forselecting the TSP technology (including bothPRG/PRS and communication links). For example,the technology selection process may be pre-determined in order to meet a constraininglocal requirement established by the stakeholders(e.g. integrate with existing EMS pre-emption system and equipment).
Typical steps for this technology evaluation processmight include:
Y Structure the technology alternatives analysisprocess (steps, participants, etc.)
Y Develop evaluation criteria based on the
PPAA
RRTT
II
Transit Signal Priority Handbook Y 27
Controller
Local Master
Local Master
Super Master
Fixed Point- to-Fixed Point
Communication
Fixed Point-to-Fixed Point Communication
Vehicle-to- Infrastructure Communication
GPS
Bus
GPS
ATP PRG
Detectors
Controller
TSP Processor
Controller
Database
PRS
Field Traffic Managment
CenterFleet
Vehicles
FIGURE 2 EXAMPLE OF TSP SYSTEM ARCHITECTURE (CALTRANS/PATH PROJECT)
17 Building Quality Intelligent Transportation Systems Through Systems Engineering, prepared by Mitretek Systems Inc. for the ITS JointProgram Office of US DOT in 2002: http://www.its.dot.gov/JPODOCS/REPTS_TE/13620.html

functional requirements and TSP system architecture
Y Identify alternative TSP system technology solutionsY Obtain information (this may include literature
searches, site visits, use of simulations, and/orlocal technology evaluation tests)
Y Evaluate any implications of technology selected on the functional requirements
Y Evaluate and select
The results from the technology evaluation process
may conclude that no technology currently exists
that fully meets all identified ConOps and TSP sys-
tem architecture requirements. This might lead to
reviewing/revising the project requirements.
Alternatively, it may lead to initiating a research and
development effort to develop and test new prod-
ucts or systems that meet the desired require-
ments, as discussed below.
TSP PROJECTDESIGN
The TSP Planning phase defined the broad charac-
teristics of the TSP system, including the Concept of
Operations (ConOps), Requirements Document, TSP
System Architecture, and technology solutions. The
design phase reviews the generic choices in light of
the specific realities in the field (in terms of actual
equipment layout, specific intersection geometric
design, local traffic conditions, etc.) and translates
these choices in ways that can be implemented cor-
ridor-by-corridor and intersection-by-intersection.
In reality, this phase will be carried out in parallel
with the procurement phase as an iterative process
in order to ensure that the technology functional
requirements are consistent with the realities
emerging from the design phase, but also to ensure
that the design engineering is modified to meet any
requirements of the specific technologies that are
actually acquired. For example, final engineering of
equipment in the field, in the controller cabinet, or
on-board the buses, cannot take place until a ven-
dor has been selected, and the final design specifi-
cations have been developed.
The discussion below concerns only issues related to
the design of the TSP system. It is important to note
that the design process will become more complex if
TSP is being implemented in conjunction with vari-
ous physical priority measures (e.g. bus lane, bus
bulbs, queue jump, etc.), or as part of a BRT project,
or as part of a comprehensive Transit ITS initiative. In
these cases, TSP is only a component of a much larg-
er initiative. However, many of the issues identified
in this report will still need to be addressed.
5.1 Detailed Data Collection and Inventory of Traffic Control System
Once the ConOps has been defined and the corri-
dors and specific intersections where TSP will be
implemented have been selected, it will be neces-
sary to conduct a major data collection effort. Data
needs to be collected on current traffic conditions in
order to refine the design of the TSP strategies; to
measure the “before” conditions for use in any
evaluation studies; and to provide a complete inven-
tory of intersection geometry, field equipment, cabi-
net location and layout, communication lines, power
supply, etc. This detailed inventory is used for
detailed engineering and preparation of equipment
installation and construction if required. Some of
this information may be available; but most agen-
cies have found that a significant data collection and
inventory effort is needed.
Traffic Data that may need to be collected includes:Y Traffic volumes and turning movements - AM
peak / PM peak / mid-day / all dayY Pedestrian crosswalk volumesY Speed & delay studies (general traffic and tran-
sit vehicles)Y Free flow (floating car) travel times / speedsY Turn movements & volumesY Level of ServiceY Delays / queues
In addition, it may be valuable to collect bus data:Y “before” dwell time / travel timeY variability of travel time by time of dayY layover / recovery times at end of routesY bus stop activity (ons / offs)Y transfersY pedestrian movements of transit riders
In lower traffic the street network performs best.In high traffic there is often a breakdown in trafficflow at intersections. Signalized intersections con-strain the traffic and then release it in platoons. Inthe best of circumstances, the platoon will proceed
PPAA
RRTT
II
28 Y Transit Signal Priority Handbook
5

smoothly to the next intersection, reaching the sig-nal just as it turns green. One reason traffic engi-neers sometimes have a bias against buses is thatbuses stop frequently making it relatively impossi-ble to maintain a smoothly flowing platoon acrosslanes. But then all vehicles entering and exitingthrough curb cuts and stopping before turns to allowpedestrian movements interrupt the traffic flow.These disturbances are generally in the right handlane. Sometimes turns are made into drivewaysfrom the left lane. Data should be collected in thelane(s) that best represents the general traffic flow.
5.2 Detailed Design and Engineering for Central Control and CommunicationsSystems Components
Depending on the system architecture and technology
solutions selected and procured, there may be required
modifications to the central control system and to the
communications network. Any modifications to these
systems will need to be designed and engineered.
5.3 Detailed Design and Engineeringby Intersection
Similarly, all installations in the field (new equip-ment, new connections, cabinet modifications, newloops, new detection equipment, etc.) will needto be designed and engineered, intersection-by-intersection. Although templates can be pre-pared in advance, there are always peculiarities inthe field that will be encountered and that willneed to be addressed case-by-case. This is avery labor-intensive effort.
As part of the TSP program, the option of relocating
bus stops to the far side of the intersections should
be investigated because of the previously men-
tioned benefits. The relocation of the bus stop will
need to be assessed in light of various considera-
tions, including: bus passenger activity and move-
ment, traffic patterns, street geometry, pedestrian
activity, community design, etc.
5.4 Detailed Design and Engineeringof On-Board Equipment
Most TSP technologies involve the installation of on-
board equipment. The installation of this equipment
requires engineering; this is the case in particular, if
the equipment is mounted externally and therefore
vulnerable to damage from bus washers or road col-
lisions, or if the technology requires line-of-sight
accuracy for detection. Generally, such engineering
needs to be done only once for every bus model.
PPAA
RRTT
II
Transit Signal Priority Handbook Y 29
IS A “FAR-SIDE” BUS STOP PLACEMENT POLICY FEASIBLE?
The near-side/far-side bus stop placement debate has existed within the transit industry from its very begin-
nings with strong arguments for each side. However, the placement of a bus stop on the far side of an inter-
section provides many advantages in the design of a TSP system. It will help disentangle the bus from con-
flicts with right-turning general traffic. It will simplify the green extension calculation and make the vehi-
cle’s “check-out” more accurate, thereby ensuring that the green phase is only extended as much as is really
needed, rather than based on a prediction of stop dwell times. This should free up more green time for
transit vehicles overall and reduce the need for recovery where subsequent buses are locked out from receiv-
ing priority. However, the decision to move well-established bus stops is a difficult one for transit systems,
and may involve various ramifications, including stop/shelter relocation costs, conflicts with local residents
and retail owners, and unintended or undesired pedestrian movements
Key Question:

5.5 Optimization and Preparation ofTiming Plans
After installation of the TSP software, it will be nec-
essary to optimize the traffic control system and
prepare new signal-timing plans (see discussion of
optimization in Part III). Where financial resources
are constrained, signal plans may not have been
reviewed or updated for years. In some of the case
studies, the re-optimization of signal plans was in
fact a major benefit to the general traffic, — including
transit — that would not have occurred without the
TSP project. In at least one case (i.e. Pierce Transit),
these benefits were specifically documented through
the evaluation process, by conducting two distinct
“after” analyses, the first after general traffic opti-
mization but pre-TSP installation, and the second
after TSP installation and post-TSP optimization.
5.6 Use of Micro-Simulation Model toDesign TSP Control Strategy inSpecial Cases
In some cases, TSP-compatible micro-simulation
tools (such as VISSIM) are used to conduct more
sophisticated analyses of a complex situation or to
evaluate corridor impacts (see Part III for a descrip-
tion of these tools). These tools require more data
and effort to calibrate than standard engineering
models, but are sometimes useful because they
specifically model the impact of TSP and the bene-
fits to transit vehicles. In addition, they are visually
stunning and provide valuable supports for presen-
tations to decision makers.
5.7 Special Considerations
5.7.1 Developing and Deploying New orEnhanced TSP Technologies
TSP technologies are evolving rapidly. New
approaches to detection and communication, includ-
ing the combination of GPS and wireless communi-
cations, are being considered, developed, or
deployed as part of more recent TSP technologies.
New controller and ITS standards are being devel-
oped and deployed. New approaches to ITS data col-
lection, transmission, and archiving are also emerg-
ing. This evolving situation offers great opportunities
to develop increasingly more sophisticated technical
solutions to address the limitations of older approaches.
It also means that there are fewer off-the-shelf technical
solutions. The case studies highlight several instances
where transit and traffic agencies became involved in
development efforts to create a more flexible controller
interface (e.g. King County Metro) or a system for col-
lecting data (e.g. Pierce Transit).
You may have the opportunity to be on the leading edge
and chose to develop or deploy a new and unproven
technology as part of your TSP project. If you have
funds for research and development, it is laudable to
advance the state of the technology. This may yield a
more effective solution to meet your local require-
ments and is good for the industry, but is higher risk
than implementing an older proven technology with
limitations. One should weigh the options carefully.
The decision to embark on a “development” effort will
need to be carefully integrated into the overall TSP
project, and will need to address such issues as:
Y Funding sources and implication (e.g. supple-mental evaluations studies)
Y Related risks and their impacts on project man-agement (e.g. schedule)
Y Process for managing the required R&DY Specific requirements related to acceptance
testing (for hardware and software)Y Ownership of intellectual propertyY Procurement costs for distributing the products
developed under this initiative to other potentialjurisdictions in the region
5.7.2 Integration with Planned Transit ITS Project
The potential integration of a TSP project into an
overall transit ITS project has been identified as a
strategic consideration. Some of the specific
design-related issues include:
Y Sequencing / phasing of design and engineer-ing activities
Y Degree of modularity of the TSP componentwithin the overall ITS project
Y Design of process for assessing defined “con-ditions” and the generating of priority requestsbased on these conditions
Y Archiving of PRG request data
PPAA
RRTT
II
30 Y Transit Signal Priority Handbook

5.7.3 Integration with EMS Pre-emption
Similarly, it may be necessary to analyze the impli-
cations of integrating TSP with EMS pre-emption.
Issues to consider include:
Y Integration of legacy EMS pre-emption systemwith TSP
Y EMS services to receive priority (e.g. firedepartment vehicles only?, or all EMS vehi-cles?, necessary approvals (e.g. state leg-islative requirements), and implications forproject management
Y Implications for TSP priority strategy choicesand parameters, especially if TSP and EMS pre-emption are not simultaneously implementedin the same jurisdictions
Y Resolution of conflicts between different levelsof priority (e.g. priority vs. pre-emption)
Y Upgrades for existing EMS vehicles
TSP PROJECT IMPLEMENTATION
6.1 Procurement
6.1.1 Project Management – Procurement and Deployment
After the TSP system has been planned and
designed it will move into the procurement and
deployment stage. Throughout the procurement
and deployment process the lead agency will have
the responsibility to maintain documents in an
orderly manner so they can be retrieved in the
future to use as a model, settle disputes, or to
build upon the existing system.
In addition, it may be valuable, if this has not yet
been done, to develop more formal Memoranda of
Understanding or Interagency Agreement docu-
ments to clearly state financial, operating, and
maintenance obligations as well as ownership of
equipment. This becomes more important once
financial resources are to be committed to ensure
there are no misunderstandings that could
become serious conflicts between stakeholders
down the road.
6.1.2 Procurement Strategy
At this point the project manager will either be
happy he/she has included someone from the con-
tracts and procurement office as an internal stake-
holder, or be woefully sorry she or he has not.
Each agency has rules about procurement that can-
not be sidestepped. Having a procurement officer
on the team early on helps assure that the procure-
ment office has some understanding of the project
planning and design and will work with the project
manager to create a smooth procurement process.
If no one from that office was involved in the early
stages, the project manager must now brief the
office and bring them up-to-speed. The procure-
ment office needs to understand the intent of the
project as well as the technical aspects.
The method of procurement will most likely be either
by bid or by RFP. If the design process has resulted
in a bid document, the procurement will be a bid. In
a bid process responders state that they will meet
the design exactly as specified and give the cost.
If the design process resulted in functional specifi-
cations, then an RFP should be created. This
appears to be the more common approach for TSP,
given the complexity and potential design variations
that are inherent in TSP projects.
An agency would chose to use the bid process if
the agency has available (either in-house or hired)
the expertise to write a detailed design document;
that specifically outlines the required technical solu-
tion, to the exclusion of potential other approaches.
It also assumes that there is no uncertainty as to
the ability of the required technology to meet the
ConOps requirements. Sometimes the design is
dictated by other actions already taken in the
region, and a bid document makes sense. Once
the design is complete, the bid process is straight-
forward and does not require intense involvement
of the stakeholders.
An agency might chose the RFP process if they are know
what functions they want but are looking for alternative
approaches to meeting a diverse set of requirements. The
RFP process also allows responders the opportunity to be
creative with solutions that the client may find more attrac-
tive than their own ideas.
PPAA
RRTT
II
Transit Signal Priority Handbook Y 31
6

The stakeholder team will need to decide what pro-
curement strategy to pursue and carefully lay out
the procurement process, including milestones,
communications managements, evaluation process
and criteria, approvals requirements from the vari-
ous jurisdictions, etc. All agencies have experience
with their own procurements processes; the main
issue in a TSP procurement is that it involves multi-
ple stakeholders who most likely have not worked
together previously in a joint procurement, and like-
ly operate under different procurement rules and
processes. It is helpful if all differences in stake-
holder procurement processes are discussed and
clarified prior to starting the process so that there
are no surprises later on.
6.1.3 Preparation of RFP’s and/or Bids(Procurement Documents)
Generally it is a good idea to create a functionally-
based RFP to allow responders to tell you how they
would address the issues you state, and encour-
ages creative solutions. The responder(s) will
respond to an RFP with a design the responder
believes will meet the client’s needs. It will explain
the proposed technology and how it will meet the
functions requested. It will also include cost infor-
mation. The response may state certain assump-
tions about the existing situation and equipment at
the agency saying that based on these assump-
tions, the cost would be X dollars. The RFP
process allows responders the opportunity to be
creative with solutions that the client may find
more attractive than their own ideas, and it may
recommend technological solutions that the agency
hasn’t even considered.
The RFP may be prepared in-house if the agency
has sufficient expertise. This is not an area in which
an agency wants to scrimp. Poorly prepared RFP’s
and bid documents cause misunderstandings and
destroy credibility. They rarely result in useable pro-
posals, so they waste valuable time for the request-
ing agency and those who propose. If in-house
expertise is not available, the agency will want to
contract with someone who is experienced in writ-
ing RFP’s for TSP. In finding the right person or firm
to do this work, the agency can follow normal con-
tracting procedures. Most agencies will want to be
sure to ask for a list of successful projects that
resulted from the contractor’s RFP writing. It is
also a good idea to follow up on references by con-
tacting someone at each agency listed to be sure
the contractor actually did the work that is claimed
and that the RFP resulted in practical proposals.
The RFP or bid documents should require:
Y All functions the agency wants performed
including an explanation of how the respon-
der’s TSP solution will handle the:
t Planned control strategy
t TSP control strategy parameters
t Circumstances (conditions) under which
priority is to be granted
t Detection distances required and to be used
t Check-in / check-out mechanism
t Required accuracy of detection mechanism
t Technological approach to detection /
Priority Request Generator (PRG)
t Technological approach to Priority Request
Server (PRS)
t Data collection at PRS and at the con-
troller, and archiving process
t Interfaces with on-board ITS systems
(if required)
Y A listing of any data the transit agency or traffic
engineering office wants collected
Y A listing of any reports the transit agency or
traffic engineering office wants created with
collected data
Y Access to data and the ability to create future reports
Y Compliance with specified ITS standards
Y A listing of special considerations for any tech
logical interfaces (e.g. AVL, TMC, traffic contro-
sytem upgrade)
Y A description of compliance with open/nonpro-
pretary hardware and software requirements,
or software escrow requirements
Y Required design and engineering for installa-
tion at intersections
Y Required design and engineering for installa-
tion / interface with central control and com-
munications systems
Y Creation of a process for testing and proving
PPAA
RRTT
II
32 Y Transit Signal Priority Handbook

pre-defined reliability and acceptability of all
equipment before it is installed in the field (this
may include inspection at the fabricator’s facili-
ty before shipment)
Y Completion of the pre-installation testing
process before installation
Y A clear description and schedule of any installa-
tion of equipment and software required of the
supplier by the RFP
Y A clear description and schedule of when and
where equipment will be installed on buses
(The transit agency may need to provide garage
space for the installers to work on buses. Be
aware of conditions such as weather and light-
ing that need to be clarified.)
Y A clear description and schedule of when and
where equipment will be installed in the field.
(The traffic engineering office will be intensely
involved in this process because field installa-
tion has the potential of disrupting traffic.
Consideration must be given to time of day, day
of week, placement of installation equipment,
signal disruption, and potential traffic hazards.)
Y Clear delineation of responsibility for obtain-
ing any right-of-way and electrical permits if
supplier is to be involved in installation
Y Post-installation testing of all installed equip-
ment and software
Y Documentation of equipment installed, which
might include:
t Wiring diagrams
t Installation drawings
t Detailed description of timing plan adjust-
ments made by priority type
t Documentation for any special equipment,
cards, and/or relays
t Catalog cuts and shop drawings of equip-
ment stating specifications for each piece
of equipment
t Manuals for maintenance and operations
t Equipment warranty information
Y Development of training documents for opera-
tion and maintenance personnel including bus
operators, mechanics, and field technicians
who will deal with any and all TSP equipment
Y Performance of training for operation and main-
tenance personnel including bus operators,
mechanics, and field technicians who will deal
with any and all TSP equipment
Y Warranty period including any additional train-
ing that may be required
6.1.4 Vendor Selection Process
After bid documents or RFP’s are distributed, it is
often good to have a Pre-Bid (or Pre-RFP) Conference
where any potential bidders or responders are invited
to ask questions about the project in a forum where
all can hear the questions and the answers.
In a bidding-process selecting the winner is fairly
simple. Based on the criteria used by the agency,
such as low bid, the winner will be identified.
The RFP selection process is more involved. Most
agencies create a team to review proposals and
select a vendor. The team will be drawn from the
already-identified stakeholders. If there are ques-
tions as to the meaning of statements in the pro-
posals, the team may want to have a meeting with
each vendor to clarify all issues in the proposals. If
that occurs, there will be another round of “best
and final offers.” (Most TSP projects are not so
complicated as to require this second round.) The
review team will examine all proposals based on a
list of criteria the team has created. Usually points
are allocated to each criterion. Examples of criteria
may include: response to technical specifications,
experience and responders’ record of on-time com-
pletion, financial resources, price, meeting equal
opportunity goals, etc. These are just examples of
criteria. Your criteria will relate to the mission and
goals of your organization. After adding and averag-
ing points, the winning responder will be identified.
After the stakeholder team has selected the suc-
cessful responder and informed all respondents as
to their selection or non-selection, there may be fur-
ther negotiations and clarifications with the suc-
cessful responder/vendor. Good communication
with the vendor at this point can prevent lost time,
misunderstandings, future change(s) of scope, and
in extreme cases — lawsuits.
PPAA
RRTT
II
Transit Signal Priority Handbook Y 33

6.2 Installation
6.2.1 Equipment Installation
After the vendor is chosen and contracts are final-
ized the equipment installation process can begin.
The lead agency must provide one point-of-contact
for the contractor so that there is no danger of
scope modification by someone in the agency who
is not authorized to modify the contract. The point-
of-contact will be the only person who can author-
ize a change in scope, schedule or payment. The
lead agency will be responsible for overseeing step-
by-step every aspect of the contract and, through
the point-of-contact, will give the vendor/installer
feedback along the way to avoid surprises at the
end of the contract.
To avoid large-scale headaches, all equipment
should be pre-tested and proven before installation.
The stakeholders representing risk assessment and
quality control will want to be sure all equipment
functions properly and may have a process in place
to ensure quality of equipment. The vendors gener-
ally have standard tests to demonstrate the proper
function of the equipment including software, hard-
ware, and the PRG/PRS systems. If the vendor
does not have a standardized test, then the vendor
will be required to create a test as was stated in
the procurement documents.
6.2.1.1 Installation of Bus Equipment
The stakeholders in bus operations — who have been
involved since the beginning of this process – will
move into a more active role to oversee equipment
installation on buses. The transit agency will have to
make buses available to the contractor for installation.
This is an important consideration because buses may
have to be taken out of service during installation.
Some vendors will install at night but they may charge
a higher fee for night work. These issues will be han-
dled easily with good communication. If possible,
these installation conditions should have been speci-
fied in the procurement documents. Bus mainte-
nance is not unusual for transit agencies; and vendors
understand the problem of taking buses out of rev-
enue service. The important issue is that agreement
is reached early on to avoid unpleasant surprises.
6.2.1.2 Installation of Field Equipment
The case studies illustrated that one of the most
labor-intensive aspects of any TSP project is the
installation of equipment in the field. This may
involve any or all of the following tasks:Y Installation of detector/PRG units on arm masts or
utility polesY Connection to power linesY Installation of PRS unit, sometimes within con-
troller cabinet or nearbyY Connection of PRS to power and communication
lines and controllerY Cutting of new embedded loops in pavementY Replacement / relocation of controller cabinet
and possible construction of new concrete padand connections
Y Remote or on-site downloading of softwareand/or new signal settings to controller
The traffic engineer(s) representing the
jurisdiction(s) in which field equipment will be
installed will need to oversee installation of field
equipment and connection to controllers and power.
The traffic engineering office will have to coordinate
with the vendor and/or engineering consultant for
field installation, and the vendor will have to con-
form to the traffic engineering office’s accepted pro-
cedures for field installation to reduce liability.
Consideration must be given to time of day, day of
week, placement of installation equipment, signal
disruption, and potential traffic hazards.
Construction contractors may also be required in
some cases (e.g. loop installation, relocation of con-
troller cabinets), or if TSP project involves reconfig-
uring road geometry (e.g. queue jump).
If the TSP program involves bus stop relocation, the tran-
sit system will need to develop a parallel but coordinated
process to address repositioning stops and shelters.
The stakeholders from the respective IT depart-
ments can help oversee the installation of any
central software.
PPAA
RRTT
II
34 Y Transit Signal Priority Handbook
PPAA
RRTT
II

6.2.2 Training
The RFP/bid documents should require the vendor to:Y Develop training documents for operations and
maintenance personnel including field techni-cians, bus mechanics, bus operators, etc., whowill deal with any and all TSP equipment
Y Perform training for operations staff and bus operatorsY Perform training of transit maintenance person-
nel including mechanicsY Perform training of field technicians who will
deal with any TSP equipment in the field and/orconnections to controllers
Many agencies have found that the “train the trainer”
technique works best. In other words, the vendor will
train a smaller numbers of personnel who will then
train others. Regardless of whether the agency
requires the vendor to train all or a portion of pertinent
positions, the agency needs to develop a plan for train-
ing new hires in the future. This can be accomplished
by adding the TSP training to the standard training for
bus operators, mechanics, and field technicians.
Many agencies do not feel that any TSP-specific
training is needed for bus operators. If the opera-
tors have no control over the TSP equipment, they
simply obey traffic signals. If the drivers have any
role to play in testing equipment, turning it off or
on, or reporting problems, then some training
should be provided.
6.2.3 Internal Communications
There is an observed tendency for TSP projects to be
carried out by the dedicated staff in relative isolation
of other internal transit staff. This is a natural occur-
rence because the TSP functionalities do not signifi-
cantly impact ongoing transit operations and mainte-
nance activities. Most TSP systems today do not
require bus operator involvement and require minimal
maintenance of on-board equipment. In addition, the
most active dialogue is with external stakeholders
(traffic engineers and consultants / suppliers). This
typically provides the TSP Project Manager with con-
siderable autonomy, but also makes more difficult
cooperation with other departments that are not
actively involved. It has been previously argued that
internal stakeholders (e.g. scheduling, procurement,
operations, and maintenance) need to be included
from the outset. Given the nature of TSP projects,
and the relative isolation within the transit agency, it
will be important for the Project Manager to strive for
the proper balance in internal communications: to
keep internal stakeholders and decision makers (e.g.
management, Board) informed of progress without
creating an onerous task.
One point may be worth highlighting. As the TSP
system is being installed and starts to generate
results and data, this may be the appropriate time
to enter into a more active dialogue with staff from
PPAA
RRTT
II
Transit Signal Priority Handbook Y 35
PPAA
RRTT
II
HOW WILL THE TRANSIT SYSTEM TAKE ADVANTAGE OF ANY TRAVELTIME SAVINGS CREATED BY THE TSP SYSTEM?
The transit system’s scheduling department should reflect on this issue to ensure that any travel time sav-
ings are not just lost in increased time spent by the vehicle and the operator sitting at the end of the route.
This creates several requirements. First, the transit system will need to have a mechanism for continuously
monitoring running times so that the improvements in travel time and the reduction in their variability, cre-
ated by the TSP system, can be identified. State-of-the-art APC or AVL systems are well geared to provide
such information, or the TSP system itself may be structured to gather this information. Some transit agen-
cies use personnel (ride checkers) to gather running time information, but this approach will require a con-
certed effort to concentrate the use of the checkers on the TSP routes to gather sufficient data on the post-
TSP running times. Second, this issue requires ongoing internal discussion and coordination from the very
beginning between the planning staff installing the TSP and the staff responsible for preparing the sched-
ules. Third, it will require an assessment of the scheduling process and system itself; many experts with
TSP experience have suggested that one needs to be able to distinguish between “layover time” as required
in the labor contract versus “recovery time” that is added to address the variability in running times. The
transit system needs to be able to reduce the “recovery” portion as travel times and reliability improve. This
is sometimes difficult for larger transit systems.
Key Question:

the scheduling department. This dialogue is needed
in order to raise awareness, and to start developing
the process by which savings in travel time and
improved reliability (resulting in the reduction of l
required scheduled recovery time) can be gradually
worked into the schedule, thereby resulting in
increased efficiency. This can be a complex discus-
sion and will require time, especially given the long
time-horizons between successive schedules (typi-
cally prepared only three to four times a year).
6.2.4 Publicity
Depending on the regional and agency goals, the
agency may or may not choose to have a media
campaign advertising the TSP installation. Some
agencies use the TSP project as a way to inform the
public of the importance of transit in a region and
as a demonstration of regional cooperation and
problem solving. Some agencies include a brief
mention of TSP as part of other more comprehen-
sive efforts (e.g. launching of a new BRT service).
Some agencies turn-on the TSP system without any
fanfare to avoid anticipated adverse publicity or reac-
tion. Decision makers in the transit agency and
impacted jurisdiction(s) should reach agreement about
publicity before anyone takes action in this area.
6.3 Verification and Validation
6.3.1 Testing of Equipment
Once all equipment has been installed, verification
and validation begins.
The procurement documents laid out several steps
in this respect, including:
Y Creation of a process for testing and proving
acceptability of all equipment before it is
installed in the field,
Y Completion of the testing process before
installation (pre-testing)
Y Testing of all installed equipment and software
(post-installation acceptance testing)
6.3.2 Testing of System
Traffic engineering departments are likely to have
their own testing / acceptance procedures for traffic
control software and controller upgrades. Testing
and acceptance procedures from the multiple juris-
dictions will need to be discussed and agreed upon
by the stakeholder team prior to procurement.
Once totally installed, procedures should be fol-
lowed to test, verify, and validate the TSP system in
its entirety.
6.3.3 Validation of Detection Distances and Accuracy
One specific issue raised during the case studies
related to the validation of detection equipment,
both optical and RF-based. In many cases, this
required careful attention and/or attenuation.
Generally each intersection presents slightly (or
vastly) different geometric designs that may require
different detection distances and/or zones. The pro-
cedures for verification and validation will vary
depending on the detection technology chosen.
With optical detection some agencies choose to set
up equipment with standard settings and later read-
just settings and equipment placement if buses
aren’t detected properly. Others have installed
equipment on a truck to simulate a bus, and then
installed detection equipment on the mast arm
while the truck is in the spot in which they want the
bus detected. With loop detection, the loops will
be installed at a distance from the intersection that
is based on an assumed speed at which the bus
will be traveling. Verification would consist of run-
ning a vehicle with a detector over the loop to
determine if a signal is sent to the receiver.
OPERATIONS AND MAINTENANCE
7.1 Ongoing Performance Monitoringand Management
Ongoing performance monitoring and management
of a TSP system requires data collection. This rep-
resents an area of weakness in most current tech-
nologies. Although some PRG systems (especially
if they are integrated with on-board AVL) incorpo-
rate a mechanism for logging when requests have
been generated, by which bus, and under what con-
PPAA
RRTT
II
36 Y Transit Signal Priority Handbook
7

dition, data collection from the PRS and controller
remains problematic. Many PRS and controllers
cannot store data, or if they do, they do so only on-
site, and this data can only be obtained by manually
downloading it in the field. Therefore, in many
cases, one does not know if the system is operat-
ing correctly and granting priority, and cannot monitor
what priority action is being used, for what bus, and
under what circumstances. This is a major issue that
future TSP projects will have to grapple with.
Ideally, one would want to collect various data:
Y time call was requested,
Y vehicle number,
Y high or low level priority,
Y specific priority routine invoked,
Y range and intensity of detection signal,
Y when call was dropped,
Y call duration period,
Y priority request disposition (e.g. not granted,
why not granted, when granted, etc.)
To address the issue of lack of data, current TSP
deployment sites have had to develop their own
solutions. Pierce Transit has developed a stand-
alone system for retrieving data at the controller and
transmitting the data via cellular communications to
an internet-accessible archived database, which can
be used to verify operational status and perform vari-
ous types of analyses. King County Metro has
developed a sophisticated unit capable of interfacing
with different types of controllers, but also capable
of logging data on PRS and controller activity.
In the future, the lack of data collection / monitoring
should be less of a concern: centralized TSP system
architectures automatically incorporate data archiv-
ing capabilities, and the TSP technologies currently
under development are increasingly sophisticated
and should be more capable of addressing this
weakness. In the mean-time, agencies will need to
identify means to collect data for purposes of ongo-
ing monitoring, management, and analysis, and to
ensure that the TSP system is operating properly.
For those systems where data is available, travel
times and signal timing can be calculated from col-
lected data. If the transit agency or traffic engineer-
ing office would like to collect and use data created
by the TSP system, that should be made clear in
the procurement document.
There should be an agreement among the stake-
holders (preferably with a memorandum of under-
standing or inter-agency agreement) concerning
what data will be collected and how it will or will
not be distributed and shared.
7.2 Procedures to Ensure System is Operating
Both the transit agency and the traffic engineering
offices will need to have some procedures to
ensure that:
Y the TSP system is operating properly
Y the PRG is generating priority requests
Y the PRS is processing the requests and com-
municating them to the controller, and that
Y the controller is granting the appropriate priority
action for the circumstances.
With respect to on-board equipment, some agen-
cies have a short test bed that each bus runs
through in the morning as it leaves the garage in
order to validate that the on-board TSP equipment is
working. This approach can work with loops, optical
systems, radio frequency system (RF) tags, etc.
PPAA
RRTT
II
Transit Signal Priority Handbook Y 37
HOW DO WE HANDLE MAINTENANCE AND WHAT IS THE COST?
Surprisingly this is not as big an issue as one might imagine. In most cities the transit agency handles main-
tenance of all equipment on the bus during routine maintenance, and the traffic agency handles all equip-
ment on the street or signal during routine maintenance. The various technologies and equipment seem to
be robust enough to have caused few problems. Although the maintenance issues are not huge issues, it is
very important that agreement be reached before implementation on how maintenance will be handled so
that it does not create a misunderstanding or become a big issue.
Key Question:

Unfortunately, on the street, it is often difficult to
determine if the PRS and controller are not
responding. A few signal systems actually have
monitoring technology, and some centralized signal
systems have monitoring capability (e.g. Los
Angeles), but many do not. In addition, most TSP
systems modify the signal timing in such a small
and subtle way that the bus operator won’t immedi-
ately notice that the signal is not responding. It is
only over a period of time that added seconds make
an impact. Sometimes over the course of an opera-
tor’s shift, he or she will notice that the signal has
not been responding properly and will report it. This
is a haphazard approach to ensuring ongoing proper
functioning, and better mechanisms will need to be
developed in the future as well as improved data
monitoring capabilities.
There should be agreements in place so that if a signal is
not responding, there are procedures for having it fixed.
7.3 Maintenance
TSP maintenance seems to be an insignificant issue
in many cases. Both on-board and field equipment
seem to be reliable, requiring little maintenance.
However, agreements need to be in place for the
occasions in which maintenance is required.
The policy in most areas is that transit agencies main-
tain whatever is on the bus and that traffic engineers
maintain field equipment, incorporating maintenance
tasks into standard maintenance activities. This is
another reason why it is important for traffic engineer-
ing and bus operations and maintenance to be part of
the stakeholder team. As mentioned, it is useful to
have agreements stating the maintenance and ongo-
ing financial policies to avoid misunderstandings or
changes in attitude in case of personnel changes.
Maintenance procedures should be spelled out by
the equipment supplier in the provided maintenance
documents. Stakeholders will need to agree on the
level of spares to be initially acquired and for the
ongoing financial responsibility for acquiring addition-
al replacement components and future upgrades.
EVALUATION, VERIFICATION,VALIDATION AND BUILDING ON TSP
8.1 Evaluation Study
It is important to evaluate the impact of TSP for a
number of reasons. First, in several of the case
studies, the evaluation study of the demonstration /
pilot project helped to document the benefits
derived from TSP while confirming the minimal
impact on non-priority street general traffic. This is
a basic concern from all traffic engineering staff,
and the evaluation study serves to allay those con-
cerns. If the evaluation study illustrates that the
benefits are positive and the impacts on general
traffic are acceptable, then the trust between stake-
holders is reinforced. This in turn facilitates the next
step of wide-spread implementation of TSP across
the region.
A good evaluation will also help determine the
future direction of TSP in the transit agency.
Because most transit agencies are strapped for
funds, it is important to know what programs are
cost effective. An evaluation with positive results
will justify the TSP implementation(s), and an evalu-
ation with negative results will raise important red
flags and help guide future decisions.
In addition, the evaluation study may clarify the spe-
cific conditions under which TSP is most cost effec-
tive. If financial resources are highly constrained,
this knowledge may help guide the choice of corri-
dors or intersections for future TSP implementation.
In order to evaluate a project in a meaningful way,
one needs Measures of Effectiveness (MOE) that
relate to the objectives of the project. Examples of
MOEs used by various agencies include:
Y Reduced travel time for buses
Y Reduced stop and signal delay for buses
Y Reduced variability in operations or schedule
adherence for buses
Y Reduced recovery time at end of run
Y Fuel savings
Y Air quality benefits
Y Reduced operating resources required
Y Number of signal cycles to clear a queue
before/after granting TSP
PPAA
RRTT
II
38 Y Transit Signal Priority Handbook
8

Y Reduced queue on mainline
Y Minimal delay to other vehicles
Y Reduced accidents (pre-emption)
Y Decreased travel time of emergency
vehicles (pre-emption)
Y Public response
Creating MOEs for your TSP project was suggested
as a useful step in the planning phase. If the
MOEs relate to the project objectives, before and
after measurements will determine project suc-
cess. At the least, you will want to determine
through objective measurements the impacts on
traffic and person movements.
A record of comments from transit users, general
traffic users, and drivers will help demonstrate the
success as well. All of the gathered information can
help the agency prioritize future TSP deployments.
In at least one of the case study sites, evaluation stud-
ies were deemed critical to the ongoing cooperation of
the stakeholders, and were carried out systematically:
Y Data was collected before TSP implementationon a corridor
Y A first evaluation was then conducted aftergeneral traffic optimization but pre-TSP installation
Y A second evaluation was then conducted afterTSP installation and post-TSP optimization
This process was conducted on a number of TSP
corridor installations.
In another case study site, an innovative approach
to pre- and post-TSP impacts was implemented.
Because there is a lot of variability among transit rid-
ership, transit operators, weather, and public driving
patterns, it was determined that pre- and post-analy-
sis would be most accurate if the variability could be
reduced. Therefore, during a very limited data col-
lection period, data was collected for half of the time
with TSP enabled, and the remaining half of the time
with TSP disabled. This allowed a more accurate
comparison of the impacts of TSP implementation.
8.2 Ongoing Data Collection
A previous section discussed the difficulties of col-
lecting data on an ongoing basis with current TSP
and controller technologies. Collecting data on an
ongoing basis would be valuable not only to monitor
the proper operation of the system, but also
because the data potentially represents a valuable
source of information for analysis purposes.
Data collected from the TSP/controller system along
an entire corridor might yield a variety of valuable
information. This data is typically collected from
transit’s AVL. Examples include:
Y Travel times (especially their variability) by time
of day, day of week, and season
Y Schedule adherence
Y Scheduled layover and recovery time
From this data one can determine:
Y Impact and effectiveness of alternative TSP
control strategies
Y Impact of different “conditions” on priority and
running times
Y Impact of stop dwell time on priority requests
Y Impact of bus operator driving behavior, etc.
PPAA
RRTT
II
Transit Signal Priority Handbook Y 39
HOW DO WE EVALUATE THE PROJECT TO SEE IF WE HAVE MET OUR GOALS?
A successful project will follow the standard systems engineering approach (recommended in this docu-
ment) that begins with a needs assessment and concludes with an evaluation. If a project is warranted
(which will be determined through a needs assessment), and good planning procedures are followed, the
after-study will show impressive results. The results are important in justifying the expenditure of funds
and in making future plans. Most agencies have found that comprehensive before and after studies were
very worthwhile. In many cases, it may be possible to simulate the before study by collecting data with the
TSP turned off for a short period of time. This approach reduces impacts on analysis by utilizing data with
the same operational impacts (weather, transit driver, seasonal ridership, etc.).
Key Question:

8.3 Building on TSP Benefits throughTransit Scheduling
By reducing time lost at traffic signals, you can
reduce bus running time; and with conditional priority
one can reduce the variability in the running time. To
capitalize on TSP benefits, the transit agency needs
to revise transit schedules to reflect the new under-
standing of running time. This issue requires ongoing
internal discussion and coordination from the very
beginning between the planning staff installing the
TSP and the staff responsible for preparing the
schedules. The scheduler who was identified early
on as a stakeholder can take the lead in this process.
The transit system will need to have a mechanism
for continuously monitoring running times so that the
improvements in travel time created by the TSP system
can be identified. State-of-the-art APC or AVL systems
can provide such information, or the TSP system itself
may be structured to gather this information. Some
transit agencies use personnel (ride checkers) to
gather running time information, but this approach
requires a concerted effort to concentrate the use of
the ride checkers on the TSP routes to gather suffi-
cient data on the post-TSP running times.
Revising the schedules will require an assessment
of the scheduling process and system itself.
Many experts with TSP experience have suggest-
ed that one needs to be able to distinguish
between “layover time” as required in the labor
contract versus “recovery time” that is added to
address the variability in running times. The transit
system needs to be able to reduce the “recovery”
portion as travel times and reliability improve.
Many agencies have found that it is easier to re-
work schedules in small increments. If the recov-
ery time is cut too much, the operators will not be
able to match the schedule, and everyone –
including passengers – will be upset. If the time
is cut too little, the benefit is not maximized.
Cutting a small amount from each schedule mark-
up period may be the least dramatic and least
painful way to adjust the schedules until an opti-
mal schedule is defined.
8.4 Fine-Tuning TSP Design
Finally, the transit system may want to fine tune the
TSP design over time using an iterative process
alternating small schedule adjustments with fine
tuning TSP design. An initial fine tuning of the set-
tings might be the contractor’s last task based on
the observations when TSP has been fully imple-
mented.
The initial TSP strategies and settings are typically a
compromise between what the transit system
would desire and what the traffic engineers feel is
acceptable. However, this initial compromise is
made before the system is implemented and
before any data on impacts exists. One should
develop a process for systematically collecting data
on the TSP actions taken by the controllers, and
comparing it to the time benefits for buses and the
impacts on general traffic vehicles. Over time, as
data is accumulated and analyzed, and experience
grows, it should be feasible to refine the TSP
strategies and settings, or even incorporate new
strategies or technological solutions currently under
development in the research community. This will
require the development of ongoing data collection
systems as well as processes for periodically
reviewing the TSP system.
PPAA
RRTT
II
40 Y Transit Signal Priority Handbook

KEYS TO SUCCESS
TSP projects vary in complexity and scope, but there are some common themes and lessons learned that
apply across the board. Listed below are lessons learned from recent successful TSP implementations.
Some were common to all projects and some were unique. They can provide value to anyone who is con-
sidering TSP.
Early Stakeholder Involvement
A TSP project by its nature involves multiple jurisdictions and agencies and multiple departments in the
transit agency. Getting representatives to the table from all impacted areas can be difficult and cumber-
some, but in the long run, it is the only way to implement a TSP project. Nearly every implementer inter-
viewed listed early stakeholder involvement and communication as the keys to success. Success
requires a good team effort. Get the team on board early and keep it engaged. Consensus among stake-
holders will give the project the energy and support it needs to move to successful implementation.
Good Communication Good communication among agencies, consultants, internal stakeholders, and all partners is critical.
Communication can lead to cooperation and is needed throughout a project to keep the project moving for-
ward and to prevent unpleasant surprises. Without good communication, cooperation is non-existent or is
lost.
A Champion Someone has to get the ball rolling. The champion can come from any agency or jurisdiction, but it is
unlikely that anything will happen without a champion to nudge it along. Enthusiastic support of at least
some of the agencies involved will go a long way to helping the project move forward. It is desirable, if
possible, to get a champion from each involved agency.
Demonstration / Pilot Project to Test TSP and Build TrustThe vast majority of TSP deployments have begun with an initial demonstration or pilot project. This served
three different purposes. First, this allowed for a test of the technical systems and equipment to ensure
that they were all meeting their functional requirements. Second, it provided a basis for measuring the
benefits and impacts of applying TSP. Finally, it provided a way to test TSP on a limited basis and thereby
allay the concerns from traffic engineering staff. This in turn built a level of mutual trust that would enable
further implementation of TSP across a region.
Convincing EvidenceGood before-and-after studies can demonstrate the benefits of TSP and ? more importantly ? the lack of
negative impact on traffic. If studies provide measurable and quantifiable project results and outcomes,
they can present the evidence needed to convince all stakeholders that TSP is a cost effective, beneficial
plan for traffic and transit. It helps to verify operational benefits in accordance with local jurisdictions’ traf-
fic engineering requirements. This puts the information in a language understandable to the people most
impacted. If the traffic engineers and the transit planners all agree that the studies show benefit to the
entire transportation community, the next project should be easier and faster to implement.
PPAA
RRTT
II
Transit Signal Priority Handbook Y 41
9

Pitching the Right IdeasPitching the right ideas from the beginning can be a key to success. The important issues are (1) people
throughput, and (2) passenger wait time (as opposed to passenger load), which includes impacts on transit
passengers not yet on board a bus. We know that high variability creates anxiety in passengers who feel
they have to arrive at a bus stop early. With TSP one can reduce passenger wait time and increase people
throughput.
PartnershipsDeveloping strong jurisdictional partnerships for project coordination and implementation is helpful. These
partnerships are the direct result of stakeholder involvement. If there is a way, through agreements, to for-
malize the partnerships, that can help keep the project moving even when there is staff turnover.
MomentumIt is critical to keep the TSP project moving ahead despite the obstacles. This responsibility will be incum-
bent upon the “champion” and will require solid project management to maintain momentum.
Standardization of EquipmentStandardized equipment can save money and time. Installation, operation, and maintenance are all easier
on standardized equipment. In the presence of multiple jurisdictions, state or county-wide efforts to stan-
dardize TSP-capable controller equipment can be valuable. In any case, stakeholders should discuss the
feasibility of increasing standardization of controller and TSP-related equipment.
Keep it SimpleIt helps to remember to keep TSP objectives simple and build incrementally.
PPAA
RRTT
II
42 Y Transit Signal Priority Handbook

PPAA
RRTT
II
Transit Signal Priority Handbook Y 43

Part2
Part II presents extensive
information on the current state
of the practice of TSP in North
America, Chapter 10 provides
a broad survey of TSP systems
and how they are being used,
and Chapter 11 provides a
summary from the eight
in-depth case studies that were
conducted for this project.

SURVEY ON TSP STATE OF THE PRACTICE
10.1 Introduction
This section highlights the state of the practice of
Transit Signal Priority (TSP) in the U.S. and Canada.
It contains a synthesis of TSP ßexperiences drawn
from a review of existing literature and interviews
with transit agency and traffic engineering person-
nel in areas in the United States and Canada where
TSP and emergency vehicle pre-emption systems
are operational. The literature review and inter-
views have been conducted in order to identify,
inventory and classify TSP and emergency vehicle
pre-emption systems currently in operation and an
effort was made to contact as many agencies with
TSP systems as possible in order to provide a broad
background of the current status of TSP systems in
North America.
10.1.1 Identification of Agencies/Cities with TSP and EmergencyVehicle Pre-emption
A list of 39 agencies/cities initially identified as utiliz-
ing TSP was generated from: (1) a literature review;
(2) Advanced Public Transportation Systems (APTS)
deployment publications; and (3) consultation with
transit/traffic engineering professionals familiar with
TSP in both the U.S. and Canada. The list only
included those agencies/cities that were believed to
have operational TSP systems when the report was
prepared. Table 1 (see next page) contains the list
of agencies generated as part of this project.
Since emergency vehicle pre-emption is built into
traffic signal controller software, the capability to
utilize this feature is directly linked to the existence
of a vehicle detection system for emergency vehi-
cles. The completion of this survey did not include
in-depth contact with emergency response agen-
cies to determine the existence of emergency vehi-
cle priority detection systems. Rather, information
on emergency vehicle pre-emption systems was
obtained from contact with transit agency and traf-
fic engineering personnel familiar with the signal
controller hardware and software and vehicle detec-
tion equipment currently in operation in their cities.
10.1.2 Inventory and Classification of TSP Systems
The information necessary for the inventory and
classification of TSP systems came from two pri-
mary sources: (1) published literature about the
deployments and (2) interviews with the transit and
traffic engineering personnel at the agencies/cities
where the systems are deployed. Throughout the
months of June, July, August and September 2004,
representatives from the 39 agencies on the initial
list were contacted by telephone to discuss the TSP
deployments in their cities.
The interviews consisted of a standard question-
naire regarding the physical and operational char-
acteristics of the transit route; the technical
details of the traffic signal controllers, TSP soft-
ware and vehicle detection systems; and other
questions about the general details of the deploy-
ments (year deployed, number of signalized inter-
sections, etc.). The completed survey forms are
contained in the Appendices.
In the cases where contact was not possible by
telephone, a written version of the questionnaire
was e-mailed to the appropriate personnel. Thirty-
one of the 39 agencies on the initial list were suc-
cessfully contacted and surveyed by telephone
and/or e-mail, which represents a response rate of
Transit Signal Priority Handbook Y 45
State of the PracticeState of the Practice
PPAA
RRTT
IIII
10

PPAA
RRTT
IIII
46 Y Transit Signal Priority Handbook
MASTER LIST OF AGENCIES WITH TSPAGENCY CITY STATEAlameda-Contra-Costa Transit District Oakland CA
Annapolis Transit Annapolis MD
Ben Franklin Transit Richland WA
Calgary Transit Calgary CAN
Centre Area Transit Authority (CATA) State College PA
Central Florida Regional Transportation Authority (LYNX) Orlando FL
City of Glendale Glendale CA
Charlotte Area Transit Charlotte NC
Colorado Springs Transit Colorado Springs CO
Greater Vancouver Transportation Authority Vancouver CAN
Honolulu Transit Honolulu HI
Houston Metropolitan Transit Authority Houston TX
Illinois DOT (Regional Transit Authority (RTA)) Chicago IL
Jefferson Transit authority Port Townsend WA
King County Metro Seattle WA
Kitsap Transit Bremerton WA
LA County Metropolitan Transportation Authority Los Angeles CA
Maryland Transit Administration Baltimore MD
Metro Atlanta Regional Transportaion Authority Atlanta GA
Metropolitan Transit Minneapolis MN
Miami-Dade Transit Authority Miami FL
MUNI San Francisco CA
Napa County Transportation Planning Agency Napa CA
City of Ottawa Ottawa CAN
Pace suburban Bus Service Arlington Heights IL
Pierce Transit Tacoma WA
Phoenix Transit/ Valley Metro Phoenix AZ
Port Authority of Allegheny County Pittsburgh PA
Ride On Montgomery County MD
Sacramento Regional Transit District Sacramento CA
Sanat Clara Valley Transportation Authority (VTA) San Mateo County CA
Skagit Transit Burlington WA
Southeastern Pennsylvania Transportation Authority (SEPTA) Philadelphia PA
St. Cloud Metropolitan Transit Commission St. Cloud MN
Toronto Transit Commission Toronto CAN
Tri-county Metropoliatn Transit District (TriMet) Portland OR
Union City Transit Union City CA
Utah Transit Authority (UTA Salt Lake City UT
Washington Metropolitan Transit Authority (WMATA) Washington DC
TABLE 1 List of Agencies Initially Identified as Utilizing TSP

approximately 80 percent. Of the 31 agencies that
were surveyed, seven indicated that their agency
had not yet deployed TSP or that their TSP deploy-
ment was no longer operational. Table 2 highlights
the response rate achieved as part of this survey,
and Table 3 summarizes the status of the TSP sys-
tems reported by the seven agencies that do not
have operational TSP systems.
The information contained in this document regard-
ing TSP and emergency vehicle pre-emption deploy-
ments was obtained from the interviews with the
24 agencies in the U.S. and Canada that reported
having operational TSP deployments (or TSP sys-
tems currently being deployed) during the summer
of 2004.
PPAA
RRTT
IIII
Transit Signal Priority Handbook Y 47
TABLE 2 Response Rate and Agencies Surveyed
NNUUMMBBEERR PPEERRCCEENNTT OOFF IINNIITTIIAALL LLIISSTT
Initial List of Agencies With TSP 39 100%
Agencies Contacted/ Responded toSurvey
31 80%
Agencies with Operational TSP Systems(Summer 2004)
24 62%
AAGGEENNCCYY SSTTAATTUUSS
Annapolis Transit -Annapolis, MD
No TSP implementations;
pre-emption only
Centre Area Transit Authority - State College, PA
Currently planning for TSP
deployment in late 2005
Maryland Transit Administration -Baltimore, MD
Planning on LRT TSP
deployment
Miami-Dade Transit Authority - Miami, FL
TSP deployment discontinued
Napa County Transportation Planning Agency- Napa, CA
No TSP implementations;
pre-emption planned
Phoenix Transit/ Valley Metro - Phoenix, AZ
No Information available
Ride On -Montgomery County, MD
TSP implementation
discontinued
TABLE 3 Status of Agencies Reporting No TSP Systems

10.2 Summary of Findings on State ofthe Practice
The survey of the 24 agencies demonstrates a widevariety of TSP applications. Several of the agenciesindicated the use of very sophisticated TSP applica-tions with advanced TSP hardware and softwarethat utilize more sophisticated TSP strategies. At thesame time, there are other agencies that are usingTSP in very targeted applications, such as the twoagencies that are using TSP only on a limited numberof intersections for left-turn movements only. TheCity of Ottawa utilizes a unique approach thatincludes several different TSP treatments, including T-intersection queue jump and left turn phase insertion.Additionally, three agencies reported the use of trafficsignal pre-emption (rather than priority) strategieswith their Light Rail Transit (LRT) and bus systems.Finally, several agencies reported one or moreroutes/corridors with TSP systems currently in thedeployment process that are not yet operational.
10.2.1 General Findings
10.2.1.1 Type of Transit Application
Approximately two-thirds of the agencies indicated
the use of TSP only for bus applications, and the
remaining one-third of agencies reported the deploy-
ment of TSP for both bus and LRT applications.
None of the agencies surveyed as part of this study
indicated the use of TSP only for LRT deployments.
10.2.1.2 Year of Deployment
While two agencies reported a TSP deployment as
early as 1985 and several agencies reported TSP
deployments in the early 1990s, the majority of TSP
deployments were completed in the late 1990s and
after the year 2000. There were also several agen-
cies that reported TSP systems that are currently in
the process of being deployed, including the
PPAA
RRTT
IIII
48 Y Transit Signal Priority Handbook
TABLE 4 Year of TSP Implementation
YEAR OF TSP IMPLEMENTATION
AGENCY CITY ST YEARAlameda-Contra-Costa Transit District Oakland CA 2003
Ben Franklin Transit Richland WA 1995
Calgary Transit Calgary CAN 2000
Central Florida Regional Transp. Authority Orlando FL 1997
City of Glendale Glendale CA 2001
Charlotte Area Transit Charlotte NC 1985
Houston Metropolitan Transit Authority Houston TX 2004
Illionois DOT (Regional Transit Authority) Chicago IL 2003
Jefferson Transit Authority Port Townsend WA 1996
King County Metro Seattle WA 1999
LA County Metropolitan Transp. Authority Los Angeles CA 1990
Metropolitan Transit Minneapolis MN 2004
City of Ottawa Ottawa CAN 1990s
Pace Suburban Bus Service Arlington Heights IL 1985
Pierce Transit Tacoma WA 2002
Port authority of Allegheny County Pittsburgh PA 1995
Sacramento Regional Transit District Sacramento CA 2002
Santa Clara Valley Transp. Authority (VTA) San Mateo County CA 1990
Skagit Transit Burlington WA 1993
Southeastern Pennsylvania Transp. Authority Philadelphia PA 2002
St. Cloud Metropolitan Transit Commission St. Cloud MN 2002
Tri-County Metropolitan Transit District (TriMet) Portland OR 1987
Utah Transit Authority (UTA) Salt Lake City UT planned
Washington Metro. Transit Authority (WMATA) Washington DC planned

Washington Metropolitan Transit Authority (WMATA)
and the Utah Transit Authority (UTA). This trend
matches the information obtained from a review of
the literature, in which approximately 70% of transit
agencies with over 100 vehicles reported either
implementing or planning TSP in a 2000 survey18.
Table 4 shows the year of implementation reported
by the 24 agencies with TSP systems.
10.2.2 Route Characteristics of TSP Applications
10.2.2.1 Route Type
The most common bus TSP application is a system
that operates in mixed traffic on four- to six-lane
arterials. Very few agencies reported bus TSP appli-
cations in an exclusive bus or bus rapid transit (BRT)
lane. On the other hand, the LRT applications were
almost exclusively deployed on dedicated right-of-
way (ROW) separate from vehicular traffic flow. The
exception to this trend is streetcar systems, such
as in Philadelphia, that operates on roadways with
mixed traffic flow.
10.2.2.2 Number of Routes
Most trnsit agencies reported TSP deployments
along one or two routes, and only a few agencies
indicated that TSP was deployed on more than six
routes. A number of the deployments were
demonstration projects, which limited the deploy-
ments to one or two routes. A number of agencies
reported that additional routes were planned for
future deployment.
PPAA
RRTT
IIII
Transit Signal Priority Handbook Y 49
TABLE 5 Number of Signalized Intersections with TSP
NUMBER OF SIGNALIZED INTERSECTIONS WITH TSP
AGENCY CITY ST SIGNALSAlameda-Contra-Costa Transit District Oakland CA 62
Ben Franklin Transit Richland WA 31
Calgary Transit Calgary CAN 67
Central Florida Regional Transp. Authority Orlando FL 19
City of Glendale Glendale CA 17
Charlotte Area Transit Charlotte NC 17
Houston Metropolitan Transit Authority Houston TX 1563
Illionois DOT (Regional Transit Authority) Chicago IL 84
Jefferson Transit Authority Port Townsend WA 2
King County Metro Seattle WA 26
LA County Metropolitan Transp. Authority Los Angeles CA 420
Metropolitan Transit Minneapolis MN 22
City of Ottawa Ottawa CAN 40
Pace Suburban Bus Service Arlington Heights IL 12
Pierce Transit Tacoma WA 110
Port Authority of Allegheny County Pittsburgh PA 5
Sacramento Regional Transit District Sacramento CA 600
Santa Clara Valley Transp. Authority (VTA) San Mateo County CA 77
Skagit Transit Burlington WA 80
Southeastern Pennsylvania Transp. Authority Philadelphia PA 61
St. Cloud Metropolitan Transit Commission St. Cloud MN 89
Tri-County Metropolitan Transit District (TriMet) Portland OR 370
Utah Transit Authority (UTA) Salt Lake City UT 12
Washington Metro. Transit Authority (WMATA) Washington DC N/A
18 O’Brien, W. “Design and Implementation of Transit Priority at Signalized Intersections: A Primer for Transit Managers and a Review ofNorth American Experience.” Canadian Urban Transit Association STRP Report 15, Toronto, Canada, 2000.

10.2.2.3 Number of Signalized Intersections
The number of signalized intersections with TSP
functionality ranged widely, from two intersections
utilizing only a transit left turn phase strategy to
over 1,500 intersections in a bus TSP deployment in
a large metropolitan area (Houston). Most of the
transit agencies reported having TSP operational at
10 to 80 signalized intersections. Table 5 shows the
number of signalized intersections reported by each
agency with TSP deployments.
10.2.2.4 Location of Bus Stops
The survey indicated a mixture of near- and far-side
bus stop locations. Most of the agencies reported uti-
lizing both far-side stops and near-side stops. The sur-
vey also provided clear evidence that agencies with
TSP strongly prefer far-side stops and the trend is to
relocate existing near-side stops to far-side stops wher-
ever possible. The main reason for this preference is
that far-side stops eliminate the difficulty of accurately
predicting transit vehicle arrival at an intersection, and
thereby reduces the amount of green extension
required and facilitates “checking out” the bus.
10.2.2.5 Peak Hour Headways
The headways reported by the transit agencies
ranged from 90 seconds to over 30 minutes on
routes using TSP. During the peak hour, most agen-
cies reported headways from five to 30 minutes,
depending on the route and type of service (bus,
LRT, express, etc.).
10.2.3 Hardware for TSP Deployments
10.2.3.1 Traffic Signal Controllers
More than 40% of the transit agencies surveyed
reported the use of NEMA traffic signal controllers,
which are currently the most widely deployed type
of signal controller in the United States. Nineteen
percent of agencies reported the use of Type 170
and 23% for Type 2070 controllers. Figure 3 shows
the traffic signal controller hardware by type; and
Table 6 shows the traffic signal controller hardware
used by each agency surveyed.
10.2.3.2 Vehicle Detection Systems
Approximately two-thirds of the agencies reported
the use of optical vehicle detection systems.
Approximately one-third of transit agencies indicat-
ed the use of a loop-based detection system, which
uses an inductive loop embedded in the pavement
and a transponder mounted on the underside of the
transit vehicle to distinguish the transit vehicle from
other vehicular traffic. Only three agencies reported
using other types of detection systems, including
Global Positioning Satellites (GPS) and radio fre-
quency (RF) systems.
The predominance of the optical detection system
for TSP is generally attributed to the wide-spread
existing use of optical detection for emergency
vehicle pre-emption systems. Since the emergency
vehicle pre-emption systems are far more common
than TSP systems, many transit agencies found that
the signalized intersections along their transit routes
were already equipped with optical detection sys-
tems at the time of planning/deployment of the TSP
system. The use of optical detection for TSP allows
transit agencies to use an existing field detection
system installation, allows for cost savings in terms
of equipment procurement, installation, and ongo-
ing maintenance costs, and eliminates the need to
have two different vehicle detection systems
deployed at each intersection.
10.2.4 Software for TSP Deployments
As previously stated, more than 40% of the sur-
veyed transit agencies reported the use of NEMA
traffic signal controller hardware. This type of con-
troller is generally provided with signal control soft-
ware from the controller manufacturer. Nearly all of
the transit agencies that reported the use of NEMA
controllers also indicated the use of the controller
manufacturer’s software with TSP functionality. A
small number of agencies reported using cus-
tomized controller software with TSP functionality
with their NEMA controllers.
A small number of transit agencies reported the
use of third-party TSP software packages that gen-
erally offer more flexibility than the TSP software
provided with NEMA controllers. These software
packages include BiTran, Wapiti, NextPhase,
PPAA
RRTT
IIII
50 Y Transit Signal Priority Handbook

PPAA
RRTT
IIII
Transit Signal Priority Handbook Y 51
TABLE 6 Traffic Signal Controller Hardware by Agency
FIGURE 3 Traffic Signal Controller Hardware by Type
TRAFFIC SIGNAL CONTROLLER HARDWARE BY AGENCY
AGENCY CITY ST HARDWARE
Alameda-Contra-Costa Transit District Oakland CA
Ben Franklin Transit Richland WA
Calgary Transit Calgary CAN
Central Florida Regional Transp. Authority Orlando FL
City of Glendale Glendale CA
Charlotte Area Transit Charlotte NC
Houston Metropolitan Transit Authority Houston TX
Illionois DOT (Regional Transit Authority) Chicago IL
Jefferson Transit Authority Port Townsend WA
King County Metro Seattle WA
LA County Metropolitan Transp. Authority Los Angeles CA
Metropolitan Transit Minneapolis MN
City of Ottawa Ottawa CAN
Pace Suburban Bus Service Arlington Heights IL
Pierce Transit Tacoma WA
Port Authority of Allegheny County Pittsburgh PA
Sacramento Regional Transit District Sacramento CA
Santa Clara Valley Transp. Authority (VTA) San Mateo County CA
Skagit Transit Burlington WA
Southeastern Pennsylvania Transp. Authority Philadelphia PA
St. Cloud Metropolitan Transit Commission St. Cloud MN
Tri-County Metropolitan Transit District (TriMet) Portland OR
Utah Transit Authority (UTA) Salt Lake City UT
Washington Metro. Transit Authority (WMATA) Washington DC
NEMA Type 170 Type 2070 Other Info Not Available

Caltrans’ C-8, and City of Los Angeles’ custom TSP
software. Since the transit agencies’ choice of TSP
software is limited by the type of signal controller
already in use at the signalized intersections, a
number of agencies are not able to utilize these
third-party TSP software products or are required to
invest in traffic control system and/or equipment
upgrades in order to do so. As advanced signal
controllers such as the Type 2070 controllers
become more prevalent in traffic signal control
applications, it is anticipated that transit agencies
will begin to utilize these third-party TSP software
products that are capable of running on the
advanced controllers. At the same time, there has
also been significant progress with the advance-
ment of TSP software for NEMA controllers, which
will offer transit agencies the benefits of improved
TSP functionality while still utilizing their existing
NEMA controllers.
Readers are encouraged to monitor the progress of
signal control hardware and TSP software since there
are continuous advancements that affect TSP func-
tionality. Also, developments within NTCIP will con-
tinue to impact TSP hardware and software develop-
ment, particularly NTCIP 1211, the evolving standard
that addresses signal control and prioritization.
Figure 4 shows the TSP software by type, and
Table 7 shows the TSP software used by each
agency surveyed.
PPAA
RRTT
IIII
52 Y Transit Signal Priority Handbook
Concept ofOperations
Caltrans E8
WapitiNextPhase
BiTranNo Info
Other/Custom
Proprietary from NEMA
3 6 11 11 11 19 29
FIGURE 4 TSP Software by Type (percent of total software)
TABLE 7 TSP Software by Agency
TRAFFIC SIGNAL CONTROLLER SOFTWARE BY AGENCYAGENCY CITY ST SOFTWAREAlameda-Contra-Costa Transit District Oakland CA
Ben Franklin Transit Richland WA
Calgary Transit Calgary CAN
Central Florida Regional Transp. Authority Orlando FL
City of Glendale Glendale CA
Charlotte Area Transit Charlotte NC
Houston Metropolitan Transit Authority Houston TX
Illionois DOT (Regional Transit Authority) Chicago IL
Jefferson Transit Authority Port Townsend WA
King County Metro Seattle WA
LA County Metropolitan Transp. Authority Los Angeles CA
Metropolitan Transit Minneapolis MN
City of Ottawa Ottawa CAN
Pace Suburban Bus Service Arlington Heights IL
Pierce Transit Tacoma WA
Port Authority of Allegheny County Pittsburgh PA
Sacramento Regional Transit District Sacramento CA
Santa Clara Valley Transp. Authority (VTA) San Mateo County CA
Skagit Transit Burlington WA
Southeastern Pennsylvania Transp. Authority Philadelphia PA
St. Cloud Metropolitan Transit Commission St. Cloud MN
Tri-County Metropolitan Transit District (TriMet) Portland OR
Utah Transit Authority (UTA) Salt Lake City UT
Washington Metro. Transit Authority (WMATA) Washington DC

10.2.5 TSP Strategies
The most commonly used TSP strategy for busesoperating in mixed flow was green extension andearly green (red truncation). This strategy is typical-ly available on the NEMA-based proprietary soft-ware packages, which are used by over 40% of thesurveyed agencies. Several agencies that reportedusing more advanced signal controllers and TSPsoftware packages indicated the use of additionalstrategies, including predictive priority, conditionalpriority (only applied to buses running behind sched-ule), and phase skipping.
Two agencies (Jefferson Transit Authority and PortAuthority of Allegheny County) reported the use of avery targeted TSP strategy of providing a left turntransit phase for buses to make left turn movementsat a limited number of intersections, or to accelerateaccess/egress into off-street terminals. These agen-cies were not using TSP strategies such as greenextension or early green (red truncation) at any othersignalized intersections along the bus corridors.
The City of Ottawa’s unique approach to TSPincludes several different applications. One applica-tion utilizes queue jumps at T-intersections, wherebuses arriving on the side street are provided aqueue jump for making a left turn onto the mainarterial. Another approach is the use of left turnphase insertion for buses at signalized intersec-tions. A third TSP application involves the use of asemi-signalized intersection, where the traffic onthe main street has a signal head and the sidestreet traffic has Stop signs. The main street trafficalways has a green light until a bus is detected onthe side street or a pedestrian call is received.
LRT and bus systems that operate on exclusiveROW or in dedicated bus or bus rapid transit (BRT)lanes were reported to be using pre-emption strate-gies more often than priority strategies. CharlotteArea Transit, Metropolitan Transit and Central FloridaRegional Transportation Authority all reported the useof pre-emption (rather than priority) strategies for theirbus TSP systems. Table 8 indicates the TSP strate-gies reported by each of the surveyed agencies.
PPAA
RRTT
IIII
Transit Signal Priority Handbook Y 53
TABLE 8 TSP Strategy by Agency
TSP STRATEGY BY AGENCYAGENCY CITY ST STRATEGYAlameda-Contra-Costa Transit District Oakland CA EG, GE
Ben Franklin Transit Richland WA EG, GE
Calgary Transit Calgary CAN EG, GE
Central Florida Regional Transp. Authority Orlando FL PR
City of Glendale Glendale CA EG, GE
Charlotte Area Transit Charlotte NC PR
Houston Metropolitan Transit Authority Houston TX EG, GE, O
Illionois DOT (Regional Transit Authority) Chicago IL EG, GE, O
Jefferson Transit Authority Port Townsend WA PI
King County Metro Seattle WA EG, GE
LA County Metropolitan Transp. Authority Los Angeles CA EG, GE, PI
Metropolitan Transit Minneapolis MN PR
City of Ottawa Ottawa CAN EG,GE,PI, O
Pace Suburban Bus Service Arlington Heights IL EG,GE
Pierce Transit Tacoma WA EG,GE,O
Port Authority of Allegheny County Pittsburgh PA PI
Sacramento Regional Transit District Sacramento CA EG, GE
Santa Clara Valley Transp. Authority (VTA) San Mateo County CA EG,GE,PI,O
Skagit Transit Burlington WA EG, GE
Southeastern Pennsylvania Transp. Authority Philadelphia PA EG, O
St. Cloud Metropolitan Transit Commission St. Cloud MN EG, GE
Tri-County Metropolitan Transit District (TriMet) Portland OR EG, GE, O
Utah Transit Authority (UTA) Salt Lake City UT EG, GE
Washington Metro. Transit Authority (WMATA) Washington DC EG, GE
EG = Early Green (red truncation) GE = Green Extension PI = Phase Insertion PR = Preemption O = Other

10.2.6 Challenges and Lessons Learned
10.2.6.1 Use of Existing Signal Controller Systems
The deployment of TSP systems is very dependent
on the existing signal controller hardware and soft-
ware systems. Currently, over 40% of TSP systems
are utilizing NEMA traffic signal controllers, which
are typically utilized with the TSP software provided
by the controller manufacturer. The trend in the
traffic industry is to upgrade existing hardware and
software but this involves considerable expense and
the timeframe for upgrades may not always satisfy
TSP implementation requirements. Additionally, the
availability of centrally controlled traffic signal sys-
tems allows for more TSP possibilities and it is
expected that a number of the agencies with a
large number of signalized intersections will migrate
to centralized traffic signal control. All of these
changes and migrations in traffic signal control
equipment will affect the TSP systems already
deployed or being deployed in those locations.
10.2.6.2 Coordination with Traffic Engineers
Many of the transit agencies attributed the success
of their TSP programs to early and continuous coor-
dination with local traffic engineers. Some agencies
reported the use of tools such as Memorandums of
Understanding (MOUs) or Memorandums of
Agreement (MOAs) to aid in building consensus
among stakeholders. This type of coordination was
particularly important where TSP was implemented
along corridors crossing several jurisdictions, with
several different groups of traffic engineers respon-
sible for the signalized intersections. The agencies
reported very few complaints from motorists
regarding additional delay on the TSP corridors, and
many reported improved levels of service as a
result of the TSP implementation.
10.2.6.5 Measures of Success
While several agencies have been able to measure
and quantify the benefits of their TSP deployments
with demonstrated time savings and improved tran-
sit service, a number of agencies lack the resources
to perform such analyses. Also, some of the agen-
cies reported that the measure of success for their
TSP programs was simply that it was implemented
and operated effectively without any complaints
from motorists. Another measure of success is
whether TSP can reduce variability, which improves
transit attractiveness and can lead to a reduction in
layover time, which will provide for a decrease in
the overall running time on the transit vehicle’s
route. This reduction in layover time, when com-
bined with a reduction in running time, could lead to
the elimination of a transit vehicle from the route
while maintaining the same level of service (or the
provision of a better level of service with the same
number of transit vehicles).
10.2.6.4 Traffic Signal Warrants for Busways
Several agencies reported that traffic signal war-
rants (which have traditionally been based on vol-
ume) do not take into account busways, where the
volume of buses is typically low and only warrants a
stop sign control for the intersections. The agen-
cies indicated that a revision of the traffic signal
warrants could result in recommendations for sig-
nalized intersections at busway locations that would
otherwise not meet the volume-based criteria for a
traffic signal. The use of signalized intersections
along busways would better serve the busway,
while also maintaining an acceptable level of serv-
ice for the cross streets.
CASE STUDIESSUMMARY
Eight case studies were conducted in North American
communities withTSP, to explore their experiences
and highlight the issues that arise, as well as solu-
tions. Understanding derived from the case studies
allowed discussion of the planning and implementa-
tion process presented in Part I. Detailed case stud-
ies can be found in the Appendices. The table on
pages 56-57 summarizes findings from the case stud-
ies to supplement the portrait of the State of the
Practice discussed previously.
PPAA
RRTT
IIII
54 Y Transit Signal Priority Handbook
11

PPAA
RRTT
IIII
Transit Signal Priority Handbook Y 55
FUTURE DIRECTIONS
The National Intelligent Transportation Systems Program Plan: A Ten-Year Vision stated in part:
The ITS vision is to ensure that:
Y Future transportation systems will be managed and operated to provide seamless, end-to-end intermodal passengertravel regardless of age, disability, or location and efficient, seamless, end-to-end intermodal freight movement.
Y Public policy and private sector decision-makers will seize the opportunity to make ITS a vial driver in achieving the vision of the transportation system for the 21st century.
Y Future transportation systems will be secure, customer oriented, performance driven and institutionallyinnovative, enabled by information from a fully integrated spectrum of computing, communication and sensor technologies.19
This vision points to a future in which traffic and transit agencies work together to create the best trans-portation system possible. Passengers do not care who is providing the transportation system. They wanta system that works – that conveniently and quickly takes them to work, home, and play. The future visionfits perfectly with a well-executed TSP system. As has been discussed at length in this document, TSP is acost-effective tool that can help make transit service more reliable and therefore, more desirable. It takesadvantage of, and indeed requires, cooperation among agencies and jurisdictions. The cooperation estab-lished in TSP implementation can be a first step toward creating a seamless transportation system.
What will TSP look like in 10 years? Because there are two main components to TSP we can look at themseparately. There is (1) technology on the bus and (2) technology on the street.
First, with respect to bus technology, a 2000 report20 stated that by 1999, 61 transit agencies operated AVLsystems and 93 were installing or planning such systems. The majority of the planned systems would beGPS-based systems. This indicates that transit agencies will rely more heavily on ITS in the future and thatAVL systems will become more common. With wider application of AVL systems, there is more opportunityto implement more sophisticated TSP systems. AVL-based TSP systems can track vehicle location and com-pare it with scheduled bus times and provide “conditional” priority that will make bus systems more reliable.
A more advanced application for transit involves real-time customer information and moves completelyaway from schedules. With heavy reliance on real-time information, buses could move as quickly as possi-ble through traffic (utilizing TSP). Real-time arrival times could be provided directly to customers throughbeepers, pagers, e-mail, cell phones, PDAs and so on. With cell phones and PDAs becoming ubiquitousand AVL being rapidly deployed, this scenario does not seem far away.
Second, with respect to technology on the street, traffic signal systems are becoming more sophisticated,complex, and adaptive. With the exception of older electromechanical controllers, all modern traffic signalcontrollers utilize some type of software to execute all traffic signal control and, where applicable, transitsignal priority. Modern traffic control systems can monitor traffic more efficiently. Future traffic controlsystems will adapt to shifts in traffic and will change signal timing to meet demand. As traffic controllersand software acquire higher functionality, and wireless and fiber communications systems expand, itbecomes more feasible for the transportation systems to track and provide priority to public transit vehi-cles, and therefore move more people more rapidly through the transportation system.
Taking into account the preponderance of regions throughout the country that state “more mobility” as atransportation goal, it is easy to understand the high level of interest in TSP. It works well now and promis-es to work even better as bus systems and traffic systems become more sophisticated.
19 The National Intelligent Transportation Systems Program Plan: A Ten-Year Vision, January 2002, Intelligent Transportation Society ofAmerica and United States Department of Transportation, page 3.
20 Advanced Public Transportation Systems: State of the Art Update 2000, Report Number FTA-MA-26-7007-00-1, September 2000, Federal TransitAdministration and Volpe National Transportation Systems Center, page 2-30.
12
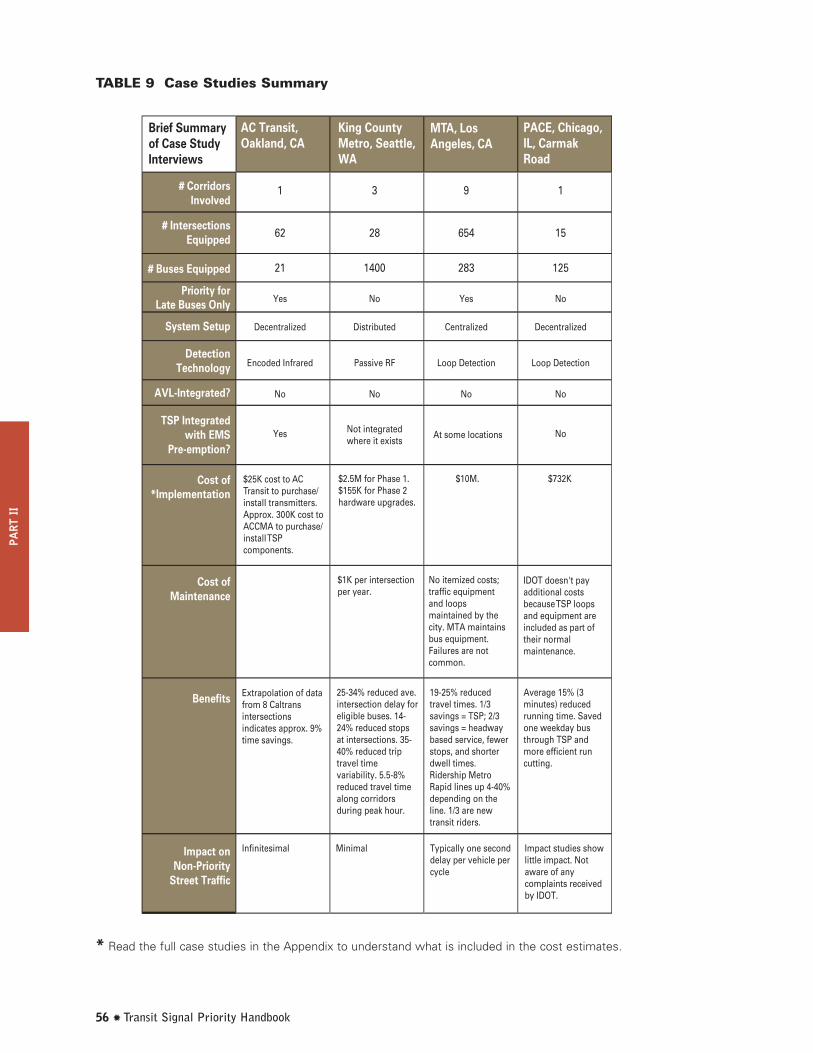
PPAA
RRTT
IIII
56 Y Transit Signal Priority Handbook
AC Transit,Oakland, CA
King County Metro, Seattle, WA
MTA, Los Angeles, CA
PACE, Chicago, IL, Carmak Road
# CorridorsInvolved
# IntersectionsEquipped
# Buses Equipped
Priority forLate Buses Only
System Setup
DetectionTechnology
AVL-Integrated?
TSP Integratedwith EMS
Pre-emption?
Cost of*Implementation
Cost ofMaintenance
Benefits
Impact onNon-Priority
Street Traffic
Brief Summary of Case Study Interviews
1 3 9 1
62 28 654 15
21 1400 283 125
Yes No Yes No
Decentralized Distributed Centralized Decentralized
Encoded Infrared Passive RF Loop Detection Loop Detection
No No No No
Yes Not integratedwhere it exists
At some locations No
$25K cost to AC Transit to purchase/ install transmitters. Approx. 300K cost to ACCMA to purchase/ install TSP components.
$2.5M for Phase 1. $155K for Phase 2 hardware upgrades.
$1K per intersection per year.
Extrapolation of data from 8 Caltrans intersections indicates approx. 9% time savings.
Infinitesimal Minimal Typically one second delay per vehicle per cycle
Impact studies show little impact. Not aware of any complaints received by IDOT.
25-34% reduced ave. intersection delay for eligible buses. 14-24% reduced stops at intersections. 35-40% reduced trip travel time variability. 5.5-8% reduced travel time along corridors during peak hour.
19-25% reduced travel times. 1/3savings = TSP; 2/3savings = headway based service, fewer stops, and shorter dwell times. Ridership Metro Rapid lines up 4-40% depending on the line. 1/3 are new transit riders.
Average 15% (3 minutes) reduced running time. Saved one weekday bus through TSP and more efficient run cutting.
No itemized costs; traffic equipment and loops maintained by thecity. MTA maintains bus equipment. Failures are not common.
IDOT doesn't pay additional costs because TSP loops and equipment are included as part of their normal maintenance.
$10M. $732K
TABLE 9 Case Studies Summary
* Read the full case studies in the Appendix to understand what is included in the cost estimates.

PPAA
RRTT
IIII
Transit Signal Priority Handbook Y 57
Pierce Transit, Tacoma, WA
TransLink, Vancouver, BC
TriMet, Portland, OR
Virginia Route 1
# CorridorsInvolved
# IntersectionsEquipped
# Buses Equipped
Late Bus Priority?
System Setup
DetectionTechnology
AVL-Integrated?
TSP Integratedwith EMS
Pre-emption?
Cost ofImplementation
Cost ofMaintenance
Benefits
Impact onNon-PriorityStreet Traffic
Brief Summary of Case Study Interviews
6 18
110 59 on B-Line and 4 on Willingdon
250 25
245 28 650 12
No Yes Yes No
Decentralized Distributed Decentralized Decentralized
Encoded Infrared Encoded Infrared Encoded Infrared
No Yes Yes No
NoYes Yes Yes
$2.7M. TSP budget was CD $1.3M (US $860K at the time) for hardware and software
Infrared emitters on Bline corridor. Visual recognition tech. on Willingdon bus lane.
CD $24K (US $20K) per year
None discernable because technicians clean detectors while they are cleaning the signal heads.
Improved speed and reliability. TSP and signal optimization reduced transit signal delay about 40%. Project also resulted in economic benefit to the general public. (GP): $14.2M/year for 6 corridors from signal coordination after TSP. Ave. total signal delay on S.19th down 18-70% (GP) and 5-30% (transit). On Pacific Ave: 30-65% (GP) and 18-21% (transit).
Very little impact. No noticeable impact.
Very little. TSP impact not yet assessed. Additional delay caused by EMS pre-emption is small.
98 B-Line reduced travel time in the corridor from 100 to 84 minutes. Resulted in a 23% modal shift from auto to transit in the corridor. Net benefit of the BRT line: CD $2.9M (US $2.4M). Main TSP benefit: significant reduction (40-50%) in travel time variability.
Reduced recovery time; increased reliability. For Line 4 in Nov. 2000, TriMet was able to avoid adding one more bus. which means savings. There are also benefits to emergency response and on-time performance for transit vehicles.
Improved travel for buses. Added emergency responder confidence.
650 buses - 0.2 FTE - signals warrantied for 5 years. No additional cost for signal maintenance.
2
Currently being discussed with Fairfax County.
$5.8M. $220K for equipment only, for 25 intersections + 12 buses

Part III presents a wide
range of background
information to assist transit
and traffic staff who
are exploring TSP
implementation.
Part3

Part III presents a wide range of background infor-
mation to assist transit and traffic agency staff that
are exploring the implementation of TSP. TSP
requires a strong partnership of both transit and
traffic agency technical staff to ensure its success.
However, the research for this study showed over
and over that the differences in training, methodolo-
gies, and even technical language for traffic engi-
neering and transit planning, was often an important
barrier to cooperation and understanding between
transit and traffic staff.
As a result, it appeared valuable to provide in this
handbook, a range of technical information that
could be drawn upon in the pursuit of TSP. In partic-
ular, technical information concerning traffic equip-
ment and systems, terminology, and pertinent con-
cepts is provided for the benefit of transit planners
working on TSP. Similarly, information concerning
transit terminology and concepts is provided for the
benefit of traffic engineers.
Part III covers the following topics:• TSP System Architecture, Equipment, Software
and Communications• Traffic Engineering Terminology• Simulation and Optimization Tools for TSP• Transit Terminology• References for Part III
TSP SYSTEM ARCHITECTURE,EQUIPMENT, SOFTWARE, AND COMMUNICATIONS
This section will provide transit and traffic engineer-
ing professionals a general understanding of the
architecture and components of TSP and their
respective range of functionalities. The information
provided in this section covers systems and subsys-
tems that are currently in use or available for use in
the United States and Canada. When considering a
complex implementation of a TSP system, it is
important to consult an experienced TSP profession-
al who is familiar with the latest TSP systems and
technologies available on the market. In addition, it
is important to recognize that no two TSP systems
are the same and that TSP equipment and software
varies for every application. A thorough design
effort needs to be completed for each TSP applica-
tion to ensure the most effective TSP system, given
the individual characteristics of each application and
the functionalities that are required by each agency.
PPAA
RRTT
IIIIII
Transit Signal Priority Handbook Y 59
Technical SupportTechnical Support
FleetManagement
FleetManagement
Tra ffic SignalController
(Coordinator)
FleetVehicle(s)
PrimaryComponents
PriorityRequest
Generator
PriorityRequestServer
FIGURE 5 TSP Architecture Elements [based on NTCIP 1211]
13

PRG-2PRG-3
PRG-5
Priority RequestServer
PRG-1
PRG-4
TransitManagementCenter
TrafficManagementCenter
Traffic SignalControl System
TransitVehicle
FIGURE 6 TSP Main System and Components
Note: Solid lines in the figure represent the TSP system links between potntial alternative PRGlocations and the PRS. Dashed lines represent information flows required by the PRG to detect aspecific bus and/or to assess whether he transit vehicle meets any defined for requesting priority.
13.1 TSP System Architecture
Initial implementations of TSP projects were techno-
logically simple, involving some mechanism for
detecting the transit or EMS vehicle, using embed-
ded loops or optical strobe systems. The detection
of a vehicle would then initiate a process within the
phase selector and/or controller to grant priority (or
not) based on fairly simple criteria.
Technology has evolved tremendously, enabling the
possibility for a variety of technologies to detect the
vehicle, as well as more sophisticated two-way
communications between the vehicle and the con-
troller, either directly, or via the central transit and/or
traffic centers. This allows for more sophisticated
messages and the feasibility of incorporating various
criteria to refine the granting of priority based on
whether the vehicle meets pre-defined conditions.
As a result, ITS standard development efforts for sig-
nal priority and TSP have been undertaken as part of
initiatives under the National Transportation
Communications for ITS Protocol (NTCIP 1211) and
Transit Communications Interface Profiles (APTA TCIP
TWG 10). These have led to the development of a
TSP System Architecture concept. Figure 5 illus-
trates the main building blocks of the architecture.
Figure 6 illustrates the main elements of a TSP sys-
tem and the alternative communications scenarios.
There are three main systems involved:
Y The Priority Request Generator (PRG) system
that generates the request for priority. The
PRG can be located in the transit vehicle, the
transit management center, the traffic manage-
ment center, or the traffic signal control system
equipped with wayside transit vehicle detec-
tion. Alternative approaches exist for generat-
ing a request for priority: wayside detection of
the transit vehicle by the local traffic signal con-
trol system (PRG-5); direct active communica-
tion from the transit vehicle (PRG-4); or com-
munications via the transit and/or traffic man-
agement centers based on knowledge of tran-
sit vehicle location (PRG 1, 2 or 3).
Y The communication system that links PRG,
PRS and other components.
Y The Priority Request Server (PRS) usually con-
tained within the traffic signal control system
that receives and processes the request(s) for
priority at the intersection(s) based on prede-
fined TSP criteria.
PPAA
RRTT
IIIIII
60 Y Transit Signal Priority Handbook

13.1.1 Priority Request Generator
Once a vehicle has been detected or has communi-
cated to the PRG, the PRG is responsible for initiat-
ing requests for priority based on predefined crite-
ria, which may be unconditional (e.g., priority auto-
matically requested for all transit vehicles on certain
routes) or conditional (e.g., priority requested for
transit vehicles that are behind schedule by more
than 5 minutes).
Depending on the approach selected, the priority
request system may be based at the local intersec-
tion level or at the management center level. A
transit vehicle may be detected at the local inter-
section level through a combination of an on-board
transmitter and a receiver on the intersection
approach. For detection at the network level, a
transit vehicle may communicate with a transit or
traffic management center, providing its location
directly. When a priority request is generated,
either at the intersection or network level, it may be
forwarded directly to the local intersection con-
troller or first pass through a central management
center for approval and/or processing.
13.1.2 Communications System
The communications system for TSP includes the
provision of detection / priority request information
from transit vehicles to the local intersection or to
transit and traffic management centers, and if a
management center is used, from center-to-center
and center-to-intersection as applicable. In addition,
the TSP system should include a mechanism for
capturing data related to TSP utilization, for off-line
analysis and refinement of strategies, and this will
require additional communications from the individ-
ual intersection controllers to the data archiving
server(s) at the traffic and/or transit centers or con-
tracted suppliers.
13.1.3 Traffic Signal Control System
The traffic signal control system is responsible for
acting on the priority request and making any appli-
cable changes to the signal indications via the local
traffic signal controller. For a simpler system, the
local traffic signal controller may be able to perform
this function completely, while in other cases, a
PPAA
RRTT
IIIIII
Transit Signal Priority Handbook Y 61
KKeeyy QQuueessttiioonn::
WHAT IS CONDITIONAL AND UNCONDITIONAL TSP AND HOW DO WEDECIDE WHAT WE NEED?
The words “conditional” and “unconditional” mean different things to different people. No system is strict-
ly unconditional. All systems have some criteria for granting TSP. For example, if three transit vehicles
approach the intersection in three consecutive signal cycles, it is unlikely that the second and third transit vehi-
cles will be granted TSP in any system. For the purpose of this handbook, the term “conditional” means that
TSP is granted for transit vehicles that are meeting specific criteria such as (transit vehicles running behind
schedule, on route, etc.). In some systems, conditional priority can be granted only if the system “knows” that
the transit vehicle is running late. That means that there must be a way of comparing the transit vehicle loca-
tion to its schedule.
The decision as to whether to have conditional or unconditional priority would be based on several criteria. If
you have some kind of vehicle location technology and your goal is to increase reliability, it makes sense to grant
conditional priority. Granting priority to a bus running ahead of schedule would decrease reliability. If the goal
is to speed up bus service (perhaps because service is very frequent or the route is an express route), then it
makes sense to grant priority to all buses. Passengers on an express bus are happy to move quickly once local
service is ended; no one will miss the bus because it was early (local service has ended and no more passengers
are boarding) and everyone is happy to arrive at a destination quickly. Therefore, the decision of whether to
have conditional or unconditional TSP depends on your goals for TSP, and on the technology you have
available or planned.

centralized traffic signal control system arbitrates
the request prior to directing the local controller to
take applicable action. Depending on predefined
parameters, the traffic signal control system may or
may not make actual changes to the signal indica-
tions. For example, if a local policy limits the num-
ber of priority activations to one per cycle, a second
priority request received by the traffic signal control
system would not result in further changes to the
signal indications. The traffic signal control system
is also responsible for ensuring that higher priority
requests (e.g., emergency / railroad pre-emption)
override other requests in order of priority.
By establishing standards for interactions between
the system components, the NTCIP and TCIP
efforts may help to make TSP implementation easi-
er and/or less expensive. NTCIP Standard 1211,
“Object Definitions for Signal Control and
Prioritization,” describes the interfaces with the sig-
nal control system. NTCIP 1211 defines four sce-
narios for TSP operations based on the location of
the transit Priority Request Generator (PRG) and the
path used to get to the traffic signal system’s
Priority Request Server (PRS). The PRG can be
located in the transit vehicle and communicate
directly to the PRS in the controller as is common
to date, or be located in either the vehicle, the tran-
sit management center, or the traffic management
center, and communicate through the transit and
traffic centers, as in more sophisticated centralized
approaches. (All four scenarios are variously repre-
sented in Figure 6). An effort is currently being
undertaken by the American Public Transportation
Association (APTA) to develop the corresponding
TCIP standards from the transit perspective. The
results of both efforts are expected to be available
in the near future.
13.2 Traffic Control SystemComponents and TSP
The interface between transit vehicles and traffic
signal control systems is central to the operation of
a TSP system. This section describes the various
components of a traffic signal control system from
the perspective of how they interface with transit
vehicles and other TSP system components.
Although the development of ITS standards is
aimed at providing more standardized and open
solutions, many of the components of TSP systems
are currently proprietary products that are constant-
ly changing and evolving. As such, it is important to
note that due to dynamic market forces, some of
the proprietary names, manufacturers, model num-
bers and functionalities of the TSP hardware and
software discussed in this section may have
changed since publication. Further, all information
has been presented in the most objective manner
possible and this document does not intentionally
favor one vendor/manufacturer over another.
TSP systems consist of the following four main
components of the traffic control system:
1. Traffic signal controller hardware
2. Traffic signal controller software
(with TSP functionality)
3. Transit vehicle detection systems
4. Communications systems
13.2.1 Traffic Signal Controller Hardware
Traffic signal controllers provide operational control
of a signalized intersection. Typically, there is a traf-
fic signal controller located at every signalized inter-
section. At a given intersection, every traffic signal
indication (both pedestrian and traffic signal head) is
connected to the signal controller. Most actuated
signalized intersections feature in-pavement loops
or other vehicle detection methods, and the detec-
tor feeds are connected to the controller. Control
can be of a single intersection, a corridor or a cen-
tralized system where several (or all) intersections
are connected together via an interconnect cable or
wireless communications system. There are two
main components of the traffic signal controller:
hardware and software. This section will discuss
the traffic signal controller hardware component.
In addition to the type of traffic signal controller,
other important considerations include cabinet size
and available space; cabinet location; communica-
tions connections; and available ports for additional
detection. All of these considerations are important
in the planning and design of a TSP system and
should be considered equally important as the type
PPAA
RRTT
IIIIII
62 Y Transit Signal Priority Handbook

of traffic signal controller. Further, maintenance of
the equipment is important especially when compo-
nents related to traffic signal operation are main-
tained by one agency and components related to
TSP are maintained by another. Both agencies will
need to coordinate and cooperate closely in the
development and execution of a maintenance plan
for the signal controller and TSP equipment.
There are four main types of traffic signal con-
trollers in operation in the U.S. and Canada:
13.2.1.1 Electromechanical Controllers
These controllers are the oldest, most basic type of
controller in operation today in the U.S. These
types of controllers have been used for more than
60 years and many are still in operation today.
Electromechanical controllers use an electrical mag-
netic coil to energize and de-energize a solenoid,
which physically turns cams and contacts to
mechanically change the signals. These types of
controllers do not typically have any “active” TSP
capabilities; however, these controllers may be
interconnected with other controllers at adjacent
intersections for coordinated timing or “passive”
TSP strategies.
13.2.1.2 NEMA Controllers
There are two types of controllers that follow the
National Electrical Manufacturers Association
(NEMA) standards — TS-1 and TS-2. These NEMA
standards allow multiple manufacturers to produce
the controllers, while allowing for equipment inter-
changeability between manufacturers. NEMA con-
trollers are provided with a manufacturer-supplied
software package as part of the controller. A full
discussion of the NEMA software TSP capabilities is
contained in the next section on TSP software.
The standard for the NEMA TS-1 controller was
adopted in 1976 and represented the first industry
standard for traffic control equipment. The standard
has been revised on several occasions since its
original version in 1976, with the most recent ver-
sion being adopted in 1989.
The standard for the NEMA TS-2 controller was
adopted in 1992 in order to provide operational fea-
tures not covered by the TS-1 standard. For exam-
ple, the NEMA TS-1 standard did not address traffic
signal system communications, pre-emption and
priority control. In addition, the 1992 NEMA TS-2
standard enforced plug-compatibility for the equip-
ment provided by different manufacturers. Two
types of NEMA TS-2 controllers were developed in
an effort to expand the traffic features of NEMA TS-
2 controllers: Type 1 and Type 2. Type 1 represents
an entirely new performance oriented standard that
uses serial communications via a bus interface and
Type 2 utilizes several of the same connectors in
common use with NEMA TS-1 equipment to maintain
backwards compatibility with the TS-1 controllers.
The following are several manufacturers that cur-
rently provide NEMA controllers in the U.S.: Eagle
(Siemens), Econolite, Naztec, Peek, U.S. Traffic,
and Vector. Several other vendors have offered
controllers in the past including Traconex, LMD,
and Multisonics.
13.2.1.3 Type 170 Controllers
The Type 170 standard was developed by the
California Department of Transportation (Caltrans)
and the New York Department of Transportation to
serve as an alternative to NEMA controllers. While
NEMA standards specify that the software be sup-
plied with the controller as firmware, Type 170 con-
trollers include hardware only, and software can be
purchased from an independent software developer.
If desired, an agency can write its own software.
One advantage of the Type 170 standard is that
modifications to the software do not affect its hard-
ware compatibility, which is ensured by the con-
troller’s open architecture design.
The following are several manufacturers that cur-
rently provide Type 170 controllers in the U.S.:
Safetran, McCain, U.S. Traffic, and Vector.
13.2.1.4 Advanced Transportation Controllers
Although there are proprietary advanced transporta-
tion controllers (ATCs) on the market, the most
common and standard type of ATC is the Caltrans
Type 2070 controller. The standard for Type 2070
PPAA
RRTT
IIIIII
Transit Signal Priority Handbook Y 63

was initially developed by Caltrans but the Joint
Committee on ATC is responsible for maintaining
this standard for other users. In addition to a more
powerful processor, the Type 2070 controller has
the capability to upgrade controller software by seri-
al downloads, similar to a personal computer. Due
to its better processing power, this type of con-
troller offers more advanced signal control and sig-
nal priority capabilities than the NEMA and Type 170
controllers. As with Type 170 controllers, it is neces-
sary to purchase and install separate software pack-
ages for the Type 2070 controllers (and the software
is interchangeable within the Type 2070 hardware
platform). There are currently several versions of
the Type 2070 controller available, including the Type
2070 (standard), Type 2070L (“Lite” version) and
Type 2070N (compatible with NEMA controller cabi-
nets). All major TSP software packages will run on
any of the Type 2070 controllers.
The following are several manufacturers that cur-
rently provide Type 2070 controllers in the United
States: Eagle, Econolite, Naztec, Safetran, U.S.
Traffic, and Vector.
13.2.2 Traffic Signal Controller Software(with TSP Functionality)
With the exception of older electromechanical con-
trollers, all modern traffic signal controllers utilize
some type of software to execute all traffic signal
control and, where applicable, TSP functionality.
TSP-enabled software used for NEMA controllers is
typically provided by the controller manufacturer as
an integral part of the controller. Manufacturers of
Type 170 and 2070 controllers may not provide soft-
ware as part of the controller assembly. For 170
and 2070 controllers, it is typically necessary to uti-
lize one of several third-party software packages
available on the market. The following software
packages are currently being used (or are available
for use) in the U.S. and Canada:
13.2.2.1 Software for NEMA Controllers
NEMA controllers are provided with a software
package by the manufacturer of the controller.
Although not required by the NEMA TS-1 1989 stan-
dard, all present NEMA controllers have emergency
vehicle pre-emption (high priority) routines included
in their software. The major manufacturers of
NEMA controllers (Eagle, Econolite, Naztec, Peek,
U.S. Traffic, and Vector) typically provide in their con-
trollers basic TSP functionalities (low priority) such as
green extension and early green (red truncation).
However, some of the NEMA manufacturers provide
TSP functionality only as an upgrade or enhanced
version of the control software. In addition, several
manufacturers report that their latest NEMA con-
troller can also run third-party software to achieve
TSP with additional and more complex functionality.
13.2.2.2 Software for Type 170 and 2070
Controllers
There are several third-party software packages
available for use with Type 170 and 2070 controllers.
The following is a discussion of the software capa-
bilities for TSP (low priority) and emergency vehicle
pre-emption (high priority) from several leading soft-
ware vendors:
Bi-Tran – Bi-Tran signal control software is owned
by McCain Traffic and is available for use on
Type 170 and 2070 controllers. Bi-Tran control
software is customized to meet the needs of
each individual application and allows for emer-
gency vehicle and railroad pre-emption, as well
as transit signal priority applications. Bi-Tran
control software runs at the individual intersec-
tion level at each controller. System wide con-
trol strategies can be achieved by having each
individual intersection controller/software send
information back to the central end (traffic con-
trol center) and then redistribute it out to the
individual intersection controllers. While the
emergency vehicle and railroad pre-emption is
basically the same as the pre-emption offered
by NEMA control software, the transit signal
priority is slightly more complex and powerful.
Bi-Tran transit signal priority allows for function-
alities such as: green extension, early green
(red truncation), left turn transit phase and
queue jump scenarios. These functionalities
are designed and implemented to meet the
needs of each application and do not depend
on the type of controller (170 or 2070). Bi-Tran
reports that any type of vehicle detection sys-
PPAA
RRTT
IIIIII
64 Y Transit Signal Priority Handbook

tem can be used to provide the detection input
into the controller/software. As of mid-2004,
Bi-Tran reported that their software was being
used by transit agencies for both bus and LRT
signal priority applications in the United States.
Caltrans C8 – This signal control software has
been developed and is owned by California
DOT for Type 170 controllers. It is Caltrans’
standard signal control software used on
California state highways. Standard Caltrans C8
offers pre-emption treatments with added TSP
functionality for TSP treatments. Based on
Caltrans Bus Signal Priority Guidelines, the C8
TSP provides green extension and early green
only for coordinated intersection phases.
Caltrans’ TSP guidelines require that TSP treat-
ment only be given when a transit vehicle is
behind schedule and for intersections that are
operating at level of service A, B, or C, as
defined by the Highway Capacity Manual. The
software can work with various vehicle detection
systems (point, zone and continuous detection).
Caltrans reported that this software is being
used for bus signal priority in Alameda County,
Santa Clara County, and in San Mateo County.
City of Los Angeles – The City of Los Angeles
has developed a suite of traffic control software
packages for real time traffic management which
include Adaptive Traffic Control System (ATCS)®,
Traffic Signal Control Program (TSCP)®, Smart
Transit Priority Manager (STPM)®, and Transit
Priority System (TPS)®. The TPS program is
designed for Type 2070 controllers and includes
both transit signal priority and emergency vehi-
cle pre-emption functionalities. The transit sig-
nal priority functionalities include green exten-
sion, early green (red truncation) and the use of
special phases. STPM is a personal computer-
based software which operates in conjunction
with TSP software. The STPM software func-
tion is to monitor and track buses, to request pri-
ority at signalized intersections, and to record all
bus travel times through the system. When this
software is connected to variable message signs
it can provide passengers with bus arrival time
information. All of the above-mentioned soft-
ware packages are expected to be available for
sale through McTrans.
Econolite ASC/2070 – Econolite’s ASC/2070 soft-
ware supports both pre-emption and a number
of TSP functionalities. It is available for use on
Type 2070 controllers and operates at the local
intersection level only. The pre-emption func-
tionality is basically the same as with the
NEMA controllers and other 170/2070 control
software packages, and the TSP control allows
for advanced TSP functionalities such as: green
extension, early green (red truncation), actuated
transit phase, phase rotation, etc. According to
the manufacturer, there is great flexibility and
the TSP functionalities can be set up according
to the needs of the individual project.
Econolite reports that any type of vehicle
detection system can be used to provide the
detection input into the controller/software. As
of mid-2004, Econolite reported that their soft-
ware was being used for bus signal priority in
King County, Washington. No other applica-
tions are currently running.
NextPhase – NextPhase is owned by Siemens
and is available for use on 2070 controllers and
the Eagle (Siemens) M50 NEMA controller.
NextPhase can support emergency vehicle and
railroad pre-emption as well as a number of
advanced transit signal priority functionalities.
NextPhase control software runs at the local
intersection level and utilizes a communication
connection with adjacent intersections to pro-
vide “predictive priority,” which allows for con-
tinuous, advance adjustment of downstream
signalized intersections to accommodate the
exact arrival time of the transit vehicle. While
the emergency vehicle and railroad pre-emption
is basically the same as the pre-emption
offered by NEMA control software, the transit
signal priority is more complex and powerful
than NEMA and some of 170/2070 software
packages. NextPhase transit signal priority
allows for advanced TSP functionalities such as:
green extension, early green (red truncation),
left turn transit phase, queue jump, phase rota-
tion, phase insertion and conditional priority
requests. NextPhase reports that any type of
vehicle detection system can be used to pro-
vide the detection input into the controller/soft-
ware. As of mid-2004, NextPhase reported
PPAA
RRTT
IIIIII
Transit Signal Priority Handbook Y 65

that their software was being used for LRT sig-
nal priority by two cities in the United States:
Salt Lake City and Houston. They have indicat-
ed that Phoenix, Minneapolis, Las Vegas and
Seattle are all planning for, or currently deploy-
ing, NextPhase software for TSP.
VS-Plus – VS-Plus signal control software is avail-
able for use on Type 2070 controllers. Much
like the other 170 and 2070 control software
packages, VS-Plus can support emergency vehi-
cle and railroad pre-emption as well as a num-
ber of advanced transit signal priority function-
alities. VS-Plus control software runs at the
local intersection level and has the ability to
communicate with adjacent intersections and
the central end (control center). In addition to
providing standard pre-emption routines, the
VS-Plus TSP functionality is more complex and
powerful and allows for advanced TSP function-
alities such as: green extension, early green
(red truncation), left turn transit phase, queue
jump, phase rotation phase insertion and condi-
tional priority requests. According to PTV
America (the vender of VS-Plus at the time this
research was conducted) VS-Plus’ TSP function-
alities have “virtually no limitations.” PTV
America reported that any type of vehicle
detection system can be used to provide the
detection input into the VS-Plus software. VS-
Plus software has been used for more than
twenty years and is currently being used for
bus and LRT signal priority by numerous cities
in Europe and China. The company has indicat-
ed that while the VS-Plus software is currently
used for basic intersection control in the United
States, there are no TSP applications currently
running in the U.S. or Canada.
Wapiti – Wapiti’s product [called Actuated Local
Intersection Firmware (W4iks)] is designed
with both emergency pre-emption and transit
signal priority functionalities. The main TSP
capabilities are green extension and red trunca-
tion. Although phase insertion is not specifical-
ly designed for the TSP application, utilization of
other exiting features may enable this software
to implement phase insertion. Wapiti’s W4iks
software is being used in numerous locations
with capabilities to run TSP. One of the main
TSP applications is with the City of Portland.
W4iks software can run on Type 170 con-
trollers. Most of the 2070 controllers are using
a newer Motorola processor, which is not com-
patible with W4iks software.
13.2.3 Transit Vehicle Detection Systems
In order for TSP systems to assign priority treat-
ment to transit vehicles, it is necessary for the sys-
tem to be able to distinguish transit vehicles from
the rest of the traffic. Therefore, one of the keys to
a successful TSP system is accurate detection of
transit vehicles. Selection of the detection system
is a rather involved process that requires detailed
planning and design to determine which type of
detection system can best meet a project’s objec-
tives. Inappropriate application of a detection sys-
tem can be a fatal flaw in the TSP system’s design.
The accuracy of detectors can be impacted by a
number of factors, including environmental condi-
tions, surrounding objects and detector placement.
Detector placement requirements can be the main
factor in the detector selection process. The most
common detector placements are (1) in the pave-
ment (2) facing the oncoming traffic flow and (3) on
the side of roadway (side-fire). One of the often
missed limiting factors of some Radio Frequency
(RF) detection systems is the requirement for an
FCC license. The FCC license application procedure
is rather lengthy and approval is not guaranteed. In
general, the FCC license ensures that the system
will not interfere with other existing systems, and
the approval process is based on FCC-defined priori-
ties. It is good practice to determine if the detection
system requires an FCC license and if not, if there is
possibility of interference from other systems that
will impact the detection system’s accuracy.
Detector selection has to be made in parallel with
selection of transit signal priority software. Transit
signal priority logic requirements must be carefully
coordinated with the detection system. For exam-
ple, it is important to determine when the transit
vehicle has cleared the intersection during the green
extension phase so that the green extension phase
can be terminated and signal timing can be returned
to the original operational mode as soon as possible.
Some transit signal priority detection systems have
limited capabilities to accommodate this type of
PPAA
RRTT
IIIIII
66 Y Transit Signal Priority Handbook

“check out” detection. Most of the time a different
detector configuration and/or additional detectors
may resolve this issue but sometimes more radical
changes may be required, such as utilization of a dif-
ferent detection system. All detection technologies
have limitations and it is important to complete a
thorough evaluation and system design to ensure
the desired functionalities are possible.
Many times the selection of a detection system is
driven by the detection system being used by the
traffic agency. Coordination with traffic agencies is
a must, since in many instances traffic agencies
end up responsible for system maintenance. But, if
a detection system cannot provide the required
functionalities for efficient TSP system operation,
alternative solutions should be evaluated.
13.2.3.1 Hard-Wired Loop Detection
This type of detection system consists of a
transponder attached to the underside of the emer-
gency or transit vehicle and a vehicle detection
receiver that integrates with the signal controller.
The transponder is detected by a standard traffic
loop embedded in the pavement. The transponders
are coded with unique identification numbers for
automatic vehicle identification (AVI) functionality.
The advantages of loop detection systems are that
the system is compatible with commonly used loop
detectors, does not require line-of-sight or visibility,
and transponders may be mounted on emergency
vehicles for pre-emption and transit vehicles for sig-
nal priority functionality. It is also relatively easy to
accommodate “TSP check-out” by merely inserting
another loop after the intersection.
The limitations of this type of system are that it
requires in-pavement loop detectors that need to be
appropriately placed; loop detectors are prone to
failure due to pavement flexing; and they are often
cut during roadway resurfacing activities. In spite of
these drawbacks, loop detectors are considered by
some agencies to be one of the most reliable types
of vehicle detectors available, and there are many
professionals in the traffic engineering community
that are familiar with the operation and mainte-
nance of loop detectors.
13.2.3.2 Light-Based (infrared) Detection
This type of vehicle detection system is one of the
most widely used for emergency vehicle and transit
vehicle detection in the U.S. The system typically
consists of three main components: (1) infrared
strobe emitter located on the transit vehicle (2)
infrared detectors located at each intersection and
(3) a “phase selector” interface within the traffic
signal controller cabinet that relays the message to
the traffic signal controller. The emitter on the tran-
sit vehicle is typically located on the top front part
of the vehicle and can be activated manually by the
driver or by some type of automatic means. When
activated, the emitter sends an infrared signal to the
detector (most commonly located on the signal
mast arm or span wire) at the signalized intersec-
tion. The signal sent by the transit vehicle may con-
tain an identification number that may be config-
ured as unique to each vehicle (or class of vehicles)
so that the transit/traffic management agency can
track the location/progression of every transit vehi-
cle. The infrared detector at each intersection
receives the signal from the transit vehicle and
routes it to the “phase selector,” where the priority
request is validated and forwarded to the signal
controller. Check out detection is achieved by noting
when the vehicle’s infrared strobe is no longer
detected at the intersection.
This detection system has two main advantages:
First, it is widely used in the U.S. for emergency
vehicle pre-emption systems. This allows a
city/region to utilize the same system for both its
emergency vehicle pre-emption system and its tran-
sit signal priority system. The detection and con-
troller interface equipment that is located at the
individual intersections will serve both needs.
Second, the technology has been well tested since
it has been in use for many years.
The main disadvantage to this type of vehicle detectionsystem is the use of a light-based technology, whichrequires line-of-sight between the transit or emergencyvehicle and the detector at the intersection. Effectiveoperation of the system can be hindered by roadwaygeometry, weather problems and obstructions such astree foliage. Additionally, the profile of the strobe lightallows for the potential for interference with nearby oradjacent intersections since light reflections can pro-vide false detection at other detectors.
PPAA
RRTT
IIIIII
Transit Signal Priority Handbook Y 67

13.2.3.3 Sound-Based Detection
Emergency Vehicle Siren Detectors - This type
of vehicle detection consists of a directional
microphone located at the intersection, a con-
troller card in the controller and an optional
visual confirmation light fixture. The micro-
phone detects emergency vehicle sirens in
yelp, wail, or hi-lo with adjustable frequency,
period and range. Although a siren device can
be mounted on transit vehicles for transit signal
priority, this type of application would be less
desirable since an audible siren would be
required on all transit vehicles.
An advantage of this system is that emergency
vehicles do not need any equipment installation
for this system to function since it utilizes their
existing sirens. Additionally, this system facili-
tates interjurisdictional emergency response
since the microphones detect and respond to all
emergency vehicle sirens. A third advantage is
that line-of-sight and visibility concerns are not
factors that affect the system’s performance.
The main disadvantage of this system is that it
is not practical for transit signal priority use due
to the requirement of each vehicle using an
audible siren. This would create situations
where the motoring public would hear emer-
gency vehicle-like sirens and possibly take eva-
sive actions that could be risky and lead to
increased accidents. Another disadvantage is
the potential for false activations from building
alarms and car alarms. Further, there is no
capability for vehicle identification or logging
without the use of additional equipment on all
of the emergency and transit vehicles.
Digital Sound Wave Recognition System -
This type of system consists of a digital sound
wave recognition system located at the inter-
section and a phase selector unit that is con-
nected to the controller. Its functionality is sim-
ilar to that of the siren detection system with
one major difference: transit vehicles can be
equipped with non-audible sound generators to
function with this system.
As with the siren detection system, one advan-
tage of this system is that emergency vehicles
do not need to be outfitted with any additional
equipment to function with this system.
Additionally, transit vehicles can utilize this sys-
tem for TSP functionality by installing a non-
audible sound generator on each transit vehicle.
Line-of-sight and visibility issues are not a con-
cern with this system.
The disadvantages of this system are similar to
the siren detection system: the possibility of false
alarms from building and car alarms, and the lack
of vehicle identification and logging capabilities.
13.2.3.4 Radio-Based Detection
This type of detection system consists of Radio
Frequency (RF) transponders mounted on the emer-
gency or transit vehicles and RF tag readers installed
upstream of the signalized intersections for detec-
tion. The tag reader system is connected to the sig-
nal controller by means of an RS-232 connector.
One of the advantages of this technology is that it
does not depend on line-of-sight or visibility.
Limitations of this system are that it requires suit-
able curbside locations for the tag readers upstream
of the intersections, including mounting locations,
power and communications connections.
Another type of radio-based detection system con-
sists of an antenna and receiver mounted at the
intersection to receive radio signals from emer-
gency vehicle or transit vehicle-mounted spread
spectrum radio transmitter. All pre-emption and pri-
ority activity is logged by vehicle ID number, priority
level, direction of travel, time, date and duration. A
drawback to this system is that its non-directional
nature requires the vehicle to provide information
on the direction of travel.
13.2.3.5 Satellite (GPS)-based Detection
There are several GPS-based detection systems
available for use with TSP deployments. This sec-
tion describes two of the GPS-based detection sys-
tems that are currently available on the market.
The first GPS-based transit vehicle detection system
consists of two units -- the in-vehicle unit and the
field unit located at the signal controller. The in-vehi-
PPAA
RRTT
IIIIII
68 Y Transit Signal Priority Handbook

cle unit consists of an onboard computer that per-
forms a range of functionalities of which one is the
constant updating of vehicle location using a GPS-
based AVL system. Based on vehicle schedule devi-
ation, passenger load and other factors, the in-vehi-
cle unit sends data information to the field unit. The
field unit is located at the signal controller to evalu-
ate incoming priority messages with regard to vehi-
cle or route number, vehicle approach, priority level,
etc. The field unit also receives the data radio mes-
sage from the vehicle. The decision as to whether to
grant or reject signal priority is made by the signal
controller or the traffic control center, depending on
system design and configuration. Advantages of this
type of detection system are that it does not require
line of sight and can notify the signal controller when
a transit vehicle has cleared the intersection.
There is another type of commercially-available tran-
sit vehicle GPS-based detection system that allows
for the determination of vehicle location, speed and
heading. This system requires the installation of
radio transceivers on each emergency or transit vehi-
cle and radio receivers at each intersection. As the
vehicle enters the intersection’s radio range, the
vehicle-mounted transceiver sends the vehicle’s
location, speed and heading information to the
receiver located at the intersection. An interface
unit processes this information and connects with
the intersection controller.
A limitation of some AVL-based detection systems is
that the polling rate of some existing AVL systems
may not support adequate sampling of vehicle loca-
tions for closely spaced intersections or for check
in/out calls if the mid-block bus stop is close to the
intersection. Further, urban environments may pro-
vide additional challenges for GPS-based systems.
13.2.4 Communications Systems
There are two types of communications associated
with emergency vehicle pre-emption and TSP sys-
tems, (1) vehicle detection communications and (2)
communications between intersections and central
end (control center). Some TSP applications require
only the first type, and others require only the sec-
ond type; however many require both types.
The first type of communications involves local
communications between the transit or emer-
gency vehicle and the signal controller located at
each intersection. Typically, this communications
system is an integral part of the vehicle detection
system, which will include both the transceiver
and receiver as part of the system. The following
are the different types of communications used in
vehicle detection systems:
Y Hard-wired loop-based
Y Light-based
Y Sound-based
Y Radio (RF)-based
Y Satellite and Radio-based
The second type involves communications from
individual intersections to the central end (control
center). There are some advanced TSP software
packages that permit communications between the
local intersection controllers at each intersection in
the field and with the central end (control center).
This allows for enhanced TSP operation but requires
communications between intersections and the
central end. Typically, intersection controllers and/or
the central end are interconnected by means of a
physical connection consisting of fiber optic or cop-
per cable. If not already implemented, this type of
communications requires significant infrastructure
costs for the installation of conduit and cabling
between intersections. Newer systems utilize wire-
less technology, which eliminates the need for
expensive conduit and cable connections between
intersections and the central end (control center).
PPAA
RRTT
IIIIII
Transit Signal Priority Handbook Y 69

TRAFFIC ENGINEERING TERMINOLOGY
It is important to understand the key traffic engi-
neering, signal timing and TSP fundamentals before
beginning the implementation of a TSP deployment.
The intent of this section is to provide basic traffic
engineering and TSP definitions and concepts that
will improve the reader’s understanding of signal tim-
ing considerations necessary to appropriately imple-
ment TSP. The first section, Key Traffic Engineering
and TSP Definitions, provides basic definitions of
important terminology along with several examples
and graphics. The second section, Key Traffic
Engineering and TSP Concepts, offers more in-depth
discussions of key areas in the traffic engineering
and TSP fields and provides several examples to illus-
trate the concepts. For additional information on this
subject, a number of traffic engineering documents
are available, including the Highway Capacity Manual;
Manual on Uniform Traffic Control Devices (MUTCD);
and A Policy on Geometric Design of Highways and
Streets (AASHTO “Green Book”).
14.1 Key Traffic Engineering and TSP-Related Concepts
This section provides definitions and explanations in
four categories: general traffic engineering termi-
nology; traffic signal timing terminology; signal coor-
dination terminology; and basic TSP terminology.
14.1.1 General Traffic Engineering Terminology
Delay: the time lost while traffic is impeded in its
movement by some element over which it has no
control and is usually expressed in seconds per
vehicle. Delay at intersections usually refers to con-
trol delay due to a control facility like a traffic signal
and includes initial deceleration delay, queue move-
up time, stopped time and final acceleration time.
Dilemma zone: refers to the portion of the road-
way in advance of the intersection within which a
driver, confronted with a yellow signal indication, is
indecisive regarding stopping prior to the stop line
or proceeding into or through the intersection.
Fully-actuated operation: timing on all of the
approaches to an intersection is influenced by vehi-
cle detectors. Each phase is subject to a minimum
and a maximum green time, and some phases may
be skipped if no demand is detected. The cycle
length for fully actuated control will vary from cycle
to cycle based on traffic demand.
Initial Interval: designed to allow the space
between the detector and the stop line to clear
vehicles.
Extension interval: (also called vehicle inter-
val, gap time or unit interval) the time the
green is extended for each arrival at the detec-
tor, from the instant of arrival of the detector.
Maximum interval: or maximum period is
the total time allowed for the phase.
Headway: time between successive vehicles as
they pass a point along the lane, measured from
some common reference points on the vehicles.
Lane group: consists of one or more lanes that
have a common stop line, carry a set of traffic
streams and whose capacity is shared by all vehi-
cles in the group.
Level of service: defines the operating conditions
that may occur on a given lane or roadway when it
is accommodating various traffic volumes. Level of
service for intersections is defined in terms of aver-
age control delay per vehicle and is categorized as
given in the table below.
PPAA
RRTT
IIIIII
70 Y Transit Signal Priority Handbook
Level of Service Control Delayper Vehicle (sec)
ABCDEF
≥10 and ≤20≥20 and ≤35≥35 and ≤55≥55 and ≤80>80
≤10
14

Peak hour factor: is a measure of the variability
of demand during the peak hour of traffic. It is the
ratio of total hourly volume during the peak hour to
the maximum rate of flow during a given time peri-
od (usually 15 minutes) within the peak hour. PHF
= volume during the peak hour/(4 x volume during
peak 15 min within the peak hour)
Example: consider an area where the peak hour is
between 7:00 a.m. and 8:00 a.m. If the 15 minute
traffic volume counts in the area are
7:00 – 7:15 a.m. 547:15 – 7:30 a.m. 757:30 – 7:45 a.m. 827:45 – 8:00 a.m. 59
Then PHF = (54 + 75 + 82 + 59)/ (4 x 82) = 0.823
Pre-timed operation: method for operating traf-
fic signals where the cycle length, phases, green
times, and change intervals are all preset.
Right turn on red: means that vehicles can
make a right turn at an intersection even though
they face a red indication.
Semi-actuated operation: some approaches
(typically on the minor street) have detectors, and
some do not. The earliest form of semi-actuated
control was designed to confine the green indica-
tion to the major street in the absence of minor-
street actuation. Once actuated, the minor-street
green is displayed for a period just long enough to
accommodate the traffic demand.
Signal face: part of the signal head provided for
controlling traffic in a single direction. Turning indica-
tions may be included in a signal face.
Signal head: assembly containing one or more
signal faces which may be designated accordingly
as one-way, two-way, etc.
Traffic control signal: type of highway traffic sig-
nal manually, electrically or mechanically operated
by which traffic is alternately directed to stop and
permitted to proceed.
Turn type: defines the type of turns made at an
intersection:
Permitted turn is a turn made through a con-
flicting pedestrian flow or opposing-vehicle flow.
Thus a left turn movement that is made at the
same time as the opposing through movement is
considered to be permitted, as is a right-turn
movement made at the same time as pedestrian
crossings in a conflicting cross walk.
Protected turn is a turn made without any con-
flicts, such as turns made during an exclusive left
turn phase or a right turn phase during which con-
flicting pedestrian movements are prohibited.
PPAA
RRTT
IIIIII
Transit Signal Priority Handbook Y 71
2.51"
Maximum period
Min. greenperiod
Extension period
InitialInt.
Veh.Int.
AC
TU
AT
ION
S
TIME
Detector Actuation onPhase with Right-of-Way
Unexpired Portions of Vehicles Intervals
FIGURE 7 Actuated Phase OperationThis table explains the actuated operation of an approach at a signal. The figure shows the Initial
Interval being extended by a time period equal to the Vehicle Interval upon the arrival of vehicles
(denoted by a ‘*’) on the approach. This extension of the interval is continued until the Maximum
Interval period is reached upon which the right of way is given to another movement.

Not opposed turning movements are
those that do not receive a dedicated left-turn
phase (i.e., a green arrow), but because of the
nature of the intersection, they are never in
conflict with through traffic. This condition
occurs on one-way streets, at T-intersections,
and with signal phasing plans that provide com-
plete separation between all movements in
opposite directions.
14.1.2 Traffic Signal Timing Terminology
All red interval: an interval during which all signal
indications at an intersection display red.
Change and clearance interval: yellow plus all-
red intervals that occur between phases to provide
for clearance of the intersection before conflicting
movements are released.
Cycle: refers to any complete sequence of
signal indications.
Cycle length: total time for the signal to complete
one cycle, stated in seconds.
Effective green time: time that is effectively
available to a movement. It is the green time plus
part of the change and clearance interval minus the
lost time for the designated movement.
Green interval: time within a given phase during
which the green indication is shown.
Interval: period of time during which all signal indi-
cations remain unchanged.
Lost time: time during which the intersection is
not effectively used by any movement, which
occurs during part of the change and clearance
PPAA
RRTT
IIIIII
72 Y Transit Signal Priority Handbook
FIGURE 8 Relationship between Interval, Phase and Split
Figure explaining the relationship between an interval, phase and split in a two phase signal operation.
Signal Head Movement
1 & 3 N.B. & E.B.
S.B.. & W.B.2 & 4
2 Phase Operation
N
Signal Indications
Green
Red Green Yellow
Yellow
All Red
RedAll Red
Interval
Phase
Split
Seconds
Percent
One Cycle: 50 seconds
25
50
3
6
3
6
2
4
2
4
15
30

interval (when the intersection is cleared) and at the
beginning of each phase as the first few vehicles in
a standing queue experience start up delays.
Maximum green time: maximum green time
that can be allowed for a phase
Minimum green time: shortest green time
allowed for a phase.
Pedestrian (walk) interval: allows adequate time
for pedestrians to leave the curb before the clearance
interval is shown. Under normal conditions, the mini-
mum walk interval is typically four to seven seconds.
Pedestrian clearance (Flashing “don’twalk”) interval: provides time for pedestrians to
clear the intersection. It should be equal to or
greater than the time required for pedestrians to
leave the curb and travel to the center of the far-
thest traffic lane before opposing vehicles receive a
green indication. A pedestrian walking speed of
4ft/sec is usually used in the calculations.
Phase: part of a cycle allocated to any combination
of one or more movements receiving the right of
way simultaneously during one or more intervals.
Split: portion allocated to each of the various phas-
es in a cycle (usually expressed as a percentage)
Yellow interval: interval following green in
which the yellow indication is shown indicating
phase termination.
14.1.3 Signal Coordination Terminology
Background cycle length: identifies the cycle
length that all controllers operating within a coordi-
nated system must have.
Band speed: slope of green band on a time speed
diagram representing the progressive speed of traf-
fic moving along the arterial.
Bandwidth: amount of green time available to a
platoon of vehicles through intersections without
stopping in a progressive signal system. It is also
referred to as through band.
Force off point: point within a cycle at which the
PPAA
RRTT
IIIIII
Transit Signal Priority Handbook Y 73
FIGURE 9 Relationship between Pedestrian and Vehicular Signals
Figure explaining the relationship between pedestrian and vehicular signals in a two phase signal opera-
tion. (Note: Phase A would be for Street A and Phase B would be for the cross street, Street B)
Green
Walk Don't Walk
Yellow
Flashing Don't Walk
Don't Walk Walk Don't WalkFlashing Don't Walk
Pedestrians
Red Green Yellow All Red
RedAll RedVehicles
Pedestrians
Vehicles
Beginning of Cycle End of Cycle
PHASE B
PHASE A

right of way is terminated so that subsequent phas-
es can be serviced at the proper time
Gap out: termination of a green interval due to an
excessive time interval between the actuation of
vehicles arriving on the green, so as to serve a con-
flicting movement.
Hold: command that retains the existing
right of way.
Offset: of an intersection is the time lapse in sec-
onds (or the percentage of the cycle length)
between the beginning of a green phase at the
intersection and the beginning of a corresponding
green phase at the master intersection.
Passage time: amount of time required for a vehi-
cle to travel at a selected speed from the detector
to the nearest point of conflicting traffic.
Permissive period: time period in which the con-
troller unit is allowed to leave a coordinated phase
under coordinated control and go to other phases.
Progression: used to describe the progressive
movement of traffic through several intersections
within a control system without stopping.
Recall: operational mode for an actuated controller
unit whereby a phase, either vehicle or pedestrian, is
displayed each cycle whether or not demand exists.
Yield point: point at which the controller is
allowed to leave the coordinated phases to service
other phases. It marks the beginning of a permis-
sive period.
14.2 Basic TSP Terminology
The following are definitions of TSP strategies and
terms related to traffic priority.
Compensation/Recovery: non priority phases
are given some additional time to make up for the
time lost during priority. Some compensation tech-
niques include limiting the number of consecutive
cycles in which priority is granted (e.g. locking out the
granting of a priority request from the next cycle).
Early Green(red truncation): desired phase
green is started earlier. This is helpful if the transit
vehicle is detected during the red phase.
Phase/green extension: desired phase green is
lengthened up to a maximum permitted time. This
proves helpful when the transit vehicle is detected
near the end of the green and no near side bus stop
PPAA
RRTT
IIIIII
74 Y Transit Signal Priority Handbook
N 1800
1200
600
0
Mai
n S
tree
t
NorthboundVehicle
Green Bandwidth
Cycle Length
Distance (ft)
G GreenY YellowR Red
Speed
60 Time (sec) 120
FIGURE 10 Green Bandwidth and Vehicular Progression along a Street

is present. By extending the green a few seconds,
the transit vehicle avoids stopping at the signal.
Phase suppression/skipping: logic is provided
so that fewer critical phases are skipped. This can
be used with logic that assesses congestion on the
approaches to the skipped phase.
Phase Rotation: strategy where the order of sig-
nal phases is “rotated” to provide TSP. For exam-
ple, a northbound left turn phase could normally be
a lagging phase, meaning it follows the opposing
through signal phase. A northbound left turning bus
requesting priority that arrives before the start of
the green phase for the through movement could
request the left turn phase. With the phase rotation
strategy, the left turn phase could be served as a
leading phase (before the through green) in order to
expedite the passage of the transit vehicle.
Pre-emption (“High” Priority): as per NTCIP
1202 Version 2, the transfer of the normal control
(operation) of traffic signals to a special signal con-
trol mode for the purpose of servicing railroad
crossings, emergency vehicle passage, mass transit
vehicle passage, and other special tasks, the control
of which requires terminating normal traffic control
to provide the service needs of the special task. The
pedestrian “don’t walk” movements are completed
to clear pedestrians.
Priority (“Low” Priority): modifies the normal
signal operation to better accommodate transit vehi-
cles. As per NTCIP 1211, the preferential treatment
of one vehicle class (such as a transit vehicle, emer-
gency service vehicle or a commercial fleet vehicle)
over another vehicle class at a signalized intersec-
tion without causing the traffic signal controllers to
drop from coordinated operations. Priority may be
accomplished by a number of methods including
the beginning and end times of greens on identified
phases, the phase sequence, inclusion of special
phases, without interrupting the general timing rela-
tionship between specific green indications at adja-
cent intersections.
Queue Jump: a strategy where transit vehicles
are provided the means to pull ahead of regular
vehicular traffic that is stopped at an intersection,
thereby providing the transit vehicle with advanced
green (a “jump”) in relation to other vehicular traffic.
Red interrupt or special phase: a short spe-cial green phase is injected into the cycle. This
can be used to create a transit-only phase such as to
permit a queue jump, and can be especially helpful
with near side stops serviced from a shoulder.
Buses get a special advance phase display which
allows them to get through the intersection smooth-
ly and get back into a regular lane of travel easily.
Window stretching: non priority phases are
given a core time, which must be serviced every
cycle, and a variable time which could be taken
away for priority purposes. Flexible window stretch-
ing differs in that the core time is not fixed in posi-
tion relative to the cycle.
14.3 Key Traffic Engineering and TSP Concepts
This section provides a more in-depth discussion of
several key traffic engineering and TSP concepts to
augment the basic definitions provided in the previ-
ous section.
14.3.1 Coordinated vs. Free Operations
Signals may be either part of a coordinated system
or independent (no coordination). An intersection
may operate in either mode, depending mainly on
site conditions. The method of signal operation dic-
tates the implementation of TSP for a signal, where
signal coordination introduces additional constraints
for the TSP implementation compared to independ-
ent signal operation. When a signal is operating in
coordinated mode, it is constrained by the local cycle
and its zero point, which defines the relationship
between adjacent intersections. At this point during
the cycle, the coordinated phase must be in opera-
tion and thus phases can only be adjusted around
this constraint. Essentially, the phases are adjusted
to provide transit priority while remaining coordinated
beyond the current cycle, such that the signal can
always return back to its coordination at this point.
This adjustment is consequently limited by the coor-
dination, although the limitation often still exceeds
the amount of TSP desired at an intersection.
PPAA
RRTT
IIIIII
Transit Signal Priority Handbook Y 75

The most common implementation of TSP relies on
green extension or red truncation to provide an
advantage to the transit vehicle. When the signal is
operating in a coordinated system, either the green
time for the transit phase is lengthened or the red
time for the transit phase is shortened. This is
accomplished by changing the green allocation for
each phase while maintaining the “zero point” to
keep the signal in coordination with the system.
This zero point, commonly referred to as the yield
point or reference phase, may be shifted for one
cycle, but should allow the signal to remain in rela-
tive coordination between intersections (fully
described in the NTCIP 1211 standard).
14.3.2 Cycle Lengths
The cycle length at an intersection is the time
required to serve each phase in a traffic signal.
Cycle length is impacted by several factors and
more details on these factors and cycle length cal-
culation procedures can be found in numerous traf-
fic-related publications such as the Highway
Capacity Manual.
The cycle length impacts the extent to which signal
priority is provided in two different ways: (1) gener-
ally speaking, intersections with higher cycle
lengths have a greater flexibility to provide transit
priority. On the other hand, longer cycle lengths
may also cause longer delays for transit vehicles if
they arrive at an intersection during the red phase
and (2) short cycle lengths allow efficient operation
for transit vehicles (and other users) that arrive ran-
domly within the cycle length but they have lower
flexibility to provide transit priority compared to
longer cycle lengths.
In coordinated operations, cycle lengths at adjacent
intersections are required to be the same in order to
maintain coordination between the intersections.
Cycle length calculations for both coordinated and
non-coordinated operations are generally completed
utilizing a traffic signal optimization software package.
14.3.3 Phasing (Two-Phase vs.Multi-Phase Signals)
Two-phase signal timing plans are the simplest form
of phasing for traffic control, and, simply stated,
separate the main street traffic from that on the
cross street. Adding left-turn movements (typically
identified by left-turn arrows at an intersection)
result in multi-phase signal timing plans that can
include eight or more phases.
Since the transit vehicle phase is provided priority
by reducing the green time of other phases, having
only two phases may limit the amount of time that
can be taken from the non-transit vehicle phase and
given to the transit vehicle phase. This is especially
noticeable when the cycle length is short and both
of the phases have pedestrian recall/actuation.
Multi-phase intersections present difficulties in pro-
viding priority and specifically in determining how
much to reduce non-transit vehicle green times;
however, there is typically more flexibility in having
additional phases to reassign time from. The priority
is often constrained by the elements discussed
above, however, providing even minimal priority will
still benefit transit travel time. At actuated and semi-
actuated intersections, the coordinated phase is
designed for the busiest stream of traffic, which in a
coordinated system receives the unused time asso-
ciated with non-coordinated phases. In the cases
where transit vehicles operate along the arterial, the
coordinated phase typically receives a high percent-
age of green time already thus, the added benefit of
time might be a small percentage of the time
beyond what is already provided in the signal cycle.
Conversely, any vehicle (including a transit vehicle) on
the non-coordinated phase will typically not receive a
high percentage of green time. Due to the amount of
time already given to the coordinated phase, there
may be more flexibility to provide priority to transit
vehicles on the non-coordinated approaches, with
resulting impacts to the highest traffic stream.
Planning of future transit signal priority projects should
consider the opportunities associated with transit vehi-
cles on non-coordinated phases, which have the great-
est potential for improvement of transit operation.
PPAA
RRTT
IIIIII
76 Y Transit Signal Priority Handbook

14.3.4 Splits
The split at an intersection is the time allocated to a
given phase relative to the cycle length. A phase is
a timing unit associated with the control of one or
more indications. Each phase at an intersection has
a set of timings. Phases typically contain vehicle
and/or pedestrian timing. Minimum times for each
phase must be met and the excess (flexible) time in
the cycle can be allocated to the transit vehicle
phase, based on traffic characteristics. When adjust-
ing splits to provide priority, consideration must be
taken so that the adjustment does not dramatically
impact the vehicular traffic on the non-transit vehi-
cle phases. Consideration of overall person delay
rather than only vehicular traffic delay allows a more
aggressive approach to the timing settings. If the
splits are adjusted too much, the non-transit vehicle
approaches may experience noticeably higher
delays, resulting in longer queues and complaints
from motorists.
14.3.5 Pedestrian Timing
Traffic signals without pedestrian actuation or push
buttons must rely on a recall in the traffic controller
that ensures a pedestrian WALK indication will be
displayed during each cycle. Pedestrian Recall calls
up the time necessary for pedestrian timing for spe-
cific phases that do not have pedestrian actuation.
For example, when pedestrian recall is on the non-
transit vehicle phase, the minimum pedestrian cycle
timing (Walk and Flash Don’t Walk) will occur,
potentially delaying the transit vehicle.
The lack of pedestrian push buttons (thus necessi-
tating the use of Pedestrian Recall) at a signalized
intersection limits the amount of time available to
shorten a phase (provide red truncation to the tran-
sit vehicle phase). For example, when side streets
have pedestrian recall activated, priority timing for
the transit vehicle phase is limited; because the
side streets need to serve the Walk and Flash Don’t
Walk each cycle, regardless of whether a pedestrian
is present at the intersection.
In instances with pedestrian push buttons, (without
pedestrian recall) the pedestrian timing must be
taken into account when providing priority. A signal
priority strategy must be developed such that, in
the event of a pedestrian call, allows the signal to
serve the pedestrian timing without driving another
phase to its minimum or negatively impacting the
transit vehicle phase. This is done by providing prior-
ity for the “worst-case” scenario, assuming pedes-
trian timing will be called even when Pedestrian
Recall is not active.
14.4 Transit Signal Priority Examples
Transit Signal Priority (TSP) is the process of altering
the signal timing to give a priority or advantage to
transit operations, as illustrated in the figure below.
Signal priority modifies the normal signal operation
process to better accommodate transit vehicles.
This is different from signal “pre-emption,” which
interrupts the normal signal operation to accommo-
date special events (e.g. train approaching a railroad
grade crossing adjacent to a signal, emergency
vehicle responding to an emergency call).
TSP systems can either be manually implemented
by the transit vehicle driver or automatically imple-
mented using on-vehicle technology, which is the
preferred method because it eliminates the human
factor, having the driver remember to activate the
emitter. In many cases, the automated TSP will
only occur at a signalized intersection if the corre-
sponding transit vehicle is behind schedule, based
on the TSP logic programmed into the traffic signal
controller.
Early Green (red truncation): The desired phase
green is started earlier. This is helpful if the transit
vehicle is detected during the desired phase red.
Example: Early Green - Bus traveling on Main
Street and arrives during Side Street green and
wants an early green light for the Main Street.
Green extension: Desired phase green is length-
ened up to a maximum permitted time. This proves
helpful when the transit vehicle is detected near the
end of the green and no near side bus stop is pres-
ent. By extending the green a few seconds, the
transit vehicle avoids stopping at the signal.
Example: Phase Extension - Bus traveling on Main
Street and arrives late during Main Street green and
wants phase extension.
PPAA
RRTT
IIIIII
Transit Signal Priority Handbook Y 77

PPAA
RRTT
IIIIII
78 Y Transit Signal Priority Handbook
FIGURE 11 Transit Signal Priority Examples 21
Concept of Operations
Variable Green
Clearance Interval
TSP Min. Green
120 second cycle
Main Street: 25 sec Green 5 sec Yellow
Side Street through phase: 10 sec Min. Green 15 sec Variable Green 5 sec Yellow
Main Street left turn: 10 sec Min. Green 15 sec Variable Green 5 sec Yellow
Side Street: 10 sec Min. Green 15 sec Variable Green 5 sec Yellow
21 Transit Capacity and Quality of Service Manual,Transit Research Board, 1999.
FIGURE 12 Normal signal timing operation

PPAA
RRTT
IIIIII
Transit Signal Priority Handbook Y 79
Concept of Operations
Early Green: Y Bus arrives during Main Street red Y Subsequent phases are shortened to "acceptable" TSP Minimum Greens Y Bus receives green 45 sec earlier than normal timing Y Main Street is green at local zero point in cycle, maintaining coordination with accident traffic signals.
Point of detection
Shorter signal delay
FIGURE 13 Signal timing operation with early green (red truncation)
Concept of Operations
Point of detection
Local cycle zero
Phase Extension: Y Traffic light stays green for Main Street beyond normal termination point using the available "variable" green from the following phases Y Subsequent phase(s) are shortened to "acceptable" TSP Minimum Greens Y 90 seconds delay savings - Bus does not need to stop; avoids having to wait through side street and left turn phases
ETA
FIGURE 14 Signal timing operation with phase extension
Green Extension: desired phase green is lengthened up to a maximum permitted time. This proves help-
ful when the transit vehicle is detected near the end of the green and no near side bus stop is present. By
extending the green a few seconds, the transit vehicle avoids stopping at the signal.
Example: Phase Extension - Bus traveling on Main Street and arrives late during Main Street green and
wants phase extension.

SIMULATION AND OPTIMIZATION TOOLS FOR TSP
15.1 Introduction
Traffic signals are provided at intersections to per-
mit safe movement of traffic and/or pedestrians.
The purpose of a traffic signal is “to alternate the
right of way between traffic streams so that the
average delay to all vehicles and pedestrians, the
total delay to any single group of vehicles and
pedestrians and the possibility of accident-produc-
ing conflicts are minimized”22. Right-of-way for dif-
ferent movements at a signal is governed by indica-
tions that display green, amber or red for vehicles
and/or walk, “flashing walk” or “don’t walk” for
pedestrians. The indications are controlled by traffic
signal controllers. There is a traffic signal controller at
most intersections and it typically controls a single
intersection or, in the case of a coordinated traffic cor-
ridor – it might also monitor multiple signals.
Settings that govern the display of different signals by
a traffic controller are called traffic signal timing plans.
Traffic signal timing plans are designed to accom-
modate the various users of the street network.
Traffic engineers typically use field observations,
various data, and computer models prior to imple-
mentation of a signal timing plan. Optimization of
a signal requires field adjustment to make a signal
timing plan effective. One of the primary problems
with the existing signal timing models, is that they
are designed solely for vehicular traffic rather than
transit, pedestrians, or freight. The implementation
of transit signal priority is an additional level of com-
plexity that requires additional understanding of the
controller’s logic and even modification in some
cases. Traffic simulation models provide an opportu-
nity to assess the impact of transit signal priority.
This chapter gives the reader a brief overview of
these tools. The chapter is divided into two sec-
tions – simulation and optimization.
15.2 Simulation
15.2.1 What is Simulation?
Simulation is the process of replicating a real world
situation in a computer model. The model is used to
predict system performance based on interactions
between its components. In the case of traffic sim-
ulation components include infrastructure and traffic
using this infrastructure. Infrastructure might
include streets, signals, crosswalks, bus stops, etc.
while traffic includes passenger cars, buses, trucks,
pedestrians, bikes and trains. Performance of a
traffic system is usually evaluated by different
measures of effectiveness (MOE) like delay, queue
length, travel time, system throughput, etc.
Traffic simulation can be broadly classified into three
categories based on the fidelity level of the model
being employed – macroscopic, mesoscopic and
microscopic. The difference between these types of
simulation is the level of detail to which traffic is
replicated in the model. A macroscopic model is
one in which the level of detail is low and traffic is
simulated as a stream. A mesoscopic model has a
moderate level of detail with less interaction
between the individual vehicles while microscopic
models have the highest level of detail and simulate
individual vehicles within the network. Vehicles in a
microscopic model, as the name suggests, are
modeled to the minutest detail usually on a second
by second basis. Since the vehicular status is
known for each second, microscopic simulation
models provide extensive reporting capabilities ? an
important requirement for transit signal priority
(TSP) evaluation. Microscopic simulation models
permit different acceleration/deceleration rates, driv-
er characteristics, gap acceptance characteristics,
and similar factors to be assigned for pre-selected
vehicular or driver groups, making interactions in
the model as realistic as possible. Due to their abili-
ty to simulate individual vehicles in the network,
only microscopic models are able to simulate transit
signal priority applications at the individual intersec-
tion level. Therefore, this document will address
only microscopic simulation.
15.2.2 The Need for Simulation
Simulation allows the user to test a new system orredesign an old system on the computer beforedeploying it in the field. It also allows the user totest different alternatives or “what if” scenarios thatcannot be tested in real life. Some of the advan-tages of simulation include:
PPAA
RRTT
IIIIII
80 Y Transit Signal Priority Handbook
22 Parsonson, Peter, NCHRP Synthesis 172 – Signal Timing Improvement Practices, Transportation Research Board, February 1992
15

Y Provides a cost effective way of testing and
evaluating different scenarios
Y Allows the user to test scenarios faster than in
real life
Y Offers an insight into the characteristics of traf-
fic system operations that are important, allow-
ing the user to make a more informed decision
Y Provides outputs/animation that the public
can understand
At the same time simulation has some disadvantages:
Y Requires collection of detailed data on field
conditions
Y Needs calibration and validation of the model
prior to testing scenarios
Y Requires an understanding of how the model
works before assessing the outputs
The processes of conducting a simulation study are
described in the following section.
15.2.3 How to Conduct a Simulation
This section gives a brief outline for identifying the
best simulation model suited to a particular job,
conducting a simulation and analyzing outputs of
simulation runs.
15.2.3.1 Selecting a model
There are a number of simulation models available
on the market, including but not limited to, AIM-
SUN, CORSIM, HUTSIM, INTEGRATION, MITSIM,
PARAMICS, SIMTRAFFIC, TEXAS, TRANSIMS, VIS-
SIM and WATSIM. This section helps users in
selecting a simulation model that best suits their
purpose. Simulation users need to understand that
every simulation model has its own strengths and
weaknesses. Selection of a simulation model
should be primarily based on model capabilities and
project objectives. Simulation models have different
capabilities related to the size of the network they
can simulate (number of links and nodes they sup-
port), amount of data and hardware they require for
input, amount of flexibility they provide users in sim-
ulating real world situations and outputs they gener-
ate. Their capabilities have to be assessed before
selection of a model. Given below is a list of things
to consider in the selection of a simulation model.
Size of network: Although most simulation
models do not have predefined limits (most of
them are limited by the computational power),
some of them are limited in terms of number
of nodes, links, detectors, and other features. If
a large network needs to be simulated it is nec-
essary to choose a model with that capability.
Elements supported: Simulation models dif-
fer in their ability to model individual traffic ele-
ments like cars, trucks, buses, rail, bicyclists,
motorists and pedestrians. For TSP, it is impor-
tant to be able to model and track individual
transit vehicles. If a model supports any or all
of these elements, it is also useful to know the
extent to which these elements are supported
in the model. Some of the models allow the
user to define the features like acceleration/
deceleration rates and driver aggressiveness.
Many simulation models have limited or no abil-
ity to simulate transit vehicles and it would
make little sense in choosing them to simulate
transit signal priority.
Simulation models also differ in their ability to
model different scenarios. Some models are
not capable of modeling roundabouts, high
occupancy vehicle (HOV) lanes, railroad cross-
ings, unsignalized intersections, work zones
and toll plazas. The user should be aware of
model limitations in simulating scenarios that
need to be evaluated.
Vehicular movement control: The move-
ment of vehicles in a microscopic simulation
program is controlled by different logic. There
might be logics for car-following, lane changing,
merging, behavior on freeways and urban
routes. It is necessary to have a basic under-
standing of the logic being applied in the simu-
lation model before selecting it. It is also help-
ful to know if the user is given control in modi-
fying or changing the logic in the model.
Ease of use: Each simulation model is different
in terms of its ease of use. Some simulation
models provide an easy to use graphic user
interface (GUI) and have a simple process for
data input. Some models allow the user to use
an aerial photograph or map as a background
PPAA
RRTT
IIIIII
Transit Signal Priority Handbook Y 81

while coding the network, which makes geom-
etry coding much easier. And some models are
easy to calibrate/validate by providing different
measures of effectiveness in a readable format.
Flexibility: Some simulation models provide
more flexibility to simulate different scenarios
and also provide a selection of parameters that
the user can manipulate. For example, in some
models vehicle acceleration and deceleration
rates can be modified for each type of vehicle.
Also models that have the capability to modify
dwell times for each transit stop and for each
transit line allow users to match the model to
field conditions. Other features that the user
might be interested in are:
Y Data transfer – to and from other models
Y Application Program Interface (API) – Some
simulation models support APIs allowing
users to customize the signal timing plans
or to simulate traffic controllers/hardware
that are used in the field.
Flexible models enable users to simulate more
complex scenarios and usually require addition-
al field data and time in coding the model, but,
they also provide more reliable and accurate
results. For projects that require the evaluation
of a large number of scenarios, models with
less flexibility and capabilities may be used to
reduce the effort and cost of evaluation. But,
for projects in which a few pre-selected scenar-
ios are to be evaluated, models with better
flexibility and more capabilities are preferred.
It should be noted that use of a flexible model
requires that the user has a thorough under-
standing on how the model works. The user
also would have more to input during the net-
work building process, which might make the
simulation model less easy to use.
Signal control logic and detection:Signal control logic and detection are important
simulation features necessary for simulating
transit signal priority operations. Simulation of
TSP requires that simulation models can detect
and distinguish between various types of vehi-
cles and their routes, in particular transit vehi-
cles. Modeling transit signal priority requires
making changes to the traffic signal control
logic of the controller. Many simulation models
offer basic TSP features like green extension
and red truncation. Users should understand
the capabilities and limitations of the model in
simulating green extension and red truncation
given that traffic signal controllers accomplish
these treatments in different ways, including
which phases are shortened and whether the
time is taken from the current cycle or the next
cycle. Users should also understand the capa-
bilities and limitations of the model in simulat-
ing advanced features like phase rotation,
phase insertion and phase skipping. In addition,
the user should know if changes to signal con-
trol logic can be done by the user or have to be
done by the software vendor, since the latter
might be expensive and time consuming.
Animation and output: Simulation models
provide users with animation of the network.
Some models have the capability to provide 3-
dimensional animations with other details (like
buildings, traffic signals, etc.) and also to allow
the user to zoom or pan across networks.
Most of these animations can be made into
movie clips and are great tools for presenta-
tions, providing a vivid presentation of the ben-
efits of TSP to policy boards and public.
Most simulation models have a provision that
allows for customizing output format. It helps
the user to have the results in a compiled form
rather than a vehicle-by-vehicle or a link-by-link
basis. Sometimes the models also support
tracking individual vehicles and this might be
useful in the case of transit signal priority.
Travel time, delay, queue length, number of
stops, fuel consumptions, emissions, bus/tram
wait time are some of the most used outputs.
Cost of Simulation: Users have to be care-
ful in the selection of a simulation model.
Prices of simulation models vary considerably
and depending on the model, the amount of
time and effort needed to collect data, build the
model, calibrate/validate it, and analyze differ-
ent scenarios varies considerably, leading to
considerable differences in project cost.
PPAA
RRTT
IIIIII
82 Y Transit Signal Priority Handbook

It should be noted that initial coding of the net-
work in a simulation model takes a consider-
able amount of effort and is usually expensive.
Once the network is coded-calibrated-validated
for a particular time period (a.m. peak or p.m.
peak), or a particular scenario, subsequent test-
ing for other time periods or other scenarios is
relatively easy and inexpensive.
15.2.3.2 Collecting Data
Field data is required to conduct a simulation study.
The data usually required to conduct a simulation is
as follows:
Y Geometric -- length of lanes, lane widths, num-
ber of lanes, lane assignment, length and loca-
tion of crosswalks
Y Signal timing plans – cycle lengths, number of
phases, duration of phases, etc. for different
times of the day
Y Speed – speed limits and average
vehicular speed
Y Transit vehicle – travel times, dwell times and
distribution of dwell times
The actual amount of data collected depends on
available budget, time and project requirements. At
a minimum a.m. and p.m. peak data should be col-
lected. If there is a significant variation in traffic vol-
umes, additional data may need to be collected
such as midday, Saturday and Sunday. Attention
should be given to the time period of data collec-
tion. For example, data collection of regular week-
day traffic should be conducted between Tuesday
and Thursday to avoid traffic fluctuations due to
weekend trips and preferably, should not be during
a holiday season. Weekend data should be collect-
ed during times that are most relevant to meet proj-
ect objectives, such as weekend traffic peak period
and/or weekend peak transit operational headways.
15.2.3.3 Developing the Network for Simulation
Developing the network for simulation involves the
processes of coding, calibration and validation.
Calibration and validation are extremely important,
but often do not get the attention they deserve in
the simulation process.
Coding: Coding is the process of building the
network in the simulation model. It involves input
of the study area geometry in the simulation
model with other information like the timing
plans and volumes. Given below are the different
ways to code a network in a simulation model:
Y The network can be coded in the simulation
model itself.
Y The network can be coded in a Network Editor
that is bundled with the simulation model and
can then be transferred to the simulation
model. The Network Editor is designed to sim-
plify network coding.
Y In some cases the network can be coded in
simulation or optimization models and can be
transferred/exported to other simulation mod-
els. This procedure is mainly used when multi-
ple softwares are required for the analysis and
optimization of the network. Sometimes, due
to the simplicity of the Network Editor, the
study network is coded in one model and then
transferred to another model. If this method
of coding the network is used, the user
should be aware of the features/elements that
may be altered or missed during the transfer
process.
Calibration: Simulation models need to be
calibrated before they are used for testing
future scenarios since an un-calibrated model
might lead to skewed results. Calibration
involves changing some of the default parame-
ters used in the simulation model so that it
reflects the conditions observed in the study
area. As previously mentioned, the movement
of traffic in a simulation model is governed by
different logics. Simulation models provide the
user with different parameters to fine tune the
logic and other aspects of the model.
Examples of these parameters include mini-
mum headway, minimum acceleration rate,
minimum deceleration rate, maximum accelera-
tion rate, etc. These parameters are given
some default values based on studies conduct-
ed by the model developer and are usually
meant to reflect generic situations. It should be
noted that simulation model parameters might
not be independent of each other and simula-
tion model calibration should be conducted by
PPAA
RRTT
IIIIII
Transit Signal Priority Handbook Y 83

studying the effect of change of one parameter
on another and performing modifications to
parameter values accordingly.
Validation: Validation can be understood as a
check on the calibration of the simulation
model. It is done by simulating the calibrated
model using a set of real world data different
from the one used for calibration. The output
from simulating this real world data is com-
pared to field observations. If the output match-
es field observations, the user can be sure that
simulation model calibration is accurate and be
confident in using the calibrated model to simu-
late future scenarios or other scenarios that
cannot be tested in the field. If there is a mis-
match, then the user should reconsider calibra-
tion adjustments before using the calibrated
model to test or compare different scenarios.
The user should also be aware of limitations of
any simulation model in representing real world
situations. It is important to view the anima-
tions during the validation process to check for
discrepancies. Results of a simulation might
vary considerably due to some of the assump-
tions made in simulation modeling. For exam-
ple, a vehicle that is supposed to make a left
turn at a signal might have been unable to
change to the turning lanes until it is too close
to the intersection and might therefore be
blocking the through movement of traffic. In
real life conditions, if such a situation occurs, a
driver would simply move through the signal
and make a U-turn at the next intersection.
Unfortunately, simulation models do not permit
this kind of movement and thus might lead to
unexpected results. These types of anomalies
should be addressed before using/comparing
the outputs of the simulation.
Example: Given below is an example of
developing a network for simulating future
TSP scenarios.
For example, consider the case of simulating a
bus route for a network during the a.m. peak
hour. The measure of effectiveness in this case
is bus travel time from its origin to its destina-
tion. Factors affecting bus travel time are
observed to be volume of traffic along its route
and number of passengers waiting at the bus
stops. Data has been collected (for the pur-
pose of calibration and validation) in the field
for a period of two hours during the morning
peak period. Within these two hours, the bus
has made a total of 12 trips from its origin to
destination and the user has all the required
information – number of passengers at the bus
stops, volume of vehicles in traffic along the
route and bus travel time for all trips.
The coding of the network in the simulation
model would involve the input of geometry of
the roads and intersections along the bus
routes, locating the bus stops and the input of
traffic signal timing plans at intersections for
the morning peak period along the bus route.
Once this information is coded in the simula-
tion model, the model can be calibrated using
data collected during the first hour in the field.
Traffic volume and number of passengers wait-
ing at bus stops for the trip representing the
median of the travel times, among the six trips
during the first hour, can be used for calibra-
tion. Using this traffic volume and passenger
number in the network, values of parameters in
the simulation model can be modified until trav-
el time output of the simulation matches what
was observed in the field.
The calibrated model (with modified parame-
ters) then has to be validated using data col-
lected during the second hour. This might
involve simulating the calibrated model using
traffic volume and number of passengers
observed in the median trip for the second
hour. If the travel time output from the simula-
tion matches field observation for that trip, you
can be confident in using the calibrated model
to simulate the bus route with different traffic
volumes or different numbers of passengers at
bus stops. Then you can rely on the bus travel
times that the simulation predicts. If output of
the calibrated model does not match travel
time observed during the validation process,
you should reconsider the values that
are calibrated.
In the above example, data for a single trip has
been used to illustrate the calibration and vali-
PPAA
RRTT
IIIIII
84 Y Transit Signal Priority Handbook

dation process. If resources permit, it is good
practice to use multiple data sets and multiple
simulation runs (for more information see sec-
tion 4.2.3.5). Statistical methods are to be used
for comparison of simulation results.
15.2.3.4 Warm Up Time
When a scenario is simulated, the simulation starts
with zero vehicles in the network. Vehicles are grad-
ually seeded (input) into the network and the user
should gather Measures of Effectiveness MOEs
after the network in the simulation model has vehi-
cles interacting as they would do in real world con-
ditions. The transition time, from the start of the
simulation to the time when vehicles begin to inter-
act, is called the warm up time. Outputs from the
simulation run are to be taken from a period starting
after the warm up time. Most simulation models
allow users to define a warm up period. The amount
of time given for the network to warm up varies but
as a rule of thumb it can be used as the time taken
for a vehicle to travel the longest link/route of the
network from one end to the other.
15.2.3.5 Number of Simulation Runs
Most of the micro-simulations are stochastic in
nature. Some of the features like driver characteris-
tics, acceleration, arrival of vehicles, etc. within
these models follow different probabilistic distribu-
tions. This is done to simulate the variability of
real world conditions. To incorporate variability in
the results, simulation models provide random
number sequences (also called random seeds).
Multiple runs can be conducted on a particular
scenario with different random numbers to check
the result of variability.
Results of a simulation analysis, drawn from a sin-
gle run (for the case of a microscopic stochastic
simulation model), are almost always misleading
(unless the run happens to represent the median).
The inherent variability of a stochastic process
requires that we simulate multiple runs. Multiple
runs allow the replication of variation of real world
situations in simulation modeling. A probabilistic
approach should be used in identifying the number
of simulation runs to be conducted. The number of
simulation runs should be based on variability, in the
results of the simulation.
The following steps can be followed in identifying
the number of simulation runs to be conducted:
Y Make an initial sample run
Y Estimate the sample variance (in terms of
results for the measure of effectiveness)
Y Determine or select the confidence interval
Y Estimate the number of runs to be conducted
based on the confidence interval
15.2.3.6 Analyzing the Outputs
Simulation models can enable a detailed analysis of
a complex intersection or corridor and measure the
outcomes of introducing TSP. Most simulation mod-
els have the capability to format the output for a
quick view of the MOEs. Some simulation models
also provide tools to conduct multiple simulation
runs without the user having to change the random
seed numbers and also provide the results of all the
multiple simulation runs.
MOEs – Different measures of effectiveness can be
used for evaluating the output of simulations,
including but not limited to queue length, delay,
travel time, traffic volume, speed variation, etc. In
the case of multiple runs, results on these meas-
ures should be presented in such a way as to pro-
vide the ultimate user information on the mean and
the variability of the results of the measure.
Simulation models also permit the testing of differ-
ent scenarios with respect to intersection geometry
and the design of traffic signal strategies, such as
transit-only phases for bus turn movements or
queue-jumps, phase rotations, different recovery
strategies, etc. This may prove useful for determin-
ing a TSP design that increases transit benefits while
minimizes impacts on traffic in complex situations.
PPAA
RRTT
IIIIII
Transit Signal Priority Handbook Y 85

15.3 Optimization
15.3.1 What Is Optimization?
Optimization is the process of designing or modify-
ing a system to make it as effective as possible for
a given criteria within a given set of constraints. In
the context of traffic signals, optimization can be
conducted on isolated signals, traffic signal corridors
or traffic signal networks. Signal timing optimization
involves the selection and modification of several
design elements including cycle length, number of
phases, phase sequence, phase duration and offsets
to achieve one or more objectives such as:
Y Minimize the number of stops.
Y Minimize the queue length.
Y Minimize the delay of vehicles.
Y Maximize throughput.
In addition, other factors like reduction of fuel emis-
sions and noise might also be considered.
The process of traffic signal optimization is carried
out by modifying traffic signal timing plans that
reside in, or are communicated by a central system
to, the intersection controllers. Different software
optimization tools are available in the market that
optimize timing plans, but none of the popular tools
are capable of optimizing all traffic signal design ele-
ments. Moreover, there is no software that can
optimize traffic signals to minimize transit vehicular
delay or to optimize transit signal priority opera-
tions. Since only traffic optimization tools are avail-
able, the following sections will concentrate on the
optimization of regular signalized intersections and
traffic signal corridors.
It should be noted that in the case of adaptive traf-
fic control systems, a quasi-optimization process is
carried out dynamically in real-time based on contin-
uous monitoring of traffic flows, delays and queues.
However, adaptive control is still relatively rare in
the North American context.
15.3.2 The Need for Optimization
The primary reason for the implementation of TSP
is to reduce travel time and the variability in travel
time of transit vehicles. Transit vehicles such as
buses share roadways with other vehicles like pas-
senger cars and trucks. The general corridor or net-
work delays impact both transit and other vehicles
and any improvement in the performance of the
corridor would benefit both. The optimization of traf-
fic signals is recognized as the cheapest available
method of improving traffic movement and hence
should be considered first before the implementa-
tion of transit signal priority.
15.3.3 How to Conduct an Optimization ofTraffic Signals
Optimization of traffic signals can involve optimization
of an isolated signalized intersection, optimization of
traffic signal corridors or optimization of traffic signal
networks with an increase in complexity from an iso-
lated signal to a corridor and to a network.
The primary constraints in the development of an
effective signal timing plan for an isolated signalized
intersection are vehicular and pedestrian demands
and intersection geometry. Signal corridors and net-
works have additional constraints like block lengths
and speed limits on the blocks. Pedestrian move-
ment is an important element in the signal timing
optimization process. Pedestrian movements
require a significant amount of time, especially for
wide intersections with multiple lanes at different
approaches and limit the extent to which traffic sig-
nals can be optimized. During the process of opti-
mization traffic engineers/designers often work with
one or more of these constraints and use their
expertise to balance them to achieve optimum traf-
fic signal timing plans.
Based on intersection geometry and types of vehic-
ular and pedestrian movements, the minimum initial
green time is determined for each phase. Minimum
phase length duration is governed by the durations
of minimum initial green, yellow and all red inter-
vals. The minimum green phase duration is always
the greater value of the minimum pedestrian time
or the minimum vehicle phase duration. Standards
for minimum pedestrian crossing times and vehicle
phase durations are provided by the Manuel for
Uniform Traffic Control Devices (MUTCD). It is
important to understand that minimum phase dura-
tion should not be violated by any type of signal pri-
ority procedures. The upper limit of phase duration
PPAA
RRTT
IIIIII
86 Y Transit Signal Priority Handbook

is governed mainly by the cycle length, number of
phases and the number of vehicles using the
phase. Cycle lengths are typically shorter in urban
environments, compared to the intersections in
suburban environments. It is good practice to keep
cycle lengths as short as possible to avoid unneces-
sary delays to pedestrians. The upper limit of cycle
lengths is usually governed by the agency operating
the signals.
In coordinated traffic signal systems, the cycle
length of all signals has to be the same. If the cycle
length of signals differs, offsets between intersec-
tions will not be constant and the signal progression
cannot be maintained. There are some special
instances where a signal in a coordinated system can
operate at half the cycle length of other signals in the
system, due to limited side street demand. It is
desirable practice that signal priority does not change
the cycle length of a coordinated signal system.
Every time the cycle length is changed, signal coordi-
nation is interrupted. Interruption of signal coordina-
tion may result in vehicular delay increase, which
may in turn increase the delay of transit vehicles.
As mentioned above, signal timing optimization
tools are limited in their capabilities. Most of the
tools currently available only optimize some of the
elements such as the phase durations, cycle lengths
and offsets. Knowing that each of the optimization
tools has different capabilities, the selection of the
model with capabilities that suit the project objectives
is an important step. It should be noted that to main-
tain uniformity of analysis among design firms, many
governing agencies impose restrictions on which soft-
ware to use for traffic signal optimization.
The selection of an optimization model is the first
step in conducting a traffic signal optimization.
Different software programs are available in the
market including, but not limited to, SYNCHRO,
TRANSYT 7F, PASSER, and MAXBAND. Some of
these specialize in minimizing the delay of vehicles
while others specialize in maximizing the green
bandwidth of signals along a corridor.
The selection of an optimization model is similar to
that of selecting a simulation model. Features such
as size of the network, elements supported, traffic
control, ease of use and flexibility are to be consid-
ered in the selection process. Most optimization
models are deterministic in nature, therefore multi-
ple runs are not required, contrary to the situation
with stochastic simulation models.
The selection of a model has to be followed by col-
lecting field data and coding the network in the
model. Data required by optimization models is less
detailed than that required by simulation models
since optimization models are representing average
flows as opposed to individual vehicles. The next
step after coding involves optimization of the signal
or the corridor. This step usually involves the selec-
tion of an intersection or a network and asking the
model to optimize features like splits, cycle times,
network offsets, etc. Due to optimization model
limitations it is wise to check optimization results
and determine if manual changes in the phase
order, and/or type and number of phases, could
improve optimization results and if the modified
phasing would require an optimization rerun.
Optimization results in revised traffic signal timing
plans – cycle lengths, phase duration, phase order,
offsets, etc. It is strongly recommended that the
user note the change in the timings of the phases,
the splits and the cycle lengths of the resulting opti-
mized timing plan. Budget permitting, it is wise to
simulate the new timing plan to check the overall
effects of optimization.
15.4 Summary
Transit signal priority studies require two types of
software. Simulation software is used to evaluate
different transit signal priority scenarios, while
optimization software is used to optimize traffic
signal operations.
Simulation is a very cost efficient approach to evalu-
ate the effectiveness of different signal priority sce-
narios. A range of simulation software is available
on the market and selection of appropriate software
is an important step in cost effective project com-
pletion. Simulation software programs require vary-
ing amounts of field data in order to provide usable
results. The volume of data needed is dependent
on project objectives. Calibration and validation are
PPAA
RRTT
IIIIII
Transit Signal Priority Handbook Y 87

very important steps in the simulation process and
should not be taken lightly. Since simulations are
stochastic in nature, it is important to complete mul-
tiple runs so that variations in network operations
will not skew results. Simulation models provide a
wealth of different measures of effectiveness but
engineering judgment must be used to validate
each set of output data, before accepting the
results of simulation.
Signal timing optimization for general traffic is one
of the first steps to be taken in the signal priority
optimization process, since transit vehicle delay is
generally impacted by vehicular delay. Many opti-
mization models are available and selection of the
right model depends on the project goals, as well
as on the preference of a specific traffic agency. It
should be noted that there is no optimization soft-
ware available that will optimize timing plans for
transit operational needs and that optimization will
be focused on overall vehicular operations. Signal
timing plans have safety operations requirements
(e.g. minimum pedestrian crossing times) that
should not be violated by transit signal priority.
TRANSIT TERMINOLOGY
Note: Much of the following transit terminology is
derived or modified from entries in the document
Urban Public Transportation Glossary, published in
1989 by the Transportation Research Board.
Advanced (or Electronic) Fare Collection (AFC):means of collecting transit fares using an electronic
medium such as a magnetic stripe or smart card
(containing an embedded computer chip) which
stores various data on validity, transaction s, securi-
ty protection, and in some cases user-related data
type of user (e.g. senior, student or person with dis-
abilities), loyalty programs, etc.
Automatic Passenger Counting (APC) system:computerized system to collect passenger activity,
schedule, and vehicle utilization data. Modern APC
systems collect data on boardings, alightings (pas-
sengers getting off the vehicle), passenger loads,
vehicle location, schedule adherence, vehicle speed,
and vehicle movement (e.g. idling, stop dwell time,
traffic stop and go movement, etc.). Data is collect-
ed continuously during the day and downloaded
automatically in the garage for subsequent analysis.
Automatic Vehicle Location (AVL) system:senses or calculates, at intervals, the location of
transit vehicles. Vehicle location can be used in var-
ious applications, including schedule adherence
monitoring, operational control and incident man-
agement through computer-assisted dispatching,
real-time customer information, transit signal priori-
ty, etc. Although in the past some transit AVL sys-
tems used sign posts or other technology, most
now use the global positioning system (GPS) to
determine vehicle location.
Base period (off-peak period): in transit, the
time of day during which vehicle requirements and
schedules are not influenced by peak-period pas-
senger volume demands (e.g. between morning
and afternoon peak periods). At this time, transit
riding is fairly constant and usually low to moderate
in volume when compared to peak-period travel.
See also off-peak.
Base-period fleet: in transit, the number of tran-
sit units (vehicles or trains) required to maintain
base-period schedules.
Block (schedule): daily operating schedule of a
transit unit (vehicle or train) between pull-out and
pull-in, including scheduled and deadhead service.
A block may consist of a number of runs. See
below for definitions of “pull-out,” “pull-in,” “dead-
head,” and “run.”
Bunching: with transit units, a situation that
occurs when passenger demand is high and dwell
times at stops are longer than scheduled.
Headways become shorter than scheduled, and pla-
toons of transit units (vehicles or trains) develop,
with longer intervals between platoons. The same
effect (one transit unit caught by the following) can
also be caused by lack of protection from general
road traffic congestion or by traffic signal timing.
Bunching can become cumulative and can result in
delay to passengers and unused capacity. See
below for definition of “headway.”
PPAA
RRTT
IIIIII
88 Y Transit Signal Priority Handbook
16

Bus Bay: area in which a bus can pull out of the
traffic and dwell at a stop for passengers to board
and alight without holding up traffic. Sometimes
buses have difficulty moving back into the flow of
traffic from a bus bay and may need assistance
from traffic signals allowing them to “queue jump.”
Bus Rapid Transit (BRT): flexible, high perform-
ance rapid transit mode that uses buses or special-
ized rubber tired-based vehicles operating on pave-
ment, and that combines a variety of physical, oper-
ating and system elements into a permanently inte-
grated system with a quality image and unique
identity. One of the many elements that might
improve the quality of BRT is TSP.
Busway: special roadway designed for exclusive
use by buses. It may be constructed at, above, or
below grade and may be located in separate rights-
of-way or within highway corridors.
Capacity
Crush (crush load): maximum feasible pas-
senger capacity of a transit vehicle, that is, the
capacity at which one more passenger cannot
enter without causing serious discomfort to the
others.
Vehicle (normal vehicle capacity, totalvehicle capacity): maximum number of pas-
sengers that the vehicle is designed to accom-
modate comfortably, seated and standing; may
sometimes refer to number of seats only.
Check: in transit operations, a record of the pas-
senger volume on all transit units that pass a specif-
ic location or time point (also known as a passen-
ger riding counter check), the actual time the unit
passes it (also known as a schedule check), the
number of passengers who board and alight at each
stop on a route or line (also known as and on-and-
off count or check), or any combination of these
items. The checker may ride the transit unit (an on-
board check), follow it in another vehicle, or check
the transit units from a particular location (a point
or corner check).
Computer-Assisted Dispatching (CAD):computerized tool to assist supervisors/dispatchers
to monitor the status of the system, perform oper-
ational control tasks, and manage incidents. CAD
systems are often combined with AVL (CAD-AVL)
to provide more accurate knowledge of the real-
time location of transit vehicles and their adher-
ence to schedules.
Deadhead (or deadheading): to move a rev-
enue vehicle in other than revenue service, for
example, from one garage to another or from the
end of a line to a garage.
Dispatcher: in bus operations, the individual who
assigns buses to runs, makes up work assignments
to fill runs, directs the operators at the start of their
assignments, and in some cases, maintains a con-
stant awareness of the status of the operation, via
radio, computer-assisted dispatch -AVL or other
means.
Exclusive transit facilities: transportation sys-
tem infrastructure elements that are set aside for
the use of transit vehicles only. Examples include
bus lanes, off-street bus loading or unloading areas
or stations, bus freeway ramps, and separated and
fully controlled transit rights-of-way.
Extra board (spare board): roster of open
(extra) runs and assignments, or a pool of employ-
ees available to cover unfilled runs or extra work.
Headway: time interval between the passing of
the front ends of successive units (vehicles or
trains) moving along the same lane or track in the
same direction, usually expressed in minutes; see
also service frequency.
Base: scheduled headway between transit
unit (vehicle or train) trips during an off-peak
(usually mid-day) period.
Policy: headway prescribed by reasons other
than matching capacity to demand. The maxi-
mum permissible headway may be established
by the transit agency policy board, usually for
off-peak, low demand periods.
Headway management: technique for manag-
ing the operation of transit units (vehicles or trains)
that focuses on maintaining a certain spacing
between units on the same line, instead of adher-
ing to a timetable. For example, if units become
PPAA
RRTT
IIIIII
Transit Signal Priority Handbook Y 89

bunched, corrective measures might include delay-
ing the units at the rear of the bunch to provide reg-
ular headways and hence load distribution, even at
the expense of reducing timetable adherence.
In-service trip: time within a transit work run in
which the operator picks up and discharges passengers.
Inspector (road supervisor, route supervisor,street supervisor): transit employee who evalu-
ates performance, enforces safety and work rules,
and attempts to solve problems. An inspector may
be mobile (covering several districts in a radio-
equipped vehicle) or fixed (assigned to a post at a
designated intersection).
Lane
Bus (bus priority lane, preferential bus lane): highway or street lane reserved
primarily for buses, either all day or during
specified periods. It may be used by other traf-
fic under certain circumstances, such as mak-
ing a right turn, or by taxis or carpools that
meet specific requirements described in the
traffic laws.
Contraflow: highway or street lane on which
vehicles operate in a direction opposite to what
would be the normal flow of traffic in that lane.
Such lanes may be permanently designated
contraflow lanes, or, more usually, they may be
used as contraflow lanes during certain hours
of the day. Sometimes the use of contraflow
lanes is restricted to public transit.
Level of Service (LOS): set of characteristics
that indicate the quality and quantity of transporta-
tion service provided, including characteristics that
are easy to quantify (system performance, e.g. fre-
quency, reliability, travel time, travel costs, number
of transfers) and those that are difficult to quantify
(service quality, e.g. availability, comfort, conven-
ience, image).
Maximum load point (MLP): point on a transit
line or route at which the passenger volume is
greatest. There is one maximum load point in
each direction.
On-time performance: proportion of time that a
transit system adheres to its published schedule
times within stated tolerances; for example, a transit
unit (vehicle or train) arriving, passing, or leaving a pre-
determined point (time point) along its route or line
within a time period that is no more than “x” minutes
earlier and no more than “y” minutes later than a
published schedule time. (Values of 0 minutes for x
and three (or five) minutes for y are very common.)
Operator: employee of a transit system whose
workday is spent in the operation of a transit unit (vehi-
cle or train). [Operator is also used to indicate the
organization that runs a transportation system.]
Paddle board (paddle, run card, run guide):headway sheets (time schedule) made up for each
run (operator’s piece of work) that lists all the
pieces of work on that run (including any special
notations) for the operator.
Passenger load: number of passengers on a tran-
sit unit (vehicle or train) at a specified point.
Passenger volume (line volume): total num-
ber of passengers carried on a transit line during a
given period.
Peak (peak period, rush hours): period during
which the maximum amount of travel occurs. It
may be specified as the morning (a.m.) or afternoon
(p.m.) or other peak.
Peak/base ratio (peak/off-peak) ratio: ratio
between the number of vehicles operating in pas-
senger service during the peak hours and that dur-
ing the base period.
Pull-in: deadhead trip from the point at which the
transit unit (vehicle or train) ends an in-service trip
to the garage or yard.
Pull-out: deadhead trip from the garage or yard to
the point at which the transit unit (vehicle or train)
begins an in-service trip.
Queue jumper (queue bypass): short section
of exclusive or preferential lane that enables speci-
fied vehicles to bypass a queue of traffic or a con-
gested section of traffic.
Relief point: designated time point at which
operators may take a lunch period or rest break, or
PPAA
RRTT
IIIIII
90 Y Transit Signal Priority Handbook

a point at which an operator is relieved by another
operator, that is, where one run is completed, and
another starts.
Restoration of service: resumption of service
according to schedule after it has been interrupted
or operating off schedule.
Rider
Captive: rider who has no means of trans-
portation other than public transit.
Choice: rider who has other means of trans-
portation available and chooses public transit.
Experience has shown that service improve-
ments that improve transit travel times (such as
TSP) can bring more choice riders to public
transit.
Road call: mechanical failure of a bus in revenue
service that necessitates removing the bus from
service until repairs are made.
Run: 1. movement of a transit unit (vehicle or train)
in one direction from the beginning of a route to the
end of it; also known as a trip. 2. an operator’s
assignment of trips for a day of operation; also
known as a work run.
Split (swing run): two operating assignments
separated by a period of time during which the
operator is unassigned and not paid.
Straight: run that has no unpaid breaks in it.
Run cutting: process of organizing all scheduled
trips operated by the transit system into runs for the
assignment of operating personnel and vehicles.
Scheduling: in transit operations, the process of
preparing the operating plan (schedule) for a transit
line or network on the basis of passenger demand,
policy for level of service, and operating elements
(travel times, etc.).
Service (types of)
Arterial: generally major (long or heavily
patronized) transit routes that operate on princi-
pal or major surface arterial streets.
Circulator: bus service confined to a specific
locale, such as a downtown area or a suburban
neighborhood, with connections to major traffic
corridors.
Crosstown:non-radial transit service that does
not enter the central business district.
Express bus: bus service with a limited
number of stops from a collector area directly
to a specific destination.
Feeder: local transit service that provides pas-
sengers with connections to main-line arterial
service, or to a rail or express bus station.
Limited: transit service that operates only
during a certain period of the day, or that only
serves specific stops (also known as limited
stop service) or in a specified area.
Local bus: bus service that picks up and dis-
charges passengers on city streets. Local bus
service involves frequent stops and consequent-
ly low average speeds. Its purpose is to pick up
and deliver transit passengers close to their ori-
gins and destinations.
Service frequency: the number of transit units
(vehicles or trains) on a given route or line, moving
in the same direction, that pass a given point within
a specified interval of time, usually one hour; see
also headway.
Service standards (service guidelines):rules and measures that are established to guide
the policy, planning and management of transit
services. Building on corporate goals, service
objectives, and system performance targets, serv-
ice standards encompass route performance crite-
ria, planning guidelines, and evaluation criteria.
Route performance criteria: criteria for
managing and evaluating the performance of
individual transit routes. These act as warrants
for making minor service adjustments or for
identifying poorly performing routes. These
might include: effectiveness criteria (e.g. load-
ing standards, on-time standard, safety stan-
dard); efficiency criteria (e.g. service utilization
standard, operator utilization standard), and
financial criteria (e.g. cost recovery standard).
Planning guidelines: warrants and design
guidelines to establish the need, and guide the
planning of new routes or changes to existing
routes. These might include: service area war-
PPAA
RRTT
IIIIII
Transit Signal Priority Handbook Y 91

rants (e.g. area location — distance from exist-
ing routes; area density — residential or indus-
trial) and design guidelines (e.g. route design,
stop spacing, schedule design, service hours).
Evaluation criteria: criteria for selecting,
from many new service proposals, the priorities
for further consideration. These might include:
market performance (e.g. markets served,
demand for transit services) and cost perform-
ance (e.g. subsidy level).
Short turn (turn back): in transit operations, to
cut short a transit trip (to turn back before reaching
the end of the route or line), usually to get back on
schedule or to meet peak passenger demands.
Sign-up (bidding runs, mark-up, operatorpick, pick, run pick, shake-up): procedure by
which, at regular intervals or when new service or
realignments of service are implemented, operators
select their regular assignment for an upcoming
period (typically several months). The order of
selection is usually by operator seniority and is usu-
ally specified in union contracts.
Stop: designated location for boarding and alight-
ing of transit vehicles. Typical spacing of stops on
streets is 825 ft to 1320 ft (250 m to 400 m).
Far-side: transit stop located beyond an inter-
section. It requires that transit units (vehicles
or trains) cross the intersection before stopping
to serve passengers.
Mid-block: transit stop located at a point
away from intersections.
Near-side: transit stop located on the
approach side of an intersection. The transit
units (vehicles or trains) stop to serve passen-
gers before crossing the intersection.
Time:
Allowance (allowed time, bonus time,dead time, hold time): time for which an
operator is paid even though the hours have
not been worked in operating a transit unit.
Forms of allowance time are pad time, report
time, turn-in time, and sometimes intervening
time.
Dwell: time a transit unit (vehicle or train)
spends at a station or stop, measured as the
interval between its stopping and starting.
Layover: time provided under the contract to
ensure a periodic work break for the operator
and to prepare for the return trip, typically at
the end of a route.
Recovery: time built into a schedule between
arrivals and departures, used for the recovery
of delays caused by traffic conditions and serv-
ice incidents.
Running: actual time required for a transit
unit (vehicle or train) to move from one point to
another.
Time point: point on a line or route at which tran-
sit units (vehicles or trains) are scheduled to pass at
a specified time. Usually, the leaving (not arriving)
time is used.
Timed transfer: scheduling of intersecting transit
routes so that they are due to arrive at a transfer
point simultaneously.
Timetable: 1. usually refers to a printed schedule
for the public. 2. a listing of the times at which tran-
sit units (vehicles or trains) are due at specified
time points; also known as a schedule.
Transit center: transit stop or station at the
meeting point of several routes or lines. It is locat-
ed on or off the street and is designed to handle
the movement of transit units (vehicles or trains)
and the boarding, alighting, and transferring of pas-
sengers between routes or lines.
Tripper: 1. in transit operations, a short piece of
work that cannot be incorporated into a full day’s
run, usually scheduled during peak hours. 2. on
some transit properties, a short run that is less than
eight hours long.
PPAA
RRTT
IIIIII
92 Y Transit Signal Priority Handbook
REFERENCES FORPART III
Ben Franklin Transit. “System Snapshot”. Richland,
WA. Available on the Web: www.bft.org
Calgary Transit. “Transit Signal Priority and
Automatic Vehicle Tracking System for Calgary Transit
Buses”. Calgary, Alberta, Canada. May 2004.
Callas, Steve. “TriMet’s Transit Signal Priority
System and Evaluation”. Presentation prepared by
TriMet, Portland, OR.
Chada, S. and Newland, R. “Effectiveness of Bus
Signal Priority”. National Center for Transit Research,
Center for Urban Transportation Research, University
of South Florida, Tampa, FL, January 2002.
City and County of Honolulu – Department of
Transportation Services. “Bus Rapid Transit”.
Honolulu, HI. March 1, 2002.
Collura, J. and Gifford, J. “Traffic Signal Preemption
and Priority: Technologies, Past Deployments, and
System Requirements”. White Paper.
City of Los Angeles Department of Transportation.
“Metro Rapid Program Transit Priority System
Evaluation Report”. Available on the Web:
http://www.fta.dot.gov/brt/lamrdp/appA.html, 2001.
Crout, David. “Transit Signal Priority: The
Importance of AVL Data”. Presentation at
Transportation Research Board Annual Meeting,
January 11, 2004.
DKS Associates and Pierce Transit. “TSP
Implementation Final Report - SR-7 Corridor”.
February 2004. . Takoma, WA. Available on the
Web: www.piercetransit.org/tsp.htm
DKS Associates and Pierce Transit. “TSP
Implementation Report – 6th Avenue”. November
2003. Takoma, WA. Available on the Web:
www.piercetransit.org/tsp.htm
DKS Associates and Pierce Transit. “TSP
Implementation Report - 56th Street”. November
2003. . Takoma, WA. Available on the Web:
www.piercetransit.org/tsp.htm
DKS Associates, NWS Engineering and Pierce
Transit. “TSP Technology Report - Pierce Transit Signal
Priority Implementation”. Takoma, WA. April 2003.
Available on the Web:www.piercetransit.org/tsp.htm
DKS Associates, NWS Engineering and Pierce
Transit. “TSP Implementation Report – Pierce
Transit Signal Priority Implementation”. Takoma, WA.
April 2003. Available on the Web: www.piercetran-
sit.org/tsp.htm
Federal Transit Administration. “Bus Rapid Transit
Project, San Pablo and Telegraph/International/East
14th Corridors – Alameda Contra Costa Transit
District”. July, 29, 2002. Available on the Web:
www.fta.dot.gov/2396_7266_ENG_HTML.htm
Fehon, K., Jarzab, J., Emoto, C., & Dagang, D.
“Transit Signal Priority for Silicon Valley Bus Rapid
Transit”. White Paper on BRT/TSP application for
Santa Clara Valley Transportation Authority.
Gardner, Craig. “2070’s at 2002 Winter Olympics in
Salt Lake City”. Presentation for Caltrans’ 2070 &
ITS Cabinet Workshop. August 2001.
Gray, Benia (Editor). “Urban Public Transportation
Glossary”. Transportation Research Board. 1989
Illinois Department of Transportation and Civiltech
Engineering, Inc. “The Cermak Road Bus Priority
Project Final Report”. Chicago, IL, 1998.
Innovative Transportation Concepts, Inc. and
Regional Transportation Authority. “Regional Transit
Signal Priority Location Study – Phase II, Model
Simulation”. Regional Transportation Authority,
Chicago, IL. April 18, 2003.
Intelligent Transportation Society of America. “An
Overview of Transit Signal Priority”. ITS America,
Washington, DC, July 2002. Available on the Web:
http://www.itsa.org/tsp.html
PPAA
RRTT
IIIIII
Transit Signal Priority Handbook Y 93
17

Joint Committee on the Advanced Transportation
Controller, Institute of Transportation Engineers,
American Association of State Highway and
Transportation Officials, Federal Highway
Administration, and National Electrical
Manufacturers Association. “Advanced
Transportation Controller Standards Overview”.
White Paper. May 3, 2000.
King County Department of Transportation. “Transit
Signal Priority shown to cut travel time, work to
synchronize signals at 80 intersections planned
county-wide”. News Release, King County
Department of Transportation. Seattle, WA.
February 12, 2001.
King County Department of Transportation. “King
County Transit Signal Priority”. Seattle, WA. January
25, 2001.
King County Department of Transportation and City
of Seattle Transportation. “Transit Signal Priority
System Assessment Study: Rainier Avenue South
Field Evaluation Draft Report”. Seattle, WA, 2000.
King County Department of Transportation.
“Controller firmware modifications/TSP Strategies
Transit Signal Priority Study”. Available on the Web:
www.transit.metrokc.gov/prog/tsp/tsp-strategy.html
King County Department of Transportation.
“Challenges: Transit Signal Priority Study”. Available
on the Web: www.transit.metrokc.gov/
prog/tsp/challenges.html
Kitsap County Transit and Nelson/Nygaard
Consulting Associates. “SR 303 Corridor Transit
Planning Study – Technology Review”. Kitsap Transit.
Bremerton, WA.
Koonce, Peter. “Detection Range Setting
Methodology for Signal Priority”. Journal of Public
Transportation, Vol. 5, No. 2, 2002
Koonce, Peter J. V., Kloos, Bill, Callas, Steve. “Bus
Priority at Traffic Signals in Portland. Version 2.0, The
Streamline Project”. ITE Meeting, 2002
Henke, Cliff. “US Cities Give Green Light to Bus,
LRT Signal Priority”. METRO Magazine.
March/April 1999.
Mirabdal, J., Fleck, J., & Thesen, B. “3rd Street
Light Rail Process – Process and Challenges of
Developing Transit Signal Priority”. Presentation
from October 22, 2003.
Meyer, Mohaddes Associates, Inc. “City of
Glendale Traffic Signal Priority System”. Glendale,
CA. May 2002. Available on the Web:
www.mmausa.com
Mucsi, K. “Transit Signal Priority in Ottawa:
Approach and Opportunities”. Presented at National
Bus Rapid Transit Institute, Ottawa, Canada,
September 24, 2003.
O’Brien, W. “Design and Implementation of Transit
Priority at Signalized Intersections: A Primer for
Transit Managers and a Review of North American
Experience”. Canadian Urban Transit Association
STRP Report 15, Toronto, Canada, 2000.
Pang, Gordon. “Bus Drivers will get power to
extend green lights”. Honolulu Star Bulletin.
Honolulu, HI. February 9, 2000.
Pitstick, Mark. “Cermak Road Bus Priority
Demonstration”. Presentation at Transit Signal
Priority Workshop, Bloomington, MN. July 12, 1999.
Prevedouros, Panos. “A Less Expensive and Less
Disruptive Bus Rapid Transit System for Honolulu..
University of Hawaii at Manoa. Manoa, HI.
November 15, 2002.
Pujol, Cesar. “Transit Signal Priority for the San
Pablo Rapid Bus”. Presentation for AC Transit,
October 1, 2003.
San Francisco Planning and Urban Research
Association. Newsletter Calendar Report 402.
“Muni’s Vision for Rapid Transit in San Francisco”.
Skehan, S. “Transit Signal Priority for Metro Rapid Bus
in Los Angeles”. Presentation to ITS America Transit
Signal Priority Workshop, Tucson, AZ, April 2003.
PPAA
RRTT
IIIIII
94 Y Transit Signal Priority Handbook

Smith, Loyd. “An Evaluation of Wireless Data
Options”. Houston METRO. Presentation at
APTA/TransITech Conference. February 2004.
TM+E Magazine. “Receiving Preferential
Treatment.” April 2004.
Tobin, Bill. “Transit Signal Priority Evaluation: A
PennDOT Public Transit Research and Demonstration
Project”. Presentation. January 13, 2002.
Toone, J. “Managing Benefits and Costs of Transit
Signal Priority””. Presentation to ITS America Transit
Signal Priority Workshop, Hartford, CT, July 2003.
Transport Canada. “Traffic Signal Priority and
Automatic Vehicle Tracking System (Phase II)”.
Transport Canada. 2004.
Vincent, Bill. “Bus Rapid Transit: The US
Experience”. Breakthrough Technologies Institute.
Washington, DC.
Werner, Jerry. “Houston Metro Plans to Deploy a
More Intelligent Transit Priority Scheme”.
Newsletter of the ITS Cooperative Deployment
Network. December 15, 2002. Available on the
Web: www.nawgits.com/icdn/ ivoms_tp.html
Yand, Mark. “Effective Transit Signal Priority”. White
Paper on Implementation of TSP in Pierce County,
Washington.
Supplier/Product Information
California Department of Transportation. “The
Advanced Transportation Controller Model 2070”.
Presentation and Student Guide. April 2002.
Econolite Control Products, Inc. ASC/2070
Controller – Product specification sheet. Available
on the Web: www.econolite.com
Fortran Transportation Systems. Literature and spec-
ifications for various traffic control products.
Available on the Web: www.fortrantraffic.com/ sys-
tems/systems.htm
Init Corporation. LISA product literature. Available
on the Web: www.initag.com/en_products/
m_lisa.php
McCain, Inc. Automatic Vehicle Identification for
Transit Signal Priority. Product specification sheet.
Available on the Web: www.mccaintraffic.com
McTrans. Product information for TSP7 software.
Available on the web: www.mctrans.ce.ufl.edu
Naztec, Inc. Corporate Literature. Available on the
Web: www.naztec.com
NEMA controller webpage. Available on the Web at:
www.nema.org/index_nema.cfm/685
PTV America (Bi-Tran software) Web page.
www.ptvamerica.com
Safetran Traffic Systems, Inc. Corporate literature.
Available on the Web: www.safetran-traffic.com
Siemens Energy and Automation, Inc. Intelligent
Transportation Systems Business Unit. “Overview
of NextPhase” Corporate Brochure.
Transcore. Amtech wireless RFID Communications
Technology. Product specification sheet. Available
on the Web: www.transcore.com/
technology/techapps.htm
U.S. Traffic Corporation. LoopComm Vehicle
Transmitter for Automatic Vehicle Identification (AVI).
Product specification sheet. Available on the Web:
www.idc-traffic.com/600a.htm
3M Traffic Management Solutions. Opticom GPS
Priority Control System. Product specification sheet.
Available on the Web: www.3m.com/itsPP
AARR
TTIIII
II
Transit Signal Priority Handbook Y 95

Appendices96 Y Transit Signal Priority Handbook
A1 Resources
A2 Glossary
A3 Case Study Details
A4 TSP Technology
Survey Forms

A1 RESOURCES
New material is constantly emerging in the rapidly
advancing field of ITS. TSP is no exception. To stay
current, one might want to check web sites that
might have updates and new information to offer.
ITS America maintains a Web site dedicated to
Transit Signal Priority:
http://www.itsa.org/tsp.html
TRIS OnLine is a comprehensive literature search
engine on transportation-related documents that is
maintained by the U.S. Department of
Transportation:
http://trisonline.bts.gov/search.cfm
The U.S. Department of Transportation also main-
tains a searchable Electronic Document Library for
many ITS-related reports it has sponsored:
http://www.its.dot.gov/itsweb/welcome.htm
Technical assistance may be found at Federal Transit
Administration’s Regional Offices:
http://www.fta.dot.gov/4978_ENG_HTML.htm for
contact information.
U.S. Department of Transportation’s ITS Professional
Capacity Building (PCB) Program provides informa-
tion on systems engineering courses designed for
professionals involved in the implementation of
advanced technologies for transportation:
http://www.pcb.its.dot.gov/brochures/ITS_SE.htm
The Transportation Research Board Committee
AHB25 “Traffic Signal Systems” maintains a search-
able Web site that includes several presentations on
transit signal priority:
http://signalsystems.tamu.edu/
The Transportation Research Board (TRB) maintains
a searchable list of publications:
http://gulliver.trb.org/publications/
The Transit Cooperative Research Program (TCRP)
of the Transportation Research Board maintains a
searchable list of publications:
http://www.tcrponline.org/bin/publications.pl
The National Center for Transit Research of the
Center for Urban Transportation Research at the
University of South Florida maintains a searchable
Web site:
http://www.nctr.usf.edu/
The Institute of Transportation Studies at UC
Berkeley maintains a searchable Web site:
http://www.its.berkeley.edu/
Transit Signal Priority Handbook Y 97
AAPP
PPEE
NNDD
IICCEE
SS
AppendicesAppendices

A2 GLOSSARY
APTA – America Public Transportation Association
ATC – Advanced Transportation Controllers – a type
of traffic signal controller
AVL – Automatic vehicle location often, but not
always, utilizing global positioning satellites (GPS)
BRT – Bus Rapid Transit — BRT combines the qual-
ity of rail transit and the flexibility of buses. It can
operate on exclusive transitways, HOV lanes,
expressways, or ordinary streets. A BRT system
combines intelligent transportation systems tech-
nology, priority for transit, cleaner and quieter vehi-
cles, rapid and convenient fare collection, and inte-
gration with land use policy.
http://www.nbrti.org
CUTA -- Canadian Urban Transit Association
DSRC -- Dedicated Short Range Communications
FHWA – Federal Highway Administration
FTA – Federal Transit Administration
GPS – global positioning satellites often used for
automatic vehicle location (AVL)
IR detectors – Infrared detectors
ISTEA – Intermodal Surface Transportation
Efficiency Act (of 1991)
ITS – Intelligent Transportation Systems – the inte-
grated application of advanced computer, electron-
ics, and communications technologies to increase
the safety and efficiency of surface transportation.
LRT – Light Rail Transit
MPO – Metropolitan Planning Organization – A
regional transportation planning body required by
Federal Law. US CODE, Title 49, Subtitle III,
Chapter 53, subsection 5303 states that MPOs are
designated under subsection (c), in cooperation
with the States and mass transportation operators,
for the purpose of developing transportation plans
and programs for urbanized areas of the State. The
plans provide for the development and integrated
management and operation of transportation sys-
tems and facilities (including pedestrian walkways
and bicycle transportation facilities) that will func-
tion as an intermodal transportation system for the
metropolitan area and as an integral part of an inter-
modal transportation system for the State and the
United States.
National ITS Architecture – provides a frame-
work for planning, defining, and integrating ITS.
http://itsarch.iteris.com/itsarch
NCHRP – National Cooperative Highway
Research Program
NEMA – National Electrical Manufacturers Association
NEMA controllers – a type of traffic signal controller
NTCIP – National Transportation Communications
for Intelligent Transportation Systems Protocol
http://www.standards.its.dot.gov/standards.htm
NTCIP Standard 1211, “Object Definitions for
Signal Control and Prioritization,” describes the
interfaces with the signal control system
http://www.standards.its.dot.gov/
standards.htm
PRG – Priority Request Generator
PRS – Priority Request Server
Regional ITS Architecture – Regional ITS archi-
tectures help guide the integration of ITS compo-
nents. During a regional architecture’s development,
agencies that own and operate transportation sys-
tems cooperatively consider current and future
needs to ensure that today’s processes and projects
are compatible with one another and with future ITS
projects. Federal rules and policy require develop-
ment of regional ITS architectures that conform with
the National ITS Architecture, to which subsequent
federally-funded ITS projects must adhere.
TCIP – Transit Communications Interface Profile
http://www.standards.its.dot.gov/standards.htm
http://www.ite.org/standards/tcip.asp
TCIP TWG 10 – Technical Working Group, within
the TCIP standards effort, concerned with transit
signal priority
http://www.standards.its.dot.gov/standards.htm
98 Y Transit Signal Priority Handbook
AAPP
PPEE
NNDD
IICCEE
SS

TEA-21 – Transportation Equity Act for the 21st
Century (of 1998)
TSP –Transit Signal Priority – an operational
strategy that facilitates the movement of in-service
transit vehicles through traffic-signal controlled
intersections.
Transit Signal Pre-emption – differs from
Transit Signal Priority, which modifies the normal
signal operation process to better accommodate
transit vehicles, while pre-emption interrupts the
normal process for special events (e.g., train
approaching a railroad grade crossing adjacent to a
signal, emergency vehicle responding to an emer-
gency call).
Type 2070 – a type of traffic signal controller
Type 170 – a type of traffic signal controller
U.S. DOT – United States Department of
Transportation
Transit Signal Priority Handbook Y 99
AAPP
PPEE
NNDD
IICCEE
SS

A3 CASE STUDY DETAILS
A3.1 AC Transit, Oakland, CA
A3.2 King County Metro, Seattle, WA
A3.3 MTA, Los Angeles, CA
A3.4 PACE, Chicago, IL - Cermak Road Corridor
A3.5 Pierce Transit, Tacoma, WA
A3.6 TransLink, Vancouver, BC
A3.7 TriMet, Portland, OR
A3.8 Virginia - Route 1
100 Y Transit Signal Priority Handbook
AAPP
PPEE
NNDD
IICCEE
SS
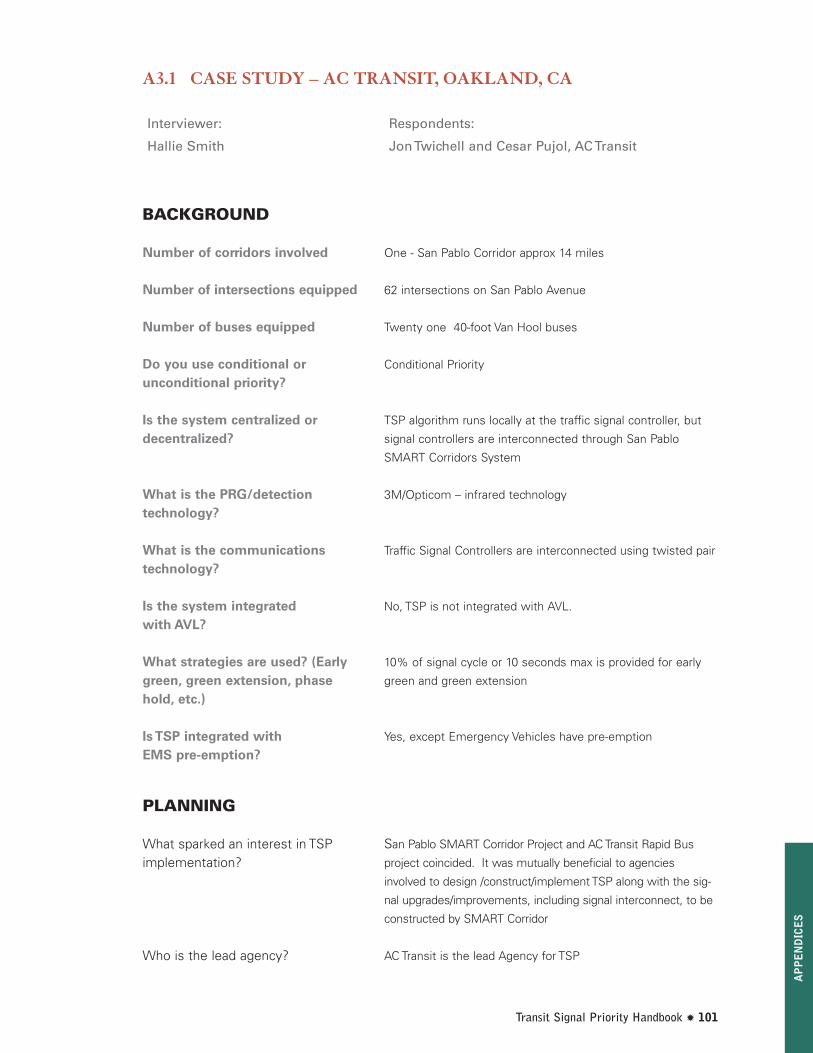
Respondents:
Jon Twichell and Cesar Pujol, AC Transit
One - San Pablo Corridor approx 14 miles
62 intersections on San Pablo Avenue
Twenty one 40-foot Van Hool buses
Conditional Priority
TSP algorithm runs locally at the traffic signal controller, but
signal controllers are interconnected through San Pablo
SMART Corridors System
3M/Opticom – infrared technology
Traffic Signal Controllers are interconnected using twisted pair
No, TSP is not integrated with AVL.
10% of signal cycle or 10 seconds max is provided for early
green and green extension
Yes, except Emergency Vehicles have pre-emption
San Pablo SMART Corridor Project and AC Transit Rapid Bus
project coincided. It was mutually beneficial to agencies
involved to design /construct/implement TSP along with the sig-
nal upgrades/improvements, including signal interconnect, to be
constructed by SMART Corridor
AC Transit is the lead Agency for TSP
Transit Signal Priority Handbook Y 101
Interviewer:
Hallie Smith
BACKGROUND
Number of corridors involved
Number of intersections equipped
Number of buses equipped
Do you use conditional or unconditional priority?
Is the system centralized ordecentralized?
What is the PRG/detectiontechnology?
What is the communicationstechnology?
Is the system integrated with AVL?
What strategies are used? (Earlygreen, green extension, phasehold, etc.)
Is TSP integrated with EMS pre-emption?
PLANNING
What sparked an interest in TSPimplementation?
Who is the lead agency?
A3.1 CASE STUDY – AC TRANSIT, OAKLAND, CA
AAPP
PPEE
NNDD
IICCEE
SS

Overall Rapid bus goal was to decrease bus travel time by
20% and increase ridership by 25% over the current limited
bus service. No stated goal for TSP
AC Transit; SMART Corridor partnership of 25 federal, regional,
and local agencies; SMART Corridor design and construction
was done by Alameda County Congestion Management
Agency (ACCMA)
State of readiness because SMART Corridor was imminent
Decided that all intersections on San Pablo will have TSP capa-
bility. Chose not to have TSP on Broadway because of heavy
bus usage.
3M/Opticom infrared emitter technology
Ability to partner with emergency services
No
Lack of feedback loop in software to evaluate TSP.
We are working to revise software to provide feedback
& evaluation
TSP is of low importance to some jurisdictions.
We are still working on it.
Training manuals were developed for both bus operators and
road supervisors. Emphasized to bus operators that they can-
not expect signals to turn green upon approach.
None
STIP
$25,000 cost to AC transit to purchase and install emitters.
Approximately $300,000 cost to ACCMA to purchase and
install TSP components
102 Y Transit Signal Priority Handbook
What were the stated goals?
Who are the players/partners?
How did you choose a corridor(s)?
How did you choose intersections?
What technology do you use?
How did you choose the technology?
Did you use any simulation ormodeling?
What were the technical obstacles?
How did you overcome them?
What were the institutional barriers?
How did you overcome them?
What is/was the training programfor bus operators?
What is/was the training programfor signal technicians?
FUNDING
How was the project funded?
What was the cost of projectimplementation?
AAPP
PPEE
NNDD
IICCEE
SS
A3.1 CASE STUDY – AC TRANSIT, OAKLAND, CA

AC Transit purchased and installed emitters for buses. CMA
did work required at intersections
170E
Equipment was calibrated for activation at correct distance
All Rapid buses are eligible for TSP at all intersections and TSP
may be used every ten minutes for each direction (north-
bound/southbound)
No
TSP works best when stops are far-side, so where possible,
stops were relocated to far-side. Only 2 of 39 stops at TSP
locations could not be relocated to far-side of intersection.
Another stop did not need to be relocated because bus made
a right turn at that intersection.
Updating and interconnect of signal improvement was includ-
ed in SMART Corridor. All intersections now have side street
detector loops and pedestrian push buttons
ACCMA paid for traffic signal equipment installation and
upgrades. AC Transit paid for signal timing work
AC Transit is working to set up a maintenance program and also a
feedback loop in the software for monitoring and data collection
AC Transit maintenance has constructed portable testing unit to
test all emitter equipped vehicles on a monthly basis. Each
emitter is tested to ensure intensity is equal to prior month level
Yes through efforts of AC Transit Marketing Department and
ACCMA
Mailers, Spots on cable TV, Door hangers, Incentive Items
such as free ride tickets, movie theater advertising
No data currently collected. AC Transit is working on software
feedback upgrade for data collection and monitoring
Transit Signal Priority Handbook Y 103
IMPLEMENTATION
How were tasks assigned forimplementation?
What kinds of controllers arepresent or did you upgrade to?
Was there a test phase?
Under what circumstance(s) isTSP used? (For late buses, allbuses, express buses, etc.)
Are bus turning-movements con-sidered/impacted?
What is the policy concerningnear side and far side stops?
To what extent was updating,installing and/or replacing signalequipment required?
Who paid for controller equip-ment installation and upgrades?
How do you ensure that TSP isworking on the equipment at theintersection?
How do you ensure that TSP isworking on the vehicles?
Was the project publicized?
If so, how?
What data do you collect?
AAPP
PPEE
NNDD
IICCEE
SS
A3.1 CASE STUDY – AC TRANSIT, OAKLAND, CA

104 Y Transit Signal Priority Handbook
This question should be addressed by the planned software
upgrade and also an annual maintenance agreement with the
ACCMA. This agreement is not in place yet and maintenance
costs are not known.
We are attempting to develop software feedback loop which
to get an accurate picture of TSP granted for each bus trip
rather than extrapolation
Extrapolation of data from 8 Caltrans intersections indicates
approximately 9% time savings
Various groups ranging from drivers to AC Transit board mem-
bers are unsure whether system is working properly.
Working on putting together a software feedback and evalua-
tion program
Infinitesimal
None; TSP should be transparent to users.
They have raised questions whether system is working or not.
This is an area that needs improvement
Adequate software design
Lack of information feedback from system
Standardization of equipment. Simplicity of TSP objectives.
Consensus on software objectives
MAINTENANCE
What are your maintenanceagreements?
EVALUATION
What Measures of Effectivenessdo you use?
What are the benefits?
What complaints have youreceived?
How have you responded to complaints?
What is the impact to non-prioritystreet traffic?
What has been the overall publicreaction/response?
How have your bus operators (orunion) responded?
How do you maintain on-goingcommunication among partners?
LESSONS LEARNED and KEYSTO SUCCESS
What were the greatest obstaclesoverall?
Deployment or installation problems?
What do you feel were the keysto success?AA
PPPP
EENN
DDIICC
EESS
A3.1 CASE STUDY – AC TRANSIT, OAKLAND, CA

Transit Signal Priority Handbook Y 105
How long did the various phasestake: planning? procurement?deployment?
If you were starting from scratch,what technology would use youand why?
If you were starting from scratch, what would be yourplanning strategy?
What are your future plans forTSP implementation?
What are your expectations with respect to NTCIP/TCIP TSP standards?
18 months for total implementation
We would use the same technology which allows us to part-
ner with emergency services and for standardization.
“Just Do It”
International Ave and Telegraph Blvd – approximately 18 miles
total and 104 total signals. AC Transit retrofit of TSP on San
Pablo Rapid has 3 goals. Bus equipment maintenance pro-
gram which is completed. Intersection equipment mainte-
nance program continues to suffer from lack of attention.
Software upgrade for feedback loop is incomplete due to low
level of attention from Caltrans.
Our expectation are standards adopted will not interfere with
our TSP implementations
AAPP
PPEE
NNDD
IICCEE
SS
A3.1 CASE STUDY – AC TRANSIT, OAKLAND, CA

106 Y Transit Signal Priority Handbook
A3.2 CASE STUDY – KING COUNTY METRO, SEATTLE, WA
Interviewers:
Brendon Hemily & Hallie Smith
BACKGROUND
Number of corridors involved
Number of intersections equipped
Number of buses equipped
Do you use conditional or uncon-ditional priority?
Is the system centralized ordecentralized?
What is the PRG/detection technology?
What is the communicationstechnology?
Is the system integrated with AVL?
Respondents:
Ron Atherley and John Toone, King County Metro
TSP has been deployed along three corridors: 99/Aurora,
Rainier Ave. and 1st Ave. So., and at one interstate exit ramp
28 intersections have been equipped: 17 coordinated intersec-
tions along Aurora/99, five intersections along Rainier Ave., five
on First Ave. So. and one at the So. 272nd exit ramp of I-5.
1,400 buses
The TSP system does not request priority based on schedule
adherence conditionality but there are many traffic-related
conditions: phase state, emergency preempt, route/trip and
call frequency. Future technology will request priority based
on conditions such as lateness and/or ridership.
The traffic control system is distributed, with the exception of
the City of Belleview that has a centralized (Computran) UTCS.
Passive RF tags on buses are detected by wayside readers
with RF antennas that are located 500 to 1,000 feet upstream,
and then communicate to the intersection Transit Priority
Request Generator (TPRG) / Interface unit. The TPRG /
Interface Unit is located in the controller cabinet, and gener-
ates priority requests to the controller for eligible buses
(based on eligibility table).
The wayside antenna Reader receives the RF signal from the
bus tag, and communicates to the TPRG using one of several
available communications protocols: RS232, RS485,
LonWorks, AT Modem and serial attached devices such as
fiber optics and spread spectrum transcievers.
The current TSP is not integrated with Metro’s AVL system.
However, in the future, TSP will be integrated with the On-
Board Systems (OBS) currently being procured. It is planned
that detection will use WiFi to replace the current passive RF
tags and readers.
AAPP
PPEE
NNDD
IICCEE
SS

The system is designed to provide green extension and red
truncation, without shortening any minimum clearance inter-
vals, skipping phases, or breaking coordination. Phase insertion
also exists at four queue jumps using loop and/or video for
detection, and for a left turn into an off-street Transit Center.
There is EMS pre-emption in some corridors, but there is
no integration.
King County metro (KC Metro) has a “Transit Speed &
Reliability Program” that is designed to make capital improve-
ments to improve transit performance. Improvements
include: redesign of bus zones, bus bulbs, roadway improve-
ments, parking removal, queue jumps, TSP, etc. An early
demonstration was initiated in 1991. This was followed by the
creation of a Regional Oversight Committee (ROC) to assist
Metro in developing consensus on system specifications and
in evaluating proposals.
KC Metro
The goals for the TSP program are:
Y Increase amount of “green time” at intersections for
selected bus trips
Y Decrease average travel time
Y Decrease variation in travel time
Y Reduce signal-related delay, and
Y Minimize impact on general traffic.
The ROC included representatives from KC Metro, KC Dept.
of Transportation, Community Transit, Pierce Transit,
Washington DOT, Snohomish County, and seven cities. Pierce
Transit subsequently decided to pursue an independent
approach, and resigned from the ROC.
The two corridors were identified by the Transit Speed &
Reliability Program.
Transit Signal Priority Handbook Y 107
What strategies are used? (Earlygreen, green extension, phasehold, etc.)
Is TSP integrated with EMS pre-emption?
PLANNING
What sparked an interest in
TSP implementation?
Who is the lead agency?
What were the stated goals?
Who are the players/partners?
How did you choose a corridor(s)?
AAPP
PPEE
NNDD
IICCEE
SS
A3.2 CASE STUDY – KING COUNTY METRO, SEATTLE, WA

Given the high cost of the RF tag readers, intersections had to
be chosen carefully. Selection of the initial intersections for
implementation was based on a forecast of potential average bus
time savings. Subsequently, a Transit Signal Priority Interactive
Model (TIM) was designed to assist in the planning phase of
developing a potential TSP deployment at an intersection or tran-
sit corridor. The user inputs cost assumptions, signal phase
splits and TSP setting. The primary product of this model is the
expected benefit of one trip. Using the expected benefit, the
model reports derived information including daily and annual ben-
efit, and a benefit-cost analysis.
Buses are equipped with programmable passive Amtech (now
TransCore) RF tags that are detected by antennas at wayside
readers. The project also involved the development of a custom
TPRG based on the ROC’s specifications.
The ROC’s specification development and RFP evaluation
processes emphasized the importance of open, non-proprietary
systems that were reliable (99% reliability) and easy to maintain.
VISSIM was explored during pre-analysis phase, but tools were
not sufficiently sophisticated in 1992. VISSIM is currently being
used to model impacts related to changes in tunnel operations.
The cost of the RF Tag readers prevented having a check-out
reader.
A check-out module was developed that uses a logic-based
approach building on phase monitoring and learning from arrival
patterns over time.
The TSP project was planned based on the concept of regional
cooperation through the ROC, but the number of jurisdictions
involved and the complexity of the TPRG development effort
caused delay in the project.
Ongoing communications through the ROC was critical.
No driver action is required, all on-board equipment in configured
during normal driver log-in operation.
When working with a jurisdiction for the first time, Metro funds a
test-bench and training by the equipment manufacturer in the juris-
diction’s signal shop. Refresher training is available as needed.
108 Y Transit Signal Priority Handbook
How did you choose intersections?
What technology do you use?
How did you choose the technology?
Did you use any simulation or modeling?
What were the technical obstacles?
How did you overcome them?
What were the institutional barriers?
How did you overcome them?
What is/was the training programfor bus operators?
What is/was the training programfor signal technicians?
AAPP
PPEE
NNDD
IICCEE
SS
A3.2 CASE STUDY – KING COUNTY METRO, SEATTLE, WA

The project was funded through normal capital funding.
The first phase cost $2.5 million, and included acquisition of
the readers and tags, development and acquisition of the
TPRG, 1software, and installation. A second phase of
$155,000 was initiated to replace the LONworks communica-
tions card with a more robust and less expensive RS485 card,
and upgrade or enhance various components and wiring.
Bus RF tags cost $600 per bus (installed) The TPRG costs
roughly $3,000. RF tag readers cost $8,000 to 9,000, and
$15,000 after installation. A typical intersection installation
requires two readers plus TPRG, and costs $35,000 (installed).
KC Metro was responsible for installation of bus and way-
side equipment. In terms of TSP settings, KC Metro recom-
mends TSP settings, but the city traffic engineer decides what
settings to implement, and is responsible for their implemen-
tation. KC Metro controls the vehicle eligibility table which
determines eligible routes, directions, potentially down to the
trip level.
Four traffic controllers were involved: Peek LMD 9200,
Econolite ASC-II, Eagle EPAC 300, and 2070 running
nextPhase software.
A Rainier HOV study in 1991 included a demonstration of TSP.
The contract with the TSP supplier, McCain Traffic Supply,
included a Phase 1 test phase to confirm the system’s ability
to meet the 99% reliability requirement.
Yes, the approach and trip information are used in processing
priority requests. Different outputs can be made to the con-
troller to request priority for a specific phase based on the
scheduled movement of the detected bus. There is one loca-
tion with an inserted left turn phase into a Transit Center that
is triggered with a loop.
There is no formal policy to have far side stops, but some
stops have relocated to make them work better.
Transit Signal Priority Handbook Y 109
FUNDING
How was the project funded?
What was the cost of projectimplementation?
What is the breakdown in costs?
IMPLEMENTATION
How were tasks assigned forimplementation?
What kinds of controllers?
Was there a test phase?
Are bus turning movements con-sidered/impacted?
What is the policy concerningnear side and far side stops?
AAPP
PPEE
NNDD
IICCEE
SS
A3.2 CASE STUDY – KING COUNTY METRO, SEATTLE, WA

The ROC developed a specification for TSP desirable features
for controllers, and staff worked with manufacturers of the four
above controllers to develop firmware enhancements to enable
TSP features and to smooth transitions.
A fifth type of controller, the Traconex is used in some suburban
jurisdictions but does not meet the TSP requirements (e,g,
insufficient memory); it will need to be replaced along corridors
where TSP is planned.
More generally, the adopted approach focused on developing a
flexible TPRG unit that could interface with a wide variety of
controllers. Although this required a lengthy development and
testing effort, the end result is a highly flexible unit that can be
used in all the different jurisdictions.
KC Metro is responsible for purchasing and installing the TPRG.
Individual jurisdictions are responsible for purchasing controllers
if they need to be replaced
The TPRG generates data on its performance, but it is hard to
correlate this with controller action.
RF tags are not tested, but some information can be gathered
from periodic logs.
The TPRG logs RF tag ID and priority requests made.
Travel time and variability studies, before/after studies, tag func-
tion check, equipment function check, communications function
check.
Individual Operations and Maintenance (O&M) Agreements are
in place with the City of Seattle and City of Shoreline, and
agreements in principles have been developed with the other
jurisdictions for future deployments.
King County has adopted the position that once the TPRG
equipment is installed, it becomes the property of the city, and
110 Y Transit Signal Priority Handbook
To what extent was updating,installing and/or replacing signalequipment required?
Who paid for controller equip-ment installation and upgrades?
How do you ensure that TSP isworking on the equipment at theintersection?
How do you ensure that TSP isworking on the vehicles?
What data do you collect?
How is the data used?
MAINTENANCE
What are your maintenanceagreements?
AAPP
PPEE
NNDD
IICCEE
SS
A3.2 CASE STUDY – KING COUNTY METRO, SEATTLE, WA
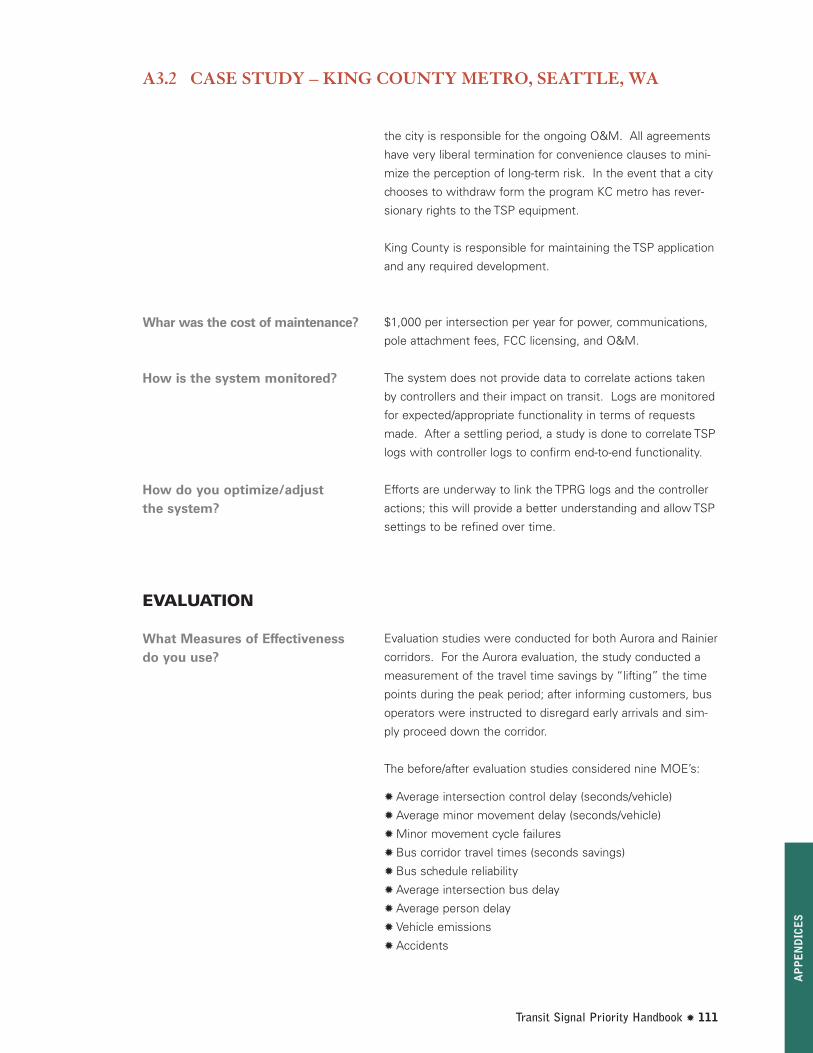
the city is responsible for the ongoing O&M. All agreements
have very liberal termination for convenience clauses to mini-
mize the perception of long-term risk. In the event that a city
chooses to withdraw form the program KC metro has rever-
sionary rights to the TSP equipment.
King County is responsible for maintaining the TSP application
and any required development.
$1,000 per intersection per year for power, communications,
pole attachment fees, FCC licensing, and O&M.
The system does not provide data to correlate actions taken
by controllers and their impact on transit. Logs are monitored
for expected/appropriate functionality in terms of requests
made. After a settling period, a study is done to correlate TSP
logs with controller logs to confirm end-to-end functionality.
Efforts are underway to link the TPRG logs and the controller
actions; this will provide a better understanding and allow TSP
settings to be refined over time.
Evaluation studies were conducted for both Aurora and Rainier
corridors. For the Aurora evaluation, the study conducted a
measurement of the travel time savings by “lifting” the time
points during the peak period; after informing customers, bus
operators were instructed to disregard early arrivals and sim-
ply proceed down the corridor.
The before/after evaluation studies considered nine MOE’s:
Y Average intersection control delay (seconds/vehicle)
Y Average minor movement delay (seconds/vehicle)
Y Minor movement cycle failures
Y Bus corridor travel times (seconds savings)
Y Bus schedule reliability
Y Average intersection bus delay
Y Average person delay
Y Vehicle emissions
Y Accidents
Transit Signal Priority Handbook Y 111
Whar was the cost of maintenance?
How is the system monitored?
How do you optimize/adjust the system?
EVALUATION
What Measures of Effectivenessdo you use?
AAPP
PPEE
NNDD
IICCEE
SS
A3.2 CASE STUDY – KING COUNTY METRO, SEATTLE, WA

Key benefits identified from the two studies were:
Y 25-34% reduction of average intersection delay for eligible buses
Y 14-24% reduction of stops at intersections
Y 35-40% reduction in trip travel time variability
Y 5.5-8% reduction in travel time along the corridors during peak hour
There have been no complaints regarding normal operations.
Side street delay was minimal.
The system is transparent to bus operators.
Developing specifications and operations acceptable to the over 20 dif-
ferent stakeholder jurisdictions in the region.
The RF reader technology requires installation upstream on a utility
pole with access to power. Finding a suitable location, obtaining
approvals, and installing is sometimes difficult and can be a lengthy
process.
Maintaining ongoing communications through the ROC was critical to
the project’s success.
System development took several years. For an individual corridor plan-
ning and design takes the bulk of the project cycle when working with
a new jurisdiction due to the need for agreements and these are usual-
ly tied to larger projects and grants. Planning, design and procurement
typically take up to one year, and deployment takes an additional 2-3
months. Follow-up studies and close out typically takes another 2-3
months.
At the time, the RF tag technology was the best available to meet iden-
tified requirements, but entails several limitations. The readers are
expensive to purchase, and to install, limiting cost-effective locations.
The readers require location on a utility pole and power hook-up, entail-
ing agreements and ongoing fees. The RF tags require FCC licenses.
For these various reasons, a wi-fi technology solution is being pursued
for the future.
112 Y Transit Signal Priority Handbook
What are the benefits?
What complaints have youreceived?
What is the impact to side streettraffic?
How have your bus operators (orunion) responded?
LESSONS LEARNED andKEYS TO SUCCESS
What were the greatestobstacles overall?
Deployment or installationproblems?
What do you feel were the keysto success?
How long did the various phasestake: planning? procurement?deployment?
If you were starting from scratch,what technology would use youand why?
AAPP
PPEE
NNDD
IICCEE
SS
A3.2 CASE STUDY – KING COUNTY METRO, SEATTLE, WA

The project focused on the development of the TPRG unit
separately from any required upgrading of the controllers. It
would probably be preferable to develop an integrated
approach addressing both TSP PRG unit and controllers at the
same time, and through an integrated procurement process.
Another 40 intersections are being equipped or planned using
the current technology.
A project is being undertaken to capture data directly from
controllers, but will only work with some controllers.
In the longer term, a new technological concept is being
planned that is based on Wi-Fi communications for detection,
instead of the current RF tags; this concept is being integrat-
ed into the current On-Board Systems procurement.
In addition, efforts are underway to explore ways to improve
the interconnect between the TPRGs at each intersection,
possibly through the implementation of a high-bandwith com-
munications network.
It is possible to do signal priority without standards but broad
standards will be helpful for Seattle to achieve consensus
among the over 20 traffic jurisdictions in the Region.
In the longer term, National standards will encourage vendors
to develop and provide products with TSP capabilities, thereby
providing more flexibility to local jurisdictions purchasing signal
control equipment. It should also lead to the development of
more standardized data collection and consistent data sets.
Transit Signal Priority Handbook Y 113
If you were starting from scratch,what would be your planningstrategy?
What are your future plans forTSP implementation?
What are their expectation withrespect to NTCIP/TCIP TSP stan-dards?
AAPP
PPEE
NNDD
IICCEE
SS
A3.2 CASE STUDY – KING COUNTY METRO, SEATTLE, WA

Respondents:
Sean Skehan, Los Angeles Department ofTransportation, and Rex Gephart, Los AngelesCounty Metropolitan Transportation Authority
BACKGROUND
9 corridors have been equipped — 19 others are planned
654
283 are equipped with transponders for TSP use on BRT corri-
dors. Other buses are equipped with transponders for monitor-
ing purposes.
Yes, based on headway management. The traffic control sys-
tem tracks the location of buses (each with unique ID) along
the BRT corridors and compares passage times to the defined
table of headways for that road segment which resides in traf-
fic servers. Priority is only granted to buses whose headway
since the previous bus is equal or greater than the defined
headway. MTA sends the headway file every six months to
LADOT. The headway management system also drives the
announcements and arrival signs for stops: central server com-
municates by CDPD to next arrival signs. This is being changed
now to hard wiring because CDPD is becoming less reliable.
Communications will be hard wired to hub and then on a twist-
ed pair wire to sign.
Centralized. The controller communicates to the central system
when bus is approaching. And the central system initiates all
phase changes. The local controller can only time phases and
can be used for backup.
New bus detector loops plus transponders on bus (only metro
Rapid buses receive priority; local buses in corridor do not).
Bus loops have to be very wide to cover all lanes, all the way
from curb to curb. All the loops are about 4 inches deep.
LADOT has over 1000 bus loops – average 1.5 loops/ intersec-
tion: small intersections have one loop, large intersections have
two loops, and route turning and stations have two loops.
Regular loops are also located on all parts of major intersec-
tions to measure traffic on all sides on those intersections.
114 Y Transit Signal Priority Handbook
A3.3 CASE STUDY – MTA, LOS ANGELES, CA
Interviewers:
Brendon Hemily Hallie Smith
BACKGROUND
Number of corridors involved
Number of intersections equipped
Number of buses equipped
Do you impose a conditionstating that only late busesreceive signal priority?
Is the system centralized or distributed?
What is the PRG/detectiontechnology?
AAPP
PPEE
NNDD
IICCEE
SS

Twisted pair wire from local to hub, and then fiber to central.
All local connections are on twisted pair.
The system is not integrated with a system-wide bus AVL system.
Early green, green extension and phase hold. Most cycles are
90 seconds but range 60 – 120 seconds. Generally, try to
give 10% of cycle for TSP – 6-15 seconds. Do not shorten
“don’t walk” phase.
Extension is more effective than early green because save
entire red time Turning buses are detected from the previous
intersection so they have time to check in for the left turn
pocket. Queue jumps are not used; most stops are far side
so queue jumps not needed and the California code doesn’t
really allow it. LADOT sets the number of cycles it is locked
out; priority locked out for next cycle unless it’s a major inter-
section – at major intersections have lock out for two cycles.
EMS pre-emption is provided at some locations: some of the
loops recognize fire trucks and some fire trucks have
transponders. The fire department is experimenting with
transponders on 44 trucks to see how it works. At EMS-
equipped intersections they receive high priority
Reducing delay to buses at traffic signals: a study in 1995
found that about 24% of delay was caused by red lights.
LADOT-MTA joint leadership
To reduce bus travel times (20-25%). Interviewed 2000 riders
and found out that number one issue was travel time for all
bus service in LA area. This triggered the whole program – In
1998, the Westside Bus Restructuring Program determined
that speeds had declined by 12% since the mid-1980’s, cost-
ing 200-250 buses; 50% of delay was dwell time. The Mayor
had been to Curitiba and instructed MTA and LADOT to work
together. LADOT then decided to move people not vehicles
which was a major policy decision. TSP accounts for about
1/3 of the travel time savings. Based on the time savings and
ridership gains, have returned to the board to ask for permis-
sion to expand application to a total of 28 corridors.
Transit Signal Priority Handbook Y 115
What is the communicationstechnology?
Is the system integrated with AVL?
What strategies are used? (Earlygreen, green extension, phasehold, etc.)
Is TSP integrated with
EMS pre-emption?
PLANNING
What sparked an interest in TSPimplementation?
Who is the lead agency?
What were the stated goals?
AAPP
PPEE
NNDD
IICCEE
SS
A3.3 CASE STUDY – MTA, LOS ANGELES, CA

LADOT and MTA
Determined by MTA with input from LADOT. Criteria for the selec-
tion of TSP corridors includes: transit use, transit potential based
on census data, and transit dependence. LADOT decided the
order in which the BRT and TSP corridors could be built and how
fast they could be deployed. LADOT suggests some things based
on traffic volumes, but MTA decides which routes to work on.
All intersections along corridor.
Loops.
Based on an evaluation of alternatives. From 1995 to 1999 evalu-
ated four strategies – toll tags, RF, loops, optical strobe – toll tag
uses a reader located on poles reader rather than loops. GPS was
not evaluated because of accuracy and canyon issues. The evalua-
tion found that loops were the cheapest and easiest.
No. The control system is based on real-time adaptive control
with real-time split adjustment. (The software will be made avail-
able through McTrans)
Rapid deployment using new controllers and involving writing new
software. The UTCS had been modified back in 1990 for light rail
(which gets priority regardless of whether late or not), but soft-
ware had to be modified for ATCS.
In addition, the control software upgrade was going to require
installing 2070 controllers, but the TSP project may have accelerat-
ed deploying the 2070’s to replace the 170’s which didn’t have
enough computing power.
Dedicated resources and staff commitments
Institutional barriers were minimized because LADOT instigated
the project.
116 Y Transit Signal Priority Handbook
Who are the players/partners?
How did you choose a corridor(s)?
How did you choose intersections?
What technology do you use?
How did you choose the technology?
Did you use any simulation ormodeling?
What were the technical obstacles?
How did you overcome them?
What were the institutional barriers?
AAPP
PPEE
NNDD
IICCEE
SS
A3.3 CASE STUDY – MTA, LOS ANGELES, CA

There was good cooperation which worked well, but there
was a short time-frame so that the opening of first 2 BRT
lines (Wilshire and Ventura) would coincide with the red line
rail extension. LADOT did all the work in house to speed up
the program; by keeping all control internal they were able to
move very quickly. The same approach was used for the
next 2 corridors (Broadway and Vermont). After that, money
became an issue and they have had to outsource construc-
tion and installation, and contract construction has been a
problem.
When design was done in-house, everything was fine.
However, awarding contracts is a long and difficult process.
In future, they may be able to figure out how to do a
design-build contract – this involves preparing detailed
plans for each intersection including loop placement, bus
stop location (and foundation changes if required), and sig-
nal timing.
Driver training was needed for the BRT operation because
they have fewer stops and want them in the run lane rather
than the curb lane.
Training class to explain the new 2070 controller and detec-
tor operation. It is important that they understand new
controller card and get wires set up properly. There is
always new training when there is new equipment, this is
nothing new.
First 2 demo lines were paid from the MTA capital budget –
BRT costs about $200,000/mile without vehicles. Next 7
lines were funded 50-50 from local funding and CMAC fund-
ing. Will use federal funding (e.g. CMAC) for expansion. By
comparison:
Light rail costs – $30-$40 M/mileHeavy rail costs — $200 - $300 M/mileOrange line (BRT bus-only corridor) costs — $20M/mile
It is cost-neutral from the operating perspective (nonew buses and no new people). MTA can actually putmore miles on buses because they are moving faster.
Budget for the 9 lines that have been completed was prob-
ably over $10 M for design and signal work –software con-
trollers, transponders, design and construction. The budget
for the next 17 lines is $ 23.5 M.
Transit Signal Priority Handbook Y 117
How did you overcome them?
What is/was the training programfor bus operators?
What is/was the training programfor signal technicians?
FUNDING
How was the project funded?
What was the cost of projectimplementation?
AAPP
PPEE
NNDD
IICCEE
SS
A3.3 CASE STUDY – MTA, LOS ANGELES, CA

Software was largest expense in the beginning, then transpon-
ders and cabinets. Controllers are $3,000 each. TSP costs about
$30,000/intersection, including everything except transponders.
Transponders are about $100/bus and are purchased separately.
Loop crew install loops, and controller staff upgraded controllers.
The software is in-house; five servers run all nine lines. Each
crew is assigned their own specialty; most of the issues were
because of having to hurry so much. Contractors are now doing
construction work because LADOT has lost so much staff in the
cut-backs.
2070 – Eagle was low bid. This could change every 5 years when
re-tendered; any vendor will work.
Yes, in 1999-2000
Priority is granted to all buses that are not early (based on head-
way comparison) with resolution to nearest minute –— 1/10 of
minutes late gets no priority; all the rest get priority. The calcula-
tion is made every 6 seconds.
Yes – they put in a phase if it is needed for left turn. LADOT does
not provide priority to buses not in revenue service, although MTA
wants it when they deadhead to get back in service.
Design is far side, near-side used only when far side is not available
(curb-cuts or parking limitations) or at rail transfer stations.
All controllers were upgraded to 2070. LADOT codes transpon-
ders and then sends to MTA who install.
MTA
Continuous monitoring through the central systems at LADOT and
MTA; this is a great advantage of a centralized system. Has yel-
low/red warning indicators if twisted pair or loop is damaged (e.g.
result of contractor digging in street). LADOT sees problem imme-
diately and can determine exact time of failure. In case of red indi-
cator, they dispatch someone immediately.
118 Y Transit Signal Priority Handbook
What is the breakdown in costs?
IMPLEMENTATION
How were tasks assigned forimplementation?
What kinds of controllers?
Was there a test phase?
Under what circumstance(s) isTSP used? (For late buses, allbuses, express buses, etc.)
Are bus turning movements con-sidered/impacted?
What is the policy concerningnear side and far side stops?
To what extent was updating,installing and/or replacing signalequipment required?
Who paid for controller equip-ment installation and upgrades?
How do you ensure that TSP isworking on the equipment atthe intersection?
AAPP
PPEE
NNDD
IICCEE
SS
A3.3 CASE STUDY – MTA, LOS ANGELES, CA

MTA Dispatcher is also watching board and should be calling
driver to see what’s wrong.
Periodic reporting of vehicle trips identifies malfunctioning
equipment
Yes
Metro rapid was publicized through media events (print, radio,
television), but there was also an article specifically on TSP –
“magic transponder”. MTA media relations takes care of all of
this.
Bus detections by loop and bus ID
Bus detections over specific loops are used in post process-
ing to measure travel times between loops, headways, etc.
They have also done tests by turning off bus ID’s and calculat-
ing time savings. Archived data allows them to evaluate from
history. Traffic control system log tracks whether priority was
requested and whether it was granted or not – every event is
recorded – They know when priority started, how long it was
granted, what type of priority, how long the “lockout” lasted,
and how long it took to recover. Detector failures are also
monitored by the central traffic system.
There aren’t any. The city maintains all traffic equipment and
MTA maintains all bus equipment. LADOT pays for the loop
maintenance. City also maintains and operates all signals on
state routes that run through the city. Failures are not com-
mon, but damage can happen with power failure or broken
box – only the loop, cable to controller, and card in controller
are TSP-specific.
Through central system at LADOT and MTA Also do monthly
queries of individual buses to see how often it has run and
whether it hasn’t shown up. There are usually five that have
been in accidents – but can check transponder, MTA has had
to replace about 10% of transponders.
Transit Signal Priority Handbook Y 119
How do you ensure that TSP isworking on the vehicles?
Was the project publicized?
Is so, how?
What data do you collect?
How is the data used?
MAINTENANCE
What are your maintenanceagreements?
How is the system monitored?
AAPP
PPEE
NNDD
IICCEE
SS
A3.3 CASE STUDY – MTA, LOS ANGELES, CA

A periodic review of travel time performance is conducted but sys-
tem is pretty self-regulating. However, if a bus stop is moved or a
new signal is introduced on route, they may have to go into route
table and insert new loop – giving 10% if needed. They can’t opti-
mize any more than that; they might check basic timing and re-do,
but would do that any way.
Reduced travel time, and increased delay to motorists
19 to 25% reduction in travel times. 1/3 of savings is due to TSP,
and 2/3 of time savings is due to headway based service fewer
stops, and shorter dwell times. Ridership Metro Rapid lines
increased 4% - 40% depending on the line. One third are new rid-
ers to transit. Businesses also like the buses moving faster and
like the arrival information because that allows the people to see
when bus will arrive and go shop until it arrives.
Almost none. Only 10% green advantage is given, and nothing is
very visible; motorists don’t really notice the difference. When
TSP was a bit too aggressive at the east end of the Ventura line,
they had a bit of a problem, so they just backed off a bit on the
time. All telephone calls go to the district office, but if they relate
to signal timing, it goes to 3rd floor. If TSP-related, complaint it
goes to Sean Skehan. He may also get a call directly from district
office asking if there’s a problem, and will then look into it.
Reduced parking spots because of the Metro Rapid program has
also been a concern.
Explain system operation
Typically 1 sec delay per vehicle per cycle
Positive
System is transparent to bus operators.
Regular meeting between LADOT and MTA, and telephone calls
between staff – Rex and Sean work together well and chat several
times a week.
120 Y Transit Signal Priority Handbook
How do you optimize/adjustthe system?
EVALUATION
What Measures of Effectivenessdo you use?
What are the benefits?
What complaints have youreceived?
How have you responded tocomplaints?
What is the impact to side streettraffic?
What has been the overall publicreaction/response?
How have your bus operators (orunion) responded?
How do you maintain on-goingcommunication among partners?
AAPP
PPEE
NNDD
IICCEE
SS
A3.3 CASE STUDY – MTA, LOS ANGELES, CA

Rapid deployment of new technology and bureaucratic limita-
tions to implementation (contracting requirements). For the
entire planned TSP system, 86 cities are involved and will
require getting agreements with all these cities to install and
implement this equipment. Engineers believe they don’t have
a second to give away from their signals, so this required
demonstrating that it works. It is now easier with the demos
that showed that it works and it doesn’t degrade their system.
No technical problems, only bureaucratic (e.g. contracting
process). Within MTA, scheduling for Metro Rapid is now
headway-based rather than schedule-based, and schedules are
prepared by operations staff, not planning. It has been a chal-
lenge to affect this change in approach, but it is improving
with increased internal dialogue over time.
Extensive technology evaluation and selection of a reliable
technology and continuous and ongoing monitoring of per-
formance. The system has to be reliable and fault tolerant, so
this is very important. For example, the system is designed
so that if a loop or section is lost, it has no impact. Someone
needs to take the lead with strong political push.
Demonstration was valuable in convincing
reluctant partners.
“Dare to be Simple”: It is important to keep BRT simple (i.e.
no dedicated lanes nor prepaid fares), and politically and envi-
ronmentally sensitive. The objective was just to improve bus
service; BRT doesn’t have to have all 13 BRT-defined attrib-
utes.
Loops, because ease of installation and reliability is high; they
have had such good results from the loops.
Transit Signal Priority Handbook Y 121
LESSONS LEARNED andKEYS TO SUCCESS
What were the greatest obsta-cles overall?
Deployment or installation problems?
What do you feel were the keysto success?
If you were starting from scratch,what technology would use youand why?
AAPP
PPEE
NNDD
IICCEE
SS
A3.3 CASE STUDY – MTA, LOS ANGELES, CA

Having a time deadline and going fast was a help, but other juris-
dictions may need more help. The expansion network is difficult,
with all the phases hard to do; it might have been preferable to
put up all the lines in LA first, and then expand to the cities that
are harder to convince. 80% should have had TSP on opening
day so that you have real speed improvement: do the lines that
have highest savings first and then take the harder ones next.
Continue deployment on selected corridors Will have 1,013 sig-
nals based on current corridor designs – 27 corridors altogether –
by year 2008. Partners for full expansion include MTA, LADOT
and 35 cities and 11 counties. Beverly Hills is adopting the
LADOT system, but the smaller cities don’t have staff, and it has
been difficult getting them to agree to TSP. The county-wide Bus
Signal Priority (BSP) is being set up for the other cities in the
region. MTA offered to provide 2070 controllers but the cities
didn’t want to maintain them, so a separate system had to be
designed. It uses GPS and wireless LAN with a processor on
each bus. This priority does not depend on bus schedule adher-
ence or headway, but will allow controller to recover. The wire-
less LAN communicates with one signal at a time. They have to
put both TSP systems on the buses that operate in several juris-
dictions. The Crenshaw line is the first to use this new system
and was tested for 6 moths starting February 2004.
Training operations to dispatch the buses with both systems is the
hardest part; five Metro rapid lines operate outside the city of LA.
Metro Orange Line will have a BRT dedicated lane on old track
bed; the buses will be granted priority in a block of time not just
because they are eligible. However the system will not do red
truncation. The Orange Line still uses loops and transponders.
Yes. It was a big deal when ITS architecture first came out.County was supposed to take the lead, but not much has hap-pened. The system predated every concept of architecture anduses a communication protocol that could be used on solid state; itis very efficient but not compliant with standards being developed.There isn’t any way to change that – grandfathered in old protocol.They are still using old protocol to include everything in network –Would follow architecture if could but can’t change now –
None. They wish they could, but the system is too far along.
122 Y Transit Signal Priority Handbook
If you were starting fromscratch, what would be yourplanning strategy?
What are your future plans forTSP implementation?
Does the project comply with aRegional ITS Architecture?
What are their expectationwith respect to NTCIP/TCIPTSP standards?AA
PPPP
EENN
DDIICC
EESS
A3.3 CASE STUDY – MTA, LOS ANGELES, CA

Transit Signal Priority Handbook Y 123
AAPP
PPEE
NNDD
IICCEE
SS

Respondents:
Bob Huffman, PACE; Taqhi Mohammed, PACE; KathyMeyerkord, Civiltech; Joe Weesner, H.W. Lochner, Inc.
1 – Cermak Road – 2.5 mile corridor
15 intersections on Cermak Road and 5 on a major N/S arterial
(Harlem). The whole system included 20 intersections which were
modernized and interconnected, but only 15 were equipped with the
TSP software and with the check-out loops. This includes Pace routes
304 & 322 and CTA Route 25
Entire fleet at West garage (approximately 125 buses)
Priority is requested by all buses.
Decentralized.
Loop detection – loops are placed 250 feet (6 bus lengths) before the
intersection with a check-out loop downstream of each intersection –
existing loops were compatible – IDOT already had loops and loops
were the most reliable technology at the time. There are checkout
loops at the 15 intersections on Cermak Road – loops are hardwired to
controllers.
The loop location was just based on IDOT standard design. It did not
have anything to do with travel time, bus length, or anything else oper-
ationally.
LoopComm 600A transmitters on the buses, LoopComm 613A receiv-
er/detector amplifiers in the signal controller cabinets
No
124 Y Transit Signal Priority Handbook
Interviewers:
Brendon Hemily
Hallie Smith
BACKGROUND
Number of corridors involved
Number of intersections equipped
Number of buses equipped
Is priority granted to late buses only?
Is the system centralized ordecentralized?
What is the PRG/detection technology?
What is the communicationstechnology?
Is the system integrated withAVL?
A3.4 CASE STUDY – PACE, CHICAGO, IL - CERMAK ROAD CORRIDOR
AAPP
PPEE
NNDD
IICCEE
SS

Early green and green extensions are both used based on
where the signal is in its cycle when the TSP call is placed by
the bus. The maximum green extension varies and each inter-
section was studied individually. On a couple of intersections
there are no extensions. Green time is taken from cross
street phasing — never from pedestrian crossing time. All
of the signals have pedestrian pushbuttons although some of
the pedestrian phases may be set on recall, particularly at the
east end of the project (closest to the City of Chicago where
all pedestrian phases are pre-timed).
No. Some of the intersections do have EMS pre-emption, but
Opticom is used for that system and it is not integrated.
The need to speed up service in congested corridors.
The Signal Pre-emption Working Group of the
Transit/Highways Task Force for the Illinois Operation Green
Light Program was charged with the responsibility of evaluat-
ing the feasibility of systems for granting priority to transit
vehicles through traffic signal priority (early studies for the
project referred to pre-emption rather than priority).
Operation Green Light was a state initiative that started in
1989 or 1990 – looking at all forms of congestion mitigation
and providing some funding. It had a transit workgroup as
one of the task forces. Projects that were eligible were varied
(sidewalks, curb cuts, signal timing, access to transit, etc).
The idea of TSP came out of the task force, Pace liked the
idea, and IDOT took it on. It began with a demo because we
needed to prove that signal priority works.
IDOT, Division of Public Transportation, was the lead for the
feasibility study. The Signal Pre-emption Working Group was
an integral part of the feasibility study. IDOT, Division of
Highways, was the lead for the design and implementation
stage. Now the only real support for TSP is from Pace & the
Regional Transportation Authority (RTA).
Transit Signal Priority Handbook Y 125
What strategies are used? (Earlygreen, green extension, phasehold, etc.)
Is TSP integrated with EMS pre-emption?
PLANNING
What sparked an interest in TSPimplementation?
Who is the lead agency?
AAPP
PPEE
NNDD
IICCEE
SS
A3.4 CASE STUDY – PACE, CHICAGO, IL - CERMAK ROAD CORRIDOR

The goals of the feasibility study and the demonstration project were to
identify feasible pre-emption technologies, analyze alternative hardware
systems, and select a preferred system for the Cermak Road corridor.
Additional goals were to evaluate the potential benefits to bus service
and the impacts on traffic operations that would likely result from the
installation of TSP.
We began at the Eastern Terminal, a rapid transit station and intermodal
connection point. We needed to prove that traffic would be okay and
that there was improved schedule reliability.
IDOT – Division of Public Transportation and Division of Highways,
Pace, and Chicago Transit Authority (CTA )
The corridor was selected because of traffic congestion caused by a
high volume of vehicles and numerous signalized intersections which
contributed to schedule reliability problems on three bus routes operat-
ing there.
They were chosen because they were between the North Riverside
Park Mall which is a transfer facility for Pace & CTA buses and the CTA
Douglas Terminal for the Blue Line. The three bus routes which use
this segment of Cermak Road are Pace Routes 304 and 322 and CTA
Route 25. Both Pace routes continue further west into the western
suburbs but their east terminus is the Douglas Terminal. The CTA route
runs only between North Riverside Park Mall and the Douglas Terminal.
The 15 intersections at which TSP was installed are located between
these two facilities.
There was extensive discussion based on a technology evaluation and
feasibility study on which communication technology to use and many
technologies were tested during the feasibility study. This system was
selected because it was compatible with the goals of the project and
with the existing actuated signals along the corridor operated by IDOT,
it did not increase the burden on the transit operator or the traffic sig-
nal operation, and it did not involve any unproven equipment or technol-
ogy. Although the technology chosen resulted in a “sole source” sup-
plier, it was an off-the-shelf system. From a cost standpoint, this was
beneficial. In addition, the technology, which used loops at a set loca-
tion, assured a consistent operation in the location at which calls for
TSP were placed. Other technologies available at the time would have
had variability on when the call was placed.
126 Y Transit Signal Priority Handbook
What were the stated goals?
Who are the players/partners?
How did you choose a corridor(s)?
How did you choose intersections?
Why did you choose LoopDetection?
AAPP
PPEE
NNDD
IICCEE
SS
A3.4 CASE STUDY – PACE, CHICAGO, IL - CERMAK ROAD CORRIDOR

First we re-timed traffic signals, then studied them, then
implemented TSP and studied it again. Simulation was also
used in the evaluation of the impact of changes in bus pri-
ority parameters on bus and vehicular traffic operations.
We used TRAF-NETSIM to model the corridor since it had
the ability to model buses based on schedule/headway. At
the time (early 1990’s) none of the software which also
modeled TSP was available. To model TSP, we observed a
TRAF-NETSIM run for 3 eastbound and 3 westbound buses
and recorded each bus’s operation along the system (when
& where it stopped and for how long and whether it
skipped any stops). We then manually simulated this on a
time-space diagram to replicate how TSP would improve
bus operation compared to a bus which did not get TSP.
VISSIM was used for the evaluation.
Several VISSIM simulations were run for each combination of
parameters and the averaged MOE’s were used in the evaluation.
During the feasibility study phase the biggest obstacle was
deciding on the technology to place TSP calls. One faction
was pushing technology which followed NTCIP protocol
and would be fully interchangeable. There were no prod-
ucts on the market at the time of the study; therefore this
would have required that the project cover the cost of
development of this technology. The other faction was
pushing off-the-shelf technology. Of the available propri-
etary systems, LoopComm was chosen because it allowed
the exact location at which the bus placed the TSP call to
be identified. Other technology such as optical sensor sys-
tems did not have this level of accuracy.
The other obstacle came during the design phase where
it was noted that the LoopComm detector amplifier had a
limited distance from the intersection where it could be
placed and still function properly. There was a limit to the
length of the lead-in cable.
The technology decision was finally decided by going with
the majority opinion. The LoopComm problem was correct-
ed by the manufacturer during the design phase.
Transit Signal Priority Handbook Y 127
What simulation or modeling didyou use?
How did you apply the results?
What were the technical obstacles?
How did you overcome the tech-nical obstacles?
AAPP
PPEE
NNDD
IICCEE
SS
A3.4 CASE STUDY – PACE, CHICAGO, IL - CERMAK ROAD CORRIDOR

IDOT Division of Highways was initially reluctant in their sup-
port of the demonstration, perhaps due to the potential for
significant adverse impact on traffic operations due to transit
priority. The CTA was a reluctant participant in the demonstra-
tion because they were pursuing other priorities and
approaches.
By monitoring the traffic delays at signal priority intersections
after the turn on of TSP which indicated there were no undue
delays in traffic. Also, we awaited complaints from the moni-
toring public after the turn-on. No complaints have been
received to date.
No training program was deemed necessary. Operators were
informed by bulletin in advance of the turn-on of this technolo-
gy and what to expect. Also, before and after surveys were
administered to operators.
None other than a demonstration of the TSP technology to
IDOT signal engineers in order to get approval for the installa-
tion of the software on the street.
Operation Green Light (state funding) and CMAQ.
$732,000 included completion of the interconnect conduit sys-
tem between 20 intersections where it did not exit, removal of
existing conduit cable and replacement with fiber optic cable,
replacement of all controllers and cabinets and installation of
advance detector loops and check-out loops where needed.
Also included was the purchase of 75 transmitters for installa-
tion on Pace & CTA buses and the installation of testing sta-
tions at each garage involved in the demonstration.
Y Transmitter – about $200/bus –
Y Feasibility Study - $175,000
Y Design, Construction inspection, Implementation –
$148,000 – signal interconnect – check out loops
Y Follow-up studies - $130,000
Y Construction - $732,000
128 Y Transit Signal Priority Handbook
What were the institutional barriers?
How did you overcome them?
What is/was the training programfor bus operators?
What is/was the training programfor signal technicians?
FUNDING
How was the project funded?
What was the cost of projectimplementation?
What is the breakdown in costs?
AAPP
PPEE
NNDD
IICCEE
SS
A3.4 CASE STUDY – PACE, CHICAGO, IL - CERMAK ROAD CORRIDOR

IDOT DPT (division of public transportation) was lead on
study – and hired Civiltech for feasibility study, design, con-
struction management, implementation, follow-up studies.
Then we did a study (using VISSIM) on what happens
when you change parameters (length of extension, location
of loops, delay time, bus stop location). There were no big
differences in operation except far side bus stops would
help remove variability in dwell time with the TSP. They
also found that benefits of upstream detection was some-
what mitigated by variability caused by heavy congestion
levels. IDOT Division of Highways did implementation.
Civiltech’s client was IDOT
Pace and CTA installed transponders.
Meetings were held with Pace and the CTA to discuss the
routes involved, the priority equipment to be installed on
the buses, and the need to consistently run the priority-
equipped buses on the routes.
Existing equipment was old and couldn’t be connected for
progression – IDOT District 1 (DoH) has standardized on
Eagle and Econolite. A functional spec was part of feasibil-
ity study and it specified that it needed early green and
extension. This wasn’t available with existing equipment.
We do not interrupt green band on progression.
Later we met with IDOT and Econolite and discussed what
could be implemented in controller. Econolite modified
existing controller to include TSP functions. They develop
the software Econolite ASC2.
IDOT uses NEMA only.
Yes. Econolite developed the new software and tested it
in-house. It was then bench tested by Civiltech personnel.
That process took several months as bugs in the program’s
operation were discovered by Civiltech and fixed by
Econolite. Once the testing was complete, a demonstra-
tion was made to IDOT personnel to gain approval to install
on the street. To verify that the equipment was operating
properly, a Civiltech engineer would travel through intersec-
tion with a transmitter with an engineer watching the signal.
Transit Signal Priority Handbook Y 129
IMPLEMENTATION
How were tasks assigned forimplementation?
What kinds of controllers didyou use?
Was there a test phase?
AAPP
PPEE
NNDD
IICCEE
SS
A3.4 CASE STUDY – PACE, CHICAGO, IL - CERMAK ROAD CORRIDOR

At the present time—for all buses whether early, on-time or
late. Ultimately, this system will be changed over to smart bus
system when the technology is upgraded to only request priority
when buses are behind schedule or are operating on an express
route.
Yes, in the original design, the Douglas Terminal was located
north of Cermak Road between 54th Avenue and Central
Avenue. Buses had to turn left at 54th Avenue to enter the sta-
tion. TSP was provided for the EB left turn phase at 54th. They
also had to turn left out of the terminal onto Central and proceed
south to return to Cermak Road. A check-in loop was provided
on this driveway at Central Avenue to call the Central NS green.
Where possible, far-side stops were established in the priority
corridor. This task was made difficult since most of the priority
corridor is in a commercial zone where customer parking is per-
mitted and a far-side bus stop lane can not be established.
New controllers were installed at each of the 15 intersections
and the controllers were fully interconnected. The other 5 were
just part of the traffic signal interconnect and included locations
along Harlem Avenue, one of the major cross streets. Those
other 5 locations were not equipped with check-out loops or the
TSP version of the Econolite software.
There is no feedback – one has to observe in the field. Also bus
operators will tell you if it’s not working. If they are having a
problem with schedule reliability then they know something is
wrong.
Test stations were installed in one Pace and one CTA garage.
These test stations consisted of a loop and two lights, one
which indicates that the bus was detected as a vehicle and one
which indicates that it was detected as a bus (i.e. the
LoopComm transmitter is installed and active). For example,
there are two confirmation beacons mounted near the garage
door. The bus needs to drive over a loop to exit the garage.
One light will come on if the bus is detected and the second
light will come on if the transmitter is operable.
A major television station was on hand during the 1st week of theturn-on to do a feature news story on this TSP project. In addition,Pace prepared a video with a split screen showing before and afterroute progression and travel time – very effective.
130 Y Transit Signal Priority Handbook
Under what circumstance(s) isTSP used? (For late buses, allbuses, express buses, etc.)
Are bus turning movements con-sidered/impacted?
What is the policy concerningnear side and far side stops?
To what extent was updating,installing and/or replacing signalequipment required?
How do you ensure that TSP isworking on the equipment at theintersection?
How do you ensure that TSP isworking on the vehicles?
How was the project publicized?
AAPP
PPEE
NNDD
IICCEE
SS
A3.4 CASE STUDY – PACE, CHICAGO, IL - CERMAK ROAD CORRIDOR

Data was collected for the before and after studies. This
data was collected under 3 conditions: before optimization
of the traffic signal system, after optimization but before
implementation of TSP, and with optimization and implemen-
tation of TSP.
Immediately following construction and implementation, bus
delay studies were completed by the transit agencies during
the PM peak hour. This data included travel time between
six waypoints between North Riverside Mall and the Douglas
Terminal. In addition, signal timing data was collected to
allow approach delay and level of service to be computed at
select intersection. This information (travel times and signal
timings) were collected both with TSP on and TSP off.
Additional studies were also completed in the early 2000s
which included vehicle delay and queue observations; bus
arrival time performance; and vehicle travel times. These
were completed both with and without TSP active.
The data was used to evaluate the effect of the installation
of bus priority on bus performance and on vehicular
performance at key intersections and through the system.
There were no maintenance agreements. IDOT is responsi-
ble for all equipment in the cabinets and the transit agencies
are responsible for the transmitters on their buses.
IDOT does not pay additional costs because they have included
TSP loops and equipment as part of their normal maintenance.
Signal system operation can be monitored using Econolite’s
Zone Monitor IV. The primary goal of monitoring had been to
detect equipment malfunctions and unauthorized changes to
controller settings. The detectors on the priority loops can
only be monitored by observing their operation in the field.
There have been no optimizations or adjustments to the
signal timings since it was installed.
Transit Signal Priority Handbook Y 131
What data do you collect?
How is the data used?
MAINTENANCE
What are your maintenanceagreements?
Was in the cost of maintenance?
How is the system monitored?
How do you optimize/adjust thesystem?
AAPP
PPEE
NNDD
IICCEE
SS
A3.4 CASE STUDY – PACE, CHICAGO, IL - CERMAK ROAD CORRIDOR

For the feasibility study, average vehicle delay, average vehicle
speed, average bus delay and average bus speed, all based on the
TRAF-NETSIM output, were used. For the follow-up studies, these
same MOE’s were used but were based on actual field studies.
Upon full optimization of traffic signals in this 2.5 miles corridor
and activation of priority, eastbound & westbound buses realized
an average of 15% reduction (3 minutes) in running time. Actual
running time reductions varied from 7% to 20% depending on the
time of day. With the implementation of TSP and through more
efficient run cutting, Pace was able to realize a savings of one
weekday bus while maintaining the same frequency of service.
Before TSP Pace had 100 bus complaints for missed trips – they
went down to 12 after TSP – inadequate green time on one
cross street.
Field observations verified the problem and the bus priority set-
tings were adjusted so that less time was taken from the cross
street green interval when a priority call was received.
Based on the follow-up studies, there is little impact to non-
priority street traffic. We are also not aware of any complaints
received by IDOT.
On-board surveys revealed that TSP has increased the satisfac-
tion level of passengers.
Bus operators have subsequently asked that more Pace routes
be set up with TSP. They don’t mind cutting running time.
Did not have an internal committee and planning was part of
bus operations.
Obtaining support from all agencies involved in the demonstra-
tion. Collecting sufficient data (in both quality and quantity) to
perform an evaluation of the demo. Presently Pace has an
excellent working relationship with RTA.
132 Y Transit Signal Priority Handbook
EVALUATION
What Measures of Effectivenessdo you use?
What are the benefits?
What complaints have you received?
How have you respondedto complaints?
What is the impact to non-prioritystreet traffic?
What has been the overall publicreaction/response?
How have your bus operators (orunion) responded?
How do you maintain on-goingcommunication among partners?
LESSONS LEARNED andKEYS TO SUCCESS
What were the greatest obstaclesoverall?
AAPP
PPEE
NNDD
IICCEE
SS
A3.4 CASE STUDY – PACE, CHICAGO, IL - CERMAK ROAD CORRIDOR

Mostly minor – ensuring that the equipment was properly
installed and maintained. The transit agencies had their own
procedures to ensure that appropriately equipped buses were
(or were not) run on Cermak Road.
Cooperation with agencies and consultants – all partners and
allies. Success requires a good team effort.
Enthusiastic support of at least some of the agencies
involved. The willingness of Econolite personnel to discuss
and implement changes to the controller firmware.
Y Feasibility Study – 1991-1993
Y Design and construction – 1994-1996
Y Software testing – Dec. 1996 – May 1997
Y Implementation – July 1997
Y Follow-up studies – 1998 – 2003
Consider optical (e.g., Opticom or Tomar) detection, which
could provide detection of transit vehicles before the vehicles
are slowed by queues at the intersections. Equip buses so
that priority was requested only when the buses were behind
schedule, to minimize impact on intersection operation.
Project with 20 signal – near Harvey transportation center –
not finalized – demonstration now testing with optical system
– 8 routes there – transit dependent customers – Also queue
jump studying – in initial stages – Phase I – 9 corridors – seek-
ing funding from RTA But will have phases II and III in future –
Waiting for completion of RTA regional study. Also planning to
integrate with new AVL system
We would like to implement standards but are not sure how
we will accomplish that.
There is a regional ITS transit plan with RTA. We map all TSP
projects to the architecture. The GCM corridor has its own
architecture and is being used to test multiple technologies.
Transit Signal Priority Handbook Y 133
Deployment or installation problems?
What do you feel were the keysto success?
How long did the various phasestake: planning? procurement?deployment?
If you were starting from scratch,what technology would use youand why?
What are your future plans forTSP implementation?
What are your expectationswith respect to NTCIP/TCIP TSP standards?
Regional architecture
AAPP
PPEE
NNDD
IICCEE
SS
A3.4 CASE STUDY – PACE, CHICAGO, IL - CERMAK ROAD CORRIDOR

Respondent
Eric Phillips, Pierce Transit
Chris Larson, City of Tacoma Public Works
One - South 19th Street Corridor
18
Tested a couple of different kinds of equipment – ran the
test for about 6 weeks or so – checked to see if there
was any travel times savings for transit and any side
street impact.
Traffic Congestion was among the worst in the nation!
Y Evaluate transit travel times utilizing TSP Corridor
Y Identify impact of TSP on side street traffic
Y Evaluate Equipment being considered for deployment
Y Develop a “GO” or “No-Go” recommendation for TSP
Y Outcomes of Demonstration:
Y Sorted out myth vs. reality
Y Selected TSP technology
Y Built level of comfort with city traffic engineers
Y Obtained support to proceed
134 Y Transit Signal Priority Handbook
A3.5 CASE STUDY – PIERCE TRANSIT, TACOMA, WA CORRIDOR
Interviewers:
Brendon Hemily
Hallie Smith
BACKGROUND forDemonstration Only
Number of corridors involved indemonstration
Number of intersectionsequipped for the demonstration.
PLANNING
What sparked an interest in TSPimplementation?
What were the stated goals andoutcome of the demonstration?
INITIAL DEMONSTRATION (PIERCE TRANSIT)
AAPP
PPEE
NNDD
IICCEE
SS

Transit Signal Priority Handbook Y 135
FUNDING
How was the demonstrationfunded?
What was the cost of the demon-stration?
Interviewers:
Brendon Hemily
Hallie Smith
BACKGROUND
Number of corridors involved inthe TSP project
Number of intersectionsequipped
Number of buses equipped
Do you use conditional or uncon-ditional priority?
Is the system centralized ordecentralized?
What is the PRG/detection technology?
What is the communications technology?
Is the system integrated with AVL?
Respondent:
Eric Phillips, Pierce Transit
Chris Larson, City of Tacoma Public Works
6 corridors. The first two intersections completed were South
19th St., (Tacoma) and SR 7/Pacific Ave. (Tacoma and WSDOT)
110
245 – 168 are Pierce Transit and 77 – Sound Transit
Unconditional— the emitter is always on when in service
along TSP corridors.
Decentralized
3M’s Opticom – the signal is received by the detector, interpret-
ed by the discriminator, which sends a request to the controller.
IR for the TSP request (communication of the data at TSP
intersections is via CDMA to IP)
Not yet – Pierce Transit is going out to bid on CAD/AVL next year.
TSP PROJECT (PIERCE TRANSIT)
AAPP
PPEE
NNDD
IICCEE
SS
A3.5 CASE STUDY – PIERCE TRANSIT, TACOMA, WA CORRIDOR
100% funded by a Federal Grant
Demonstration Project Funding — $86,000 (Federal)

We develop GP coordination plans for the corridors first and
then implement TSP control strategies within parameters, such
as always maintaining progression, no skipping phases and no
interference with pedestrian phases. TSP strategies include
green extension and red truncation/early green. A “detection
extension” strategy was developed for controllers lacking low
priority function and operating in free mode as a means to
extend standard loop detection to the max time once a bus is in
range.
We have no queue jumps yet, but will put one on a downtown
arterial. There is no transit-only phase insertion.
Yes – fire only in Tacoma – in University Place it is police and
fire. E911 paramedic and private ambulances are required to be
coded in City of Tacoma to use the 700 series Opticom for EVP.
We started from scratch in City of Tacoma because the city did
not have EVP yet.
In 1995 there was a lot of technology coming out. Pierce Transit
tried to validate whether the technology would improve transit.
We tested the water with TSP, and the City of Tacoma agreed to
try TSP. The City contacted police and fire right away to see if
they were interested in emergency pre-emption.
The lead agencies are Pierce Transit and City of Tacoma. Wefocused most of the program around City of Tacoma. There area lot of other small jurisdictions and in those areas there werequestions about who would maintain the equipment. Initially wedid not really talk about what kind of TSP function would work.We kept looking for a controller package that would work. TheCity was concerned about what TSP would do to the flow of traf-fic and Pierce Transit had to pledge that it would meet the City’srequirements. The strategy was that the City would receive ben-efits for the general traffic first through optimization and coordi-nation, and then Pierce Transit would get benefits from TSP. TheCity was glad to have the support to conduct extensive trafficengineering work that was needed.
Y Improve Transit Service Reliability
Y Maintain Transit Travel Times along major operating Corridor
Y Reduce dwell time at project intersection
136 Y Transit Signal Priority Handbook
What strategies are used? (Earlygreen, green extension, phasehold, etc.)
Is TSP integrated with EMSpre-emption?
PLANNING
What sparked an interest in TSPimplementation?
Who is the lead agency?
What were the stated goals ofthe TSP project?
AAPP
PPEE
NNDD
IICCEE
SS
A3.5 CASE STUDY – PIERCE TRANSIT, TACOMA, WA CORRIDOR

A multi-jurisdictional group – City of Tacoma, Pierce County,
City of Lakewood, City of University Place, Wash DOT, Pierce
Transit. 80% of the project is in Tacoma. Tacoma and County
(for smaller communities who contract with Pierce County for
signal maintenance) to maintain the controllers.
Corridor choice was based on:
Y Passengers per hour
Y Service Frequency
We deploy TSP compatible equipment at project intersections
that provide the greatest public benefit.
3M’s Opticom. Existing and new controllers, some CDMA wire-
less technology also installed at time points along TSP corridors.
We already had Opticom in the county. The demonstration
confirmed feasibility of that technology, and there was a deci-
sion for a sole-source procurement for Opticom. Opticom
was required by the project partners to enable integration
with EVP/EMS.
We used the Synchro model for optimization for general traf-
fic. Also, we used VISSIM for detailed simulation of the
ramps on SR 7 project because Synchro did not give fine
enough results. VISSIM is more expensive to use because of
detailed data and calibration requirements, but the results are
very impressive, especially when presenting to our Board or
general audience. VISSIM will also be used to simulate com-
plex signal redesign project in downtown required by introduc-
tion of new LRT.
We had a lot of controllers that did not have a TSP control
strategy and therefore could not provide a response beyond
high priority.
We replaced them and conducted extensive testing on others
to verify controller features.
There was not a lot of communications between transit and
traffic in the beginning.
We began developing a relationship among the agencies and
opened the lines of communication. Simply visiting one
another for a brief conversation over donuts can help open
communication. Technical issues and concerns were
Transit Signal Priority Handbook Y 137
Who are the players/partners?
How did you choose a corridor(s)?
How did you choose intersections?
What technology do you use?
How did you choose the technology?
What simulation or modelingtools did you use?
What were the technical obstacles of the project?
How did you overcome them?
What were the institutional barriers?
How did you overcome them?
AAPP
PPEE
NNDD
IICCEE
SS
A3.5 CASE STUDY – PIERCE TRANSIT, TACOMA, WA CORRIDOR

approached and evaluated through a process of discussing
actual data versus a reaction to a proposal without facts.
A training program was developed because bus operators
manually control emitters. We established TSP Working Group
with S&T and Operator participation to develop a Training
Program. We know it is important to make sure to communi-
cate regularly with your front line! Training for bus operators is
incorporated into operator’s manual and is now part of all oper-
ators’ training. The training explains how TSP works and when
to turn it on and off – how you use the system and how it is
applied.
Also, use instructions for emitters are included in daily shift/run
assignment and are route specific.
In addition, there was training for maintenance of the on-board
TSP equipment: we have a few electronics specialists who
handle radio, fare box, destination signs, and TSP equipment.
Checking for TSP equipment is just part of the routine checks
on traffic signal cabinets.
Had 3-4 grants and then an earmark – around 1997-1999
Y TSP Implementation — $2.5 Million (Federal) — (CMAQ
and STP) — $200,000 (State)
Y Total Project Funding (including the demonstration and TSP
implementation) was $2,786,000
Y Cost per intersection with replacement of controller and
cabinet (including engineering): $25,763
Y Cost per intersection with no controller replacement
(but including engineering): $9,263
138 Y Transit Signal Priority Handbook
What is/was the training programfor bus operators?
What is/was the training programfor signal technicians?
FUNDING
How was the project funded?
What was the cost of projectimplementation?
AAPP
PPEE
NNDD
IICCEE
SS
A3.5 CASE STUDY – PIERCE TRANSIT, TACOMA, WA CORRIDOR

Field engineering – (1) collect baseline data on intersection,
(2) model the project (Synchro & sometimes VISSIM for spe-
cial problems) and see how much flexibility is in an intersec-
tion, (3) create new general traffic plan and then implement,
(4) deploy and fine-tune, (5) another study to include corridor,
(6) implement TSP plan, (7) evaluation study to measure ben-
efits compared to baseline and to optimized general traffic
plan. Detection ranges are set in the field. DKS and Pierce
Transit do this together. We look at intersection design for
range of detection and bus stop placement. We then look at
the type of controller that is available and the intersection
volume to determine settings. Higher side street volumes
require more restrictive TSP. We don’t want to mess up traf-
fic. We do an after-study and compare it to the base line.
We describe what the benefits are at that point. Sometimes
we reduce the change in the settings.
The City did not want a separate black box so we use
TraConEx 390 and LMD 9200 controllers. Pierce purchased
city-wide upgraded software. For the LMD’s we keep the
same software everywhere and have no hardware issues.
We replaced 18 controllers because they were older fixed-
time controllers with no external input capability. The com-
bination of Opticom and new controllers allowed us to cre-
ate a controller standard.
All buses on certain routes.
We try to have far-side stops whenever possible, based on
availability of sidewalks and topography, but we can use
mid-block stops or nearside stops if necessary.
Some of the jurisdictions have Tomar (for emergency vehicle
pre-emption) and some very old Opticom equipment (100
series). Sometimes detection was set up in only one direc-
tion and the location didn’t work well. Some old equipment
didn’t distinguish between high and low priority, so they
could be pre-empted by mistake, and had to be replaced.
Sometimes it was harder to update an intersection than to
start from scratch.
Pierce provided new controllers where needed.
Transit Signal Priority Handbook Y 139
IMPLEMENTATION
How were tasks assigned forimplementation?
What kinds of controllers do you have?
Under what circumstance(s) isTSP used? (For late buses, allbuses, express buses, etc.)
What is the policy concerningnear side and far side stops?
To what extent was updating,installing and/or replacing signalequipment required?
Who paid for controller equip-ment installation and upgrades? AA
PPPP
EENN
DDIICC
EESS
A3.5 CASE STUDY – PIERCE TRANSIT, TACOMA, WA CORRIDOR

The City has a spare ratio and they just replace equipment with
spares when the equipment breaks. The City gets reports from
the fire department if the equipment is not working. Pierce
Transit reports to the City if there is a disruption in the data col-
lection process because that means equipment is not working.
Will show problems, but there are very few problems. The dis-
criminators work fine and detectors can go bad but it is not
really a problem.
Bus operators are required to perform equipment checks daily
and will report if the equipment is not working.
There were some news stories but there was no large
media effort.
We had a “ride-along” with an environmental reporter.
Customers said they were happy with anything that would get
them there faster.
We gave our customers a warning during the data collection
phase when the buses ran free (i.e. not adhering to schedules at
time points). We told the customers that the buses might run
early, so please get to stop a little early for the next few days.
We had a special task to develop a complementary system to
collect Opticom data from discriminator, and transmit it via
CD/PD to Pierce Transit, and integrate it into a system that
compared real data (arrival times) to schedule data (arrival
times). The data does not tell what controller did – we don’t
communicate with controller. The data we collect includes:
time call was requested, vehicle number, high or low priority,
range and intensity, when call was dropped, call duration peri-
od, etc. We now use CDMA (broader spectrum).
We compare real data with scheduled data and have been able
to reduce schedule times. We usually have enough recovery
built in to compensate for traffic volume. With TSP we try to
reduce recovery time.
The City maintains their own equipment and Pierce maintains
their own equipment.
There is no discernable extra cost because the technicians
clean detectors while they are cleaning signal heads
140 Y Transit Signal Priority Handbook
How do you ensure that TSP isworking on the equipment at theintersection?
How do you ensure that TSP isworking on the vehicles?
How was the project publicized?
What data do you collect?
How is the data used?
MAINTENANCE
What are your maintenanceagreements?
What is the cost of maintenance?
AAPP
PPEE
NNDD
IICCEE
SS
A3.5 CASE STUDY – PIERCE TRANSIT, TACOMA, WA CORRIDOR

Y Comprehensive before and after studies
Y Travel time
Y Stop and signal delay
Y Fuel savings
Y Air quality benefits
Y Public schedule changes
Y Operating resources required
Y Signal delay significantly increases transit travel time.
TSP is an effective tool and significantly reduces signal delay
and improves transit speed and reliability.
Implementation of TSP provided significant economic benefit to
the general public. Signal coordination alone – $14.2 million
annually for the six corridors (after TSP strategies implemented).
On S. 19th Signal Coordination reduced average total signal
delay for by 18-70% for GP, and by 5-30% for transit. (AM and
PM peak)
On Pacific Ave. signal coordination reduced average total sig-
nal delay by 30-65% for GP, and by18-21% for transit. (AM
and PM Peak)
The combination of TSP and signal optimization reduced tran-
sit signal delay about 40% in both corridors.(So. 19th and
Pacific Ave. Corridors)
Implementation of TSP had little impact on traffic progression
along these two corridors.
Bus stop locations (far-side optimal for TSP) should be consid-
ered during TSP implementation.
Some side street delay increased with TSP implementation,
but was well within acceptable limits.
Each intersection designed according to unique characteristics
(bus stop location, frequency of times stop served, traffic vol-
umes, type of controller).
Range setting requirements vary and proper setting is an
essential implementation task.
Transit Signal Priority Handbook Y 141
EVALUATION
What Measures of Effectivenessdo you use?
What are the benefits?
AAPP
PPEE
NNDD
IICCEE
SS
A3.5 CASE STUDY – PIERCE TRANSIT, TACOMA, WA CORRIDOR

Complaints are related to coordination rather than TSP. Someone
may see that there is no traffic and they want to go ahead. They
ask the City to adjust the signal. But the City believes coordina-
tion is important and will not “fix” one intersection at the expense
of all the others.
Very little impact.
Very little response.
The Union was afraid the schedulers might try to cut too much
time from the schedules. Time has shown that fear to be
unfounded, so they are okay now. Scheduling maintains on-going
communication with operations to ensure no problems arise.
Have team that used to meet monthly. Doesn’t need to meet
that often.
State; Cities of Tacoma, Lakewood, and University Place; Pierce
County; DKS; from Pierce Transit operations assistant manager, TSP
project manager, director of development and planning and scheduling.
Convincing traffic engineers of the need for TSP and keeping
everyone focused on working on same project; and keeping com-
munications open.
There were issues internal to Pierce Transit because we were
bringing a new system on-line. We had to make sure it was incor-
porated as part of operations. We solved these problems with
communications and by giving responsibility and allowing people
to feel ownership.
From the City’s point of view the greatest obstacles were the
complaints about side street delays. The side streets used to run
free but are now part of coordination. Therefore, the side street
delays are a function of coordination and NOT a function of TSP.
On the whole the public is unaware of TSP.
142 Y Transit Signal Priority Handbook
What complaints have youreceived?
What is the impact to side street traffic?
What has been the overall publicreaction/response?
How have your bus operators (orunion) responded?
How do you maintain on-goingcommunication among partners?
LESSONS LEARNED andKEYS TO SUCCESS
What were the greatest obstaclesoverall?
AAPP
PPEE
NNDD
IICCEE
SS
A3.5 CASE STUDY – PIERCE TRANSIT, TACOMA, WA CORRIDOR

The City was at first concerned that transit would get green
light and everyone else would be delayed, but that has not
been the case. Also, the City didn’t see a huge benefit but
there has been a real benefit in getting the traffic coordination.
No problems worth mentioning. Decided to install emitters
within bus body next to destination sign to avoid possible
problems from water infiltration (bus washers and rain)
Develop strong jurisdictional partnerships for project coordina-
tion and implementation.
Verify operational benefits in accordance with local jurisdic-
tions traffic engineering requirements.
Provide measurable and quantifiable project results
and outcomes.
We had 3-4 grants and then an earmark all around 1997-1999. In
the Fall of 1999 we started an interagency agreement between
Pierce Transit and City of Tacoma which was completed Spring
2000. Construction took place in Spring 2000 to 2001.
Have issued Task Orders for Implementing remaining
TSP Corridors.
Further use of data collection tool to assist with making
schedule changes to take full advantage of TSP.
Estimating that we can pull at least one bus from Route #1 –
Pacific Avenue Corridor.
Assessing and re-designing traffic control system downtown
around new LRT
Schedule changes will occur over next five service changes.
Tacoma Express Bus Corridor Project
Prioritize Peak Hour Express Bus Service
Coordinated Project with Sound Transit
Regional architecture – all consistent - Puget Sound
Regional Council
Transit Signal Priority Handbook Y 143
Deployment or installation problems?
What do you feel were the keysto success?
How long did the various phasestake: planning? procurement?deployment?
What are your future plans forTSP implementation?
Are you using either a RegionalITS architecture or the NationalITS Architecture? AA
PPPP
EENN
DDIICC
EESS
A3.5 CASE STUDY – PIERCE TRANSIT, TACOMA, WA CORRIDOR

Respondent:
Hansel Wang, P. Eng.
Roads & Infrastructure Planning
Program Manager, Transportation Engineering,TransLink
TSP is a major component of the 98 B-Line 16 km BRT corri-
dor between Vancouver and Richmond.
[In addition TSP has also been deployed as a stand-alone appli-
cation at 4 intersections along the Willingdon corridor in
Burnaby.]
59 intersections in the 98 B-Line
28 buses
On the 98 B-Line, priority is granted based on schedule adher-
ence condition. [The Willingdon Ave. corridor provides priority
to all buses.]
Distributed. Signals are coordinated in Vancouver, but not
in Richmond.
Novax infrared emitters are arranged in a sidefire configura-
tion, with emitters mounted on the curb-side of the bus over
the middle doors, and the detectors mounted on utility poles,
shelters, etc. The check-in detector is typically located
100-150 m upstream, and check-out is located at the near-side
of intersection.
[The Willingdon corridor uses a visual recognition technology.
Although the visual recognition system cannot distinguish
between buses and trucks, this is not a problem in this specif-
ic location because the buses are operating in an exclusive
bus lane.]
Communications from detectors to master unit is by hard-wire
or RF communications depending on layout of equipment.
The system is integrated with the AVL system deployed for
the 28 98 B-Line buses.
144 Y Transit Signal Priority Handbook
Interviewer:
Brendon Hemily
BACKGROUND
Number of corridors involved
Number of intersectionsequipped
Number of buses equipped
Do you use conditional or uncon-ditional priority?
Do you use conditional or uncon-ditional priority?
What is the PRG/detection technology?
What is the communicationstechnology?
Is the system integrated with AVL?
A3.6 CASE STUDY – TRANSLINK, VANCOUVER, BC
AAPP
PPEE
NNDD
IICCEE
SS

The TSP system provides maximum green extension of up to
15 seconds, red truncation governed by minimum pedestrian
times, and phase insertion. Maximum green extension in
downtown Vancouver is 12 seconds because of lower cycle
lengths and signal coordination.
No.
TSP was planned as an integral part of the 98 B-Line from
the beginning.
TransLink is responsible for transit policy and planning,
contracting of transit operations, and the management of the
region’s Major Road Network (MRN), including co-funding of
road maintenance on the MRN network. This unusual
institutional framework provides TransLink with both control of
transit and some influence over the roads as well.
The goals of the B-Line are to reduce travel time and improve
reliability in an effort to provide a much more attractive transit
product that emulate a rapid transit service. The TSP system
was designed primarily to reduce travel time variability.
[In the case of the Willingdon corridor, TSP was implemented
to improve service on one of the highest demand routes that
links the Metrotown SkyTrain station and the BC Institute of
Technology, along a bus lane]
TransLink, the municipalities of Vancouver and Richmond, and
the BC Ministry of Transportation (that controls intersections
in the airport area.
The 98 B-Line (a BRT) corridor is a major corridor slated for
higher capacity transit in TransLink’s Strategic Plan. The BRT
service is designed to build ridership for a future rapid transit
system currently under planning. It also serves as a potential
model for the deployment of BRT in other corridors.
59 of the 68 intersections in the corridor are equipped; those
not equipped represent major/major intersections where there
was a concern about the impact on buses and general traffic
in the intersecting corridor.
Infra-red emitters
Transit Signal Priority Handbook Y 145
What strategies are used? (Earlygreen, green extension, phasehold, etc.)
Is TSP integrated with EMS pre-emption?
PLANNING
What sparked an interest in TSPimplementation?
Who is the lead agency?
What were the stated goals?
Who are the players/partners?
How did you choose a corridor(s)?
How did you choose intersections?
What technology do you use? AAPP
PPEE
NNDD
IICCEE
SS
A3.6 CASE STUDY – TRANSLINK, VANCOUVER, BC

New Novax traffic controllers were being deployed in
Vancouver. A demonstration of the Novax TSP system was
conducted in 1999-2000 to test its compatibility with multiple
controllers in use in other jurisdictions.
Yes.
VISSIM was used to simulate operations in a few locations
Simulation was used to determine the best location of check-in
detectors. However no systematic assessment of the entire
corridor was conducted before implementation. A new project
is currently underway to use simulation for evaluation purposes.
There was some teething problems with the new controllers
especially when configured in coordinated groups, so TSP
could only be deployed initially at isolated intersections until
this problem was resolved.
There was a problem in finding an appropriate location for the
check-in detector. The simulation analysis provided a standard
check-in location (15 seconds upstream with location deter-
mined by speed of the bus), but this often had to be moved
substantially to the next available utility pole downstream,
reducing the potential benefit of TSP.
The new simulation project will provide more detailed analysis
for some locations. In addition, a new generation of TSP tech-
nology is currently being evaluated that will provide a more
dynamic approach to detection.
Despite the considerable discussion of TSP over the years and
the high profile of the 98 B-Line, understanding of TSP among
the municipalities remains fragmented.
The unusual institutional framework provides TransLink with
much influence on the process, but there remains a need for
continuous communication efforts with the Ministry, and other
municipalities for future TSP implementation.
There was only bus operator with respect to the on-board AVL
unit; the TSP was transparent to the operators.
Not for the TSP.
146 Y Transit Signal Priority Handbook
How did you choose the technology?
Did you use any simulation ormodeling?
If so, which tools did you use?
If so, how did you use simulationtools and apply the results?
What were the technical obstacles?
How did you overcome them?
What were the institutional barriers?
How did you overcome them?
What is/was the training programfor bus operators?
What is/was the training programfor signal technicians?
AAPP
PPEE
NNDD
IICCEE
SS
A3.6 CASE STUDY – TRANSLINK, VANCOUVER, BC

TSP was part of the 98 B-Line deployment budget.
The overall budget for the 98 B-Line was CD$52 Million
(US$34.67 M): 44% for the infrastructure (including construction
of a median lane in Richmond); 35% for the new buses; 11% for
modifications to the maintenance facility; and 10% for ITS.
The TSP budget was CD$1.3 M ($US 860,000 at the time) for
hardware and software.
The cost was approximately CD$28,000 per intersection
(US$18,700). Emitters cost roughly CD300 (US$200) plus
installation. CD$20,000 (US$13,300) was spent on
simulation analysis.
TransLink has overall responsibility.
The AVL and TSP suppliers are responsible for on-board equip-
ment, and the TSP supplier was responsible for wayside
equipment. Municipalities are responsible for signal timings.
Novax in Vancouver and Econolite in Richmond.
The TSP system was demonstrated in late 1990’s for its func-
tionalities and integration with an AVL system, prior to the
implementation of the B-Line service.
On the 98 B-Line, priority is granted to buses that are two or
more minutes late.
The TSP Master Unit has the ability to distinguish four levels
of ‘lateness’, and in case of conflict, forwards the request by
the most severely late bus to the controller.
Bus-only turn phases are used at the end of the protected
median BRT right-of-way in Richmond to enable the buses to
reintegrate the normal lanes. In addition, there is a queue-jump
at the Airport Station with a bus-only phase for exiting buses.
Transit Signal Priority Handbook Y 147
FUNDING
How was the project funded?
What was the cost of projectimplementation?
What is the breakdown in costs?
IMPLEMENTATION
How were tasks assigned forimplementation?
What kinds of controllers?
Was there a test phase?
Under what circumstance(s) isTSP used? (For late buses, allbuses, express buses, etc.)
Are bus turning movements con-sidered/impacted?
AAPP
PPEE
NNDD
IICCEE
SS
A3.6 CASE STUDY – TRANSLINK, VANCOUVER, BC

The corporate policy is for far-side location of B-Line stations.
In some cases, this was not feasible because of various rea-
sons, including property availability. B-Line stations are mostly
separated from local bus stops.
Vancouver was in the process of upgrading their controllers
prior to the B-Line project. New controllers were required
in Richmond.
Both Vancouver and Richmond paid for their new controllers in
the corridor.
A print-out is generated every two to three months or upon
request made by TransLink to the municipalities and indicates
time of requests, but this is a crude and unsatisfactory
approach for monitoring the operation of the TSP Master and
wayside units.
If a problem is detected by the municipality between theMaster Unit and the controller, TSP is disabled. A moresophisticated monitoring and diagnostic system will be incorporated in the next technology generation currently under development.
No system exists.
The B-Line was massively publicized, but TSP element was
not emphasized.
None other than those recorded by the controllers. The
availability of data is a significant issue.
Not used unless malfunctioning of equipment is detected.
TransLink is responsible for maintaining detectors and TSP
master unit. The TSP is currently maintained by Novax under a
direct contract with TransLink.
CD$24,000 (US$20,000) per year
The printouts generated every three months are the only
means, but are insufficient.
148 Y Transit Signal Priority Handbook
What is the policy concerningnear side and far side stops?
To what extent was updating,installing and/or replacing signalequipment required?
Who paid for controller equip-ment installation and upgrades?
How do you ensure that TSP isworking on the equipment at theintersection?
How do you ensure that TSP isworking on the vehicles?
Was the project publicized?
What data do you collect?
How is the data used?
MAINTENANCE
What are your maintenanceagreements?
Was in the cost of maintenance?
How is the system monitored?
AAPP
PPEE
NNDD
IICCEE
SS
A3.6 CASE STUDY – TRANSLINK, VANCOUVER, BC

A VISSIM model is currently being developed to assess the
performance of the current system.
A comprehensive evaluation study was conducted to assess
the overall impacts of the 98 B-Line BRT system. As part of
this evaluation study, a before and after evaluation was made
of the impact of TSP.
The 98 B-Line resulted in reducing travel time in the corridor
form 100 to 84 minutes. It resulted in a 23% modal shift from
auto to transit in the corridor. The net benefit of the BRT line
is CD$2.9 million (US$2.4 M) per year.
The main benefit from the TSP system was a significant
reduction (40-50%) in travel time variability.
This is an issue. Schedules are prepared by the contract oper-
ator, Coast Mountain Bus Company. There is a need to moni-
tor actual savings and review time points in light of running
time savings.
There have been no complaints; nobody has noticed.
There has been no noticeable impact.
We have not received any complaints from the public.
We have not received any complaints from the operators.
TransLink has an in-house Project Administrator, but his pri-
mary role is technical and maintenance (e.g. when equipment
is damaged).
No formal committee was established during deployment.
Communications with municipalities for future deployments is
being carried out one by one.
Transit Signal Priority Handbook Y 149
How do you optimize/adjust thesystem?
EVALUATION
What Measures of Effectivenessdo you use?
What are the benefits?
Have benefits been reflected intransit schedules, and how?
What complaints have youreceived?
What is the impact to side streettraffic?
What has been the overall publicreaction/response?
How have your bus operators (orunion) responded?
How do you maintain on-goingcommunication among partners?
AAPP
PPEE
NNDD
IICCEE
SS
A3.6 CASE STUDY – TRANSLINK, VANCOUVER, BC

The requirement for schedule-based conditional TSP should be
re-evaluated. TSP has been conceived as having negative
impacts on pedestrians by some municipalities.
Finding an appropriate fixed location for the check-in detectors,
that does not sacrifice performance is an issue.
The availability of funding for the B-Line was a key to success.
In addition, the use of simulation, even limited as it was, was
useful to demonstrate potential benefits in terms of overall
travel delay, and facilitated negotiations with traffic departments.
Planning = 3 yearsProcurement = 1/2 yearInstallation = 2 years
A system that provided more ongoing data collection and diag-
nostics capability would have been preferable, but was not
available at the time.
In addition, the technological solution adopted involves considerable
hardware on the street, capital costs, and power requirements.
Adopting an unconditional approach to TSP would greatly sim-
plify the deployment because it does not require integration
with AVL, and would reduce overall costs considerably. The
potential for an unconditional approach is being explored for
future deployments.
More planning to understand the optimal location of check-in
point for each intersection would have been useful, but the
technology is still constrained by the need of mounting check-
in detector at a fixed location.
150 Y Transit Signal Priority Handbook
LESSONS LEARNED andKEYS TO SUCCESS
What were the greatest obstaclesoverall?
Deployment or installation problems?
What do you feel were the keysto success?
How long did the various phasestake: planning? procurement?deployment?
If you were starting from scratch,what technology would use youand why?
If you were starting fromscratch, what would be yourplanning strategy?
AAPP
PPEE
NNDD
IICCEE
SS
A3.6 CASE STUDY – TRANSLINK, VANCOUVER, BC

A major study, involving the University of British Columbia, is
underway using VISSIM and data from several corridors, to
evaluate more accurately various related issues, including:
passive coordination, conditional vs unconditional TSP, and other
related measures such as parking bans, queue jumps, etc.
In addition, a new generation of TSP technology is currently
being assessed that may address some of the identified
technical issues.
TransLinks’s strategic plan has identified various other corridors
for BRT deployment once these initiatives have been completed.
AAPP
PPEE
NNDD
IICCEE
SS
Transit Signal Priority Handbook Y 151
A3.6 CASE STUDY – TRANSLINK, VANCOUVER, BC
What are your future plans forTSP implementation?

Respondents:
Jon Lutterman, TriMet
Willie Rotich, City of Portland
Phase one is complete and includes 8 corridors.
Phase two began March 2004 – TriMet is gradually adding corridors and
other intersections.
There are 250 intersections equipped in Phase 1- There will be 370 at
end of phase II.
There are 650 buses equipped. That includes all fixed route buses
except 20’ circulators.
Conditional — based on four criteria. (See below.)
Decentralized
3M’s Opticom
Phase I – Activation is based on four criteria: 1) Door closed, 2) on-
route, 3) 30 seconds or more late, and 4) within city of Portland as
defined by a geometric polygon. The initial project was funded based
on a request by the city of Portland, and only applies to the city.
Parameters have not been set up to date to implement TSP in
suburban municipalities.
There is no checkout detection.
Phase II will create “Activation points” and won’t request priority from
bus until it reaches an exact point as determined by AVL system. There
is about a bus length in differential GPS accuracy.
Creation of activation points requires two changes: a change to on-board
firmware and to software of data derived from TriMet’s scheduling soft-
ware that will allow definition of activation points. It is like a new
scheduling point. In addition, the creation of activation points Phase II
will require some development of the business rules to use in AAPP
PPEE
NNDD
IICCEE
SS
152 Y Transit Signal Priority Handbook
A3.7 CASE STUDY – TRIMET, PORTLAND, OR
Interviewers:
Brendon Hemily
Hallie Smith
BACKGROUND
Number of corridors involved
Number of intersectionsequipped
Number of buses equipped
Do you use conditional or uncon-ditional priority?
Is the system centralized ordecentralized?
What is the PRG/detection technology?
AAPP
PPEE
NNDD
IICCEE
SS

determining distances from the intersection in special
situations. For example, for near side stops, the activation
point may be set at stop-bar as opposed to the normal up-
stream distance. Once activation points are created, granting
of priority may also be linked to other factors such as
activation of passenger push buttons, length of time for door
openings, and historic likeliness of stopping.
The buses operate in low priority range. Opticom provides 10
classes within “low priority”. In theory, if the phase selector
receives several requests, it could go to highest class.
However, this feature has not been used to date in Portland.
Priority is granted on a “first come first serve” basis.
Encoded Infrared Communications
Yes.
Both green extension and red truncation are used. Recovery isnot needed because the signals are never out of coordination.The system does not provide priority to a bus request in thecycle following a cycle in which priority was requested.
The system allows 7-10 seconds extension which changes byintersection. If there is a pedestrian push button, the walktime will not be shortened beyond the 4 second minimum asset by the MUTCD. The maximum cycle length is 120 secondswith either phases but in the central business district somecycles are as short as 60 seconds. If signals are too closetogether, no bus priority is given.
Portland also has some queue jumps which is used when abus lane is in a right turn only lane. The queue jump gives sixseconds of advance to buses to jump the queue. Both loopsand Opticom are used to grant the signal in right lane. Theseare Installed based on need.
At intersections with pedestrian call buttons, we use maximumtime available. At intersections with pedestrian recalls, weshorten crossing time (4-second minimum) to limits set by MUTCD.
Yes. High priority is provided to fire trucks only, not regularpolice vehicles or ambulances. High priority is also providedto two police bomb squad vehicles. AA
PPPP
EENN
DDIICC
EESS
Transit Signal Priority Handbook Y 153
What is the communicationstechnology?
Is the system integrated withAVL?
What strategies are used? (Earlygreen, green extension, phasehold, etc.)
Is TSP integrated with EMSpre-emption?
AAPP
PPEE
NNDD
IICCEE
SS
A3.7 CASE STUDY – TRIMET, PORTLAND, OR

There had been some early pilot projects conducted by Tri Met in early
1990’s (Powell using transponders, Multnomah), but technology and soft-
ware were not sufficiently mature, results were inconclusive, and the
pilots had not lead to further development.
More recently, Tri Met had implemented the “Streamlining Project” to
improve speed on selected corridors which added TSP, assessed stop
spacing, looked at individual stop locations, moved nearside stops to
far-side stops wherever possible based on a far-side preference policy,
and added some new striping and some queue jumping. The reason
TriMet began in the city first and added suburbs later is that the city
had an funds earmark by Congress for TSP. Emergency vehicles were
first implementation and then buses were added with signal priority.
There had previously been some implementation of EMS pre-emption
at a few intersections.
The City Traffic Department was the lead but TriMet often leads in imple-
mentation. Additionally, there is the TransPort Group which may take the
lead. The TransPort Group is a regional ITS coordinating group composed
of three counties and one city as well as Oregon Department of
Transportation and Washington Department of Transportation. The state
calls the meetings which are held monthly. TransPort maintains the
regional ITS architecture and all agencies share fiber and cameras. Each
agency maintains its own fiber. TransPort provides the forum to
encourage continued implementation of TSP in suburbs.
Transit wanted to reduce operating costs and improve reliability of
schedules through reduced variability.
The City wanted to provide priority to emergency vehicle (fire), and to
increase the PEOPLE throughput through intersections.
The project has enabled:
Y Extension of Opticom to all fire trucks
Y Upgrade to 170E/with HC11 type controllers
Y Additional intersections installed with Opticom
Y Equipping of all buses with low priority Opticom
City of Portland DOT, TriMet, and Oregon DOT for development of stan-
dard controller equipment.
AAPP
PPEE
NNDD
IICCEE
SS
154 Y Transit Signal Priority Handbook
PLANNING
What sparked an interest in TSPimplementation?
Who is the lead agency?
What were the stated goals?
Who are the players/partners?AA
PPPP
EENN
DDIICC
EESS
A3.7 CASE STUDY – TRIMET, PORTLAND, OR

Level of ridership, frequency of service, and amount of sched-
ule deviation (based on analysis of AVL data). The team
looked at the behavior and came up with a list of candidates.
Then out of all these they chose the corridors with the best
possibility of making an impact. The corridor had to be inside
city and have a big potential for delay. AVL data was used to
determine the potential for delay. Some input was also pro-
vided by the fire department.
Phase 1: Intersections were chosen to get measurable benefits.
Phase II will concentrate on “hot spots”. TriMet held a “Hot
Spot Contest” asking bus drivers which signals bother them
most. TriMet analyzed the submitted intersections using AVL
and awarded prizes based upon correctly prioritizing the
negative impact. TriMet took the top 30 intersections within
the City (but outside original corridors) and some additional
corridors listed in the TIP as candidates. Intersections that
were too close together, downtown, or just too complicated
were eliminated.
Opticom. Phase selectors had to be upgraded. With an
upgrade to 700 series, they will be able to use the class and
vehicle identification numbers for determining priority level. The
City is upgrading their traffic control system and the suburbs
will be able to use the same system. The central system
upgrade came with free licenses for all the regional partners.
Opticom had been used by the fire department all along, so
instead of choosing a different technology we made the decision
to use Opticom because it made sense. There was no need to
look for something new because we already have technology
that would be shared by the fire department.
TriMet did not use any simulation or modeling. The City of
Portland uses Synchro to model timing for signalized
intersections. The consultant hired the local university (PSU)
to create a TSP simulation to aide in timing plan adjustments.
Although there was no simulation, the consultant assessed in
detail each intersection to determine plans and timings.
Appropriate time to be provided for extension or truncation
depended on professional knowledge (using free flow
speeds). The consultant used standard times (e.g. 4 seconds
is minimum for walk – walk time under flashing is calculated
using 4ft/sec) — from ITE manual and MUTCD. AAPP
PPEE
NNDD
IICCEE
SS
Transit Signal Priority Handbook Y 155
How did you choose a corridor(s)?
How did you choose intersections?
What technology do you use?
How did you choose the technology?
Did you use any simulation ormodeling?
If so, which tools did you use?
AAPP
PPEE
NNDD
IICCEE
SS
A3.7 CASE STUDY – TRIMET, PORTLAND, OR

1) Definition (boundaries) of the city:
The initial project was funded for city of Portland only. In addition,
agreements have not yet been signed with suburbs, and their con-
trollers have not been set up. Therefore, a bus with its emitter on
would be perceived as an EMS vehicle anywhere out side the city
boundary.
We needed to define borders for where this system will work, used by
AVL firmware. The border is very jagged. We started with 120 points,
and eventually simplified to a 15-point polygon. The system has to be
enclosed in a continuous polygon in order to function properly.
Another technical problem was the default setting and upgradability
of equipment:
High priority is different from the emergency emitter
10 hertz = low priority
14 hertz = high priority
Opticom said the equipment was upgradeable, so TriMet assumed they
could replace a chip or upgrade through a serial port. The default state
is flash. TriMet wanted the default to be no flash because the default
created problems when buses were in the suburbs. Therefore, TriMet
wanted to upgrade to default “off” setting. But to upgrade they had to
replace the whole back-half of emitter. This lead to a conflict over the
definition of “upgradeable”. The new generation of emitters is designed
with laptop plug-in for firmware upgrading.
Another technical problem was compatibility with J1708. The message
collision detection on-board the vehicle area network (VAN) would only
retry twice before turning off. Excessive on-board message noise
therefore prevented message delivery. This has been rectified with
new firmware.
Additional technical problems were related to controller software.
Controller software handled pre-emption but not priority (provided low
priority but at the same time used minimum green times for left
turns movements).
Controller Software required a different algorithm for low priority. This
meant that we had to redesign the CPU and software had to be rewritten.
To overcome the lack of upgrade ability of equipment, TriMet reached
an agreement with the supplier.
AAPP
PPEE
NNDD
IICCEE
SS
156 Y Transit Signal Priority Handbook
What were the technical obstacles?
How did you overcome them?
AAPP
PPEE
NNDD
IICCEE
SS
A3.7 CASE STUDY – TRIMET, PORTLAND, OR

The controller software problems were addressed by the
state. The state had initiated in parallel a process to enhance
and standardize controller software and equipment, called the
W4IKS. A user group was formed to standardize controllers
across the state. Although they considered moving to a 2070
controller platform, it was felt that the 2070 platform was
insufficiently mature at the time. They adopted an upgraded
170 platform instead.
The W4IKS process resulted in the development of the 170E
controller (with 1 KRAM, 512 EE and A/D of memory, and
higher speed) and a software upgrade into the firmware. The
software included in the 170E represents a one-step enhance-
ment to existing 170 software, but sufficient to enable desir-
able TSP features.
Not really because of great communication – TransPort and
Technical Advisory Committee (TAC).
There was an initial concern from Fire chiefs that providing
low priority would compromise their high priority. However
that concern was overcome with communications.
TSP implementation still requires time. An intergovernmental
agreement (IGA) has to be signed with each suburb for future
expansion, and this takes 6 – 18 months, which is longer than
anticipated in TIP.
There is no bus driver intervention required and no formal
training per se. Awareness is provided by sending bus opera-
tors articles to read to inform them. The Operator’s Report
comes with their paycheck. Even queue jump was not per-
ceived to require training. The driver sees the light and pro-
ceeds accordingly.
Software that was used for old controllers had 15 tables.
There are now two more (17) tables. Signal technicians had
to learn the two additional tables, but all the rest is the same.
Plans were already optimized, and tables are downloaded by
technicians as needed when they go to the controllers in the
field. Not a lot of training was or is required. Timing plans for
all signals are reviewed every five years by the City.
The new Central System upgrade will include the new tables.
AAPP
PPEE
NNDD
IICCEE
SS
Transit Signal Priority Handbook Y 157
What were the institutional barriers?
What is/was the training programfor bus operators?
What is/was the training programfor signal technicians?
AAPP
PPEE
NNDD
IICCEE
SS
A3.7 CASE STUDY – TRIMET, PORTLAND, OR

The project was funded by congressional earmark. In the future, other
jurisdictions will pay for their own upgrades (or TriMet will pay partial
installation costs). The upgraded central traffic control system is being
funded/developed by the City of Portland and the suburbs will be able to
use it. In addition, decisions concerning 170E controllers simplify deci-
sions for future participants. The City maintains about 1000 intersections.
$5.8M
Numbers are approximate:
$5M total originally (5.8 revised budget):
$3.5M city (3.9)
$960K for consultant work for plans and timings
$250K for upgrade to central system
Rest of 3.5M is for receivers, labor, etc
$1.5M TriMet (1.9)
$868 K hardware for emitter
$515 K installation
$255 K firmware
Cost per intersection is about $10,000 if there is no Opticom at all there.
There are eight corridors in Phase I. Phase II started March 2004.
There are 250 intersections equipped in Phase 1- There will be 370 at
end of phase II. There are 650 buses equipped. That includes all fixed
route buses except 20’ circulators.
The consultant prepared plans and timings and marked each intersec-
tion. Technicians then provided the installation. The truck that electri-
cians/technicians use has an emitter at about same height as a bus
emitter, so they can check placement of the receiver in the field. They
read the intensity from emitter and then add 50’ to the reading and
enter it into the laptop.
State uses 170’s. City of Portland bought new 170E ATC’s with 68000
microprocessor. This is the same CPU that was supposed to run on
the 2070.
Safe trans and McCain Traffic supply CPUs. It was necessary to add
more memory. The City changed the microprocessor 64HC11 with 1
KRAM, 512 EE, and A/D memory, and upgraded firmware based on
Wapiti software.
The State has now adopted 170E controller as standard for the whole state.AAPP
PPEE
NNDD
IICCEE
SS
158 Y Transit Signal Priority Handbook
How was the project funded?
What was the cost of projectimplementation?
What is the breakdown in costs?
IMPLEMENTATION
What is the extent of implemen-tations: number of corridors,routes, streets, intersections?
How were tasks assigned forimplementation?
What kinds of controllers? AA
PPPP
EENN
DDIICC
EESS
A3.7 CASE STUDY – TRIMET, PORTLAND, OR

Line 4 and Line 12– were test phase – Had two corridors and
tested about 20 + 26 +13 (59 controllers)
This occurred prior to finalization of federal grant, and City
spent its own money to implement on 2 corridors, and used
that as a test phase. They had to keep working at the soft-
ware to fix it. The problem was that it would get out of coor-
dination and sometimes it would get stuck. Some signals
acted like they were preempted. The problem was overcome
by tweaking the software.
Priority is granted for buses that are running 30 seconds or
more late. TriMet had originally set a 90-second late criteria
but found that buses had difficulty recovering from this level
of lateness.
There is one intersection that’s minor to major that is con-
trolled by Opticom.
As a result of the previous “Streamlining project”, Tri Met had
adopted a “far-side” stop policy wherever possible.
TSP required upgrading to standardized 170E controller
boards, but that was a relatively minor operation once the
standard had been developed through state process. TSP
also required Opticom phase selectors at all intersections.
This was included in earmarked federal grant.
This is covered with regular maintenance in the field. Signals
are checked every 6-12 months to ensure that everything is
working mechanically.
There are on-board diagnostics that indicate whether the emit-
ter is operational and sending a message. The weekly mainte-
nance cycle generates fault reports for various things includ-
ing TSP. Also, if the emitter doesn’t provide data, it’s not
working.
Not intentionally but it has been mentioned in conjunction
with the “Streamlining Project”
On-board diagnostics will show when priority is requested.
However, there is no way at this time to indicate if controller
actually granted priority and how. This data loop needs to be
closed. This is a major problem from an analytic point of view
so that effectiveness of TSP can be more closely assessed. AAPP
PPEE
NNDD
IICCEE
SS
Transit Signal Priority Handbook Y 159
Was there a test phase?
Under what circumstance(s) isTSP used? (For late buses, allbuses, express buses, etc.)
Are bus turning movements con-sidered/impacted?
What is the policy concerningnear side and far side stops?
To what extent was updating,installing and/or replacing signalequipment required?
Who paid for controller equip-ment installation and upgrades?
How do you ensure that TSP isworking on the equipment at theintersection?
How do you ensure that TSP isworking on the vehicles?
Was the project publicized?
What data do you collect?
AAPP
PPEE
NNDD
IICCEE
SS
A3.7 CASE STUDY – TRIMET, PORTLAND, OR

Local phase selector logs the class of requesting buses, time, action,
etc., but data can only be downloaded by going to the controller in the
field to download info. A project is underway so that Central can see
data logged by controller: request to controller, by which bus, when,
and actions that have been implemented.
TriMet collects a tremendous amount of data through its AVL (Orbital) sys-
tem. Red Pine APC’s are on 75% of the fleet. All new buses have APC
and TriMet is moving toward 100% of the fleet equipped with APC’s.
Data is used to adjust schedules.
This brings up an important issue. At first TriMet time pulled too much
time off the adjusted schedules. When schedules are too tight, variabil-
ity rises. This caused some problems so schedulers have learned to
take minutes out of the schedule gradually until variability goes up.
Then they can add some back in to find the right balance. TriMet has
“driver shake-up” each quarter.
None - TriMet maintains buses and the City maintains signals.
650 buses - 0.2 FTE – The hardware is under warranty for 5 years. A
new emitter costs about $1000 and should last 12 years or more.
There is no additional cost for the signal maintenance. Phase selectors
and receivers are very durable. One doesn’t have to clean them or any-
thing. The City has a task for the consultant to check if the receivers
need cleaning.
When the ignition turns on, the bus is interrogated as to what priority it
has. The emitter knows how it is programmed and it can tell bus
whether it is functioning and whether the priority is high or low.
AAPP
PPEE
NNDD
IICCEE
SS
160 Y Transit Signal Priority Handbook
How is the data used?
MAINTENANCE
What are your maintenanceagreements?
What in the cost of maintenance?
How is the system monitored?
AAPP
PPEE
NNDD
IICCEE
SS
A3.7 CASE STUDY – TRIMET, PORTLAND, OR

TriMet MOE was reduced variability. Reduce recovery time at
end of run is now a goal but was not an initial goal.
Note: it is important to distinguish between “layover time”
defined by the bus operator’s contract and “recovery time”
which is added to ensure on-time departure when variability
exists. As variability is reduced, recovery time can be reduced
as well.
TriMet projected potential savings in recovery time and
removed it at outset, but this created new variability problems.
Since then they have been proceeding incrementally, ratcheting
it down with each sign-up, to returning it when variability starts
increasing again. However, because of lack of data from con-
troller actions, TriMet is unable to assess directly the impact of
specific strategies on reduced variability and running time..
Reduced recovery time and increased reliability. For Line 4 inNov 2000 TriMet was able to avoid adding one more bus. Thisadds up to savings. There are also benefits to emergencyresponse and on-time performance for transit vehicles. Busoperations removed too much schedule time at first whichcreated problems and complaints from bus operators. TriMethas since proceeded incrementally.
There are no complaints from the traffic side.
Very little. Plan to upgrade software to be able to collect data
directly from controllers. After that, a formal evaluation study
will be conducted.
No reaction.
Little reaction.
The TransPort Group TAC meets every other month maintain-
ing communication across modes and across the region.
AAPP
PPEE
NNDD
IICCEE
SS
Transit Signal Priority Handbook Y 161
EVALUATION
What Measures of Effectivenessdo you use?
What are the benefits?
What complaints have youreceived?
What is the impact to non-prioritystreet traffic?
What has been the overall publicreaction/response?
How have your bus operators (orunion) responded?
How do you maintain on-goingcommunication among partners?
AAPP
PPEE
NNDD
IICCEE
SS
A3.7 CASE STUDY – TRIMET, PORTLAND, OR

For TriMet obstacles include:
Getting the activation points into TriMet data – it’s a new piece of soft-
ware – the firmware makers had moved on – this is not a small task to
add to the AVL system. TriMet must define the business rules for cre-
ating activation points and then maintaining them.
Defining usage parameters – what is the default in the emitters? How
late do I want the bus to be? How to define city polygon?
For the City obstacles were that:
Controllers had to be upgraded and software had to have the proper
algorithm..
Deployment or installation problems? Initially there was water damage
to the electronics on the emitters caused by bus washers. The problem
was resolved by drilling a hole on bottom of each emitter to allow the
water to drain.
Stakeholder partnerships!
The project was accepted by transit and traffic and was even proposed by
the traffic side. There is a champion in the traffic department.
Extensive inter-agency cooperation and trust in the region created an
environment where dialogue already existed to a large extent and there
was a strong commitment to cooperation. Examples include:
The TransPort ITS working committee brings all agencies involved in ITS
(traffic and transit) to the same table and prepared the regional archi-
tecture.
The city implemented a 800mhz trunk radio that was built with suffi-
cient capacity to meet the needs of all agencies in the region. Access
will be provided to all, and participating agencies will share in mainte-
nance costs
TransPort adopted a single GIS standard for the region.
The new upgraded city traffic control system is being made available to all
suburban communities. This will facilitate traffic coordination and future
extension of TSP to suburban communities.
Additional keys to success were pitching the right ideas from the begin-AAPP
PPEE
NNDD
IICCEE
SS
162 Y Transit Signal Priority Handbook
LESSONS LEARNED andKEYS TO SUCCESS
What were the greatest obstaclesoverall?
What do you feel were the keysto success?
AAPP
PPEE
NNDD
IICCEE
SS
A3.7 CASE STUDY – TRIMET, PORTLAND, OR
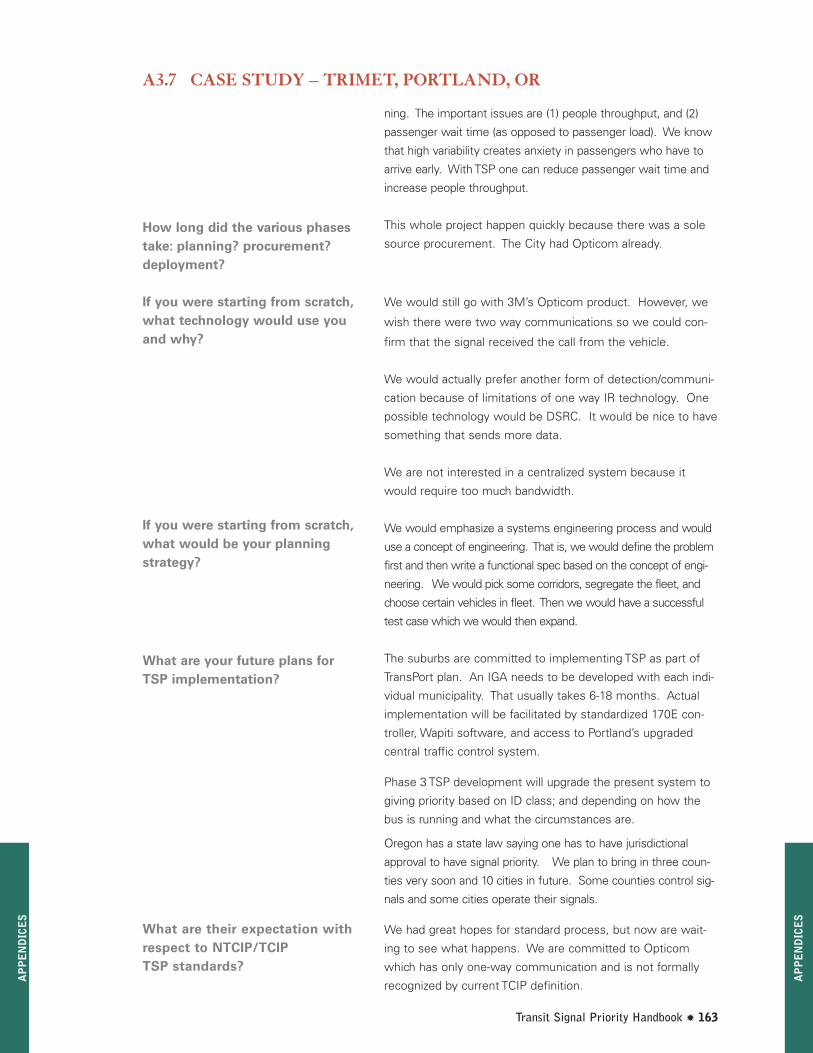
ning. The important issues are (1) people throughput, and (2)
passenger wait time (as opposed to passenger load). We know
that high variability creates anxiety in passengers who have to
arrive early. With TSP one can reduce passenger wait time and
increase people throughput.
This whole project happen quickly because there was a sole
source procurement. The City had Opticom already.
We would still go with 3M’s Opticom product. However, we
wish there were two way communications so we could con-
firm that the signal received the call from the vehicle.
We would actually prefer another form of detection/communi-
cation because of limitations of one way IR technology. One
possible technology would be DSRC. It would be nice to have
something that sends more data.
We are not interested in a centralized system because it
would require too much bandwidth.
We would emphasize a systems engineering process and would
use a concept of engineering. That is, we would define the problem
first and then write a functional spec based on the concept of engi-
neering. We would pick some corridors, segregate the fleet, and
choose certain vehicles in fleet. Then we would have a successful
test case which we would then expand.
The suburbs are committed to implementing TSP as part of
TransPort plan. An IGA needs to be developed with each indi-
vidual municipality. That usually takes 6-18 months. Actual
implementation will be facilitated by standardized 170E con-
troller, Wapiti software, and access to Portland’s upgraded
central traffic control system.
Phase 3 TSP development will upgrade the present system to
giving priority based on ID class; and depending on how the
bus is running and what the circumstances are.
Oregon has a state law saying one has to have jurisdictional
approval to have signal priority. We plan to bring in three coun-
ties very soon and 10 cities in future. Some counties control sig-
nals and some cities operate their signals.
We had great hopes for standard process, but now are wait-
ing to see what happens. We are committed to Opticom
which has only one-way communication and is not formally
recognized by current TCIP definition.
AAPP
PPEE
NNDD
IICCEE
SS
Transit Signal Priority Handbook Y 163
How long did the various phasestake: planning? procurement?deployment?
If you were starting from scratch,what technology would use youand why?
If you were starting from scratch,what would be your planningstrategy?
What are your future plans forTSP implementation?
What are their expectation withrespect to NTCIP/TCIP TSP standards?
AAPP
PPEE
NNDD
IICCEE
SS
A3.7 CASE STUDY – TRIMET, PORTLAND, OR

Respondents:
Bob Sheehan, VDOT
Doug Hansen, Fairfax County
John Collura, UMass/Amherst (formerly VaTech)
One Corridor — Route 1, Richmond Hwy, Fairfax County
25
6 buses in first contract. 6 buses in second contract including REX
Also, emergency vehicles equipped at the three firehouses serving
U.S. Route 1.
Signal priority is not dependent on the bus lateness. Green extension is
given only if priority is requested in the last 10 seconds of the phase.
Capacity, schedule, etc. are not considered.
Plans are to convert system to a GPS/AVL/bus schedule system so that
priority will only be requested when buses are actually behind schedule.
Decentralized
Optical. 3M Opticom system.
Optical signal, strobe (EMS)/Infrared (bus). We have leased line com-
munication to each intersection; however, data/information from the
phase selectors is not transmitted. Data from the phase selector is not
communicated to the controller and thus not collected centrally. Data
can be printed out on a laptop with the appropriate software. This is a
very simple system. The bus must place the request at end of cycle dur-
ing last 10 seconds. The call will extend the green 10 seconds more.
Not yet, but it is planned for the future.
Green extension (bus); green extension and red truncation (emergency)
AAPP
PPEE
NNDD
IICCEE
SS
164 Y Transit Signal Priority Handbook
Interviewer:
Hallie Smith
BACKGROUND
Number of corridors involved
Number of intersectionsequipped
Number of buses equipped
Do you use conditional or uncon-ditional priority?
Is the system centralized ordecentralized?
What is the PRG/detection technology?
What is the communicationstechnology?
Is the system integrated with AVL?
What strategies are used? (Earlygreen, green extension, phasehold, etc.)
A3.8 CASE STUDY – VIRGINIA - ROUTE 1
AAPP
PPEE
NNDD
IICCEE
SS

Yes. EMS pre-emption typically called Pre-emption. The order
in which pre-emption is granted is: Railroad #1, Emergency
Pre-emption #2 (hardwired or remote), Bus priority #3. If two
requests of same priority level are made, the first is granted
and the second is denied.
Emergency vehicle pre-emption was the original impetus.
Before this, pre-emption occurred only at isolated intersec-
tions through Fairfax County, not on a corridor. At the request
of FCDOT, ITS funds were appropriated for this study. Bus pri-
ority was added after the first phase began due to the recent
interest and advancement in priority technology.
Fairfax County. VDOT is an integral partner. Virginia Tech was
responsible for procurement and evaluation.
The goal was to determine whether TSP would be beneficial
and whether there would be any adverse impacts.
The RFP describes exactly what green extension is and limits
the signal priority to this type of service and no other. In addi-
tion, it specifically states emergency pre-emption shall be an
“unconditional” green interval. The transit vehicle shall be
provided a “conditional” green interval…
The underlying goal, essentially the reason for installation and
the stated goal for Virginia Tech’s evaluation was “To Improve
Emergency Vehicle and Transit vehicle travel time, and to
increase safety along U.S. Route 1.” Virginia Tech then evaluat-
ed the system’s performance to determine if there was a
detrimental impact on traffic, either on side street or mainline.
Any ill-effects were noted.
Part of the impetus of the study was a desire by VDOT to have
some documentation that corridor operation was not unduly
impacted by pre-emption or priority requests. Initial Va. Tech
study revealed that there was minimal negative consequence to
side-street traffic (i.e. queues cleared next green phase). In addi-
tion, there was a slight reduction in bus operating time although
it was hard to gauge this over just six intersections, hence the
decision to expand the study from 6 to 25 intersections.
Fairfax County DOT, Fairfax County Fire and Rescue, Fairfax
Connector, WMATA, Virginia Tech, Virginia DOT AAPP
PPEE
NNDD
IICCEE
SS
Transit Signal Priority Handbook Y 165
Is TSP integrated with EMS pre-emption?
PLANNING
What sparked an interest in TSPimplementation?
Who is the lead agency?
What were the stated goals?
Who are the players/partners?
AAPP
PPEE
NNDD
IICCEE
SS
A3.8 CASE STUDY – VIRGINIA - ROUTE 1

The area was a perfect test site due to the number of bus routes: 3
basic (fixed route, local service), and now several express routes
(Richmond Highway Express bus service (REX)), and the number of Fire
houses. One fire house was within the system boundaries for first test
and a second one was included for the second part. Also, Route 1 had
been the specific target for Fire & Rescue for years for signal pre-emp-
tion. Fairfax County requested inclusion of Route 1 for funding through
the ITS Management and Operations Technical Committee of COG.
First 6 intersections were equipped for pre-emption and then priority
for buses was added later. It took about a year to get all the study
information together and to get funding moving. The additional 19
intersections were for transit priority only – not for pre-emption. One
reason for extending the corridor 19 more intersections was that VA
TECH thought the corridor needed to be longer to get any transit
improvement.
Proximity to fire house. Proximity to each other. The first six intersec-
tions (North Kings to Collard/Popkins) are in the vicinity of Fire House
(#11) and are very close to each other. The distance between North
Kings and the next intersection north on Rt. 1 is long and platoons
break down. The distance between Collard/Popkins and the next inter-
section south is also very long. As for priority, there were existing
Connector and Metro bus routes along U.S. Route 1.
The first contract was technology independent. However, the RFP
requested security features and other requirements that precluded
many bidders. The system had to be optical-compatible. 3M Opticom
was the only respondent to the RFP.
Fairfax County had requested that an optical based system be specified as
there was already 3M Opticom in use through other areas of the County.
The technology choice was determined based on the bids submitted.
The technology was governed by the use of existing optically
based equipment.
Virginia tech was responsible for the pre-installation and post-
installation analysis.
The purpose of the study was for simulation of results. VA TECH used
VISSIM to see what would happen on the corridor.
AAPP
PPEE
NNDD
IICCEE
SS
166 Y Transit Signal Priority Handbook
How did you choose a corridor(s)?
How did you choose intersections?
What technology do you use?
How did you choose the technology?
Did you use any simulation or modeling?
AAPP
PPEE
NNDD
IICCEE
SS
A3.8 CASE STUDY – VIRGINIA - ROUTE 1

Controller software. We had to wait over a year for our 170E
Controller firmware revision to allow green extension
signal priority.
VDOT was very cooperative in getting the software modified
(which was a part of a larger VDOT modification of software
on other uses). Another current problem is the coding of
emitters for the new version of emitter software (which
identifies vehicles as being from Fairfax County.)
See above. We tested several revisions from our software
vendor, BiTrans, before finally accepting the currently
installed version.
System ownership and maintenance (VDOT vs. Fairfax
County) is a problem. Also internal Fairfax County logistics
since two departments (EMS and Fairfax DOT) are now shar-
ing the same equipment).
Ongoing. System maintenance issues continue to be a topic
of discussion.
No formal training.
We received training from 3M. The purpose of the training
was to identify problems with the equipment and also diag-
nose whether a problem is caused by the pre-emption equip-
ment or VDOT’s controller. The VDOT repair shop did extensive
testing of the 3M unit to confirm compatibility with our con-
troller and our conflict monitors. This in-depth testing provided
a great opportunity to learn the functionality of the 3M unit.
ITS funding through COG (see above).
Equipment for 25 intersections and 12 buses was approximate-
ly $220,000 (including installation).
So far, one corridor and 25 intersections have Bus Priority
technology. There are approximately 35 other isolated inter-
sections in Fairfax County that utilize the 3M Opticom system
for emergency vehicles only. AAPP
PPEE
NNDD
IICCEE
SS
Transit Signal Priority Handbook Y 167
What were the technical obstacles?
How did you overcome them?
What were the institutional barriers?
How did you overcome them?
What is/was the training programfor bus operators?
What is/was the training programfor signal technicians?
FUNDING
How was the project funded?
What was the cost of projectimplementation?
IMPLEMENTATION
What is the extent of implemen-tations: number of corridors,routes, streets, intersections?
AAPP
PPEE
NNDD
IICCEE
SS
A3.8 CASE STUDY – VIRGINIA - ROUTE 1

Based on logical responsibility. VDOT took the lead to test the compati-
bility with our controllers since we serve as the actual vendors of our
control boxes and controllers. VDOT also coordinated with Virginia Tech
to manage the construction, evaluation, and system testing schedule.
VDOT technicians and engineers performed the system testing.
Virginia Tech procured the equipment and performed evaluation;
however, VDOT downloaded the logs from the phase selectors.
170E controller. BiTrans 233 software modified for use in Northern Virginia.
Yes. The contractor was required to verify operation of all equipment
before pre-emption/priority activated.
All buses. (Now included express (REX) buses)
No. The buses only get green extension of the through movement phase.
Queue-jumping may be considered in future as part of the U.S. Route 1
highway and transit development projects.
Far side bus stops are encouraged for TSP intersections. However,
most bus stops now are near side. Bus stop location is under consider-
ation in a separate Fairfax County Bus Stop Inventory Study. Right now
there is no policy in place. Currently queue jumping is not used.
The controllers did not have to be replaced. However, all controllers
required a software update. When signal controller software firmware is
updated, it requires an on-site installation. The intersection is put into a
flash condition, and the software upload/download is performed. Then
an extensive in-field test is performed to confirm field functionality,
communication to central system, conflict monitor performance, etc.
VDOT
There is shop testing at the beginning of the installation. But there is
no communications back to the traffic center except under some very
specific circumstances. These circumstances include instances in
which there is a pre-emption request or a priority request that occurs at
a specific time in the signal cycle. The “phase selector log” logs every-
thing at the controller. However, no one gathers the logs because it is
time consuming and not a high priority. To capture the log one must
take a laptop to the site and download the log. Also, periodic test runs
can be conducted by emergency vehicles.
AAPP
PPEE
NNDD
IICCEE
SS
168 Y Transit Signal Priority Handbook
How were tasks assigned forimplementation?
What kinds of controllers?
Was there a test phase?
Under what circumstance(s) isTSP used? (For late buses, allbuses, express buses, etc.)
Are bus turning movements con-sidered/impacted?
What is the policy concerningnear side and far side stops?
To what extent was updating,installing and/or replacing signalequipment required?
Who paid for controller equip-ment installation and upgrades?
How do you ensure that TSP isworking on the equipment at theintersection?
AAPP
PPEE
NNDD
IICCEE
SS
A3.8 CASE STUDY – VIRGINIA - ROUTE 1

There is a confirmation light that comes on when the
pre-emption/priority is activated (installed on the additional 19
intersections). If the light does not come on, Fire and Rescue
will report it.
Yes, most specifically as part of the REX Express bus system
which began in September 2004.
VDOT collects no data although logs are automatically
retained at the signal location. Virginia Tech used the logs
during the evaluation period. No additional post-evaluation log
downloads are performed.
Early in implementation we looked at the logs to determine if the
system was working and what vehicles were using the system.
Virginia Tech is compiling the results of their study.
Currently being discussed.
Currently being discussed with Fairfax County.
The system cannot be monitored remotely due to
communication constraints. Call-in reports.
Adjustments need to be made on site.
Queue. Number of cycles to clear a queue before/after.
Queue on mainline. Delay to vehicles. Reduction in
accidents. Travel time of emergency vehicles through specific
section of Rt. 1. Reduction in travel time for buses a plus.
Travel time for buses. Reduced accidents. Added emergency
responder confidence.
The VA TECH study looked at side street delays for pre-emption only.
Now they are looking at side street delays for priority as well.
AAPP
PPEE
NNDD
IICCEE
SS
Transit Signal Priority Handbook Y 169
How do you ensure that TSP isworking on the vehicles?
Was the project publicized?
What data do you collect?
How is the data used?
MAINTENANCE
What are your maintenanceagreements?
Was in the cost of maintenance?
How is the system monitored?
How do you optimize/adjust thesystem?
EVALUATION
What Measures of Effectivenessdo you use?
What are the benefits?
AAPP
PPEE
NNDD
IICCEE
SS
A3.8 CASE STUDY – VIRGINIA - ROUTE 1

Little to none from traveling public.
This response concerns pre-emption only. The impact of transit signal
priority has not been analyzed yet.
The difference in delay or the additional delay is small. Example, with-
out pre-emption being granted, sometimes it would take 2 cycles for a
queue to clear anyway. One impact noted was when multiple emer-
gency vehicles responded to a call. The headway between the vehicles
was such that as each pre-emption was granted and the transition back
to coordination was occurring, the second or third or fourth emergency
vehicle would request pre-emption. In this scenario an impact on side
street traffic was more noticeable. Also the impact on the mainline
could be noticed during peak hours.
Board of Supervisors very pleased. Also has gotten the attention of
congressional legislators.
Phone conversations between VDOT, FCDOT, Fire & Rescue, and/or Transit
A major hurdle was the modification to the controller firmware. Also, the
institutional issues associated with VDOT and Virginia Government in gen-
eral have contributed to cause a delay in deployment because of the
denial of maintenance responsibility.
The biggest obstacles were obtaining funding (sought for years), and
the issue of implementing corridor pre-emption without an official study.
System functions fine. However, the codes for the buses have been
programmed incorrectly a few times.
Keep moving ahead despite the obstacles. Communication.
Planning – no formal planning period.
Procurement: Maybe 1 year.
Deployment: Only a few months, with several months dedicated to
evaluation. The project could or should have been completed much
earlier; however, the controller firmware upgrade delayed the project
extensively. Working partnership with VDOT.AAPP
PPEE
NNDD
IICCEE
SS
170 Y Transit Signal Priority Handbook
What complaints have youreceived?
What is the impact to non-prioritystreet traffic?
What has been the overall publicreaction/response?
How do you maintain on-goingcommunication among partners?
LESSONS LEARNED andKEYS TO SUCCESS
What were the greatest obstaclesoverall?
Deployment or installation
problems?
What do you feel were the keysto success?
How long did the various phasestake: planning? procurement?deployment?
AAPP
PPEE
NNDD
IICCEE
SS
A3.8 CASE STUDY – VIRGINIA - ROUTE 1

Same technology. However, we would like to have communi-
cation to the devices. We would like phase selector informa-
tion then we would know when priority was granted. Would
like to make the priority more conditional. In the future, any
advanced priority system will require updated communica-
tions and severe upgrades the controller firmware and most
likely new controllers.
First we would lay the foundation with a concept of opera-
tions that defines the project philosophy. We would get all
major parties to understand the need for TSP. We would talk
with all partners and (assuming we have funding) we would
set up a pilot and not force it on anyone. This would help
break down resistance. One always needs a political champi-
on. Once the system is proven it is much easier to expand it.
One should know your goal in terms of technology. Some
consultants are ten years behind in their technology and so
the buyer needs to know the capability of technology.
All Connector buses to be equipped with emitters. Pending
success of U.S. Route 1 study, expansion to other corridors in
Fairfax County.
I would expect future modifications and upgrades to the sig-
nal system and the traffic management system in Northern
Virginia in general will require updated standards.
AAPP
PPEE
NNDD
IICCEE
SS
Transit Signal Priority Handbook Y 171
If you were starting from scratch,what technology would use youand why?
If you were starting fromscratch, what would be yourplanning strategy?
What are your future plans forTSP implementation?
What are their expectation withrespect to NTCIP/TCIP TSP standards?
AAPP
PPEE
NNDD
IICCEE
SS
A3.8 CASE STUDY – VIRGINIA - ROUTE 1

172 Y Transit Signal Priority Handbook
AAPP
PPEE
NNDD
IICCEE
SS

Transit Signal Priority Handbook Y 173
The following survey forms were used during the months of June and July 2004 to conduct phone inter-
views with transit agency and traffic engineering personnel in areas in the United States and Canada where
Transit Signal Priority (TSP) and emergency vehicle pre-emption systems are operational. The interviews
were conducted in order to identify, inventory and classify TSP and emergency vehicle pre-emption sys-
tems currently in operation in the United States and Canada. In the cases where contact was not possible
by telephone, the survey was emailed to the appropriate personnel for completion
The following transit systems or municipalities were surveyed:
Alameda-Contra-Costa Transit District
Ben Franklin Transit
Calgary Transit
Central Florida Regional Transportation Authority (LYNX)
City of Glendale
Charlotte Area Transit
Houston Metropolitan Transit Authority
Illinois DOT (Regional Transit Authority) (RTA)
Jefferson Transit Authority (Port Townsend, WA)
King County Metro
LA County Metropolitan Transportation Authority
Metropolitan Transit (Minneapolis, MN)
City of Ottawa
PACE Suburban Bus Service
Pierce Transit
Port Authority of Allegheny County
Sacramento Regional Transit District
Santa Clara Valley Transportation Authority (VTA)
Skagit Transit
Southeastern Pennsylvania Transportation Authority (SEPTA)
St. Cloud Metropolitan Transit Commission
Tri-County Metropolitan Transit District (TriMet)
Utah Transit Authority
Washington Metropolitan Transit Authority(WMATA)
.
TRANSIT SIGNAL PRIORITY (TSP) SURVEY FORM
AAPP
PPEE
NNDD
IICCEE
SS

AAPP
PPEE
NNDD
IICCEE
SS
174 Y Transit Signal Priority Handbook
Agency:Alameda-Contra-Costa Transit District
City, State:Oakland, CA
Contact:Jon Twichell, Transportation Planning Manager, (510) [email protected]://www.smartcorridors.com
Background
Type of Transit:Rapid Bus (1st Level BRT)
Date of implementation:June 2003
Number of routes:1 Physical Characteristics
General description of route: (geo-metrics, exclusive bus lanes, leftturn lanes)
BRT
Number of signalized intersections:62
Mixed flow or exclusive ROW:Mixed flow on city streets.
Number of lanes:4-lane arterials (2 lanes each direction)
Headways:12 minute peak period headways.
Signal Controls
Centralized/Decentralized:Centralized. Half of the signals are con-trolled by CalTrans and half are controlledby the Alameda County CongestionManagement Agency.
Fixed/Actuated:Actuated
Hardware:Type 170 controllers
Software:BiTran software for local portion of corri-dor. Caltrans C-8 software for CalTransportion of corridor.
Vehicle Detection Type:Optical (3M Opticom)
TSP Strategies UsedGreen ExtensionEarly Green (Red Truncation)
Additional CommentsThere are two published documents avail-able regarding TSP - one discussing thePilot Study and one that highlights theDeployment Study. For this project, mostof the hardware was already in place,however approximately 30 intersectionshad no pre-emption equipment. New con-trollers were later purchased and installedat these locations.
A memorandum of understanding provedto be an effective tool in the success ofthe TSP implementation.
After the implementation of TSP, the SanPablo Rapid bus service experienced an18% reduction in total travel time and anincrease in ridership by 22%. It should benoted that other factors other than TSPcould have influenced these travel timeand ridership changes.
Next Steps
The “International Telegraph Corridor” is a19-mile route that is currently beingplanned and is scheduled to open duringthe Summer of 2006.
TRANSIT SIGNAL PRIORITY (TSP) SURVEY FORM

Agency:Ben Franklin Transit
City, State:Richland, WA
Contact:Barbara HaysPete Beaudry (509) 585-4249 (City of Kennewick)(509) [email protected]
John Deskins (509) 585- 4400 (Traffic Engineer)
Background
Type of Transit:Bus
Date of implementation:1995
Number of routes:Physical Characteristics
General description of route: (geo-metrics, exclusive bus lanes, leftturn lanes)
Route is in the regular flow of traffic.
Number of signalized intersections:31
Near Side / Far Side Stops:Approximately 11 far side stops
Mixed flow or exclusive ROW:Mixed flow
Number of lanes:Two lanes in each direction of travel witha shared center turn lane along the major-ity of the corridor
Headways:30 minutes
Signal Contols
Centralized/Decentralized:Decentralized
Fixed/Actuated:Actuated
Hardware:Econolite ASC/2S (NEMA TS-2, Type I)
Software:NEMA proprietary software
Vehicle Detection Type:Optical (3M Opticom)
TSP Strategies Used
Green ExtensionEarly Green (Red Truncation)
Additional Comments
TSP is only used in the City of Kennewickand is only used when buses are runningbehind schedule.
Next Steps
Planning expansion to the City of Richland
AAPP
PPEE
NNDD
IICCEE
SS
Transit Signal Priority Handbook Y 175
TRANSIT SIGNAL PRIORITY (TSP) SURVEY FORM

Agency:Calgary Transit
City, State:Calgary, Alberta, Canada
Contact:Neil McKendrickHamid Radmanesh(403) 268-1501(403) 537-7727, (403) [email protected]://www.calgarytransit.com
Background
Type of Transit: Bus and LRT
Date of implementation:September 2000
Number of routes: 7
Physical Characteristics
General description of route: (geo-metrics, exclusive bus lanes, leftturn lanes)
Route 3 service operates 18 hours per day,7 days per week on major 4 lane arterialroads and within the downtown. Stopspacing every 300 feet. North expressroutes - Limited stop express servicefrom north Calgary to and from the down-town during weekday peak periods.
Number of signalized intersections:50 outside of the downtown (Route 3 cor-ridor). 17 signals along the express routes
Near Side / Far Side Stops:Far side (transit policy for all stops to befar side)
Mixed flow or exclusive ROW:Mixed flow
Number of lanes:4
Headways:5 minute (peak), 10 minute (weekday mid-day), 15- 20 minutes (evenings and week-ends.) Express routes include 4+ trips foreach route during peak periods
Signal Controls
Centralized/Decentralized:Both centralized and decentralized con-trollers are used. The inner third of trafficsignals operate via the central traffic cen-ter control. This was developed by PBFarradyne and is referred to asManagement Information System forTraffic (MIST).
Fixed/Actuated:Both fixed and actuated signals exist
Hardware:NEMA LMD9200 controllers by Peak TrafficControl Systems
Software:Proprietary software provided by con-troller manufacturer (Peak Traffic)
Vehicle Detection Type:Optical (3M Opticom)
TSP Strategies Used
Green Extension (up to 20 seconds). EarlyGreen (Red Truncation) (up to 20 seconds)
Additional Comments
Optical (Opticom) detection systems are alsobeing installed for the Calgary FireDepartment along key response routes. AllOpticom installations will provide dual priority- Fire vehicles receive higher priority ( pre-emption) than transit vehicles, which receivetransit signal priority. Work also done to favorLRT operation in the downtown (optimizedsignals). In suburban Calgary, LRT preemptstraffic signals with protected gate arms atroadway crossings.
AAPP
PPEE
NNDD
IICCEE
SS
176 Y Transit Signal Priority Handbook
TRANSIT SIGNAL PRIORITY (TSP) SURVEY FORM

Agency:Central Florida Regional TransportationAuthority (LYNX)
City, State:Orlando, FL
Contact:Doug Jamison
Chris Kibler(407) 841-2279 x3071(407) [email protected]@cityoforlando.net
Background
Type of Transit: Bus
Date of implementation: 1997
Number of routes:1 route (10 buses) (TSP route is called“Lymmo”)
Physical Characteristics
General description of route: (geo-metrics, exclusive bus lanes, leftturn lanes)
Functions as a BRT service. Single lane, 1.5mile loop that runs parallel to traffic andstops at major destinations within the City.
Number of signalized intersections:19 signals along the route that have TSPcapabilities.
Near Side / Far Side Stops:Mandatory bus stops, 19 stops in total.Stops are a mix of near and far side.
Mixed flow or exclusive ROW:Operates along exclusive right-of-way
Number of lanes:1
Headways:5 min peak/10-15 min off-peak & weekends
Centralized/Decentralized:Originally operated as a centralized sys-tem, but now runs decentralized.
Fixed/Actuated:Actuated
Hardware:Naztec – NEMA controllers (model 980)
Software:Naztec “Streetwise” proprietary software
Vehicle Detection Type:Loop Detection
TSP Strategies Used
Signal pre-emption.
AAPP
PPEE
NNDD
IICCEE
SS
Transit Signal Priority Handbook Y 177
TRANSIT SIGNAL PRIORITY (TSP) SURVEY FORM

Agency:City of Glendale
City, State:Glendale, CA
Contact:Wayne Ko(818) 548-3960 [email protected]
BackgroundType of Transit:
“Beeline” Bus
Date of implementation:2001
Number of routes:1
Physical Characteristics
General description of route:(geo-metrics, exclusive bus lanes, leftturn lanes)
Approximately 3-mile route, consistingmostly of downtown arterials
Number of signalized intersections:17
Near Side / Far Side Stops:Relocating existing near side stops to farside
Mixed flow or exclusive ROW:Mixed Flow
Number of lanes:4-lanes (2 each direction) with a centershared turn lane
Headways:N/A
Signal Controls
Centralized/Decentralized:Centralized system using the QuicNet4system from Bi-Tran
Hardware:Type 170
Software:Bi-Tran 233 (modified for TSP)
Vehicle Detection Type:GPS NextBus system
TSP Strategies Used
Green ExtensionEarly Green (Red Truncation)
Additional Comments
Information is sent to the control centerwhere comparisons are made betweenthe actual arrival time and the scheduledtime. If the bus is running on schedulethen signal priority is not requested.
AAPP
PPEE
NNDD
IICCEE
SS
178 Y Transit Signal Priority Handbook
TRANSIT SIGNAL PRIORITY (TSP) SURVEY FORM

Agency:Charlotte Area Transit
City, State:Charlotte, NC
Contact:William Finger, Charlotte DOT(704) [email protected]
Background
Type of Transit:Express Bus
Date of implementation:1985 – 1998
Number of routes:1
Physical Characteristics
General description of route:(geo-metrics, exclusive bus lanes, leftturn lanes)
3-Mile corridor. Exclusive bus lanes inconjunction with left turn lanes. “ClosedDoor” express peak-hour service.Inbound service during AM peak; out-bound service during PM peak.
Number of signalized intersections:17
Mixed flow or exclusive ROW:Mixed flow
Number of lanes:4-lane arterials
Near or far side stopsNo stops (express service)
Headways:Varies, 5 minutes to 20-30 minutes
Signal Controls
Centralized/Decentralized:Decentralized
Fixed/Actuated:Fully actuated
Hardware:Traconex 390 NEMA Type-I
Software:Low-level pre-emption included with theNEMA controller (proprietary)
Vehicle Detection Type:Optical (3M Opticom)
TSP Strategies Used
Pre-emption only
The green time is truncated on the prioritystreet to prevent vehicles from trying toride behind the buses.
Additional Comments
This service was planned in anticipation ofan HOV lane and was very successful. Theservice is now in 2-way operation on anincomplete barrier-separated reversibleHOV facility.
AAPP
PPEE
NNDD
IICCEE
SS
Transit Signal Priority Handbook Y 179
TRANSIT SIGNAL PRIORITY (TSP) SURVEY FORM

Agency:Houston Metropolitan Transit Authority
City, State:Houston, TX
Contact:Lloyd Smith/John Olson(713) 615-6305 / (713) [email protected]@ridemetro.orghttp://www.ridemetro.org
Background
Type of Transit:Bus and LRT
Date of implementation:Bus system under construction as of June2004. LRT system operational January 1,2004.
Number of routes:1 LRT Line (8 mile corridor)
90 local and express routes for buses (TSPis not used on point-to-point commuterbus routes using motor coaches travelingprimarily on freeways.)
Physical Characteristics (per route)
General description of route:(geo-metrics, exclusive bus lanes, leftturn lanes)
Bus Routes: Variety of arterial mixed traf-fic lanes located outside the CentralBusiness District. (In the CBD and alongsix radial freeways, buses use exclusivebus lanes and HOV lanes within the ROW.)
Generally near side stops for bus, thoughsome far side.
Light Rail Corridor: Arterial streetsthrough three major activity centers:downtown, Texas Medical Center, Reliantstadium
Number of signalized intersections:1,500 for bus, 63 for LRT
Mixed flow or exclusive ROW:Bus Route: Mixed flow
Light Rail Corridor: Predominately semi-exclusive ROW adjacent to roadway withat-grade street crossings. Three-block sec-tion is separated by fences or barriersfrom the adjacent traffic lane, which isopened to pedestrian traffic for scheduledevents. One ? mile section has trains oper-ating in mixed traffic with left turn lanesshared by trains and traffic.
Number of lanes:Varies
Headways:Bus headways vary widely based on routeand time of day (peak/off-peak).LRT head-ways vary between 6 minutes during peakperiods and 12, 15 and 18 minutes duringoff-peak periods.
Signal Controls
Centralized/DecentralizedSystem is hardwired into signals alongroute, which are connected to each otherand central computer via Ethernet.
Fixed/Actuated:Actuated
Hardware:Type 2070 controllers with wireless commu-nications to central communications center
Software:NextPhase by Siemens ITS
Vehicle Detection Type:Bus detection: Optical (3M Opticom).
Light Rail: TWC system supplied bySiemens Transportation
AAPP
PPEE
NNDD
IICCEE
SS
180 Y Transit Signal Priority Handbook
TRANSIT SIGNAL PRIORITY (TSP) SURVEY FORM

TSP Strategies Used
Bus: Conditional Priority - buses containGPS, stored route maps and time tables.
Only contacts upcoming signal if bus fallsbehind schedule by several minutes.
LRT: utilizes a predictive priority method-ology instead of pre-emption. Trains runon green band through corridor; contactsupcoming signals if falls out of band; allred needed at times to prevent conflicts.(Nine gated crossings use railroad pre-emption due to roadway geometry or railspeeds.)
Additional Comments
Currently conducting testing for bus TSPsystem to optimize operations.
LRT results are mixed so far – working wellwhen stays near established green band,but not as efficient when gets far off band.
Next Steps
Completion of roadway TSP system late2004, bus TSP installation in 2005.
e Article on VISSIM analysis for LRT systemin November 2002 issue of ITE Journal.
e Preliminary planning for a limited num-ber of BRT / premium routes is under-way.
AAPP
PPEE
NNDD
IICCEE
SS
Transit Signal Priority Handbook Y 181
TRANSIT SIGNAL PRIORITY (TSP) SURVEY FORM

Agency:Illinois DOT (Regional Transit Authority) (RTA)
City, State:Chicago, IL
Contact:Duana Love, PE(312) [email protected]://www.rtachicago.org
Background
Type of Transit:Bus
Date of implementation:2003
Number of routes:17
Physical Characteristics General description of route: (geometrics,exclusive bus lanes, left turn lanes)
Number of signalized intersections:84
Mixed flow or exclusive ROW:Mixed Flow
Number of lanes:Headways:
Signal Controls
Centralized/Decentralized:Both centralized and decentralizedroutes exist.
Hardware:Econolite ASC/2, Eagle EPAC 300, Type2070 controllers, PEEK LMD40
Software:NEMA proprietary software; Type 2070controller firmware
TSP Strategies Used
Early Green (Red Truncation)
Green Extension
Conditional priority is used, whererequests are made only when buses areoperating behind schedule.
Additional Comments
Some information derived from the“Regional Signal Priority Location Study –Phase II, Model Simulation” and the “TSPImplementation Plan”.
AAPP
PPEE
NNDD
IICCEE
SS
182 Y Transit Signal Priority Handbook
TRANSIT SIGNAL PRIORITY (TSP) SURVEY FORM

Agency:Jefferson Transit Authority
City, State:Port Townsend, WA
Contact:Curtis Stacey(360) [email protected]
Background
Type of Transit:Bus
Date of implementation:1996/97
Number of routes:N/A
Physical Characteristics General description of route: (geometrics,exclusive bus lanes, left turn lanes) TSPis implemented on 2 traffic signals to facil-itate left turns out of the Park-n-Ride lot.
Number of signalized intersections:2
Mixed flow or exclusive ROW:Mixed flow
Number of lanes:4
Headways:Varies- 20 minutes to 2 hours
Signal Controls
Centralized/Decentralized:Decentralized
Vehicle Detection Type:Optical (3M Opticom)
TSP Strategies Used
Phase insertion is used to accommodateheavy left turn movement out of the Park-n-Ride lot.
AAPP
PPEE
NNDD
IICCEE
SS
Transit Signal Priority Handbook Y 183
TRANSIT SIGNAL PRIORITY (TSP) SURVEY FORM

Agency:King County Metro
City, State:Seattle, WA and vicinity
Contact:Ron Atherley(206) 263-4954
Background
Type of Transit:Bus - 40’ and 60’ articulated rubber tirediesel buses; Electric trolley
Date of implementation:1999
Number of routes:Multiple
Physical Characteristics
General description of route: (geo-metrics, exclusive bus lanes, leftturn lanes)
Varies
Number of signalized intersections:Currently 26, with plans for expansion
Mixed flow or exclusive ROW:Mixed flow
Number of lanes:Varies
Near or far side bus stops:Far side
Headways:Varies from 7-15 minute
Signal Controls
Centralized/Decentralized:Decentralized (closed loop)– local controllersoftware provide priority response. Workingwith Computran central traffic system in
Bellevue – needs software enhancements
Fixed/Actuated:Actuated and semi-actuated
Hardware:Controller Types vary (NEMA: Eagle,Econolite and Peek; and Type 2070)
Software:King County/McCain Traffic RF TransitPriority Request (TPR system) – with localTPRG software and central TPR systemsoftware
NextPhase
Vehicle Detection Type:Radio Frequency RF 900 MHz
TSP Strategies UsedGreen ExtensionEarly Green (Red Truncation)
Additional CommentsThe results of TSP implemented along theportion of Route 7 has reduced traveltimes by approximately 8%.
Next Steps
Working on central TSP applications withEagle (Actra) and Econolite (icons)
AAPP
PPEE
NNDD
IICCEE
SS
184 Y Transit Signal Priority Handbook
TRANSIT SIGNAL PRIORITY (TSP) SURVEY FORM

Agency:LA County Metropolitan TransportationAuthority
City, State:Los Angeles, CA
Contact:Sean Skehan(213) [email protected]
Background
Type of Transit:LRT
Bus
Date of implementation:Since 1990
2000
Number of routes:2 LRT lines
8 routes totaling approximately 100 miles
Physical Characteristics
General description of route: (geo-metrics, exclusive bus lanes, leftturn lanes)
LRT service operates on exclusive ROW
The bus service is a cross-county routeoperating within three different agencies.All service operates on major arterials,mostly 4-lane.
Number of signalized intersections:20
The system includes approximately 400intersections
Mixed flow or exclusive ROW:Exclusive ROW
Mixed flow
Number of lanes:N/A
Typical section of roadway varies, oper-ates primarily on 4-lane arterials.
Near or Far Side Stops:N/A
Mainly far side stops, near side stops areused only when far side is not possible.
Headways:5 minute peak period headways
20 minute off-peak headways
90 second headways on the heaviest routeduring the peak period
20 minute headways on the lightest off-peak route.
Average headways are approximately 5minutes
Signal Controls
Centralized/Decentralized:Centralized
Fixed/Actuated:Fixed in the central business district (CBD)
Actuated outside the CBD
Hardware:Exclusively uses 2070 controllers on theLRT lines and all intersections using TSP
Software:Custom design – City of Los AngelesSoftware
Vehicle Detection Type:Loop-based system with transponders onthe buses.
TSP Strategies Used
Early Green (Red Truncation)Green ExtensionPhase Insertion
AAPP
PPEE
NNDD
IICCEE
SS
Transit Signal Priority Handbook Y 185
TRANSIT SIGNAL PRIORITY (TSP) SURVEY FORM

Agency:Metropolitan Transit
City, State:Minneapolis, MN
Contact:Aaron Isaacs(612) [email protected]
Background
Type of Transit:Hiawathath Light Rail Line: LRT servicewith 12 stations
Minnesota – St. Paul Campus Shuttle:
3-mile shuttle bus operation betweenboth campuses
Lake Street Demonstration Project (bus)
Date of implementation:Hiawatha Light Rail Line planned to openJune 26, 2004
Number of routes: 3
Physical Characteristics
General description of route: (geo-metrics, exclusive bus lanes, leftturn lanes)
Hiawatha LRT runs along its own ROWthroughout the line and within the down-town operates as a rail-type priority withsignal pre-emption.
Number of signalized intersections:The campus shuttle includes 2 signalsalong the 3-mile route. The remainingintersections along the route are unsignal-ized. The Lake Street Demonstration proj-ect includes 20 signalized intersections.
Mixed flow or exclusive ROW:The Hiawatha Line operates exclusivelyon its own ROW. The bus systems oper-ate in mixed traffic.
Number of lanes:The Hiawatha Line runs on its dedicatedlane and in some locations operates with-in the median.
The campus shuttle runs typically along 2-lane arterials.
Headways:The Hiawatha Line operates on a 7-1/2minute headway during the peak hour anda 10 minute headway during the middayand Saturdays. During the off-peak andon Sundays, this service assumes a 15-minute headway.
The campus shuttle runs on a 5 minuteheadway on weekdays during schoolhours.
Signal Controls
Vehicle Detection Type:Optical and Loop detectors
TSP Strategies Used
Both services utilize signal pre-emption astheir strategy.
Additional CommentsProblem with opticalbus detection system triggering the emer-gency vehicle pre-emption systems.
Next Steps
Currently coordinating with the Universityof Minnesota’s Center for TransportationStudies in developing a GPS-based vehi-cle identification system.
AAPP
PPEE
NNDD
IICCEE
SS
186 Y Transit Signal Priority Handbook
TRANSIT SIGNAL PRIORITY (TSP) SURVEY FORM

Agency:City of Ottawa
City, State:Ottawa, Ontario, Canada
Contact:Kornel Mucsi(613) 580 2424 x [email protected]
Background
Type of Transit:Bus
Date of implementation:1990s
Number of routes:See notes below
Physical Characteristics
General description of route: (geo-metrics, exclusive bus lanes, leftturn lanes)
Mixed
Number of signalized intersections:40
Near Side / Far Side Stops:mixed
Mixed flow or exclusive ROW:Mixed flow with exclusive bus lanes forqueue jump at certain intersections.
Number of lanes:varies
Headways:varies
Signal Controls
Centralized/Decentralized:Centralized
Fixed/Actuated:Both.
Hardware:Enhanced Type 170 Controllers
Software:Developed in house with a number of TSPcapabilities: extension/truncation for coor-dinated and actuated phases, phase inser-tion, queue jump phases
Vehicle Detection Type:Double loop and single loop in exclusivebus lanes
TSP Strategies Used
The focus of transit priority is on congest-ed locations. TSP is an element of a widertransit priority approach. The primaryobjective is to eliminate or reduce conges-tion delay to buses, and the secondaryobjective is to reduce or eliminate signaldelay.
Congestion delay is reduced by bus lanesand queue jumps with or without signalpriority. There are queue jumps on arteri-als for straight through movement andqueue jumps at “T” intersections for theleft turn movement.
In corridors with a large number of busesthere is passive signal priority. There areintersections with actuated transit phases,truncation/extension on the actuatedphase, half cycle lengths, two transit actu-ated phases within the same cycle. Thereis one intersection with a bus actuated“pedestrian signal”.
Future plans: Improved bus detection,extension and truncation on the coordi-nated phase
Several different TSP strategies are used forkey locations along bus routes. The focus isto improve the most congested locationsinstead of focusing on specific bus routes. AA
PPPP
EENN
DDIICC
EESS
Transit Signal Priority Handbook Y 187
TRANSIT SIGNAL PRIORITY (TSP) SURVEY FORM

Queue jump strategy for buses on themain street. Four intersections opera-tional and four under construction.Various geometric designs.
T-intersection queue jumps. Buses arriv-ing on side street to the main arterial andmaking left turn onto arterial street havequeue jumps. Queue jumps exist for sig-nalized and unsignalized intersections.One T-signalized intersection operationaland two under construction and threeunsignalized intersections operational. Abus arriving on the side street receiveshigh level priority (but lower priority levelthen emergency vehicle pre-emption).This TSP strategy does not include phaseskipping capabilities. Implemented on 15intersections throughout city.
A number of locations have left turnphase insertion. Left turn can be activatedas a lead or lag phase. Lead phase can beactivated by both buses and other vehi-cles, while lag phase can be activated onlyby buses.
Intersection pedestrian signal with busactuation is a rather rare concept. Thisintersection layout has a traffic light forthe main arterial but the side street has notraffic light; instead it has stop signs. Themain arterial always has a green lightunless a pedestrian pushes the button or abus is detected on the approach. Thisapproach is used in one intersection.
AAPP
PPEE
NNDD
IICCEE
SS
188 Y Transit Signal Priority Handbook
TRANSIT SIGNAL PRIORITY (TSP) SURVEY FORM

Agency:PACE Suburban Bus Service
City, State:Arlington Heights, IL
Contact:Taqhi Mohammed(847) [email protected]://www.pacebus.com
Background
Type of Transit:Bus
Date of implementation:1985
Number of routes:4 routes along one corridor
Physical Characteristics
General description of route:(geo-metrics, exclusive bus lanes, leftturn lanes)
Linear corridor; Demonstration project
Number of signalized intersections:12
Mixed flow or exclusive ROW:Mixed Flow
Number of lanes:N/A
Near or far side bus stops:N/A
Headways:N/A
Signal Controls
Centralized/Decentralized:N/A
Fixed/Actuated:N/A
Hardware:NEMA ASC-2 controllers by Econolite
Software:N/A
Vehicle Detection Type:LoopComm vehicle identification system
TSP Strategies Used
Early Green (Red Truncation)Green Extension
AAPP
PPEE
NNDD
IICCEE
SS
Transit Signal Priority Handbook Y 189
TRANSIT SIGNAL PRIORITY (TSP) SURVEY FORM

Agency:Pierce Transit
City, State:Tacoma, Washington
Contact:Eric Phillips(253) 983-2721
Background
Type of Transit: Bus
Date of implementation: 2002
Number of routes: 6
Physical Characteristics
General description of route: (geo-metrics, exclusive bus lanes, leftturn lanes)
All routes are corridor-based and operatealong a linear route.
Number of signalized intersections:There are 110 signalized intersectionsalong the 6 bus routes
Mixed flow or exclusive ROW:Currently, all buses operate within thegeneral purpose lanes.
Number of lanes:Typical sections range from 2-5 lanes
Near or far side bus stops:Both near and far side bus stops exist alongthe corridor, although there is a preferencefor far side stops. Many stops have beenrelocated to far side of the intersection.
Headways:15 to 30 minutes during the peak hour
Signal Controls
Centralized/Decentralized:Decentralized
Fixed/Actuated:Both fixed and actuated controls are usedwithin the corridor.
Hardware:Traconex TMP-390 (NEMA-TS-1controller),Econolite ASC-2 (NEMA TS-1controller),Peek LMD 9200 (NEMA TS-1 con-troller) used within the majority of corridors
Software:Various
Vehicle Detection Type:(Optical) Opticom and Loop (LoopComm)
TSP Strategies Used
Green ExtensionEarly Green (Red Truncation)Low priority preempt algorithm (LPPAwith the 390 controllers)
Additional Comments
TSP has been utilized very effectively byPierce Transit, which can be attributed inpart by early coordination between juris-dictions. The transit corridor encompass-es three different city governments, acounty government, and a state DOT. TheTSP program has not only decreased trav-el times among transit riders, but hasimproved the level of service at the inter-sections as well. Some problems wereencountered with buses’ optical detectionsystem activating the emergency vehiclepre-emption systems outside of the TSProutes.
Next Steps
Additional implementations are planned.
AAPP
PPEE
NNDD
IICCEE
SS
190 Y Transit Signal Priority Handbook
TRANSIT SIGNAL PRIORITY (TSP) SURVEY FORM

Agency:Port Authority of Allegheny County
City, State:Pittsburgh, PA
Contact:David Wohlwill, AICPLead Transit Planner(412) [email protected]
Background
Type of Transit:Bus
Date of implementation:Mid 1990’s - early 2000’s
Number of routes: 47
Physical Characteristics
General description of route:(geometrics, exclusive bus lanes,left turn lanes)
Signals at four locations in downtownPittsburgh to facilitate left turn move-ments for buses.
Liberty Avenue/Stanwix Street/ForbesAvenue for 3 eastern express routes
Smithfield Street and Fort Pitt Boulevardfor 22 southern local and express routesmost of which use the South Busway.
Liberty and Smithfield Street for11 localand express eastern routes most of whichuse the Martin Luther King, Jr. EastBusway. This signal facilitates movementsfor buses entering the Smithfield Streetbus lane.
Sixth Avenue and Grant Street for 9 east-ern routes. (Note these 9 routes areincluded in the 11 routes which pass throughthe Liberty and Smithfield intersection).
West Busway Entrance at West CarsonStreet for 11 routes to allow buses enter-
ing Carson Street from the West Buswayon their way to downtown Pittsburgh.
Number of signalized intersections:5
Mixed flow or exclusive ROW:Mixed flow at 3 intersections and exclu-sive ROW at 2 intersections
Number of lanes:Liberty Avenue/Stanwix Street/ForbesAvenue: Two lanes
Smithfield Street and Fort Pitt Boulevard:Two inbound lanes on Smithfield StreetBridge, three inbound lanes on Fort PittBoulevard; buses use one lane.
Liberty and Smithfield Street:Two travellanes and one left turn lane on LibertyAvenue and one lane on Smithfield Street.
Sixth Avenue and Grant Street: Two out-bound lanes on Sixth Avenue, two out-bound lanes on Grant Street.
West Busway Entrance at West CarsonStreet: One lane in each direction on WestBusway and two lanes in each directionon West Carson Street.
Near/Far Side Stops:Both near and far-side stops are onthese routes
Headways:Smithfield Street and Fort Pitt Boulevardis the busiest intersection in terms of thenumber of bus movements with 58 tripsduring a peak hour (almost one-minuteheadway).
Signal Controls
Centralized/Decentralized;Decentralized
Fixed/Actuated:Fixed
AAPP
PPEE
NNDD
IICCEE
SS
Transit Signal Priority Handbook Y 191
TRANSIT SIGNAL PRIORITY (TSP) SURVEY FORM

Hardware:Type 170 Controllers (Safetran)
Software:Wapiti
Vehicle Detection Type:Standard in-pavement loop for bus use only
TSP Strategies Used
Phase insertion is used at all four intersec-tions to prioritize heavy left turn move-ments in downtown Pittsburgh and at theWest Busway/West Carson Street intersec-tion to facilitate bus movements off theWest Busway.
Additional Comments
City of Pittsburgh owns and operates thesignals in downtown Pittsburgh.
The buses do not have equipment to acti-vate signals.
Port Authority has three busways. Busroutes operating on all three buswaysbenefit from the TSP applications.
Next Steps
1) Consider TSP as a component of on-street Bus Rapid Transit in Downtown toOakland Corridor, Port Authority’s mostheavily traveled corridor.
2) Pursue additional opportunities for TSPin downtown Pittsburgh.
AAPP
PPEE
NNDD
IICCEE
SS
192 Y Transit Signal Priority Handbook
TRANSIT SIGNAL PRIORITY (TSP) SURVEY FORM
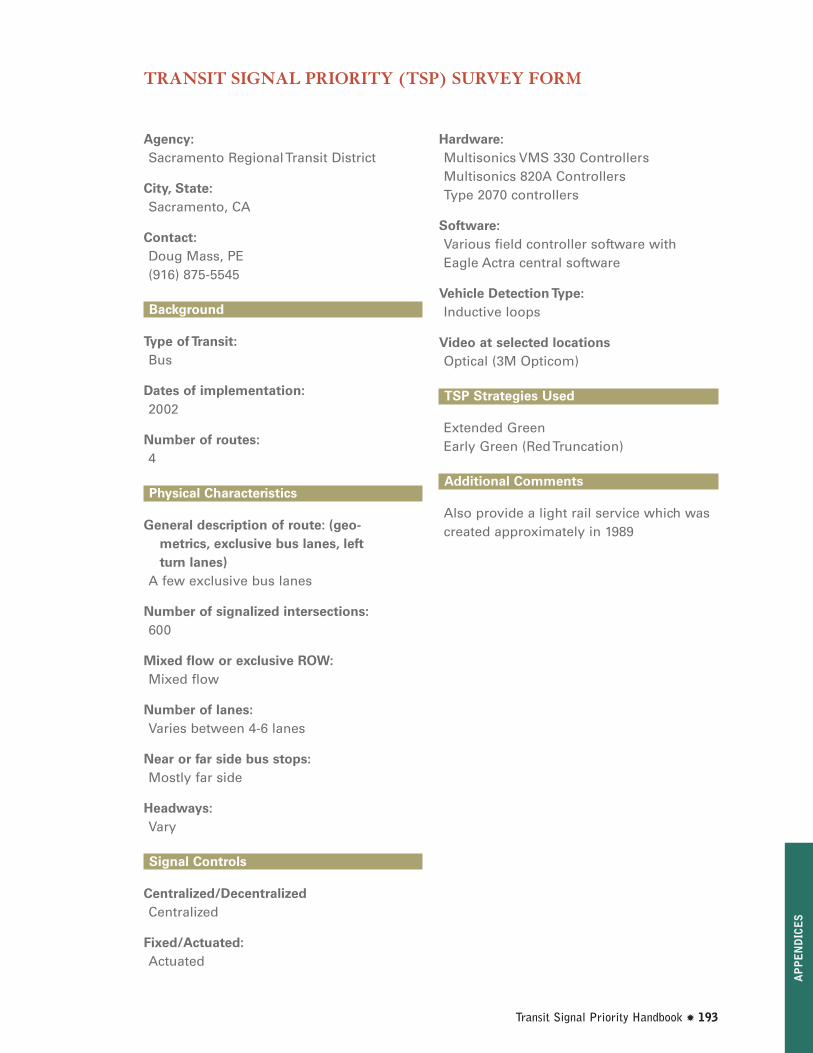
Agency:Sacramento Regional Transit District
City, State:Sacramento, CA
Contact:Doug Mass, PE(916) 875-5545
Background
Type of Transit:Bus
Dates of implementation:2002
Number of routes:4
Physical Characteristics
General description of route: (geo-metrics, exclusive bus lanes, leftturn lanes)
A few exclusive bus lanes
Number of signalized intersections:600
Mixed flow or exclusive ROW:Mixed flow
Number of lanes:Varies between 4-6 lanes
Near or far side bus stops:Mostly far side
Headways:Vary
Signal Controls
Centralized/DecentralizedCentralized
Fixed/Actuated:Actuated
Hardware:Multisonics VMS 330 ControllersMultisonics 820A ControllersType 2070 controllers
Software:Various field controller software withEagle Actra central software
Vehicle Detection Type:Inductive loops
Video at selected locationsOptical (3M Opticom)
TSP Strategies Used
Extended GreenEarly Green (Red Truncation)
Additional Comments
Also provide a light rail service which wascreated approximately in 1989
AAPP
PPEE
NNDD
IICCEE
SS
Transit Signal Priority Handbook Y 193
TRANSIT SIGNAL PRIORITY (TSP) SURVEY FORM

Agency:Santa Clara Valley Transportation Authority(VTA)
City, State:San Mateo County, CA
Contact:Casey Emoto(408) 321-5744 x5564
Background
Type of Transit:LRT
Bus
Date of implementation:Approximately 1990
Currently in the implementation stage
Number of routes:One main route with several extensionroutes added.Upon completion, the fullcorridor will be approximately 20 miles
Physical Characteristics
General description of route: (geo-metrics, exclusive bus lanes, leftturn lanes)
LRT service operates on exclusive ROW
The bus service is a cross-county routeoperating within three different agencies.
Number of signalized intersections:50+ TSP operation will be phased in, thefirst segment to include 27 signals over6 miles.
Mixed flow or exclusive ROW:Exclusive ROW
Mixed flow
Number of lanes:N/A
Typical section of roadway varies, oper-ates primarily on 4-lane arterials.
Near or Far Side Stops:N/A
All stops are far side stops
Headways:15 minute peak period headways
12-15 minute peak period headways
Signal Controls
Centralized/Decentralized:Decentralized
Fixed/Actuated:All actuated
Hardware:NEMA Type TS-2 controllers (McClainVector, Naztech, Traconex)
Software:NEMA software with external pre-emptionlogic controllers to perform the transit pri-oritization. Based on a modified versionof the CALTRANS C-8 software
Vehicle Detection Type:Loops
TSP Strategies Used
LRT
Full priority: permits the skipping of phas-es and the shortening of phases
Bus
Early green (Red Truncation)
Extended Green
AAPP
PPEE
NNDD
IICCEE
SS
194 Y Transit Signal Priority Handbook
TRANSIT SIGNAL PRIORITY (TSP) SURVEY FORM

Agency:Skagit Transit
City, State:Burlington, WA
Contact:Wade Mahala(360) 757-4433(360)336-6217 (City of Mt. Vernon)
Background
Type of Transit:Bus
Date of implementation:1993
Number of routes:10
Physical Characteristics
General description of route: (geo-metrics, exclusive bus lanes, leftturn lanes)
Mainline system – usage of right hand lanes
Bus service has recently been included inDOT planning – changes TBA
Number of signalized intersections:80
Mixed flow or exclusive ROW:Mixed flow
Near or far side bus stops:Near side bus stops
Headways:1-direction headways
Deadheads located about 40 miles eastof Burlington
Signal Controls
Centralized/Decentralized:Mostly centralized
Fixed/Actuated:Fixed
Vehicle Detection Type:Optical (3M Opticom)
TSP Strategies Used
Green ExtensionEarly Green (Red Truncation)
Additional Comments
Also provide a van pool service, a ride-chair service and a dial-a-ride service
AAPP
PPEE
NNDD
IICCEE
SS
Transit Signal Priority Handbook Y 195
TRANSIT SIGNAL PRIORITY (TSP) SURVEY FORM

Agency:Southeastern Pennsylvania TransportationAuthority (SEPTA)
City, State:Philadelphia, PA
Contact:John Bukowski(215) [email protected]
Background
Type of Transit:Trolley (Route 10)Trolley (Route 15)Bus (Route 52)
Date of implementation:Route 10 Trolley - Late 2003Route 15 Trolley - Late 2002Bus (Route 52) – Late 2005
Number of routes:2 Implemented; 1 being implemented
Physical Characteristics
General description of route: (geo-metrics, exclusive bus lanes, leftturn lanes)
Mixed flow
Number of signalized intersections:61 current; 24 additional planned for late 2005
Mixed flow or exclusive ROW:Mixed flow
Number of lanes:varies
Near/Far Side Stops:Both
Headways:New headways to be determined.Expecting 1-2 trolley vehicles and 1 buscould be removed.
Signal Controls
Centralized/Decentralized:Decentralized
Fixed/Actuated:Both. Intersection equipment is fixed,vehicle emitter actuates the cycle.
Hardware:Trolley routes: Type 170 ControllersBus: Not yet bid
Software:Trolley: BiTran 233 softwareBus: Proprietary
Vehicle Detection Type:Trolley: Optical.
TSP Strategies Used
Route 10 Trolley - Green Extension; EarlyGreen (Red Truncation)
Route 15 Trolley - Green extension is theonly TSP strategy being used due tominimum green requirements forpedestrian crossings.
Bus: Not yet bid
Additional Comments
Fiber Optic cable run through each loca-tion for City loop back to their TrafficControl Center.
Next Steps
Planning to go to a centralized system.
AAPP
PPEE
NNDD
IICCEE
SS
196 Y Transit Signal Priority Handbook
TRANSIT SIGNAL PRIORITY (TSP) SURVEY FORM

Agency:St. Cloud Metropolitan TransitCommission
City, State:St. Cloud, MN
Contact:Tom CruikshankDirector of Planning(320) [email protected]
Background
Type of Transit:Bus (Fleet of 31 buses)
Date of implementation:November 2002
Number of routes:18
Physical Characteristics
General description of route: (geo-metrics, exclusive bus lanes, leftturn lanes)
Traditional hub and spoke design withmost transfers occurring at the downtownSt. Cloud Transit Center with secondaryhub at St. Cloud State University.
Number of signalized intersections:89
Mixed flow or exclusive ROW:All buses operate in a mixed flow environ-ment.
Number of lanes:Routes vary from local streets to statehighways
Headways:1- hour headways off-peak and Saturdaywith 1/2-hour headways typical duringweekday peak hours.
Signal Controls
Centralized/Decentralized:Decentralized
Fixed/Actuated:Actuated
Hardware:Econolite ASC-2S (NEMA TS-2, Type I)
Software:Econolite customized TSP software.Initial software was based on theCermack Road, Chicago Area, IL applica-tion and was later upgraded to currentKing County, WA version.
Vehicle Detection Type:Optical (3M Opticom)
TSP Strategies Used
Green ExtensionEarly Green (Red Truncation)
Additional Comments
There are 2 documents available regard-ing St. Cloud’s TSP deployment; onedescribing a Pilot Study conducted in2000, the other a Deployment Study in2001. For this TSP project, most of thehardware was already in place, however28 intersections received new 3MOpticom pre-emption equipment and 30intersections received new Econolite ASC-2S controllers.
A Memorandum of Understandingbetween the MTC and local roadway juris-dictions (Two Cities, Two Counties andMn/DOT) proved to be an effective tool inthe success of the TSP implementation.
AAPP
PPEE
NNDD
IICCEE
SS
Transit Signal Priority Handbook Y 197
TRANSIT SIGNAL PRIORITY (TSP) SURVEY FORM

Agency:Tri-County Metropolitan Transit District(TriMet)
City, State:Portland, OR
Contact:Willie Rotich(503) [email protected]
Background
Type of Transit:
Bus
Date of implementation:2002
Blue Line opened in 1987Red Line opened in 2002Yellow Line opened in 2004
Number of routes:1
Physical Characteristics
General description of route: (geo-metrics, exclusive bus lanes, leftturn lanes)
Three bus routes service east-west move-ments and the airport.
Number of signalized intersections:Bus service includes 370 signals, howeveronly a minority of them have TSP.
Mixed flow or exclusive ROW:Some portion of the LRT are on dedicatedROW. The majority of the LRT and all ofthe bus service operates on mixed flowroadways.
Number of lanes:Data Not Available
Near/Far Side Stops:Data Not Available
Headways:Data Not Available
Signal Controls
Centralized/Decentralized:Decentralized
Fixed/Actuated:Data Not Available
Hardware:Type 170E Controller
Software:Wapiti
Vehicle Detection Type:Loops (LoopComm), Optical (3M Opticom)
TSP Strategies Used
The LRT preempts the signal via loopdetectors and VetagGreen ExtensionEarly Green (Red Truncation)One intersection has queue jump
AAPP
PPEE
NNDD
IICCEE
SS
198 Y Transit Signal Priority Handbook
TRANSIT SIGNAL PRIORITY (TSP) SURVEY FORM

Agency:Utah Transit Authority
City, State:Salt Lake City, UT
Contact:Richard Hodges(801) [email protected]
Background
Type of Transit:Bus
Date of implementation:Currently being installed (Summer 2004)
Number of routes:1 (prototype; enhancement pending)
Physical Characteristics
General description of route: (geo-metrics, exclusive bus lanes, leftturn lanes)
High volume.
Number of signalized intersections:12
Mixed flow or exclusive ROW:All buses operate in a mixed flow environ-ment.
Number of lanes:Typically 6 lanes with a center turn lane
Headways:Plan includes headways; Presently: 22 min (peak), 40 min (off peak)Future Plans: 15 min (peak), 30 min (off peak)
Signal Controls
Centralized/Decentralized:Centralized
Fixed/Actuated:Actuated
Hardware:Type 2070
Software:Central software = ICONS by Siemens
Local intersection controller software =NextPhase
Vehicle Detection Type:Optical (3M Opticom)
TSP Strategies Used
Green ExtensionEarly Green (Red Truncation)
Additional Comments
Light Rail uses the check in/check out system
The system is very similar to the systemimplemented in Los Angeles
Next Steps
TBA – pending results and observations
5-year plan includes 3 BRT lines as well as12 priority corridors
AAPP
PPEE
NNDD
IICCEE
SS
Transit Signal Priority Handbook Y 199
TRANSIT SIGNAL PRIORITY (TSP) SURVEY FORM

Agency:Washington Metropolitan TransitAuthority(WMATA)
City, State:Washington, D.C./SuburbanMaryland/Northern Virginia
Contact:Will Raine - ITS Coordinator, WMATA(202) [email protected]
Glen Hazinoziski – Project Manager forDemonstration ProjectWilbur Smith Company(703) 645-2982
Background
Type of Transit:Bus
Date of implementation:Currently being implemented (duringSummer 2004)
Number of routes:Four routes are being implemented aspart of this demonstration project.
Physical Characteristics
Number of signalized intersections:Depends on corridor
6 currently, 25 planned on Route 1 corri-dor in Fairfax County
Near Side / Far Side Stops:Data Not Available
Mixed flow or exclusive ROW:Mixed Flow
Number of lanes:Data Not Available
Headways:Data Not Available
Signal Controls
Centralized/Decentralized:Centralized
Decentralized on Georgia Avenue andRoute 1. The demonstration project willcommunicate with the traffic center inArlington, VA via a Remote DataManagement System (RDMS)
Fixed/Actuated:Fixed
Hardware:NEMA TS-2 ( Eagle EPAC 300)
Software:SCOOT Adaptive Control Software beingcustomized as part of this demonstrationproject by Siemens
BiTrans on Georgia Avenue
Vehicle Detection Type:Optical (3M Opticom)
TSP Strategies Used
Green ExtensionEarly Green (Red Truncation)
Additional Comments
WMATA is implementing TSP along fourmajor corridors in the metropolitanWashington region as part of a demon-stration project with 3M, Siemens and TheWilbur Smith Company. The corridorsinclude Georgia Ave., Columbia Pike, andthe Route 1 Corridor.
The projects are still underway, installa-tion of the emitters may start as early asSeptember 2004 along the Columbia PikeCorridor.
AAPP
PPEE
NNDD
IICCEE
SS
200 Y Transit Signal Priority Handbook
TRANSIT SIGNAL PRIORITY (TSP) SURVEY FORM
