transition in iran’s electricity market considering the
TRANSCRIPT

Transition in Iran’s Electricity Market Considering the Policies on Elimination of Electricity Subsidies: System Dynamics Application
M. Pourhossein, N. Nahavandi*, M. K. Sheikh-El-Eslami
Mehdi Pourhossein, Department of Industrial Engineering, Tarbiat Modares University, Tehran, Iran Nasim Nahavandi, Department of Industrial Engineering, Tarbiat Modares University, Tehran, Iran M. Kazem Sheikh-El-Eslami, Department of Electrical Engineering, Tarbiat Modares University, Tehran, Iran
KKEEYYWWOORRDDSS ABSTRACT
Because of electricity subsidies, electricity price in Iran is much lower than its real value, and the growth of electricity demand is much more than its rational rate, which in turn implies ever increasing investment in the electricity section by the Government. Therefore, the recent Government policies are based on elimination of electricity subsidies, followed by commissioning complete electricity market to attract investors in the power industry. In this paper, a model is developed for electricity demand prediction and evaluating Iran's current electricity market and complete electricity market to deal with optimistic and pessimistic electricity demand. Hence, a system dynamics framework is applied to model and generate scenarios because of its physical capability and information flows that allow understanding the behavior of nonlinear dynamics in uncertain conditions. To validate the model, it was compared with the available actual data within 21 years, since (1988-2008). After model validation, two scenarios are evaluated based on the influence of eliminating electricity subsidies on electricity demand in short-term and long-term and then commissioning of the probable complete electricity market is evaluated.
© 2014 IUST Publication, IJIEPR, Vol. 25, No. 4, All Rights Reserved.
11.. IInnttrroodduuccttiioonn
Iran’s electricity demand is growing very rapidly. Factors such as population growth, economic growth, and rapid urbanization rate have played role in this regard. Statistics show that Iran’s electric energy consumption has increased by 8.7 times since 1980. However, during this period, the power generation, the
**
Corresponding author: Nasim Nahavandi Email: [email protected] Paper first received Jun. 30, 2013, and in accepted form July, 05, 2014.
installed generation capacity, the transmission capacity and the length of the lines have increased too. In this period, the number of electricity customers was unexpectedly increased, such that per capita electricity demand was increased to 143 kWh in 2006, while per capita electricity generation was 122 kWh in this period [1], the power units should estimate the accurate amount of required power in order to supply the total electric demand. Offering electricity to the consumers with a price much lower than the real one is among the major factors leading to increase of energy consumption rate. The difference between these two
System dynamics, Electricity market, Electricity subsidies, Investment
DDeecceemmbbeerr 22001144,, VVoolluummee 2255,, NNuummbbeerr 44 pppp.. 226633--227700
hhttttpp::////IIJJIIEEPPRR..iiuusstt..aacc..iirr//
IInntteerrnnaattiioonnaall JJoouurrnnaall ooff IInndduussttrriiaall EEnnggiinneeeerriinngg && PPrroodduuccttiioonn RReesseeaarrcchh
pISSN: 2008-4889

M. Pourhosseini, N. Nahavandi, M. K. Sheikh-El-Eslami Transition in Iran’s Electricity Market Considering 264
IInntteerrnnaattiioonnaall JJoouurrnnaall ooff IInndduussttrriiaall EEnnggiinneeeerriinngg && PPrroodduuccttiioonn RReesseeaarrcchh,, DDeecceemmbbeerr 22001144,, VVooll.. 2255,, NNoo.. 44
prices is paid by the Government as subsidies. To deal with electrical energy consumption, Iran’s Government has to construct more plants. An increase in the number of plants as well as paying electrical energy subsidies by the Government imposes severe financial pressures to the Government. The recent policies of the Government are focusing on elimination of electricity subsidies and then commissioning the complete electricity market through absorbing investors in electrical industry to reduce financial pressures. The new policy will make the changes and complexities in power system. Complexity of the system makes sustainable policy decision making a difficult task. Complexity of this system primarily comes from the existence and interactions of non-linear and dynamic variables including various stocks of electricity generation capacity, restricting and regulatory Government, price dynamics, and advances and challenges in technologies for electricity generation, consumption. Understanding of such complex policy issues and decisions necessitates the use of system simulation [2-3].Due to these reforms, some complementary modeling approaches have been developed in order to analyze the electric power system operation and planning [4]. The dynamic nature of the technical and economic systems arisen from combination of electric power systems and electricity markets, time delays of systems, and stochastic uncertainty of parameters can be well addressed in the time simulation method. System dynamics (SD) modeling [5] has been extensively used in order to analyze and examine the investment trend and the consequences of imposing different regulated policies in the electricity market considering the dynamic behaviors of investors in market and time delays such as permission acquiring time and construction time.SD has a wide range of applications, including several power system problems [6]. In this research, a SD modeling was proposed to model the present Iranian electricity market and its potential complete commissioned market in future years. For this purpose, first, the electricity demand is modeled with more details and then changing dynamics in transition of Iran’s electricity market (current electricity market & complete electricity market) is analyzed. Besides, based on the recent policies of the Government for improving the electricity market structure and along with the elimination of electricity subsidies (short-term or long-term), 2 scenarios were proposed in this research. Finally, simulation results describing the behavior induced by the interaction between the system variables over time - in and across the scenarios- were discussed. The materials presented in this paper are organized as follows: In Section 2, Literature review of the paper are studied. Section 3 describes a summary of revolutions in transition from traditional market to complete electricity market in Iranian electricity market. In
Section 4, Iranian electricity energy is described. Section 5 explains the importance of system dynamics modeling and its application in electricity market. In section 6, our model and its boundary system will be introduced. Section 7 deals with the cause and effect diagram, the model of Iran’s current electricity market, and the model of complete electricity market. In section 8, the simulation results are discussed and different scenarios in Iran's electricity market in future years are evaluated. Also in this section, the sensitivity analysis of parameters is done to show the effects of different parameters on Market Dynamics. Finally, a summary of the results is given in Section 9.
2. Literature Review Dynamic aspects of electricity market using SD
concept were first considered in the UK market [7-8] where reliability-based payment was used as a capacity mechanism. SD methodology has been used to analyze privatization and deregulation processes of electricity markets. Ford used this model to study the dynamics of new power plants construction and their boom and bust cycling nature in the west US market [6]. By SD method, also causes leading to the critical situation in California market during 2000 and 2001 were addressed [9]. Some other electricity markets, in which SD concept was applied to study their dynamic natures, include: Nord Pool Electricity Market [10-12], Canada [13], Colombia [14], Spain [15], Swiss [16], Korea [17], Pakistan [18], Portugal [19] and Turkey [20]. Olsina et al. depicted a general and extensive model (irrespective of capacity mechanism) for market simulation. This model was focused on the formulation of the mathematical framework [21]. A mechanism for capacity payment based on SD modeling was presented by Assili et al [22]. Kadoya et al considered the northeastern U.S. markets with an emphasis on energy and capacity markets [23]. An approach was also introduced in Portugal to help market agents to develop long-term generation investment plans [24]. In Iran, a simulation model is proposed by Hasani and Hosseini, which helps to get insights in how different capacity mechanisms can be employed in a competitive electricity market to create investment incentives with effective return of capital costs while ensuring the reliability requirements [25]. The stochastic nature of renewable energy recourses such as wind power technology has been also considered in the simulation- based model [26-27]. Also Hasani and Hosseini developed a system dynamics model to analyze the impacts of different kinds of capacity payment as investment incentive mechanisms in Iranian electricity market [28]. Different methods can be applied to estimate the electricity demand based on economic indicators. Some of these methods are based on non-linear model [29-34] while some others are based on linear model [35]. For forecasting problems, several methods including regression and time series methods have

265 M. Pourhosseini, N. Nahavandi, M. K. Sheikh-El-Eslami Transition in Iran’s Electricity Market Considering
IInntteerrnnaattiioonnaall JJoouurrnnaall ooff IInndduussttrriiaall EEnnggiinneeeerriinngg && PPrroodduuccttiioonn RReesseeaarrcchh,, JJuunnee 22001144,, VVooll.. 2255,, NNoo.. 22
been suggested so far [36]. Kermanshahi investigated the problem of long-term load forecasting of total amount of power demand up to year 2005 for nine Japanese power utilities [29]. Also Kermanshahi and Iwamiya proposed a long-term load forecasting method [30]. In this method, two different artificial neural networks (ANN) including a recurrent neural network (RNN) and a multi-layer feed-forward network with back-propagation (BP) learning algorithm were used. They also reported that in short-term load forecasting, weather condition has significant influences on peak loads, while in long-term load forecasting, economic factors play an important role. Barakat and Al-Rashed, described an extended logistic model with varying asymptotic upper bound for long-range peak demand forecasting, However, in their work, a large error associated with some years peak demand was reported [31]. Erdogdu focused on the electricity demand in Turkey by presenting an electricity demand estimation and forecast using co-integration analysis and Autoregressive Integrated Moving Average (ARIMA) modeling [37]. Amjadi estimated the electricity demand of Iran based on economic indicators using Particle Swarm Optimization (PSO) algorithm. They used genetic algorithm (GA) and PSO to validate the results obtained. The results showed that PSO is a useful optimization tool for solving the problem and can be used as an alternative solution to estimate the country’s future electricity demand [38].In other research sadeghi estimated the per capita consumption of electricity in residential sector based on economic indicators in Iran. The Genetic Algorithm Electricity Demand Model (GAEDM) developed based on the past data using the genetic algorithm approach (GAA) [39]. 3. Revolutions in Transition from Traditional
Market to Complete Electricity Market Competitive advantages in Power Industry
Attempt to create competition in the electricity market is mainly due to this fact that competition has
more advantages over monopoly regulations. Generally, due to high investment costs, the Government will face heavy financial burden. As a result, a movement has been initiated a movement toward deregulation and privatization. Deregulation has allowed competitive energy suppliers to enter the markets and offer their energy supply products to consumers. Energy prices are not regulated in these areas and consumers are not forced to receive supply from their utility. In deregulated markets, consumers can choose their supplier, similar to other common household service providers. The stated rationale for deregulation is often that fewer and simpler regulations will lead to a raised level of competitiveness, therefore higher productivity, more efficiency and lower prices overall. Opposition to deregulation may usually involve apprehension regarding environmental pollution and environmental quality standards (such as the removal of regulations on hazardous materials), financial uncertainty, and constraining monopolies. Deregulation can be distinguished from privatization, where privatization can be seen as taking state-owned service providers into the private sector [1]. Electricity industry regulations in Iran need to change for transition in market. The expected changes in the case of introduction of competition in the market are as follows:
(a) After the privatization, companies have been rushing to invest in Power Generation with in goal of maximum profit;
(b) Shortening of the planning horizon due to elimination of return to guaranteed capital existing before the introduction of competition; and
(c) Appearance of interrelationships and strategic interplays between the companies that are in the process of production planning. The changes occurred because of deregulation of investment in generation capacity are shown in table 1 [23].
Tab. 1. Impact of deregulation on investment [23]
After deregulation Before deregulation Problem
Profit Total cost of load cover Choosing the type of power plant
Most optimistic project GEP Participation in the total capacity
Marginal cost+α Marginal cost Bid price
Delayed investment for guaranteed profit
GEP-based investment Unreliability
Profit Variable costs of other plants and O&M cost
Exit from the system
Expected profit GEP Project cancellation
Floating confidence Perfect confidence Long-term capacity contracts

M. Pourhosseini, N. Nahavandi, M. K. Sheikh-El-Eslami Transition in Iran’s Electricity Market Considering 266
IInntteerrnnaattiioonnaall JJoouurrnnaall ooff IInndduussttrriiaall EEnnggiinneeeerriinngg && PPrroodduuccttiioonn RReesseeaarrcchh,, DDeecceemmbbeerr 22001144,, VVooll.. 2255,, NNoo.. 44
4. Iran’s Electricity Section Regarding the importance of energy sources -
especially electricity - in human societies, it is essential to fully comprehend dimensions of supply and demand for this critical element. In addition, the lack of resources and required power plants for electricity generation illuminates the necessity of surveying supply and demand as well as the consumers reaction versus price changes; this, in turn, makes it feasible for correct planning and decision making about this source of energy. After the Islamic Revolution in 1979, Iran had to face another challenge: the war against Iraq (1980-1988). This challenge forced the Government to help people by granting subsidy to essential goods such as bread, drugs, and different kinds of energy - especially electric power, which is one of the major industries in every country. This policy helped people have an easier life during the war; however, as the famous law of supply-demand tells us, the lower the price of any good, the higher demand for that good is predicted, and this low price of energy made Iran one of the most and worst energy consumers in the world. This high rate of consumption will cause lots of problems such as lack of electricity and financial pressure on the Government. For this reason, the Government is to launch a complete electricity market but with prices much lower than the real price of electricity. Thus, it is necessary to sell the electricity to the public with its real price which takes a particular deal of time. According to the bills passed in Iran, the Government is obliged to adjust the average interior sale of electricity in a way that, at the end of its 5-year program, it reaches the tariff price. Besides, the Government has to annually add 1% to the outputs of plants and reduce the wastes of transmission and distribution networks up to 14% at the end of the 5-year program. Here, the effects of electricity subsidies elimination on capital economic factors, social justice, production, and electricity supply and consumption are discussed: 4-1. The Effect of Subsidies Elimination on Capital Economic Factors Following the implementation of this project and increase of fossil fuels and electricity prices and regarding the excessive use of the energy in industry, the tariff price of agricultural and industrial products would have a significant rise, which in turn results in increase of prices and inflation, affecting on the tariff price of all products. Besides, this motivates the producers to use manufacturing technology with low energy consumption, which leads to increased productivity. Completion of this project will result in less intervening of the Government in the economy; this will in turn lead to partial prices improvement, decrease of subsided products hoarding, and clarification of business atmosphere. An improved business atmosphere results in the growth of
investment, employment and increased per capita income.
4-2. The Effect of Subsidies Elimination on Social
Justice Allocation of huge amount of income obtained by price realization to the low-income classes of the society – in order to compensate the effect of prices inflation – can play a significant role in increasing their purchase ability and social justice realization.
4-3. The Effect of Subsidies Elimination on
Electricity Production and Supply One of the expectations of electricity subsidies elimination is to increase electricity products in the country. Through reducing Government participation and modification of partial prices that leads to realization of electricity price, the private section will be motivated to enter to the electricity market and invest in this area. In addition, the Government can allocate parts of the incomes obtained from price liberalization to increase of electricity production in the plants and reduction of electricity loss in the transmission networks. Furthermore, by investing in the construction of plants with new forms of energy (nuclear, combinational cycle, and wind), it is expected that production and export of electricity will increase. Increase of prices in fossil fuels, as one of basic materials for electricity production in the plants, leads to a significant rise in the tariff price of electricity, which will result in increased electricity prices and its subsequent effects.
4-4. The Effect of Subsidies Elimination on Electricity
Consumption Increase of energy share in the tariff price of products causes the industry the apply methods and machineries with lower energy consumption. Besides, the change in energy prices and public’s economic ability play a key role in their application of electrical energy. Partial modification of prices and increased economic prosperity result in increase of productivity in the industrial and agricultural sections as well as increase of electricity consumption. Another consequence of subsidies elimination is increase of electricity alternative price, e.g. gas price, which can lead to increase of energy consumption due to mutual relationship between gas and electricity consumption. Electricity market in Iran will be prepared to be converted into complete electricity market after elimination of energy subsidies. As previously noted, attracting the investors is another factor considered as a critical element in complete electricity market. Government should provide sufficient support through allocation of incentives to attract investors for power plant construction and electricity generation to cope with growing electricity demand in the coming years.

267 M. Pourhosseini, N. Nahavandi, M. K. Sheikh-El-Eslami Transition in Iran’s Electricity Market Considering
IInntteerrnnaattiioonnaall JJoouurrnnaall ooff IInndduussttrriiaall EEnnggiinneeeerriinngg && PPrroodduuccttiioonn RReesseeaarrcchh,, JJuunnee 22001144,, VVooll.. 2255,, NNoo.. 22
In the recent years, a big share of Iran’s needed electricity is being generated by thermal power plants (hard-coal(HC) power plants, gas turbine(GT) power plants, gas-fired combined cycles(CCGT) power plants), while few percent of it is generated by diesel, hydro and nuclear power plants. Fig. 1 shows the share of plants in power generation in 2008. As show, water electricity, and electricity produced from renewable sources form a small share of total electricity production in recent years. However, in the following years, this share will be even more negligible due to increasing demand for electricity and reduction in natural resources required for other types of power plants.
Fig. 1. Share of Power Ministry & Private sector in
Power generation [1]
Electricity customers in Iran are divided into 5 sections: household, industrial, agricultural, commercial, and public. Fig. 2 shows the share of different sections of electricity consumption in 2008. In each sector, price of tariff is different with that of the others, but in all of them, the prices are much lower than the actual prices, and consumption is much more than the standard rate. Internal electricity consumption rate and the rate of loss of electrical power in transmission and distribution networks have been added to other sectors as a part of the country's electricity demand.
Fig. 2. Share of different sections of electricity
consumption [1]
5. System Dynamics Approach In this study, the selected modeling was a system
dynamics (SD) approach, which was formerly applied
in 1970 by Forrester at MIT for economic and management systems. In general, this approach is based on identification of the system structure and logic of the causal interrelationships between different components of the system to respond to its dynamics. In mathematical terms, this method is the result of formulated differential equations that show system’s behavior. Through SD approach, power market dynamics is described with nonlinear differential equation used for system feedbacks, delays, stock and flow structure and, non-linears. Evaluation of power market is determined by modeling the variables that directly affect supply and demand. Development process of dynamic systems modeling can be divided into five stages [5]:
1. Elaborate description of the problem; 2. Defining the theories and dynamic hypotheses
about the causes of leading to the above mentioned problem;
3. Building a simulation model to test the above hypothesis;
4. Testing the model to be ensured of its performance accuracy; and
5. Design of policies and their evaluation by the simulation model.
Hypothesis Iran's electricity market is in a phase of transition to complete electricity market. The considered simulation period of the electricity market and its income are controlled by the Government. In this research, some strategies have been planned for Iran’s current market as follows: 1- In Iran’s current market, the real price is not
defined based on the interaction between supply and demand.
2- Decision to build power plant is not planned based on regarding the market prices and calculation of the expected profits. The Government itself constructs thermal power plants to deal with increasing electricity demand at any time.
3- About 85% of Iran's share of electricity generation has been done by thermal power plants, where the share of each power plant was almost constant.
4- For estimation of the annual production capacity, fixed reserve margin of 30% in simulation period and 15 to 20% in the forecast period are considered to deal with the demand growth, and based on this estimation, the new plants will be constructed.
6. System Boundary
System boundary and system variables are defined according to the assumptions considered in the previous section. Subsystems in the originally developed model are electricity demand, supply and price.

M. Pourhosseini, N. Nahavandi, M. K. Sheikh-El-Eslami Transition in Iran’s Electricity Market Considering 268
IInntteerrnnaattiioonnaall JJoouurrnnaall ooff IInndduussttrriiaall EEnnggiinneeeerriinngg && PPrroodduuccttiioonn RReesseeaarrcchh,, DDeecceemmbbeerr 22001144,, VVooll.. 2255,, NNoo.. 44
Fig. 3. The summery of system boundary.
Exogenous variables of this model were GDP,
population, Government policies and energy resources. Since the electricity market is monopoly, decisions to create new capacities are taken without any restriction on power plant investment costs. As a result, cost of construction and utilization of power plants are considered as exogenous variables during the simulation process. During the forecast, costs – as an endogenous variable - are effective on the investment decisions after launching complete electricity market. Endogenous variables are divided into two sections. The first section is related to demand subsystem, which in turn includes different sections of electricity consumption. In this section, such variables as electricity subsidies paid to people, real price and electricity tariff price are also considered. The second
section deals with supply subsystem that includes variables determining the electricity supply such as thermal plants construction time, life time of plants, reserve margin, generation capacity of thermal plants, capacity construction, maximum peak, total cost and Pool price. All endogenous variables interact with each other and constitute a system, aiming to supply the electricity. The variables of such a system are shown in Fig. 3.
7. Model Description 7.1. Electricity Demand
Fig. 4 presents the causal-effect diagram of electricity demand.
Income PerCapital
Population
GDP
Electricity Tariff
Household ElectricityDemand
Agricultural ElectricityDemand
Commerical ElectricityDemand
Industrial ElectrictyDemand
+
+
-
Plant InternalConsumption Rate
NetworkConsumption Rate
Total ElectricityDemand
+
Electricity Subsidy
Real ElectricityPrice
+
-
+ +
+
+
IndustrialTecnology
-
+
Fig. 4. Causal- effect diagram of electricity demand
269 M. Pourhosseini, N. Nahavandi, M. K. Sheikh-El-Eslami Transition in Iran’s Electricity Market Considering
IInntteerrnnaattiioonnaall JJoouurrnnaall ooff IInndduussttrriiaall EEnnggiinneeeerriinngg && PPrroodduuccttiioonn RReesseeaarrcchh,, JJuunnee 22001144,, VVooll.. 2255,, NNoo.. 22
Hypothesis of dynamic of system of Fig. 4 can be expressed as follows: Along the increase in per capita income (based on the economic growth pattern of achieving an optimal level of per capita income within the specified time of the program), household electricity consumption pattern will change. This increase of per capita income coupled with increase of population growth - considering the variable of growth rate within the forthcoming years – leads to increase in the total household electricity consumption. Besides, industrial growth and increase in total GDP result in a growth in total industrial electricity consumption. Development of production technologies may lead to modification of electricity consumption pattern. As the last component of electricity consumption, agricultural electricity consumption has a constant growth, which is independent of GDP value and shows limited growth regarding its mechanization process in the forthcoming years. Moreover, public and commercial electricity consumption has a constant growth. The total amount of consumption can be calculated through summing the above-mentioned four consumptions, considering the internal power consumption coefficient and the rate of drop distribution network. In this study, quantitative relationships between the system components were extracted from Iran’s energy balance reports [1]. 7-1-1. Population The analysis begins with the presumed population of 51 million and the population growth rate of 1.8% [38]. Although the characteristics of population’s age distribution, in terms of total forming population in the household and supplying new housing, can have a significant impact on the consumption aspect, due to some considerations, this effect was ignored.
7-1-2. Per Capita income Growth To determine an appropriate pattern for economic growth, there is a need for a comprehensive study of
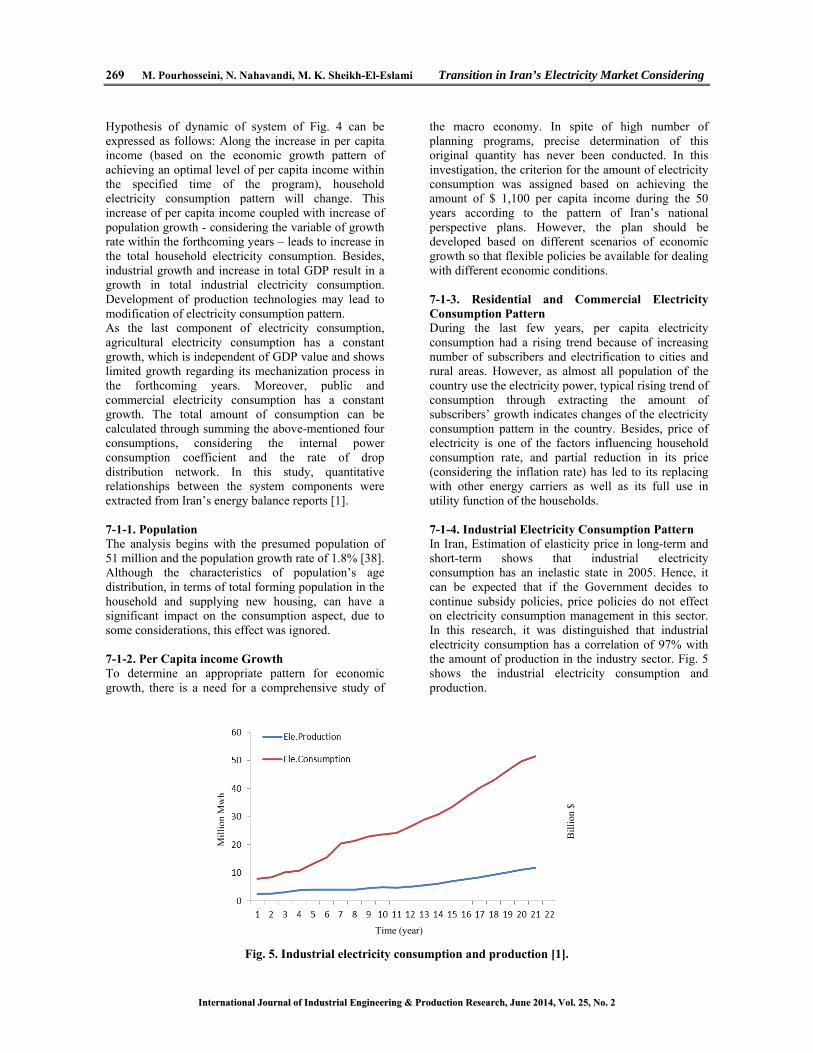
the macro economy. In spite of high number of planning programs, precise determination of this original quantity has never been conducted. In this investigation, the criterion for the amount of electricity consumption was assigned based on achieving the amount of $ 1,100 per capita income during the 50 years according to the pattern of Iran’s national perspective plans. However, the plan should be developed based on different scenarios of economic growth so that flexible policies be available for dealing with different economic conditions. 7-1-3. Residential and Commercial Electricity Consumption Pattern During the last few years, per capita electricity consumption had a rising trend because of increasing number of subscribers and electrification to cities and rural areas. However, as almost all population of the country use the electricity power, typical rising trend of consumption through extracting the amount of subscribers’ growth indicates changes of the electricity consumption pattern in the country. Besides, price of electricity is one of the factors influencing household consumption rate, and partial reduction in its price (considering the inflation rate) has led to its replacing with other energy carriers as well as its full use in utility function of the households. 7-1-4. Industrial Electricity Consumption Pattern In Iran, Estimation of elasticity price in long-term and short-term shows that industrial electricity consumption has an inelastic state in 2005. Hence, it can be expected that if the Government decides to continue subsidy policies, price policies do not effect on electricity consumption management in this sector. In this research, it was distinguished that industrial electricity consumption has a correlation of 97% with the amount of production in the industry sector. Fig. 5 shows the industrial electricity consumption and production.
Fig. 5. Industrial electricity consumption and production [1].
Mil
lion
Mw
h
Bil
lion
$
Time (year)

M. Pourhosseini, N. Nahavandi, M. K. Sheikh-El-Eslami Transition in Iran’s Electricity Market Considering 270
IInntteerrnnaattiioonnaall JJoouurrnnaall ooff IInndduussttrriiaall EEnnggiinneeeerriinngg && PPrroodduuccttiioonn RReesseeaarrcchh,, DDeecceemmbbeerr 22001144,, VVooll.. 2255,, NNoo.. 44
Fig. 6. Ratio of industrial consumption to production
Here, the key fact is that with the elapse of time and change in the type of industrial products from mass scale and high energy consuming products to compact products with high added value, on the one hand, and improvement of production processes toward saving electricity energy consumption, on the other, energy consumption trend will decrease for the same added value (Fig. 6). In addition, industry share in GDP must have an ascending trend; this is due to this fact that physical and climatic conditions limit agricultural production and, as a result, service sectors will be limited to have high growth rates. Although quantitative analysis of the above issue requires further analysis, in this study, industry growth was assumed as 12 % from the start of simulation to nearly 40% at the end of the simulation process.
7-1-5. Plant Internal Consumption Rate and Network Consumption Rate Plant internal consumption rate and network consumption rate are other crucial factors in estimation of the total electricity consumption. These two parameters rise by increasing of both the life of power plant and network equipment. Though policies of the Ministry of Energy in utilization of the power plants and networks are determinant of variation in the above mentioned coefficients, in this model, quantitative amount of these two parameters were assumed as a ratio of total electricity consumption (20 % in the start of the simulation to 30 % at end of simulation).
7-2. Electricity Price in Iran’s Power Market A main loop in the model includes household electricity tariff and real electricity price (Fig. 3). Due
to inelasticity of industrial, agricultural and commercial sectors upon electricity price, the effect of price changes on these sectors was disregarded and the effect of household electricity tariff on household consumption was assessed. Since tariff price of electricity supply is much lower than its real price, the Government pays for this difference to the people as subsidies. Dynamical theory of this section is expressed as: “the much the real price of electricity increases, the more subsidies for the increased cost of electricity should be paid by the Government to reduce the huge financial pressure from on the public”. Since the Government suffers significant financial pressures, it has to increase the electricity tariff price, which in turn leads to reduction of the subsidies. Therefore, tariff price of electricity will be close to its real price. Another factor resulting from the changes in household electricity prices is the demand for electricity; as the demand for electricity increases, the tariff price of electricity reduces. In the model designed in this study, tariff price is a function of power consumption.
7-3. Iran's Electricity Market Mechanism In survey of capacity dynamic required for country, a balancing loop (Fig. 7) was developed. The dynamic hypothesis in this section is based on this principle that with increase of electricity demand, the needed reserve electricity will be lowered. As a consequence, the Government will require new capacities to build new power plants and, after the delay time for plant construction and power generation, the capacity of production will the finally, increased due to the raise of reserve electricity. This cycle still continues as a loop.

271 M. Pourhosseini, N. Nahavandi, M. K. Sheikh-El-Eslami Transition in Iran’s Electricity Market Considering
IInntteerrnnaattiioonnaall JJoouurrnnaall ooff IInndduussttrriiaall EEnnggiinneeeerriinngg && PPrroodduuccttiioonn RReesseeaarrcchh,, JJuunnee 22001144,, VVooll.. 2255,, NNoo.. 22
Max Load
Reserve Margin
Rate of Expected Growthof the Maximum Load
ConstructionCapacity
GenerationCapacity
+
RequiredCapacity -
+
+RetirementCapacity-
+
Total ElectricityDemand
+
+
Load Factor-
Fig. 7. Causal loop of generation capacity in Iran’s power market
Generation capacity is obtained from aggregation of the electricity producers, so it can be considered as stock variable in which annual production is the input rate and depreciation of the plant is the output rate. In addition, developing capacities are considered as stock variable, while required annual capacities that decision-makers consider to cover the demand growth are regarded as the input rate. After time elapse needed for construction of power plants, the available of electricity capacity is obtained, which is the output rate for capacity in construction and the input rate for stock variable (i.e. Generation capacity). Using the electricity demand forecast in the previous section and considering the load factor of 0.7, ("Load Factor" is an indicator of how steady an electrical load is over time. If your electric billing rate includes both Energy (kWh) and Demand (kW) charges, your load factor can be calculated by the following formula: L.F. (%) = [(Total kWh)/(# Days in Bill Cycle x 24 hrs/day)]/[Peak kW Demand]), maximum annual load can be calculated. After estimating the maximum load
and its difference with the total generation capacity, the required capacity can be determined. When the required capacity is determined, considering the Generation Expansion Planning (GEP), it must be noticed that a share of this capacity is for thermal power plants whose share has not been less than 85% within the past 21 years. Nevertheless, a share of this generation capacity is provided by hydropower plants and the electricity produced from renewable sources, which consists of a small share of the total production. In the recent years, with the increase of demand for electricity, on the one hand, this amount will be reduced more, and shrink of natural resources needed for other types of power plants, on other, this amount will be reduced more and more. Regarding the Government’s investment annually, to determine the exact share of thermal power plants, planning for electricity generation is needed – which is not the concern of this research. Stock-flow model of the mentioned dynamic is presented in Fig. 8.
Max Load
Reserve Margin
Required Capacity
Demand
Load GrowthCoefficient
Complete TimeTime to Adjust Life Time of Plant
Other Plants
Simulated GenerationCapacity
Thermal PlantsShare
LF
Generation Capacity(MW)Capacity in Construction
Thermal Plants Complete Rate Retirement RateNew Capacity
Fig. 8. Stock-flow diagram of generation capacity

M. Pourhosseini, N. Nahavandi, M. K. Sheikh-El-Eslami Transition in Iran’s Electricity Market Considering 272
IInntteerrnnaattiioonnaall JJoouurrnnaall ooff IInndduussttrriiaall EEnnggiinneeeerriinngg && PPrroodduuccttiioonn RReesseeaarrcchh,, DDeecceemmbbeerr 22001144,, VVooll.. 2255,, NNoo.. 44
Max Load (KW)
Reserve Margin
ConstructionCapacity
GenerationCapacity
+
+
RetirementCapacity
-
Household ElectricityDemand
Total ElectricityDemand
+Real Electricity
Price
+
Expected PoolPrice
InvestmentDecision
InvestmentPermmision
ExpectedProfitability
Pool Price
+
+
+
+
+
+
Pollution Tax
Fuel Price
Investment Cost
-
Trans Price
LOLP-
+
Maintenance Cost
Marginal Cost
-
++
+
Loading Factor
-
-
GDP
+
Industrial.Ele.Demand
Com & Pub.Ele.Demand
Agri.Ele.Demand+
Internal & NetConsumption Rate
Tech
-
Fig. 9. Causal- effect diagram of complete power market
7-4. Complete Electricity Market Mechanism Fig. 9 presents the causal-effect diagram of complete electricity market.
7-4-1. Price Determination Process in Complete Electricity Market Pool price, which equals the marginal cost of the most expensive running generator, is obtained from the electricity supply and demand curves.
7-4-2. Effect of Reliability on the Average Price: In case of contingencies, supply of the total demand may be a huge task. In such conditions, the market price may rise to abnormal values. Some markets have adopted a cap price to hedge high electricity prices in such cases. This price may be equal or less than the Value of Lost Load (VOLL). In this study, it was assumed that VOLL is equal to the cap price assigned by the regulator. The assumption of offering the cap price by suppliers during inadequacy of the supply may be a reasonable strategy and should be seriously considered. In this study, to include the effect of reliability on the average cost-based price, a new concept, namely “probability based supply curve” was introduced by using equation 1 in Table 2. In fact, this equation is the stochastic expectation of the price between two possible scenarios when the generation supplied to the market meets the total demand while the supplied generation does not meet the total demand because of unpredictable events. Since, LOLP depends on the reserve, it is obvious that the new prices will also depend on it and will increase by decrease of the reserve. Generation Total price of in this method can be defined using equation 2 in Table 2.
7-4-3. Reliability Consideration (LOLP Function): In this research, some simplifications were made to calculate LOLP. These assumptions are reasonable and adequate in long-term simulation of the market [21]: * All generating units were assumed to have the same capacity, which is calculated using the weighted average of typical capacities of different technologies. * A two-state probabilistic generation model was assumed. * Equal forced outage rate (FOR) values were assumed for the generating units. Then LOLP can be calculated using a binomial distribution function as equation 3 in Table 2; where, p is FOR; q is 1-FOR [25]. 7-4-4. Investment Process In this study, it was assumed that investments in new power generation capacity are based on purely economic arguments. When the expected profitability is high enough to cover the required rate of return on capital, power companies prefer to invest in power plants. The total cost, including fixed costs and variable costs, is considered to economically evaluate any project. The variable costs are explained as a function of generation, though the fixed costs do not depend on generation. The variable costs of a generation technology can be calculated through summation of fuel plus operations and maintenance (OM) costs. Thus the variable cost for each MW capacity of the generating technology i can be written as equation 4 in Table 2 Typically, the marginal cost of a technology equals to its variable cost. 7-4-5. Economic Assessment of the Investment Among the most conventional methods for economic assessment of a project, one can name the Net Present Value (NPV) method. For any project, NPV equals to

273 M. Pourhosseini, N. Nahavandi, M. K. Sheikh-El-Eslami Transition in Iran’s Electricity Market Considering
IInntteerrnnaattiioonnaall JJoouurrnnaall ooff IInndduussttrriiaall EEnnggiinneeeerriinngg && PPrroodduuccttiioonn RReesseeaarrcchh,, JJuunnee 22001144,, VVooll.. 2255,, NNoo.. 22
the difference between the present value of the total income and the total cost of the project within its operational lifetime. However, unlike the projects with different lifetimes, the NPV method may not be easily used. Besides, Internal Rate of Return (IRR) and
Annual Equivalent Value (AEV) methods may serve as more efficient methods to compare different projects. The AEV method converts the income and cost during the operational life time into its equivalent annual value.
Tab.2. Equations Equation No.
CPA=LOLP(VOLL- ) 1 TP = + CPA 2
LOLP = Pr(K≥R) = =1- 3 VCi = Fueli + OMi 4
πi = ( – ) 5
= 6
= 7
= 8
= 9
= 10
= 11
( ) = 12
= - 13
14
= ( )( ) 15
Each generating technology i involves two periods in its lifetime: construction period ( ) and operation period ( ). For simplification, it was assumed that all investment costs ( ) have been paid at the beginning of the construction period. Then subtracting the operation cost from the income, the annual profit for each year can be calculated. The annual profit for a MW capacity of technology i ( ) can be calculated using equation 5 in Table 2 [22]. To investigate the profitability of investment by AEV method, the annual equivalent value of profit during the period Tci+Toi (represented by ) should be compared with the annual equivalent value of investment during the period Tci+Toi (represented by
). The annual equivalent values of investment and profit during the period Tci+Toi can be formulated as equations 6 and 7 in Table 2; where, , , and are as equations 8, 9 and 10 in the Table 2 [22].
Equations 8–10 are transformation functions as multiplier coefficients, which convert the future value in year T into its present equivalent value, i.e. the annual equivalent value during period T to its present value, and the present value to its annual equivalent value during period T, respectively [40]. In these formulas, r represents the required rate of return at the industry level. Using equations 8–10, the annual equivalent value of profit during the period Tci+Toi (πi) for an investment in technology i at year t, with a construction duration of Tci and an operation period of Toi, can be calculated. To do this, first, πi during the years t+Tci to t+Tci+Toi is converted to its equivalent value in year t+Tci, then this value is converted into its equivalent value in the year t. Finally, this latter equivalent value is converted into its equivalent distributed value during the period Tci+Toi. equation 50 stands for the integration of these two transformations.

M. Pourhosseini, N. Nahavandi, M. K. Sheikh-El-Eslami Transition in Iran’s Electricity Market Considering 274
IInntteerrnnaattiioonnaall JJoouurrnnaall ooff IInndduussttrriiaall EEnnggiinneeeerriinngg && PPrroodduuccttiioonn RReesseeaarrcchh,, DDeecceemmbbeerr 22001144,, VVooll.. 2255,, NNoo.. 44
7-4-6. Profitability Index According to equation 11 in Table 2, it is possible to define a profitability index for each generating technology. At the long-term equilibrium point for an ideal competitive market, the profitability index for each technology equals to 1. This is due to the fact that the profit equals the average investment costs. Under such condition, the market does not offer any incentive for the new entries or exits. However, old decommissioning power plants will be replaced by new ones in order to cover the retired capacity and the long-term perceived demand growth [21]. In this study, this condition was considered as the reference level of investment rate. When aggregated perceived profitability rises and PI>1, then more projects will be profitable and more firms will invest in new capacities. On the contrary, when PI<1, fewer projects will be profitable and only firms with lower capital costs may invest. In this case, the aggregated investment rate will be less than the reference level. Due to these explanations, Olsina et al. (2006) used a logistic function mi (a type of S-curve functions) to explain the aggregated investment responsiveness to the profitability index for each technology i as equation 12 in Table1; where, is the logistic function for technology i, is the profitability
index of technology i, max is the upper limit of the logistic function (maximum value of ), and and are the parameters of the logistic function. The above equation must satisfy the condition . In equation.12, if , then parameters and can be calculated as equations 13 and 14 in Table 1. Based on numerical values, different saturation levels ( ) were assumed for hard coal (HC), combined cycle gas turbine (CCGT), and gas turbine (GT) technologies. To describe the investment rate at time t for generation technology i, equation 15 was adopted (the same as olsina [21]); where is the investment rate of technology i at time t (MW/year), is the capacity retired rate of technology i at time t (MW/year), and is the capacity addition rate necessary to cover the expected growth of the maximum load served by technology i (MW/year).
8. Simulation Results and Analysis 8-1. System parameters As discussed in the previous section, the mentioned thermal power plants have high share in electricity production. Considering this fact, the value of input parameters in the model is shown in Table 3.
Tab. 3. The values of input parameter values for different generation technologies Value of parameter Input parameter
3 Time of construction CCGT (year) 4 Time of construction HC (year) 2 Time of construction GT (year) 30 Life time of CCGT (year) 40 Life time of HC (year) 20 Life time of GT (year) 1 Adjustment and permission time (year) 600 Investment Cost CCGT ($/kW) 1300 Investment Cost HC ($/kW) 400 Investment Cost GT ($/kW) 2008-2037 Forecasting period
Reference: Iran Power Plants Projects Management Group
8-2. Model Validation After implementation of the model, it was run according to the inputs in Vensim’s PLE software and then its outcome was compared with the historical data for its validation. For extraction of quantitative relationships in electricity demand and supply, the reports of Iran's Energy Balances were used. As presented in Fig. 10. and Fig. 11., through numerical simulation of the system dynamics modeling, the real data were compared with the simulated data. 8-2-1. Validation of Simulation Based Model Model validation is a very important step in system dynamics methodology. To perform this process, the historical data from 1988 to 2008 were required. A model will be valid in the case in which the error rate is smaller than 5% (see equations 16–18); where, S stands for the average of the simulation result and A represents the average of the historical data [41]. In
this research, Generation Capacity and Electricity Demand variables were selected to check the model’s validity taking into account that both of Generation Capacity and Electricity Demand are significant for the base model.
400 B
300 B
200 B
100 B
02 2 2 2 2 2
2 2 22 2
22
2
1 1 1 1 1 1 11 1 1
1 11
1
1988 1990 1992 1994 1996 1998 2000 2002 2004 2006 2008Time (Year)
kWh
Total Electricity Demand : Base Model 1 1 1 1 1 1 1 1actual demand : Base Model 2 2 2 2 2 2 2 2 2 2 Fig. 10. Total simulated and real electricity
consumption

275 M. Pourhosseini, N. Nahavandi, M. K. Sheikh-El-Eslami Transition in Iran’s Electricity Market Considering
IInntteerrnnaattiioonnaall JJoouurrnnaall ooff IInndduussttrriiaall EEnnggiinneeeerriinngg && PPrroodduuccttiioonn RReesseeaarrcchh,, JJuunnee 22001144,, VVooll.. 2255,, NNoo.. 22
60,000
45,000
30,000
15,000
0
2 2 2 22 2
2 22
2
22
2
2
1 1 11 1
1 11
11
11
11
1988 1990 1992 1994 1996 1998 2000 2002 2004 2006 2008Time (Year)
MW
Generation Capacity : Base Model 1 1 1 1 1 1 1 1 1real capacity : Base Model 2 2 2 2 2 2 2 2 2 2
Fig. 11. The real and simulated generation capacity
As it can be found from equations 28–30, in this validation process, the historical data of Generation Capacity and Electricity Demand are also needed.
Error Rate = (16)
Where,
(17)
(18)
The error rates of Generation Capacity and Electricity Demand are given as follows: Error Rate of Generation Capacity = 0.044303 Error Rate of Electricity Demand = 0.027459 Based on the above results, all the error rates are lower than 5%, implying that the designed model is valid. The comparison between simulation results and the historical data of Electricity Demand and Generation Capacity are given in Fig. 10 and Fig. 11 respectively.
8-3. Scenarios Development in this section two scenarios are considered based on the Government policies base on elimination of energy subsidies. To launch complete electricity market, first, Iranian Government should provide real price of electricity to people. Consumer behaviors after elimination of electrical subsidies in short and long term have been surveyed through these scenarios. After elimination of subsidies, Iran's electricity market will be prepared to launch complete electricity market. Also, by attracting investors to invest in plant construction, the Government will be ready to launch the complete electricity market. The designed scenarios are shown in Table 4.
Table 4. Scenarios
Transition period Form time of complete
electricity market Subsidies elimination Scenario
2008-2013 2013 Short-term (5 years) 1
2008-2020 2020 Long-term (12 years) 2
8-3-1. Generation Capacity and Total Electricity Consumption Simulation results were obtained via implementation of the scenarios in the software. Electricity demand and Generation Capacity are shown in Fig. 12. and Fig. 13.
Generation Capacity
200,000
150,000
100,000
50,000
02 2 2
2 22
2 2 22
22
22
1 1 1 11
11
1 1 11
11
1
1988 1995 2002 2009 2016 2023 2030 2037Time (Year)
MW
Generation Capacity : First Scenario 1 1 1 1 1 1 1 1 1Generation Capacity : Second Scenario 2 2 2 2 2 2 2 2
Fig. 12. Generation Capacity
Total Electricity Demand
800 B
600 B
400 B
200 B
0 2 2 2 22
22
22
2
22
2
2
1 1 1 11
11
11
11
1
11
1988 1995 2002 2009 2016 2023 2030 2037Time (Year)
kWh
Total Electricity Demand : First Scenario 1 1 1 1 1 1 1 1Total Electricity Demand : Second Scenario 2 2 2 2 2 2 2
Fig. 13. Electricity Demand.
Due to the effects of short-term elimination of electricity subsidies, a sudden drop in electricity demand is observed in the first scenario. This reduction, in turn, effects on the dynamic of electricity market, and due to higher rate of electricity production compared to electricity demand, its price is reduced and, consequently, investment attraction will be

M. Pourhosseini, N. Nahavandi, M. K. Sheikh-El-Eslami Transition in Iran’s Electricity Market Considering 276
IInntteerrnnaattiioonnaall JJoouurrnnaall ooff IInndduussttrriiaall EEnnggiinneeeerriinngg && PPrroodduuccttiioonn RReesseeaarrcchh,, DDeecceemmbbeerr 22001144,, VVooll.. 2255,, NNoo.. 44
reduced in many technologies, while the overall amount of production in a particular period of time is constant. On the other hand, long-term elimination of smoothly reduces the electricity consumption, and after complete commissioning of the electricity market, investment attraction in production technologies will be higher than in the first scenario. For this reason, as also shown in Fig. 12 the need for new capacities is recognized much sooner than in the first scenario.
8-3-2. Electricity price and reserve margin: In Fig. 14 & Fig. 18 show the changes in electricity and reserve margin. In scenario 1, since electricity reserve is very small, the price increases more than in scenario 2. At the beginning of the project of subsidies elimination because of price increase and reduced electricity demand, reserve margin is low in both scenarios. Also, during the complete commissioning of electricity market, due to larger margin reserve and, as a result, lower electricity price, investment attraction has been dropped. As Fig. 18 illustrates, reserve margin in scenario 1 is less than in scenario 2; this leads to a sudden rise of electricity price in scenario 1.
100
75
50
25
0
2
2
2
2 2 2
2
2
2
2
2
22
2
1 1 1
1 1 1
1
1
1
1
1
11
11
2008 2015.3 2022.5 2029.8 2037Time (Year)
$/kW
h
"Actual.price" : First Scenario 1 1 1 1 1 1 1 1 1 1"Ele.price" : First Scenario 2 2 2 2 2 2 2 2 2 2
Fig. 14. Electricity tariffs.
150,000 MW150,000150,000
75,000 MW75,00075,000
0 MW00
3 3 3 3 33 3
3 3 3 33
22 2 2 2
2 2 22
22
22
11 1 1 1 1 1
11
1 1
11
2008 2015.3 2022.5 2029.8 2037Time (Year)
Generation Capacity : First Scenario MW1 1 1 1 1 1 1 1Max LOAD : First Scenario 2 2 2 2 2 2 2 2 2 2Reserve Margin : First Scenario 3 3 3 3 3 3 3 3 3
Fig. 15. Generation – reserve margin – maximum load.
100
75
50
25
0
2
2
22
2 2
2
2
2
2 2
2 2
21 1 1 1 1 1
1
1
1
1 1
1 1
11
2008 2015.3 2022.5 2029.8 2037Time (Year)
$/kW
h
"Actual.price" : Second Scenario 1 1 1 1 1 1 1 1 1"Ele.price" : Second Scenario 2 2 2 2 2 2 2 2 2
Fig. 16. Electricity tariffs.
150,000 MW150,000150,000
75,000 MW75,00075,000
0 MW00
3 3 3 3 3 3 3 3 33 3 3
22 2 2
22
22
22
22
2
11 1 1 1 1
11 1
11
11
2008 2015.3 2022.5 2029.8 2037Time (Year)
Generation Capacity : Second Scenario MW1 1 1 1 1 1 1Max LOAD : Second Scenario 2 2 2 2 2 2 2 2 2Reserve Margin : Second Scenario 3 3 3 3 3 3 3 3 3
Fig. 17. Generation – Reserve margin – Maximum
load.
Reserve(%)
0.8
0.6
0.4
0.2
0
2
22 2
2
2
2 2
2
2 22 2 2 2
1
11
1 1
1
11
1
1
1
1 11
1
1988 1995 2002 2009 2016 2023 2030 2037Time (Year)
"Reserve(%)" : First Scenario 1 1 1 1 1 1 1 1 1 1"Reserve(%)" : Second Scenario 2 2 2 2 2 2 2 2 2
Fig. 18. Reserve Margin .
8-3-3. Investment Rates of Different Generation Technologies Investment rate of various manufacturing technologies is shown in Fig. 19 and Fig. 20 Investment rate in both scenarios dramatically drops after elimination of electricity subsides; however, this does not lead to bankruptcy of the producers during the construction of plants. After a couple of years, due to rise in electricity prices and offering incentives, investment rate increases (investment rate of GT power plants > CCGT power plants > HC power plants). In scenario 1, these investment incentives occur later than in scenario 2.but in early years (between 2018 to 2023)

277 M. Pourhosseini, N. Nahavandi, M. K. Sheikh-El-Eslami Transition in Iran’s Electricity Market Considering
IInntteerrnnaattiioonnaall JJoouurrnnaall ooff IInndduussttrriiaall EEnnggiinneeeerriinngg && PPrroodduuccttiioonn RReesseeaarrcchh,, JJuunnee 22001144,, VVooll.. 2255,, NNoo.. 22
investment rate of HC power plants is more than CCGT power plants and investment rate of CCGT power plants is more than GT power plants.
10,000 MW10,000 MW10,000 MW
5,000 MW5,000 MW5,000 MW
0 MW0 MW0 MW
3
3 3 3 3 3
33
3
3
3
3 32
2 2 2 2 2
2
2
2 2
22
2
11
1 11 1 1
1 11 1
11
1
2005 2009 2013 2017 2021 2025 2029 2033 2037Time (Year)
"Investment Rate (HC)" : First Scenario MW1 1 1 1 1 1 1"Investment Rate(CCGT)" : First Scenario MW2 2 2 2 2 2 2"Investment Rate(GT)" : First Scenario MW3 3 3 3 3 3 3
Fig. 19. Investment rate in the first scenario
10,000 MW10,000 MW10,000 MW
5,000 MW5,000 MW5,000 MW
0 MW0 MW0 MW
3
3 3 3 3
3
3 3
33
3
3
3
2
2 2 2 2
2
2 2
2
2
2 2
2
11
1 1 1 1
1
1 11 1 1 1
1
2005 2009 2013 2017 2021 2025 2029 2033 2037Time (Year)
"Investment Rate (HC)" : Second Scenario MW1 1 1 1 1 1 1"Investment Rate(CCGT)" : Second Scenario MW2 2 2 2 2 2"Investment Rate(GT)" : Second Scenario MW3 3 3 3 3 3 Fig. 20. Investment rate in the second scenario
9. Conclusion and Future Work
In Iran's power industry, because of lower tariff prices than the real prices, presence of monopolistic market and also increase in construction of thermal power plants, the Government has been subjected to high financial pressures; so it has decided to reduce this pressure through eliminating the energy subsidies as well as launching complete electricity market. In this paper, the effect of these policies on demand and required capacity in the future years were investigated
through system dynamics (SD) approach. With the use of this approach, Delays in unit constructions, estimation of demand and market capacity growth during the construction periods have been included and considered in the proposed model as parameters, which effect the decision. System (market dynamics) behavior is shown by these decisions, trends, and changes. However, using this approach, it is not possible to accurately announce the amount of output quantity, and one can just passively recognize the system changes and behaviors induced by various policies. Moreover, the more stable is the system, the more precise the trends and behaviors can be shown. The results of this study showed that during the early years of the probable commissioning of the complete electricity market, investment rate in power plants reduces because of high reserve margin and low probability of turn-off. However, this rate will increase with decrease in reserve margin and creation of incentives for investment. The results also showed that subsidies elimination somehow deals with demand growth in both short-term (12 years) and long- term (8 years), but again the country will need new capacity to deal with it after 8 to 12 years. It seems that Iranian Government is forced to launch complete electricity market as soon as possible within the period of energy subsidies elimination. Therefore, it needs to make an effort, as its first priority, to absorb investors to construct power plants and produce electricity. Increase in construction of Thermal power Plants will be lead to increase in pollutants and it may need to manage demand and supply in a more efficient way. Detailed analysis of the influence of increase pollutants on market dynamics may be the subject of future work, in other word the analysis of the consequences of green policies such as CO2 taxes and green energy markets.
9-1. Acknowledgments The authors would like to sincerely thank the Iran’s Power Plant Projects Management Group (MAPNA group) for their science, technology and financial supports
List of Symbols
Construction period of generation technology i Tci Capacity payment ($/MWh) or ($/MW/yr) CPA(t) Operation period of generation technology i Toi Value of lost load in ($/MWh) VOLL Total investment cost in ($/MW)
Loss of load probability of generation system at time t
LOLP(t)
Transformation function as the multiplier coefficient, which converts the future value in year T into its equivalent value
Generation total price ($/MWh) TP
Transformation function as the multiplier coefficient, which converts the annual equivalent value during period T into its present value
Average price paid to any MW of capacity for technology i
Transformation function as the multiplier coefficient, which converts the present value into its annual equivalent value during the T period
Forced outage rate of generation technology i
FORi
Annual equivalent values of investment during the period Tci+Toi ($/MW)
Number of reserve units R

M. Pourhosseini, N. Nahavandi, M. K. Sheikh-El-Eslami Transition in Iran’s Electricity Market Considering 278
IInntteerrnnaattiioonnaall JJoouurrnnaall ooff IInndduussttrriiaall EEnnggiinneeeerriinngg && PPrroodduuccttiioonn RReesseeaarrcchh,, DDeecceemmbbeerr 22001144,, VVooll.. 2255,, NNoo.. 44
Total investment cost in ($/MW) Number of out-of-service units K
Required rate of return at the industry level r Number of units N Profitability index
Variable cost for each MW capacity of generation technology i ($/MWh)
VCi
Aggregated capacity investment
Operations and maintenance costs ($/MWh)
OMi
Saturation level of investment
Fuel price of generation technology i ($/MWh)
Fueli
Fixed parameters of S-shaped investment function
,
Annual profit for a MW capacity of technology i ($/MW)
Investment rate of technology i at time t(MW/year)
Annual expected average electricity of price ($/MWh)
Capacity retired rate of technology i at time t (MW/year)
Annual expected average of marginal cost ($/MWh)
Capacity addition rate necessary to cover the expected growth of the maximum load served by technology (MW/year)
Expected average time duration that each MW of technology i is utilized in a year (hours)
Annual equivalent value of profit during the period Tci+Toi ($/MW)
References
[1] Power Ministry of Iran, 2008. Energy balance-sheet: Power ministry of Iran. [2]Ford, A., Bull M., “Using system dynamics for conservation policy analysis in the Pacific Northwest”, System Dynamics Review, 15(1), 1989, pp 1-16. [3]Qudrat-Ullah, H., BaekSeo, S., “How to do structural validity of a system dynamics type simulation model: the case of an energy policy model”. Energy Policy, 38(5), 2010, pp 2216-2224. [4]Dyner, I., Larsen, E.R., “From planning to strategy in the electricity industry”. Energy Policy, 29 (13), 2001, pp 1145–1154. [5]Sterman, J.D., “Business dynamics: systems thinking and modeling for a complex world”, 2000, Irwin McGraw-Hill. [6] Ford, A.,”Cycles in competitive electricity markets: A simulation study of the western United States”. Energy Policy, 27(11), 1999, pp 637–658. [7] Bunn, D.W., Larsen, E.R., “Sensitivity of reserve margin to factors influencing investment behavior in the electricity market of England and Wales”. Energy Policy, 20(5), 1992, pp 420–429. [8] Bunn, D.W., Larsen, E.R., Vlahos, K., “Complementary modeling approaches for analyzing several effects of privatization on electricity investment”. Journal of the Operational Research Society, 1993, pp 957–971. [9] Ford, A., “Waiting for the boom: A simulation study of power plant construction in California”. Energy Policy, 29(11), 2001, pp 847–869. [10] Botterud, A., et al. “A dynamic simulation model for long-term analysis of the power market”. In Proceedings of the 14th Power Systems Computation Conference, 2002.
[11]Vogstad, K., et al. “The transition from a fossil fuelled towards a renewable power supply in a deregulated electricity market”. In Proceedings of System Dynamics Conference, Palermo, Italy, 2002. [12]Vogstad, K., “Counterproductive environmental policies: Long term versus short term substitution effects of gas in a liberalized electricity market”. In Proceedings of System Dynamics Conference, 2004. [13] Qudrat-Ullah, H., “Understanding the dynamics of electricity generation capacity in Canada: A system dynamics approach”. Energy, vol.59, 2013, pp 285–294. [14] Carvajal, S.X., Arango, S., Larsen E.R., “Evaluation of a payments proposal for blackstart services in the Colombian electricity system: A system dynamics approach”. Electrical Power and Energy Systems. vol.53, 2013, pp 382–389. [15] Movilla, S., Miguel, L.J., FelipeBlázquez, L.,”A system dynamics approach for the photovoltaic energy market in Spain”. Energy Policy, vol.60, 2013, pp 142–154. [16]Ochoa, P., “Policy changes in the Swiss electricity market: Analysis of likely market responses”. Socio-Economic Planning Sciences, 41(4), 2007, pp 336–349. [17] Park, J.Y., et al. “Investment incentives in the Korean electricity market”. Energy Policy, 35(11), 2007, pp 5819–5828. [18] Qudrat-Ullah, H., Davidsen, P.I., “Understanding the dynamics of electricity supply, resources and pollution: Pasaoglu Kilanc.G, Or.I, A decision support tool for the analysis of pricing, investment and regulatory processes in a decentralized electricity market. Energy Policy, 36(8), 2008, pp 3036–3044.Pakistan’s case”. Energy, 26(6), 2001, pp 595–606. [19] Pereira, A.J.C., Saraivab, J.T.,” A long term generation expansion planning model using system dynamics – Case study using data from the

279 M. Pourhosseini, N. Nahavandi, M. K. Sheikh-El-Eslami Transition in Iran’s Electricity Market Considering
IInntteerrnnaattiioonnaall JJoouurrnnaall ooff IInndduussttrriiaall EEnnggiinneeeerriinngg && PPrroodduuccttiioonn RReesseeaarrcchh,, JJuunnee 22001144,, VVooll.. 2255,, NNoo.. 22
Portuguese/Spanish generation system”. Electric Power Systems Research, vol.97, 2013, pp 41–50. [20] Pasaoglu Kilanc, G., Or.I, “A decision support tool for the analysis of pricing, investment and regulatory processes in a decentralized electricity market”. Energy Policy, 36(8), 2008, pp 3036–3044. [21] Olsina, F., Garcés, F., Haubrich, H.J., “Modeling long-term dynamics of electricity markets”. Energy Policy, 34(12), 2006, pp 1411–1433. [22] Assili, M., Javidi, D., Ghazi, R., “An improved mechanism for capacity payment based on system dynamics modeling for investment planning in competitive electricity environment”. Energy Policy, 36(10), 2008, pp 3703–3713. [23] Kadoya, T., et al. “Utilizing system dynamics modeling to examine impact of deregulation on generation capacity growth”. Proceedings of the IEEE, 93(11), 2005, pp 2060–2069. [24] Pereira, A.J.C., Saraiva, J.T., “Generation expansion planning (GEP)- A long-term approach using system dynamics and genetic algorithms (GAs)”. Energy, 2011. [25] Hasani, M., Hosseini, S., “Dynamic assessment of capacity investment in electricity market considering complementary capacity mechanisms”. Energy, vol.36, 2011, pp 277-293. [26] Hasani-Marzooni, M., Hosseini, S.H., “Dynamic model for market-based capacity investment decision considering stochastic characteristic of wind power”. Renewable Energy. 36 (8), 2011, 2205–2219. [27] Pereira, A.J.C., Saraiva, J.T., “Long term impact of wind power generation in the Iberian day-ahead electricity market price”. Energy, vol.55, 2013, pp 1159–1171. [28] Hasani-Marzooni, M., Hosseini, S.H., “Dynamic analysis of various investment incentives and regional capacity assignment in Iranian electricity market”. Energy policy, 56, 2013, pp 271–284. [29] Kermanshahi, B., “Recurrent neural network for forecasting next 10 years loads of nine Japanese utilities”. Neurocomputing, 23(1-3), 1998, pp 125–133. [30] Kermanshahi, B., Iwamiya, H., “Up to year 2020 load forecasting using neural nets”. International Journal of Electrical Power & Energy Systems, 24(9), 2002, pp 789–797. [31] Barakat.E, Al-Rashed, S., “Long range peak demand forecasting under conditions of high growth”. IEEE Transactions on power system, 7(4), 1992, pp 1483–1486.
[32] Canyurt, O.E., Ozturk, H.K., Hepbasli, A., Utlu, Z., “Estimating the Turkish residential-commercial energy output based on genetic algorithm (GA) approaches”. Energy Policy, 33(8), 2005, pp 1011–1019. [33] Canyurt, O.E., Ozturk, H.K., Hepbasli, A., Utlu, Z., “Genetic algorithm (GA) approaches for the transport energy demand estimation: Model development and application”. Energy Sources, 28(13-16), 2006, pp 1405–1413. [34] Ozturk, H.K., et al. “Electricity estimation using genetic algorithm approach”: A case study of Turkey. Energy, 30(7), 2005, pp 1003–1012. [35] Ozturk, H.K., Canyurt, O.E., Hepbasli, A., Residential-commercial energy input estimation based on genetic “algorithm (GA) approaches: An application of Turkey”. Energy and Buildings, 36(2), 2004, pp 175–183. [36] Sahoo, N., Prasad, K., “A fuzzy genetic approach for network reconfiguration to enhance voltage stability in radial distribution systems”. Energy Conversion and Management, 47(18-19), 2006. [37] Erdogdu, E., “Electricity demand analysis using cointegration and ARIMA modeling”: A case study of Turkey. Energy Policy, 35(2), 2007, pp 1129–1146. [38] Amjadi, M., Nezamabadi-pour, H., Farsangi, M., "Estimation of electricity demand of Iran using two heuristic algorithms". Energy Conversion and Management, 51(3), 2010, pp 493–497. [39]Sadeghi, H., Zolfaghari, M., Heydarizade, M., "Estimation of Electricity Demand in Residential Sector Using Genetic Algorithm Approach". International Journal of Industrial Engineering & Production Research, 22(1), 2011, pp 43–50. [40] Wang, X., McDonald, J., "Modern Power System Planning". 1994. [41] Suryani, E., et al." Demand scenario analysis and planned capacity expansion: A system dynamics framework". Simulation Modelling Practice and Theory, 18(6), 2010, pp 732–751.