translocation of the southern rock lobster, jasus ... · translocation of the southern rock...
TRANSCRIPT

Translocation of the
southern rock lobster, Jasus
edwardsii, to improve yield
and marketability
PhD thesis by
Arani Chandrapavan (BSc Hons)
Submitted in fulfilment of the requirements for
the Degree of Doctor of Philosophy
This research was supported by the Tasmanian
Aquaculture and Fisheries Institute
University of Tasmania
June 2010
Photo: Shane Fava Jasus edwardsii (Hutton,1875)
“It is not the strongest of the species that survive, not the most intelligent, but those who are the most adaptive to change.”
— Charles Darwin —
�
�
� �������������������������������������������������������������������������������
�
I
Declarations
Statement of originality This thesis contains no material that has been accepted for a degree or diploma by the University or any other institution. To the best of my knowledge and belief, this thesis contains no material previously published or written by another person, except where due acknowledgment is made in the text. Arani Chandrapavan
Statement of authority of access This thesis may be available for loan and limited copying in accordance with Copyright Act 1968. Arani Chandrapavan
�
�
� �������������������������������������������������������������������������������
�
II
Abstract
�
The Tasmanian southern rock lobster (Jasus edwardsii)
fishery has a single Tasmania-wide management system despite
large spatial variations in the biology (growth) and market traits
(shell colour, body shape and live transport condition). This has
created uneven distribution of harvest rates around the State
where red, fast-growing, shallow-water lobsters are heavily
targeted by fishers due to their high market demand, while pale,
slow-growing, deep-water rock lobsters have a much lower rate
of exploitation. In an attempt to improve yield, marketability and
value of deep-water southern rock lobsters, translocation of
lobsters between regions was examined as a supplementary
management strategy for the Tasmanian rock lobster fishery.
Adult deep-water lobsters were moved inshore to shallow-water
reefs where changes to growth, market traits and body condition
were monitored through recapture surveys.
Red pigmentation in shell colour decreased with depth
across southern Australia. Most of the catch is sold into Asian
live markets where there is a preference for red lobsters. This
market preference has lead to the price discounting of lobsters,

�
�
� �������������������������������������������������������������������������������
�
III
which was estimated at a total of AUS$6.67 million / year for the
Tasmanian Rock Lobster Fishery. Morphological market traits of
leg length and abdomen shape were also different between deep
and shallow-water J. edwardsii populations and between the
sexes in each population. Nutritional indicators of condition did
not differ among adult deep-water, shallow-water and
translocated male lobsters, however fatty acid profiles indicated
dietary differences between deep and shallow-water lobsters.
Haemolymph condition indices detected significant differences in
the post-harvest condition between deep-water and shallow-
water lobsters.
Translocating small, pale adult lobsters into a shallow
water habitat resulted in a number of changes important to the
yield and value of the fishery. Growth rates of translocated adult
lobsters increased at their first moult in their new habitat,
exceeding that of resident deep-water lobsters from the original
site. Growth of translocated females exceeded resident shallow-
water females in the first year post-release. Translocation
changed the pale colouration of deep-water lobsters into the
bright red grade most sought after by the Asian market, however
changes in morphology were only partial and may require several
moults for a complete change in shape. Dietary fatty-acid
�
�
� �������������������������������������������������������������������������������
�
IV
profiles of translocated lobsters matched those of the resident
lobsters, while significant levels of essential omega-3 fatty acids
in the muscle tissue of translocated lobsters suggest enhanced
nutritional condition after translocation. The post-harvest
condition of resident shallow-water lobsters and translocated
lobsters were similar when recaptured 12 months later. �
Translocation could be an effective management tool to
add value to the less marketable deep-water southern rock
lobsters. These results on the magnitude and timing of
improvements in market traits will now contribute towards the
economic and biological evaluation of the feasibility of
translocation as a fisheries enhancement strategy for the
Tasmanian Rock Lobster Fishery.
�
�
� �������������������������������������������������������������������������������
�
V
Statement of co-authorship Chapters 2-6 of this thesis have been prepared as scientific manuscripts as identified on the title page for each chapter. In all cases sample design, data analyses, interpretation of results and manuscript preparation were the primary responsibility of the candidate, but were carried out in consultation with supervisors, and with the assistance of co-authors whose contributions are outlined below: Dr Caleb Gardner
Dr Gardner (Tasmanian Aquaculture and Fisheries
Institute (TAFI), University of Tasmania (UTAS)) provided the role of a principal supervisor for this PhD program. He provided the initial funding and financial support for all aspects of this investigation and his research team at TAFI provided technical support for all related field work. He provided advice relating to experimental design, lobster biology and fishery management, and on statistical analyses of results on all chapters of this thesis. Dr Bridget S Green
Dr Green is a research fellow (TAFI, UTAS) and co-
investigator on the translocation project and provided the role of a co-supervisor for this PhD program. She provided advice on the statistical analyses of results, manuscript preparation for Chapters 3, 4, 5, 6 and the overall structure of thesis. Dr Adrian Linnane
Dr Linnane leads the Rock Lobster Sub-Program at the
South Australian Research and Development Institute (SARDI) and was responsible for the co-ordination of the translocation field trials in South Australian waters. He provided shell colour data from South Australian commercial lobster catches for analyses in Chapter 2 and also provided lobster samples and digital image data for morphometric analyses in Chapter 3.

�
�
� �������������������������������������������������������������������������������
�
VI
Mr David Hobday Mr Hobday led the Invertebrate Section at Fisheries
Victoria at the Department of Primary Industries, and was responsible for the co-ordination of the translocation field trials in Victorian waters. He provided shell colour data from Victorian commercial lobster catches for analyses in Chapter 2 and also provided lobster samples and digital image data for morphometric analyses in Chapter 3. Dr Michaela A Guest
Dr Guest was a post-doctoral fellow affiliated with UTAS,
TAFI and CSIRO. She provided advice on the subject matter of diet as it relates to lipid profiles of invertebrates, statistical analyses and had the role of research supervisor for this component of the thesis. Dr Peter D Nichols
Dr Nichols leads the Food Futures Flagship program at
CSIRO (Commonwealth Scientific and Industrial Research Organisation) and provided laboratory space, equipment and instrumentation for the lipid and fatty acid analyses in Chapter 4. His specialised knowledge of lipid biochemistry and analytical techniques assisted in the interpretation of the data.
We the undersigned on behalf of all co-authors agree with the above statement of co-authorship for each of the published or submitted peer-reviewed manuscripts contributing to this thesis:
Signed:…………………………………………..Date:……………
Dr Caleb Gardner – principal supervisor (TAFI/UTAS)
Signed:…………………………………………...Date:……………
Dr Bridget S Green – co-supervisor (TAFI/UTAS)

�
�
� �������������������������������������������������������������������������������
�
VII
Acknowledgements This research was financially and logistically supported by a number of industries, institutions and individuals. Most importantly the Tasmanian Aquaculture and Fisheries Institute (TAFI) in conjunction with the Tasmanian Rock Lobster Industry provided the initial funding and later substantially supported by the Fisheries Research and Development Corporation (FRDC) and the Future Harvest Theme of the Australian Seafood CRC. This thesis would not be possible without the support, guidance, encouragement and motivation from my fantastic supervisors Drs Caleb Gardner and Bridget Green. I thank Caleb for answering a desperate email seeking a PhD project with lobsters all those years ago, for securing funding for this mammoth of a study, introducing me to the world of fisheries science, for guiding me through the challenges of a PhD, for financially supporting me when my scholarship ceased, and instilling in me the confidence to secure my first full-time job as a scientist. I thank Bridget for coming onboard to co-supervise me half way through my candidature. Thanks for all the invaluable suggestions for improvements on manuscripts that have enormously shaped this thesis and for the infallible writing skills and tips you tried to impart on me. Thank you both for your mentorship and the opportunity to be part of this exciting lobster research. Many facets of my thesis would not be possible without the collective support and enthusiasm of my collaborators, Drs. Adrian Linnane (SARDI), David Hobday (MAFRI), Peter Nichols (CSIRO) and Michaela Guest (TAFI/CSIRO). Thanks also to Ass/Profs Stewart Frusher and Malcolm Haddon for providing advice and knowledge whenever I was in doubt. Thanks to Hilary Revill and Rod Pearn from DPIPWE from whom I observed the intricate art of leading stakeholder meetings and for facilitating much of the interaction with industry members. I also thank members of the Tasmanian Rock Lobster Fisherman’s Association for their support of this project and assistance with data and sample collections. I would like to express my sincere thanks to current and past members of “TEAM TRANSLOCATION” and the numerous volunteers involved in field surveys. I’m especially indebted to Dane Jones, Shane Fava, Craig MacKinnon, Sam Ibbott, Ruari

�
�
� �������������������������������������������������������������������������������
�
VIII
Colquhoun, Justin Hulls, Hanna Wernstrom, Peter Hawthorn, David Rielly, Jack Gibson and Matt Francis for their enthusiastic assistance and entertaining stories during the countless hours of lobster potting and tagging. Thanks also to the TAFI aquaculture team for keeping an eye on my lobsters and providing assistance when needed. I am also immensely thankful to Dr Joan Woodberry for her generous Postgraduate Fellowship for Women which provided crucial financial aid that allowed me to attend several international conferences (16th International Crustacean Congress, Glasgow in 2005, 3rd International symposium Sea-Ranching and Stock Enhancement Conference, Seattle 2006, 8th International Conference and Workshop on Lobster Biology and Management, Prince Edward Island 2007), where I have been fortune to receive some exciting awards and meet fellow lobster enthusiasts. Thanks to my European colleagues Drs Gro van der Meeren and Thomas Breithaupt for encouraging me to pursue my PhD dream and to my current colleagues Drs Mervi Kangas and Nick Caputi for their generous support in allowing me to finish this thesis from the other side of the country. To all my friends with whom over the PhD years I have shared houses, offices, fieldtrips and the all encompassing Tassie weather, in particular Anna, Adam, Cynthia, Eric, Fay, Farhan, Hanna, Jess, John, Lisa, Luisa, Nicole, Sarah, Steve, Theresa, Tim, Tobes, Vila, and Zoe. You all were my Hobartian family that kept me sane, fed and entertained through the many student dramas and lively conversations on life, love and lobsters. Thanks for the memories. Finally, I dedicate this thesis to my family, Appa, Amma and Thuvara, whose own journey across the seas made this endeavour possible. Thank you for your patience, love and understanding and instilling in me strong roots and wings so I can achieve all that I can. ~Arani~ P.S. Thanks also to the hundreds of lobsters that became invaluable participants of this project (and sometimes my diet) �
�
�
� �������������������������������������������������������������������������������
�
IX
CONTENTS Declarations...............................................................................I
Abstract....................................................................................II
Statement of co-authorship.......................................................V
Acknowledgements..................................................................VII
Chapter 1
GENERAL INTRODUCTION...................................................1
1.1 Fisheries enhancement systems.......................................2
1.2 Background to management of the Tasmanian Rock
Lobster Fishery........................................................……..5
1.3 Characteristics of Jasus edwardsii biology, market and
fishery..........................................................................…7
1.4 Translocation as a fisheries enhancement strategy.........11
1.5 Study objectives and thesis structure.............................14
Chapter 2
COLOUR VARIATION IN THE SOUTHERN ROCK LOBSTER JASUS EDWARDSII, AND ITS ECONOMIC IMPACT ON THE COMMERCIAL INDUSTRY..................................................17 Abstract...............................................................................….18
2.1 Introduction................................................................…19
2.2 Materials and methods...................................................21
������ Catch effort and colour data..................................21
2.2.2 Data analyses.......................................................23
2.2.3 Economic impact..................................................24
2.3 Results..........................................................................26
2.4 Discussion.....................................................................33
������ Spatial variation in colour ....................................33
������ Impact of colour variation on the fishery...............36

�
�
� �������������������������������������������������������������������������������
�
X
Chapter 3
PHENOTYPIC VARIATION IN SHELL COLOUR AND MORPHOLOGY AMONG ADULT SOUTHERN ROCK LOBSTERS, AND RESPONSE TO TRANSLOCATION....……...40 Abstract...................................................................................41
3.1 Introduction...................................................................42
3.2 Materials and methods...................................................44
3.2.1 Lobster collection and translocation......................44
3.2.2 Colour analysis.....................................................47
3.2.3 Morphometric analyses.........................................49
3.2.4 Data analyses.......................................................50
3.3 Results...........................................................................53
3.3.1 Shell colour variation............................................53
3.3.2 Body-shape variation............................................57
3.4 Discussion.....................................................................66
3.4.1 Natural variation in market traits.........................66
3.4.2 Market traits response to translocation and its
commercial significance.................................................68
Chapter 4
LIPID CONTENT AND FATTY ACID VARIATION AMONG ADULT SOUTHERN ROCK LOBSTERS, AND RESPONSE TO TRANSLOCATION...............................................................72 Abstract...................................................................................73
4.1 Introduction...................................................................74
4.2 Materials and methods...................................................77
4.2.1 Translocation and lobster collection......................77
4.2.2 Lipid and fatty acid analyses.................................81
4.2.3 Statistical analyses...............................................83
4.3 Results...........................................................................84
4.3.1 Total lipid content and lipid-class composition......84
4.3.2 Fatty-acid compositions........................................88
�
�
� �������������������������������������������������������������������������������
�
XI
4.4 Discussion.....................................................................94
4.4.1 Fatty acid differences in Jasus edwardsii..............94
4.4.2 Nutritional condition of Jasus edwardsii...............96
4.5 Conclusion...................................................................100
Chapter 5
HAEMOLYMPH CONDITION VARIATION AMONG POST-HARVEST ADULT SOUTHERN ROCK LOBSTERS, AND RESPONSE TO TRANSLOCATION.................................….101 Abstract.............................................................................….102
5.1 Introduction..............................................................…103
5.2 Materials and methods.................................................106
5.2.1 Translocation of J. edwardsii..............................106
5.2.2 Haemolymph collection and analyses..................108
5.3 Results......................................................................…111
5.3.1 Pigment stage.....................................................113
5.3.2 Serum protein..................................................…114
5.3.3 Total haemocyte counts......................................114
5.3.4 Electrolytes.........................................................115
5.4 Discussion................................................................…117
Chapter 6
GROWTH RATE VARIATION AMONG ADULT SOUTHERN ROCK LOBSTERS, AND RESPONSE TO TRANSLOCATION.124 Abstract..............................................................................…125
6.1 Introduction..............................................................…126
6.2 Materials and methods.................................................128
6.2.1 Translocation of lobsters.....................................128
6.2.2 Data analyses.....................................................129
6.3 Results......................................................................…131
6.4 Discussion................................................................…133

�
�
� �������������������������������������������������������������������������������
�
XII
Chapter 7
GENERAL DISCUSSION....................................................140
Translocation can improve yield and marketability of Jasus
edwardsii..............................................................................141
Future of translocation as a fisheries enhancement
strategy...........................................................................…...147
Conclusion...................................................................…......150
REFERENCES..................................................................152
APPENDIX……………………………………………………………….176

�
�
Chapter 1 General Introduction
�
1
�
�
Chapter
�
�
�
�
�
�
�
General Introduction
�
1
�
�
Chapter 1 General Introduction
�
2
�
1.1 Fisheries enhancement systems
A decreasing trend in global catch rates and landings from
capture fisheries have raised concerns about the capacity of wild
harvest to supply the growing demand for fishery products
(Garcia and Grainger 2005; Pauly et al. 2005). In response,
capture fisheries and aquaculture sectors are expanding,
restoring depleted stocks, and establishing enhancement
programs to improve production and management of fishery
resources (Caddy and Defeo 2003). Among the diverse strategies
that are being implemented to achieve these objectives, there is
an emerging field of fisheries enhancement systems, which
combines the practice of releasing cultured organisms with
harvest under the principals of wild fisheries (Lorenzen 2005).
Enhancement initiatives are highly diverse and viewed to
be intermediate between aquaculture and fisheries in terms of
both technical and human control. The three widely adopted
enhancement systems defined by Lorenzen (2008) and Bell et al
(2008) are;
�
�
Chapter 1 General Introduction
�
3
• Restocking – the release of cultured juveniles into a wild
population to restore severely depleted spawning
biomass to provide regular, substantial yields.
• Stock enhancement – augments the natural supply of
juveniles to overcome recruitment limitation.
• Sea-ranching – the release of cultured juveniles into
unenclosed coastal environments for harvest at a larger
size in “put, grow and take” operations. There is no
intention of allowing released juveniles to augment
spawning biomass, as in restocking, or to strengthen
year classes, as in stock enhancement. However, where
the animals reach maturity before the desired harvest
size, they will contribute to egg production.
Within each of these broad enhancement systems, the
designs of the operations vary to suit the biological or fishery
characteristics of the target species. For instance, under specific
circumstances the “put, grow and take” approach that defines
sea ranching is slightly modified for enhancement operations
where released animals are sourced from adults within the stock
instead of hatchery reared juveniles. The use of adults instead of
juveniles in enhancement fisheries systems is not uniquely
defined, but falls under the broad category of translocation.
�
�
Chapter 1 General Introduction
�
4
Translocation is the mediated movement of wild
individuals or populations from one area with free release in
another, in an attempt to establish, re-establish, or augment a
population (IUCN 1987). Its applications in terrestrial systems
range from conservation to pest management (Griffith et al.
1989; Fischer and Lindenmayer 2000) and for the aquatic
systems it has aided restocking, stock enhancement and sea
ranching operations (Bell et al. 2005). Most recently, a similar
term “managed relocation” (aka ‘assisted colonisation’ and
‘assisted migration’) has been coined to describe the
translocation of species to areas beyond their natural range to
prevent their extinction from the effects of climate change (Sax et
al. 2009; Schlaepfer et al. 2009). Thus the concept of
translocation has many applications.
Among the common themes across all applications of
translocation, is the debate of their appropriate and responsible
use. Translocation associated risks often parallel those for the
release of cultured juveniles, and stem from the uncertainty
surrounding the interaction between wild and released
populations (e.g. genetic mixing, resource competition), the
behaviour of released individuals in the new environment (e.g.

�
�
Chapter 1 General Introduction
�
5
survival, movement) and the ecological impact from population
manipulation (e.g. spread of disease, trophic interaction). From a
conservation perspective, enhancement strategies are sometimes
opted as a last resort (Griffith et al. 1989) and in the case of
managed relocation, the risk of species extinction is too large to
disregard the option altogether (Sax et al. 2009). From a fisheries
management perspective, stakeholders may only favour the
fisheries enhancement option if it outperforms alternative
management measures or provide a wider range of benefits and
economically feasible (Lorenzen 2008). A common agreement in
all instances is that the decision to establish enhancement
systems requires rigorous evaluation supported by
comprehensive research.
1.2 Background to management of the Tasmanian Rock Lobster Fishery
Management of the southern rock lobster resource in
Tasmania began with gear restrictions, minimum legal size limits
and a prohibition on harvest of soft-shelled or ovigerous lobsters
in the late 1880’s. Gear restrictions were later modified in the
early 1900’s to allow the use of pots (traps), plus limited entry,
restrictions on the total number of pots in use and closed
seasons (Gardner et al. 2004). In 1998 an individual transferable
�
�
Chapter 1 General Introduction
�
6
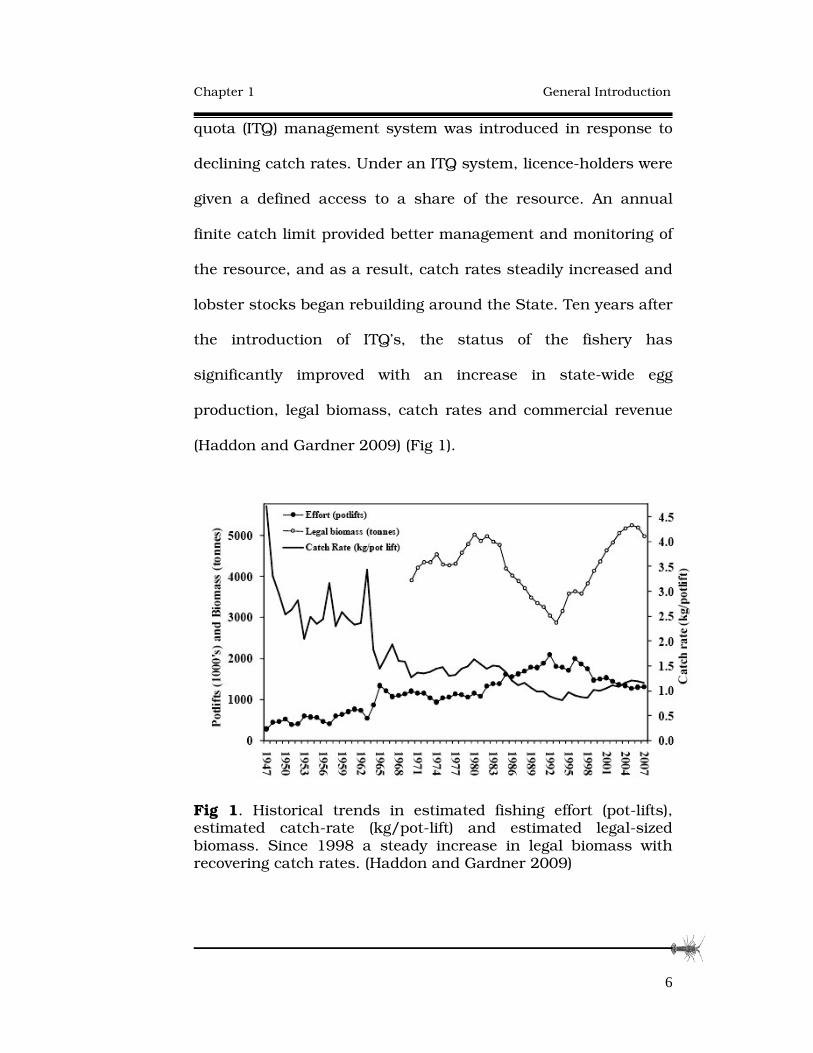
quota (ITQ) management system was introduced in response to
declining catch rates. Under an ITQ system, licence-holders were
given a defined access to a share of the resource. An annual
finite catch limit provided better management and monitoring of
the resource, and as a result, catch rates steadily increased and
lobster stocks began rebuilding around the State. Ten years after
the introduction of ITQ’s, the status of the fishery has
significantly improved with an increase in state-wide egg
production, legal biomass, catch rates and commercial revenue
(Haddon and Gardner 2009) (Fig 1).
Fig 1. Historical trends in estimated fishing effort (pot-lifts), estimated catch-rate (kg/pot-lift) and estimated legal-sized biomass. Since 1998 a steady increase in legal biomass with recovering catch rates. (Haddon and Gardner 2009)
�
�
Chapter 1 General Introduction
�
7
The main impact of capping catch through ITQ’s was a
shift in focus from maximising catch to optimising the value of
the catch (Bradshaw et al. 2001). Fishers shifted fishing effort
from offshore areas where the catch rate was high but the unit
value was low, into inshore areas where the value of the catch
was higher although catch rates were low (Frusher et al. 2003).
Increased commercial fishing effort inshore is a product of
market demand as fishers operating inshore harvest a higher
valued product and have lower operational costs compared to
fishers working on offshore grounds.
1.3 Characteristics of Jasus edwardsii
Biology, Market and Fishery
The southern rock lobster, Jasus edwardsii has a wide
distribution across southern Australasia in a range of depths (1
– 200 m) and habitats (Booth 2006), although reportedly no
genetic differentiations among spatial stocks (Ovenden et al.
1992) due to its long larval phase (Bruce et al. 2000). In
Australia J. edwardsii is the basis of 3 major commercial
fisheries, in the states of South Australia, Victoria and
Tasmania, with a gross value of exported product of AUS$134
million in 2006 (Wood et al. 2007). Biological characteristics of J.

�
�
Chapter 1 General Introduction
�
8
edwardsii are variable throughout its’ geographic range,
particularly between deep and shallow-water populations. Two
biological traits that significantly impact management of the
commercial industry are growth rates (McGarvey et al. 1999) and
size at onset of female sexual maturity (Gardner et al. 2006).
In Tasmania, growth of J. edwardsii is faster in shallow
water and in more northern latitudes (Fig 2). Deep-water females
are slow-growing and in some areas they never reach the legal
minimum length (LML) for harvesting, but since they reach
sexual maturity at a smaller size they contribute significantly to
the state-wide egg production (Punt and Kennedy 1997).
Conversely in the north of the State, growth rates are so fast that
females are often removed by the fishery before they reach
sexual maturity and do not contribute to egg production. The
use of a single size limit throughout Tasmania where the target
species exhibits high spatial variation in demographic traits
appears as an inefficient harvest strategy of the available
resource.

�
�
Chapter 1 General Introduction
�
9
Fig 2. Size (CL) frequency distribution of female J. edwardsii sampled from north (King Island), east (Schouten Island) and south (Maatsuyker Island) coast of Tasmania. The solid vertical line indicates the legal minimum size and arrows indicate the size at which 50% of the females are mature.
�
�
Chapter 1 General Introduction
�
10
The majority of the southern rock lobster catch is exported
live to China where it is popular among the sushi restaurant
trade and during festivals and special occasions (Roberts 1994).
The red shell colouration of southern rock lobsters is a highly
regarded market trait by Asian consumers due to the cultural
association of the colour red with luck, prosperity and happiness
(Konosu and Yamaguchi 1994). However, J. edwardsii harvested
from depths greater than 30 m have very pale shell colouration
(McGarvey et al. 1999). In addition to shell colouration, body-
shape (leg length and abdomen shape), vitality and condition of
lobster during live transport are also key market traits. The
Asian market pays a higher premium for lobsters in a narrow
size range (800 – 1500 g) without limb and carapace damage and
which exhibit high vitality on arrival. Pale coloured, deep-water
lobsters are generally sold at discounted prices or alternatively
sold as cooked product on the domestic market. The price
differential between deep-water pale lobsters and shallow-water
red lobsters is variable and lowest during winter months when
catch rates of all lobsters are low and market demand is high.
So, in order to maximise their profits, some fishers adopted a
fishing strategy which targets inshore areas until catch rates
decline, then target offshore regions in winter to take advantage
of higher market prices for pale lobsters (Frusher et al. 2003).

�
�
Chapter 1 General Introduction
�
11
The interplay between the biological, market and fishery
characteristics of J. edwardsii in Tasmania presents several
management challenges, but also opportunities for improving
yield, value and sustainability of the industry.
1.4 Translocation as a
fisheries enhancement strategy
In response to the management issues surrounding spatial
differences in egg production, ecosystems effects, marketing and
yield, several options for spatial management are under
consideration. For example, different regional minimum legal
size limits may alter average harvest sizes so that they are better
matched with regional growth rates and female size at maturity.
This aims to increase egg production in northern regions and
increase state-wide catch. But under this strategy, catches of
extremely small and large lobsters and pale coloured lobsters
would still fail to satisfy the Asian market demands and be sold
at discounted prices, and so this option might improve the yield
and sustainability but not maximise the value of the fishery.
Other options include: increased quota allocation to direct effort
to offshore deep-water regions, spatial closures, maximum size
limits, and new market destinations. Some of these options
�
�
Chapter 1 General Introduction
�
12
provide increased economic yield while others would increase
egg production levels, however none could improve the value of
the product. Thus these options have their own strengths and
weaknesses as they effectively target one or a few objectives for
improving a spatially heterogeneous fishery but fail to address
others.
Translocation is one option that when used as an
enhancement strategy could deliver improvements in yield, value
and sustainability. Sea ranching through multiple translocations
would be an exclusively field-based operation where large
numbers of adult deep-water lobsters would be removed from
sites of low productivity in deep-water regions of the State and
be released into areas of high productivity inshore. The success
of this strategy depends on translocated deep-water lobsters
surviving, and adopting the biological characteristics of the
resident shallow-water lobsters. Translocating deep-water
lobsters aims to enhance the inshore stocks by increasing
productivity, catch rates and quality of yield. In achieving these
objectives, the Tasmanian Rock Lobster Fishery may use
translocation as a supplementary strategy in conjunction with
existing ITQ controls, provided it relieves the spatial pressures
addressed above and meets the following constraints:

�
�
Chapter 1 General Introduction
�
13
management of risk of disease transfer and genetic mixing to
acceptable levels; high survival rates of released animals; low
immigration rates of released animals back to deep water
habitats; translocated animals adopt the market traits of
shallow-water lobsters; a neutral or positive impact of additions
and removal of animals on the ecosystem; and economic
feasibility.
Invertebrate resources world-wide are coming under
pressure as rising demand and prices for these generally high-
value species leads to their overexploitation (Caddy and Defeo
2003). For Australian fishery resources in particular, there is a
large gap in their management performance between their
current use and their best use (Colquhoun and Archbold 2009)
as illustrated by the Tasmanian southern rock lobster resource.
Thus novel management initiatives are sometimes necessary to
progress towards a better fishery performance. This thesis
describes a 2-year experimental stage of a large-scale fishery
enhancement experiment, with the specific objective of
improving marketability and yield for the Tasmanian rock lobster
industry.
�
�
Chapter 1 General Introduction
�
14
1.5 Study Objectives and thesis structure
The specific study aims of this thesis research were to:
1) Quantify the spatial variation in the key market traits
of shell colour, morphology, growth, physiological and
nutritional condition between deep and shallow-water
populations; and
2) Evaluate changes to traits influencing yield and
marketability of deep-water lobsters after translocation.
Despite its commercial importance, the change in lobster
colour with depth and throughout its range in the three
commercial fishing states of South Australia, Victoria and
Tasmania has not been comprehensively documented. In
Chapter 2 I investigated the relationship between lobster colour
and depth and how this varies between regions. This information
was then incorporated with catch rate records in the years
before and after the quota management change to estimate the
economic impact of colour discounting on the Tasmanian Rock
Lobster Industry.
�
�
Chapter 1 General Introduction
�
15
While the key market traits of shell colour and body-shape
are widely accepted to vary throughout its distribution, this
information is largely anecdotal. In Chapter 3, quantitative
measurements of shell colour and body-shape traits were taken
from deep and shallow-water lobster populations from
Tasmanian, South Australian and Victorian fishing grounds.
This provided baseline information for comparisons of these
traits in deep-water lobsters after translocation to determine
whether translocated lobsters had adopted the traits of the
resident shallow-water lobsters in Tasmania.
Differences in market traits have been presumed to be
related to nutritional differences between deep and shallow-
water populations. In Chapter 4, using lipid and fatty acids
analyses I investigated the nutritional condition of shallow and
deep-water populations and whether this altered after
translocation.
Differences in live transport condition between deep and
shallow-water lobsters suggest differences in their physiological
condition in response to stress. In Chapter 5, I assessed the
post-capture condition of deep-water lobsters before and after
translocation in comparison to shallow-water lobsters using

�
�
Chapter 1 General Introduction
�
16
several haemolymph indices to determine how translocation may
have altered the post-harvest condition of deep-water lobsters.
Increase in yield through translocation requires
translocated lobsters to increase their growth and adopt the
growth rate of the resident population. Chapter 6 provides
preliminary results of the short-term growth changes of deep-
water adult male and female lobsters translocated from a slow-
growth to a high-growth region.
Practical application and research serves a key
intermediate role for quantitative assessment of outcomes from
fisheries enhancement strategies. Stakeholders evaluating the
overall feasibility of translocation require quantitative data to
measure success and model predictive scenarios. This thesis
provides a detailed quantitative assessment of the morphological
and physiological differences between regions of high and low
lobster productivity and how these differences respond to
population manipulation. This research is part of a broader
investigation evaluating translocation aided sea-ranching as a
suitable fisheries enhancement strategy to improve the yield,
value and sustainability of the southern rock lobster fishery
(Chapter7).

�
�
Chapter 2 Economics of colour variation
�
17
�
�
�
�
Chapter Chapter Chapter Chapter �
�����
�
Colour variation in the southern
rock lobster Jasus edwardsii, and its economic impact on the
commercial industry
This chapter previously published as:
Chandrapavan A, Gardner C, Linnane A, Hobday D (2009). Colour variation in the southern rock lobster Jasus edwardsii, and its economic impact on the commercial industry. New Zealand Journal of Marine and Freshwater Research 43: 537 – 545. �
2
�
�
Chapter 2 Economics of colour variation
�
18
Abstract
Southern rock lobster Jasus edwardsii varies in shell
coloration throughout southern Australia. Predominantly
exported as a live product to Asian markets, price is influenced
by colour with prices higher for dark red than paler coloured
lobsters. This paper explores spatial and depth variation in shell
colour for the Tasmanian, South Australian and Victorian
Fisheries using catch sampling data. The proportion of red
lobsters decreased with depth and prevalent in depths less than
30 m, whereas paler coloured lobsters dominated the deeper
depth ranges. The depth of transition where 50% of lobsters were
classified as red showed a weak trend of increase with latitude
from southern Tasmania to northern South Australia. Under
quota management, lobster colour was a significant driver of
fleet dynamics as fishers target areas of high price per unit.
Consequently, catches of pale lobsters from deeper depths
remain low despite the high catch rates in these areas. The
colour price differential varies seasonally (higher in summer) so
fishers increase supply of pale lobsters during winter.
Discounting on colour equates to AUS$6.67 million/year for the
Tasmanian Fishery alone, which indicates value from
management or marketing research to reduce discounting.

�
�
Chapter 2 Economics of colour variation
�
19
���� Introduction
Southern rock lobster Jasus edwardsii (Hutton, 1985) are
found throughout southern Australia and New Zealand and are
fished across their distribution (Kailola et al. 1993). In Australia,
the state-managed fisheries of Tasmania, South Australia and
Victoria are managed using quota systems for the commercial
sector with a gross value of exported product of AUS$134 million
dollars in 2006 (Wood et al. 2007). These fisheries exploit a large
depth range with catch taken from 1 to 250 m (main fishing
range 1-140 m) (Booth 2006). Inshore populations of J.
edwardsii are of a bright red colour and receive greater fishing
effort by both the commercial and recreational sectors than
lobsters caught from deeper depths that are of a paler coloration
(Bryars and Geddes 2005). Commercially classed as
“pale/brindle” and “white” lobsters, the exoskeletons of deep-
water lobsters are mosaics of red, orange, and yellow tones.
Colour variation is one of the many spatial differences in the
biology of this species, and market grading of lobsters according
to colour is a common practice in lobster processing facilities in
Australia (Bryars and Geddes 2005).
�
�
Chapter 2 Economics of colour variation
�
20
Red coloured lobsters are in high demand throughout the
year, driven by the Chinese market that receives 90% of
Australia’s exports (Wood et al. 2007). High demand is due to the
cultural association of the colour red with happiness, luck and
prosperity (Konosu and Yamaguchi 1994). Lobsters are displayed
alive in restaurants so appearance and condition are also critical
for this live market. In Australia, lobsters lacking uniform red
coloration are often sold at discounted prices or sold into the
local market for cooked product (Harrison 2004). Therefore,
improving the price of pale coloured lobsters has been identified
by the commercial industry as an opportunity for expanding
value of the industry (Gardner and van Putten 2008a, b). Yet
despite its commercial importance, information on the spatial
distribution of colour categories and how they change and relate
to depth has not been explored to date. This information is
important in understanding seasonal fishing patterns and
fishing effort particularly as it relates to the change in
management system in 1998 when a shift in emphasis to quality
of product occurred (Ford 2001). Thus data from fisheries
independent surveys and commercial catch sampling were
examined in this study to determine spatial and depth patterns
in lobster colour. The beach price differential that exists owing
to colour grading was examined seasonally and the economic
�
�
Chapter 2 Economics of colour variation
�
21
impact of colour differences was estimated both before and after
management change for the Tasmanian rock lobster industry.
���� Materials and Methods
2.2.1 Catch effort and colour data
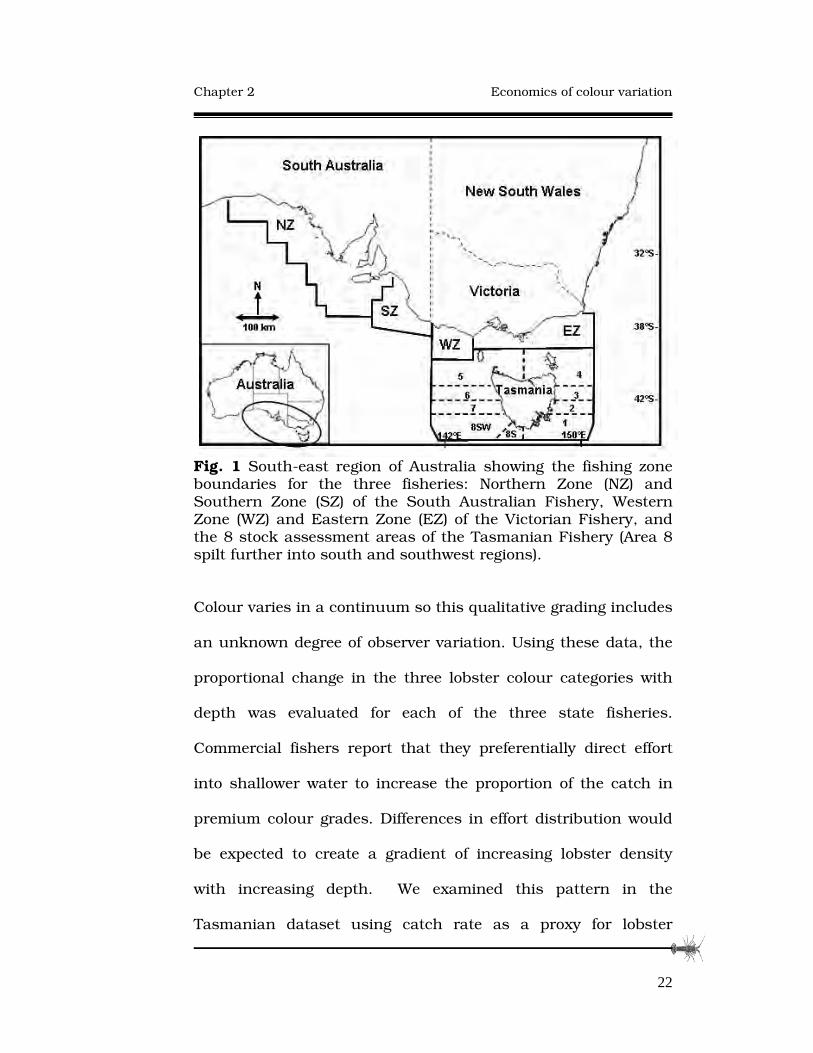
The Tasmanian Rock Lobster Fishery is managed as a
single zone but because of demographic variation the fishery is
divided into eight areas for stock assessment purposes
(Semmens et al. 2006). The South Australian Rock Lobster
Fishery is separated into two discrete fishing zones, Northern
and Southern, and the Victorian Fishery is divided into Western
and Eastern zones (Fig. 1) (Department of Primary Industries
2003; Linnane et al. 2006). Colour, depth at capture, effort and
location data were obtained through fisheries independent
research catch sampling surveys and commercial catch sampling
conducted by all three state fisheries for the period 1993–2006.
Observers conducting these surveys in each of these regions
recorded colour according to the three categories used by lobster
processors: red, pale, and white, based on the intensity and
distribution of the red pigmentation in the exoskeleton (Fig. 2).
�
�
Chapter 2 Economics of colour variation
�
22
Fig. 1 South-east region of Australia showing the fishing zone boundaries for the three fisheries: Northern Zone (NZ) and Southern Zone (SZ) of the South Australian Fishery, Western Zone (WZ) and Eastern Zone (EZ) of the Victorian Fishery, and the 8 stock assessment areas of the Tasmanian Fishery (Area 8 spilt further into south and southwest regions).
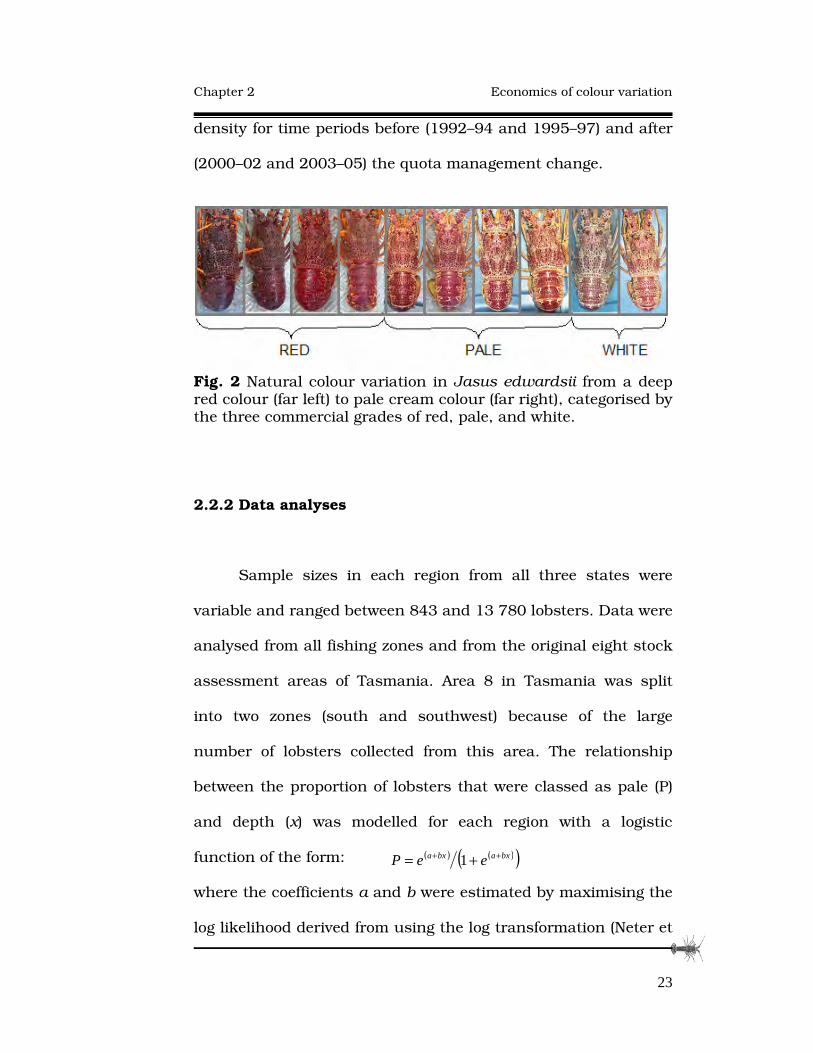
Colour varies in a continuum so this qualitative grading includes
an unknown degree of observer variation. Using these data, the
proportional change in the three lobster colour categories with
depth was evaluated for each of the three state fisheries.
Commercial fishers report that they preferentially direct effort
into shallower water to increase the proportion of the catch in
premium colour grades. Differences in effort distribution would
be expected to create a gradient of increasing lobster density
with increasing depth. We examined this pattern in the
Tasmanian dataset using catch rate as a proxy for lobster
�
�
Chapter 2 Economics of colour variation
�
23
( ) ( )( )bxabxa eeP ++ += 1
density for time periods before (1992–94 and 1995–97) and after
(2000–02 and 2003–05) the quota management change.
Fig. 2 Natural colour variation in Jasus edwardsii from a deep red colour (far left) to pale cream colour (far right), categorised by the three commercial grades of red, pale, and white.
2.2.2 Data analyses
Sample sizes in each region from all three states were
variable and ranged between 843 and 13 780 lobsters. Data were
analysed from all fishing zones and from the original eight stock
assessment areas of Tasmania. Area 8 in Tasmania was split
into two zones (south and southwest) because of the large
number of lobsters collected from this area. The relationship
between the proportion of lobsters that were classed as pale (P)
and depth (x) was modelled for each region with a logistic
function of the form:
where the coefficients a and b were estimated by maximising the
log likelihood derived from using the log transformation (Neter et
�
�
Chapter 2 Economics of colour variation
�
24
al. 1990). These models were then used to estimate the depth at
which 50% and 95% of the population were classed as pale, thus
providing an estimate of the depth at which 50% and 5% of the
population were classed as red (D50% and D5%). Estimation of
uncertainty around these estimates followed the method of
Turner et al. (2002) which determined 95% confidence limits
around model fits from 500 simulations for each area in a
bootstrapping routine where data were randomly sampled with
replacement from each of the depth bins (Haddon 2001). The
middle 95% of the bootstrap replicates constituted the
confidence interval. Confidence limits derived by this method
reflect the uneven distribution of certainty around estimates of
the transition of colour with depth.
2.2.3 Economic impact
Economic implications of colour variation were examined
for the Tasmanian fishery which has been managed through
individual transferable quota since 1998 (Bradshaw 2001). A
result of this management regime was that market revenue after
1998 could only vary through changes in beach price rather
than through number of lobster landings. Since beach price is
influenced by lobster colour, changes to revenue after the shift to
�
�
Chapter 2 Economics of colour variation
�
25
quota management is partially a function of the colour
composition of catches landed. The economic impact of colour of
landings was explored for three time series: before quota (1992–
95); immediately before and at management transition (1996–
99); and during an extended period after quota introduction
(2000–05). Each time series is reviewed by summer (November–
March) and winter (April–September) periods owing to seasonal
changes in fleet dynamics. Historical monthly price of lobsters
was obtained in Australian dollars from sales records of an
exporting lobster processor (provided by Ian Hawthorn, Red
Lobsters Pty Ltd). For the summer period of 2006 the average
seasonal beach prices (over 5 months) were AUS$25.50/kg for
red, AUS$20.20/kg for pale, and AUS$18.60/kg for white
lobsters. For the winter period the average seasonal beach prices
(over 6 months) increased to AUS$36.00/kg for red, AUS$32.17
for pale and AUS$31.17/kg for white lobsters. Prices for
historical data were adjusted for inflation using national
consumer price index with 2005 as the base year.
Although commercial fishers record all catch and effort in
compulsory logbooks, this data series does not include colour of
catch. Consequently, the proportion of catch in each colour
grade was estimated on the basis of the average depth at which
�
�
Chapter 2 Economics of colour variation
�
26
pots were deployed as recorded by fishers. Gross revenue was
then estimated from catch, estimated proportions of catch in
each colour grade and the beach price for each colour grade.
The estimated gross revenue for the colour graded (discounted)
catch was then contrasted with estimated gross revenue that
would occur in the absence of price discounting by colour by
using only the beach price of red coloured lobsters. This
approach provided an estimate of the loss in revenue because of
differentiation based on colour only, but still inclusive of the
seasonal price differential.
2.3 Results
A strong relationship between depth of capture and lobster
colour was observed in all three states (Fig. 3). Red lobsters
comprised greater than 50% of the catch in depths less than 33
m in Tasmania, 43 m in Victoria, and 64 m in South Australia.
Significantly reduced proportions of red lobsters were
encountered in depths greater than 60 m but did not disappear
from the depth profile. The proportion of pale lobsters in depths
down to 100 m was higher in Tasmania and Victoria than in
South Australia and white lobsters were a minor component of
the colour composition in all states except in Tasmania where it
was 50% of the catch at 100 m depth (Fig. 3).

�
�
Chapter 2 Economics of colour variation
�
27
Fig. 3 Profile of colour change with depth of all lobsters sampled from each state: South Australia (1993–2005: n = 77, 102); Victoria (1993–2006: n = 68, 787); Tasmania (1993–2003: n = 340, 224). Numbers on the top of plots show the sample size for each depth interval. (Black area = red lobsters; Hatched area = pale lobsters; White area = white lobsters).

�
�
Chapter 2 Economics of colour variation
�
28
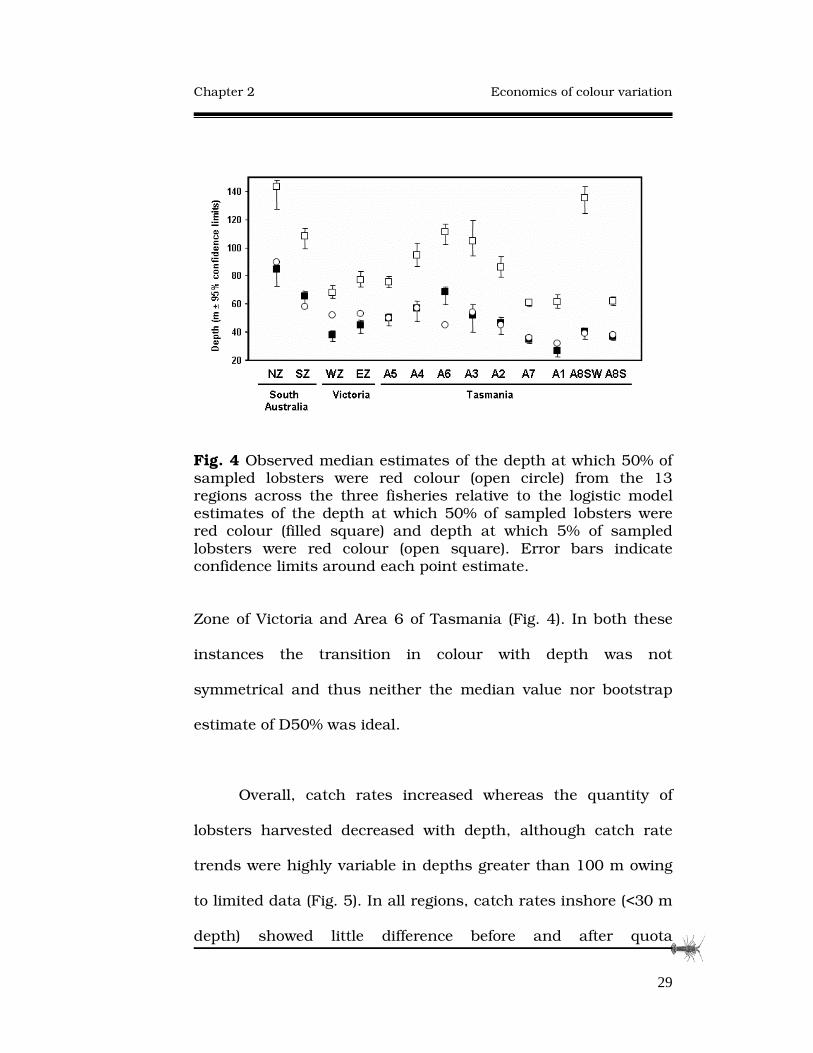
The depth at which 50% of lobsters were red (D50%)
varied between regions with a weak trend from the northwest of
South Australia to the southeast waters of Tasmania. The
shallowest D50% was observed in southern Tasmania with a
range of 32–39 m whereas the deepest D50% was observed in
the Northern Zone of South Australia at 90 m (Fig. 4). This
spatial trend was considered weak because variation between
locations was high, for example, a significantly higher D50%
value was estimated from Area 6 than from either of the adjacent
areas (Areas 5 and 7; Fig. 4). Model estimates of D5% relative to
D50% for each region indicate the rapidity of the transition from
red to pale colour with depth: where D5% is close to D50% the
transition is very sharp and occurs over a small depth range.
The difference between D5% and D50% was greatest for Area
8SW, however, this appears to be a spurious result given the
much smaller ranges for adjacent areas (Areas 8S and 1). This
atypical pattern in Area 8SW appeared to result because the
biological pattern was not correctly specified by a logistic
function in this single case so the model fit was poor at the
extremity of D5%. Overall the model estimates from the
bootstrapping analyses were similar to the observed median
depths for colour transition except for two sites, the Western
�
�
Chapter 2 Economics of colour variation
�
29
Fig. 4 Observed median estimates of the depth at which 50% of sampled lobsters were red colour (open circle) from the 13 regions across the three fisheries relative to the logistic model estimates of the depth at which 50% of sampled lobsters were red colour (filled square) and depth at which 5% of sampled lobsters were red colour (open square). Error bars indicate confidence limits around each point estimate.
Zone of Victoria and Area 6 of Tasmania (Fig. 4). In both these
instances the transition in colour with depth was not
symmetrical and thus neither the median value nor bootstrap
estimate of D50% was ideal.
Overall, catch rates increased whereas the quantity of
lobsters harvested decreased with depth, although catch rate
trends were highly variable in depths greater than 100 m owing
to limited data (Fig. 5). In all regions, catch rates inshore (<30 m
depth) showed little difference before and after quota

�
�
Chapter 2 Economics of colour variation
�
30
introduction but there was marked increase in the tonnages of
lobsters harvested. At greater depths, in the years post quota,
catch rates were at their highest whereas the average annual
catch remained unaffected in Areas 1 to 4 and dropped slightly
in Areas 5 to 8. In the years after quota introduction, there was
an increased shift in catch rate trends at all depths greater than
30 m in the southwest region of Tasmania (Areas 7 and 8), while
catch remained unaffected by management change.
The price differential between summer and winter months
increased more than two fold post quota owing to the
discounting value being less in winter (Table 1). Discounting of
catch on the basis of colour had a greater impact on gross value
of product (GVP) in summer than in winter owing to both greater
discounting in summer (when supply is greater) and also
increased supply of non-red coloured lobsters.

�
�
Chapter 2 Economics of colour variation
�
31
Fig. 5 Comparison between total numbers of lobsters harvested with depth (left column) and change in catch rates with depth observed (right column)(mean ± SD) for the four time periods for the four condensed regions of the Tasmanian fishery. (Note different scale on y axis).
0
30
60
90
1201992-94
1995-97
2000-02
2003-05
0
30
60
90
120
0
30
60
90
120
Ave
rage
ann
ual c
atch
(ton
nes)
±S
D
0
30
60
90
120
150
180
210
0 -1
011
-20
21 -
3031
-40
41 -
5051
-60
61 -
7071
-80
81 -
9091
-10
010
1 - 1
1011
1 - 1
2012
1 - 1
3013
1 - 1
40
0
1
2
3
4
0
1
2
3
4
5
0
1
2
3
4
5
Ave
rage
ann
ual c
atch
rat
e(k
g/po
tlift
) ±S
D
0
0.51
1.5
2
2.53
3.5
4
0 -1
011
-20
21 -
3031
-40
41 -
5051
-60
61 -
7071
-80
81 -
9091
-10
010
1 - 1
1011
1 - 1
2012
1 - 1
3013
1 - 1
40
Depth intervals (m)
Area 1 & 2
Area 3 & 4
Area 5 & 6
Area 7 & 8
0
30
60
90
1201992-94
1995-97
2000-02
2003-05
0
30
60
90
1201992-94
1995-97
2000-02
2003-05
0
30
60
90
120
0
30
60
90
120
0
30
60
90
120
0
30
60
90
120
Ave
rage
ann
ual c
atch
(ton
nes)
±S
DA
vera
ge a
nnua
l cat
ch (t
onne
s) ±
SD
0
30
60
90
120
150
180
210
0 -1
011
-20
21 -
3031
-40
41 -
5051
-60
61 -
7071
-80
81 -
9091
-10
010
1 - 1
1011
1 - 1
2012
1 - 1
3013
1 - 1
40
0
30
60
90
120
150
180
210
0 -1
011
-20
21 -
3031
-40
41 -
5051
-60
61 -
7071
-80
81 -
9091
-10
010
1 - 1
1011
1 - 1
2012
1 - 1
3013
1 - 1
40
0
1
2
3
4
0
1
2
3
4
0
1
2
3
4
5
0
1
2
3
4
5
0
1
2
3
4
5
0
1
2
3
4
5
Ave
rage
ann
ual c
atch
rat
e(k
g/po
tlift
) ±S
DA
vera
ge a
nnua
l cat
ch r
ate
(kg/
potli
ft) ±
SD
0
0.51
1.5
2
2.53
3.5
4
0 -1
011
-20
21 -
3031
-40
41 -
5051
-60
61 -
7071
-80
81 -
9091
-10
010
1 - 1
1011
1 - 1
2012
1 - 1
3013
1 - 1
400
0.51
1.5
2
2.53
3.5
4
0 -1
011
-20
21 -
3031
-40
41 -
5051
-60
61 -
7071
-80
81 -
9091
-10
010
1 - 1
1011
1 - 1
2012
1 - 1
3013
1 - 1
40
Depth intervals (m)
Area 1 & 2
Area 3 & 4
Area 5 & 6
Area 7 & 8
�
�
Chapter 2 Economics of colour variation
�
32
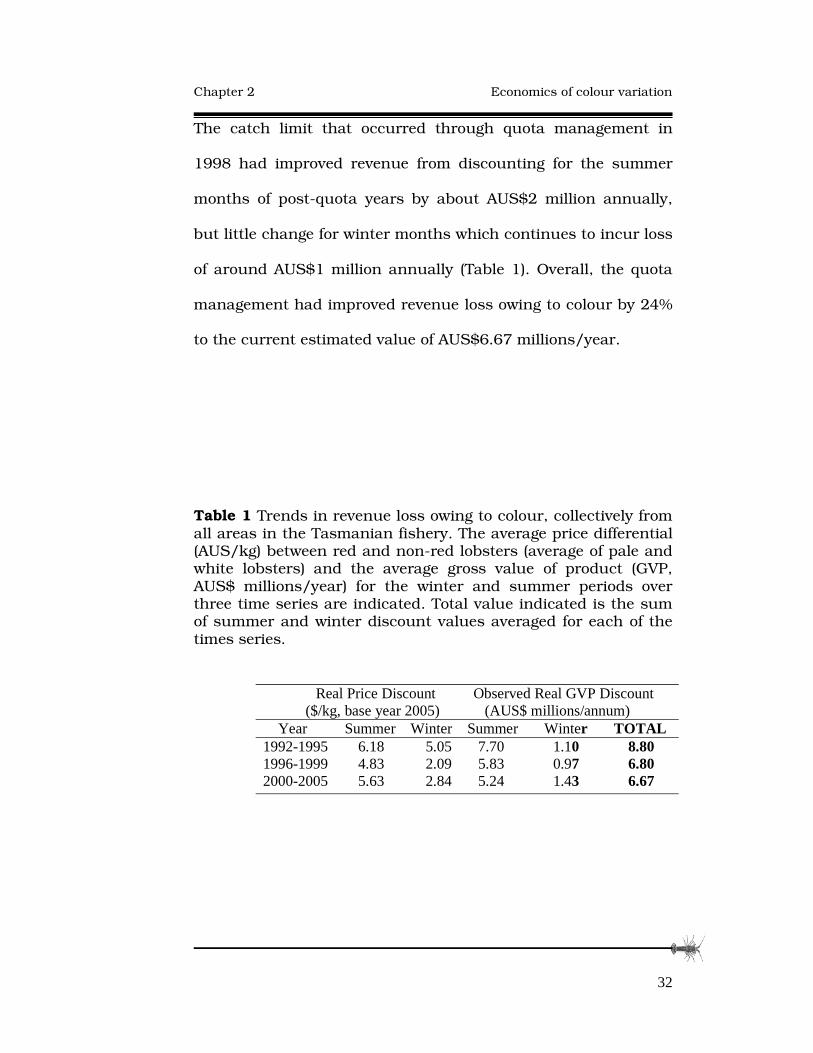
The catch limit that occurred through quota management in
1998 had improved revenue from discounting for the summer
months of post-quota years by about AUS$2 million annually,
but little change for winter months which continues to incur loss
of around AUS$1 million annually (Table 1). Overall, the quota
management had improved revenue loss owing to colour by 24%
to the current estimated value of AUS$6.67 millions/year.
Table 1 Trends in revenue loss owing to colour, collectively from all areas in the Tasmanian fishery. The average price differential (AUS/kg) between red and non-red lobsters (average of pale and white lobsters) and the average gross value of product (GVP, AUS$ millions/year) for the winter and summer periods over three time series are indicated. Total value indicated is the sum of summer and winter discount values averaged for each of the times series. �
Real Price Discount Observed Real GVP Discount ($/kg, base year 2005) (AUS$ millions/annum)
Year Summer Winter Summer Winter TOTAL 1992-1995 6.18 5.05 7.70 1.10 8.80 1996-1999 4.83 2.09 5.83 0.97 6.80 2000-2005 5.63 2.84 5.24 1.43 6.67
�
�
Chapter 2 Economics of colour variation
�
33
2.4 Discussion
2.4.1 Spatial variation in colour
We observed a clear transition in shell colour of J.
edwardsii with depth from a dark red colour in shallow depths
to a pale cream colour at deeper depths across all three states.
The rapidity in depth transition in shell colour was variable
between regions and around Tasmania, but had a weak
latitudinal trend, in a similar pattern to that which occurs with
depth range of red lobsters’ growth rates and size at onset of
female maturity across this region (McGarvey et al. 1999;
Gardner et al. 2006). The latter is thought to be driven by
differences in temperature whereas the strong relationship we
document between red shell coloration and depth appears to
have a dietary basis, presumably because of changes in reef
composition and in prey items with depth. Macro and encrusting
algal assemblages which dominate inshore reef systems produce
a wide variety of carotenoids which are then subsequently
consumed by herbivores and larger reef dwelling animals such
as lobsters who must acquire carotenoids dietarily (Goodwin
1960). Thus the concentration and intensity of red pigmentation
in the exoskeleton is accumulated through the absorption of

�
�
Chapter 2 Economics of colour variation
�
34
dietary carotenoids and carotenoproteins and the subsequent
synthesis into astaxanthin (Konosu and Yamaguchi 1994).
Aquaculture studies have manipulated pigmentation by differing
astaxanthin levels in artificial diets to produce different coloured
juvenile J. edwardsii (Crear et al. 2002, 2003) and American
lobster Homarus americanus (Tlusty 2005; Tlusty and Hyland
2005). Studies have also reported that both background
colouration and photoperiod to have no effect on the colouration
of juvenile southern rock lobsters (Stuart et al. 1996; Crear et al.
2003) and thus unlikely to be causative factors of colour
variation in adult J. edwardsii. Therefore, the pale coloration
deep waters rock lobsters around Tasmania, below the photic
zone, most probably infers to a shift in dietary composition that
is indicative of a shift in prey species or change in prey
availability. Given that the diet of deep-water lobsters is
unknown, shell colour could be used as a crude indicator of diet
quality, at least in terms of carotenoid intake.
The variation we observed in the spatial and depth range
of red lobsters may reflect the high variability in depth range and
compositional differences in macroalgal communities across
southern Australia. The penetration depth of light can vary in its
quality and in its intensity, reaching the reef surface with an
�
�
Chapter 2 Economics of colour variation
�
35
overall trend for this depth range to extend into deeper water as
wave exposure and water clarity increases (Edgar 2001). Depth
range of algal communities may also be influenced by seasonal
and temporal oceanographic processes such as localised up-
welling events which are common in the southeast region of
South Australia (Schahinger 1987). Furthermore, differences in
geology and hydrology between these regions may also be a key
factor as availability of homesites which provides adequate
protection and food source are also highly variable.
In all states, red lobsters are still present at depths to 100
m, well below the photic zone, and in Victoria white lobsters are
found in shallow-water depths of around 20–30 m. In these
instances, movement of lobsters rather than diet may account
for these observations. For example, in the spiny lobster
Panulirus cygnus, colour change in the wild can occur during its
intermoult period in association with an offshore migration event
at the onset of maturity, termed “the whites run” (Melville-Smith
et al. 2003). Large-scale migrations do not occur in Australian
populations of J. edwardsii and thus do not contribute to the
colour differences reported here (Gardner et al. 2003). However
small-scale along-shore movement undertaken by immature
females and males events are evident in some areas of the South

�
�
Chapter 2 Economics of colour variation
�
36
Australian (Linnane et al. 2005) and New Zealand fisheries
(Annala and Bycroft 1993). Seasonal fluctuations in food
resource and access to new spawning grounds are thought to be
some of the reasons for these small-scale movement patterns
and may explain some of the variation in the D50% red lobsters
between adjacent areas of the Tasmanian fishery.
�
2.4.2 Impact of colour variation on the fishery
Fleet movements typically reflect attempts by fishers to
find the optimal balance between costs (a function of catch rates)
and revenue (a function of volume of product and beach price).
The introduction of the quota systems in lobster fisheries across
southern Australia has provided the incentive to shift fishing
business strategy towards maximising catch value and
minimising fishing costs in response to fixed volume of product
(Bradshaw 2001). Fishers have the capacity to improve beach
price by adjusting their effort in response to colour and seasonal
differences in price. A general pattern is for fishers to target
inshore areas for red lobsters in summer when supply is high
and discounting for colour is greatest. In winter, fishers target
locations with higher catch rates with less regard for colour
because low supply leads to higher prices and less discounting
�
�
Chapter 2 Economics of colour variation
�
37
on the basis of colour. Ford’s (2001) review of the Tasmanian
Rock Lobster Industry 2 years after the introduction of the quota
system found that there was already a trend of shifting catches
to winter months. A socio-economic study on the impact of the
Tasmanian quota system conducted 2 years after the
introduction of quota, found only 25% of fishers had shifted
their effort inshore to target red-coloured lobsters whereas 60%
said they spent more time fishing in winter to seek higher prices
when supply was more limited (Frusher et al. 2003). These
trends in seasonal and spatial fishing patterns have altered little
since then. For the 2003–05 period, fishing trends showed
greater catch from shallow depth regions around Tasmania (with
the exception of Area 7 and 8) whereas catch rates remained
relatively low despite the intended stock rebuilding that was
intended to occur though the quota introduction. Greater
increase in catch rates in depths more than 50 m in all regions
around Tasmania was seen during the post-quota years
especially on the west coast. But despite high catch rates, catch
levels from these depths were low and were mostly exploited
during the winter months when the price differential between red
and non-red lobsters was small. Similar trends in catch rates by
depth were also evident in both South Australian and Victorian
�
�
Chapter 2 Economics of colour variation
�
38
fisheries (Department of Primary Industries 2003; Linnane et al.
2006).
Limited catches due to quota introduction resulted in a
large reduction in the price differential of lobsters, which has
increased the value of the industry by approximately AUS$2
millions for the post-quota years. While this is an economic
improvement, the discounting practise continues to have a
significant economic impact with the current estimated value of
revenue loss at AUS$6.67 millions/year. Greater supply of pale
lobsters during winter when demand for all coloured lobsters is
high largely reduced the discounting value by around 50% (Table
1), despite the worsening weather conditions during winter
months and lower catch rates at this time. Opportunities for
further reductions to discounting and reducing the impact of
fishing effort in the inshore areas are currently the major
challenges facing all the state fisheries. Options include
developing non-Asian markets such as those in the United
States and Europe where colour of lobsters is less important,
limiting harvest of pale lobsters to periods of high demand when
colour preferences become less critical and the allocation of
additional quota units for deep-water regions in order to shift
effort away from inshore areas. One management option

�
�
Chapter 2 Economics of colour variation
�
39
currently under consideration in all three states is the sea-
ranching of deep-water lobsters in shallow-water inshore areas
(Gardner and van Putten 2008a). Translocation of pale and white
coloured lobsters into areas of red coloured lobsters is aimed at
achieving fast improvements to market traits such as growth,
colour and condition which are assumed to be related to the diet
of these animals. Thus, both the spatial and depth variability in
lobster colour highlighted through this study and the current
significant economic impact owing to colour grading estimated
for the Tasmanian Fishery, provides valuable information for
future management plans.
�
�
�
�
�
�
�
�
�
�
�
�
�
�
�
Chapter 3 Market trait variation
�
40
�
�
�
Chapter Chapter Chapter Chapter
�
�����
�
Phenotypic variation among adult
southern rock lobsters, and response to translocation
This Chapter is prepared for submission to ICES Journal of Marine Science as:
Chandrapavan A, Gardner C, Green B.S, Linnane A, Hobday D. Exploiting phenotypic plasticity to enhance the market traits of a spiny lobster. �
3
�
�
Chapter 3 Market trait variation
�
41
Abstract
This study explored translocation as a method to increase the
value of less marketable deep-water southern rock lobster Jasus
edwardsii. Firstly, variation in the commercially important shell
colouration and body shape between deep-water and shallow-
water Tasmanian populations and among South Australian and
Victorian populations was quantified. Deep-water J. edwardsii
were pale coloured with longer walking legs but less meat
content than shallow-water, red coloured J. edwardsii. Body
shape traits were highly variable among deep-water populations
across the three States and also between the sexes in each
population. Deep-water lobsters were then translocated to a
shallow-water inshore reef to determine if the observed variation
in traits was plastic, and whether translocation could be used to
improve the quality of deep-water lobsters. Translocated lobsters
were monitored over a 14 month post-release period and during
this time they changed from a pale/white colour to the more
marketable red colour within one moult. Plasticity was observed
in abdomen morphology but not leg morphology. The
translocation experiment was successful in transforming
pale/white deep-water lobsters into red lobsters with higher
market value in a phenotypic response to altered environmental
conditions. Translocation appears to have commercial
�
�
Chapter 3 Market trait variation
�
42
application for exploiting natural plasticity in market traits of
lobsters to increase price.
3.1 Introduction
The price of live Australian southern rock lobster (Jasus
edwardsii) in its main export markets in Asia can vary according
to the colouration of the exoskeleton, overall body size and
shape, degree of injury to appendages and its vitality after live
transport. External appearances contribute to the price of
lobsters sold live because consumer preferences are highly
influenced by visual presentation. The most important market
trait is shell colour, which varies systematically with capture
depth and location throughout southern Australia (Chapter 2).
Shallow-water J. edwardsii are typically red, while lobsters
caught from depths greater than 30 m are paler and are
commercially graded into categories of “pale” and “white”
(Chapter 2). The fishing industry also differentiates lobsters on
morphometric traits that reduce meat content. Characteristics
associated with less meat yield such as long and spindly legs
and/or abdomens that are narrow compared to their carapace
�
�
Chapter 3 Market trait variation
�
43
are believed to be more pronounced in deep-water pale lobsters
than in shallow-water red lobsters.
The discounting of pale, deep-water lobsters based on
colour and morphology is a standard practice for most of the
year and greatest during summer months when supply is
greater. Colour discounting reduced revenue by an estimated
AUS$7 million or 12% of total revenue for the Tasmanian rock
lobster industry in 2008 (Chapter 2). Discounting is also an
issue for fisheries management as it influences fleet movements
within the Tasmanian rock lobster fishery, and increases fishing
pressure on the more depleted inshore stocks (Gardner et al.
2006). Management changes incorporating spatial elements are
currently under review, with aims of increasing profitability and
to reducing fishing pressure on inshore, more depleted reefs.
One option under consideration is sea ranching through the
translocation of pale-coloured, deep-water lobsters into inshore
reefs and the economic and biological feasibility of this strategy
is contingent upon translocated lobsters adopting the growth
rates and phenotypic characteristics of the resident shallow-
water population (Gardner and van Putten 2008a, b).

�
�
Chapter 3 Market trait variation
�
44
Differences in market traits may reflect differences in diet
and/or adaptation to local habitat and through translocation.
We investigate whether it is possible to harness the observed
phenotypic differences between deep and shallow-water J.
edwardsii to enhance its marketability. Our objectives for this
study were twofold. Firstly, we examined the magnitude of
phenotypic plasticity of the key market traits within the
Australian southern rock lobster fishery by quantifying the
variation in body-shape traits and shell colouration. Secondly,
we translocated deep-water lobsters into a shallow-water reef
inshore to test whether a change in habitat can induce a plastic
response. We assessed this by comparing the market traits of
the recaptured translocated lobsters with resident deep and
shallow water populations.
3.2 Materials and methods
3.2.1 Lobster collection and translocation
Lobsters used for colour analysis
Natural variation in shell colour was determined from
wild-caught, shallow-water (5 – 15 m) and deep-water (60 – 80
m) lobsters collected from Taroona Research Reserve (42.95°S,
147.34°E) and around Maatsuyker Island (43.38°S, 146.17°E)
respectively in Tasmania (TAS).
�
�
Chapter 3 Market trait variation
�
45
Lobsters used for morphometric analyses
For analysis of spatial variation in body-shape traits, South Australian
(SA) shallow-water lobsters (10 – 30 m) from Ringwood Reef (37.55°S,
140.05°E) and deep-water lobsters (40 - 100 m) from Robe (37.74°S,
139.84°E) and deep-water (70 – 110 m) lobsters from Victoria (VIC) (38.52°S,
141.53°E) were measured for comparisons with lobsters from the shallow and
deep-water TAS sites (Fig 1). All lobsters analysed were mature adults and
captured using baited pots and upon capture were measured, sexed, and clipped
on one pleopod. To estimate leg length and meat yield, the fourth walking leg
was removed by applying pressure to the base of the coxa to induce autotomy,
and immediately placed in ice, then later stored in a -30˚C freezer. Lobsters
with regenerated or damaged legs were not sampled. A sub-sample of the deep-
water and shallow-water populations was photographed for measurements of
shell colour and body-shape traits.
Translocation of lobsters
During November 2005, approximately 2000 adult lobsters
(68 - 120 mm) were trapped from around Maatsuyker Island and
translocated to Taroona Research Reserve. The reserve supports
a large population of fast-growing, red coloured Jasus edwardsii
protected from fishing. All translocated lobsters were individually
coded with T-bar tags in the ventral surface of the first
abdominal segment (coloured Hallprint T-bar anchor tag),
clipped on one pleopod, measured, and sexed. Taroona Reserve

�
�
Chapter 3 Market trait variation
�
46
was resampled at 5, 8, 12 and 14 months after release, and at
each time the same data was recorded for all recaptured
translocated lobsters and fourth walking leg (non-injured, non-
Fig 1. South-east region of Australia with deep and shallow-water sampling locations in Tasmania (MAT = deep-water site at Maatsuyker Island, TAR = shallow-water site at Taroona Marine Reserve), South Australia (ROB = deep-water site at Robe, RWR = shallow-water site at Ring-wood Reef) and Victoria (VIC = only deep-water site sampled). In Tasmania, lobsters for the translocation experiment were moved from MAT and released into TMR.

�
�
Chapter 3 Market trait variation
�
47
regenerated) was removed. If the same lobster was caught twice
the remaining fourth walking leg in the pair was removed. A sub-
sample of translocated lobsters (10 – 20 lobsters) was
photographed for measurements of shell colour and body-shape
traits. Moult growth increments of more than five millimetres
and the partial or complete regeneration of the cut pleopod were
used as moult confirmation (Ziegler et al. 2004).
3.2.2 Colour analysis
The range in natural colouration among red, pale and
white lobsters was quantified by image analysis of digital photos
taken of shallow-water and deep-water Tasmanian lobsters. Only
hard-shelled lobsters with minimal carapace fouling were
selected and colour was measured on five locations on the body,
including the dorsal and lateral surface of the carapace, dorsal
region of the abdomen closest to the carapace, the dorsal surface
of the telson and the ventral surface of the sternum (Fig. 2).
Colour changes in translocated lobsters were examined in all five
body locations of recaptured moulted and non-moulted lobsters
at each of the resampling surveys. The exoskeleton was blotted
dry before being photographed with a Nikon Coolpix 5400 digital
camera with a Nikon SL1 Macro Cool Light ring flash attached
by a Nikon UR-E11step-down ring lens adapter (adapted from

�
�
Chapter 3 Market trait variation
�
48
Tlusty, (2005)). A black cloth hood was attached at the base of
the ring flash to exclude external light. A 10 cm metal rod was
also attached at the base of the camera to ensure constant
distance from the exoskeleton. The camera was manually set
under the macro operating function (shutter speed - 1/8 second,
aperture - F4.4, picture quality - “normal”, light metering -
“spot”, white balance - “speed light”, sensitivity - “ISO100”,
image adjust and sharpness set to “auto”). Colour of the different
body locations was quantified using the histogram function in
Adobe Photoshop 7.0. Each image was opened in the RGB colour
mode and a circular region (diameter of 1000 pixels) was
measured for the mean values (darkest = 0 to lightest = 255) of
each of the red, green and blue channels. These three individual
channel values were added together to produce a single value for
each image ranging from 0 – 765 (range of combined RGB value).
This method was selected for analysis because we were only
interested in the final colour produced by the three colour
channels and not the changes or differences in the individual
colour channels between the colour categories. In all five body
locations the red channel dominated in intensity over the green
and blue channels, therefore only variants of the colour red was
present in our samples.
�
�
Chapter 3 Market trait variation
�
49
3.2.3 Morphometric analyses
Spatial and depth variation in leg length were compared
among shallow and deep-water lobsters collected from TAS, SA
and VIC sites. Prior to measurement, leg samples were thawed at
room temperature and blotted dry. Periopods were measured
along the dorsal length of the merus and the ventral length of
the propodus (excluding the connective tissues). Total leg length
(LL) was calculated from the combined lengths of the merus and
propodus. To determine meat yield of the fourth walking leg, wet
weight was recorded for the whole leg sample and the moisture
content was determined by drying overnight at 100˚C and then
reweighing the sample. Samples were then placed in a muffle
furnace for three hours at 550˚C, and reweighed to determine
the ashed weight. The difference between the wet and ashed
weights provided an estimate of the combined moisture and
organic weights of the meat content (g). Note that this method
overestimates the meat yield as our calculations also include the
water and organic content of the exoskeleton.
Spatial and depth variations in abdomen dimensions were
assessed from digital image analysis using Image J v1.33
software (Wayne Rasband, National Institute of Health, USA,
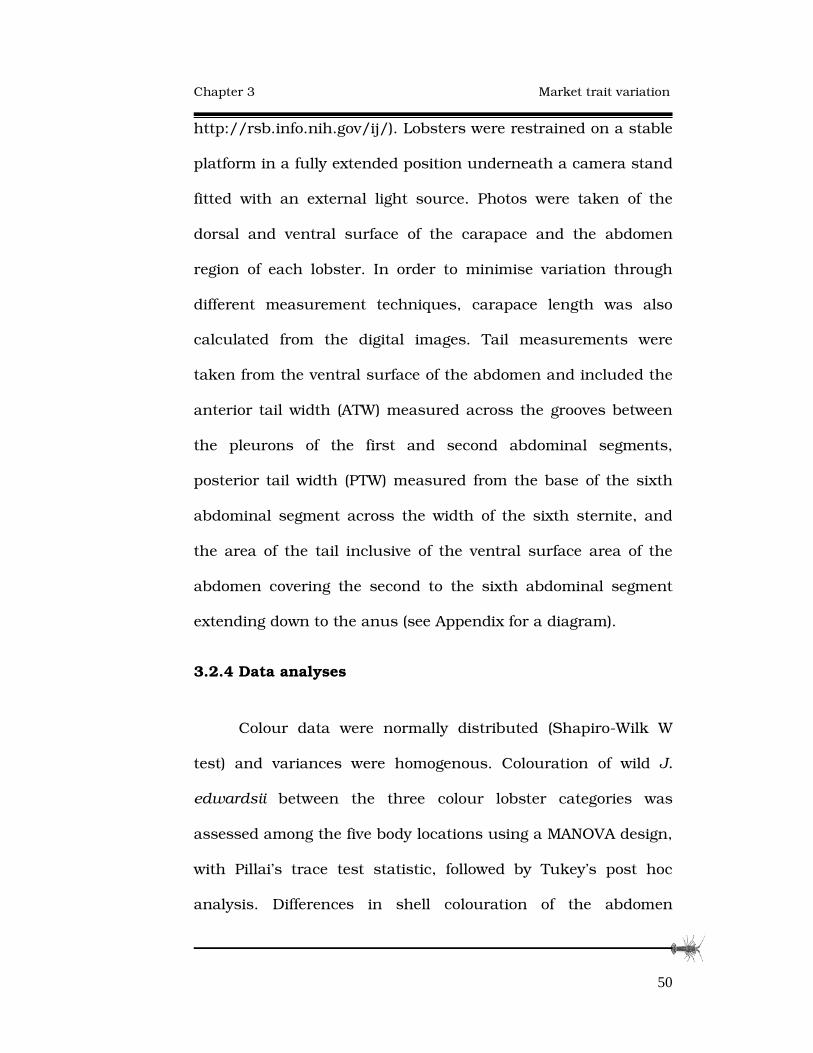
�
�
Chapter 3 Market trait variation
�
50
http://rsb.info.nih.gov/ij/). Lobsters were restrained on a stable
platform in a fully extended position underneath a camera stand
fitted with an external light source. Photos were taken of the
dorsal and ventral surface of the carapace and the abdomen
region of each lobster. In order to minimise variation through
different measurement techniques, carapace length was also
calculated from the digital images. Tail measurements were
taken from the ventral surface of the abdomen and included the
anterior tail width (ATW) measured across the grooves between
the pleurons of the first and second abdominal segments,
posterior tail width (PTW) measured from the base of the sixth
abdominal segment across the width of the sixth sternite, and
the area of the tail inclusive of the ventral surface area of the
abdomen covering the second to the sixth abdominal segment
extending down to the anus (see Appendix for a diagram).
3.2.4 Data analyses
Colour data were normally distributed (Shapiro-Wilk W
test) and variances were homogenous. Colouration of wild J.
edwardsii between the three colour lobster categories was
assessed among the five body locations using a MANOVA design,
with Pillai’s trace test statistic, followed by Tukey’s post hoc
analysis. Differences in shell colouration of the abdomen
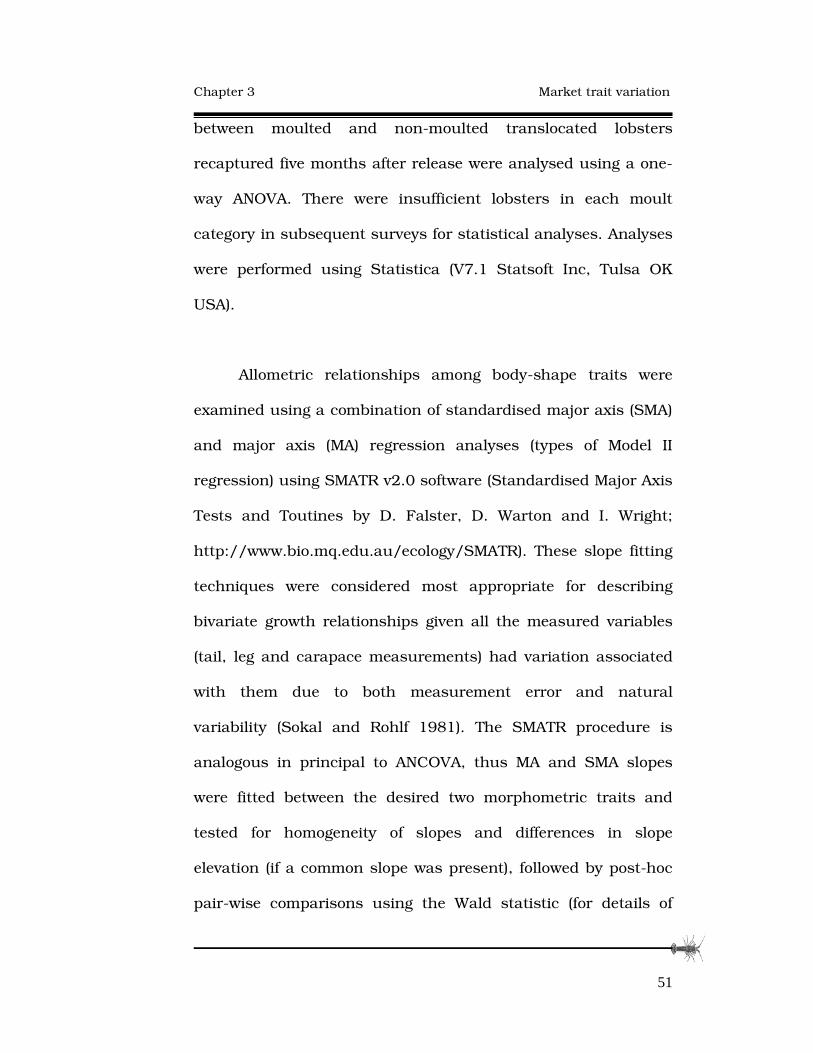
�
�
Chapter 3 Market trait variation
�
51
between moulted and non-moulted translocated lobsters
recaptured five months after release were analysed using a one-
way ANOVA. There were insufficient lobsters in each moult
category in subsequent surveys for statistical analyses. Analyses
were performed using Statistica (V7.1 Statsoft Inc, Tulsa OK
USA).
Allometric relationships among body-shape traits were
examined using a combination of standardised major axis (SMA)
and major axis (MA) regression analyses (types of Model II
regression) using SMATR v2.0 software (Standardised Major Axis
Tests and Toutines by D. Falster, D. Warton and I. Wright;
http://www.bio.mq.edu.au/ecology/SMATR). These slope fitting
techniques were considered most appropriate for describing
bivariate growth relationships given all the measured variables
(tail, leg and carapace measurements) had variation associated
with them due to both measurement error and natural
variability (Sokal and Rohlf 1981). The SMATR procedure is
analogous in principal to ANCOVA, thus MA and SMA slopes
were fitted between the desired two morphometric traits and
tested for homogeneity of slopes and differences in slope
elevation (if a common slope was present), followed by post-hoc
pair-wise comparisons using the Wald statistic (for details of
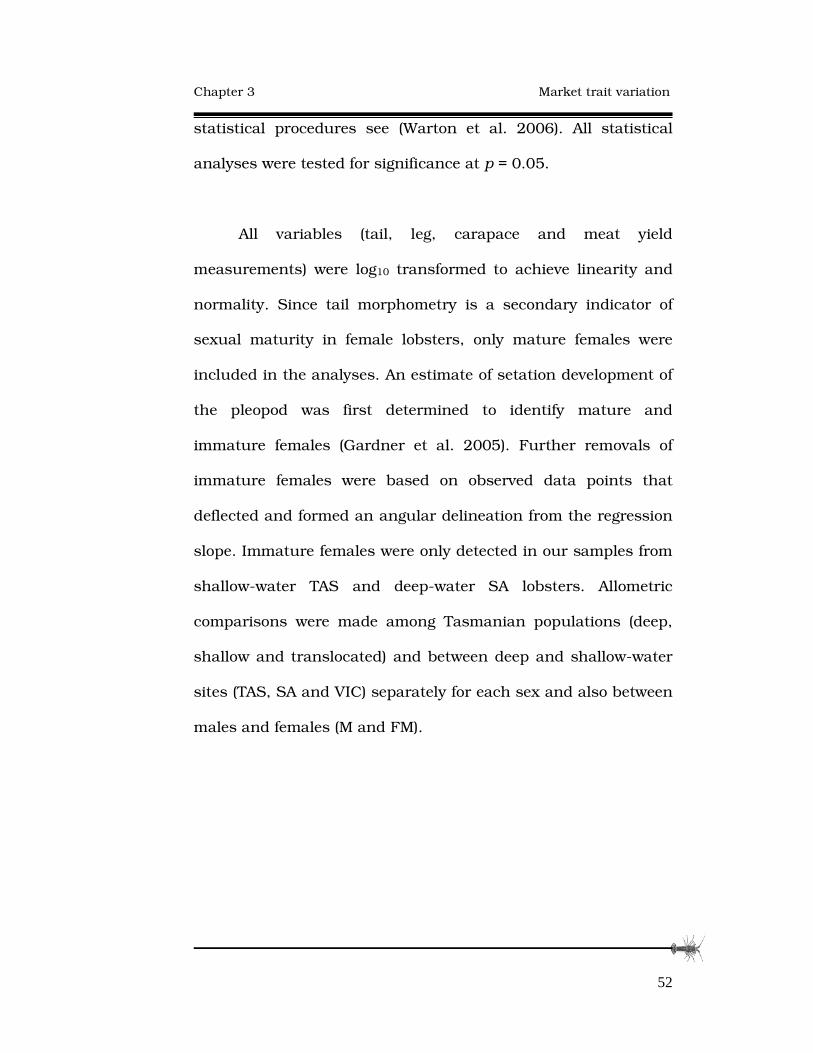
�
�
Chapter 3 Market trait variation
�
52
statistical procedures see (Warton et al. 2006). All statistical
analyses were tested for significance at p = 0.05.
All variables (tail, leg, carapace and meat yield
measurements) were log10 transformed to achieve linearity and
normality. Since tail morphometry is a secondary indicator of
sexual maturity in female lobsters, only mature females were
included in the analyses. An estimate of setation development of
the pleopod was first determined to identify mature and
immature females (Gardner et al. 2005). Further removals of
immature females were based on observed data points that
deflected and formed an angular delineation from the regression
slope. Immature females were only detected in our samples from
shallow-water TAS and deep-water SA lobsters. Allometric
comparisons were made among Tasmanian populations (deep,
shallow and translocated) and between deep and shallow-water
sites (TAS, SA and VIC) separately for each sex and also between
males and females (M and FM).

�
�
Chapter 3 Market trait variation
�
53
3.3 RESULTS
3.3.1 Shell colour variation
The natural shell colour of red lobsters had a RGB range
of 100 – 250, while pale and white lobsters ranged from 350 to
800 (Fig. 2). Shell colouration varied significantly between all
three market colour grades (F10,92 = 49.5, p < 0.001) as well
colouration between body locations (F12,135 = 21.0, p < 0.001)
with generally the dorsal surfaces more pigmented than the
ventral surfaces (Fig 3). Five months after translocation, moulted
lobsters were significantly darker than non-moulted lobsters,
and both females and males had changed from pale or brindle
coloration to the high market value red colouration (females,
F1,13 = 14.5, p = 0.01; males F1,6 = 14.0, p = 0.01). By the end of
the moulting period (10 months after translocation), all
translocated lobsters had changed colour from pale or white to
the red colour range. The timing of the colour change also
suggests that translocated males had begun moulting earlier
than resident males. Colour change was proportional in all body
locations, therefore only the results for the tail region are
presented (Fig. 4).
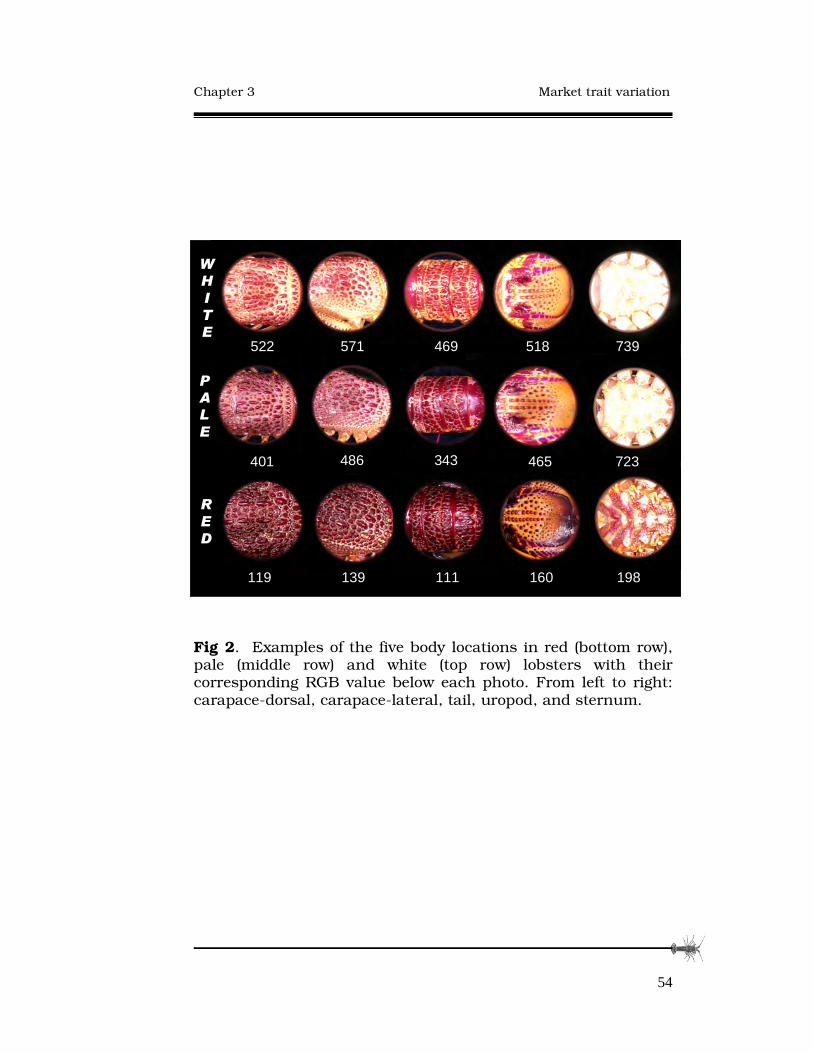
�
�
Chapter 3 Market trait variation
�
54
Fig 2. Examples of the five body locations in red (bottom row), pale (middle row) and white (top row) lobsters with their corresponding RGB value below each photo. From left to right: carapace-dorsal, carapace-lateral, tail, uropod, and sternum.
�
�
�
160111139119 198
�
�
�
�
�
571 469 518 739522
�
�
401 486 343 465 723
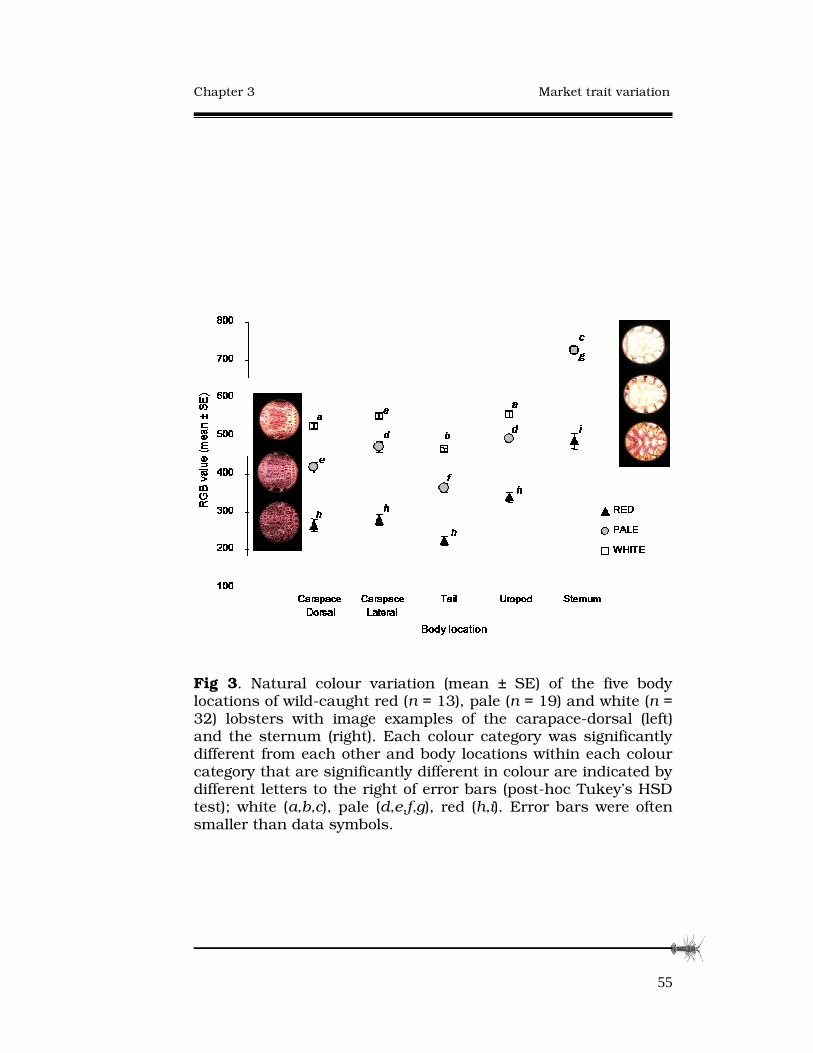
�
�
Chapter 3 Market trait variation
�
55
Fig 3. Natural colour variation (mean ± SE) of the five body locations of wild-caught red (n = 13), pale (n = 19) and white (n = 32) lobsters with image examples of the carapace-dorsal (left) and the sternum (right). Each colour category was significantly different from each other and body locations within each colour category that are significantly different in colour are indicated by different letters to the right of error bars (post-hoc Tukey’s HSD test); white (a,b,c), pale (d,e,f,g), red (h,i). Error bars were often smaller than data symbols.
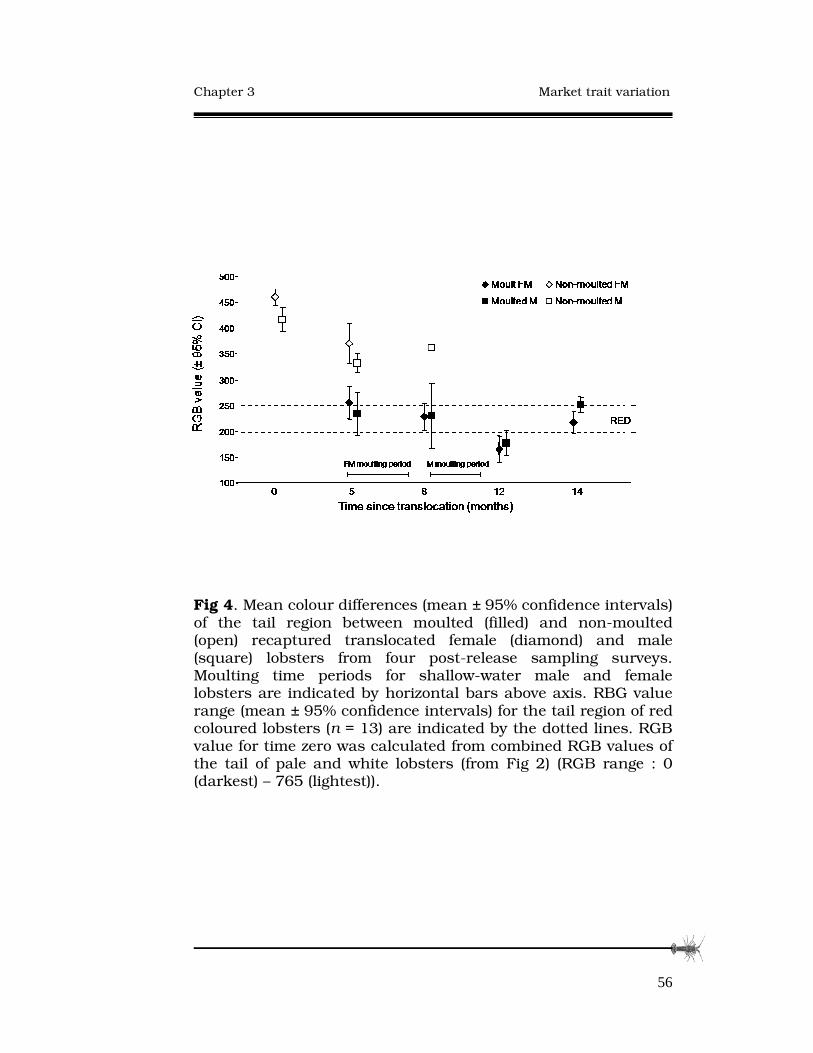
�
�
Chapter 3 Market trait variation
�
56
Fig 4. Mean colour differences (mean ± 95% confidence intervals) of the tail region between moulted (filled) and non-moulted (open) recaptured translocated female (diamond) and male (square) lobsters from four post-release sampling surveys. Moulting time periods for shallow-water male and female lobsters are indicated by horizontal bars above axis. RBG value range (mean ± 95% confidence intervals) for the tail region of red coloured lobsters (n = 13) are indicated by the dotted lines. RGB value for time zero was calculated from combined RGB values of the tail of pale and white lobsters (from Fig 2) (RGB range : 0 (darkest) – 765 (lightest)).

�
�
Chapter 3 Market trait variation
�
57
3.3.2 Body-shape variation�
Deep-water male and female TAS lobsters had longer legs
than shallow-water lobsters, but relative to their leg length,
significantly less meat content than shallow-water lobsters (Fig.
5). Males had longer legs than females among TAS deep and
shallow-water populations (p < 0.05, Table 1a). However, for any
given leg length, meat yield was greater in shallow-water TAS
females than males, but there was no differences in meat yield
between the sexes of deep-water TAS lobsters (p = 0.19, Table
1b). After their first moult there was no difference in leg length of
translocated lobsters (in either sex) compared to deep-water
lobsters. The tail area (TA) of shallow-water TAS males was
larger than the TA of deep-water males (Fig. 6a), but no
difference detected among TAS females (Fig. 6b). There was an
increase in the TA of translocated males to a similar size to that
of shallow-water males (Table 2a). No change was detected in the
TA of translocated females. In both sexes, the posterior tail width
(PTW) relative to anterior tail width (ATW) was wider in deep-
water TAS lobsters than in shallow-water TAS lobsters (Figs. 7a,
7b, Table 2b). In translocated males, the changes in the relative
width of the PTW was not significantly different from shallow and
deep-water males, and conversely in translocated females the
�
�
Chapter 3 Market trait variation
�
58
PTW was significantly less than deep-water lobsters and greater
than shallow-water lobsters.
Deep-water TAS male lobsters had longer legs than VIC
males while SA males were intermediate to TAS and VIC males
(Fig. 5c). Among deep-water female populations, SA females had
significantly shorter legs than TAS and VIC females (Fig. 5d).
There were no differences in leg length between TAS and SA
shallow-water males (Fig. 5e), but shallow-water SA females had
longer legs than TAS females (Fig. 5f). Among deep-water sites,
VIC lobsters had larger tail area than TAS and SA lobsters for
both sexes. Tail area did not differ between SA and TAS deep and
shallow-water populations (Figs. 6c, 6d). There was no difference
in the width of the PTW between deep-water SA and VIC males
but both populations had narrower PTW than TAS males (Fig.
7c). Conversely in deep-water females, the PTW was significantly
different widths between all three sites. For any given ATW, the
PTW was widest in TAS females followed by SA and narrowest in
VIC females (Fig. 7d).
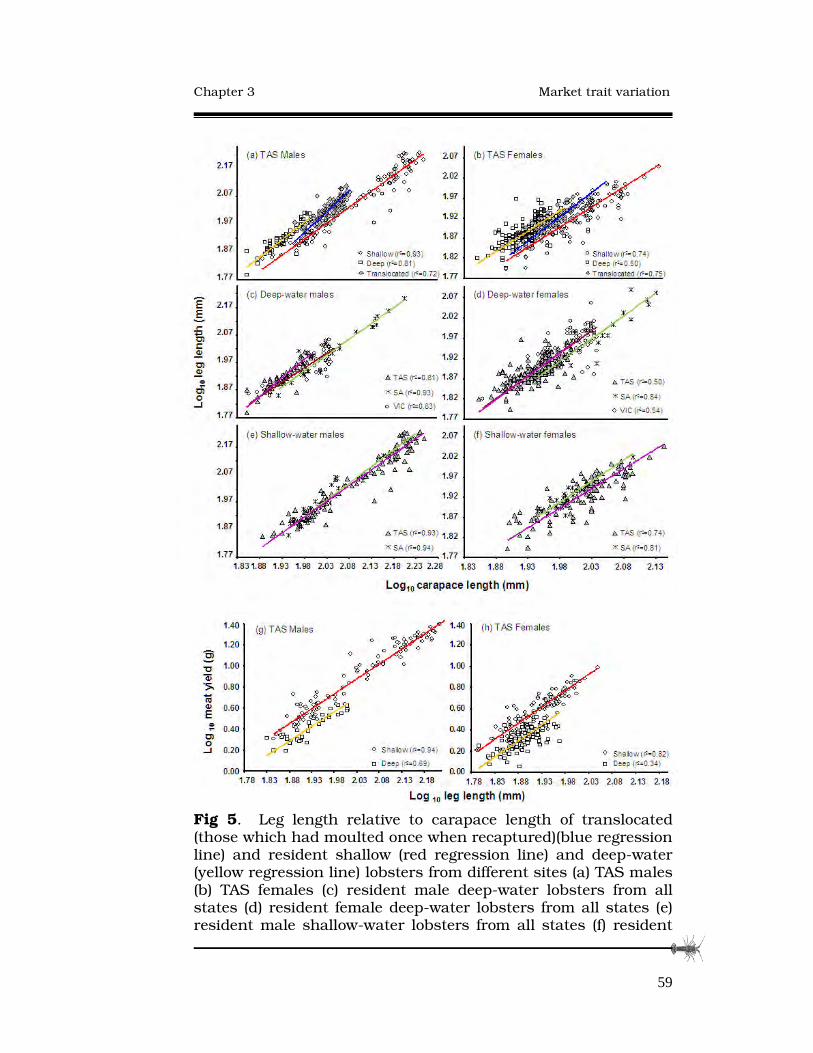
�
�
Chapter 3 Market trait variation
�
59
Fig 5. Leg length relative to carapace length of translocated (those which had moulted once when recaptured)(blue regression line) and resident shallow (red regression line) and deep-water (yellow regression line) lobsters from different sites (a) TAS males (b) TAS females (c) resident male deep-water lobsters from all states (d) resident female deep-water lobsters from all states (e) resident male shallow-water lobsters from all states (f) resident

�
�
Chapter 3 Market trait variation
�
60
female shallow-water lobsters from all states (TAS = purple, VIC = brown, SA = green regression lines) . Scatter plots of meat yield and leg length of TAS shallow-water and deep-water males (g) and (h) females are shown. Results of regression analyses based on these plots are presented in Table 1. Correlations values (r2) are shown on the legend of each plot.
�
�
Fig 6. Tail area relative to carapace length of translocated (those which had moulted once when recaptured) and resident shallow and deep-water lobsters from different sites (a) TAS males (b) TAS females (c) resident male deep-water lobsters from all states (d) resident female deep-water lobsters from all states. No data were available from resident shallow-water lobsters in SA and VIC sites. Results of regression analyses shown in these plots are presented in Table 2a. Correlations values (r2) are shown on the legend of each plot. �
�

�
�
Chapter 3 Market trait variation
�
61
�
�
�
�
�
�
Fig 7. The posterior tail width relative to anterior tail width of translocated (those which had moulted once when recaptured) and resident shallow and deep-water lobsters from different sites (a) TAS males (b) TAS females (c) resident male deep-water lobsters from all states (d) resident female deep-water lobsters from all states. No data were available from resident shallow-water lobsters in SA and VIC sites. �
�
�
�
�
Chapter 3 Market trait variation
�
62
Table 1. Regression statistics of the major axis (MA) regression analysis of (a) leg length and carapace length and standardised major axis (SMA) regression analysis of (b) meat yield and leg length. Results of comparisons between shallow, deep and translocated TAS populations and of deep and shallow-water lobsters are shown separately for each sex. Results of comparisons between males and females within each population are also given. Regression parameters of individual MA or SMA slope, common slope (CS) and intercept are indicated with (lower, upper 95% confidence intervals), differences in slope (��) and in elevation (�E) among populations were then tested for at the significance level of p = 0.05. Significant differences are indicated by different superscripts from post-hoc pair wise comparisons. Non-significance (p>0.05) indicated by the notation ‘ns’.
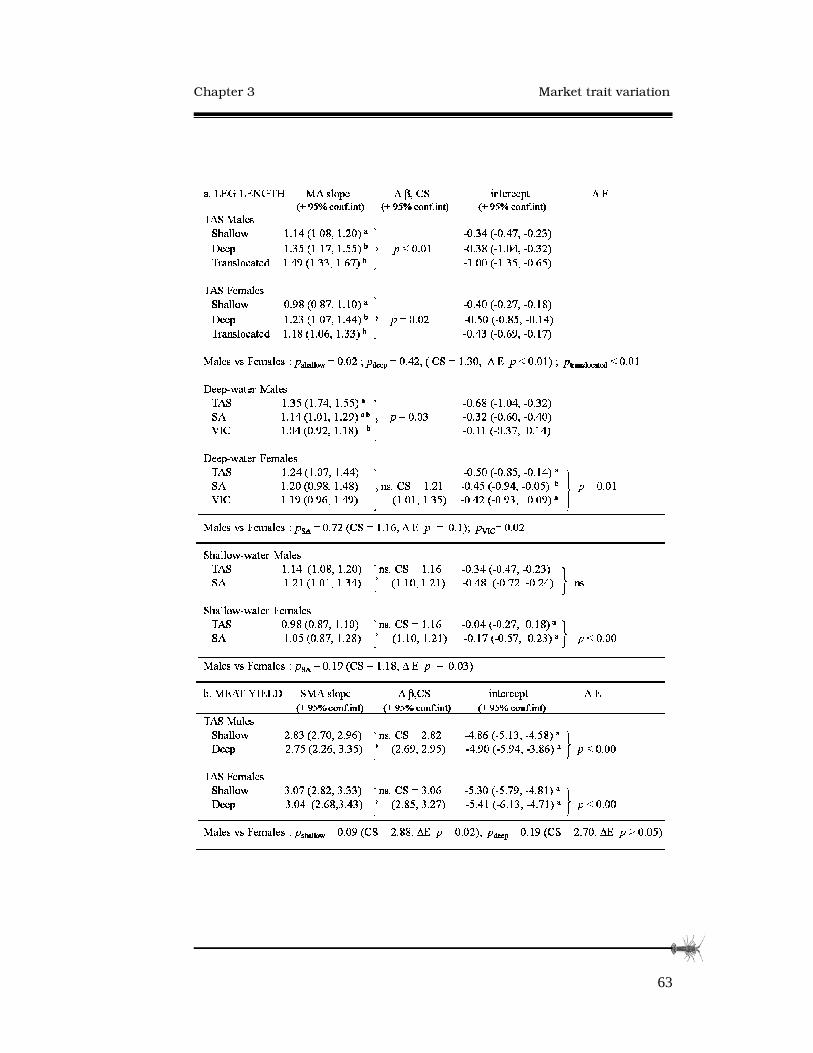
�
�
Chapter 3 Market trait variation
�
63
�
�
Chapter 3 Market trait variation
�
64
�
�
Table 2. Regression statistics of the major axis (MA) regression analysis of (a) tail area and carapace length and of (b) the posterior and anterior tail width. Results of comparisons between shallow, deep and translocated TAS populations and of deep and shallow-water lobsters are shown separately for each sex. Results of comparisons between males and females within each population are also given. Regression parameters as same as in Table 1.�� �
�
�
�
�
�
�
�
�
�
�
�
�
�
�
�
�
�
�
�
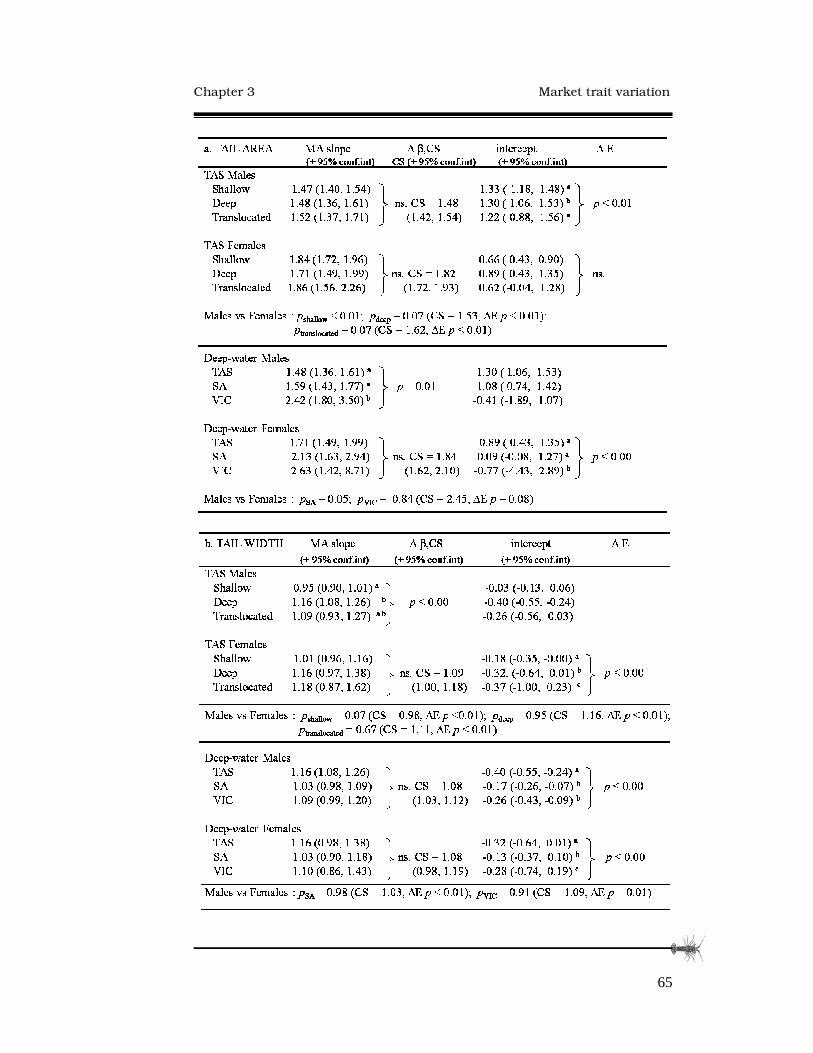
�
�
Chapter 3 Market trait variation
�
65
�

�
�
Chapter 3 Market trait variation
�
66
�
3.4 DISCUSSION
3.4.1 Natural variation in market traits
The observed variation in red colouration, and the relative
growth differences between carapace length, leg length, tail area
and tail shape between deep and shallow-water populations may
reflect differences in diet and/or adaptation to the local
environment driven by trade-offs between survival, growth and
reproduction. Shell colouration is influenced by the availability
of carotenoids derived from the diet (Rao 1985). The carotenoid
astaxanthin is produced by macro-algae species and through its
subsequent consumption by herbivores and larger predators it
becomes the primary pigment in crustacean shell colour
(Goodwin 1960; Meyers and Latscha 1997). In juvenile southern
rock lobsters, manipulation of tissue carotenoid levels and shell
colouration has been achieved through incorporating differing
astaxanthin levels in artificial feeds (Crear et al. 2003). Tlusty
and Hyland (2005) also produced similar results in juvenile
American clawed lobsters Homarus americanus and further
suggested that differences in the rates of carotenoid uptake and
deposition in the cuticle could additionally control phenotypic
colour variation. Aquaculture studies have also reported that
�
�
Chapter 3 Market trait variation
�
67
neither background colouration nor photoperiod affected
colouration of juvenile southern rock lobsters (Stuart et al. 1996;
Crear et al. 2003). Sea-cage experiments aimed at colour
enhancement in pale, deep-water adult J. edwardsii had
produced red lobsters with supplemented feeding, but colour
improvement in starved, pale lobsters also occurred, with the
authors concluding that the experimental lobsters consumed
biofouling organisms from cage surfaces (Bryars and Geddes
2005). For adult J. edwardsii shell colour may depend on diet
but it is unclear as to what extent colour expression reflects an
adaptive plastic response to its physical environment or to
physiological and behavioural stimuli.
There were morphological differences between deep and
shallow-water Tasmanian lobsters when assessed by leg length,
tail shape and tail area. These differences in body-shape imply
differences in meat yield as evident from the analysis of one of
the walking legs. The narrow tail shape reported for deep-water
lobsters was however not observed and rather the reverse trend
with shallow-water lobsters with narrower tails than and deep-
water lobsters. There was substantial variation in the body-
shape of J. edwardsii populations across the three states
although not with any systematic pattern such as a latitudinal

�
�
Chapter 3 Market trait variation
�
68
trend. Allometric differences in morphology were also
pronounced between the sexes. Sexual dimorphism may be
responsible for the differences in tail characteristics, while
differences in leg length and meat yield between the sexes could
be due to differences in their metabolic rates. Similar differences
have been observed in the clawed lobsters Homarus americanus
and Homarus gammarus, where males and females from
geographically different sites show variations in morphology
despite their lack of movement and genetic differentiation
(Debuse et al. 2001; MacCormack and DeMont 2003). The
proposed causative factors of phenotypic plasticity were lobster
density, water temperature, food availability and interactions
among conspecifics. All of these factors potentially contributed to
the observed differences between deep and shallow water
lobsters in this study.
3.4.2 Market traits response to translocation and its
commercial significance
Colour change in translocated J. edwardsii was a
significant outcome of this study and consistent with colour
change resulting from a change in diet. It contrasts with the
colour transformation observed in the western rock lobster
�
�
Chapter 3 Market trait variation
�
69
Panulirus cygnus, which changes from a red to paler colouration
prior to its migration to offshore breeding grounds (Melville-
Smith et al. 2003). In this case, the distinct red to white colour
transition in P. cygnus is assumed to have a genetically
controlled mechanism (Wade et al. 2005). Changes in colour
within a moult are also possible (Davis et al. 2005), but this is
unclear from our results as increase in fouling during inter-
moult masks any minor colour change. For deep-water J.
edwardsii moulting was required following translocation in order
for a more marketable red colouration and from a commercial
point of view this increases its marketability and value.
Allometric changes in morphology after translocation
varied among the body-shape traits and were also influenced by
gender. The relative growth of the tail area of translocated males
was similar to those of the resident shallow-water males after
their first moult in the new habitat, demonstrating a high degree
of plasticity. In another instance, the posterior tail width (PTW)
of translocated females was statistically different but growth
changes intermediate between deep and shallow-water females,
while the PTW of translocated males were indistinguishable from
both shallow and deep-water males. While there was no
significant change in the leg length to carapace relationship in
�
�
Chapter 3 Market trait variation
�
70
translocated lobsters, graphical plots (Figs. 5a, 5b) indicate a
transitional shift towards the resident population. Leg length
may be less responsive to habitat change than the other traits
examined and may require several moults for a complete
transformation.
While there are many stock enhancement operations
utilising hatchery reared juveniles (Bell et al. 2008; Zohar et al.
2008), the capture, translocation and release of adults in the
marine environment is less common. However translocation has
been adopted for similar value-adding strategies in other
commercial species. For example, the roe size and quality of sea
urchins are being enhanced in France by transplanting adults
with poor quality gonads from polluted and barrens areas into
areas dense in algal assemblages (Martin 2004). Abalone is
another high value seafood product where transplant
experiments had shown to improve the growth rates of stunted
populations (Dixon and Day 2004). The success of all stock
enhancement and sea ranching strategies depend on several
associated factors including its economic feasibility (Bartley and
Bell 2008), but for the Australian southern rock lobster
industries, this study highlights translocations’ potential in
providing an opportunity to add value to its less marketable
�
�
Chapter 3 Market trait variation
�
71
product through improving its key market traits of colour and
morphology.
Translocation appears to have commercial application for
exploiting natural plasticity in market traits of lobsters to
increase beach price. For deep-water Jasus edwardsii
translocated to shallow-water, a single moult was sufficient to
elicit significant changes in colour and a range of changes in
body-shape traits as they grew in their new environment. Given
colour has a higher priority over body-shape traits when setting
the market price, there may still be a low risk of continued
discounting by processors for translocated red lobsters with
narrow tails or short legs. These issues needs to be addressed
through further market research to assess industry and market
response to market traits in translocated lobsters and determine
if both the consumer and the processor are able to discriminate
between legal size shallow and translocated lobsters. For the
Australian southern rock lobster industry, this study highlights
the potential of translocation to add value through transforming
lobsters from undesirable phenotypes to desirable ones and offer
a novel approach to fisheries management.
�
�
Chapter 4 Lipid and fatty acid variation
�
72
�
�
�
Chapter Chapter Chapter Chapter
�
�����
�
�
Variation in the lipid and fatty acid content of adult southern rock
lobsters, and response to translocation
This chapter previously published as:
Chandrapavan A, Guest M.A, Nichols P.D, Gardner C (2009). Translocating southern rock lobsters (Jasus edwardsii) from deep-water to shallow inshore water enhances nutritional condition through omega-3 long-chain polyunsaturated fatty acid content. Journal of Experimental Marine Biology and Ecology 375: 9-15. �
4
�
�
Chapter 4 Lipid and fatty acid variation
�
73
Abstract
Deep-water southern rock lobsters (Jasus edwardsii) were
translocated into shallow-water inshore reefs around Tasmania
in an attempt to enhance their growth rates and market traits.
We assessed changes in nutritional condition in adult, deep-
water lobsters before and 12 months after relocation through
variations in the lipid and fatty acid profiles in the
hepatopancreas and muscle. Fatty acid compositions were
similar between shallow and translocated lobsters and both were
different from deep-water lobsters, suggesting a dietary
difference between the deep and shallow-water lobsters, and a
dietary change in deep-water lobsters after translocation.
Nutritional condition indices, such as total lipid and
triacylglycerol content, did not significantly vary between the
lobster populations which may be due to within-population
variability driven partly by differences in the moult stage of
lobsters. Mean concentrations of fatty acids, lipid content and
essential polyunsaturated fatty acids (PUFA) were higher in
translocated lobsters than in both deep and shallow-water
lobsters. Mean omega-3 long-chain PUFA content, in particular
eicosapentaenoic acid (EPA, 20:5n-3) increased by 30% in the
muscle of translocated lobsters, resulting in an enhanced
nutritional value and a change in overall body condition. This�
�
�
Chapter 4 Lipid and fatty acid variation
�
74
enhancement of key fatty acids, achieved through translocation,
highlights the market potential of translocation for the
commercial industry.
4.1 Introduction
The southern rock lobster (Jasus edwardsii) fishery in
Tasmania currently operates below its optimal yield limit due to
considerable regional and depth variation in biological traits of
the lobsters (Gardner and van Putten 2008a, b). Within the
fishery there are differences in key market traits such as shell
colouration, size and body shape. Biological and market trait
differences are greatest between the inshore shallow-water
lobsters characterised by fast growth rates and bright red shell
colour, and offshore deep-water lobsters characterised by slow
growth rates and pale shell colour (Chapter 2). Considerable
differences in size at sexual maturity (Gardner et al. 2006),
seasonal catchability and possibly vitality during live transport
occur between these populations and are further responsible for
the greater fishing effort in inshore areas for the highly valued
shallow-water lobster (Ford 2001). Biological variations between
deep and shallow water J. edwardsii populations are assumed to
�
�
Chapter 4 Lipid and fatty acid variation
�
75
be related to differences in habitat and in particular the diet of
these animals, but this has not previously been examined.
To increase the value, yield and sustainability of this
resource, spatial management strategies aimed at optimising
yield and marketability of the deep-water lobster stocks are
currently being explored. One approach is stock enhancement
through a form of sea-ranching. Large numbers of lower valued,
sub-legal sized, adult, deep-water lobsters were translocated to
shallow-water reefs inshore, where resident lobsters have a
higher market value. Key variables in this mediated movement
will be a change in diet and water temperature, although these
were not directly measured. After their first moult event in the
new habitat, translocated lobsters changed from a pale
colouration to the marketable red colour of the resident lobsters,
and growth increments showed a 2 to 3 fold increase (Chapter
6). What remains unclear is the role of diet in these
transformations and to what extent nutritional condition of rock
lobsters has been altered through translocation.
�
Indices of nutritional condition that are sensitive to dietary
changes include total lipid content (energy reserves), the
proportion of structural (phospholipid) versus storage lipid

�
�
Chapter 4 Lipid and fatty acid variation
�
76
(triacylglycerol), fatty acid composition and ratios of specific fatty
acids (Kanazawa and Koshio 1994; Ju and Harvey 2004). These
indices have been used to examine differences in body condition
caused by dietary stress such as starvation in crustaceans
(Jones and Obst 2000; Moore et al. 2000; Parslow-Williams et al.
2001), spatial variation within populations of the same and
related species (Iverson et al. 2002, Murphy et al. 2002, Phillips
et al 2003a, 2003b) and between wild and cultured populations
(Navarro and Villanueva 2003; Nelson et al. 2005). For
crustaceans, interpretation of nutritional information must also
consider the physiological condition of animals such as
reproductive and moult cycle (Chang and O’Connor 1983;
D’Abramo 1997), and the functional role of the tissue analysed
as these can alter the relative quantity and type of lipid reserves.
For example, the digestive gland (hepatopancreas) of decapod
crustaceans is primarily involved in the digestion and absorption
of food material, lipid synthesis and storage, and in regulating
energy metabolism (O’Connor and Gilbert 1968; Gibson and
Barker 1979). Lipid reserves found in this gland are typically
high and respond rapidly to changes in physiological and
environmental parameters such as dietary stress caused by
altered feeding rates, moulting and reproduction (Sargent 1974;
McLeod et al. 2004). By contrast, muscular tissues such as
�
�
Chapter 4 Lipid and fatty acid variation
�
77
walking legs are low in lipid which is predominantly present in
bio-membranes as phospholipids, and do not respond readily to
short term changes in physiological and environmental
parameters (Cockcroft 1997). This slow tissue turnover rate
means they are useful in understanding the longer term dietary
changes experienced by the animal (Corraze 1999).
In the present study, we quantified the lipid content, lipid
class and fatty acid compositions of both the digestive gland and
leg muscle of shallow-water, deep-water and recaptured
translocated lobsters to examine differences in their nutritional
condition through short-term and long-term changes, and to
understand the dietary plasticity of J. edwardsii through the in
situ change of lobster habitat and diet.
4.2 Materials and Methods
4.2.1 Translocation and lobster collection
One of the principal translocation release sites, Taroona
Marine Reserve, is located in the Derwent Estuary in Tasmania
and extends 800 m from the shoreline covering an area of 1.0
km2 with a depth range of 1 to 15 m. The reserve supports high
�
�
Chapter 4 Lipid and fatty acid variation
�
78
densities of fast growing, red coloured Jasus edwardsii.
Maatsuyker Island lies 10 km off the south coast of Tasmania in
the southern ocean with a depth range down to 100 m and
consists of rocky outcrops and patchy reefs (Fig. 1). These reefs
are characterised by high densities of slow growing, pale
coloured lobsters (Punt and Kennedy 1997).
In November 2005, approximately 2000 sub-legal sized
lobsters (68-120 mm) of both sexes were captured using baited
lobster traps at depths between 60-80 m around Maatsuyker
Island. Lobsters were tagged ventrally in the abdomen (with a
coloured Hallprint T-bar anchor tag), one pleopod clipped and
bio-data recorded. Prior to release of translocated lobsters,
digestive gland and leg muscle tissue samples of hard-shelled,
male lobsters of varying sizes were collected from 10 shallow-
water lobsters from the Taroona site and 9 deep-water lobsters
from the Maatsuyker site. The Taroona site was surveyed twelve
months later in November 2006, when translocated lobsters
were recaptured and digestive gland and leg muscle samples
were collected from 10 hard-shelled male lobsters. Selection of
lobsters for analysis included those which had moulted at least
once since release, and changed in shell colour from pale to
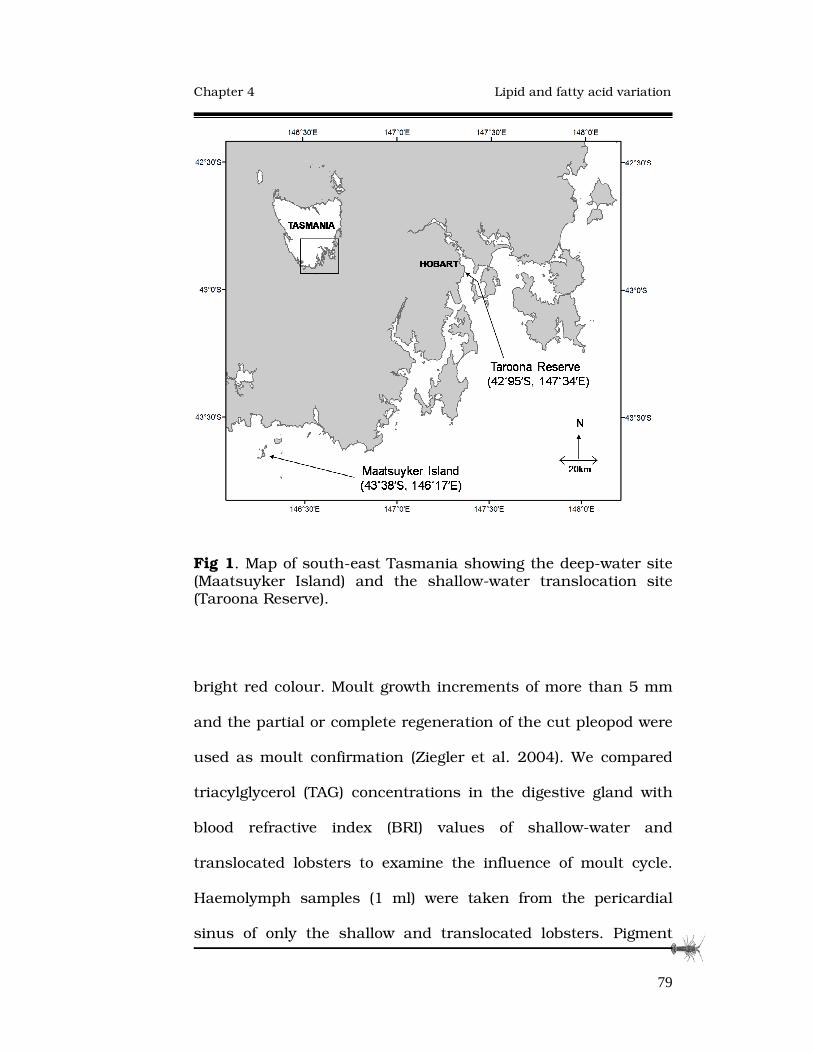
�
�
Chapter 4 Lipid and fatty acid variation
�
79
Fig 1. Map of south-east Tasmania showing the deep-water site (Maatsuyker Island) and the shallow-water translocation site (Taroona Reserve).
bright red colour. Moult growth increments of more than 5 mm
and the partial or complete regeneration of the cut pleopod were
used as moult confirmation (Ziegler et al. 2004). We compared
triacylglycerol (TAG) concentrations in the digestive gland with
blood refractive index (BRI) values of shallow-water and
translocated lobsters to examine the influence of moult cycle.
Haemolymph samples (1 ml) were taken from the pericardial
sinus of only the shallow and translocated lobsters. Pigment
�
�
Chapter 4 Lipid and fatty acid variation
�
80
stage (PS) of the haemolymph was noted (Musgrove 2001) and
then an aliquot of the sample was placed in a hand-held
refractometer (Model UR-2, Industrial and Scientific Supply Co.)
to measure blood refractive index. The blood protein/pigment
stage index developed by Musgrove (2001) for J. edwardsii was
used as an additional condition index. The BRI is directly
proportional to the concentration of protein in blood of J.
edwardsii (Oliver and MacDiarmid 2000; Musgrove 2001), which
increases as body condition improves from the post-moult to
pre-moult stage of the moult cycle. Haemolymph colour is
indicative of the pigment astaxanthin, which increases in
concentration during the late inter-moult to pre-moult stage and
can be visually assessed for colour change. Both BRI and PS
provide a crude indication on the moult stage, particularly in
differentiating the beginning, middle and end phases of the
cycle. Animals in post-moult to early-inter-moult stage will have
low BRI values and PS of clear/grey colour. During the long
inter-moult period as water is replaced by tissue growth in
lobsters, BRI increases while the PS remains colourless. As
lobsters approach the pre-moult stage, reabsorption of the old
shell causes blood pigment to change progressively from clear to
dark red colour and BRI levels are at their highest. Although we
selected hard-shelled lobsters for analysis, these additional

�
�
Chapter 4 Lipid and fatty acid variation
�
81
indices provide more precise information on the moult condition
of the lobsters. Animals were killed in freshwater before a single
lobe of the digestive gland was dissected for lipid and fatty acid
analyses. Muscle tissue from the fourth right or left walking leg
was also removed and all samples stored in a –20˚C freezer prior
to analysis.
4.2.2 Lipid and fatty acid analyses
All lobster digestive gland and muscle samples (as wet
tissues) were quantitatively extracted overnight using a modified
Bligh and Dyer (1959) one-phase methanol:chloroform:water
extraction (2:1:0.65 v/v/v). Phases were separated the following
day by addition of chloroform and water (final solvent ratio,
1:1:0.9 v/v/v methanol: chloroform: water). Lipids were
recovered in the lower chloroform phase, solvents removed under
vacuum, the concentrated lipid recovered through rotary
evaporation at 40ºC, then weighed to obtain total lipid content.
An aliquot of the total lipid extract (TLE) was analysed using an
Iatroscan MKV TH10 thin layer chromatography flame ionisation
detector analyser (Tokyo, Japan) to determine the proportions of
individual lipid classes. A polar solvent system (60:17:0.1 v/v/v
ratio of hexane: ether: acetic acid) resolved TAG, free fatty acids,

�
�
Chapter 4 Lipid and fatty acid variation
�
82
sterols and phospholipids. Peaks were quantified with DAPA
Scientific Software (Kalamunda, Western Australia).
An aliquot of the TLE was transmethylated at 80ºC for 2 h
in a 10:1:1 v/v/v mixture of methanol: hydrochloric acid:
chloroform to produce fatty acid methyl esters (FAME). FAME
were partitioned by the addition of water and extracted with 4:1
hexane: chloroform (v/v, 3 x 1.5 ml), the solvent removed under
a stream of nitrogen, then silylated at 60ºC for 2h in N, O-bis-
(trimethysilyl)-triflouracetamide (BSTFA). FAME were analysed
by gas chromatography (GC) using a Agilent Technologies 6890N
GC (Palo Alto, California, USA) equipped with an Equity™-1
fused silica capillary column (15 m × 0.1 mm i.d., 0.1µm film
thickness), an FID, a split/splitless injector and an Agilent
Technologies 7683 Series auto sampler and injector. Helium was
the carrier gas, and pressure was maintained at 65 kPa.
Samples were injected in splitless mode with an oven
temperature of 120ºC, and temperature was increased to 250ºC
at 10ºC / min, and finally to 270ºC at 3ºC / min. Peaks were
quantified with Agilent Technologies ChemStation software (Palo
Alto, California, USA). Individual components were identified by
mass spectral data and by comparing retention time data with
those obtained for authentic and laboratory standards. GC
�
�
Chapter 4 Lipid and fatty acid variation
�
83
results are typically subject to an error of up to ± 5% of
individual component area. GC-mass spectrometric (GC-MS)
analyses were performed on a Finnigan Thermoquest GCQ GC-
mass spectrometer fitted with an on-column injector and using
Thermoquest Xcalibur software (Austin, Texas, USA). The GC
was equipped with an HP-5 cross-linked methyl silicone fused
silica capillary column (50 m × 0.32 mm i.d.) of similar polarity
to that used for GC analyses and helium was used as carrier
gas.
4.2.3 Statistical analyses
A combination of analysis of covariance (ANCOVA) and
multivariate analysis of covariance (MANCOVA) were used to
compare total lipid content, TAG content and fatty acid
compositions between shallow-water, deep-water and
translocated lobster populations using lobster size (carapace
length) as a covariate. All variables were normally distributed
after transformations of log10 of digestive gland data and log2
transformation of leg muscle data (Shapiro-Wilk W test and
normal probability plots) and there was no violation of the
homogeneity of slopes assumption. Pillai’s trace test was used as
multivariate test of significance and significant effects were
�
�
Chapter 4 Lipid and fatty acid variation
�
84
further examined using Tukey’s post-hoc analysis. Statistical
analyses were performed using Statistica (V7.1 Statsoft Inc,
Tulsa OK USA). All identified individual fatty acids (expressed as
percentage of total fatty acids) were compared among deep-
water, shallow-water and translocated lobsters using principal
components analysis (PCA). PCA reduces the number of
variables by producing components using linear correlations
between variables to identify those fatty acids that contribute
most to the separation between observed groups and was
performed using PRIMER 6 software (PRIMER-E, Plymouth, UK).
4.3 Results
4.3.1 Total lipid content and lipid class composition
Mean total lipid content (mg g-1 wet wt.) of the digestive
gland did not significantly vary between deep-water, shallow-
water and translocated lobster populations (F2,25 = 0.56, p =
0.58). The major lipid class in the digestive gland was
triacylglycerol (TAG) followed by phospholipid (PL), free fatty-acid
(FFA) and sterol (ST) (Table 1). TAG concentrations in the
digestive gland did not vary between the lobster populations
(F2,24 = 0.41, p = 0.66). Total lipid content in the leg muscle
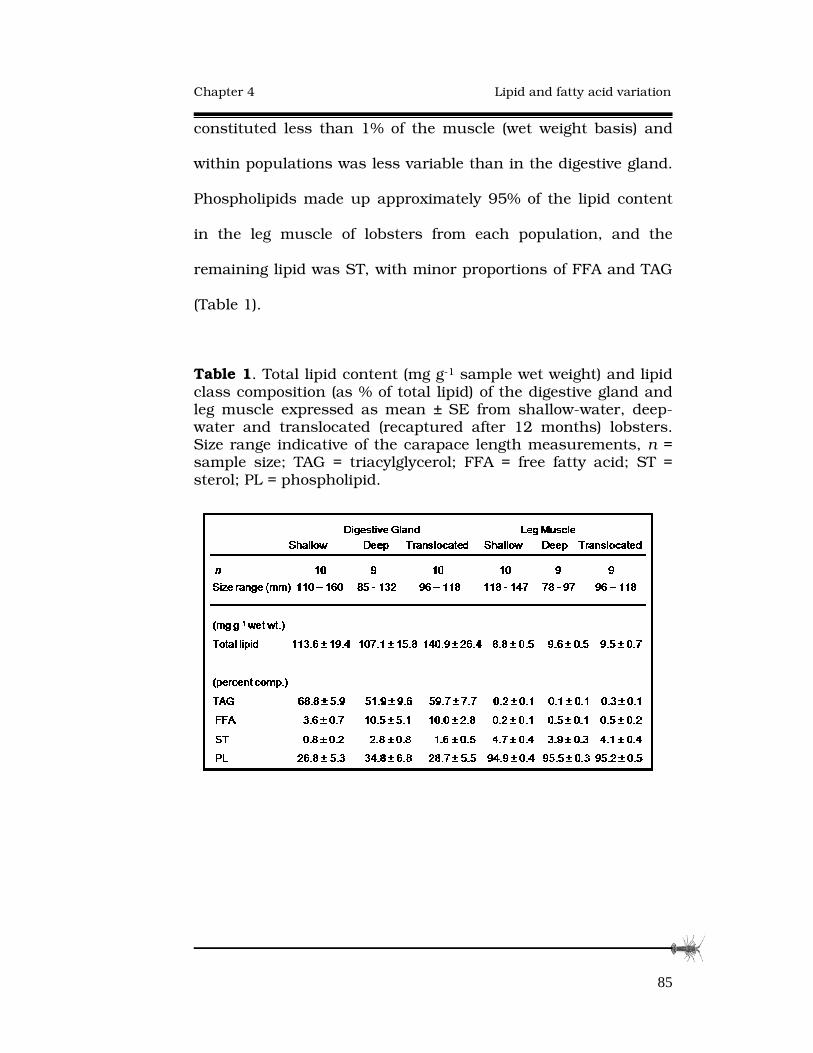
�
�
Chapter 4 Lipid and fatty acid variation
�
85
constituted less than 1% of the muscle (wet weight basis) and
within populations was less variable than in the digestive gland.
Phospholipids made up approximately 95% of the lipid content
in the leg muscle of lobsters from each population, and the
remaining lipid was ST, with minor proportions of FFA and TAG
(Table 1).
Table 1. Total lipid content (mg g-1 sample wet weight) and lipid class composition (as % of total lipid) of the digestive gland and leg muscle expressed as mean ± SE from shallow-water, deep-water and translocated (recaptured after 12 months) lobsters. Size range indicative of the carapace length measurements, n = sample size; TAG = triacylglycerol; FFA = free fatty acid; ST = sterol; PL = phospholipid.
�
�
Chapter 4 Lipid and fatty acid variation
�
86
The median BRI values for shallow (1.339) and
translocated lobsters (1.341) were similar (Fig 2b), indicating
that most lobsters were in their late post-moult to early inter-
moult stage of the moult cycle. Several translocated lobsters
appear to be in their late inter-moult to pre-moult, indicated by
their darker (reddish) blood pigment colour and higher BRI, and
these same lobsters had higher TAG level (Fig 2a, b). Generally,
lobsters in their late inter-moult and pre-moult stage are nearing
the end of their maximum TAG accumulation phase and our
results suggest that the low and high ranges in TAG
concentrations in shallow-water and translocated lobsters (Fig
2a) may be associated with the early and late phases of the
moult cycle respectively.

�
�
Chapter 4 Lipid and fatty acid variation
�
87
Fig 2. Body condition indices of shallow-water, deep-water and translocated (recaptured after 12 months) lobsters (A) TAG concentrations from the digestive gland and (B) Haemolymph refractive index values of only shallow-water and translocated lobsters (symbols indicate raw data). Also indicated are the broad BRI ranges associated with the moult cycle of J.edwardsii (see Musgrove 2001): Post-moult 1.335 – 1.3400; Inter-moult 1.3400-1.3450; Pre-moult 1.3460-1.3600. The box and whisker plot shows: box = 1st-3rd quantiles; centre line = median value; whiskers = minimum-maximum values. Note, no blood information collected for deep-water lobsters.

�
�
Chapter 4 Lipid and fatty acid variation
�
88
4.3.2 Fatty acid compositions
Digestive Gland
The most abundant fatty acids in the digestive gland (>5%
of total fatty acids for all populations) were 16:1n-7c, 16:0,
18:1n-9, 18:1n-7, 18:0, 20:5n-3 (eicosapentaenoic acid: EPA),
20:1n-9+11 and 22:6n-3 (docosahexaenoic acid: DHA).
Monounsaturated fatty acids (MUFA) were the dominant group of
fatty acids (40.2 ± 4.9 % to 41.8 ± 1.9 %) with similar
proportions of saturated fatty acids (SFA) (27.7 ± 1.7 % to 28.6 ±
1.9 %) and polyunsaturated fatty acids (PUFA) (29.6 ± 3.0 % to
31.8 ± 3.4%) (Table 2). Concentrations of total fatty acids (TFA)
in the digestive gland did not vary significantly between deep
water, shallow water and translocated populations (F2,25 = 2.68,
p = 0.88), nor did total concentrations of SFA, MUFA and PUFA
(F6,46 = 1.25, p = 0.30) (Fig. 3c). Analyses of selected (n-3) and (n-
6) PUFA that typically indicate dietary differences also were not
different between lobster populations (F4,48 = 1.57, p = 0.197)
(Fig. 3e). Mean concentrations of EFA was significantly higher in
translocated lobsters than in shallow-water and deep-water
lobsters (F12,22 = 5.27, p < 0.001) (Fig 3a). Mean concentrations
of EPA and AA were significantly higher in translocated lobsters
than in shallow-water lobsters, but not different from deep-water
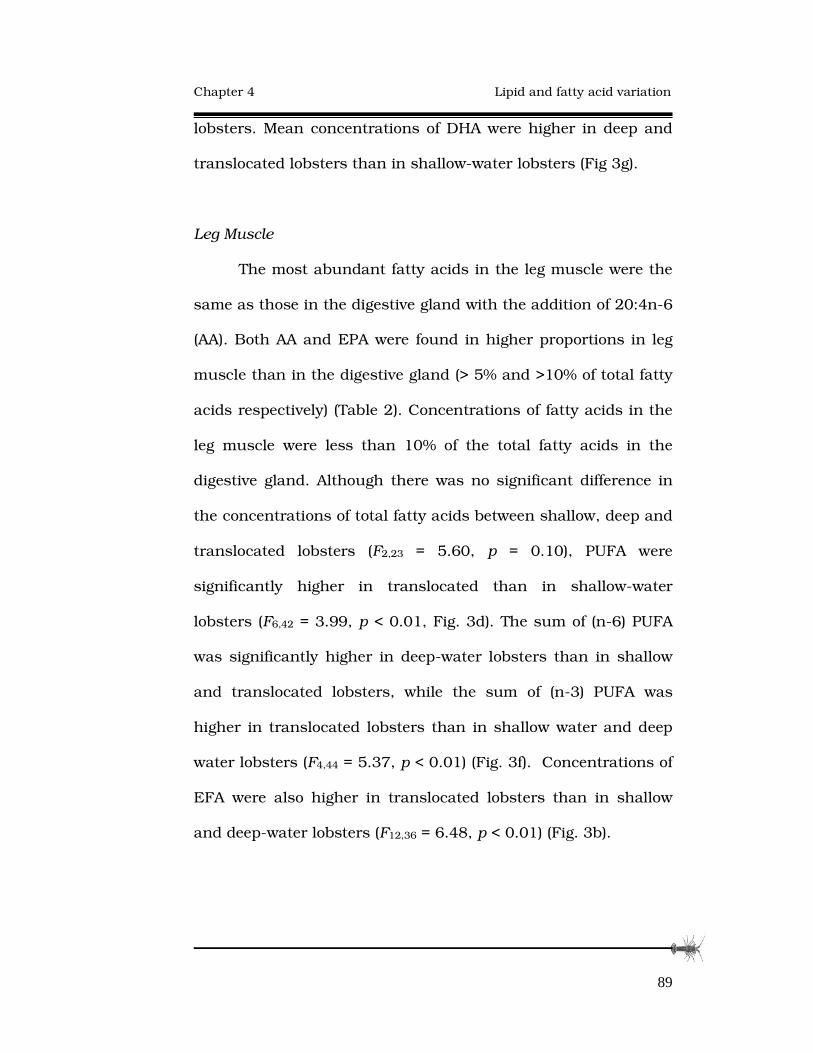
�
�
Chapter 4 Lipid and fatty acid variation
�
89
lobsters. Mean concentrations of DHA were higher in deep and
translocated lobsters than in shallow-water lobsters (Fig 3g).
Leg Muscle
The most abundant fatty acids in the leg muscle were the
same as those in the digestive gland with the addition of 20:4n-6
(AA). Both AA and EPA were found in higher proportions in leg
muscle than in the digestive gland (> 5% and >10% of total fatty
acids respectively) (Table 2). Concentrations of fatty acids in the
leg muscle were less than 10% of the total fatty acids in the
digestive gland. Although there was no significant difference in
the concentrations of total fatty acids between shallow, deep and
translocated lobsters (F2,23 = 5.60, p = 0.10), PUFA were
significantly higher in translocated than in shallow-water
lobsters (F6,42 = 3.99, p < 0.01, Fig. 3d). The sum of (n-6) PUFA
was significantly higher in deep-water lobsters than in shallow
and translocated lobsters, while the sum of (n-3) PUFA was
higher in translocated lobsters than in shallow water and deep
water lobsters (F4,44 = 5.37, p < 0.01) (Fig. 3f). Concentrations of
EFA were also higher in translocated lobsters than in shallow
and deep-water lobsters (F12,36 = 6.48, p < 0.01) (Fig. 3b).
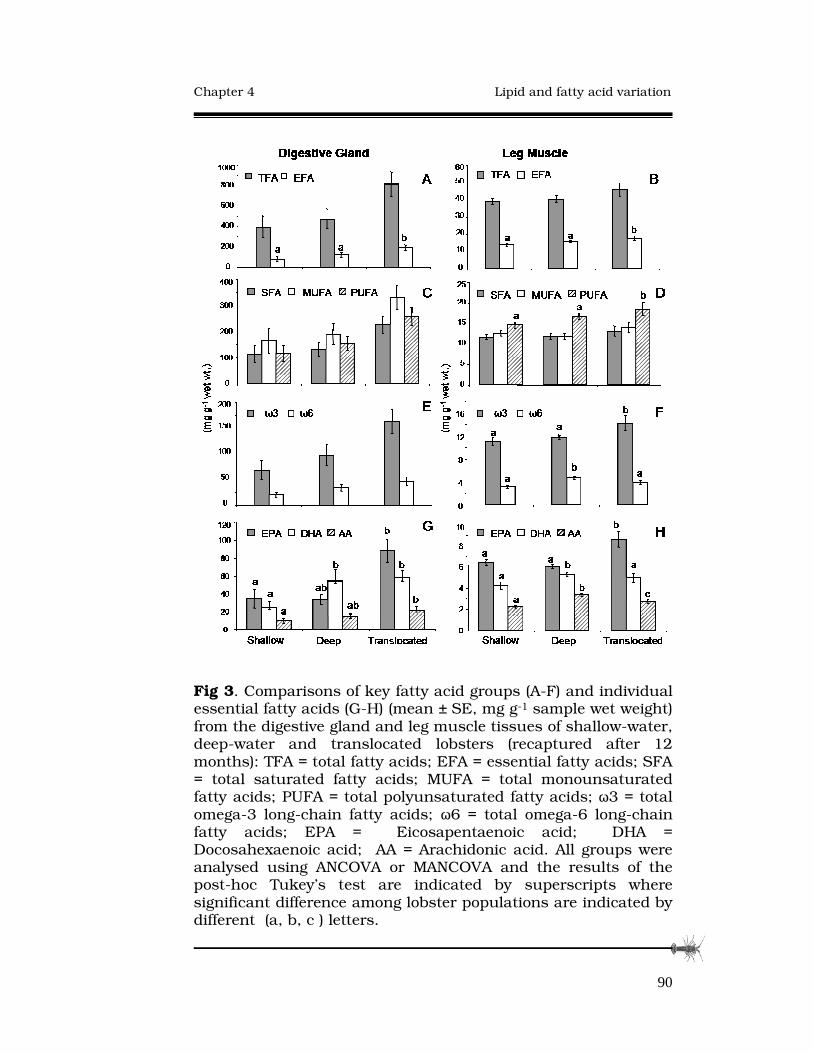
�
�
Chapter 4 Lipid and fatty acid variation
�
90
Fig 3. Comparisons of key fatty acid groups (A-F) and individual essential fatty acids (G-H) (mean ± SE, mg g-1 sample wet weight) from the digestive gland and leg muscle tissues of shallow-water, deep-water and translocated lobsters (recaptured after 12 months): TFA = total fatty acids; EFA = essential fatty acids; SFA = total saturated fatty acids; MUFA = total monounsaturated fatty acids; PUFA = total polyunsaturated fatty acids; �3 = total omega-3 long-chain fatty acids; �6 = total omega-6 long-chain fatty acids; EPA = Eicosapentaenoic acid; DHA = Docosahexaenoic acid; AA = Arachidonic acid. All groups were analysed using ANCOVA or MANCOVA and the results of the post-hoc Tukey’s test are indicated by superscripts where significant difference among lobster populations are indicated by different (a, b, c ) letters.
�
�
Chapter 4 Lipid and fatty acid variation
�
91
Eicosapentaenoic acid (EPA) was higher in translocated lobsters
than in shallow and deep-water lobsters while DHA was slightly
higher in deep-water lobsters, but not different between shallow
and translocated lobsters. Arachidonic acid (AA) was significantly
different between all lobster populations, and was highest in
deep-water lobsters (Fig. 3h).
Leg muscle fatty acid profiles were grouped separately for
each of the three populations on the PCA plot, although there
was slight overlap between the FA profiles of translocated
lobsters and shallow-water lobsters along the secondary axis
(PC2, 23%, Fig 4). Deep-water lobsters were distinct from the
other two populations along PC1, which accounted for 48% of
the variance. Separation among groups along PC1 was driven
strongly by 16:1(n-7)c and EPA while the main fatty acid causing
separation between shallow and translocated lobsters along PC2
was 18:1(n-9), with additional influences from EPA and DHA.
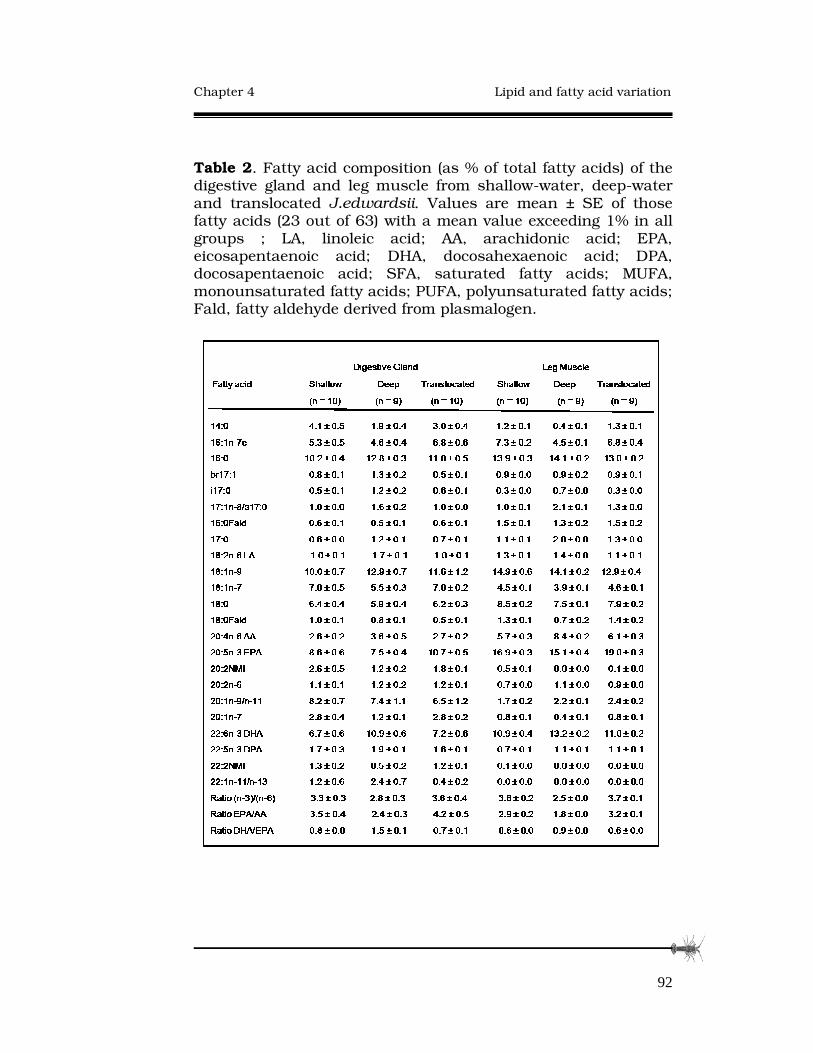
�
�
Chapter 4 Lipid and fatty acid variation
�
92
Table 2. Fatty acid composition (as % of total fatty acids) of the digestive gland and leg muscle from shallow-water, deep-water and translocated J.edwardsii. Values are mean ± SE of those fatty acids (23 out of 63) with a mean value exceeding 1% in all groups ; LA, linoleic acid; AA, arachidonic acid; EPA, eicosapentaenoic acid; DHA, docosahexaenoic acid; DPA, docosapentaenoic acid; SFA, saturated fatty acids; MUFA, monounsaturated fatty acids; PUFA, polyunsaturated fatty acids; Fald, fatty aldehyde derived from plasmalogen.
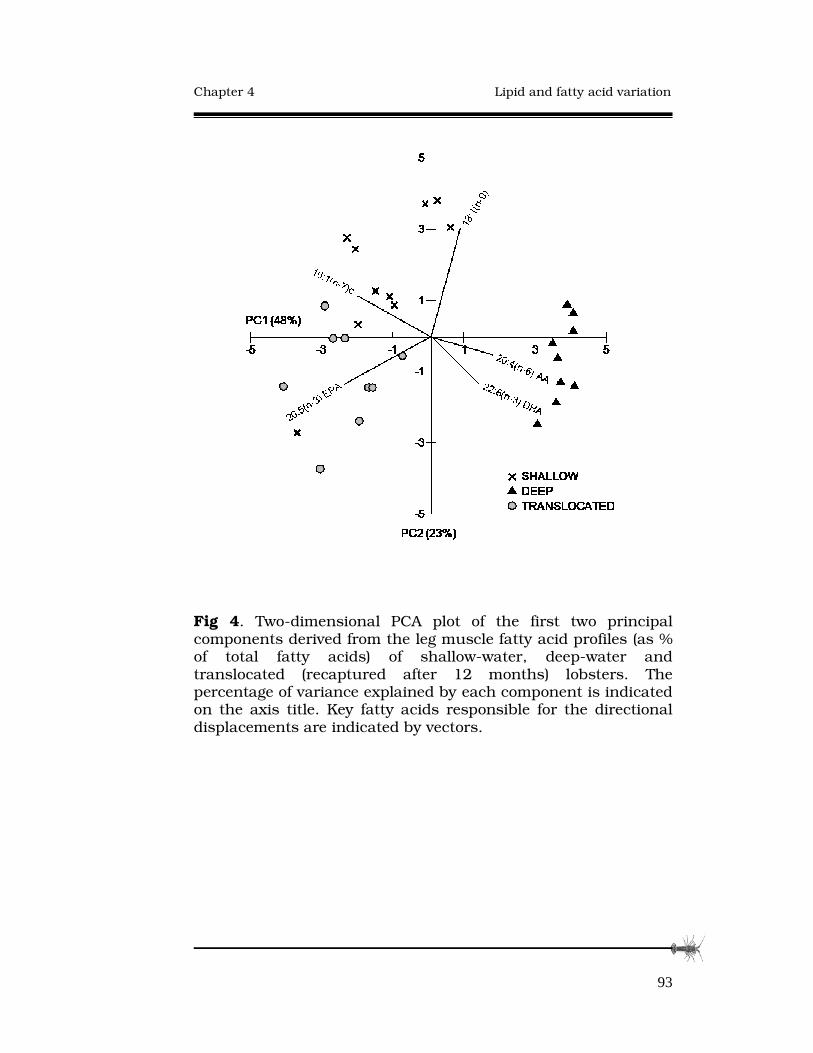
�
�
Chapter 4 Lipid and fatty acid variation
�
93
Fig 4. Two-dimensional PCA plot of the first two principal components derived from the leg muscle fatty acid profiles (as % of total fatty acids) of shallow-water, deep-water and translocated (recaptured after 12 months) lobsters. The percentage of variance explained by each component is indicated on the axis title. Key fatty acids responsible for the directional displacements are indicated by vectors.

�
�
Chapter 4 Lipid and fatty acid variation
�
94
4.4 Discussion
4.4.1 Fatty acid differences in Jasus edwardsii
Fatty acid profiles were different in lobsters from deep-
water, shallow-water, and translocated populations. Overall FA
compositions of translocated lobsters were more similar to those
of shallow-water lobsters than to deep-water lobsters, while
concentrations of some individual FA were more similar to deep-
water lobsters (e.g. 20:1n-9+11). These differences in FA profiles
are consistent with differences in diet between lobster
populations at different depths and thereby confirm the change
in diet in translocated lobsters. Identification of prey items from
lipid signature analyses, as has occurred for a number of other
marine species, may further resolve dietary differences between
deep and shallow-water populations. Our results also showed
that fatty acid profiles of deep, shallow and translocated lobsters
were similar between muscle and hepatopancreas,
demonstrating that a period of 12 months was sufficient
(although not the maximum time period required) for the
biochemical signature of the new prey items to be assimilated by
translocated lobsters. This is supported by aquarium feeding
trial studies where lipid profiles of adult Jasus edwardsii (tail
and leg muscle) changed in response to different feed types after

�
�
Chapter 4 Lipid and fatty acid variation
�
95
four months (Nelson et al. 2005), and after three months in
juveniles (whole body) (Johnston et al. 2003).
Both tissue types revealed concentrations of n-3 and n-6
FA were higher in deep than in shallow-water lobsters, and
highest in translocated lobsters. The ratio of n-3/n-6 was also
lowest in deep-water lobsters and markedly higher in shallow
and translocated lobsters. Eicosapentaenoic acid (EPA) and DHA
were the two main PUFA driving the separation of deep-water
lobsters from shallow and translocated lobsters in our principal
component analysis. These essential fatty acids play an
important role in the growth and development of crustaceans,
especially during the early larval and juvenile stages (Nelson et
al. 2006). Essential fatty acid deficiency has been linked to slow
growth rates and a decrease in feeding efficiency in several fish
species and a reduction in egg production and deformities in
larval morphology (Corraze 1999). The production of aquaculture
feeds is a prime example of the importance of nutrient balance in
achieving positive growth and condition outcomes. An imbalance
can lead to competition between fatty acids and the inefficient
synthesis of prostaglandins (D'Abramo 1997). Therefore it is
possible that an imbalance in the proportions of EFA in the diet
(e.g. AA/EPA, DHA/EPA ratios) in conjunction with insufficient
�
�
Chapter 4 Lipid and fatty acid variation
�
96
levels of essential nutrients may be contributing factors in the
slower growth rates of deep-water lobsters.
4.4.2 Nutritional condition of Jasus edwardsii
Total lipid and TAG content were not different between the
three lobster populations, despite differences in the fatty acid
compositions. The most plausible reason for similarity in TAG
and lipid is the influence of the moult cycle. For crustaceans,
growth is achieved through the cyclic accumulation and
depletion of organic reserves, a significant and important feature
of decapod physiology (Passano 1960). During the long inter-
moult period of the moult cycle, TAG reserves are accumulated
for the next moult event. Lipid content is therefore constantly
changing in addition to supplying the demands from
reproduction, daily energetics, and environmental and seasonal
fluctuations in food availability. In the present study, a high BRI
in a number of translocated lobsters indicated they were in the
inter-moult or pre-moult phase, while the majority were in the
post-moult phase. These same lobsters had high levels of TAG.
These differences in the moult phases within populations,
especially among translocated lobsters, highlight the
physiological heterogeneity among the lobsters used for analysis.
�
�
Chapter 4 Lipid and fatty acid variation
�
97
This highlights the importance of moult staging when
quantifying lipid content, which many previous studies have
overlooked.
Most interesting was the finding of higher concentrations
of EFA in the hepatopancreas and muscle of translocated
lobsters than in shallow or deep-water lobsters. In particular
very high mean concentrations of total and selected PUFA
groups in the muscle of translocated lobsters. Rates of
metabolism, digestion and catabolism which are hormonally
controlled (Santos et al. 1997) and driven by several factors such
as temperature, light and diet (Childress et al. 1990), may
change in response to a new habitat and the ensuing
environmental changes. Translocated lobsters analysed in our
study had experienced 12 months in the new environment and
had also changed in appearance (Chapter 3) and growth
(Chapter 6). Initial differences in growth rate may have been due
to metabolic differences, assuming significant differences in
metabolism were present between deep and shallow-water
lobsters, although this is largely speculative at this point.
Translocated lobsters may have experienced increased nutrient
uptake or a greater absorption rate indicative of the higher
concentrations of lipid and fatty acids in the digestive gland that

�
�
Chapter 4 Lipid and fatty acid variation
�
98
may reflect modifications to the digestive physiology due to
greater quantity of food being digested. This may be a
compensatory response whereby an increase in the size and
volume of the digestive gland and enzyme activity occurred in
response to the new habitat.
Leg muscle of translocated lobsters had higher
concentrations of PUFA and in particular EFA than in shallow
and deep-water lobsters. Given the accelerated growth in
translocated lobsters over a short period of time, increased
tissue synthesis including incorporation of associated lipid, may
be a possible explanation for this observation which is similar to
a compensatory response that is sometimes induced by a period
of starvation or reduced nutrient intake (Ali et al. 2003).
Compensatory responses can include hyperphagia, rapid weight
increase, repletion of energy reserves and increased nutrient
intake. For small and pale coloured translocated lobsters, risk
from cannibalism is high. One way to avoid this situation is to
eat and grow as fast as possible. This catch-up growth behaviour
in habitats of high predation has been shown in several fish
studies where there is a trade off between escape performance
and growth acceleration (Alvarez and Metcalfe 2007). Since
compensatory responses are reported to be short-lived, it is

�
�
Chapter 4 Lipid and fatty acid variation
�
99
unclear if this will be maintained over several moults by
translocated lobsters or if it is regulated at optimal or maximal
rates.
From a commercial and marketing point of view, increased
concentrations of EFA in edible tissues are highly favourable.
Recent studies have shown that consumption of oily fish has
associated health benefits in humans, as they decrease
cholesterol levels and the subsequent occurrence of
cardiovascular disease (Gebauer et al. 2006; Jarvinen et al.
2006). In particular, the emphasis is on the richness of omega-3
long-chain PUFA, which in our study were 30% higher in
concentration in the muscle of translocated lobsters than in
shallow and deep-water lobsters. This is a significant and novel
finding given the marketing issues surrounding the importance
of omega-3 long-chain PUFA in cultured fish species comparable
to their wild counterparts. Nelson et al. (2005) found the lipid
and fatty acid content of muscle of cultured and wild J.
edwardsii to be similar, but the animals differed in their quality
attributes such as taste, texture and colour. Therefore enhanced
nutrition in translocated lobsters may also implicate enhanced
flavour and flesh quality thus providing the basis for further
research.

�
�
Chapter 4 Lipid and fatty acid variation
�
100
4.5 Conclusion
Differences in fatty acid profiles between deep and
shallow-water populations and the change in their FA profile
after translocation highlights the dietary plasticity of adult Jasus
edwardsii. Changes in key market traits, in particular the health
benefiting omega-3 long-chain PUFA, were also observed,
although it is presently unclear if these differences arise from
nutritional condition and/or other factors. This study is the first
to show nutritional enhancement through the in situ
manipulation of lobster habitat. This finding suggests
translocated deep-water lobsters have enhanced nutritional
condition and quality, beyond that of legal-sized shallow-water
lobsters, thus raising its market potential.
�
�
Chapter 5 Haemolymph condition variation
�
101
Chapter Chapter Chapter Chapter
�
�����
�
Haemolymph condition variation among post-harvest adult southern
rock lobsters, and response to translocation
This Chapter is in press with Marine and Freshwater Behaviour and Physiology: Chandrapavan A, Gardner C, Green B.S. Haemolymph condition of deep-water southern rock lobsters translocated to shallow-water reefs.
5
�
�
Chapter 5 Haemolymph condition variation
�
102
Abstract
Deep-water southern rock lobsters were translocated to inshore
reefs harbouring high-market value southern rock lobsters as
part of an experimental spatial management strategy to enhance
their market traits, growth and post-harvest condition. We
assessed the haemolymph condition of deep-water lobsters
before and after (over a period of 14 months) translocation for
comparison to resident lobsters at the release site using a range
of moult and haemolymph indices. Moult indices indicated deep-
water lobsters were of similar moult stage to resident lobsters
before translocation, they moulted earlier than resident lobsters
in their new habitat but were of similar moult stage to resident
lobsters when sampled 12 months after translocation.
Comparisons of haemolymph parameters included total
haemocyte count, serum protein and electrotypes such as
magnesium and potassium, which were all significantly different
between deep and shallow-water lobsters prior to translocation.
These populations when sampled 12 months after translocation
showed similar concentrations of all haemolymph parameters,
suggesting an improved resilience to post-harvest stress in
translocated lobsters. Benefits of translocation to inshore areas
on the post-harvest condition of deep-water lobsters could be

�
�
Chapter 5 Haemolymph condition variation
�
103
due to improved body condition through the manipulation of
habitat and diet but also from the reduced post-capture
transport time and stress duration.
5.1 Introduction
The live trade of southern rock lobsters (Jasus edwardsii)
from Australia to export markets in Asia began in the late 1980’s
and supplied by the three main State fisheries of Tasmania,
South Australia and Victoria (Roberts 1994). The species is
harvested from a range of depths, premium lobsters are caught
from inshore shallow-water areas (< 30 m) where they are fast
growing, red in colour and of high vitality for live transport.
Lobsters harvested from offshore deep-water areas (> 30 m) are
paler in colouration and thus sold at a discounted price (Chapter
2) but are also slow growing, and incur higher transport
mortality. Maintaining low mortality rates is thus a priority as
the condition of live lobsters affects its sale price and overall
profitability of the fishing industry. While spatial differences in
demographic traits such as growth (Punt et al. 1997), size at
sexual maturity (Gardner et al. 2006) and shell colour (Chapter
3) have been documented for J. edwardsii, it is not clear if

�
�
Chapter 5 Haemolymph condition variation
�
104
distinctive physiological or biochemical differences exist between
deep-water and shallow-water lobster populations or at least in
their response to post-harvest stress.
Stress is a physiological response altering the
physiological condition to beyond the normal range and can be
either readily reversible if physiological disturbance are within
the homeostatic capability of the lobsters, or it can be non-
reversible, ultimately leading to death (Taylor et al. 1997).
Stressors associated with live transport of crustaceans generally
arise from the interchanges between immersions and emersions
(air breathing) and exacerbated through capture and handling by
fishing gear and crew, exposure to varying temperatures and
oxygen availability, physical damage and interactions with other
lobsters. Currently, processors rely on their visual assessment of
lobster vigour (tail flipping, antenna response and general
handling resistance) before lobsters are live transported, but
quantitative measurements of condition can be assessed from
oxygen uptake (Whiteley and Taylor 1992), stress hormones
(Chang 2005), muscle metabolites (Speed et al. 2001) and
haemolymph (blood) parameters (Moore et al. 2000; Fotedar et
al. 2006; Lund et al. 2009). The crustacean haemolymph is the
principal medium for transport and storage of a range of organic
�
�
Chapter 5 Haemolymph condition variation
�
105
and inorganic constituents and indices such as blood gases,
blood pH, proteins, lipids, cells and ions (Paterson and Spanoghe
1997) are widely used measures of physiological condition. In
addition to stress, haemolymph indices are also affected by the
moult cycle, reproductive cycle and nutritional condition (Moore
et al. 2000; Musgrove 2001), so it is important to take these
factors into consideration when assessing post-harvest stress.
Translocation of deep-water southern rock lobsters into
shallow-water reefs inshore is currently being explored as a
fisheries enhancement strategy to increase their yield and
improve marketability, including the live transport condition of
deep-water lobsters. Large-scale experimental translocations
have shown translocated lobsters to change from a pale to a red
colouration, increase their growth rate and achieve enhanced
nutritional value (Chapters 3, 4, 6) after their first moult in the
new shallow-water habitat. High survival of translocated lobsters
(Green and Gardner 2009) in synergy with enhanced biological
traits imply improved physiological condition for deep-water
lobsters after translocation, although how this translates to
improved post-harvest condition is yet to be demonstrated. Thus
the central aim of this study was to determine how translocation
may have altered the post-harvest condition of deep-water

�
�
Chapter 5 Haemolymph condition variation
�
106
lobsters and if translocated lobsters share similar conditional
profiles to resident lobsters. In this study we compare the post-
harvest condition of deep-water and shallow-water J. edwardsii
before and 12 months after translocation, as well as describe the
temporal variability in the hemolymph condition of translocated
and resident shallow-water lobsters over a 14 month post-
translocation period.
5.2 Materials and methods
5.2.1 Translocation of J. edwardsii
During November 2005, 1998 sub-legal sized adult
lobsters (68 - 120 mm) were captured from around Maatsuyker
Island (60 – 80 m deep) (43.38°S, 146.17°E) using baited
(barracouta and jack mackerel) lobster pots after a soak time of
approximately 6 hours. Immediately upon capture, all lobsters to
be translocated were tagged with an individually coded T-bar tag
in the ventral surface of the first abdominal segment (coloured
Hallprint T-bar anchor tag), had one pleopod clipped, and details
of carapace length (CL), shell colour and sex recorded (bio-data).
Captured lobsters were then kept on-board the research vessel

�
�
Chapter 5 Haemolymph condition variation
�
107
in a flow-though holding tank for approximately 48 hours while
being transported to their release site (5 - 15m deep) at Taroona
Marine Reserve (42.95°S, 147.34°E). Due to the logistical
difficulties of haemolymph sampling on board the research
vessel (weather, time and consistency with other surveys), a sub-
sample of translocated lobsters (127 females (FM) and 72 males
(M)) were land transported (out of water) back to the laboratory
and placed into a re-circulating tank for 2-5 hours (time period
between the first and last lobster sampled) before their
haemolymph was extracted.
Also in November 2005, shallow-water lobsters (23 FM, 27
M) from the release site (Taroona Marine Reserve) were captured
using baited pots after a soak time of approximately 12 hours.
Captured lobsters had their size, shell colour and sex recorded
and land transported back to the laboratory and placed in a re-
circulating tank for 2-3 hours before their haemolymph was
extracted. Taroona Reserve we re-surveyed using baited pots (as
above) at 2, 3, 5, 8, 10, 12, 14 months after translocation.
During each survey the bio-data was recorded for all recaptured
translocated lobsters as well as a sub-sample of resident
lobsters. Haemolymph samples were extracted after being
transported back to the laboratory and allowed a period of 2-3

�
�
Chapter 5 Haemolymph condition variation
�
108
hours of acclimation in holding tanks. Haemolymph samples
from resident lobsters were not collected from the 2 and 3-month
post-translocation surveys. All haemolymph samples were
placed immediately on ice and later stored in a -18ºC fridge.
Moult growth increments of more than three millimetres and the
partial or complete regeneration of the cut pleopod were used as
moult confirmation (Ziegler et al. 2004).
5.2.2 Haemolymph collection and analyses
A haemolymph sample of 2 – 3 ml was extracted (using a 3
ml syringe, 22-gauge needle) by pericardial puncture and
transferred to a sterile Eppendorf tube. Haemolymph pigment
stage (1: colourless to 4.5: dark red) was assessed using the
Southern Rock Lobster Blood Colour Reference Card developed
by Musgrove (2001). The Pigment Stage Index (PS) was developed
by Musgrove (2001) for the southern rock lobster Jasus
edwardsii, and refers to the change in haemolymph colour
during the moult cycle due to changes in astaxanthin
concentrations in the haemolymph. From post-moult to inter-
moult, colour changes from clear/pale blue through to pale
yellow (PS 1 to PS 2.5) and progressively darken to a deep orange
in pre-moult lobsters (from PS 3 to PS 4.5). This index can be

�
�
Chapter 5 Haemolymph condition variation
�
109
used to determine broadly the moult stage of a lobster where the
darkening of the haemolymph colour corresponds with
increasing pigment stage. All sampled animals were released
alive back into Taroona Reserve.
A small aliquot of the haemolymph sample was then
placed in a hand-held refractometer (Model UR-2, Industrial and
Scientific Supply Co.) to measure the refractive index (RI). The
blood RI values were converted to blood serum a protein
concentration (as outlined by Musgrove 2001) which is a reliable
index of physiological condition (Oliver and MacDiarmid 2001).
For the analysis of total haemocyte counts (THC) which is
another common measure of health condition, a 200 µl aliquot of
haemolymph was mixed with 200 µl of Na-cacodylate based anti-
coagulant in another eppendorf tube (4.28 g of Na-cacodylate
added to 90 ml of distilled water, pH adjusted to 7.0 using 1.0 M
HCl, 400 µl of stock 25% glutaraldehyde solution added and
volume adjusted to 100 ml with distilled water). Tubes were well
mixed prior to measurements of THC using a haemocytometer
(Improved Neubauer, Bright-line, BLAUBRAND®).
Key haemolymph electrolytes critical for ion regulation in
crustaceans was extracted from, the remaining whole

�
�
Chapter 5 Haemolymph condition variation
�
110
haemolymph that was allowed to clot overnight, and then
macerated and centrifuged at 1600 g for 10 minutes. Using a
sterile 1ml syringe, the serum portion was extracted and
transferred to another sterile eppendorf tube. Analysis of serum
extracts was measured for calcium (Ca), magnesium (Mg), and
potassium (K) using a Cobas Mira Clinical Analyser. Extracts
were diluted 1:4 for K and concentration determined by ion-
selective electrode (ISE) and further diluted 1:8 for Ca and Mg,
which were determined by colorimetric methods. Haemolymph
electrolytes measurements were only analysed from a sub-
sample of translocated and resident male lobsters captured in
Nov 2005 and Jan 2007.
Multivariate analyses were used to compare haemolymph
parameters (excluding PS index) between deep-water and
resident lobsters before translocation (Nov 05), and between
translocated and resident lobsters after translocation (Nov 06).
Analyses were performed separately for the sexes due to
differences in their moult stages during these sampling periods.
Electrolytes were also analysed separately as these were only
measured in males and were compared between Nov 05 and Jan
07. All variables were normally distributed and the Pillai’s trace
test was used as multivariate test of significance and significant
�
�
Chapter 5 Haemolymph condition variation
�
111
effects were further examined using Tukey’s post-hoc analysis.
Statistical analyses were performed using Statistica (V7.1
Statsoft Inc, Tulsa OK USA).
5.3 Results
The PS index provides a broad indicator of moult stage,
and differences in mean PS values were not very large between
populations in Nov 05 and in Nov 06, suggesting no difference in
moult categories. That is, deep-water lobsters were of similar
moult stage to shallow-water lobsters before translocation as
well as 12 months after translocation. Concentrations of serum
protein (SP) and total haemocyte counts (THC) varied
significantly between deep-water and shallow-water populations
before translocation (Females: F2,47 = 28.97, p < 0.01; Males:
F2,96 = 17.74, p < 0.01) but no differences between translocated
and resident lobster populations 12 months after translocation
(Females: F2,29 = 1.89, p = 1.68; Males: F2,32 = 1.86, p = 1.72).

�
�
Chapter 5 Haemolymph condition variation
�
112
Fig 1. Temporal variability in the different haemolymph indices (mean ± SE)(pigment stage, serum protein and total haemocyte counts) sampled from resident (broken line) and translocated (solid line) female (left column) and male (right column) lobsters. Light grey area indicates the moulting period of translocated lobsters and dark grey area indicates the moulting period of resident lobsters. Significant difference between resident and translocated populations is indicated by * .

�
�
Chapter 5 Haemolymph condition variation
�
113
5.3.1 Pigment Stage
Growth moult increments, change in shell colouration and
pleopod regeneration from recaptured tagged lobsters were used
to estimate the moult period for translocated lobsters between
sampling periods. The moult period for translocated females was
between Feb 06 and April 06, and for translocated males we
estimate moulting to occur between June 06 and Sep 06. These
moult estimates were approximately 2-3 months in advance of
the moulting by the resident population. In females, peak mean
PS values of 4.0 (translocated) and 3.3 (resident) occurred prior
to moulting and the lowest mean PS values 2.4 (translocated)
and 1.8 (resident) occurred in the early inter-moult phase when
the females were berried (carrying eggs) (Fig 1a). At the
completion of the spawning period in Sept 06, PS values
increased in the following months until Jan 07 when sampling
ceased. In males however, no cyclic trends were observed for
both translocated and resident populations (Fig 1b). Mean PS
value did not exceed 2.0 on any of the sampling months over the
14-month period, indicating that sampled lobsters were in their
inter-moult phase.
�
�
Chapter 5 Haemolymph condition variation
�
114
5.3.2 Serum Protein
Serum protein (SP) concentrations of translocated female
lobsters followed a cyclic trend of rise and fall with highest peaks
occurring 3 (Feb 06) and 12 months (Nov 06) after translocation
(Fig 1c). For males, a cyclic trend was also observed with values
peaking prior to moulting of resident lobsters (Sep 06), however
the peak for translocated males occurred in Apr 06, well in
advance of their estimated moulting period (Fig 1d). SP
concentrations declined gradually after moulting in translocated
males but more sharply in resident males. Before translocation,
mean SP concentrations of deep-water females were significantly
lower than resident females, but both similar 12 months after
translocation. For males, mean SP concentrations were
significantly higher then resident males before translocation but
no differences detected 12 months after translocation.
5.3.3 Total Haemocyte Counts
Trends in THC reflected that of SP for males of resident
and translocated populations however for females only a subtle
cyclic pattern was detected (Fig 1e, 1f). For females, we observed
�
�
Chapter 5 Haemolymph condition variation
�
115
an increase in THC leading up to the moulting period of
translocated females, then a decrease during post-moult,
followed by a gradual increase in the subsequent months. This
pattern was very similar to that of resident females. Mean THC
was higher in deep-water lobsters than in resident lobsters
before translocation (Nov 05) but were similar between
translocated and resident populations 12 months after
translocation.
5.3.4 Electrolytes
Concentrations of electrolytes were significantly different
between deep-water and shallow-water males before
translocation in Nov 05 (F3,53 = 21.89, p < 0.01) but were similar
between translocated and resident males after translocation in
Jan 07 (F3,56 = 1.02, p = 0.39). Concentrations of Ca were similar
between populations before and after translocation, while Mg
concentrations of deep-water lobsters were significantly higher
than in resident lobsters and K concentrations were significantly
lower than in resident lobsters in Nov 05 (Fig 2).
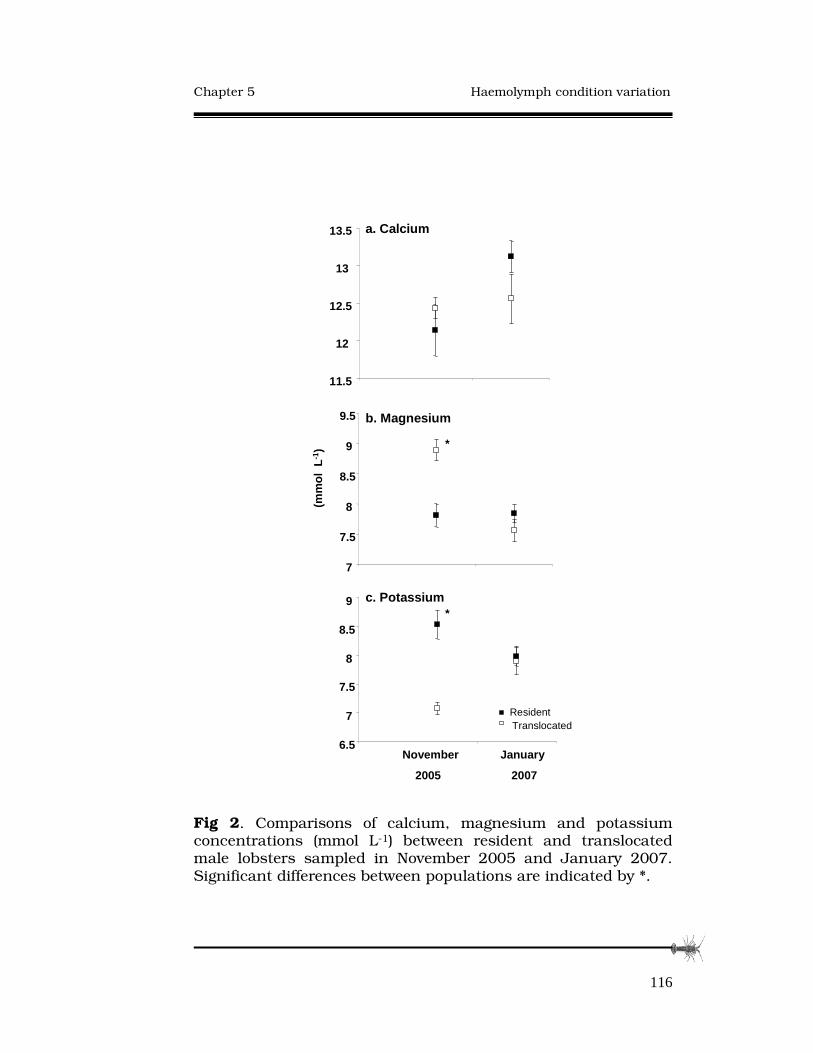
�
�
Chapter 5 Haemolymph condition variation
�
116
�
�
�
�
�
�
�
�
�
�
�
�
�
�
�
Fig 2. Comparisons of calcium, magnesium and potassium concentrations (mmol L-1) between resident and translocated male lobsters sampled in November 2005 and January 2007. Significant differences between populations are indicated by *. �
�
a. Calcium
b. Magnesium
c. Potassium
(mm
ol L
-1)
November January
2005 2007
11.5
12
12.5
13
13.5
7
7.5
8
8.5
9
9.5
6.5
7
7.5
8
8.5
9
ResidentTranslocated
*
*
�
�
Chapter 5 Haemolymph condition variation
�
117
�
�
5.4 Discussion
The overall haemolymph conditional profile of deep-water
lobsters was different from those of shallow-water lobsters prior
to translocation, but the conditional profiles of translocated
lobsters captured 12 months later were similar to resident
lobsters. Haemolymph indices also showed clear temporal trends
in physiological condition, largely influenced by the moult cycle.
Interpretation of the haemolymph indices relied on
identifying the moult phases of all lobsters over the sampling
period using the different morphological indicators (moult
increments, pleopod regeneration, shell colour change) together
with the PS index. This allowed us to account for the moult
influence when assessing the overall haemolymph response to
post-harvest stress. This step was important because crustacean
physiology is dominated by the moult cycle and each stage is
associated with changes in the composition of the blood
(Maynard 1960; Mercaldo-Allen 1991). During pre-moult, a
resorption of the exoskeleton occurs and the blood provides a
temporary storage sites for these materials. Uptake of water at
moult increases the haemolymph volume and rapidly dilutes
�
�
Chapter 5 Haemolymph condition variation
�
118
blood constituents. Water uptake occurs once the old
exoskeleton begins to detach from the newly formed cuticle
underneath. During post-moult, growth of muscle tissue reduces
haemolymph volume and thus the concentrations of
haemolymph components proportionally increase (Florkin 1960).
Overall trends in the haemolymph indices showed peaks
and troughs associated with different moult stages, but these
patterns were not always synchronised between translocated
and resident lobsters since translocated lobsters moulted earlier
than resident lobsters. For translocated females, the peaks and
troughs in indices occurred at the beginning and end of the
estimated moult period, thus showing a good corroboration
between haemolymph condition and moult indices. For
translocated males however, clear cyclic trends in the RI and
THC that were indicative of the moult influence on the
hemolymph condition were suppressed in the PS index.
Morphological moult indicators estimated moulting to occur
several months after the peaks in RI and BRI indices, which
suggests either an extended pre-moult phase or a staggered
moulting event among males. Despite the inconsistencies in
moult estimates between indices, moult stages of translocated
and resident lobsters were similar before translocation (Nov 05)
�
�
Chapter 5 Haemolymph condition variation
�
119
and 12 months after translocation (Nov 06). Thus haemolymph
conditional differences between translocated and resident
lobsters are most likely to be driven by factors other than its
moult condition.
The total number of circulating haemocytes are generally
elevated for a period of time during the post-harvest process in
response to bacterial infections, physical injury and dehydration,
but can decline gradually as an indication of worsening health
condition (Jussila et al. 1997) resulting in very low THC at the
moribund stage (Fotedar et al. 2006). For adult J. edwardsii the
THC range that was subjective to moult stage was 5 – 25 x 106
cells/ml. Lavallée et al (2000) reported for Homarus americanus,
an increase in THC from 20 to 30 x 106 cells/ml from capture to
when they arrive for processing. Jussila et al. (1997) reported a
range of 8.5 to 15.9 x 10⁶ cells/ml for freshly arrived western
rock lobsters to the processing factory, and a range of 5.3 to 5.6
x 106 cells/ml for healthy lobsters (after a 16 hour recovery).
Lower THC of deep-water J. edwardsii males and females than
resident lobsters from this study suggests a greater deterioration
in the post-capture condition of deep-water lobsters.
�
�
Chapter 5 Haemolymph condition variation
�
120
Haemolymph serum protein (SP) concentrations responds
to changes in the haemolymph volume through water uptake or
fluid loss, thus lowest SP levels occur in post-moult lobsters
when they ingest large volume of water to expand their newly
formed exoskeleton (Oliver and MacDiarmid 2001). Blood pH and
concentrations of organic and inorganic ions may also alter the
total protein concentrations in response to stress (Paterson and
Spanoghe 1997), while some proteins may be catabolised as an
energy source after glycogen reserves are exhausted. Lavallée et
al. (2000) reported a range of 18.6 to 99.8 g/L for H. americanus
post-capture on boats, while Paterson et al. (2005) reported
serum protein levels greater than 80 g/L for P. cygnus following
simulated post-harvest handling. We found temporal trends in
the serum protein concentrations of translocated and resident
lobsters to reflect changes in the moult phases but never
exceeding 60 mg/L. Since SP levels of deep-water lobsters was
lower in females and higher in males than in resident lobsters, it
is not clear from the SP index which population reflects a poor,
healthy or declining health condition. Perhaps haemolymph
indices sampled from dead or moribund lobsters may have
provided a greater understanding on their deviations in health
condition from lobsters unsuitable for live transport.

�
�
Chapter 5 Haemolymph condition variation
�
121
Emersion stress triggers a series of physiological
disturbances interfering with the osmotic and ionic regulation as
animals switch from aerobic to anaerobic respiration (Lignot et
al. 2000). Thus a sign of good health is the ability to maintain
tight regulation of ions during post-harvest. Calcium (Ca) ion
concentrations change in the haemolymph during the buffering
of acidosis, while magnesium (Mg) and potassium (K)
concentrations respond to salinity changes and also increase in
response to post-harvest stress caused by hypoxia which is
indicative of body volume changes and how the antennal gland
functions (Paterson and Spanoghe 1997). Paterson et al. (2005)
reported significant deviations in Mg, K and Ca levels between
western rock lobsters considered to be poor and good condition
for live trade, but the same cannot be inferred for deep and
shallow-water J. edwardsii without reference or baseline values.
Both Mg and K were significantly different between deep and
shallow-water males but its unclear if these deviations reflect
poor ion regulation given the absence of reference values.
Perhaps the sequence of the ion concentrations may provide an
alternative approach to assess condition. For example, for
resident males in Nov 05, the order of decreasing concentrations
were Ca > K > Mg and this order was the same as in Jan 06,
however the order for translocated males changed from Ca > Mg

�
�
Chapter 5 Haemolymph condition variation
�
122
> K in Nov 05 to Ca > K > Mg in Jan 06 which reflected those of
resident males. This suggests ion regulation in deep-water males
may have been compromised by post-harvest stress.
While this study did not monitor the haemolymph
condition of lobsters throughout the entire post-harvest
commercial process, significant deviations in health status
between deep-water and shallow-water lobsters (before
translocation) at an early stage of the process suggests that as
physiological condition worsen during subsequent processing
the likelihood of mortality for deep-water lobsters will be higher
than for shallow-water lobsters. The similar condition profile
between translocated and resident lobsters seems to suggest
increased resilience to post-harvest stress in deep-water lobsters
achieved through translocation. The impact of translocation on
the physiological condition of deep-water lobsters may be due to
change in diet and/or environmental influences, but from a
commercial point of view other key benefits of translocation
include the overall reduction in post-harvest transport time
simply due to their closer proximity to land, thus reducing stress
duration. Furthermore, current and related investigations do
suggest that the body condition of deep-water lobsters have
improved after translocation through increased growth rate

�
�
Chapter 5 Haemolymph condition variation
�
123
(Chapter 6), enhanced shell colour (Chapter 3) and nutritional
condition (Chapter 4). By adopting the market traits of resident
shallow-water lobsters, we assume this will translate to
improved live transport condition in translocated deep-water
lobsters.
�
�
Chapter 6 Growth variation
�
124
�
�
Chapter Chapter Chapter Chapter
�
�����
�
�
Growth rate variation among adult southern rock lobsters, and response to translocation
�
�
�
�
�
�
�
�
This chapter previously published as: Chandrapavan A, Gardner C, Green B.S. (2010). Growth rate of adult rock lobsters Jasus edwardsii increased through translocation. Fisheries research 105: 244-247. �
�
6
�
�
Chapter 6 Growth variation
�
125
�
�
Abstract
Growth rates of southern rock lobster, J. edwardsii, decrease
from north to south of Tasmania and also decrease with depth.
Slow-growing lobsters from deep-water regions were translocated
to shallow-water, inshore areas to examine the potential of
translocation to increase yield for the Tasmanian Rock Lobster
Industry. Within their first moult, translocated lobsters
increased their growth rates, exceeding that of resident deep-
water lobsters from the original site. Growth of translocated
females increased to the extent that it exceeded resident
shallow-water females in the first year post-release. The
increased growth rate of deep-water southern rock lobsters after
translocation and the magnitude of the growth changes achieved
in a short period highlight the plasticity in growth of this
species. Growth, and therefore size-at-age, is potentially
determined by density effects, food availability or other
unidentified environmental factors. Rapid increases in lobster
growth achieved through translocation suggest that
translocation could be applied to increase the productivity of the
fishery.
�
�
Chapter 6 Growth variation
�
126
6.1 Introduction�
Variable growth of the southern rock lobster Jasus
edwardsii is the basis of ongoing spatial management challenges
across the Australian fishery (McGarvey et al. 1999). Around the
coast of Tasmania, growth rates of J. edwardsii decrease from
north to south of the State and also decrease with depth (Punt et
al. 1997). For example, the mean annual growth increment for
females of carapace length 75 mm is 1-2 mm in the southern
regions while in the north of the State it is more than 20 mm per
annum. Likewise for males of carapace length 75 mm, the mean
annual growth increment is 10 mm in the southern regions and
22 mm in the north of the State (Punt et al. 1997). Differences in
growth are also reflected in the spatial differences in L50%
(length at which 50% of lobsters are mature) for female southern
rock lobsters around Tasmania which is estimated to be 60-65
mm in the south and 100-105 mm in the north of the State
(Gardner et al. 2006). Thus maturation at a smaller size in deep-
water lobsters further inhibits their growth. Despite this spatial
heterogeneity in growth and size at maturity, the Tasmanian
Rock Lobster Fishery consists of a single fishing zone managed
under a quota system with a State-wide size limit of 110 mm
carapace length (CL) for males and 105 mm CL for females
(Gardner et al. 2004). Under this management strategy, vast

�
�
Chapter 6 Growth variation
�
127
differences in egg production, biomass levels and fishing effort
are apparent between deep and shallow-water regions and from
north to south of the State (Punt et al. 1997).
In addition to slower growth rates, deep-water lobsters are
characterised by paler shell colouration and body-shape traits
that contribute to a reduced market price when compared to red
lobsters from inshore regions. Under a quota management
system, commercial fishers maximise the value of their catch by
heavily targeting inshore lobster stocks and only
opportunistically utilise the deep-water stocks, such as in winter
months when price of pale coloured lobster are more favourable
(Chapter 2). Better tailoring of management to the biology of J.
edwardsii is currently being explored through research,
including harvest strategy evaluation of regional size limits and
harvests. One management option under consideration to deal
with spatial differences in the biology of J. edwardsii is the
translocation of adult lobsters from low-growth areas to high-
growth areas. If translocated deep-water lobsters survive and
adopt the growth of resident shallow-water lobsters,
translocation as a spatial management strategy has the potential
to increase yield and exploitable biomass (Gardner and van
Putten, 2008a). The first phase in exploring translocation as a

�
�
Chapter 6 Growth variation
�
128
management tool was assessing its economic feasibility under
assumed growth scenarios, and this predicted greatest increase
in economic rent from the fishery when translocations occur
between regions with greatest differences in growth (Gardner and
van Putten, 2008b). The following phases of experimental
translocation trials are underway in Tasmania to determine if
translocated lobsters will adopt the biological characteristics of
resident lobsters in the new habitat. In this paper we present
results on the short-term growth response of translocated
lobsters from a deep-water region in the south of the state to a
shallow-water reef on the east coast of Tasmania.
6.2 Materials and methods
6.2.1 Translocation of lobsters
In November 2005, 1998 adult, male and female deep-
water lobsters (68 – 120 mm CL) were trapped using baited
metal pots in depths around 60 - 80 m from around Maatsuyker
Island (43.38°S, 146.17°E) in the south of the State, and were
transported in flow-through holding tanks onboard a research
vessel and released into depths of 5 – 15 m at a marine protected
area, Taroona Research Reserve (42.95°S, 147.34°E) on the east
coast of Tasmania (Fig 1). All translocated lobsters were tagged

�
�
Chapter 6 Growth variation
�
129
ventrally with T-bar tags (coloured Hallprint T-bar anchor tag),
carapace length (CL) measurements and sex were recorded, and
one pleopod was clipped as an indicator for moulting. Taroona
Reserve was surveyed at 5 (April 2005), 8 (July 2005), 12
(November 2005) and 14 (January 2006) months after the
translocation for the collection of growth data from resident and
translocated lobsters. Ongoing tag-recapture research surveys at
Taroona Reserve and around Maatsuyker Island provided growth
information of the resident lobster populations for the years
2000 - 2005.
6.2.2 Data analyses
Data analyses of annual moult growth increments were
restricted to setose (mature) females between 70 – 110 mm CL
(at time of capture) and males between 70 – 130 mm CL. Only
lobsters that were recaptured after the annual moulting season
(April to May for females and September to October for males)
were included, to ensure the lobster had moulted. Carapace
length measurements were collected by numerous personnel
over a number of years, and so we have assumed measurement
errors of equal magnitude across all lobsters. Carapace length
and growth increment data were transformed (log10) to achieve

�
�
Chapter 6 Growth variation
�
130
normal distribution. Differences in growth moult increments
were analysed using a combination of analysis of covariance
(ANCOVA) using CL as covariate, and separate slope analyses
(applied when the homogeneity of slopes assumption was
violated). Pillai’s trace test was used as multivariate test of
significance and significant effects were further explored using
Tukey’s post-hoc analysis. All statistical analyses were
performed using Statistica v7.1 (Statsoft Inc. Tulsa OK USA).
Trends in growth differences among small (80-85 CL, well under
the legal size) and large (Males; 100-105 CL, Females; 90-95 CL)
those approaching the legal size) males and females are
displayed using boxplots.
Fig 1. Map of south-east Tasmania showing the deep-water capture site (Maatsuyker Island) and the shallow-water translocation release site (Taroona Marine Reserve).
�
�
Chapter 6 Growth variation
�
131
6.3 Results
Moult increments decreased with size and increments
were highly variable across the size ranges for both males and
females of the resident deep-water, resident shallow-water and
translocated populations. Growth rates varied significantly
among the three populations for both males (F(2,559) = 6.20, p <
0.001) and females (F(2,606) = 4.48, p = 0.01) (Fig 2). For male
lobsters ranging between 70 and 130 mm CL, the mean (± SD)
growth rate of translocated males (after their first moult) was
significantly greater (8 ± 6.1 mm) than resident deep-water
lobsters (4.9 ± 3.6 mm) but less than the growth rate of the
resident shallow-water male lobsters (11 ± 4.9 mm). For female
lobsters ranging between 70 and 110 mm CL, the mean (± SD)
growth rate of translocated females were significantly greater (8
± 4.2 mm) than resident shallow-water females (3 ± 2.5 mm) and
resident deep-water population females (0.9 ± 0.8 mm).
Growth trends between small and large sized lobsters
showed that for small males (80 – 85 mm CL), the median
growth increment was higher in shallow-water males (13.0 mm)
than in deep-water males (7.4 mm) but was highest in
translocated males (15.4 mm; Fig 3a). For large males (100 – 105
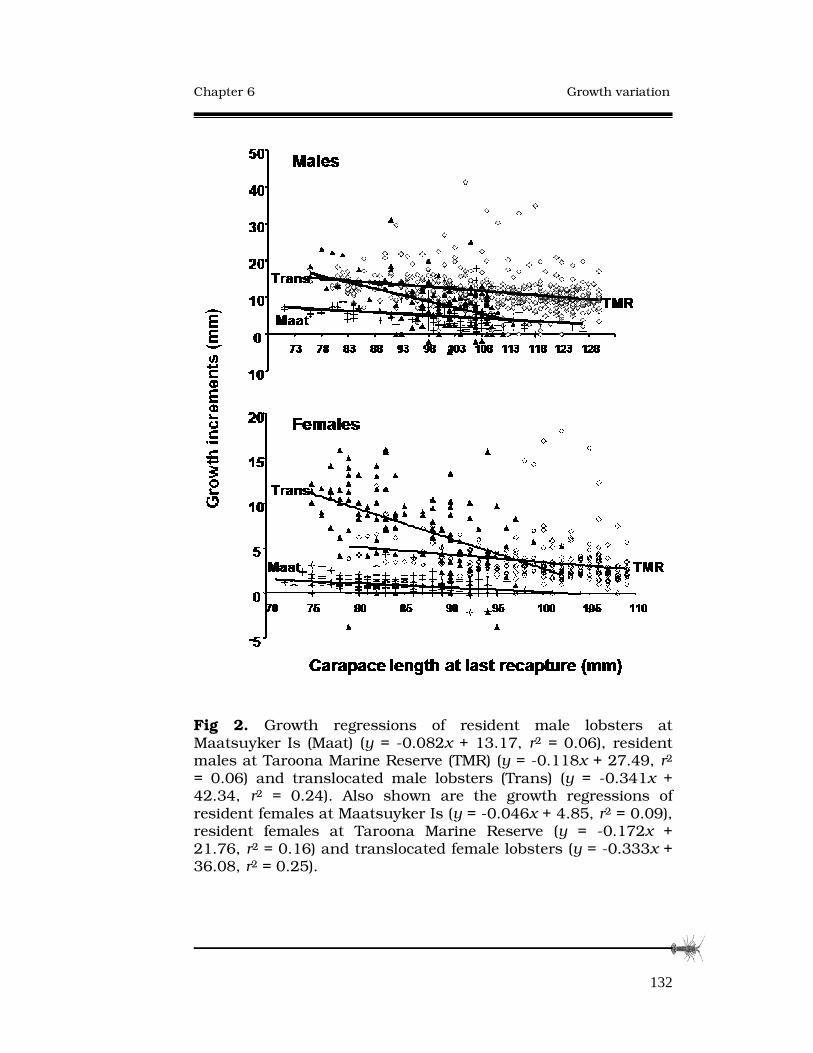
�
�
Chapter 6 Growth variation
�
132
Fig 2. Growth regressions of resident male lobsters at Maatsuyker Is (Maat) (y = -0.082x + 13.17, r2 = 0.06), resident males at Taroona Marine Reserve (TMR) (y = -0.118x + 27.49, r2 = 0.06) and translocated male lobsters (Trans) (y = -0.341x + 42.34, r2 = 0.24). Also shown are the growth regressions of resident females at Maatsuyker Is (y = -0.046x + 4.85, r2 = 0.09), resident females at Taroona Marine Reserve (y = -0.172x + 21.76, r2 = 0.16) and translocated female lobsters (y = -0.333x + 36.08, r2 = 0.25).

�
�
Chapter 6 Growth variation
�
133
mm CL), median growth increment was highest in shallow-water
males (12.4 mm), followed by translocated males (7.1 mm) and
lowest in deep-water males (3.1 mm; Fig 3b). Growth trends for
small females (80 – 85 mm CL) showed that the median growth
increment was highest in translocated females (8.8 mm),
followed by shallow-water females (6.2 mm) and lowest in deep-
water females with (1.0 mm; Fig 4a). For larger females (90 – 95
mm CL), median growth increment was also highest in
translocated females (4.4 mm), followed by shallow-water
females (3.0 mm) and lowest in deep-water males (0.6 mm; Fig
4b).
6.4 Discussion
This translocation experiment provided a unique
opportunity to exploit the site-specific variation in growth rate in
Jasus edwardsii. We were able to increase growth rates in the
slow-growing, sub-legal portion of the population by moving
them to areas of faster growth, and therefore increase the
biomass of the stock. Growth in translocated females exceeded
that of resident females of both the shallow and deep-water
populations. This increases productivity and exploitable biomass
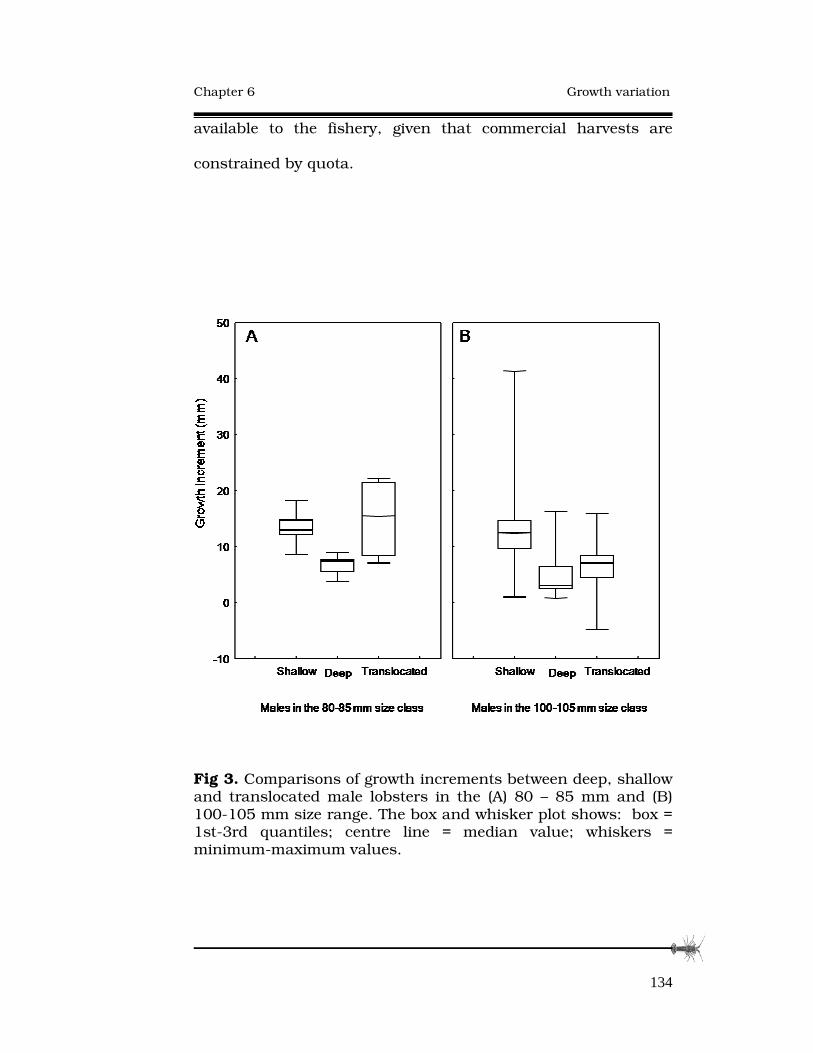
�
�
Chapter 6 Growth variation
�
134
available to the fishery, given that commercial harvests are
constrained by quota.
Fig 3. Comparisons of growth increments between deep, shallow and translocated male lobsters in the (A) 80 – 85 mm and (B) 100-105 mm size range. The box and whisker plot shows: box = 1st-3rd quantiles; centre line = median value; whiskers = minimum-maximum values.
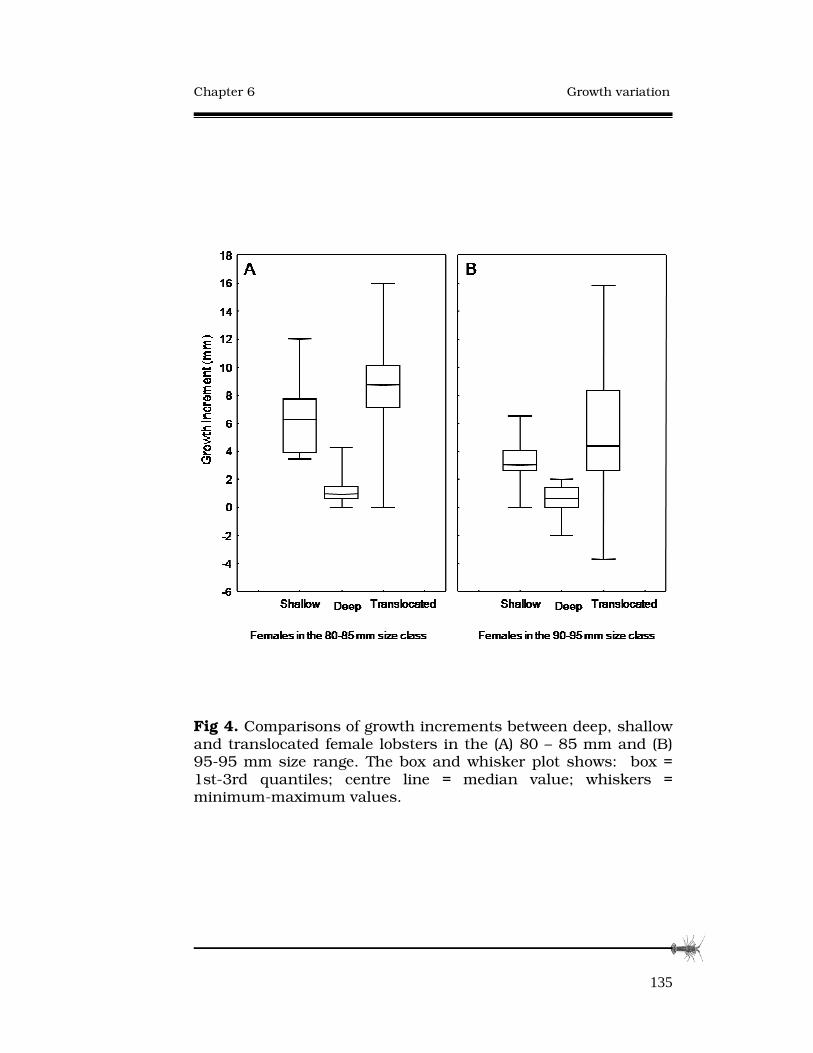
�
�
Chapter 6 Growth variation
�
135
�
�
�
�
�
�
�
Fig 4. Comparisons of growth increments between deep, shallow and translocated female lobsters in the (A) 80 – 85 mm and (B) 95-95 mm size range. The box and whisker plot shows: box = 1st-3rd quantiles; centre line = median value; whiskers = minimum-maximum values. �
�
�
�
�

�
�
Chapter 6 Growth variation
�
136
Females are important to the fishery not only through
contribution to exploitable biomass but also through egg
production. Final implementation of translocation as a
management tool needs to consider any implications for
spawning stock biomass as translocated females receive less
protection from size limits and enter the fishery sooner.
The overall economic feasibility evaluation of translocation
identified both the operational costs of translocation and change
in growth to increase with distance from Maatsuyker Island
(Gardner and van Putten 2008b). Under the assumption that
translocated lobsters would match the growth rate of resident
lobsters, greatest yield gain resulted when growth differences
between capture and release sites were large. We found growth
increments of translocated lobsters to be greater than resident
deep-water lobsters thus achieving the primary goal of
translocation, but the magnitude of growth change varied among
small and large males and females. This suggests that gains in
economic yield through translocation may be a function of size
at release and gender in addition to growth differences between
regions. The key outcome from the experimental trials was that
growth of small yet mature males and females exceeded the
growth of resident males and females within the first 12 months

�
�
Chapter 6 Growth variation
�
137
of translocation. Given this result, selectively translocating small
sized lobsters to release locations at shorter distances may
deliver the predicted yield as from translocating lobsters to high-
growth areas in the north of the State, although this is yet to be
substantiated from further experimental trials. Translocating
small sized lobsters would however require additional effort for
grading at sea thus increasing the cost of capture, but overall
translocation costs will be reduced by the greater tonnages (from
smaller sized lobsters) transported over smaller distances
especially as catch rate of under-sized females is high.
�
Modelled translocation from Maatsuyker Island to Taroona
predicted a 347% increase in total biomass, with assumptions of
constant harvest rate, that lobsters adopt the growth rate of
resident lobsters in the first year after translocation, and that
release mortality is no greater than 10% (Gardner and van
Putten 2008a). Increased growth from the first year after
translocation presented here support the predicted increased
biomass and mortality of translocated lobsters was similar to
resident lobsters, and was less than 10% (Green and Gardner
2009). Given that none of the modelled scenarios considered
growth of translocated lobsters to exceed that of the residents in
the first 12 months, the results from this study would need to be

�
�
Chapter 6 Growth variation
�
138
factored into future economic and biological evaluations for
translocation operations. The magnitude of the growth changes
in translocated lobsters in the current study is compelling in
terms of its commercial implications, but longer term monitoring
is needed to determine how growth rates change with
subsequent moults, as this will influence the time period for
translocated lobsters to enter the fishery.
Growth in crustaceans is moult related and
discontinuous, and regional variations in moult growth
increments and moult frequency have largely been attributed to
differences in diet, environmental factors such as water
temperature and density effects for major commercial lobster
species (review by Wahle and Fogarty 2006 including J.
edwardsii McGarvey et al. 1999). Therefore to understand how
translocation will alter lobster stock dynamics, one must
consider the mechanisms regulating growth. For instance,
manipulation of lobster population densities through
translocations has the potential to also change the growth of
resident lobsters at the capture and release sites due to change
in food availability and other density effects. For example, Dixon
and Day (2004) demonstrated growth enhancement of a
“stunted’ abalone population by both density-reduction and
�
�
Chapter 6 Growth variation
�
139
through translocation to habitats of faster growing abalone.
Additional translocations of deep-water southern rock lobsters to
sites of different densities are currently underway and the
results of these experiments offer scope for quantifying density
dependent growth in J. edwardsii. The role diet plays in the
growth variation of J. edwardsii is also unclear but mean
concentrations of lipid content and essential polyunsaturated
fatty acids (PUFA) were higher in translocated lobsters than in
deep and shallow-water lobsters suggesting enhanced overall
body condition (Chapter 4). The change in diet through
translocation is also apparent in the change in the shell
colouration from pale/white to red due to the greater availability
of dietary carotenoids in shallow-water habitats (Chapter 3). The
combined results of colour and growth enhancement will add
value and increase the productivity of deep-water recruits to
deliver greater economic yield from the fishery.
�
�
�
�
�
�

�
�
Chapter 7 General discussion
�
140
�
�
�
�
�
�
�
�
�
�
�
ChapterChapterChapterChapter
�
�
�
�
�
�
�
General Discussion
7

�
�
Chapter 7 General discussion
�
141
Translocation can improve yield and marketability of Jasus edwardsii
The specific aims of this thesis were to quantify and
describe the variation in the key market traits and growth of the
southern rock lobster Jasus edwardsii between deep and
shallow-water populations, and assess how these traits respond
to translocation. In addressing these aims, the current study 1)
described the depth and latitudinal variation in the shell
colouration of J. edwardsii and ascertained an economic impact
value on the commercial industry 2) quantified differences in
growth, shell colour, body-shape market traits, nutritional and
post-capture condition between deep-water and shallow-water
lobster populations and 3) demonstrated how translocation can
improve marketability and increase growth of deep-water J.
edwardsii over a short time period. In doing so, this study has
highlighted the plasticity of these traits and how its exploitation
through population manipulation presents a feasible option to
value-add to the commercial industry and increase the
exploitable biomass of the fishery.
Depth variation in the shell colour of J. edwardsii (Chapter
2) is an unusual occurrence among commercial lobster species
and thus creates unique marketing issues. These marketing

�
�
Chapter 7 General discussion
�
142
issues are due to price discounting based on shell colouration in
Asian country markets (where there is a high regard for the
colour red), which dominate the live market trade. Several
approaches have been considered in dealing with the marketing
of different coloured lobsters. Alternate market destinations for
deep-water J. edwardsii are under development through
industry marketing initiatives in the USA while attempts at sea-
cage grow out trials to enhance colour and improve growth
delivered little success due to on-going feed, maintenance costs
and poor lobster quality issues (Bryers and Geddes 1995). I have
demonstrated that successful shell colour enhancement in J.
edwardsii is however possible through translocation (Fig 1).
Shell colour of all pale and white grades of J. edwardsii changed
to the marketable red colour after its first moult in the new
habitat (Chapter 3). For the commercial industry, colour
enhancement through translocation can potentially eliminate the
colour grading process and the estimated value of revenue loss
at AUS$6.67 millions/year from price discounting can be
recovered.
In addition to colour variation, this study is also the first
to describe morphometric variation among Australian J.
edwardsii populations. The study revealed significant differences
�
�
Chapter 7 General discussion
�
143
in body-shape traits such as leg length and abdomen shape
across a depth gradient, however there were no complete
transformations of these traits in the short-term of a single
moult in translocated lobsters (Chapter 3). Deep-water southern
rock lobsters are not graded based on body-shape differences
alone since greater weighting is given to shell colouration, but
shape is a contributing factor to price discounting nonetheless.
Therefore it is presumed that any inferior body-shape traits that
persist in translocated lobsters will be overridden by the
improved marketability of the red shell colouration.
In addition to phenotypic variation in colour and
morphology, differences in growth and body condition between
deep and shallow-water lobster stocks also impact on the
commercial potential of translocation. In addressing the
commercial industry’s observations that deep-water southern
rock lobsters have poorer condition and lower survival during
live transport than their shallow-water counterparts, the health
and nutritional condition of deep-water, shallow-water and
translocated lobsters were assessed through lipid and
haemolymph indices (Chapters 4 and 5). An overarching factor
which heavily influenced the outcome of all these analyses was
the moult cycle which at times masked differences between
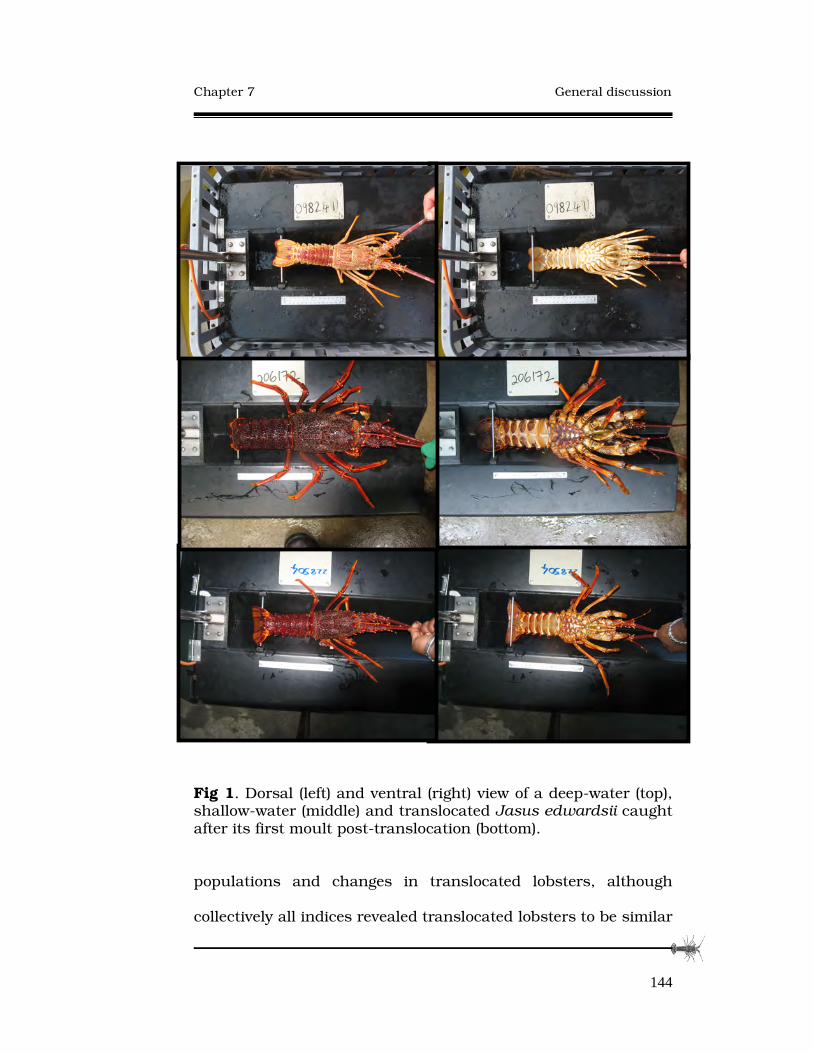
�
�
Chapter 7 General discussion
�
144
Fig 1. Dorsal (left) and ventral (right) view of a deep-water (top), shallow-water (middle) and translocated Jasus edwardsii caught after its first moult post-translocation (bottom).
populations and changes in translocated lobsters, although
collectively all indices revealed translocated lobsters to be similar
�
�
Chapter 7 General discussion
�
145
in condition to resident lobsters after a period of 12 months. In
particular the enhanced nutrition of translocated lobsters from
the high amounts of omega3 fatty acid content provides an
added marketing tool to further value-add to the product.
Further research through simulated live-transport trials by
Hawthorn (2009) found there was an improvement in live
transport condition as translocated lobsters incurred lower
mortality than deep-water lobsters. This further supports the
results from my thesis that physiological and nutritional
condition can be improved though translocation.
Potential benefits from translocation occur not only
through changes in market traits but also through increased
productivity with improvements in growth. Previous cost benefit
analyses showed that benefits mainly accrue through increase in
yield (Gardner and van Putten 2008b). My thesis demonstrated
that the growth rate of deep-water males and females increased
after translocation, with most lobsters matching and some
achieving greater growth increments than resident lobsters in
their first moult event (Chapter 6). Often the core challenge of
many enhancement operations is for released individuals to
survive and adopt the growth of wild individuals. Translocated
individuals achieved both these goals in their new habitat and

�
�
Chapter 7 General discussion
�
146
thus overcoming some of the key challenges of enhancement
strategies. Given the growth of J. edwardsii is highly plastic,
manipulation of lobster stock densities through translocations is
also likely to occur and thus the impact from density-dependent
process would also need to be further evaluated. For Tasmania,
yield gains are predicted to be economically feasible and
beneficial from translocations between sites of extreme
differences in growth rates and over short distances (Gardner
and van Putten 2008a), but this prediction may change if
translocated lobsters consistently exceed the growth of resident
lobsters. Mechanisms regulating life-history traits and
phenotypic expression in commercial lobster species are highly
variable and are most probably a combination of environmental,
behavioural, dietary and genetic factors acting upon each other.
While identifying these specific drivers would have further
clarified my results, unravelling the complex interaction between
animal and habitat was beyond the capacity of this study and
outside the scope of commercial interest.

�
�
Chapter 7 General discussion
�
147
Future of translocation as a fisheries enhancement strategy
“Translocations are powerful tools for the management of the natural and man-made environment which, properly used, can bring great benefits to natural biological systems and to man, but
like other powerful tools they have the potential to cause enormous damage if misused”
(IUCN 1987)
The task of evaluating the potential risks against the
benefits from translocations ultimately hinges on the economic,
social, biological and environmental components that drive the
fishery. The research presented in the thesis only assessed some
of the biological outcomes from translocations to inform
stakeholders of its application and provide quantitative data for
its economical evaluation. Other aspects of translocation are
equally imperative to its biological and economic feasibility:
• Related research underway has estimated that
apparent survival of all translocated lobsters from
Maatsuyker Island to Taroona Marine Reserve is
similar to survival of resident lobsters (Green and
Gardner 2009).
• Preliminary results from acoustic tracking data of
post-release translocated lobsters indicate high site
fidelity, overlap of home-ranges between resident
and translocated lobsters and a slightly greater
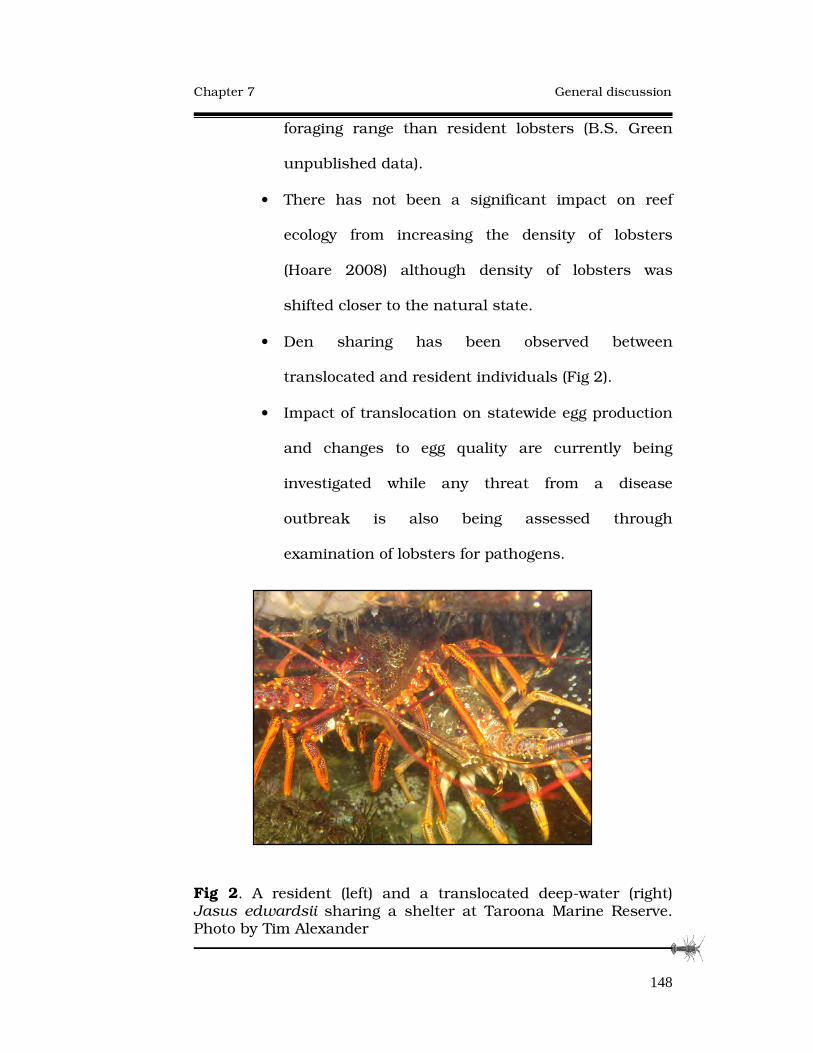
�
�
Chapter 7 General discussion
�
148
foraging range than resident lobsters (B.S. Green
unpublished data).
• There has not been a significant impact on reef
ecology from increasing the density of lobsters
(Hoare 2008) although density of lobsters was
shifted closer to the natural state.
• Den sharing has been observed between
translocated and resident individuals (Fig 2).
• Impact of translocation on statewide egg production
and changes to egg quality are currently being
investigated while any threat from a disease
outbreak is also being assessed through
examination of lobsters for pathogens.
Fig 2. A resident (left) and a translocated deep-water (right) Jasus edwardsii sharing a shelter at Taroona Marine Reserve. Photo by Tim Alexander
�
�
Chapter 7 General discussion
�
149
Although fisheries enhancement strategies using adults is
less common than hatchery reared juveniles, they face many of
the same challenges, concerns and constraints. Often the
rationale for translocating adults sourced from the wild stocks
serve to solve a specific issue rather than the broad goal of stock
replenishment. For example, reproductively deficient individuals
of queen conchs (Strombus gigus) from depleted inshore areas of
the Florida Keys are being translocated to offshore regions where
they once again develop normally and become reproductively
active (Delgado et al. 2004). In Japan, the enhancement of
(Strongylocentrotus nudus) roe quality and size was achieved by
transplanting adults with poorly developed gonads from barrens
habitats to kelp forests (Bell et al 2005). Stunted populations of
greenlip abalone translocated to faster growth areas showed
enhanced growth in response to greater food availability (Dixon
and Day 2004). One of the drawbacks to translocation strategies
is that proving its success requires long-term monitoring even if
the short-term results seem promising. Thus adult
translocations such as these are often documented as research
attempts, while their commercial application is a drawn-out
debated process.

�
�
Chapter 7 General discussion
�
150
Conclusion
“ …the core challenge in understanding enhancement fisheries is to elucidate how the characteristics of the target population and its environment, fishing and enhancement
technologies, and stakeholder behaviour interact and lead to particular outcomes ”
Lorenzen (2008, pp 11)
The research presented in this thesis has addressed some
of the key characteristics of the target population (translocated
lobsters) in its new environment that will inform and aid
stakeholders in planning future management decisions. The
process towards implementation is currently underway with pilot
commercial scale translocations being planned between deep
and shallow-water sites within a single fishing area (refer to Fig
1 in Chapter 2). Stakeholders will review the outcome of these
trials and all other research results before deciding on larger
scale translocations from south to north of the State. The final
adoption of translocation is envisaged to be a stepwise
integration and used as a supplementary strategy with existing
management arrangements, although the final implementation
will hinge on the tradeoffs between the economic, social,
biological and environmental components that drive the fishery.
In response to challenges presented by differences in the
biological characteristics of Jasus edwardsii and aspects of its

�
�
Chapter 7 General discussion
�
151
resource management, the research presented in this thesis
provides quantitative data on the spatial differences in market
traits, body condition and growth and how these traits can be
improved through translocation. While the success of
translocation as a fisheries enhancement strategy is yet to be
determined, in exploring its feasibility the current study has
contributed and highlighted significant and interesting aspects
of a lobsters’ biology and its management.
�
�
References
�
152
References
Ali M, Nicieza A, Wootton RJ (2003). Compensatory growth in
fishes: a response to growth depression. Fish and
Fisheries 4: 147-190.
Alvarez D, Metcalfe NB (2007). The tradeoff between catch-up
growth and escape speed: variation between habitats in
the cost of compensation. Oikos 116: 1144-1151.
Annala JH, Bycroft B (1993). Movement of rock lobsters (Jasus
edwardsii) tagged along the eastern coast of the North
Island, New Zealand. NZ J Mar Freshw Res 27: 183-190.
Bartley DM, Bell JD (2008). Restocking, stock enhancement and
sea ranching: Arenas of progress. Rev Fish Sci 16:357-365.
Bell JD, Rothlisberg PC, Munro JL, Loneragan NR, Masuda R
(2005). Restocking and stock enhancement of marine
invertebrate fisheries. Adv Mar Biol 49:1-370.
�
�
References
�
153
Bell JD, Leber KM, Blankenship HL, Loneragan NR, Masuda R
(2008). A new era for restocking, stock enhancement and
sea ranching of coastal fisheries resources. Rev Fish Sci
16:1-9.
Booth JD (2006). Jasus species. In: Lobsters–Biology,
management, aquaculture and fisheries. Oxford, Blackwell
publishing. 340-358.
Bligh EG, Dyer WJ (1959). A rapid method of total lipid
extraction and purification. Can J Biochem Physiol 37:
911-917.
Bradshaw M, Wood L, Williamson S (2001). Applying qualitative
and quantitative research: a social impact assessment of a
fishery. Appl Geo 21: 69 85.
Bruce BD, Bradford R, Griffin D, Gardner C, Young J (2000). A
synthesis of existing data on larval rock lobster
distribution in southern Australia. FRDC project 96/107.
57pp.
�
�
References
�
154
Bryars SR, Geddes MC (2005). Effects of diet on the growth,
survival, and condition of sea-caged adult southern rock
lobster, Jasus edwardsii. NZ J Mar Freshw Res. 39: 251-
262.
Caddy JF, Defeo O (2003). Enhancing or restoring the
productivity of natural populations of shellfish and other
marine invertebrates resources. FAO Fisheries Technical
Paper 448. FAO, Rome.
Chang ES, O'Connor JD (1983). Metabolism and transport of
carbohydrates and lipids. In: Bliss, D.E. (Ed.), The biology
of crustacea. Academic Press, New York, pp. 263-287.
Chang ES (2005). Stressed-out lobsters: Crustacean
hyperglycemic hormone and stress proteins. Integ Comp
Biol 45: 43-50.
Childress JJ, Cowles DL, Favuzzi JA, Mickel TJ (1990).
Metabolic rates of benthic deep-Sea decapod crustaceans
decline with increasing depth primarily due to the decline
in temperature. Deep-Sea Res Part A 37, 929-949.

�
�
References
�
155
Cockcroft AC (1997). Biochemical composition as a growth
predictor in male west-coast rock lobster (Jasus lalandii).
Mar Freshw Res 48: 845-856.
Colquhoun E, Archbold D (2009). Evaluating the performance of
Australian marine capture fisheries. Final report to the
FRDC – Resource Working Group.
Corraze G (1999). Lipid Nutrition. In: Guillaume, J., Metailler,
R., Kaushik, S., Bergot, P. (Eds.), Nutrition and feeding of
fish and crustaceans. Springer, London, pp. 111-130.
Crear B, Hart P, Thomas C, Barclay M (2002). Evaluation of
commercial shrimp grow-out pellets as diets for juvenile
southern rock lobster, Jasus edwardsii, influence on
growth, survival, colour, and biochemical composition. J
Appl Aqua 12: 43-57.
Crear BJ, Hart PR, Thomas CW (2003). The effect of photoperiod
on growth, survival, colour and activity of juvenile
southern rock lobster, Jasus edwardsii. Aquac Res 34:
439-444.

�
�
References
�
156
D'Abramo LR (1997). Triacyglycerols and fatty acids, Crustacean
nutrition (Advances in World Aquaculture). World
Aquaculture Society, Baton Rouge, pp. 71-107.
Davis JLD, Eckert-Mills MG, Young-Williams AC, Hines AH,
Zohar Y (2005). Morphological conditioning of a hatchery-
raised invertebrate, Callinectes sapidus, to improve field
survivorship after release. Aquaculture 243:147-158
Debuse VJ, Addison JT, Reynolds AD (2001). Morphometric
variability in UK populations of the European lobster. J
Mar Biol Ass U K 81:469-474.
Delgado GA, Bartels CT, Glazer RA, Peterson NJB, McCarthy KJ
(2004). Translocation as a strategy to rehabilitate the
queen conch (Strombus gigas) population in the Florida
Keys. Fish Bull 102:278-288.
Department of Primary Industries (2003). Rock lobster fishery
management plan, 2003: Fisheries Victoria management
report series, No 1. Victoria, Department of Primary
Industries.
�
�
References
�
157
Dixon CD, Day RW (2004). Growth responses in emergent
greenlip abalone to density reductions and translocations.
J Shellfish Res 23:1223-1228.
Edgar GJ (2001). Australian marine habitats in temperate
waters. Sydney, New Holland Publishers.
Fischer J, Lindenmayer DB (2000). An assessment of the
published results of animal relocations. Biol Conserv 96:1-
11.
Ford W (2001). Restructuring the Tasmanian rock-lobster
fishery - the effect of two years of management under
individual transferable quotas. Mar Freshw Res 52: 1641-
1648.
Fotedar S, Evans L, Jones B (2006). Effect of holding duration
on the immune system of western rock lobster, Panulirus
cygnus. Comp Bio Physiol A - Mol Integ Physiol 143: 479-
487.
�
�
References
�
158
Florkin M (1960). Blood chemistry. In: The physiology of
crustacean I. Editor; Waterman T. Academic Press, New
York. Vol 1, pp 141-159.
Frusher S, Eaton L, Bradshaw M (2003). Impact of management
change to an ITQ system in the Tasmanian Rock Lobster
Fishery. Hobart, Tasmanian Aquaculture and Fisheries
Institute.
Garcia SM, Grainger RJR (2005). Gloom and doom? The future
of marine capture fisheries. Phil Trans R Soc B 360:21-46.
Gardner C, Frusher S, Haddon M, Buxton C (2003). Movements
of the southern rock lobster Jasus edwardsii in Tasmania,
Australia. Bull Mar Sci 73: 653-671.
Gardner C, Mackinnon C, Haddon M, Frusher SD (2004).
Tasmanian Rock Lobster Fishery 2002/03, Fishery
Assessment Report. Tasmanian Aquaculture and Fisheries
Institute.
�
�
References
�
159
Gardner C, Mills D, Frusher SD (2005). Does pleopod setation
provide a measure of maturity in female southern rock
lobsters Jasus edwardsii? Sci Mar 69:123-131.
Gardner C, Frusher S, Barrett N, Haddon M, Buxton C (2006).
Spatial variation in size at onset of maturity of female
southern rock lobster Jasus edwardsii around Tasmania,
Australia. Sci Mar 70: 423-430.
Gardner C, van Putten I (2008a). The economic feasibility of
translocating rock lobsters to increase yield. Rev Fish Sci
16:154-163.
Gardner C, van Putten I (2008b). Biological modelling of
translocation as a management tool for a rock lobster
fishery. Rev Fish Sci 16:81-90.
Gebauer SK, Psota TL, Harris WS, Kris-Etherton PM (2006). n-3
fatty acid dietary recommendations and food sources to
achieve essentiality and cardiovascular benefits. Am J Clin
Nutr 83: 1526S-1535S.
�
�
References
�
160
Gibson R, Barker PL (1979). The decapod hepatopancreas.
Oceanogr Mar Biol Annu Rev 17: 285-346.
Goodwin TW (1960). Biochemistry of pigments. In: Waterman TH
(ed) The physiology of crustacea: metabolism and growth,
Vol 1. Academic Press Inc., New York, p 101-140.
Green BS, Gardner C (2009). Surviving a sea-change: survival of
southern rock lobster (Jasus edwardsii) translocated to a
site of fast growth. ICES J. Mar. Sci 66: 656-664.
Griffith B, Scott JM, Carpenter JW, Reed C (1989). Translocation
as a species conservation tool: status and strategy.
Science 245:477-482.
Haddon M (2001). Modelling and quantitative methods in
fisheries. Florida, Chapman & Hall.
Haddon M, Gardner C (2009). Rock lobster fishery assessment
report 2007/08. Tasmanian Aquaculture and Fisheries
Institute, Hobart.

�
�
References
�
161
Harrison AJ (2004). A report on the abalone and rock lobster
post harvesting industry in Tasmania. Hobart, Tasmania
Abalone Council. 121 p.
Hawthorne P (2009). Effects of deep-water hauling and
translocation from deep-water to shallow-water inshore
reefs on the physiological condition of southern rock
lobster (Jasus edwardsii). Honours thesis, Flinders
University, South Australia.
Hoare M (2008). Ecological effect of transplantation of deep-
water rock lobsters. Honours thesis, Flinders University,
South Australia.
Iverson SJ, Frost KJ, Lang SLC (2002). Fat content and fatty
acid composition of forage fish and invertebrates in Prince
William Sound, Alaska: factors contributing to among and
within species variability. Mar Ecol Prog Ser 241: 161-181.
IUCN (1987). IUCN Position statement on translocation of living
organisms: introductions, reintroductions and restocking.
22nd Meeting of the IUCN Council, Gland Switzerland,
�
�
References
�
162
September 1987
(http://iucn.org/themes/ssc/pubs/policy/transe.htm).
Jarvinen R, Knekt P, Rissanen H, Reunanen A (2006). Intake of
fish and long-chain n-3 fatty acids and the risk of
coronary heart mortality in men and women. Br J Nutr 95:
824-829.
Johnston DJ, Calvert KA, Crear BJ, Carter CG (2003). Dietary
carbohydrate/lipid ratios and nutritional condition in
juvenile southern rock lobster, Jasus edwardsii.
Aquaculture 220: 667-682.
Jones PL, Obst JH (2000). Effects of starvation and subsequent
refeeding on the size and nutrient content of the
hepatopancreas of Cherax destructor (Decapoda :
Parastacidae). J Crustac Biol 20: 431-441.
Ju SJ, Harvey HR (2004). Lipids as markers of nutritional
condition and diet in the Antarctic krill Euphausia superba
and Euphausia crystallorophias during austral winter.
Deep-Sea Res Part II 51: 2199-2214.
�
�
References
�
163
Jussila J, Jago J, Tsvetnenko E, Dunstan B, Evans LH (1997).
Total and differential haemocyte counts in western rock
lobsters (Panulirus Cygnus George) under post-harvest
stress. Mar Freshw Res 48: 863-867.
Kailola PJ, Williams MJ, Stewart PC, Reichelt RE, McNee A,
Grieve C (1993). Australian Fisheries Resource. Canberra,
Bureau of Resource Sciences. 155 p.
Kanazawa A, Koshio S (1994). Lipid nutrition of the spiny lobster
Panulirus japonicus (Decapoda, Lalinuridae) - a review.
Crustaceana 67: 226-232.
Konosu S, Yamaguchi K (1994). Colour and taste In: Spiny
lobster management. Cambridge, Blackwell Scientific. pp.
495-501.
Lavallee J, Hammel KL, Spangler ES, Cawthorn RJ, Dohoo IR
(2000). Descriptive statistics of fishing practices,
postharvest health status, and transport conditions in the
Prince Edward Island lobster (Homarus americanus)
industry. J Shellfish Res 19: 265-274.
�
�
References
�
164
Lignot JH, Spanings-Pierrot C, Charmantier G (2000).
Osmoregulatory capacity as a tool in monitoring the
physiological condition and the effect of stress in
crustaceans. Aquaculture 191: 209-245.
Linnane A, Dimmlich W, Ward T (2005). Movement patterns of
the southern rock lobster, Jasus edwardsii, off South
Australia. NZ J Mar Freshw Res 39: 335-346.
Linnane A, McGarvey R, Feenstra J (2006). Northern Zone rock
lobster (Jasus edwardsii) fishery status report 2005/2006.
West Beach, SARDI Aquatic Sciences.
Lorenzen K (2005). Population dynamics and potential of
fisheries stock enahncment: practical theory for
assessment and policy analysis. Phil Trans R Soc B
360:171-189.
Lorenzen K (2008). Understanding and managing enhancement
fisheries systems. Rev Fish Sci 16:10-23.
Lund HS, Wang T, Chang ES, Pedersen LF, Taylor EW, Pedersen
PB, McKenzie DJ (2009). Recovery by the Norway lobster
�
�
References
�
165
Nephrops norvegicus (L.) from the physiological stresses of
trawling: Influence of season and live-storage position. J
Exp Mar Biol Ecol. 373:124-132.
McGarvey R, Ferguson GJ, Prescott JH (1999). Spatial variation
in mean growth rates at size of southern rock lobster,
Jasus edwardsii, in South Australian waters. Mar Freshw
Res 50: 333-342.
McLeod LE, Carter CG, Johnston DJ (2004). Changes in the
body composition of adult male southern rock lobster,
Jasus edwardsii, during starvation. J Shellfish Res 23:
257-264.
MacCormack TJ, DeMont ME (2003). Regional differences in
allometric growth in Atlantic Canadian lobster (Homarus
americanus). J Crust Biol 23:258-264.
Martin GAS (2004). Transplantation of large Paracentrotus
lividus: A restocking strategy for an edible sea urchin. In:
Lawrence JM, Guzman O (eds) Sea urchins: fisheries and
ecology - Proceedings of the international conference on
�
�
References
�
166
sea-urchin fisheries and aquaculture. DEStech
Publications, Pennsylvania, p 74-83.
Melville-Smith R, Cheng YW, Thomson AW (2003). Factors
affecting colour change in 'white' western rock lobsters,
Panulirus cygnus. J Exp Mar Biol Ecol 291: 111-129.
Mercaldo-Allen M (1991). Changes in the blood chemistry of the
American lobster Homarus americanus, H. Milne Edwards,
1837, over the molt cycle. J Shellfish Res 10: 147-156.
Meyers SP, Latscha T (1997) Carotenoids. In: Crustacean
nutrition (Advances in world aquaculture). World
Aquaculture Society.
Moore LE, Smith DM, Loneragan NR (2000). Blood refractive
index and whole-body lipid content as indicators of
nutritional condition for penaeid prawns (Decapoda :
Penaeidae). J Exp Mar Biol Ecol 244: 131-143.
Murphy KJ, Mooney BD, Mann NJ, Nichols PD, Sinclair AJ
(2002). Lipid, FA, and sterol composition of New Zealand
�
�
References
�
167
green lipped mussel (Perna canaliculus) and Tasmanian
blue mussel (Mytilus edulis). Lipids 37: 587-595.
Musgrove RJB (2001). Interactions between haemolymph
chemistry and condition in the southern rock lobster,
Jasus edwardsii. Mar Biol 139: 891-899.
Mynard DM (1960). Circulation and heart function. In: The
physiology of crustacean I. Editor; Waterman TH.
Academic Press, New York. Vol 1, pp 161-226.
Navarro JC, Villanueva R (2003). The fatty acid composition of
Octopus vulgaris paralarvae reared with live and inert
food: deviation from their natural fatty acid profile.
Aquaculture 219: 613-631.
Nelson MM, Olley J, Crear BJ, Lewis T, Nichols PD (2005).
Comparison of wild and cultured adult southern rock
lobster, Jasus edwardsii: Growth, sensory analysis and oil
composition. Food Australia 57: 499-508.
Nelson MM, Bruce MP, Nichols PD, Jeffs AG (2006). Nutrition of
wild and cultured lobsters. In: Phillips, B.F. (Ed.),
�
�
References
�
168
Lobsters: Biology, Management, Aquaculture and
Fisheries. Blackwell Publishing, Victoria, pp. 205-230.
Neter J, Kutner MH, Nachtsheim CJ, Wassermen W (1990).
Applied linear statistical models. Chicago, Irwin.
O'Connor JD, Gilbert LI (1968). Aspects of lipid metabolism in
crustaceans. Am Zool 8: 529-539.
Oliver MD, MacDiarmid AB (2001). Blood refractive index and
ratio of weight to carapace length as indices of nutritional
condition in juvenile rock lobsters (Jasus edwardsii). Mar
Freshwa Res 52: 1395-1400.
Ovenden JR, Brasher DJ, White RWG (1992). Mitochondrial DNA
analyses of the red rock lobster Jasus edwardsii supports
an apparent absence of population subdivision throughout
Australiasia. Mar Biol 112:319-326.
Parslow-Williams PJ, Atkinson RJA, Taylor AC (2001). Nucleic
acids as indicators of nutritional condition in the Norway
lobster Nephrops norvegicus. Mar Ecol Prog Ser 211: 235-
243.
�
�
References
�
169
Passano LM (1960). Moulting and its control. In: Waterman, T.H.
(Ed.), The physiology of crustacea. Academic Press Inc,
London, pp. 473-536.
Paterson BD, Spanoghe PT (1997). Stress indicators in marine
decapod crustaceans, with particular reference to the
grading of western rock lobsters (Panulirus cygnus) during
commercial handling. Mar Freshw Res 48: 829-834.
Paterson BD, Spanoghe PT, Davidson GW, Hosking W,
Nottingham S, Jussila J, Evans LH (2005). Predicting
survival of western rock lobsters Panulirus cygnus using
discriminant analysis of haemolymph parameters taken
immediately following simulated handling treatments. NZ
J Mar Freshw Res 39: 1129-1143.
Pauly D, Watson R, Alder J (2005). Global trends in world
fisheries: impacts on marine ecosystems and food security.
Phil Trans R Soc B 360:5-12.
Phillips KL, Nichols PD, Jackson GD (2003a). Dietary variation of
the squid Moroteuthis ingens at four sites in the Southern

�
�
References
�
170
Ocean: stomach contents, lipid and fatty acid profiles. J
Mar Biol Ass U K 83: 523-534.
Phillips KL, Nichols PD, Jackson GD (2003b). Size-related
dietary changes observed in the squid Moroteuthis ingens
at the Falkland Islands: stomach contents and fatty-acid
analyses. Polar Biol 26: 474-485.
Punt AE, Kennedy RB (1997). Population modelling of
Tasmanian rock lobster, Jasus edwardsii, resources. Mar
Freshw Res 48: 967-980.
Punt AE, Kennedy RB, Frusher SD (1997). Estimating the size-
transition matrix for Tasmanian rock lobster, Jasus
edwardsii. Mar Freshw Res 48: 981-992.
Rao KR (1985). Pigmentary effectors. In: Bliss DE, Mantel LH
(eds) The Biology of crustacea: integument, pigments, and
hormonal processes, Vol 9. Academic Press Inc., New York,
p 395-462.
Roberts PR (1994). Export marketing of Australian and New
Zealand Rock Lobster. In 'Spiny Lobster Management'.
�
�
References
�
171
(Eds BF Phillips, JS Cobb and J Kittaka) pp. 510-516.
(Blackwell Scientific Publishing: Oxford).
Santos EA, Nery LEM, Keller R, Goncalves AA (1997). Evidence
for the involvement of the crustacean hyperglycemic
hormone in the regulation of lipid metabolism. Physiol
Zool 70: 415-420.
Sargent JR (1974). The structure, metabolism and function of
lipids in marine organisms. In: Malins, D.C., Sargent., J.R.
(Eds.), Biochemical and Biophysical Perspectives in marine
Biology. Academic press, London, pp. 149-212.
Sax DF, Smith KF, Thompson AR (2009). Managed relocation: a
nuanced evaluation is needed. Trends Ecol Evol 24:472-
473.
Schahinger RB (1987). Structure of coastal upwelling events
observed off the south-east coast of South Australian
during February 1983 – April 1984. Aust J Mar Freshw
Res 38: 439-459.
�
�
References
�
172
Schlaepfer MA, Helenbrook WD, Searing KB, Shoemaker KT
(2009). Assited colonization: evaluating contrasting
management actions (and values) in the face of
uncertainty. Trends Ecol Evol 24: 471-472.
Semmens J, Haddon M, Mackinnon C (2006). Tasmanian Rock
Lobster Fishery assessment report 2004/2005. Hobart,
Tasmanian Aquaculture and Fisheries Institute.
Sokal RR, Rohlf FJ (1981). Biometry. W.H Freeman and
Company, New York.
Speed SR, Baldwin J, Wong RJ, Wells RMG (2001). Metabolic
characteristics of muscles in the spiny lobster, Jasus
edwardsii, and responses to emersion during simulated
live transport. Comp Biochem Physiol B - Bioch and Mol
Biol 128: 435-444.
Stuart T, Macmillan DL, Thomas M (1996). The effect of
background colour on the colour of developing juvenile
rock lobsters, Jasus edwardsii (Crustacea: Decapoda). Mar
Freshw Behav Physiol 27: 269-273.
�
�
References
�
173
Taylor HH, Paterson BD, Wong RJ, Wells RMG (1997).
Physiology and live transport of lobsters: report from a
workshop. Mar Freshw Res 48: 817-822.
Tlusty M (2005). Use of digital colour analysis to assess variation
within individual adult American lobsters (Homarus
americanus) and the process of addition of colour in white
lobsters. NZ J Mar Freshw Res 39: 571-580.
Tlusty M, Hyland C (2005). Astaxanthin deposition in the cuticle
of juvenile American lobster (Homarus americanus):
implications for phenotypic and genotypic coloration. Mar
Biol 147: 113-119.
Turner K, Gardner C, Swain R (2002). Onset of maturity in male
southern rock lobsters Jasus edwardsii in Tasmania,
Australia. Invert Reprod Dev 42: 129-135.
Wade N, Goulter KC, Wilson KJ, Hall MR, Degnan BM (2005).
Esterified astaxanthin levels in lobster epithelia correlate
with shell colour intensity: Potential role in crustacean
shell colour formation. Comp Biochem Physiol B 141:307-
313.
�
�
References
�
174
Wahle RA, Fogarty MJ (2006). Growth and development:
Understanding and modelling growth variability in
lobsters. In: Lobsters: Biology, management, aquaculture
and fisheries. Blackwell Publishing Ltd, Oxford. pp. 1-44.
Warton DI, Wright IJ, Falster DS, Westoby M (2006). Bivariate
line-fitting methods for allometry. Biol Rev 81:259-291.
Whiteley NM, Taylor EW (1992). Oxygen and acid-base
disturbances in the haemolymph of the lobster Homarus-
gammarus during commercial transport and storage. J
Crust Biol 12: 19-30.
Wood R, Peat A, Galeano D (2007). Australian Fisheries
Statistics 2006. Canberra, Australian Bureau of
Agricultural and Resource Economics.
Ziegler PE, Haddon M, Frusher SD, Johnson CR (2004).
Modelling seasonal catchability of the southern rock
lobster Jasus edwardsii by water temperature, moulting,
and mating. Mar Biol 145:179-190.
�
�
References
�
175
Zohar Y, Hines AH, Zmora O, Johnson EG, Lipcius RN, Seitz RD,
Eggleston DB, Place AR, Schott EJ, Stubblefield JD,
Chung JS (2008) The Chesapeake Bay blue crab
(Callinectes sapidus): A multidisciplinary approach to
responsible stock enhancement. Rev Fish Sci 16: 24-34

�
�
Published papers
�
176
Appendix
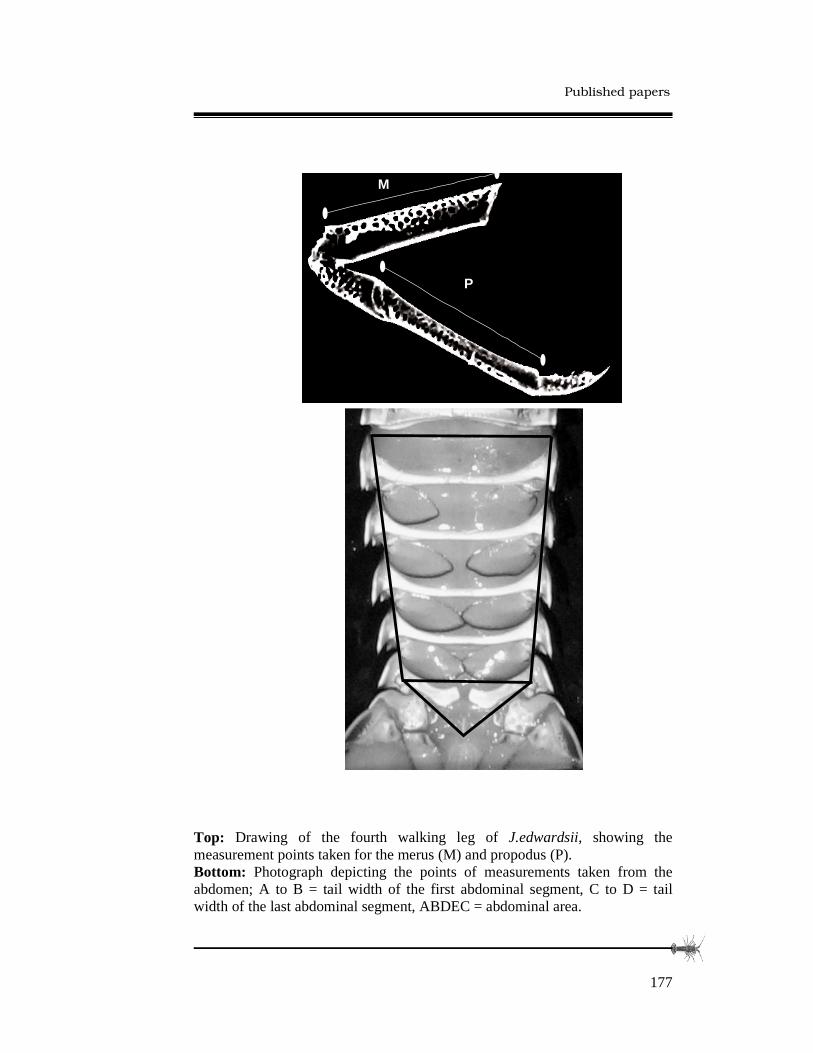
�
�
Published papers
�
177
��
�������
��
��������������
��
Top: Drawing of the fourth walking leg of J.edwardsii, showing the measurement points taken for the merus (M) and propodus (P). Bottom: Photograph depicting the points of measurements taken from the abdomen; A to B = tail width of the first abdominal segment, C to D = tail width of the last abdominal segment, ABDEC = abdominal area.
M
P