transmission and generation investment in electricity ... · transmission and generation investment...
TRANSCRIPT

Transmission and Generation Investment in Electricity
Markets: the Impact of Market Splitting and Network
Fee Regimes
Veronika Grimm
Barcelona
February 3, 2015
joint work with A. Martin, M. Schmidt, C. Sölch, M. Weibelzahl, and G.Zöttl

Prof. Dr. Veronika Grimm, FAU & EnCN Economy
A Grand Challenge
2
Quelle: Bundesamt für Strahlenschutz
● Abandoning nuclear energy
requires complete reorientation of
power supply schemes.
● Old plants get dismanteld or need
repowering.
● A lot of fluctuating renewable
sources have been installed.
● We need market rules that
generate adequate investment
incentives:
=> adequate capacities
=> at the right locations
Prof. Dr. Veronika Grimm, FAU & EnCN Economy
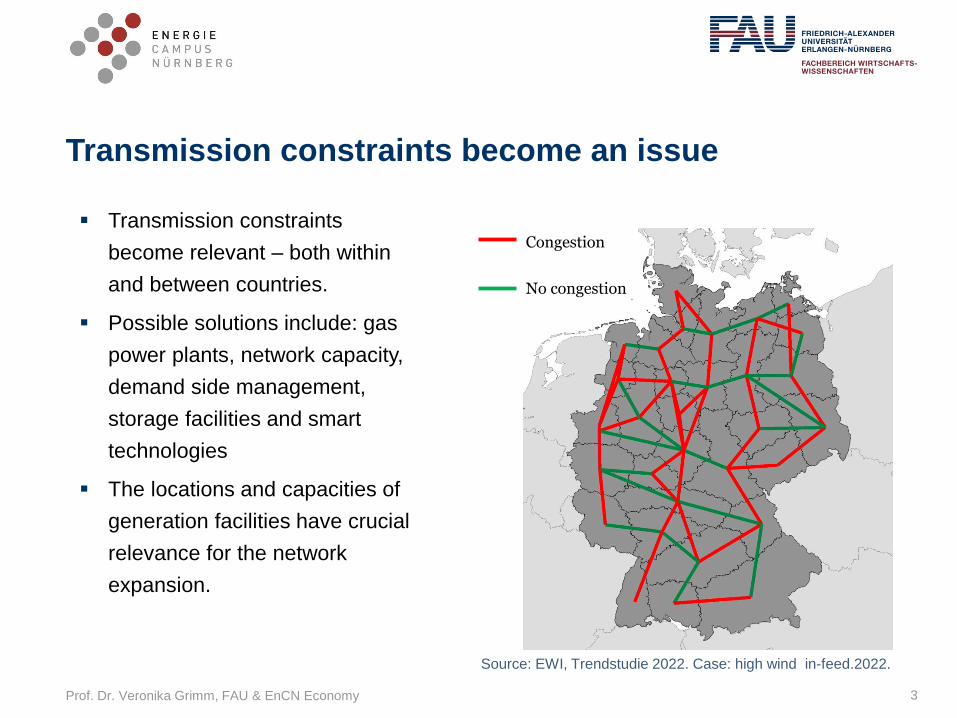
Transmission constraints become an issue
Transmission constraints
become relevant – both within
and between countries.
Possible solutions include: gas
power plants, network capacity,
demand side management,
storage facilities and smart
technologies
The locations and capacities of
generation facilities have crucial
relevance for the network
expansion.
3
Congestion
No congestion
Source: EWI, Trendstudie 2022. Case: high wind in-feed.2022.
Prof. Dr. Veronika Grimm, FAU & EnCN Economy
Related Literature
“Old World”: Integrated planer problem
Optimal expansion for generation and transmission capacities
Gallego et al. (1998), Binato et al. (2001), and others
Investment models for generation facilities (e.g. peak load pricing
literature, “Capacity-market”-discussion).
typically disregards network and network expansion (“copper plate”)
Gaszewicz & Poddar (1997), Murphy & Smeers (2005), Grimm & Zöttl (2013)
Models on optimal transmission planning in anticipation of private
investment
Typically asume optimal management of the network (nodla pricing)
Sauma and Oren (2006, 2009), Jin and Ryan (2011), Jenabi et al. (2013)
# 4 05.02.2015
Prof. Dr. Veronika Grimm, FAU & EnCN Economy
Related Literature
Models analyzing impact of different network management regimes
(nodal pricing, zonal pricing, redispatch)
typically focus on the short run perspective (given network & generation
facilities)
Hogan (1999), Ehrenmann and Smeers (2005), Neuhoff et al. (2005), …
Analyses of the ability to exercise market power under different network
management regimes
Oren (1997), Jing-Yuan & Smeers (1999), Oggoni & Smeers (2013)
This paper: models transmission planning by a regulator in anticipation
of private investment in an energy only market with redispatch
# 5 05.02.2015

Prof. Dr. Veronika Grimm, FAU & EnCN Economy
Questions we have in mind (examples)
What is the quantifiable impact of adopting a different transmission
management regime (e.g. price zones,…, nodal pricing) taking into
account long run investment?
what is the impact of changed way of charging network fees on
generation investment and associated network expansion?
This paper: lump sum, capacity based, energy based
Current work: G- and L-Component, regional differentiation
Incentives under Cost Based vs. Market Based redispatch (different
paper, short run)
What are the incentives to invest in responsive consumption units and
what is the impact on optimal transmission investment?
We present a computable equilibrium framework which allows to
analyze those issues
6

Prof. Dr. Veronika Grimm, FAU & EnCN Economy
Roadmap of this talk
(1) Introduction
(2) Computational Equilibrium Framework
(3) Testexample (6-node-network)
(4) Very first results on Germany&Neighbours
(5) Conclusion
# 7 05.02.2015

Prof. Dr. Veronika Grimm, FAU & EnCN Economy
What we have in mind
8
Model Components Illustration
Network expansion by social
planner
Competitve Firms invest in
different production technologies
throughout the network
Demand at the nodes (net of
renewable feed-in) can be
fluctuating and uncertain.
We want to explicitly take into
account impact of different
network management regimes
(redispatch, market splitting)
Main purpose: to identify the impact of market rules on investment decisions
(overall system optimization is just a benchmark!)
Prof. Dr. Veronika Grimm, FAU & EnCN Economy
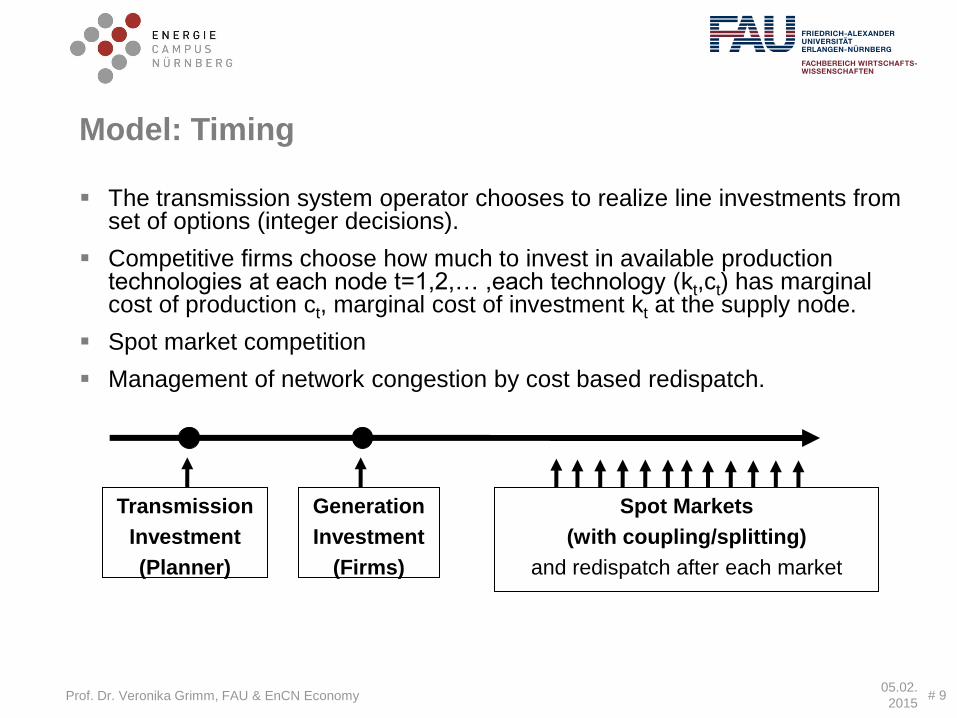
Model: Timing
The transmission system operator chooses to realize line investments from set of options (integer decisions).
Competitive firms choose how much to invest in available production technologies at each node t=1,2,… ,each technology (kt,ct) has marginal cost of production ct, marginal cost of investment kt at the supply node.
Spot market competition
Management of network congestion by cost based redispatch.
Spot Markets
(with coupling/splitting)
and redispatch after each market
Generation
Investment
(Firms)
Transmission
Investment
(Planner)
05.02.
2015 # 9

Prof. Dr. Veronika Grimm, FAU & EnCN Economy
Model Components: modelling the physical network
● We consider the usual linear lossless DC-Approximation:
10
100 MW
resistance : 1
therm. capacity: 80 MW
flow: 75 MW
100 MW
resistance: 2
therm. capacity: 40 MW
flow: 25 MW resistance : 1
therm. capacity: 40 MW
flow: 25 MW

Prof. Dr. Veronika Grimm, FAU & EnCN Economy
Model Components: Network Management Regimes Cost based Redispatch:
All bids at the spot markets are made entirely independently of network
constraints, we obtain a uniform price accross the entire market.
Quantities traded may be physically unfeasible. Then the TSO has to find
the cheapest possible re-dispatch to make final quantities physically
feasible.
Market Splitting:
The market region is divided into price zones, potential congestion among
zones (but not within zones!) is already taken into account at the spot
markets.
Remaining physical infeasibilities are still resolved through redispatch.
11

Prof. Dr. Veronika Grimm, FAU & EnCN Economy
Model Components: Network Fees
The TSO is facing the following cost:
Network expansion investment
Cost of redispatch
In our framework TSO is supposed to not make any profits, the above
spendings have to be recovered by network fees. We consider the following
cases:
lump sum
energy based fees (e.g. Germany, 5 €ct/KWh)
capacity based fees
Fees payed either by generators or by consumers
12

Prof. Dr. Veronika Grimm, FAU & EnCN Economy
Illustration of our 3-stage approach
13
Network Expansion
(social planner)
Investment in Generation Facilities
Trading at Spot Markets
(competitive companies)
Redispatch taking into account renewable production
(social planner)

Prof. Dr. Veronika Grimm, FAU & EnCN Economy
Our 3-stage approach, more formally
14
Max Welfare(N,K,S,R) s.t.
Network expansion-stage: Social planner chooses network(expansion) maximizing WF
K,S is competitve equilibrium, s.t.
Market-stage: Competitive Firms choose capacities and Spotmarket-bids to maximize profits.
Min REDCost(N,K,S,R) s.t.
quantities can be transmitted by network and can be produced by plants
Traded quantities S can be produced by capacities K
Redispatch-stage: Social planner chooses Redispatch R to minimize Redispatchcost REDCost, s.t. all quantities are feasible.

Prof. Dr. Veronika Grimm, FAU & EnCN Economy
Benchmark: system optimization / first best
15
Max Welfare(N,K,S,R) s.t.
Integrated perspective: Social planner chooses network(expansion), generation investment and production to maximize Welfare
Transmission is feasible
s.t. feasibility constraints.
Production schedule is feasible

Prof. Dr. Veronika Grimm, FAU & EnCN Economy
Computational Results, 6 node test example
● To test our equilibrium framwork we consider a
common 6-node-example (adapted for long
run decisions).
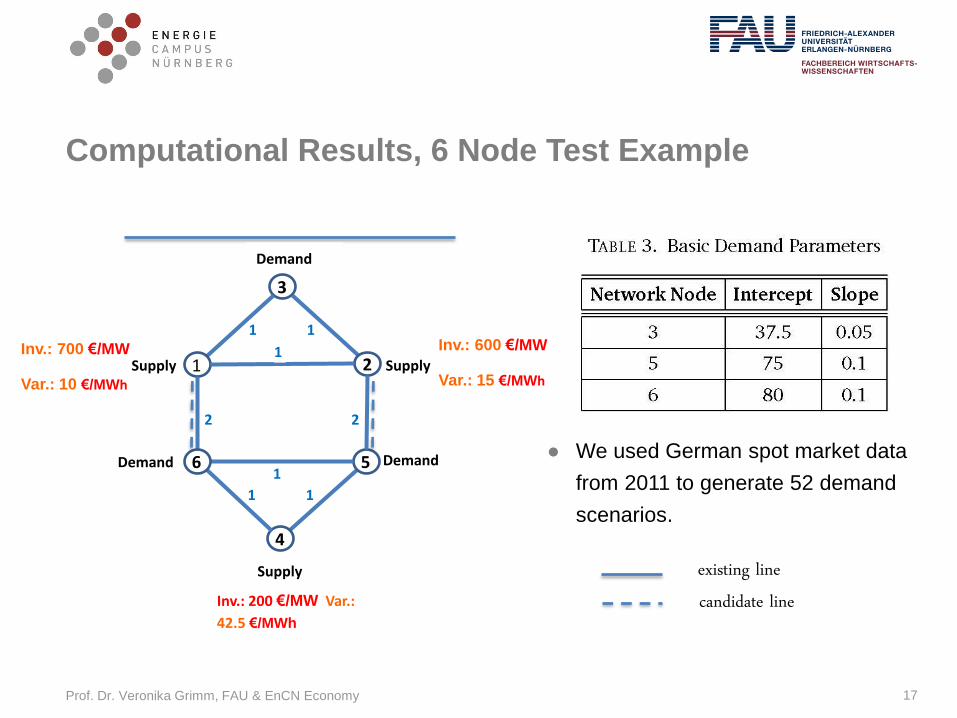
● Lines connecting nodes 1,2,3 and nodes 4,5,6
have sufficient capacities. Only lines 1-6 and
2-5 cause problems. Potential line investment
1-6 and 2-5.
● Three demand nodes (3,5,6).
● Investment in generation facilities only at the
supply nodes (1,2,4)
● Notice: Storage facilities are not (yet) included.
16
3
Demand
Supply 2
5
4
1
6
Supply
Supply
Demand Demand
1
1 1
1
1 1
2 2
existing line candidate line
Prof. Dr. Veronika Grimm, FAU & EnCN Economy
Computational Results, 6 Node Test Example
17
3
Demand
Supply 2
5
4
1
6
Supply
Supply
Demand Demand
1
1 1
1
1 1
2 2
Inv.: 600 €/MW
Var.: 15 €/MWh
Inv.: 700 €/MW
Var.: 10 €/MWh
Inv.: 200 €/MW Var.:
42.5 €/MWh
existing line candidate line
● We used German spot market data
from 2011 to generate 52 demand
scenarios.

Prof. Dr. Veronika Grimm, FAU & EnCN Economy
6 node test example, scenarios analyzed
18
Scenario: Single Zone
Zone North
Scenario: Two Zones
Zone South
Spot- & Redispatch-Markt

Prof. Dr. Veronika Grimm, FAU & EnCN Economy
Computational Results, 6 Node Test Example
19
Benchmark (fist best) Single Zone Two zones Welfare (norm.): Generation. Invest.: Network Invest.:
1
All locations Build no line
0.93
Only node 1 Build both lines
0.98
Only nodes 1 and 4 Build 2-5
Prof. Dr. Veronika Grimm, FAU & EnCN Economy
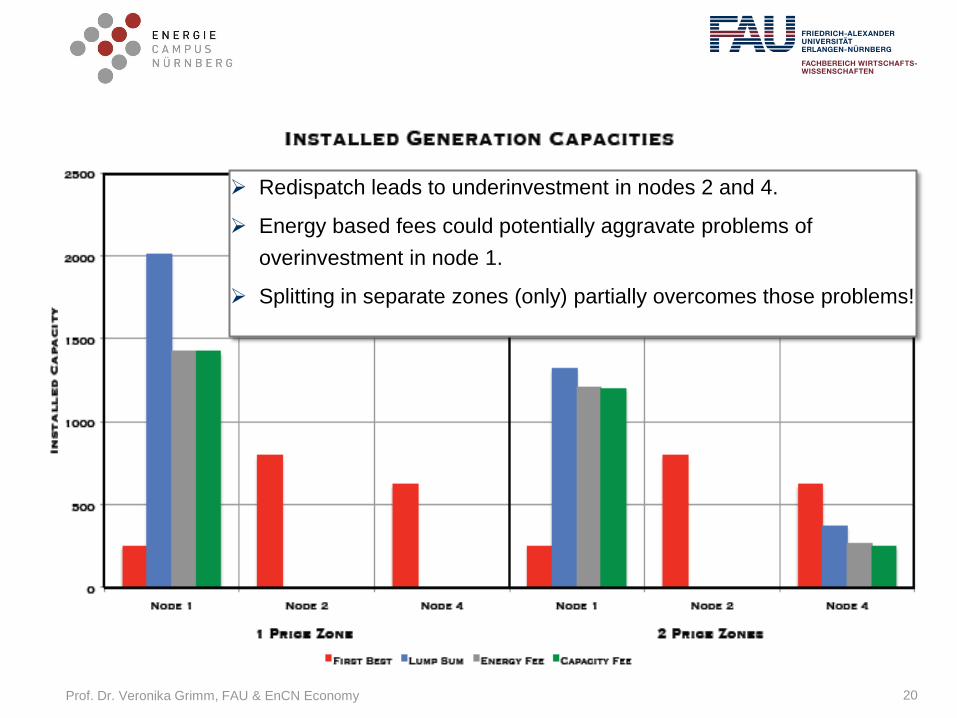
20
Redispatch leads to underinvestment in nodes 2 and 4.
Energy based fees could potentially aggravate problems of
overinvestment in node 1.
Splitting in separate zones (only) partially overcomes those problems!

Prof. Dr. Veronika Grimm, FAU & EnCN Economy
Summary of Results
21

Prof. Dr. Veronika Grimm, FAU & EnCN Economy
Prices
22

Prof. Dr. Veronika Grimm, FAU & EnCN Economy
6 node test example, Summary of Results
● Under Cost Based Redispatch Regime
investment in generation facilities in the
„South“ is too low and network investments are
too high (relative to the first best).
● Energy based fees potentially aggravate
problems of overinvestment in the „North“.
● Consideration of different regions already at
the spot market (market splitting) would
aleviate but not eliminate distortions
● Perspective: Our framework allows to
precisely quantify all those differences, also for
detailled calibration of specific market regions.
23
3
Demand
Supply 2
5
4
1
6
Supply
Supply
Demand Demand
1
1 1
1
1 1
2 2
existing line candidate line

Prof. Dr. Veronika Grimm, FAU & EnCN Economy 24
Regional Model "Electricity Transport 2013" 8784 hours (= year 2012)
20 regions for Germany:
2 regions for off-shore wind energy
plants (North and Baltic Sea),
18 regions on the German mainland
9 regions for neighboring countries:
Austria,
Belgium,
Switzerland,
Czech Republic,
Denmark (West),
France,
the Netherlands,
Poland,
Northern Europe (Denmark East,
Norway, Sweden)

Prof. Dr. Veronika Grimm, FAU & EnCN Economy
First Results II
25

Prof. Dr. Veronika Grimm, FAU & EnCN Economy
First Results II
26 26
3
5 4
8
7 6
9
2 1
10
11 12 13
14
15
16 17
18 19 20
26
21 27
25
22
23 24
3
5 4
8
7 6
9
2 1
10
11 12 13
14
15
16 17
18 19 20
26
21 27
25
22
23 24
First best Solution Market Solution (Cost based redispatch)

Prof. Dr. Veronika Grimm, FAU & EnCN Economy
Summary
● We have established a framework where a planner chooses transmission line
investment and competitive firms invest in generation facilities.
● The framework allows to explicitly analyze the impact of different network
management regimes (network fees, price zones,…) on generation and
network investment.
● First qualitative results based on test example:
1) Redispatch leads to underinvestment in the „South“.
2) Energy based fees aggravate problems of overinvestment in the
„North“.
3) Splitting in separate zones only partially overcomes those problems!
● Future work: analyze regional differentiation of transmission fees, those might
at least partially heal the problems!
# 27 05.02.2015

Thank you for your Attention!

Prof. Dr. Veronika Grimm, FAU & EnCN Economy 29
Used data and parameters
Type Investment cost (€ / (MW * a)) Variable cost (€)
Nuclear no new investment 10,00
Lignite 235730 27,32
Hard coal 202330 40,69
Gas 80100 73,68
Parameters:
Price elasticity: -0.25
=> slope of demand function: -4
Generation technologies:
Data for 2012 from:
eex.com (German prices)
entsoe.eu (Consumption)
Transparency homepages of TSOs (solar, wind, cross border
physical flow)
Electricity market homepages of neighboring countries (prices)
…
Prof. Dr. Veronika Grimm, FAU & EnCN Economy 30
First Results I
First best model vs. Redispatch model (single zone, lump sum)
Without net investment vs. (forced) investment in 1 line: high-voltage
DC-link
start: Lauchstädt (Saxony-Anhalt)
end: Meitingen (Bavaria)
capacity: 2 GW
length: 450 km
cost: 1.40 m €/km
annuity: 0.11 m €/(km*a)

Prof. Dr. Veronika Grimm, FAU & EnCN Economy 31

Prof. Dr. Veronika Grimm, FAU & EnCN Economy 32
Benchmark (first best) Single Zone Welfare (p.c.): No line invest. Forced line invest. Generation. Invest.: No line invest. Forced line invest.
100.00 % 99.99 %
Build Gas (596 MW) in Baden-Wuerttemberg Build Gas (414 MW) in Baden-Wuerttemberg
96.37 % 96.38 %
No investment
No investment
First Results I

Prof. Dr. Veronika Grimm, FAU & EnCN Economy
Complex Solution
33
What is the best mix of the
available technologies
in the short run and
in the long run?
Solution to a central planer problem
How does a market environment
look like that makes us achieve
those goals?
We analyze investment incentives
in different market environments
Prof. Dr. Veronika Grimm, FAU & EnCN Economy 34
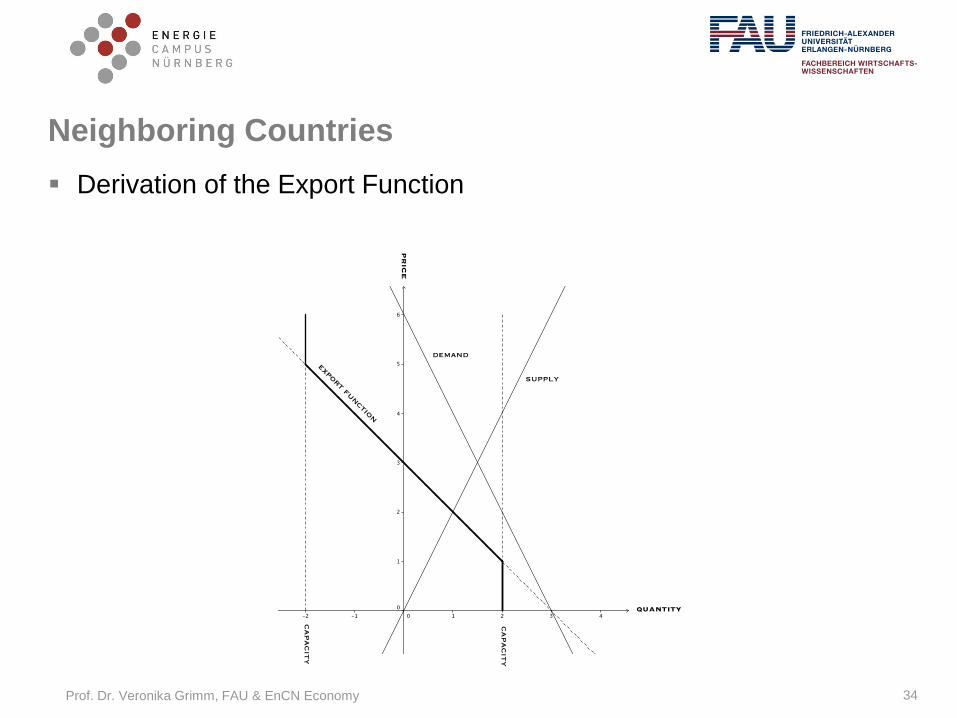
Neighboring Countries
Derivation of the Export Function
Prof. Dr. Veronika Grimm, FAU & EnCN Economy 35
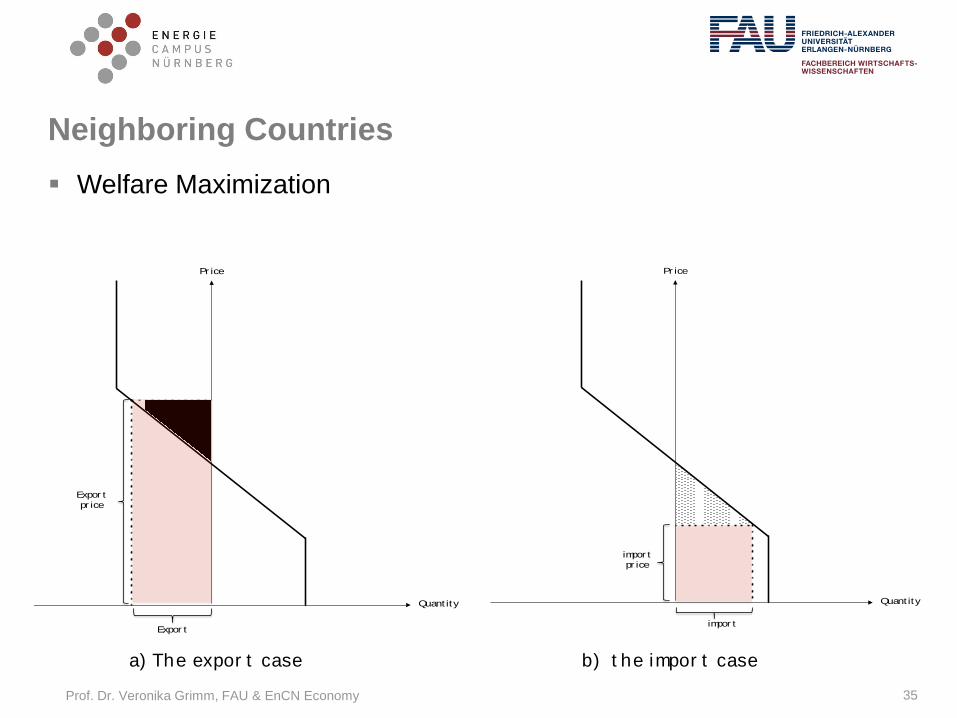
Neighboring Countries
Welfare Maximization
Pr ice
Quant ity
Expor t pr ice
Expor t
Pr ice
Quant ity
impor t
pr ice
impor t
a) The expor t case b) t he impor t case

Prof. Dr. Veronika Grimm, FAU & EnCN Economy 36
Prices (first best model without line investment) in hour 8784
price#8784#1 27.223569
price#8784#2 10.841658
price#8784#3 27.455101
price#8784#4 27.301276
price#8784#5 27.758322
price#8784#6 27.701336
price#8784#7 27.836173
price#8784#8 27.589864
price#8784#9 28.097541
price#8784#10 27.731295
price#8784#11 27.851197
price#8784#12 27.702865
price#8784#13 27.700879
price#8784#14 27.699153
price#8784#15 28.094892
price#8784#16 27.719492
price#8784#17 27.845780
price#8784#18 28.048212
price#8784#19 27.515344
price#8784#20 27.757710
priceforeign#8784#21 27.728219
priceforeign#8784#22 27.210806
priceforeign#8784#23 27.443086
priceforeign#8784#24 27.548400
priceforeign#8784#25 27.255895
priceforeign#8784#26 27.307127