transmission design definition report - era - d72744 - formal...page 1 of 54 dms# 7075162...
TRANSCRIPT
Page 1 of 54
DMS# 7075162
Uncontrolled document when printed
Refer to DMS for current version
Transmission Design Definition Report
Midwest Energy Project
South Section
Pinjar to Eneabba Terminal Transmission Line
Project No T0180069
Original Issue: xxxxxxxx Prepared by: Transmission Primary Engineering & Construction © 2009 Western Power ABN 18540492861

Page 2 of 54
DMS# 7075162
Uncontrolled document when printed
Refer to DMS for current version
Document Control
Endorsement Approvals
Name Title Signature
Prepared by Dyan Paskarina Lines Engineer – Transmission Lines Design
Reviewed by Charles Crew Section Manager – Transmission Lines Design
Endorsed by Chris Eggleton Branch Manager – Transmission Primary Engineering & Construction
Approved by Mehdi Toufan Group Manager – Transmission Delivery
Record of Revisions
Revision number
Date DMS version
Revised by Description
0 13/07/2010 3 Issued for comments
Documents Referenced In This Document
DMS# Title of Document
DMS and other document reference in this document are indicated in blue underlined text.
Stakeholders (people to be consulted when document is updated)
Position / Title
Section Manager – Transmission Lines Design
Branch Manager – Transmission Primary Engineering & Construction
Group Manager – Transmission Delivery
Notification List (people to be consulted when document is updated) This document must not be made available to personnel outside Western Power without the prior written approval of Western Power.

Page 3 of 54
DMS# 7075162
Uncontrolled document when printed
Refer to DMS for current version
CONTENTS
1 EXECUTIVE SUMMARY 7
2 PROJECT REQUIREMENTS 8
2.1 PROJECT SCOPE 8
3 PLANNING REQUIREMENTS 9
3.1 REGULATORY REQUIREMENT 9
3.2 BACKGROUND AND RECOMMENDED OPTION 9
3.3 LINE TRANSPOSITION 9
3.4 LINE OVERVOLTAGES (FERRANTI EFFECT) 10
3.5 SYSTEM SECURITY REQUIREMENTS 10
4 LINE ROUTE 11
4.1 REGULATORY REQUIREMENT 11
4.2 ROUTE OPTIONS ANALYSIS 11
4.3 LAND USE CONSTRAINTS 11
4.4 VISUAL IMPACT ASSESSMENT 12
5 LINE DESIGN INPUTS 13
5.1 NETWORK REQUIREMENTS 13
5.2 STANDARD REQUIREMENTS 13
5.3 PHYSICAL ENVIRONMENT 13
5.4 MAINTENANCE PROVISIONS 14
5.5 DESIGN LIFE AND RELIABILITY REQUIREMENT 14
6 PHASE CONDUCTOR 15

Page 4 of 54
DMS# 7075162
Uncontrolled document when printed
Refer to DMS for current version
6.1 INTRODUCTION 15
6.2 TYPE SELECTION 15
6.3 CONDUCTOR SIZE DETERMINATION 16
6.3.1 CORONA PERFORMANCE 16 6.3.2 MECHANICAL STRENGTH 18 6.3.3 CAPITAL COST 18 6.3.4 JOULE LOSSES 18 6.3.5 WHOLE-OF-LIFE COSTS COMPARISON 19
6.4 STRINGING TENSION 20
6.5 MAXIMUM OPERATING TEMPERATURE FOR PROFILING 21
7 OVERHEAD EARTHWIRE (OHEW) 23
7.1 TYPE AND SIZE SELECTION 23
7.1.1 FAULT RATING 23 7.1.2 STRENGTH 23 7.1.3 COST 24
7.2 STRINGING TENSION 24
7.3 OPTICAL GROUND WIRE (OPGW) 24
8 LINE INSULATION AND FITTINGS 26
8.1 INSULATORS TYPE ANALYSIS 26
8.1.1 COMPARATIVE COSTS 26 8.1.2 MECHANICAL STRENGTH 26
8.2 LEAKAGE DISTANCE 27
8.3 LINE FITTINGS 27
9 STRUCTURE SUITE SELECTION 28
9.1 FUNCTIONAL REQUIREMENTS 28
9.2 STRUCTURE TYPE OPTIMISATION 28
9.3 LOST ANGLE OPTIMISATION OF TOWER TYPES 30
9.4 SECTION LENGTH REQUIREMENT 32

Page 5 of 54
DMS# 7075162
Uncontrolled document when printed
Refer to DMS for current version
10 OPTIMAL SPAN LENGTH 33
10.1 PLSCADD ANALYSIS METHOD 33
10.2 INPUT PARAMETERS DERIVATION 33
10.3 ANALYSIS RESULTS 34
11 TOWER GEOMETRY 35
11.1 PHASE CONDUCTOR CROSS ARM SEPARATION AND LENGTH 35
11.2 LIGHTNING PROTECTION AND EARTHING 35
11.3 HEIGHT ABOVE GROUND FROM CONDUCTOR ATTACHMENT POINT 36
12 STRUCTURE AND FOUNDATION REQUIREMENTS 37
12.1 BASIS OF DESIGN 37
12.2 STRUCTURAL RELIABILITY 37
12.3 DESIGN ACTIONS 37
12.3.1 WIND LOADING 37 12.3.2 FAILURE CONTAINMENT LOAD 38 12.3.3 MAINTENANCE AND CONSTRUCTION LOADS 38
12.4 DETAILED TOWER DESIGN 38
12.5 MATERIAL SELECTION 38
12.6 TOWER ACCEPTANCE TESTING 39
12.7 FOUNDATION SELECTION AND OPTIMISATION 39
13 ENVIRONMENT IMPACT 42
13.1 ELECTROMAGNETIC FIELDS 42
13.2 RADIO AND TELEVISION INTERFERENCE 42
13.3 EARTH POTENTIAL RISE AND LOW FREQUENCY INDUCTION 43
14 132KV LINE CONNECTION 44

Page 6 of 54
DMS# 7075162
Uncontrolled document when printed
Refer to DMS for current version
14.1 PINJAR SUBSTATION 44
14.2 REGANS SUBSTATION 44
14.3 CATABY SUBSTATION 44
14.4 ENEABBA SUBSTATION 44
15 132KV LINE CROSSINGS 45
15.1 PINJAR CROSSINGS 45
15.2 EMU DOWNS WINDFARM TEE-OFF 45
16 APPENDIX A – MID WEST NETWORK MAP 47
17 APPENDIX B –PROPOSED 330KV PINJAR-ENEABBA LINE ROUTE 48
18 APPENDIX F – PINJAR 132KV CONNECTION 49
19 APPENDIX G – REGANS 132KV CONNECTION 50
20 APPENDIX H – CATABY 132KV CONNECTION 51
21 APPENDIX I – ENEABBA 132KV CONNECTION 52
22 APPENDIX J - EPR & LFI DESIGN 53
23 54

Page 7 of 54
DMS# 7075162
Uncontrolled document when printed
Refer to DMS for current version
1 EXECUTIVE SUMMARY
This document outlines the design characteristics for the transmission lines component of the Midwest Energy project, namely the 330kV double circuit Pinjar-to-Eneabba Terminal overhead lines and the 132kV transmission lines connection design.
A separate document covers the design of substation and secondary system component of the Midwest Energy project.
The purpose of this Design Report is to give details on:
• The design solution and the reasoning behind it, which includes the factors underpinning the design (environmental conditions, standards, etc) and the design methodology used in developing the design.
Description of the key assumptions and the impact of these.
The key design risks and how these are being mitigated.
The report is structured to describe how the design was developed and addresses the above items in further details where relevant.
The report also provides a central point to capture the Pinjar to Eneabba 330kV overhead line design and will be used as a future reference for Asset Management and Design reference, including network augmentation.
In summary:
o The line will be constructed as a double circuit and the route length is approximately 200km.
o The new line will be built on an existing 132kV line route to keep the environmental issues to a minimum.
o The line is designed with a design life of 50 years with conductor operating temperature at 85ºC
o The phase conductor chosen is twin Lacrosse 54/3.75+19/2.25 ACSR/AC based on its performance and cost benefits.
o A span length of 600m was determined as a result of the optimisation method with PLSCADD profiling software. Through optimum spotting, 406 towers were identified as the most efficient solution for the adopted line route.
o The line has been designed to comply with ENA C(b)1-2006 “Guidelines for design and maintenance of overhead distribution and transmission lines.”

Page 8 of 54
DMS# 7075162
Uncontrolled document when printed
Refer to DMS for current version
2 PROJECT REQUIREMENTS
2.1 PROJECT SCOPE
The transmission work of the Midwest Energy Project consists of substation, transmission lines and secondary system design. This report will outline the design of the 330kV and 132kV transmission lines as follow:
a. Decommissioning of the existing PJR (Pinjar) – RGN (Regans) – CTB (Cataby) – ENB (Eneabba) 132 kV three-pole wood construction ‘Cricket Wicket’ Line (CWL),
b. Construction of a 330kV Double circuit transmission line from Pinjar to Eneabba and then on to the future Eneabba Terminal (ENT) substation location for connection to a new 330kV Double circuit transmission line to Three Springs Terminal (TST) which will be built by Karara Mining Limited (KML),
c. 132kV line connections to PJR, RGN, CTB and ENB substations,
d. 330kV line connection at Pinjar to the NBT-PJR81/NT-PJR81 line tower,
e. Line rearrangements of NBT-PJR81 at Neerabup Terminal (NBT) to create NBT-TST91,
f. 132kV line connections from the existing Three Springs Substation (TS) to the new TST substation,
g. Relocation of Emu Downs connection from CTB-ENB/EMD81 line to PJR-ENB/EMD81 line,
h. Undergrounding a portion of the PJR-ENB 81/PJR-CTB 81 132kV double circuit lines.
A separate report covers the design of the substation and secondary system components of the Midwest Energy project (DM# 7355185). The substation design report covers the following:
a. Establish Three Springs Terminal (TST) 330kV substation as part of the work to supply Karara Iron Ore,
b. New Line bay at NBT,
c. Additional work required 132kV substations along the route at Pinjar, Cataby, Regans, Emu Downs and Eneabba.
The overall scope of the project is further detailed in DM#7170020

Page 9 of 54
DMS# 7075162
Uncontrolled document when printed
Refer to DMS for current version
3 PLANNING REQUIREMENTS
3.1 REGULATORY REQUIREMENT
The design for the Midwest Energy project complies with the following regulatory requirements:
o Western Powers Technical Rules (Approved by the ERA);
o Electricity (Supply Standards and System Safety) Regulations 2001;
o Electricity Industry Act 2004;
o Electricity Corporations Act 2005 (WA);
o Electricity Industry (Network Quality and Reliability of Supply) code 2005;
o Energy Safety Act 2006;
3.2 BACKGROUND AND RECOMMENDED OPTION
Western Power’s South West Interconnected Network (SWIN) extends into the Mid-West region, the main centre of which is Geraldton. The part of the network servicing the Mid-West is known as the North Country network and is a long network spanning 400km from the northern outskirts of Perth to north of Geraldton. Refer to Appendix A for the network system map of this area.
A number of major resource project proposals exist within the region, with each project requiring substantial power supply requirements. The network does not have the capacity to provide the required power supply to any of these projects with its current configuration. The North Country Region forecast indicates that there is an impending problem whereby electricity demand will far exceed supply capacity within the next few years.
Western Power identified and evaluated a number of options to increase the power transmission capacity for the Mid-West region of Western Australia to meet the forecast increased demand for electricity, together with a forecast increase in electricity generation in the region. (Project Planning Report – Southern Section Transmission System Augmentation – DM# 7092558).
The recommended solution entails the following:
1. Construction of a double circuit 330kV transmission line from Pinjar to Eneabba. The new transmission line will be constructed along the route of an existing 132kV transmission line, which will need to be decommissioned,
2. Operating one circuit at 330kV and the other at 132kV initially, until such time as there is sufficient electricity demand to covert the second circuit to 330kV.
3.3 LINE TRANSPOSITION
A system study (DM #7839028) undertaken by Western Power has revealed that under projected load conditions the negative phase sequence voltage unbalance can exceed 5% at the customer site at projected transfer levels of 400MW into Three Springs Terminal. To keep the negative phase voltage unbalance to within 1%, a line transposition will be required between Neerabup and Eneabba substation.

Page 10 of 54
DMS# 7075162
Uncontrolled document when printed
Refer to DMS for current version
The proposed location for the line transposition is at the north of Cataby Substation. Two towers placed side by side to carry each circuit are included in the design to accommodate the line transposition. Both circuits will be transposed at the same span.
3.4 LINE OVERVOLTAGES (FERRANTI EFFECT)
Energisation of long transmission lines under no or low load conditions can cause a rise in voltage at the receiving end due to a phenomenon known as the Ferranti Effect. System studies have been completed to investigate solutions to reduce the receiving end voltage to within acceptable levels. The results of the studies are as follows:
1. Install 2 x 22kV reactors (25MVAr) on the tertiary winding of the 330/132kV transformer to allow stepped switching for voltage control during steady state conditions and line re-energisation,
2. Install a 50MVAr 330kV reactor at Three Springs Terminal to manage the impact of voltage rise during energisation of the 330kV circuit.
The design and installation of the reactors are included as part of the Substation design. Refer to DM# 7355185 for further details.
3.5 SYSTEM SECURITY REQUIREMENTS
Karara Mining Limited (KML) has indicated that their load is sufficiently tolerant to outages that a single circuit 330kV radial supply from Neerabup will be sufficient. Hence, the level of security will be based on an N-0 supply, until further load demand prompts the need to convert the second circuit to 330kV. A derogation will be sought from the Technical Rules to allow this condition.

Page 11 of 54
DMS# 7075162
Uncontrolled document when printed
Refer to DMS for current version
4 LINE ROUTE
4.1 REGULATORY REQUIREMENT
The route selection must abide by the following requirement:
o Environmental Protection Act 1986;
o Environmental Protection (Noise) Regulations 1997;
o Environmental Protection and Biodiversity Conservation Act 1999;
4.2 ROUTE OPTIONS ANALYSIS
Western Power reviewed the following options for the Pinjar to Eneabba line route:
o Replace the existing 34 year old 132 kV wood pole transmission line;
o Build parallel to and 40 metres from the existing 132kV wood pole transmission line either on the east or west sides or a combination of both;
o A potential eastern option between Cataby and Eneabba was identified to avoid the Coomallo Nature reserve. A western option was also identified but eliminated as it would require significant clearing in the Conservation State.
Refer to Appendix B for the proposed line route map.
Based on the option analysis undertaken in 2006 and confirmed with the 2009 review of the line route options, utilising the existing 132kV transmission line route was deemed as the preferred option.
A comparison of line route options has found that rebuilding on the existing 132kV wood pole alignment between Pinjar and Eneabba represents the most environmentally acceptable line route option with the least impact on landowners. Initial cost estimates indicated that the capital cost of the line replacement option is lower than for alternative routes to the east and west, and comparable to building 40m to the side of the existing line.
Although the existing line route passes through areas of environmental sensitivity, including four nature reserves, a national park and several EPP wetlands, these are already degraded within the existing infrastructure corridor. The rebuild option therefore represents a significantly lower level of environmental impact than alternative routes passing through non-degraded environments, and consequently minimise risks to project delivery.
For further details on the option review and analysis, please refer to DM#6516783
4.3 LAND USE CONSTRAINTS
The Pinjar to Eneabba 330 KV Transmission Line is approximately 200 kilometres long and traverses a range of land uses including:
• Conservation areas • State forests • National Parks • Timber plantations • Wind farms

Page 12 of 54
DMS# 7075162
Uncontrolled document when printed
Refer to DMS for current version
• Grazing country • Olive plantations • Paulownia plantations and • Cropping land
The land traversed introduced constraints which have the following impacts on the line:
• Height Restriction Department of Defence’s height restrictions for structures are in place in the vicinity of Gingin airstrip (30 metres) and TACAN remote site at Beermullah (40 metres) The standard vertical configuration designed structure could not be used in these locations since the lowest height structure in the tower suite was 51m. Thus, two main alternatives were considered.
a. Two single circuit lines with poles construction b. Design a double circuit low profile tower
The low profile tower option was adopted as wider easement of the two single circuit option was unacceptable by the land owners.
• Wheat belt clearance
C(b)1 Table 8.1 Note 4 states that additional clearance should be considered in order to cater for vehicles of unusual height. Western Power’s Environmental and Community Engagement Branch has consulted land owners to determine the additional ground clearance. It has been confirmed that Western Power’s standard practice of using 2.3m additional clearance is satisfactory for this line.
4.4 VISUAL IMPACT ASSESSMENT
Visual impact assessment was conducted by Western Power to meet the Department of Environment and Conservation’s (DEC) and local shire requirements. The result indicated that poles should be used instead of towers within certain areas, such as the crossings of Brand Highway, Jurien Bay Road and Bibby Road (Emu Downs Windfarms).
Poles with gull wings and slender body design were included in the final pole suite to meet the aesthetic and visual impact requirement at Jurien Bay Road. The local community has indicated that the standard pole type (normal suspension pole) provided sufficient aesthetic improvement compared to the tower design.
Refer to DM#5293078 for visual impact assessment report.

Page 13 of 54
DMS# 7075162
Uncontrolled document when printed
Refer to DMS for current version
5 LINE DESIGN INPUTS
5.1 NETWORK REQUIREMENTS
The network requirements quoted below underpin the designs for the proposed line.
Network Requirements Factor Value Source
Network nominal voltage 330 kV Normal operating range ±10% Equipment highest voltage 362 kV Minimum required lightning/surge impulse withstand
1175 kVp
Short time withstand:
OPGW
Overhead earthwires
Phase conductors
56kA for 270 ms
56kA for 200 ms
56kA for 270 ms
Transmission Planning Criteria
DM# 1195855
5.2 STANDARD REQUIREMENTS
The design of Pinjar to Eneabba transmission line complies with:
o Relevant Australian Standards
o ENA C(b)1-2006
5.3 PHYSICAL ENVIRONMENT
Line designs have been based on the following physical environmental conditions:
Rated Physical Environment
Factor Value Source
Conductor rating:
Maximum ambient temperature
Solar radiation
Wind speed
440C
1,000 W/m2
1 m/s
ESAA D(b)5-1988 (DM# 7916973)
Bureau of Meteorology Map (DM# 7266097)

Page 14 of 54
DMS# 7075162
Uncontrolled document when printed
Refer to DMS for current version
Rated Physical Environment
Factor Value Source
Regional wind speed – 200 year average recurrence interval:
Region A
Region B
43 m/s
52 m/s
Refer to:
AS/NZS 1170.2:2002
Clause 18.3
Keraunic level (Average annual thunder days)
10 Bureau of Meteorology
DM# 5534120
Everyday temperature 150C Bureau of Meteorology
DM# 7022053
5.4 MAINTENANCE PROVISIONS
The 330kV Pinjar to Eneabba transmission line is a high security line. As such, future planned outages for maintenance or new load/generator cut-ins will be very difficult to obtain.
Aligned with standard industry practice, Western Power allows live line maintenance for 330kV transmission lines. The maintenance policy is to use the live bare hand methodology. ENA C(b)1-2006 Section 4.4 states that lines designed for live bare hand work shall have safe approach distance in accordance with ENA LLM 01-2006. The minimum safe approach distance specified in the latter standard for a 330kV line is 2030mm. Refer to Appendix C, for the live line maintenance clearance requirements.
5.5 DESIGN LIFE AND RELIABILITY REQUIREMENT
Western Power adopted an industry standard design working life of 50 years for transmission lines and its component. Reliability level 3 (LR=3) is selected which is applicable to 330kv transmission lines (Appendix A1 – ENA C(b)1-2006 and Section 6.2 AS/NZS 7000:2010). These factors correspond to wind return period of 200 years.

Page 15 of 54
DMS# 7075162
Uncontrolled document when printed
Refer to DMS for current version
6 PHASE CONDUCTOR
6.1 INTRODUCTION
The phase conductor selection is one of the main components in transmission lines design. Although the capital cost of the phase conductor is not a large percentage of the overall cost, it has significant influence on many other components of the line design. This is because it affects the height of the towers (due to sag) and the loads on the towers and foundations. The following aspects will be addressed.
• Conductor Type o Environmental issues o Strength o Cost
• Corona performance • Mechanical Strength • Whole of life cost
o Capital Cost o Losses (Corona and Joule)
6.2 TYPE SELECTION
The conductor types considered for the proposed 330kV Pinjar to Eneabba lines are:
Conductor Type Long Span (Strength)
Corrosion Resistance
Cost efficient
AAC All Aluminium Conductor
AAAC All Aluminium Alloy Conductor
ACSR/GZ Aluminium Conductor Steel Reinforced Galvanized Zinc
ACSR/AC Aluminium Conductor Steel Reinforced Aluminium Clad
ACSR/AC-TW ACSR/AC with Trapezoidal Wire
Table 6.1 Conductor Type Selection
Further explanations on each conductor type are as follows:
1. AAC: All Aluminium Conductor (1350 Alloy)
This type of conductor (1350 alloy) has limited strength and is mainly suitable for short spans and not for long spans required for country lines.
2. AAAC: All Aluminium Alloy Conductor (1120 Alloy)
Page 16 of 54
DMS# 7075162
Uncontrolled document when printed
Refer to DMS for current version
This conductor has higher conductor strength than AAC conductor. However, due to the hardness of the 1120 alloy, the conductor does not have good self damping characteristic and thus can not be tensioned up to the same extent as ACSR conductor. This results in higher sag and taller towers.
3. ACSR/GZ: Aluminium conductor, Galvanised steel reinforced
The steel core in this conductor gives the conductor higher strength and thus can withstand a higher tension, resulting in lower sag compared to all an aluminium conductor. The steel core is galvanised with zinc. However, this conductor is prone to corrosion due to the material being different on the steel core and the aluminium strand.
4. ACSR/AC: Aluminium conductor, Aluminium clad steel reinforced
This conductor is of similar construction type as the ACSR/GZ. The steel core however, is clad in aluminium. This results in greater corrosion resistance properties, making it suitable for transmission lines in high risk corrosive areas - e.g near the coast.
5. ACSR/AC-TW (Trapezoidal shaped wire)
Trapezoidal wire conductors were considered as an alternative option. The individual wire strands have a trapezoidal rather than round cross section. For the same diameter, the amount of aluminium is greater and so resistive losses are lower. In addition, the surface of conductor is smoother and thus is expected to reduce corona losses. However, the lack of information readily available from the manufacturer has precluded serious consideration to using this type of conductor for this project. Data verifications with the manufacturer will need to be carried out before attempting to incorporate the trapezoidal wire conductor into major design projects.
Based on all the above, ACSR/AC was chosen as the conductor type for the Pinjar to Eneabba line. The steel core will be able to withstand the long spans and the aluminium cladding will be suitable for the corrosive environmental which the Pinjar Eneabba line will transverse.
6.3 CONDUCTOR SIZE DETERMINATION
When determining the optimum conductor size, several factors need to be considered for extra high voltage lines.
6.3.1 CORONA PERFORMANCE
The design of transmission lines for satisfactory corona performance can be achieved by minimising the effect of corona discharge to an acceptable level. The detrimental effects of corona discharges are corona losses, audible noise and radio interference.
Audible noise and radio interference can be limited to acceptable levels by ensuring:
=> Surface voltage gradient < corona onset gradient
Surface voltage gradient is affected by operating voltage parameters of the line. ie:

Page 17 of 54
DMS# 7075162
Uncontrolled document when printed
Refer to DMS for current version
o Operating voltage
o Conductor diameter
o Conductor configuration (interphase distances)
o Number of sub-conductors per bundle
o Conductor bundle radius
Corona onset gradient is affected by atmospheric and environmental conditions around the conductor (surface state coefficient) ie:
o Relative air density
o Conductor stranding factor
o Conductor roughness factor caused by environmental influences – particularly salt, dust pollution.
For 330kV transmission lines, the most optimum way to minimise the effects of corona is with larger diameter conductors in twin bundle configuration. Smaller diameter conductors in quad bundle configuration were also investigated as part of the whole of life cost comparison but were found to be less cost effective.
For corona onset gradient and corona losses, the major determining parameter is the conductor surface state coefficient. A factor of 0.6 is considered suitable for transmission lines in Western Australia in an unpolluted area. However, the proposed Pinjar - Eneabba line runs north of Perth, along the coastal region. The salt pollution from the ocean will reduce the conductor surface state coefficient and thus increase the corona losses.
Corona onset and loss calculations were carried out for the conductors capable of meeting the load requirements – namely Gymnastics, Hurdles and Lacrosse. Western Power commissioned the University of Western Australia (UWA) to undertake a study to determine the affect (sensitivity) of various surface state coefficients on these parameters. Utilising UWA’s past experience with corona calculations on other transmission lines in Western Australia, the study was carried out for the range of 0.6, 0.58, 0.56, and 0.54.
Table 6.2 and 6.3 have been reproduced from the UWA report (DM#7030194). Table 6.2 shows the corona power loss under fine weather conditions for conductor surface state coefficients of 0.54 to 0.60.
Corona Power Loss (kW/km) Conductor
Surface State Coefficient Gymnastics Hurdles Lacrosse
0.54 67.99 34.87 11.23 0.56 47.16 13.61 0 0.58 24.67 0.91 0 0.60 8.98 0 0
Table 6.2 Corona Power Loss (kW/km) Fine Weather Condition
Under foul weather condition (rain intensity of 1mm/hr), the corona power loss will increase as shown in Table 6.3.

Page 18 of 54
DMS# 7075162
Uncontrolled document when printed
Refer to DMS for current version
Corona Power Loss (kW/km) Conductor Surface
Condition Gymnastics Hurdles Lacrosse Normal conductor surface condition
40 25 18.5
Table 6.3 Corona Power Loss (kW/km) Fine Weather Condition
6.3.2 MECHANICAL STRENGTH
Using the limit state equation from ENA C(b)1-2006 Section 3.3.1, the conductor mechanical strength is calculated:
Minimum Required Conductor Strength Conductor
Ultimate Tensile Strength (UTS)
Region A Region B
Gymnastics 139.0 114.24 kN 131.44 kN
Hurdles 159.0 125.57 kN 143.91 kN
Lacrosse 180 kN 138.02 kN 157.46 kN
Table 6.4 Calculated Conductor Strength
The wind pressures used for the calculations are 0.78kPa for Region A and 1.02kPa for Region B based on a 600m span. All three conductors have sufficient mechanical strength for both Region A and B.
6.3.3 CAPITAL COST
The incremental capital cost for the three conductor candidates using Gymnastics as the (lowest) base value were calculated for cost comparison.
Conductor Conductor
diameter (mm) Additional Capital Cost of
Line ($millions)
Gymnastics 29.3 0
Hurdles 31.5 2.76
Lacrosse 33.8 6.04
Table 6.5 Capital Cost for Different Conductors
6.3.4 JOULE LOSSES
Another factor to be considered is the resistive losses (I2R) of the conductor. Based on the 20 year central load forecast for the Mid West area shown in Graph 6.1 and assuming no load growth for the following 20 years (due to data unavailability), the net present value of the line losses was calculated over a 40 years period to account for the economic life of the line.

Page 19 of 54
DMS# 7075162
Uncontrolled document when printed
Refer to DMS for current version
MID WEST REGION PEAK LOAD FORECAST
(20/05/2010)
50
100
150
200
250
300
350
400
450
500
550
600
650
700
750
20
06
20
07
20
08
20
09
20
10
20
11
20
12
20
13
20
14
20
15
20
16
20
17
20
18
20
19
20
20
20
21
20
22
20
23
20
24
20
25
20
26
20
27
20
28
20
29
20
30
Summer Peak Period
Pe
ak L
oa
d (
MW
)
Existing Capacity
Historical Actuals
High Forecast
Mid Range Central to High Forecast
Central Forecast
Low Forecast
Graph 6.1 Midwest Region Peak Load Forecast
Due to the uncertainty of the load factor value, a range of load factors were investigated. These figures were then incorporated into the whole of life cost comparison.
6.3.5 WHOLE-OF-LIFE COSTS COMPARISON
Comparative cost analysis was performed on the conductors, taking into account the capital cost, corona losses and joule losses. As the corona power losses (Table 6.2) for Gymnastics were significantly higher than Hurdles and Lacrosse, further net present cost sensitivity studies were undertaken for the latter two conductors to determine the optimum conductor.
Table 6.5 shows the difference in net present cost of Lacrosse over Hurdles for various conductor surface state coefficients and load factors. Positive cost values indicate cases where Lacrosse is more cost effective than Hurdles. The cost of losses is based on $36/MW-hr (based on statistical average STEM price of energy 1 June 2008 to 15 April 2011 DM#8213588).

Page 20 of 54
DMS# 7075162
Uncontrolled document when printed
Refer to DMS for current version
Load Factor Conductor Surface State
Coefficient Load Forecast
0.6 0.65 0.7 0.75 0.8 $million
Central -1.82 -1.63 -1.42 -1.21 -0.98
Mid Central High -0.09 0.35 0.82 1.32 1.86 0.6
High 2.34 3.15 4.01 4.92 8.14
Central -0.97 -0.78 -0.57 -0.36 -0.13
Mid Central High 0.76 1.2 1.67 2.17 2.71 0.58
High 3.19 4 4.86 5.77 8.99
Central 10.99 11.18 11.39 11.6 11.83
Mid Central High 12.72 13.16 13.63 14.13 14.67 0.56
High 15.15 15.96 16.82 17.73 20.95
Central 17.59 17.78 17.99 18.2 18.43
Mid Central High 19.32 19.76 20.23 20.73 21.27 0.54
High 21.75 22.56 23.42 24.33 27.55
Table 6.5 Net Present Cost Difference of Lacrosse over Hurdles
From the table above, it can be seen that Lacrosse conductor has a lower net present cost for 49 of the 60 cases. The findings are summarised as follows.
a. Lacrosse is more optimal for surface state coefficients lower than 0.6. This is highly likely to be the case due to the line’s proximity to the coast.
b. Lacrosse is more optimal for loads higher than the central forecast. Advice from System Planning is that the Mid Central High forecast is the most likely scenario.
c. Lacrosse will provide higher load capacity, although capacity limitations are not at present considered to govern. However, it allows for load increase in the future with the appropriate reactive compensation.
d. Lacrosse will have lower radio, television and audible noise levels.
Thus, it is recommended to select Lacrosse as the conductor for the line.
6.4 STRINGING TENSION
ENA C(b)1-2006 Table 7.1 outlines the maximum every day tensions for conductors. For the MWEP project the conductor stringing tension of the selected Lacrosse conductor is determined as follows:

Page 21 of 54
DMS# 7075162
Uncontrolled document when printed
Refer to DMS for current version
Criteria Recommended increment in horizontal tension (%CBL)
Comments
Basic Tension 18 ACSR 54/7, 54/19
Conductor Clamp 2.5 Type C clamps (armour grip suspension unit)
Terrain 2 Terrain category 2
Damping 3 Maximum of 6 is allowed for uncertainties in the damper design. The optimal location of dampers is dependant on vibration frequency.
Total 25.5
Table 6.7 Calculated Conductor Strength
Table 6.7 gives a recommended maximum horizontal tension of 25.5% of CBL. However ENA C(b)1 Table 7.1 also provides notes for additional considerations including the increased vibration protection required for long spans.
Western Power has experienced satisfactory performance on a similar 330kV line with 24% design tension (400m spans). The optimal span length determined for this project is 600 m, which is the longest span for a line in the Western Power network. Therefore, considering past successful experience with Western Power lines as well as C(b)1 recommendations a design tension of 23% was considered prudent.
6.5 MAXIMUM OPERATING TEMPERATURE FOR PROFILING
The maximum conductor operating temperature will determine the ultimate rating which can be achieved from the Pinjar to Eneabba 330kV double-circuit line.
Lacrosse will be able to provide 2100A (twin bundle) per circuit under maximum operating temperature of 85oC. This will give an ultimate capacity of 1200MVA per circuit.
The following considerations support the decision to profile the line at 85°C, which is the standard profiling temperature on Western Power’s existing 330kV network.
a. Effective line capacity – ability to uprate in the future
The operation of the proposed circuit to Karara mine and the future connections to other mine will be a on a continuous operation for 365 days a year. Once the circuit has been built there will be no opportunity to uprate the circuit by increasing tower heights or replacement of conductors while still maintaining supplies to Karara mine and other mines (3-6 months outage will be required for the construction work).

Page 22 of 54
DMS# 7075162
Uncontrolled document when printed
Refer to DMS for current version
b. Load forecasts – ability to use additional capacity
Extension Hill (future mining connection) is considering a firm supply (n-1) and will require a higher line capacity which corresponds to the need of a maximum profiling temperature of 85°C. In order to use the proposed additional capacity available by profiling for 85°C, additional investment would be required to alleviate voltage constraints to allow the circuit capacity to be used. Transfer in excess of 500MVA per circuit is feasible by using an SVC or STATCOM support. The additional load support may facilitate the supply of the future loads in the area.
c. Asset lifetime– building line assets for future
The average expected age of a newly constructed transmission circuit is at least 50 years. The future load possibilities have to be considered over an extended period beyond that of a 20 year load forecast available at this stage. It is likely that over an extended timeframe greater than 20 years, there will be an increase in loading which will support the need to profile the line at 85°C.
d. Support for future generation developments
Future generation connections have previously been identified and there are currently over 1450 MW enquiries to Western Power regarding connection in the North Country Region. There is capability in this proposed 330kV Pinjar to Eneabba circuit to accept generation (wind and gas) and it is expected that once the line is constructed a number of applicants will seek connection to our network.
A review was undertaken of similar utility practices which use long transmission circuits to supply remote loads. Powerlink Queensland operates long transmission lines (275kV and 330kV) in excess of 700km and all their transmission lines are typically profiled at 85°C or higher dependant on conductor type and size. Powerlink Queensland effectively uses reactive support to ultimately drive the capacity at transmission remote ends to fully utilise the conductor capacity and this enables deferment of augmentations and replacement of transmission circuits.
Page 23 of 54
DMS# 7075162
Uncontrolled document when printed
Refer to DMS for current version
7 OVERHEAD EARTHWIRE (OHEW)
7.1 TYPE AND SIZE SELECTION
Two earthwires for lightning protection shielding including one OPGW for protection and control signalling purposes are included in the line design.
The phase conductor selected is Lacrosse ACSR/AC. To match the phase conductor, ACSR/AC or SC/AC type conductor could be used as the earthwire. However, the selection of earthwire will be based on fault rating, strength and cost.
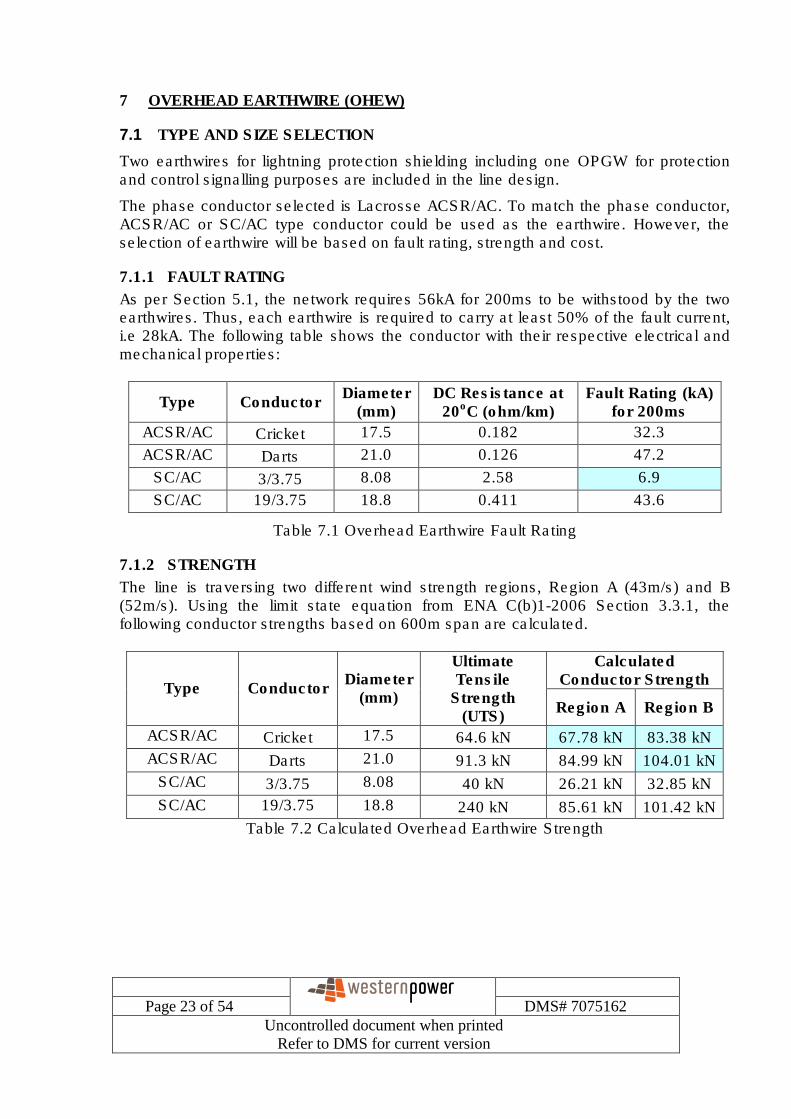
7.1.1 FAULT RATING
As per Section 5.1, the network requires 56kA for 200ms to be withstood by the two earthwires. Thus, each earthwire is required to carry at least 50% of the fault current, i.e 28kA. The following table shows the conductor with their respective electrical and mechanical properties:
Type Conductor Diameter
(mm) DC Resistance at
20oC (ohm/km) Fault Rating (kA)
for 200ms
ACSR/AC Cricket 17.5 0.182 32.3
ACSR/AC Darts 21.0 0.126 47.2
SC/AC 3/3.75 8.08 2.58 6.9
SC/AC 19/3.75 18.8 0.411 43.6
Table 7.1 Overhead Earthwire Fault Rating
7.1.2 STRENGTH
The line is traversing two different wind strength regions, Region A (43m/s) and B (52m/s). Using the limit state equation from ENA C(b)1-2006 Section 3.3.1, the following conductor strengths based on 600m span are calculated.
Calculated Conductor Strength
Type Conductor Diameter
(mm)
Ultimate Tensile
Strength (UTS)
Region A Region B
ACSR/AC Cricket 17.5 64.6 kN 67.78 kN 83.38 kN
ACSR/AC Darts 21.0 91.3 kN 84.99 kN 104.01 kN
SC/AC 3/3.75 8.08 40 kN 26.21 kN 32.85 kN
SC/AC 19/3.75 18.8 240 kN 85.61 kN 101.42 kN
Table 7.2 Calculated Overhead Earthwire Strength

Page 24 of 54
DMS# 7075162
Uncontrolled document when printed
Refer to DMS for current version
It can be seen that in Region B, Darts conductor is not strong enough. A special earthwire (18/19/3.00 ACSR/AC) with a higher mechanical strength but with the same diameter as Darts ACSR is nominated for Region B if Darts ACSR is the conductor selected for the earthwire.
Calculated Conductor Strength Conductor
Diameter (mm)
Ultimate Tensile Strength (UTS)
Region A Region B 18/19/3.0 ACSR/AC
21.0 200 kN 100.59 kN 119.21 kN
Table 7.3 Calculated Overhead Earthwire Strength
7.1.3 COST
Darts ACSR/AC and 19/3.75 SC/AC conductors were considered suitable for the earthwire as both conductors have sufficient fault ratings and strengths.
Based on the cost comparison, Darts ACSR/AC is selected as the earthwire for Region A. 18/19/3/0 ACSR/AC will be used as the earthwire for Region B.
7.2 STRINGING TENSION
In accordance with ENA C(b)1-2006 section 4.8, sag and electrical rating of the conventional earthwire should be matched with the OPGW used in a twin earthwire design, to ensure correct clearance and current sharing. Neither conventional earthwire nor OPGW shall sag more than the main conductors to prevent mid-span flashover. The sag of the earthwire and OPGW shall be at least less than 90% of the main conductor’s sag.
Earthwire Tension (%UTS)
Region A
Darts ACSR 21
Region B
18/19/3.00 ACSR 15 Table 7.5 Overhead Earthwire Stringing Tension
7.3 OPTICAL GROUND WIRE (OPGW)
Communications bearers and multiplexing equipment are designed to cater for Protection, SCADA and other operating requirements including telephony and remote power quality monitoring. The communications bearers are to comply with the Western Power Technical Rules Clause 2.9 (DM# 3605551) requirements for duplication on 330kV lines for diverse bearers.
The scope of the communications design for the MWEP includes the following:

Page 25 of 54
DMS# 7075162
Uncontrolled document when printed
Refer to DMS for current version
• One of the earth wires (lightning protection shielding) for the Pinjar to Eneabba line will be an OPGW to provide one of the duplicated communications paths,
• Existing microwave bearers will be utilised to provide the second of the duplicated communications paths for Protection and SCADA.
Installation of OPGW for new lines construction is a standard electric utility practice in Australia and around the world. It is the least cost method of providing optical fibre connectivity between substations, requiring only a small increase in cost over ordinary OHEW. It will provide 48 fibre optic cores for communications circuits.
The electricity network has immediate application for 10 to 12 cores (5 to 6 pairs) of fibre per line circuit. 48 core fibre OPGW was selected for the following reasons:
1. Potential for future customers in the Midwest to use the available spare fibres.
Western Power has already fielded enquiries for a number of future loads and generations facilities. Where a customer teed into the line, they would require 4 dedicated cores in each direction (active pair and maintenance pair) on the OPGW. A 48 core fibre equates to a maximum of 6 customers.
2. Typically, there is no second chance to install an OPGW.
o The Pinjar to Eneabba line is a 50 year asset, and the technology enhancements like IEC 61850 over that time are likely to require extensive optic fibre bearer.
o Tightening Civil Codes, high retrofit costs and inability to obtain the required line outages means existing lines are not preferred for installation or upgrade of OPGW.
o While it is possible to increase the bandwidth utilised by each core, the cost of the OLTE (Optical Line Termination Equipment) to support this, and the difficulty that ensue when there is a fibre fault or when a maintenance outage is required means there is a practical limit to how much can be carried on each core.

Page 26 of 54
DMS# 7075162
Uncontrolled document when printed
Refer to DMS for current version
8 LINE INSULATION AND FITTINGS
8.1 INSULATORS TYPE ANALYSIS
The following three types of insulators were considered:
o Porcelain discs
o Porcelain Longrod
o Polymeric Longrod
8.1.1 COMPARATIVE COSTS
Polymeric longrod has not had the same service history as porcelains and therefore its longevity has not been as well established as that of the latter type.
Manufacturers and users of polymeric insulators have indicated that the industry assessment, at this point in time, points to a lifetime of about 25 years (DM# 7260521).
Porcelain ceramic insulators, on the other hand, have a service history of over 50 years.
It is evident from the cost analysis that although the porcelain disc insulator presents higher capital cost, porcelain disc insulators are the most economical insulators.
8.1.2 MECHANICAL STRENGTH
Using the limit state design, the strengths of the insulators are calculated as follow:
Mechanical Strength (kN) Tension Insulator Type
Region A Region B
Porcelain Disc Tension 120.77 137.78
Table 8.2 Tension Insulator Mechanical Strength
The values are calculated using 0.93kPa and 1.24kPa wind pressure for Region A and B respectively on a 600m span.
In addition, the suspension insulators are calculated under different deviation angles as follow:
Mechanical Strength (kN)
Region A Region B Suspension
Insulator Type 0.5o 5o 15o 0.5o 5o 15o
Porcelain Disc 76.52 88.74 122.09 84.73 100.55 141.16
Table 8.3 Suspension Insulator Mechanical Strength
From table 8.2 and 8.3, standard 160kN rated porcelain disc insulators are sufficient for all of the different tower application.
Page 27 of 54
DMS# 7075162
Uncontrolled document when printed
Refer to DMS for current version
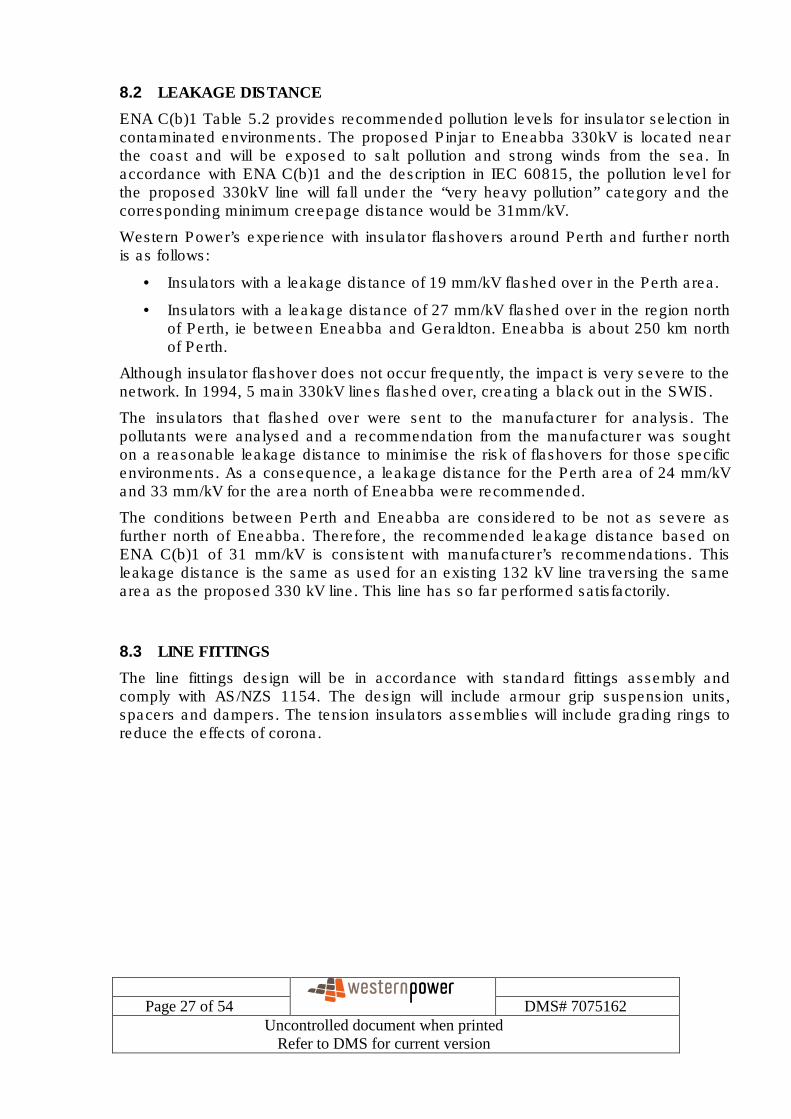
8.2 LEAKAGE DISTANCE
ENA C(b)1 Table 5.2 provides recommended pollution levels for insulator selection in contaminated environments. The proposed Pinjar to Eneabba 330kV is located near the coast and will be exposed to salt pollution and strong winds from the sea. In accordance with ENA C(b)1 and the description in IEC 60815, the pollution level for the proposed 330kV line will fall under the “very heavy pollution” category and the corresponding minimum creepage distance would be 31mm/kV.
Western Power’s experience with insulator flashovers around Perth and further north is as follows:
• Insulators with a leakage distance of 19 mm/kV flashed over in the Perth area.
• Insulators with a leakage distance of 27 mm/kV flashed over in the region north of Perth, ie between Eneabba and Geraldton. Eneabba is about 250 km north of Perth.
Although insulator flashover does not occur frequently, the impact is very severe to the network. In 1994, 5 main 330kV lines flashed over, creating a black out in the SWIS.
The insulators that flashed over were sent to the manufacturer for analysis. The pollutants were analysed and a recommendation from the manufacturer was sought on a reasonable leakage distance to minimise the risk of flashovers for those specific environments. As a consequence, a leakage distance for the Perth area of 24 mm/kV and 33 mm/kV for the area north of Eneabba were recommended.
The conditions between Perth and Eneabba are considered to be not as severe as further north of Eneabba. Therefore, the recommended leakage distance based on ENA C(b)1 of 31 mm/kV is consistent with manufacturer’s recommendations. This leakage distance is the same as used for an existing 132 kV line traversing the same area as the proposed 330 kV line. This line has so far performed satisfactorily.
8.3 LINE FITTINGS
The line fittings design will be in accordance with standard fittings assembly and comply with AS/NZS 1154. The design will include armour grip suspension units, spacers and dampers. The tension insulators assemblies will include grading rings to reduce the effects of corona.

Page 28 of 54
DMS# 7075162
Uncontrolled document when printed
Refer to DMS for current version
9 STRUCTURE SUITE SELECTION
9.1 FUNCTIONAL REQUIREMENTS
The objective of this section is to determine the most economical suite of structures that can cover all functional requirements of the line.
The high level inputs to this process are as follows:
1. Wind Region and special wind conditions
2. Environmental and Community Engagement inputs
• Line route and terrain
• Visual impact issues
• Special clearance requirements
The process of structure suite selection then consists of:
A. Determining the possible combinations of tower types and functional requirements.
B. Refining the tower suite to obtain the most optimal use of towers. Ie taking into consideration cost of developing each different tower type and utilising towers for multiple applications.
C. Determining the actual angles for which the towers will be designed that optimises their usage over the various angle requirements of the line route.
9.2 STRUCTURE TYPE OPTIMISATION
In determining a suite of structures for any given transmission line, the following tower types must be included:
• Suspension structures (designed for 0 or less than 5 degree deviation)
• Heavy Suspension structures (to cater for 5 or more degree deviations). This option may be used where there are many small angles in the line route.
• Inline strain structures (for line constructability on long transmission lines)
• Strain structures (designed for major line angle/deviations)
• Terminal structures (for terminating the transmission lines prior to entering the substation)
The initial analysis of electrical, environmental and civil requirements identified the need to design the tower types to meet the following region/conditions:
1. Wind region according to AS/NZS 1170.2:2002:
• Southern Section: Wind Region A (Pinjar to 2 km south of Eneabba Substation);
• Northern Section: Wind Region B (2 km south of Eneabba Substation to Eneabba Terminal);

Page 29 of 54
DMS# 7075162
Uncontrolled document when printed
Refer to DMS for current version
• Higher land in Region A (between Cataby and Eneabba) subjected to higher than normal wind loads.
2. Clearance and visual impact issues
• Wheat belt areas (additional clearance of 2.3m as per Section 4.3);
• Height restricted area in Gingin and Beermullah as per Section 4.3.
Table 9.1 displays all the initial tower type combinations. To appropriately manage the high cost of introducing new tower types with respect to design, drafting, prototyping and load testing, the following optimisation refinements were performed:
o A taller general purpose tower was developed rather than designing a special wheat belt tower which resulted in development savings of $300,000. Leg extension pieces can be removed to cater for towers where the extra clearance is not required.
o The suspension tower for wind region B is used as a suspension tower in the higher wind area of Region A at approximately 40 locations. A site specific region A high wind tower would be 0.5t lighter than the suspension tower for region B. However, compared to the cost to develop and test a new tower type, the additional cost is considered a prudent approach.
o Using the lost angle analysis, the rarely used tower types were substituted with towers of similar or higher load capacities, as summarised in Section 9.3.
Tower Types
Region Light
Suspension Heavy
Suspension In-line Tower Strain Tower
Terminal Tower
Wind Region A
Wind Region B
Wheat belt N/A
Higher wind loads in Region A N/A N/A
Low Profile Tower in Gingin and Beermullah N/A N/A N/A N/A
Table 9.1 Structure Types Selection
In addition, 4 pole types have also been designed for the environmentally sensitive areas as mentioned in Section 4.4.
The line schedule detailing tower locations and corresponding tower types are available in DM#7130932.
Page 30 of 54
DMS# 7075162
Uncontrolled document when printed
Refer to DMS for current version
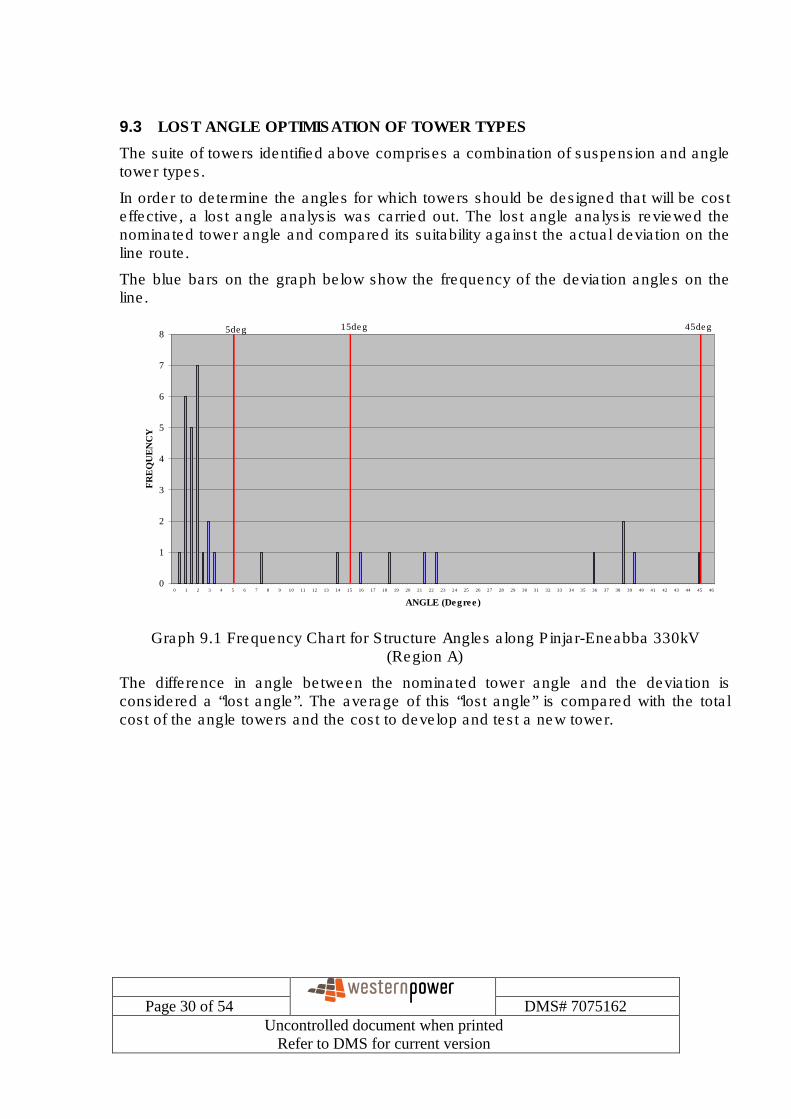
9.3 LOST ANGLE OPTIMISATION OF TOWER TYPES
The suite of towers identified above comprises a combination of suspension and angle tower types.
In order to determine the angles for which towers should be designed that will be cost effective, a lost angle analysis was carried out. The lost angle analysis reviewed the nominated tower angle and compared its suitability against the actual deviation on the line route.
The blue bars on the graph below show the frequency of the deviation angles on the line.
0
1
2
3
4
5
6
7
8
0 1 2 3 4 5 6 7 8 9 10 11 12 13 14 15 16 17 18 19 20 21 22 23 24 25 26 27 28 29 30 31 32 33 34 35 36 37 38 39 40 41 42 43 44 45 46
ANGLE (Degree)
FR
EQ
UE
NC
Y
5deg 15deg 45deg
Graph 9.1 Frequency Chart for Structure Angles along Pinjar-Eneabba 330kV (Region A)
The difference in angle between the nominated tower angle and the deviation is considered a “lost angle”. The average of this “lost angle” is compared with the total cost of the angle towers and the cost to develop and test a new tower.
Page 31 of 54
DMS# 7075162
Uncontrolled document when printed
Refer to DMS for current version
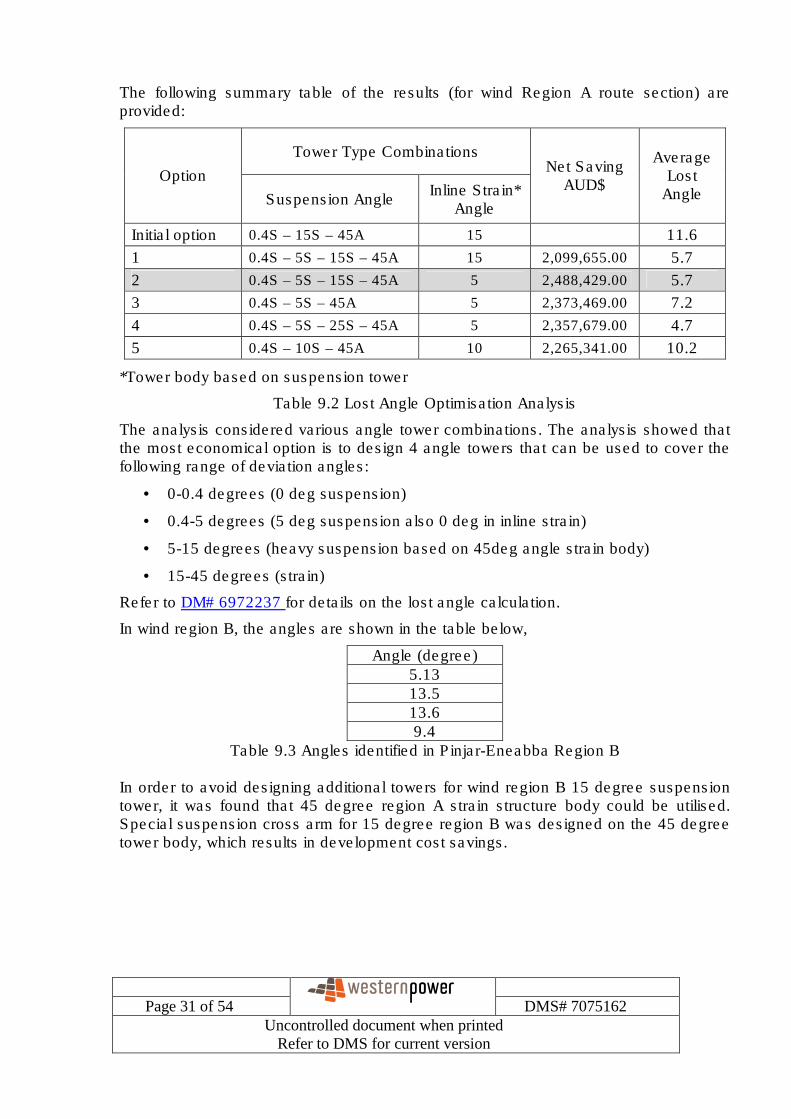
The following summary table of the results (for wind Region A route section) are provided:
Tower Type Combinations
Option
Suspension Angle Inline Strain*
Angle
Net Saving AUD$
Average Lost
Angle
Initial option 0.4S – 15S – 45A 15 11.6
1 0.4S – 5S – 15S – 45A 15 2,099,655.00 5.7
2 0.4S – 5S – 15S – 45A 5 2,488,429.00 5.7
3 0.4S – 5S – 45A 5 2,373,469.00 7.2
4 0.4S – 5S – 25S – 45A 5 2,357,679.00 4.7
5 0.4S – 10S – 45A 10 2,265,341.00 10.2
*Tower body based on suspension tower
Table 9.2 Lost Angle Optimisation Analysis
The analysis considered various angle tower combinations. The analysis showed that the most economical option is to design 4 angle towers that can be used to cover the following range of deviation angles:
• 0-0.4 degrees (0 deg suspension)
• 0.4-5 degrees (5 deg suspension also 0 deg in inline strain)
• 5-15 degrees (heavy suspension based on 45deg angle strain body)
• 15-45 degrees (strain)
Refer to DM# 6972237 for details on the lost angle calculation.
In wind region B, the angles are shown in the table below,
Angle (degree) 5.13 13.5 13.6 9.4
Table 9.3 Angles identified in Pinjar-Eneabba Region B In order to avoid designing additional towers for wind region B 15 degree suspension tower, it was found that 45 degree region A strain structure body could be utilised. Special suspension cross arm for 15 degree region B was designed on the 45 degree tower body, which results in development cost savings.

Page 32 of 54
DMS# 7075162
Uncontrolled document when printed
Refer to DMS for current version
Tower Type Region A Region B
Suspension 9DS0A 9DS0B
Heavy Suspension 9DS5A
9DS15A
In-line Strain 9DA0A
Strain Tower 9DA45A 9DA15B
Terminal Tower 9DT25A 9DT25B
Low Profile Tower Low Profile
Note : 9DS0A means 9(330kV) Double Circuit Suspension tower 0 degree Region A
9DA15B means 9(330kV) Double Circuit Angle tower 15 degree Region B
Table 9.3: Optimised Tower Suite
9.4 SECTION LENGTH REQUIREMENT
The suspension structures have been designed to be fully compliant with ENA C(b)-1-2006. The structures are designed with longitudinal strength similar to the transversal direction and are fully capable of dissipating a shock load within the next two or three spans and to prevent the cascade failures (refer to ENA C(b)-1-2006; Section 3; section 3.7.1 and 3.7.2). This eliminates any need for stop structures.
However, the constructability of the transmission lines are also required to be considered as a design parameter. Based on advice from transmission lines construction companies and Western Power’s experience on a similar 330kV project, long sections of line provide additional challenges for sag adjustment of bundled conductors. Subsequently, based on the construction company’s recommendation, in-line strain structures are introduced every 15km of length to limit the section length and facilitate conductor sag adjustment.
Page 33 of 54
DMS# 7075162
Uncontrolled document when printed
Refer to DMS for current version
10 OPTIMAL SPAN LENGTH
Span length is key design parameter that has a large effect on the ultimate line costs. As part of the design optimisation process undertaken by Western Power, desktop studies were performed to establish the most cost effective span length for the selected route.
10.1 PLSCADD ANALYSIS METHOD
Using Power Line System Computer-Aided Design and Drafting (PLSCADD) software package, optimum spotting of structures was utilised to achieve the most economical structures location and design for the line.
Optimum spotting is an iterative process whereby PLSCADD is used to resolve a large combination of structure types, locations and heights to achieve the least cost solution by utilising matrix combination calculations. The software package is also used to ensure that all design criteria and other local terrain constraints are met. Design criteria included issues such as:
- Exclusion/restricted zones
- Minimum ground clearance
- Lateral clearance
- Maximum allowable structure loads
- Insulator swing angles.
PLSCADD optimum spotting steps:
1. Method 1 structure models
PLSCADD uses wind and weight span ratio for structure spotting to identify preliminary span lengths based on the least cost structures combination.
2. Method 2 structure modelling
The strength of the structures was taken into consideration in this method to refine the selected span length. To ensure that the strength of the structures is not exceeded, optimum spotting algorithms consider a very large number of trial combinations of structure locations and strength checks.
Following the development of simplified Method 4 structures (primary members only), the optimum spotting results were checked using the PLSCADD finite element analysis feature.
10.2 INPUT PARAMETERS DERIVATION
The optimum spotting features in PLSCADD requires input of an initial line design. The design includes several key parameters already established within the design process. These key parameters are:
a. Lacrosse twin bundle conductor with 23% UTS,
b. Wind speed in accordance with AS/NSZ 1170,
c. Allowable swing angle for suspension insulators,
Page 34 of 54
DMS# 7075162
Uncontrolled document when printed
Refer to DMS for current version
d. Tower geometry (crossarm length, phase to phase separation, nominal tower height),
e. Base cost of the tower type and height.
For each of the optimum spotting cases analysed, the total cost per tower was determined by incorporating the following factor to the base cost of the initial tower types:
o Span Factor is a coefficient derived from the impact of different wind/ruling spans to the tower weight
o Height Factor is a coefficient derived from the impact of tower height to the tower weight (based on the weight of various leg extension)
o Cost per tonne is the cost per tonne of fabricated tower steelwork delivered to site.
o Tower steelwork installation cost. A base cost ( as per 28 April 2010) is used to interpolate a coefficient factor for the increase of installation cost with respect to the increase in tower height.
o Cost for the supply of insulator and electrical hardware on tower
o Construction cost for fittings installation and conductor stringing.
o Foundation cost = Detailed method of determining foundation costs is found in Section 12.7.
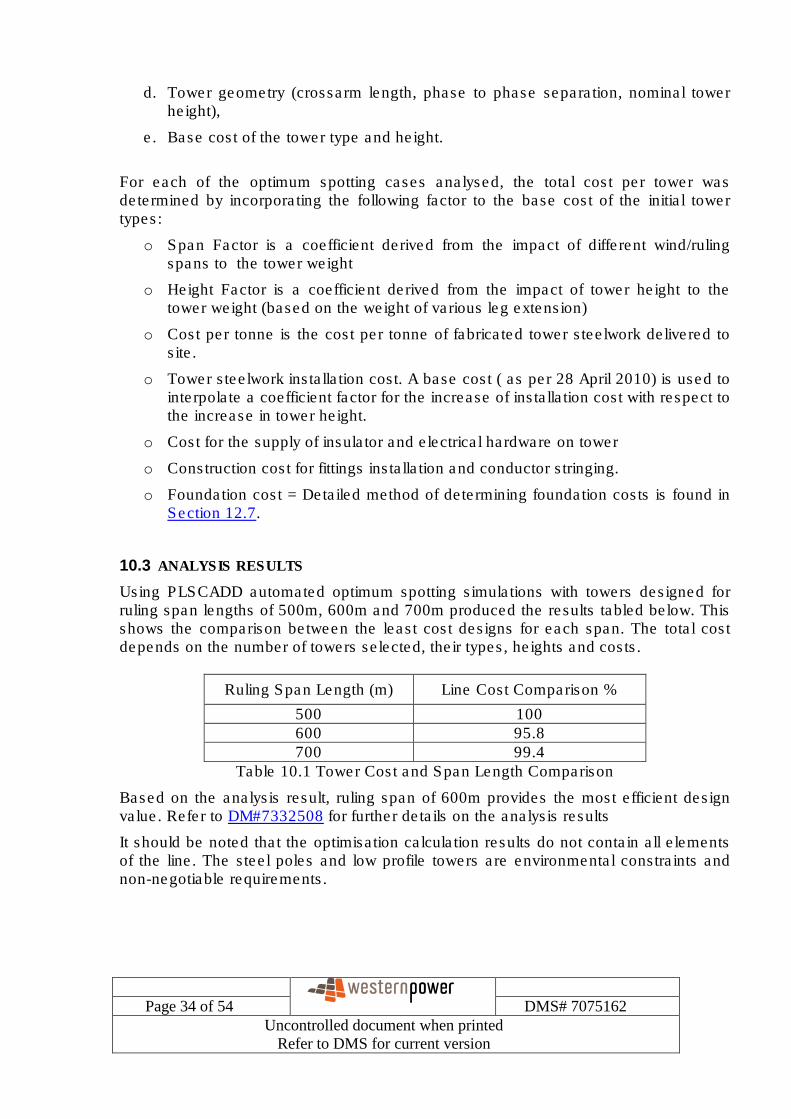
10.3 ANALYSIS RESULTS
Using PLSCADD automated optimum spotting simulations with towers designed for ruling span lengths of 500m, 600m and 700m produced the results tabled below. This shows the comparison between the least cost designs for each span. The total cost depends on the number of towers selected, their types, heights and costs.
Ruling Span Length (m) Line Cost Comparison %
500 100 600 95.8 700 99.4
Table 10.1 Tower Cost and Span Length Comparison
Based on the analysis result, ruling span of 600m provides the most efficient design value. Refer to DM#7332508 for further details on the analysis results
It should be noted that the optimisation calculation results do not contain all elements of the line. The steel poles and low profile towers are environmental constraints and non-negotiable requirements.

Page 35 of 54
DMS# 7075162
Uncontrolled document when printed
Refer to DMS for current version
11 TOWER GEOMETRY
11.1 PHASE CONDUCTOR CROSS ARM SEPARATION AND LENGTH
To comply with the requirements set out in Section 4.3, the line is designed for live line maintenance. As such, the geometry is not only determined by the power frequency and impulse withstand clearances required, but also by live line maintenance approach and working distances. A minimum safe approach distance of 2030mm for live bare hand work is required for 330kV line in accordance with ENA LLM 01-2006.
Section 4.1 stipulates that the minimum required lightning/surge impulse withstand voltage for the line shall be 1175 kV. ENA C(b)1-2006 Table 10.4 states that the corresponding clearances to earthed structures are 1.1 m and 2.6 m respectively to withstand power frequency and impulse voltage.
The swing angles are calculated in accordance with ENA C(b)1-2006 Section 10.4.3 and AS/NZS 1170.2:2002. For low wind locations, the wind pressure is 0.1 kPa.
For high wind locations, in accordance with the detailed procedure in C(b) Section 10.4.3 the wind pressure was calculated for a 200 year wind return period and converting the 3 second gust to a 5 minute gust. The 5 minute guest wind will provide a satisfactory operational performance with a probability of exceeding the calculated swing angle of 1%..The wind pressure is 0.72 kPa for region A and 0.95 kPa for region B.
11.2 LIGHTNING PROTECTION AND EARTHING
The earthwire cross-arm length is calculated to provide adequate shielding to prevent a shielding failure occurring in an area with a keraunic level of 10 as indicated in the Bureau of Meteorology map of thunder days.(DM# 7139161).
The earthwire is placed above each top phase conductor at the same vertical distance of the vertical phase to phase separation of the line designed for de-energised maintenance as opposed to the live line design. This is due to the increase in length in phase to phase separation for a live line design. Industry practice has shown that de-energised maintenance distance for earthwire to phase is adequate to avoid flashover. Western Power has experienced satisfactory performance based with the same approach on other similar 330kV lines.

Page 36 of 54
DMS# 7075162
Uncontrolled document when printed
Refer to DMS for current version
11.3 HEIGHT ABOVE GROUND FROM CONDUCTOR ATTACHMENT POINT
Non wheat-belt
Conductor sag at 850C 26.8 m - Standard 600m span
Ground clearance 8.0 m - As per ENA C(b)1-2006 section 8.1
Sag Tolerance 1.0 m*
Total 35.8 m
Wheat-belt
Total Non wheat-belt height 35.8 m - Indicated above
Additional height for wheat-belt + 2.3 m**
Total 38.1
*The 1.0 m sag tolerance is based on a survey carried out by Western Power which indicated that the majority of power utilities in Australia use this value for 330 kV lines to ensure that the ground clearance is maintained throughout the life of the line taking into account possible errors relating to survey, construction, sagging, conductor setting-in, annealing and creep. Refer to DM# 7137537 for the survey data.
** The additional ground clearance allowed for the wheat-belt region is for the unusual additional height of some farming machinery, refer to Western Power Guidelines (DM# 1788481)

Page 37 of 54
DMS# 7075162
Uncontrolled document when printed
Refer to DMS for current version
12 STRUCTURE AND FOUNDATION REQUIREMENTS
12.1 BASIS OF DESIGN
The structures have been designed to withstand minimum loading requirements as per ENA C(b)1-2006 and corresponding Australian Standards.
12.2 STRUCTURAL RELIABILITY
As mentioned in Section 5.5, the design life of the Pinjar Eneabba line is 50 years with a reliability level of 3, which correspond to 200 years wind return period.
12.3 DESIGN ACTIONS
12.3.1 WIND LOADING
The wind load is based on ENA C(b)1-2006 and AS1170.2: Structural Design Actions: Wind Actions. The site specific wind parameters were based on the fact that the majority of the line is orientated South to North and passes through open terrain (paddocks and farming lands).
A detailed examination of topographical maps indicated that the majority of the line did not have any issue with increased wind pressure due to local topographical features such as funnelling or expansion in valleys, hills and escarpments. However 25 km of the line adjacent to Eneabba Substation was identified as being exposed to higher wind pressure (AS 1170.2:200 clause 4.4) than the rest of the line.
In addition the design took into account the change in wind regions as at Lat 30° close to Eneabba from Wind Region A1 to Region B.
The site specific wind parameters are adopted as follows (as per AS1170.2: Structural Design Actions-Wind Actions and line geography):
Wind Region A1 B
Regional wind speed VR=43m/s VR=52m/s
Terrain category 2.0 2.0
Assessed Topographic multiplier (Mt)
1.0 (in general)
1.0
In accordance with ENA C(b)1-2006 Section 3 the structures have been designed to withstand the wind combinations as follows:
o Transversal wind;
o Oblique wind 22.5° inclination to transverse axis;
o Oblique wind 45.0° inclination to transverse axis;

Page 38 of 54
DMS# 7075162
Uncontrolled document when printed
Refer to DMS for current version
o Oblique wind 67.5° inclination to transverse axis;
o Longitudinal wind; and
o Tornado wind.
12.3.2 FAILURE CONTAINMENT LOAD
The Failure Containment Load is based on ENA C(b)1-2006 section 3.7. As such, the structures are designed to withstand unbalanced longitudinal conductor tension due to failure of adjacent structure by considering the equivalent longitudinal loads resulting from not less than any one third of all phase conductors on the structure being broken with a nominal coincident wind velocity of 0.25 times the ultimate wind pressure or 0.24 kPa, whichever produces more adverse effect.
12.3.3 MAINTENANCE AND CONSTRUCTION LOADS
The Maintenance and Construction Loads are based on ENA C(b)1-2006 section 3.8. In order to minimise the structural loads on tower and provide stringing methodology that may suit any contractor, Western Power requires the maintenance loads to be considered for each complete phase or overhead earth-wire being worked on in turn.
The conditions are based on the worst weather conditions under which maintenance will be carried out. The limiting wind velocity for maintenance work was taken as 10m/s (industry work practice).
12.4 DETAILED TOWER DESIGN
The PLSCADD method 4 detailed tower design has been performed by Western Power to the extent required to extract the tower properties necessary for line optimisation analysis such as tower geometry, member sizes, tower weight and tower models for PLSCADD optimum spotting and performance verification checks.
The tower models have been designed using PLS-Tower software package and inserted in the PLSCADD line profile for optimal spotting (level 2 modelling). The structural and electrical performance verification was carried out by using level 4 models and finite element analysis (FEA). The FEA method calculates interactions between the tower members and attached conductor loads by including structure flexibility matrices and hence produces more realistic and more economical results compared with the traditional non-interactive model approach.
12.5 MATERIAL SELECTION
Towers shall be of steel material using hot rolled angle (90º) sections and plates. In general the following grades of steel shall be applicable:
• Mild steel shall be Grade 250 in accordance with AS 3678 (for plates) and Grade 300 in accordance with AS 3679.1 (for angles)
• High tensile steel shall be Grade 350L0 in accordance with AS 3678 and AS 3679.1

Page 39 of 54
DMS# 7075162
Uncontrolled document when printed
Refer to DMS for current version
Since the responsibility of costly and time consuming production of steel fabrication drawings are with the Contractor and can only start after the steel standard is approved, any change of steel standard is expected to have a limited influence on the project.
12.6 TOWER ACCEPTANCE TESTING
All tower types will be required to be full scale prototyped and then load tested prior to full production to demonstrate that the developed designs meet the quality requirements of the Western Power technical specification.
The load tests are required to verify the force distribution in the tower members and assess the efficiency of secondary bracing elements for each tower design.
All load tests will be in accordance with IEC 60652 with agreed test procedures to simulate design conditions as closely as practicable.
Western Power will witness these tests to ensure they meet the design requirements.
12.7 FOUNDATION SELECTION AND OPTIMISATION
The following foundation types were considered on the basis of soil types expected to be encountered, based on Western Power’s experience with previous lines (including those in the Mid West region):
o Bored undercut foundation which is formed by augering a hole into soil and extending its base by forming a “bell”.
o Type “A” is for dry stable soil
o Type “D” is for wet stable soil.
o Bored socketed foundation, formed by augering a hole into rock; Type “B”
o Mass concrete or spread footings formed by excavation of square holes in soil or rock. The base may be straight sided or undercut depending on soil conditions and construction methods.
o Type “C” is for dry stable soil,
o Type “C1” for dry unstable soil,
o Type “E” is for wet stable soil,
o Type “E1” is for wet unstable soil.
o Type “F” is mass concrete foundation in rock.
o Piled, consisting of driven steel piles; Type “G”.
A geotechnical consultant (Golder Associates) carried out initial geotechnical studies at approximately 5 km intervals along the line length (refer DM #6132622). Further geotechnical investigations have been carried out (DM #7908966) to reduce the intervals to 2km in order to achieve the required accuracy of soil parameters.
Page 40 of 54
DMS# 7075162
Uncontrolled document when printed
Refer to DMS for current version
The foundation type distribution resulting from the Golder Associates’ report and historical data from the existing line in the same area is as follows:
o Bored undercut (Types “A” and “D”) 16%
o Bored socketed (Type “B”) 3%
o Mass concrete (Types “C”, “C1”, “E”, “E1” and “F”) 21%
o Piled (Type “G”) 60%
The cost of the foundations represents a significant part of the overall line cost. Three options were explored to reduce these costs without compromising the safety margin.
1. Minimum common parameters.
This option is based on less extensive geotechnical investigation and adopts more conservative design parameters. The safety level is high however it will result in a higher foundation cost.
2. Full geotechnical testing at each tower location.
This option will provide very accurate soil parameters at each tower location and prediction of foundation type distribution. However in order to reduce construction cost the foundation design should be standardised and based on general optimised parameters that cover a reasonable amount of footings (target 90%). Therefore the option 2 actually can not realise the full benefit from the extensive geotechnical investigations.
3. Reasonably frequent geotechnical testing and design based on engineering soil parameters.
The geotechnical investigation will produce values and reasonably accurate distribution of soil parameters that will allow the determination of engineered soil parameters that cover the majority of foundations (target 90%). The engineering parameters will be used for foundation design. Construction personnel will be made aware of the assumed parameters and guidelines will be issued to allow recognition of soils not conforming to the adopted design parameters. The foundation in non-conforming soils will require special design however this is expected to be a small percentage resulting in this option producing the greatest cost/benefit.
Option 3 was selected and the design of each type of footing was based on the following measures to ensure that the soil conditions meet the assumed design criteria during construction:
o Foundation type testing;
o A geotechnical consultant will review the Contractor’s foundation installation procedures;
o The geotechnical consultant will provide steel pile driving acceptance criteria charts (based on testing records); and
o The geotechnical consultant will train the Contractor’s construction personnel to assess soil parameters. In addition the geotechnical consultant will provide

Page 41 of 54
DMS# 7075162
Uncontrolled document when printed
Refer to DMS for current version
construction oversight of foundation installation to ensure correct selection by construction personnel.

Page 42 of 54
DMS# 7075162
Uncontrolled document when printed
Refer to DMS for current version
13 ENVIRONMENT IMPACT
13.1 ELECTROMAGNETIC FIELDS
Western Power has calculated the Electromagnetic Field (EMF) strengths applicable to the Pinjar-Eneabba line design. Under Western Power’s easement conditions, only normal farming operations such as grazing and cropping are permitted within the easement. Continuous exposure such as living in a structure underneath the line is not permitted.
The calculated values for the Pinjar-Eneabba 330kV line are (Refer DM# 7105170):
Electric Field Strength 6.3 kV/m (rms)
Magnetic Flux Density 0.019 mT (rms)
Based on the calculated values, the results comply with the recommendations of the National Health & Medical Research Council of Australia (NHMRC), specifically the following Interim Guidelines on Limits of Exposure to 50/60Hz Electric and Magnetic Fields as referenced in ENA C(b)1-2006 Table 4.2.
LIMITS OF EXPOSURE TO 50/60Hz ELECTRIC AND MAGNETIC FILEDS
Exposure characteristic Electric field
strength kV/m (rms) Magnetic flux density
mT(rms)
OCCUPATIONAL
Whole working day 10 0.5
Short term 30 5
For limbs 25
General Public
Up to 24hours/day 5 0.1
Few hours/day 10 1
13.2 RADIO AND TELEVISION INTERFERENCE
Western Power conducts surveys on all existing 330kV transmission lines to ascertain whether they comply with the limit of electromagnetic interference set by AS/NZS 2344. Measurements are carried out at the edge of easement (30m from centreline of the transmission lines. The survey indicated that all existing 330kV lines comply with the Australian Standard.
Based on this survey data, it is regarded that the proposed Pinjar to Eneabba 330 kV line will comply with the radio and television interference voltage limits set by AS/NZS 2344, due to the following:
o The design of Pinjar to Eneabba double circuit line is similar to the existing double circuit transmission lines. Pinjar to Eneabba will have larger conductor (33.8mm compared to existing 31.5mm) which will generate lower corona losses and thus reducing the noise levels.
Page 43 of 54
DMS# 7075162
Uncontrolled document when printed
Refer to DMS for current version
o The easement of Pinjar to Eneabba 330kV lines will be slightly wider, i.e. 2.5 m and 5.5m more for Region A & Region B respectively, both measured from its centreline left and right.
13.3 EARTH POTENTIAL RISE AND LOW FREQUENCY INDUCTION
A desktop study of the EPR/LFI for the Pinjar to Eneabba line was undertaken to give a preliminary design and expected cost for the mitigation. The study was based on known soil resistivity data at Neerabup, Pinjar, Cataby and Enneabba and 10 Ω tower footing resistivity as per Western Power’s basis of earthing design to achieve satisfactory backflashover performance.
Western Power’s basic earthing design comprises of bonding the earthwires at the tower earthwire peaks and connecting a 4m length of steel galvanised bar at the foot of the tower to 2 stainless steel electrodes with a minimum depth of 6m.
Even though, copper is a better material for earthing electrodes, Western Power has selected stainless steel due to the following:
1. Better performance against cathodic reaction which occurred if copper electrode was used in the vicinity of other steel pipes assets.
2. Less vandalism risk compared to copper.
The report from the desktop study (DM#5513334) indicated that the basic earthing design of 2 electrodes per tower leg will not be sufficient to achieve 10 Ω tower footing resistance.
Due to the complexity and difficulty of developing a full soil and tower models for the entire line route without additional testing, it was recommended to undertake site studies once the Pinjar to Eneabba 330kV tower lines are built. On site testing will be performed at each tower legs to determine actual soil resistivity and tower footing resistance. It is expected that once all the towers are earthed and connected together, the overall footing resistance will meet the recommended 10 Ω.
The LFI studies indicated that there are other assets within the vicinity of the line route. These assets are:
- Telstra cable
- WaterCorp asset
- Gas pipelines
Once the Pinjar Eneabba line is built, LFI tests will be performed in conjunction with the above asset owners. If the values of the ‘on-site’ testing are found to be exceeding the acceptable limits, mitigation will be performed.
The full report of the study can be found in Appendix G.

Page 44 of 54
DMS# 7075162
Uncontrolled document when printed
Refer to DMS for current version
14 132kV LINE CONNECTION
The new 330kV transmission line will be constructed as a double circuit, however only one circuit will be operating at 330kV. The other circuit will be operated at 132kV and will be connected into Western Power’s existing 132kV substations along the line route. These substations are Pinjar, Cataby, Regans and Eneabba. The east side of the double circuit line will be the circuit operating at 132kV.
The design of the 132kV connection will utilise Western Power’s wood pole standard design (T5000 series).
14.1 PINJAR SUBSTATION
On the south side of Pinjar substation, the 132kV connection will take place at tower T-PJR 90/90. The circuit will connect to the existing NT-PJR 81 steel pole line. This circuit will form NBT-PJR 81. One span of conductors will require to be strung for this portion.
The north side of Pinjar, the line will be connected to the existing pole 4 of PJR-RGN 81. Standard wood pole and fittings will be applied for the design of this interconnector. Refer to Appendix C for a sketch of the line entries. Details of the scope of work are documented in DM# 7235123.
14.2 REGANS SUBSTATION
The north side of Regans substation will be connected to the existing CTB-RGN 81 line, while the south side will be connected to the existing PJR-RGN 81. Western Power’s T5000 standard wood pole design and fittings will be applied for the design of the connection. Refer to Appendix D for a sketch of the line entries. Details of the scope of work are documented in DM# 7236045.
14.3 CATABY SUBSTATION
The north side of Cataby substation will be connected to the existing CTB-ENB 81 line, while the south side will be connected to the existing CTB-RGN 81. Western Power’s T5000 standard wood pole design and fittings will be applied for the design of the connection. Refer to Appendix E for a sketch of the line entries. Details of the scope of work are documented in DM# 7243000.
14.4 ENEABBA SUBSTATION
The east side of the new double circuit line which will be energised at 132kV, is to be connected to the new gantry at Eneabba substation to create CTB-ENB 81 line. Western Power’s T5000 standard wood pole design and fittings will be applied for the design of the connection. Refer to Appendix F for a sketch of the line entries. Details of the scope of work are documented in DM# 7247619.
Page 45 of 54
DMS# 7075162
Uncontrolled document when printed
Refer to DMS for current version
15 132kV LINE CROSSINGS
There are two 132kV transmission lines along the proposed line route of the new double circuit transmission line. Provisions for line crossings are required prior to the new lattice towers construction.
15.1 PINJAR CROSSINGS
The proposed line route of the new double circuit transmission line will cross over the existing PJR-CTB 82/PJR-ENB 81. The existing PJR-CTB 82/PJR-ENB 81 is currently crossing over the existing PJR-CTB 81 line and thus the existing 132kV towers PJR-CTB 82/PJR-ENB 81 are fairly tall.
There were 3 possible solutions for these line crossings:
1. Install higher 330kV lattice towers to cross over the existing PJR-CTB 82/PJR-ENB 81
2. Cross underneath the existing PJR-CTB 82/PJR-ENB 81 with double circuit 330kV line gantry
3. Replace the existing 132kV PJR-CTB 82/PJR-ENB 81 tall crossing structures with 132kV underground cable.
Consultation with system operations and various other stakeholders within Western Power deems option 1 and 2 to be unsuitable. Taller structures for the new 330kV transmission lines will provide negative visual impact. In addition, constructing these taller towers will require outages on the 132kV line circuit which will result in reduced system reliability.
Crossing underneath the 132kV line circuits is also unadvisable by system operations due to the importance of the 330kV line circuits compared to the 132kV circuits. The relative reliability of the 330kV line is higher and thus if the 132kV circuits fail and affect the 330kV line circuit, this will present a high risk which is unacceptable to system operations.
In light of the above, option 3, the underground 132kV cable was selected as the preferred option.
This solution consists of steel transition structures, steel suspension poles and 132kV underground cable. Both the PJR-CTB 82/PJR-ENB 81 will be undergrounded.
Western Power’s standard 132kV cable design (T5001series) will be used for the underground cable design.
15.2 EMU DOWNS WINDFARM TEE-OFF
The existing cricket wicket CTB-ENB/EMD 81 wood pole line has to be dismantled to allow the new 330kV lattice towers to be built. As a result, the existing tee off section of the CTB-ENB/EMD 81 will required to be connected to the existing PJR-ENB 81 tower line and renamed as PJR-ENB/EMD 81.The existing CTB-ENB/EMD 81 line will have the tee off section removed and re-energised as CTB-ENB 81.

Page 46 of 54
DMS# 7075162
Uncontrolled document when printed
Refer to DMS for current version
The design of the tee off relocation will be in accordance with T5000 wood pole standard design.

Page 47 of 54
DMS# 7075162
Uncontrolled document when printed
Refer to DMS for current version
16 APPENDIX A – MID WEST NETWORK MAP
Geraldton
Mungarra
Eneabba
Three Springs
Golden Grove
Emu Downs
Muchea
Moora
Cataby
Regans
Pinjar
Perth Metro Area
Walkaway
Neerabup
Karara
Extension Hill
MWEP proposed 330kV line
KML proposed 330kV line
Existing 132kV network
Future Eneabba Terminal
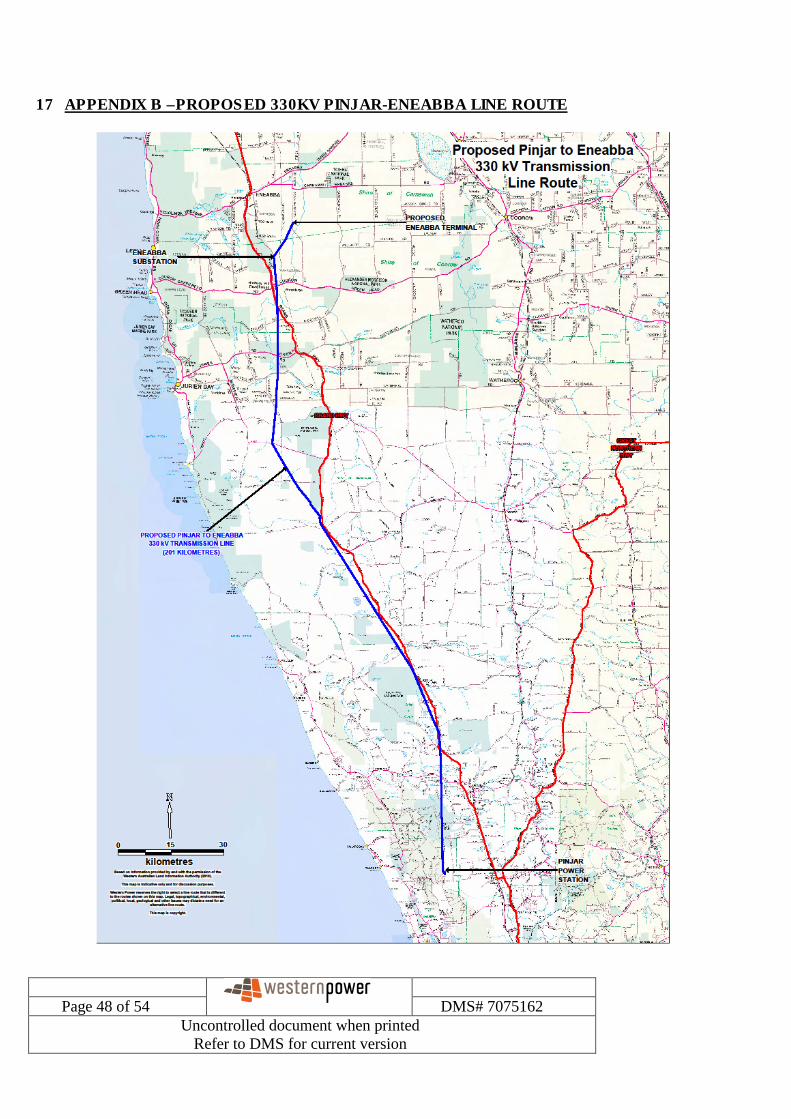
Page 48 of 54
DMS# 7075162
Uncontrolled document when printed
Refer to DMS for current version
17 APPENDIX B –PROPOSED 330KV PINJAR-ENEABBA LINE ROUTE
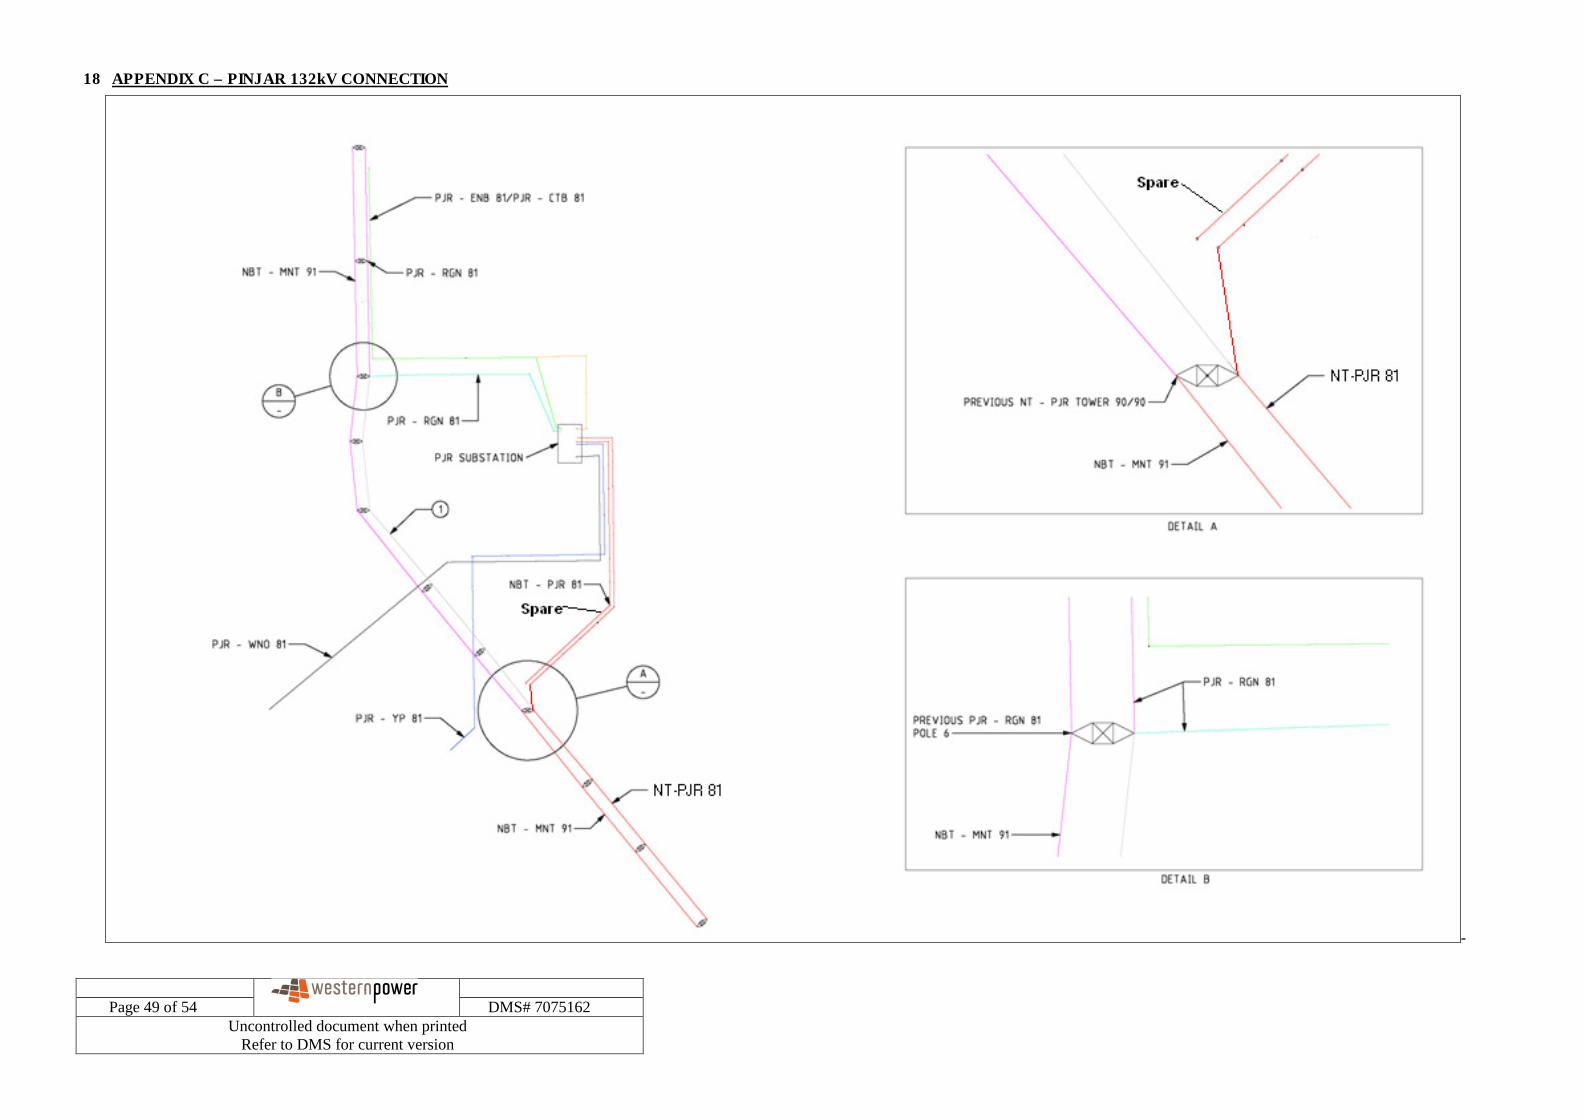
Page 49 of 54
DMS# 7075162
Uncontrolled document when printed
Refer to DMS for current version
18 APPENDIX C – PINJAR 132kV CONNECTION
-

Page 50 of 54
DMS# 7075162
Uncontrolled document when printed
Refer to DMS for current version
19 APPENDIX D – REGANS 132kV CONNECTION
-

Page 51 of 54
DMS# 7075162
Uncontrolled document when printed
Refer to DMS for current version
20 APPENDIX E – CATABY 132kV CONNECTION
-

Page 52 of 54
DMS# 7075162
Uncontrolled document when printed
Refer to DMS for current version
21 APPENDIX F – ENEABBA 132kV CONNECTION
-
-

Page 53 of 54
DMS# 7075162
Uncontrolled document when printed
Refer to DMS for current version
22 APPENDIX G - EPR & LFI DESIGN
In 2009 a detailed EPR/LFI study was performed on the proposed Pinjar to Eneabba 330kV Line. In consultation with various asset owners (Telstra, WaterCorp, Gas Pipelines) modelling was done using computer software to simulate the effects of the proposed line on those assets. The simulated values were then compared with various ENA Guidelines, International and Australian Standards for compliance.
In order to verify these design values, selective testing will be performed on site once the line is built. Depending on the test results, various mitigation options will be considered if required. Again, this will be done in consultation with the asset owners.
To ensure that the EPR/LFI Study is considered in full, extracts of that report will not be added as an Appendix. It is advisable to consider the Report in full and therefore it will only be referenced in this section.
Reference:
DM#5513334: Proposed Pinjar to Eneabba 330kV Transmission Line Route – EPR and LFI Study using PSMT.

Page 54 of 54
DMS# 7075162
Uncontrolled document when printed
Refer to DMS for current version
23