transmutation rates in the annulus gas of pressure tube
TRANSCRIPT
Transmutation Rates in the Annulus Gas of Pressure Tube Water
Reactors
by
Mohammad Mateen Ahmad
A Thesis Submitted in Partial Fulfillment
of the Requirements for the Degree of
Master of Applied Science
in
Nuclear Engineering
Faculty of Energy Systems and Nuclear Science
University of Ontario Institute of Technology
July, 2011
© Mohammad Mateen Ahmad, 2011
ii
ACKNOWLEDGEMENTS
I am indebted to my research supervisor, Dr. Rachid Machrafi for the opportunities he
has given me and for the support and invaluable guidance throughout the course of my
study at UOIT.
I would like to express my gratitude to my co-supervisor Dr. Igor Pioro, whose expertise,
understanding, and patience, added considerably to my graduate experience. Special note
of gratitude to all the staff members in “FESNS” for their wealth of knowledge I was
exposed to, during my graduate studies.
I would also like to thank my parents and siblings for their continuous support and
encouragement.
I owe a special note of thanks to Fayyaz Ahmed, for sharing his experience and making
my stay in Canada, enjoyable and memorable.
iii
CONTENTS
ACKNOWLEDGEMENTS .......................................................................................... ii
LIST OF FIGURES ..................................................................................................... vi
LIST OF TABLES ....................................................................................................... ix
ABSTRACT ...................................................................................................................x
NOMENCLATURE .................................................................................................... xi
INTRODUCTION ..................................................................................................... xiii
CHAPTER 1 ..................................................................................................................1
BACKGROUND ON PRESSURE TUBE REACTORS ..............................................1
1.1. Description of CANDU Reactor ............................................................................1
1.2. CANDU Supercritical Water Reactor (CANDU SCWR) .......................................4
1.2.1. Supercritical Water and Fluid properties .........................................................5
1.2.2. Proposed CANDU SCWR Fuel Channel .........................................................6
1.3. Annulus Gas System (AGS) ..................................................................................8
1.3.1. Purpose of AGS ..............................................................................................9
1.3.2. Physical Description of AGS ........................................................................ 10
1.3.3. Evolution of AGS’s ...................................................................................... 12
1.3.4. Previous Experiences in AGS ....................................................................... 14
1.4. Issues with CO2 Annulus Gas .............................................................................. 15
1.4.1 Thermal Insulation ......................................................................................... 15
1.4.2. Transmutation of 12
C and
16O ........................................................................ 16
1.4.3. Formation of Organic Compounds ................................................................ 19
1.5. Transmutation in Annulus Gas ............................................................................ 22
1.6. Inert Annulus Gas and Thermal Insulation ........................................................... 26
iv
CHAPTER 2 ................................................................................................................ 29
APPROACH AND METHODOLOGY ...................................................................... 29
2.1. Neutron Interaction and Transport ....................................................................... 29
2.1.1. Nuclear Fission Reaction .............................................................................. 29
2.1.2. Movement of Neutrons in the CANDU lattice ............................................... 31
2.1.3. Neutron Migration ........................................................................................ 33
2.2. Fuel Channel ....................................................................................................... 37
2.2.1. Fuel Channel Characteristics ......................................................................... 38
2.2.2. Simulating Fuel Channel Conditions ............................................................. 40
2.3. Simulation Approach ........................................................................................... 45
2.4. Transmutation Rates ............................................................................................ 46
CHAPTER 3 ................................................................................................................ 50
MONTE CARLO MODELING .................................................................................. 50
3.1. MCNP Code Description ..................................................................................... 50
3.1.1. Surface Cards................................................................................................ 51
3.1.2. Cell Cards ..................................................................................................... 52
3.1.3. Data Cards .................................................................................................... 53
3.1.4. Tally Cards ................................................................................................... 54
3.1.5. Input File Format .......................................................................................... 55
3.2. Three Dimensional PTR Fuel Channel ................................................................ 56
3.3. Fuel Channel Simulation Parameters ................................................................... 59
3.3.1. Neutron Sources Placement........................................................................... 59
3.3.2. Simulated Neutron Sources ........................................................................... 61
3.4. Simulation Model ................................................................................................ 62
3.4.1. PTR Fuel Channel Model .............................................................................. 62
v
3.4.2. PT SCWR Fuel Channel Model .................................................................... 65
CHAPTER 4 ................................................................................................................ 66
RESULTS AND DISCUSSION ................................................................................... 66
4.1. Neutron Flux and Transmutation Rates in PTR Fuel Channel .............................. 66
4.1.1. PTR Annulus Gas Flux with CO2 .................................................................. 66
4.1.2. PTR Annulus Gas Transmutation Rate .......................................................... 72
4.1.3. Annulus Gas Temperature Influence on Transmutation Rate Trends ............ 75
4.2. PT SCWR Fuel Channel Annulus Transmutation Rates Trends ........................... 77
4.2.1. Annulus Gas Temperature Influence on Transmutation Rate ......................... 77
4.2.2. Annulus Gas Pressure Influence on Transmutation Rate ................................ 83
4.3. PTR and PT SCWR Comparison ......................................................................... 88
CONCLUSIONS .......................................................................................................... 90
FUTURE WORK......................................................................................................... 92
REFERENCES ............................................................................................................ 93
APPENDIX A .............................................................................................................. 96
MCNP CODE OF PTR AND PT SCWR FUEL CHANNEL .................................... 96
APPENDIX B............................................................................................................... 99
ADDITIONAL RESULTS FROM MCNP ................................................................. 99
APPENDIX C ............................................................................................................ 105
TRANSMUTATION RATES WITH DIFFERENT NEUTRON SOURCES ......... 105

vi
LIST OF FIGURES
Figure 1. 1. CANDU-6 fuel channel ................................................................................2
Figure 1. 2. Side view of the CANDU Reactor ................................................................3
Figure 1. 3. Current Canadian SCWR fuel channel concept.............................................5
Figure 1. 4. Variation of properties of light water at critical pressure with
temperature......................................................................................................................6
Figure 1. 5. Insulated PT design of the CANDU SCWR fuel channel ..............................7
Figure 1. 6. Configuration of bundles in the fuel channel ................................................8
Figure 1. 7. Simplified annulus gas system ................................................................... 10
Figure 1. 8. Annulus gas channel flow system ............................................................... 11
Figure 1. 9. History of annulus gas system. ................................................................... 13
Figure 1. 10. 12
C(n, γ)13
C reaction cross section ............................................................ 17
Figure 1. 11. 14
N(n,p)14
C reaction cross section............................................................. 17
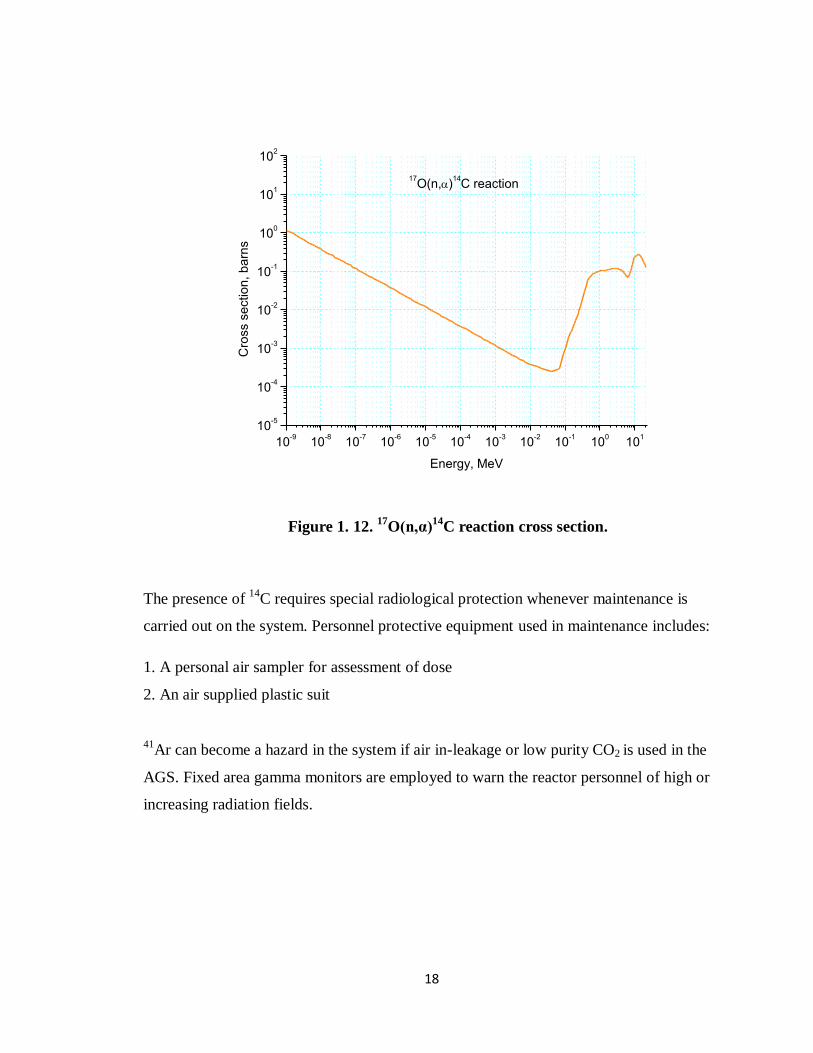
Figure 1. 12. 17
O(n,α)14
C reaction cross section ............................................................ 18
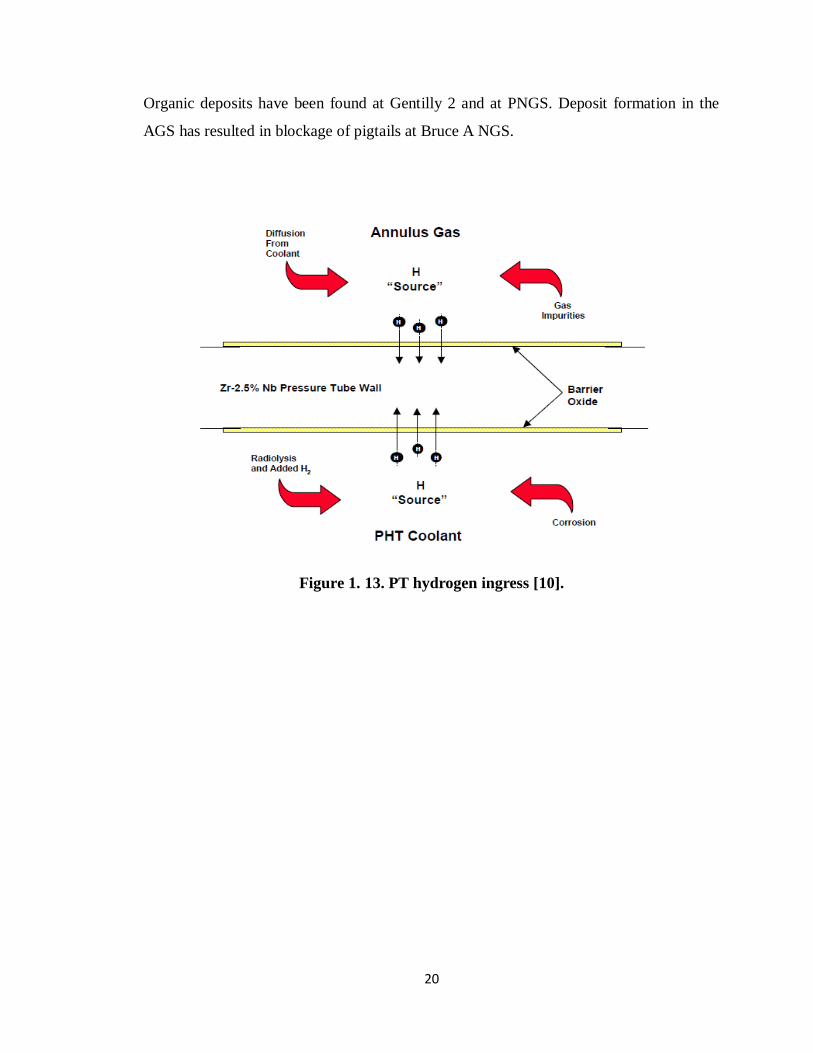
Figure 1. 13. Pressure tube hydrogen ingress................................................................. 20
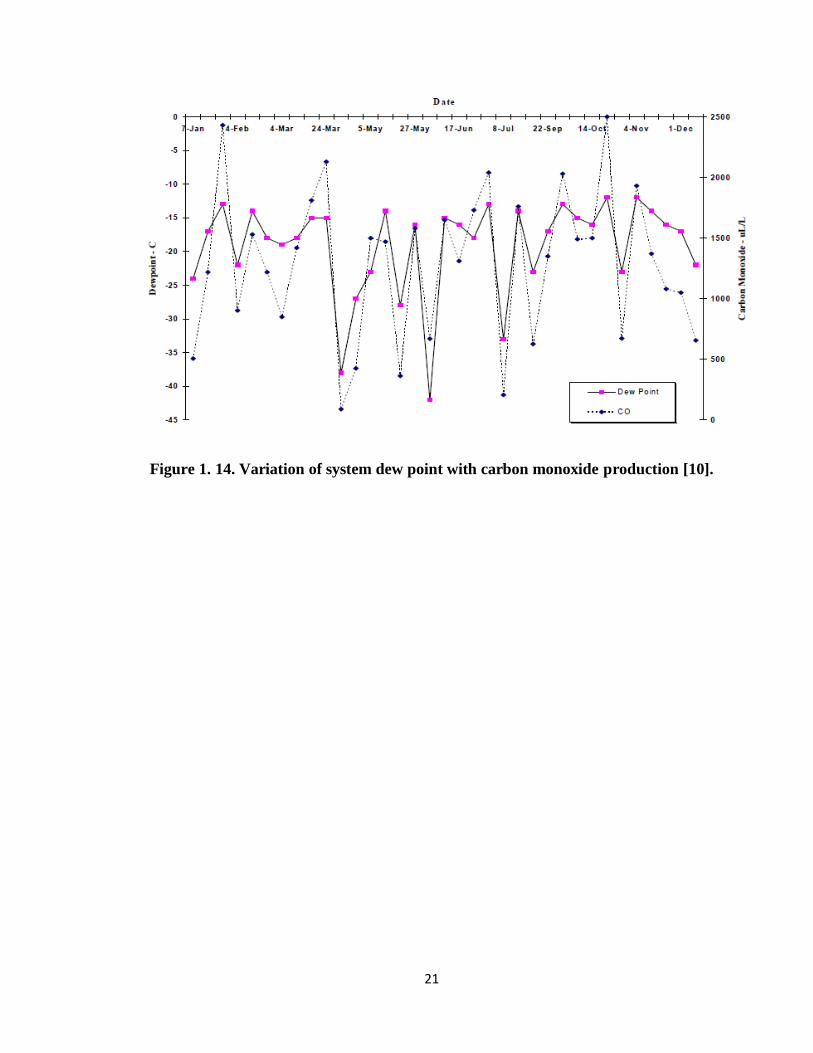
Figure 1. 14. Variation of system dew point with carbon monoxide production ............. 21
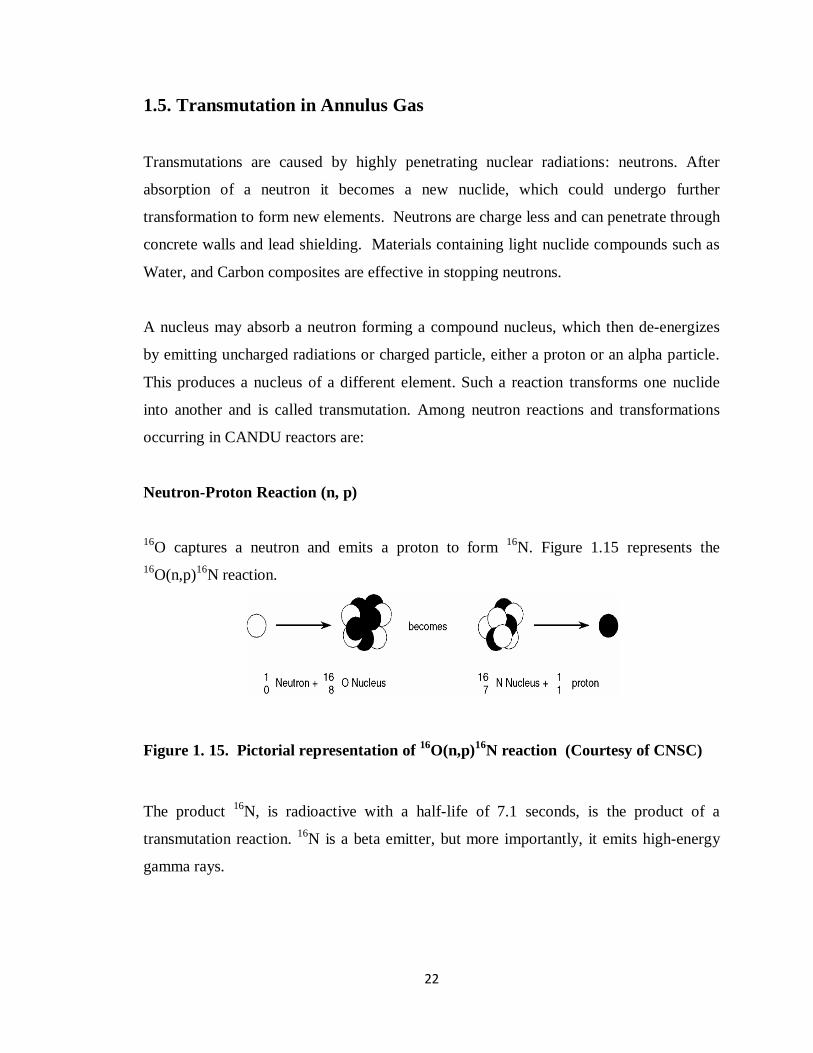
Figure 1. 15. Pictorial representation of 16
O(n,p)16
N reaction ....................................... 22
Figure 1. 16. Pictorial representation of 10B(n,α)
7Li reaction. ........................................ 23
Figure 1. 17. Pictorial representation of 1H(n,γ)
2H reaction ........................................... 23
Figure 1. 18. Pictorial representation of 2H(n,γ)
3H reaction ........................................... 24
Figure 1. 19. CANDU fuel channel ............................................................................... 27
Figure 1. 20. Thermal conductivity behavior of gases considered for CANDU
annulus gap. .................................................................................................................. 28
Figure 2. 1. Fission product decay chain ....................................................................... 30
Figure 2. 2. Typical paths followed by fission neutrons from birth to absorption ........... 32
Figure 2. 3. Disposition of moderator and coolant around the fuel bundle ..................... 36
Figure 2. 4. Fuel channel modeled in MCNP ................................................................. 37
Figure 2. 5. 37- element fuel bundle arrangement.......................................................... 39
Figure 2. 6. Cross-sectional view of the fuel channel..................................................... 40
Figure 2. 7. Doppler broadening of 238
U resonances ...................................................... 42
Figure 2. 8. Schematic study of simulation .................................................................... 45

vii
Figure 2. 9. Neutrons crossing the surface of a sphere. .................................................. 47
Figure 3. 1. 2-D view of PTR fuel channel (Front view). .............................................. 56
Figure 3. 2. MCNP model of PTR fuel channel in (a) Angled view and
(b) Front view. ............................................................................................................... 58
Figure 3. 3. Neutron movement in UO2 element. ........................................................... 59
Figure 3. 4. Position of the neutron sources in the fuel bundle ....................................... 60
Figure 3. 5. Fission neutron energy distribution from 235
U thermal fission..................... 61
Figure 3. 6. PTR fuel channel simulation for single neutron sources placed in
(a) Central ring element, (b) Inner ring element, (c) Intermediate ring element and
(d) Outer ring element. .................................................................................................. 63
Figure 3. 7. PTR fuel channel simulation with multiple neutron source. ........................ 64
Figure 3. 8. PT SCWR fuel channel simulation for multiple neutron sources. ................ 65
Figure 4. 1(a). Neutron flux in PTR fuel channel annulus with single point source
from low energy to 2 MeV ............................................................................................. 67
Figure 4. 1(b). Neutron flux in PTR fuel channel annulus with single point sources
from 100 keV to 2 MeV ................................................................................................. 68
Figure 4. 2(a). Neutron flux in PTR fuel channel annulus with single line source
from low energy to 2 MeV ............................................................................................. 69
Figure 4. 2(b). Neutron flux in PTR fuel channel annulus with single line sources
from 100 keV to 2 MeV ................................................................................................. 69
Figure 4. 3 (a) Neutron flux in PTR fuel channel annulus gas with multiple sources
from low energy to 2 MeV ............................................................................................. 70
Figure 4. 3(b). Neutron flux in PTR fuel channel annulus gas with multiple neutron
sources from 100 keV to 2 MeV .................................................................................... 71
Figure 4. 4. Transmutation rates of annulus gas in PTR fuel channel for (a) Single
point, (b) Single line and (c) Multiple neutron sources. .................................................. 73
Figure 4. 5. Neutron absorption cross sections of different gases…. ........................... 754
Figure 4. 6. Transmutation rate, density and thermal conductivity trends of annulus
gas in PTR fuel channel at pressures (a) 0.4 MPa and (b) 1 MPa. ................................... 76

viii
Figure 4. 7. Transmutation rates, density and thermal conductivity trends of the annulus
gas in PT SCWR fuel channel at pressures (a) 1 MPa, (b) 5 MPa, (c) 10 MPa, (d) 15
MPa and (e) 25 MPa. ..................................................................................................... 82
Figure 4. 8. Transmutation rates, density and thermal conductivity trends of annulus gas
in PT SCWR fuel channel at temperatures (a) 100°C, (b) 200°C, (c) 300°C and
(d) 500°C. ...................................................................................................................... 87
Figure 4. 9. Neutron flux profile in annulus gas for PTR and PT SCWR
fuel channels.................................................................................................................. 88
Figure B. 1. Simulation for single line source placed in PTR fuel channel. .................... 99
Figure B. 2. PTR fuel channel simulation for multiple neutron sources at (a) 50%
histories and (b) 100 % histories run ............................................................................ 100
Figure B. 3. PT SCWR fuel channel simulation for single neutron sources placed in
(a) Central ring element, (b) Inner ring element, (c) Intermediate ring element and
(d) Outer ring element. ................................................................................................ 101
Figure B. 4. Neutron flux profile for single 1 MeV point neutron source in PTR
fuel channel ................................................................................................................. 102
Figure B. 5. Neutron flux profile for single 1 MeV line neutron source in PTR fuel
channel. ....................................................................................................................... 102
Figure B. 6. Neutron flux profile in for 1 MeV multiple neutron sources PTR fuel
channel. ....................................................................................................................... 103
Figure B. 7. Neutron flux profile for 1 MeV single line neutron sources in PT SCWR
fuel channel ................................................................................................................. 103
Figure B. 8. Neutron flux profile for 1 MeV multiple neutron source in PTR and PT
SCWR fuel channel. ................................................................................................... 104
Figure C. 1. Transmutation rates in PTR fuel channel annulus gas for 1 MeV
(a) Single point, (b) Single line and (c) Multiple neutron sources. ............................... 106
Figure C. 2. Transmutation rates in PT SCWR fuel channel with CO2 annulus for
(a) Single point and (b) Single line neutron sources. .................................................... 107
Figure C. 3. Transmutation rates in PT SCWR fuel channel annulus with multiple
point neutron sources at pressures (a) 10 MPa, (b) 15 MPa and (c) 25 MPa. ................ 109
ix
LIST OF TABLES
Table 1.1. Radiation sources in a CANDU reactor building ........................................... 25
Table 2.1. Moderating properties of different materials ................................................. 35
Table 2.2. Parameters of 37-element fuel bundle. .......................................................... 38
Table 2.3. Fuel channel geometry parameters ................................................................ 39
Table 2.4. Simulated conditions in PTR fuel channel. ................................................... 43
Table 2.5. Simulated conditions in PT-SCWR fuel channel. .......................................... 44
Table 2.6. Energy distributions for i energy groups ....................................................... 49
Table 3.1. MCNP 4a calculated mass fraction and atomic fraction of fuel channel
materials ........................................................................................................................ 58
Table 4.1. Ratios of integral transmutation rates in PTR and PT SCWR fuel channel
annulus .......................................................................................................................... 89

x
ABSTRACT
CANDU (CANada Deuterium Uranium) reactor utilizes Pressure Tube (PT) fuel channel
design and heavy water as a coolant. Fuel channel annulus gas acts as an insulator to
minimize heat losses from the coolant to the moderator. Since fuel bundles are
continuously under high neutron fluxes, annulus gas nuclides undergo different nuclear
transformations generating new composition of the gas that might have different physical
properties which are undesirable for the annulus system. In addition, gas nuclides become
radioactive and lead to an increase of the radioactive material inventory in the reactor and
consequently to an increase of radiation levels.
Pressure Tube Reactor (PTR) and Pressure Tube Supercritical Water Reactor (PT
SCWR) fuel channel models have been developed in Monte Carlo N-Particle (MCNP)
code. Neutron fluxes in the fuel channel annulus gas have been obtained by simulating
different types of neutron sources in both PTR and PT SCWR fuel channels.
Transmutation rates of annulus gases have been calculated for different gases (CO2, N2,
Ar and Kr) at different pressures and temperatures in both fuel channels. The variation of
the transmutation rates, neutron fluxes and gas densities in the annulus gas have been
investigated in PTR and PT SCWR fuel channels at constant pressures and different
temperatures. MCNP code along with NIST REFPROP [14] and other software tools
have been used to conduct the calculations.
Keywords: Annulus Gas, CANDU, CANDU SCWR, Fuel Channel, MCNP Code,
Neutron Flux, Pressure Tube Reactor, Supercritical Water Reactor, Transmutations,
Transmutation Rate.

xi
NOMENCLATURE
A Mass number
Z Atomic number
E Neutron energy, eV
Ei Average initial neutron energy, eV
Ef Average final neutron energy, eV
k Boltzmann constant, 8.62×10⁻⁵
eV/K
n Number of moles
n Number of neutrons
N Number of nuclides
N Nuclide density, atom/cm3
P Pressure, Pa
Pc Critical Pressure, Pa
V Volume of gas, cm3
Rrate Transmutation rate, s-1
Rsph Radius of sphere, cm
R Universal gas constant, 8.314 J mol-1
K-1
T Temperature, °C
Tc Critical Temperature, °C
Tk Temperature, °K
Greek symbols
α Alpha Radiations
β Beta Radiations
γ Gamma Radiations
ξ Lethargy
σa Microscopic neutron absorption cross section, cm2
σc Microscopic neutron capture cross section, cm2
σf Microscopic neutron fission cross section, cm2
xii
eff Effective absorption cross section, cm2
Φ Neutron flux, cm-2
s-1
∑ Macroscopic cross section, cm-1
∑a Macroscopic absorption cross section, cm-1
∑s Macroscopic scattering cross section, cm-1
ρ Density, g/cm3
ΔρT Temperature coefficient of reactivity, mk/°C
Abbreviations and Acronyms
AECL Atomic Energy of Canada Limited
AGS Annulus Gas System
Ar Argon
CANDU CANada Deuterium Uranium Reactor
CANDU SCWR CANDU SuperCritical Water Reactor
CANFLEX CANDU FLEXible fuelling
CO2 Carbon dioxide
CNSC Canadian Nuclear Safety Commission
CT Calandria Tube
KAERI Korean Atomic Energy Research Institute
Kr Krypton
MCNP Monte Carlo N- Particle
MOX Mixed OXide fuel
N2 Nitrogen
NIST National Institute of Standards and Technology
NPD Nuclear Power Demonstration Reactor
REFPORP Reference Fluid Thermodynamic and Transport Properties
PNGS Pickering Nuclear Generating Station
PTR Pressure Tube Reactors
PT SCWR Pressure Tube Supercritical Water Reactors
PT Pressure Tube
US DOE U.S. Department of Energy

xiii
INTRODUCTION
In a CANDU reactor several hundred (380 in CANDU-6 and 480 in CANDU-9) fuel
channels are contained and supported in a horizontal cylindrical tank known as the
Calandria Tube (CT). The calandria is filled with heavy water moderator at low
temperature (~ 90°C) and pressure (atmospheric pressure). Each fuel channel contains a
zirconium-niobium alloy PT and a zirconium CT. Each PT is thermally insulated from
the cool, low pressure moderator, by CO2 filled gas annulus formed between the PT and
the concentric CT. Under normal operating conditions the coolant pressure and
temperature in PTR is 10 MPa and 310°C. Each fuel channel contains and supports 12
fuel bundles in the reactor core. Heat losses from the coolant are minimized by the
annulus gas which also enables leaks from the PT or CT to be detected by any increases
in humidity of the annulus gas [1].
The Annulus Gas System (AGS) provides a monitored continuous flow of the controlled
low pressure gas to the annular space between the PT and the CT. Gases having low
thermal conductivities are well suited to minimize the heat losses, but presence of high
radiation fluxes in the reactor core could cause change in properties of the gases. These
radiation fields are mainly high neutron fluxes that are present in any operational nuclear
reactors. These neutrons are absorbed in the annulus gas and produce radioactive
nuclides. This casts an uncertainty whether these new nuclides would have lower or
higher thermal conductivity than its parent gas. Therefore, selection of suitable annulus
gas is based on the assessment of several properties, mainly thermal conductivity,
transmutation rate and chemical inertness.
Neutrons in the annulus gap are due to fission neutrons exiting the fuel channel, and
thermal neutrons that are entering the channel after being moderated. The energy of
neutrons entering the fuel channel is in thermal energy range (~0.025eV) whereas
energies of the neutrons leaving the channel are distributed in a large span of energies
(along the energy spectrum). Since, different coolants are being used in CANDU and
CANDU SCWR; they would have an effect on the neutron flux distribution in both the
xiv
systems. Therefore, determination of the neutron flux spectrum is a critical factor in
calculating the transmutation rate of the annulus gas.
Historically, the gases used in CANDU fuel channel annulus were air or N2, both of
which produced corrosive compounds. These compounds gradually cut through the
metallic components of the fuel channel. Later on N2 and air were replaced by CO2
which is being currently used in all the CANDU reactors. CO2 possess superior insulator
properties but there are issues associated with it such as production of organic
compounds. CO2 also produces the radioactive carbon, 14
C nuclide, which has a half life
of 5740 years.
The first prototype CANDU reactor called “NPD Reactor”. NPD (Nuclear Power
Demonstration) Nuclear Generating Station and Douglas Point Nuclear Generating
Station have both used air as annulus gas. The annulus gap was maintained at a slightly
negative pressure with respect to the atmosphere resulting in some air in-leakage.
Problems faced were buildup of high radiation fields in the annulus from 41
Ar and
corrosive environment due to O2, N2 and water vapor presence. Pickering Unit A uses N2
annulus gas, which prevents corrosion and radiation problems as faced with air. It also
has no problem of radiation fields from 41
Ar as no air circulates inside the core. However,
the radioactive 14
C isotope is produced and it is a problem to be dealt with because of its
radioactivity and long half life. Reactors built after Pickering unit A are all based upon
the CO2 gas annulus instead of N2.
The main reasons for switching from N2 to CO2 annulus were:
(1) less corrosive nature of the CO2 gas than N2 in a wet annulus and,
(2) less relative production of 14
C by CO2 [2].
However, CO2 produces organic compounds that cause blockage/clogging of internal
pores and interferes with the dew point measurements. This could be minimized by using
other gases that have chemically inert behavior such as Ar, Kr and He. These gases also
offer improved insulation than CO2. One of the required characteristic of an annulus gas

xv
is the low production of radioactive materials. This depends on the transmutation rate of
an annulus gas in the fuel channel.
Due to the complexity and difficulties to conduct an experimental study of the
transmutation rates occurring in the annulus, we have used computational capabilities of
the MCNP Code to investigate neutron transport in the fuel channel. Thus, models have
been developed for PTR and PT SCWR fuel channels containing 37 element fuel bundle.
Thermal hydraulic data of coolants and annulus gases at different conditions have been
incorporated in the simulation. Single and multiple neutron sources have been used in the
fuel bundle to carry out the simulation.
The main objective of this thesis is to investigate the transmutation rates occurring in the
annulus gas of PTR and future PT SCWR fuel channel models under CANDU fuel
channel conditions. The study has been conducted for different annulus gases and with
different neutron sources. The investigation has used MCNP 4a codes of PTR and PT
SCWR fuel channels containing a 37-element fuel bundle. Neutron transport simulations
have been carried out by determining the neutron flux profiles in wide neutron energy
spectra in the annulus gases. Then, the transmutation rates have been calculated for CO2,
N2, Ar and Kr annulus gases under different pressure and temperatures conditions.
The thesis contains an introduction and four chapters and ends with a conclusion, list of
references and appendixes. Few words on future work are also presented.
Chapter 1 presents a general background on CANDU reactors and AGS of the fuel
channel. Past experiences with different gases in earlier CANDU reactors have also been
discussed. Chapter 2 describes the approach and explains the theoretical processes
relating to the neutron transport and interactions. It also elaborates the methodology used
in the simulation along with the calculation of transmutation rate. Chapter 3 describes the
features of the Monte Carlo simulation and details the model being built for the
simulation. Illustrations of the PTR and PT SCWR fuel channels developed in the code
have been illustrated with neutron sources in the same chapter. Chapter 4 presents the

xvi
results of the simulations, their analysis and discussion. Finally, the thesis findings have
been summarized in a conclusion and a brief scope for the future work has been
addressed.

1
CHAPTER 1
BACKGROUND ON PRESSURE TUBE REACTORS
CANDU nuclear reactor is a pressurized heavy-water reactor (HWR) that has been
operated successfully around the world and is being built in several countries today.
CANDU reactors are characterized by their natural uranium fuel in the form of Uranium
dioxide (UO2) and heavy water (D2O) moderator. Requirements related to these design
choices resulted in a PTR with on power fuelling: a reactor that is neutron efficient (high
neutron economy), with a well-thermalized neutron spectrum. All the nuclear reactors
being operated currently around the world have coolant under subcritical pressures and
temperatures. Coal and gas fired power plants have been long operated at supercritical
coolant pressures and temperatures. Operating a power plant with coolant at supercritical
condition improves the thermal efficiency to about 40-45% from existing value of
30-33%. However, operating a nuclear reactor in supercritical coolant conditions would
require major modifications to the existing fuel channels in the CANDU reactors.
CANDU SCWRs are one of the Generation IV reactors (currently in their early stage of
development) conceptually similar with improved design features to accommodate the
supercritical coolant conditions. To better understand the CANDU and CANDU SCWR,
their physical and operating characteristics are given in the following sections.
1.1. Description of CANDU Reactor
CANDU reactor is a heavy water based reactor with a pressure tube design concept rather
than pressure vessel used by light water reactors. The use of multiple horizontal fuel
channels is a distinguishing feature of CANDU reactors [1]. Each of the fuel channels
consists of a Zr-2.5 Nb alloy PT that contains fuel bundles. Heavy water coolant (at
310°C and 10 MPa) flows through the PT which is contained in an external concentric
Zircalloy-2 CT . Heavy-water moderator is present outside the CTs. The gap between the
2
PT and the CT is maintained by an insulating annulus gas such as CO2. The gas in the
annulus is the only isolating medium to prevent the heat flow from the high pressure
coolant in the PT to the moderator. The heat loss to the moderator results in less heat
being carried to the steam generators which adversely affects the steam formation,
resulting in a loss of heat efficiency. The Annulus Gas System (AGS) ensures that there is
an efficient insulation (thermal barrier) provided to the coolant as it carries away the heat
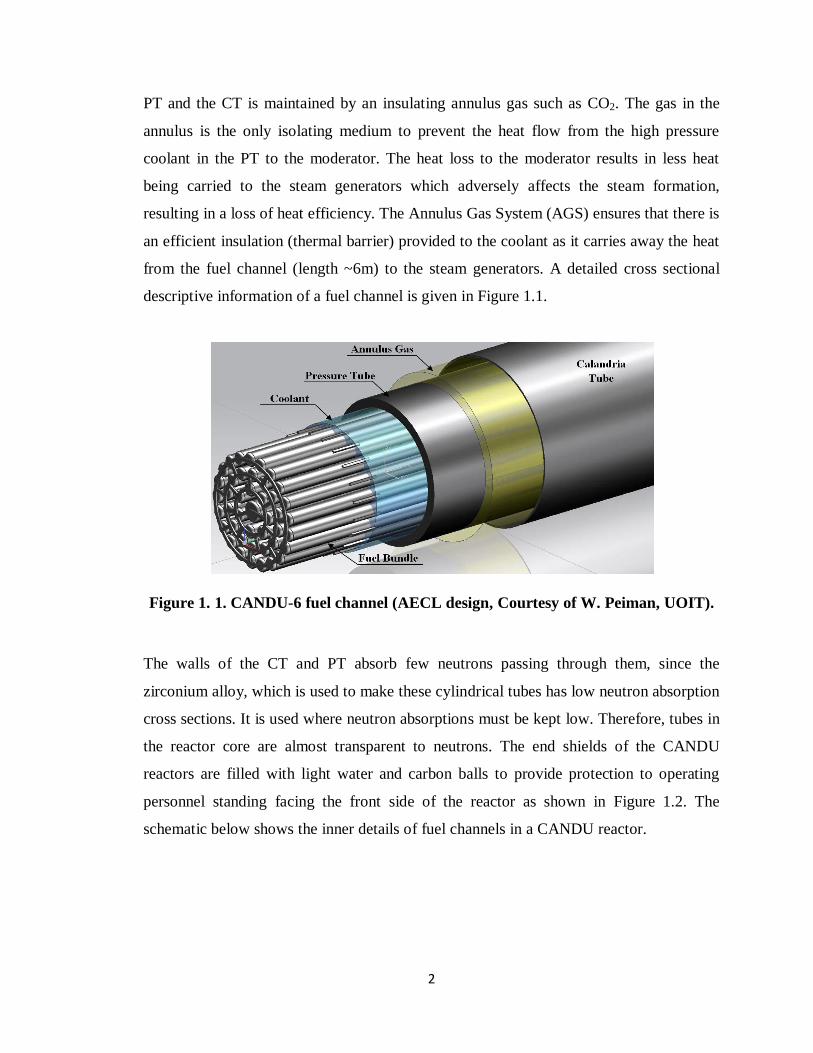
from the fuel channel (length ~6m) to the steam generators. A detailed cross sectional
descriptive information of a fuel channel is given in Figure 1.1.
Figure 1. 1. CANDU-6 fuel channel (AECL design, Courtesy of W. Peiman, UOIT).
The walls of the CT and PT absorb few neutrons passing through them, since the
zirconium alloy, which is used to make these cylindrical tubes has low neutron absorption
cross sections. It is used where neutron absorptions must be kept low. Therefore, tubes in
the reactor core are almost transparent to neutrons. The end shields of the CANDU
reactors are filled with light water and carbon balls to provide protection to operating
personnel standing facing the front side of the reactor as shown in Figure 1.2. The
schematic below shows the inner details of fuel channels in a CANDU reactor.

3
Figure 1. 2. Side view of the CANDU Reactor [3].

4
1.2. CANDU Supercritical Water Reactor (CANDU SCWR)
CANDU Super-critical Water-Cooled Reactor (SCWR) operates above the
thermodynamic critical point of water (Tc=375°C, Pc=22 MPa). Currently, it is one of the
six reactor concepts being considered by the Generation-IV International Forum (GIF) for
international collaborative research and development. It is considered as one of the most
promising Generation IV reactors because of its simplicity, high thermal efficiency, and
nearly fifty years of industrial experience from thermal-power stations with a SCW cycle
[4].
Supercritical water (SCW) nuclear power plants (NPPs) offer an increased thermal
efficiency, ~ 45–50%, compared to the current generation nuclear plants (30–35%).
AECL has considered CANDU design as the basis for designing its SCWR. The current
Canadian SCWR concept includes a fuel channel comprised of a fuel bundle, liner tube,
ceramic layer and PT insulated internally, which would enable the pressure tube to
operate at temperatures close to that of the moderator [5]. The outer surface of the PT will
be in direct physical contact with the moderator, while the inner surface of the PT is
covered with a ceramic layer to protect the PT from exposure to high-temperature
coolant. In addition, a perforated metal liner covers and protects the insulator from
damage during fuelling and/or refueling and from erosion by the coolant flow as shown
in Figure 1.3 [7].

5
Figure 1. 3. Current Canadian SCWR fuel channel concept [5].
It is the change in physical properties such as thermal conductivity, density, viscosity; of
fluids at supercritical conditions that demands the modification of current CANDU fuel
channel design. The behavior of water at below and above supercritical pressures and
temperatures is discussed in detail in the sub section below.
1.2.1. Supercritical Water and Fluid properties
At supercritical conditions, the thermal–physical properties of water vary strongly across
the pseudo-critical line [6]. The variation of physical properties of water with temperature
at supercritical pressure conditions is shown in Figure1.4. For specific heat Cp, a
maximum peak of 80 kJ/kg.K is obtained at the pseudo-critical temperature of 375°C for
constant pressure of 25 MPa. With further increase in temperature, the peak drops down
gradually and becomes constant at ~10 kJ/kg.K. It also shows the water density variation
with temperature at constant pressure of 25 MPa. The water density decreases as the
temperature increases, and a maximum density gradient is obtained in the vicinity of the
pseudo-critical line where the specific heat is maximum. The coolant density will drop by
more than a factor of nine from inlet to outlet of a CANDU-SCWR core [6].

6
Temperature, oC
250 300 350 400 450 500 550 600
Density,
kg/m
3
0
100
200
300
400
500
600
700
800
900
1000
Cp, kJ/k
g-K
0
25
50
75
100
125
150
175
200
Therm
al C
onductivity,
W/m
-K
0.0
0.1
0.2
0.3
0.4
0.5
0.6
0.7
Vis
cosity,
P
a-s
20
30
40
50
60
70
80
90
100
110
120
130
140
Density
Specific Heat
Thermal Conductivity
Viscosity
Water, P= 25 MPa
Tc=
375
oC
Figure 1. 4. Variation of properties of light water at critical pressure with
temperature.
The light water density affects the moderation and the absorption (in CANDU), which
will then influence the fission power distribution. The power distribution, in turn, affects
the coolant and moderator density profiles in core. The flux spectrum would also be
affected as the fuel being used is 4% enriched. Also the thermal conductivity drops down
in the pseudo critical region due to drop in the density. Several fuel channel
configurations have been proposed for the CANDU SCWR one of which has been briefly
described in the following section.
1.2.2. Proposed CANDU SCWR Fuel Channel
The role played by each of the fuel channel component dictates which material should be
used. The PT should be strong enough to sustain the 25 MPa pressure coolant flows, so its
material must have high strength to contain the coolant under such extreme environment.
The insulator in SCWR must have high thermal and corrosion resistance, plus high tensile
7
strength to bear the weight of the fuel bundles without any significant thickness reduction
during its design life. The perforated liner and the fuel sheaths must have high corrosion
resistance in SCW, although their resident times are significantly different. The fuel
sheaths must be able to withstand the pressure differences between the coolant and fuel
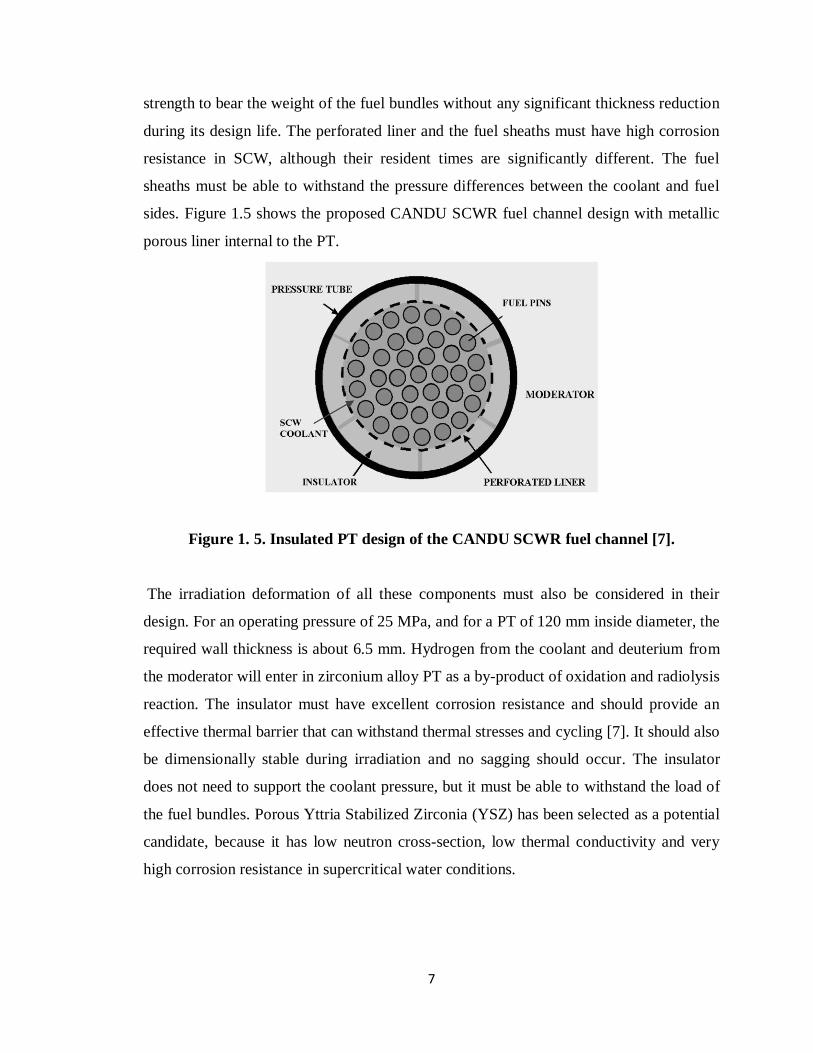
sides. Figure 1.5 shows the proposed CANDU SCWR fuel channel design with metallic
porous liner internal to the PT.
Figure 1. 5. Insulated PT design of the CANDU SCWR fuel channel [7].
The irradiation deformation of all these components must also be considered in their
design. For an operating pressure of 25 MPa, and for a PT of 120 mm inside diameter, the
required wall thickness is about 6.5 mm. Hydrogen from the coolant and deuterium from
the moderator will enter in zirconium alloy PT as a by-product of oxidation and radiolysis
reaction. The insulator must have excellent corrosion resistance and should provide an
effective thermal barrier that can withstand thermal stresses and cycling [7]. It should also
be dimensionally stable during irradiation and no sagging should occur. The insulator
does not need to support the coolant pressure, but it must be able to withstand the load of
the fuel bundles. Porous Yttria Stabilized Zirconia (YSZ) has been selected as a potential
candidate, because it has low neutron cross-section, low thermal conductivity and very
high corrosion resistance in supercritical water conditions.

8
1.3. Annulus Gas System (AGS)
Annulus gas flows through the fuel channel annulus, to an outlet header and then to the
compressors. These compressors provide the force needed to circulate the gas to the inlet
header and back through the system. Circulation of the gas is very important to monitor
the dew point readings and gas sampling represents all of the annuli. Fuel bundle
configuration in the channel is shown in Figure 1.6.
Figure 1. 6. Configuration of bundles in the fuel channel
[8].
The main operating requirements of the AGS are:
(a) To prevent corrosion of coolant tubes, CTs and other components, by maintaining
a low dew point, by drying the gas and periodically purging the system.
(b) To maintain low radiation fields in the gas system, by periodically purging the
system.

9
While desired gas characteristics for annulus gas are:
(a) Low thermal conductivity (Good Thermal Insulator),
(b) Low tendency to promote corrosion,
(c) Low production of radioactive nuclides.
AGS has been worked on for last several decades to improve the thermal efficiency of
CANDU and to reduce transmutations occurring in the gases. Several new concepts have
been utilized with the AGS such as detection of “leak before break”.
1.3.1. Purpose of AGS
AGS provides means for D2O leak detection from PT/CT into the annulus, for assessing
the leak rate, for identifying the leak source, and for locating the leak with a minimum of
radiation exposure to personnel. It also minimizes the hazards to the operating personnel
from CO2 and radioactive isotopes 14
C and 41
Ar which will be normally produced in the
channel annuli. The AGS maintains a hydrogen/deuterium level below 0.1% by volume in
the annulus gas to minimize hydrogen pickup by the PTs. The pressure in the annuli is
maintained at or above atmospheric pressure under normal operating conditions. This
protects the CTs from collapsing and prevents ingress of air into the system. Over
pressure protection is provided to protect the system if there is a pressure regulation
failure and to limit damage if a PT fails.

10
1.3.2. Physical Description of AGS
CO2 flows through the channel annuli in the PT assemblies via 44 parallel flow paths.
Figure 1.7 shows the overall AGS in CANDU. The 44 parallel paths contain from 3 to 11
channel annuli in series. Each inlet tube contains a rotameter with an integral outlet
needle valve which is adjusted to allow equal flow through each of the 44 lines. When
there is a blockage in an annulus, the corresponding rotameter indicates lower value than
normal flow.
Figure 1. 7. Simplified annulus gas system [9].

11
Figure 1. 8. Annulus gas channel flow system [9].
The 380 channels in the reactor core are arranged in a lattice with 22 vertical rows
containing from 6 to 22 channels per row. The channel annuli are connected in a series-
parallel arrangement as shown in Figure 1.8. In each vertical row, alternate channel annuli
are connected in series. Each row has two inlet connections in parallel, running to the top
two channel annuli and two outlet connections in parallel, running from the bottom two
channel annuli. All 44 outlet tubes from the channels are connected to two leakage
indicators. A drain connection is provided on the bottom and a vent connection is
provided on one end. The indicators are mounted with a slope to facilitate drainage. All
the liquid is drained by gravity to a drain header where two moisture beetles alarm on the
12
presence of moisture. A normally closed valve separates the drain header from the drain
tank.
The drain tank consists of 6l stainless steel tank mounted vertically and provided with a
level transmitter. The tank is used to measure the rate of collection of heavy water (D2O)
with time as an indication of the leak rate. The vent lines from the leakage flow indicators
are connected to a common vent line which leads to a gas-to-air heat exchanger. The heat
exchanger cools the annulus gas flow to prevent overheating of the concrete at the vault
penetration. The gas return piping contains a filter to remove debris in the system that
may cause reduced compressor performance. Downstream of the filter are the flow,
pressure and temperature monitoring instrumentation. A sampling station, with cold
finger, is provided to obtain moisture and gas samples for chemical analysis. The return
piping also contains two on-line dew point hygrometers in parallel for monitoring the dew
point of the re circulating gas.
1.3.3. Evolution of AGS’s
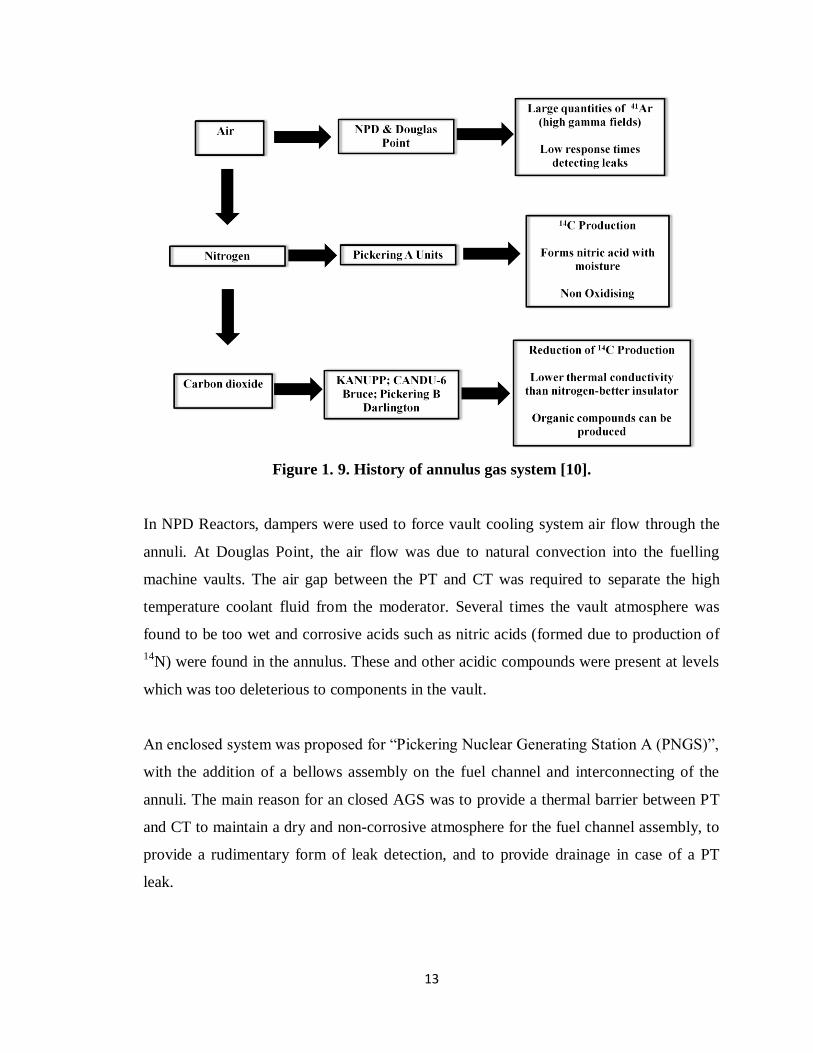
Current AGS are highly complex systems with stringent performance requirements as
compared to previous systems. An overview of past gases used in with their
disadvantages is shown in Figure 1.9.
13
Figure 1. 9. History of annulus gas system [10].
In NPD Reactors, dampers were used to force vault cooling system air flow through the
annuli. At Douglas Point, the air flow was due to natural convection into the fuelling
machine vaults. The air gap between the PT and CT was required to separate the high
temperature coolant fluid from the moderator. Several times the vault atmosphere was
found to be too wet and corrosive acids such as nitric acids (formed due to production of
14N) were found in the annulus. These and other acidic compounds were present at levels
which was too deleterious to components in the vault.
An enclosed system was proposed for “Pickering Nuclear Generating Station A (PNGS)”,
with the addition of a bellows assembly on the fuel channel and interconnecting of the
annuli. The main reason for an closed AGS was to provide a thermal barrier between PT
and CT to maintain a dry and non-corrosive atmosphere for the fuel channel assembly, to
provide a rudimentary form of leak detection, and to provide drainage in case of a PT
leak.
14
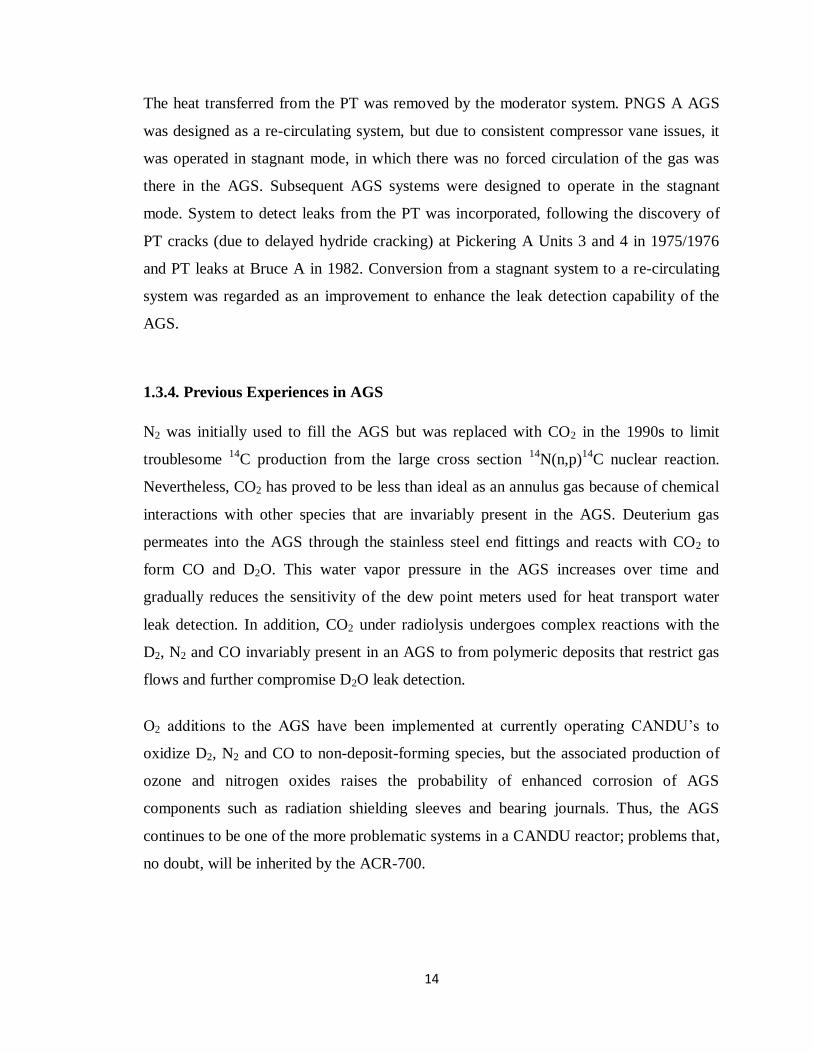
The heat transferred from the PT was removed by the moderator system. PNGS A AGS
was designed as a re-circulating system, but due to consistent compressor vane issues, it
was operated in stagnant mode, in which there was no forced circulation of the gas was
there in the AGS. Subsequent AGS systems were designed to operate in the stagnant
mode. System to detect leaks from the PT was incorporated, following the discovery of
PT cracks (due to delayed hydride cracking) at Pickering A Units 3 and 4 in 1975/1976
and PT leaks at Bruce A in 1982. Conversion from a stagnant system to a re-circulating
system was regarded as an improvement to enhance the leak detection capability of the
AGS. An
1.3.4. Previous Experiences in AGS
N2 was initially used to fill the AGS but was replaced with CO2 in the 1990s to limit
troublesome 14
C production from the large cross section 14
N(n,p)14
C nuclear reaction.
Nevertheless, CO2 has proved to be less than ideal as an annulus gas because of chemical
interactions with other species that are invariably present in the AGS. Deuterium gas
permeates into the AGS through the stainless steel end fittings and reacts with CO2 to
form CO and D2O. This water vapor pressure in the AGS increases over time and
gradually reduces the sensitivity of the dew point meters used for heat transport water
leak detection. In addition, CO2 under radiolysis undergoes complex reactions with the
D2, N2 and CO invariably present in an AGS to from polymeric deposits that restrict gas
flows and further compromise D2O leak detection.
O2 additions to the AGS have been implemented at currently operating CANDU’s to
oxidize D2, N2 and CO to non-deposit-forming species, but the associated production of
ozone and nitrogen oxides raises the probability of enhanced corrosion of AGS
components such as radiation shielding sleeves and bearing journals. Thus, the AGS
continues to be one of the more problematic systems in a CANDU reactor; problems that,
no doubt, will be inherited by the ACR-700.
15
Considering thermal conductivity, corrosion and transmutations which are the most
common issues affecting the performance of these gases, we are analyzing the behavior of
CO2 and N2 which are commonly used with comparison to noble gases such as Ar, Kr.
Thermal conductivity is also a main contributing factor, since low thermal conductivity
reduces heat loss. Several inert gases have better thermal properties than CO2, but their
behavior under intense neutron flux environment needs to be found to arrive at a
conclusion regarding their feasibility into the AGS.
1.4. Issues with CO2 Annulus Gas
CO2 is far better than the gases that have been used in the first CANDU reactors in the
past. The problems with use of air, N2, based annuli have been lessened and the effects
have been mitigated but still other issues such as chemical reactivity and polymer
formation exist.
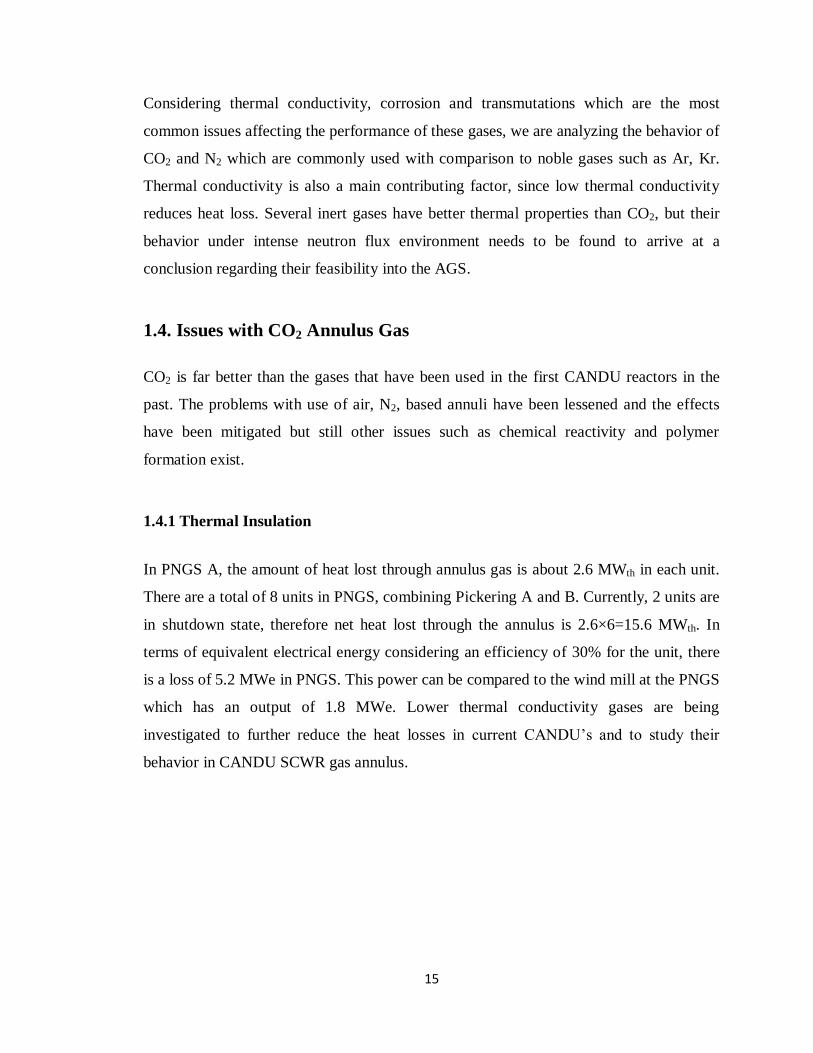
1.4.1 Thermal Insulation
In PNGS A, the amount of heat lost through annulus gas is about 2.6 MWth in each unit.
There are a total of 8 units in PNGS, combining Pickering A and B. Currently, 2 units are
in shutdown state, therefore net heat lost through the annulus is 2.6×6=15.6 MWth. In
terms of equivalent electrical energy considering an efficiency of 30% for the unit, there
is a loss of 5.2 MWe in PNGS. This power can be compared to the wind mill at the PNGS
which has an output of 1.8 MWe. Lower thermal conductivity gases are being
investigated to further reduce the heat losses in current CANDU’s and to study their
behavior in CANDU SCWR gas annulus.
16
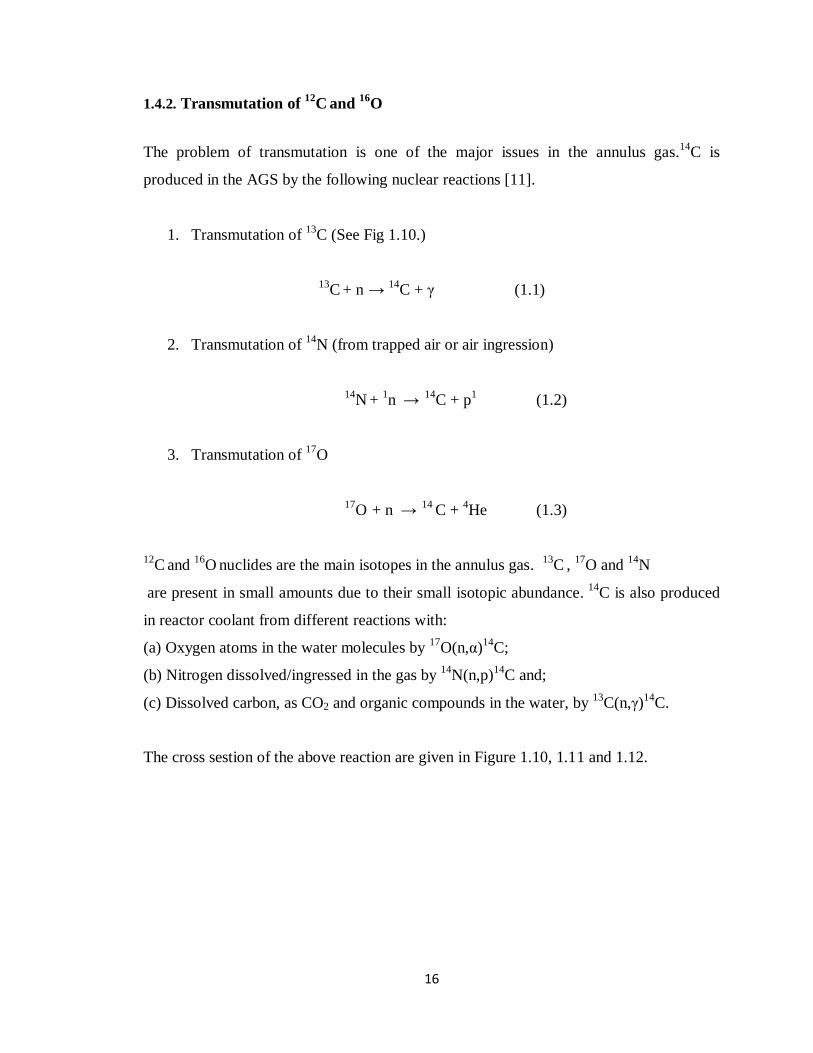
1.4.2. Transmutation of 12
C and
16O
The problem of transmutation is one of the major issues in the annulus gas.14
C is
produced in the AGS by the following nuclear reactions [11].
1. Transmutation of 13
C (See Fig 1.10.)
13C
+ n
→
14C + γ (1.1)
2. Transmutation of 14
N (from trapped air or air ingression)
14N
+
1n
→
14C + p
1 (1.2)
3. Transmutation of 17
O
17O
+ n
→
14 C +
4He (1.3)
12C
and
16O
nuclides are the main isotopes in the annulus gas.
13C
,
17O and
14N
are present in small amounts due to their small isotopic abundance. 14
C is also produced
in reactor coolant from different reactions with:
(a) Oxygen atoms in the water molecules by 17
O(n,α)14
C;
(b) Nitrogen dissolved/ingressed in the gas by 14
N(n,p)14
C and;
(c) Dissolved carbon, as CO2 and organic compounds in the water, by 13
C(n,γ)14
C.
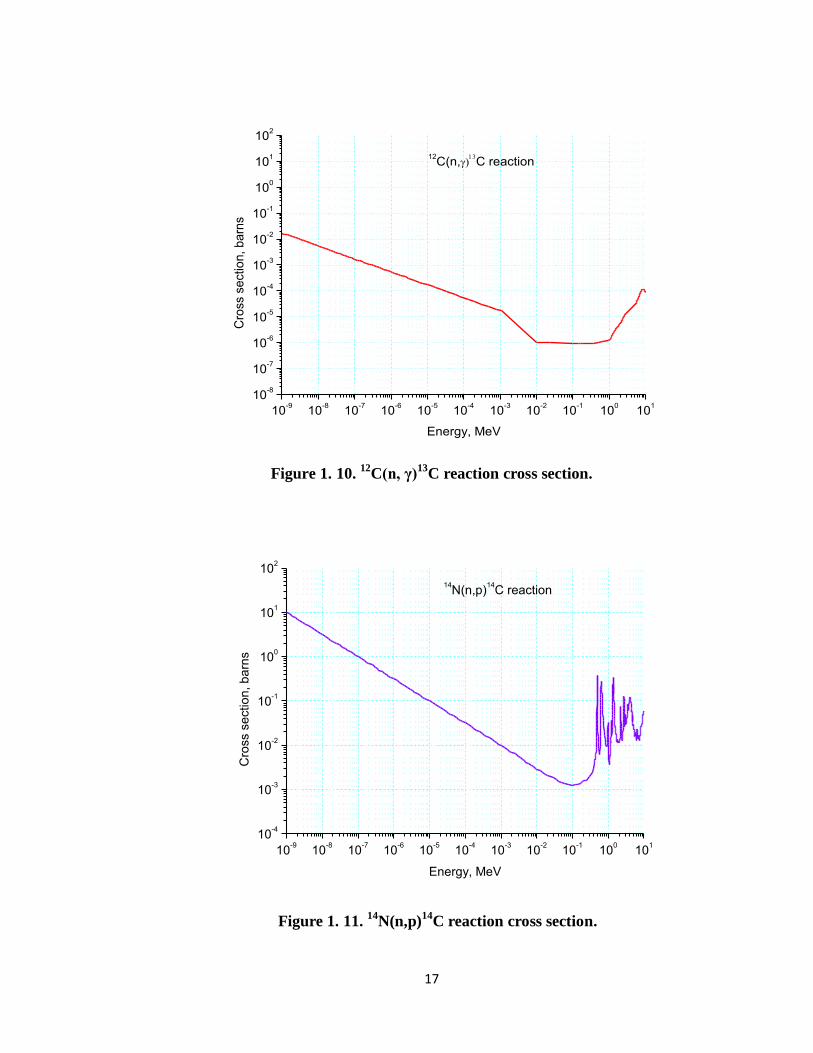
The cross sestion of the above reaction are given in Figure 1.10, 1.11 and 1.12.
17
10-9
10-8
10-7
10-6
10-5
10-4
10-3
10-2
10-1
100
101
10-8
10-7
10-6
10-5
10-4
10-3
10-2
10-1
100
101
102
Cro
ss s
ectio
n, b
arn
s
Energy, MeV
12C(n,
C reaction
Figure 1. 10. 12
C(n, γ)13
C reaction cross section.
10-9
10-8
10-7
10-6
10-5
10-4
10-3
10-2
10-1
100
101
10-4
10-3
10-2
10-1
100
101
102
Cro
ss s
ectio
n, b
arn
s
Energy, MeV
14N(n,p)
14C reaction
Figure 1. 11. 14
N(n,p)14
C reaction cross section.
18
10-9
10-8
10-7
10-6
10-5
10-4
10-3
10-2
10-1
100
101
10-5
10-4
10-3
10-2
10-1
100
101
102
Cro
ss s
ectio
n, b
arn
s
Energy, MeV
17O(n,)
14C reaction
Figure 1. 12. 17
O(n,α)14
C reaction cross section.
The presence of 14
C requires special radiological protection whenever maintenance is
carried out on the system. Personnel protective equipment used in maintenance includes:
1. A personal air sampler for assessment of dose
2. An air supplied plastic suit
41Ar can become a hazard in the system if air in-leakage or low purity CO2 is used in the
AGS. Fixed area gamma monitors are employed to warn the reactor personnel of high or
increasing radiation fields.

19
1.4.3. Formation of Organic Compounds
The second problem faced with CO2 annulus is the formation of organic compounds.
During normal operation of CANDU, D2 gets dissociated from O2 due to radiolysis and
begins to slowly enter the annulus gas (diffusion through the stainless steel end fittings)
as shown in Figure 1.13. D2 then reacts with CO2 forming D2O. This reaction when
occurring for a sustained period of time would result in a gradual increase in system dew
point over time. Figure 1.14 shows a plot for variation of dew point with CO production.
Equation (1.4) shows the reaction producing D2O in the annulus. This formation of D2O
and CO is not favored. Thus, the water vapor pressure in the AGS increases over time and
gradually reduces the sensitivity of the dew point meters used for coolant leak detection.
This will result in some deuterium remaining in the gas (equilibrium D2).
D2 + CO2 → D2O + CO (1.4)
3D2 + CO → D2O + CD4 (1.5)
CD4 = Methyl compound that is the precursor to deposit formation
With CO production in the AGS, several organic compounds are produced that restrict
and cause blockages. Equation (1.4), (1.5) shows the chemical reaction that yields these
organic deposits. These organics are in the form of polymers which are very sticky or tary
in texture. In addition, CO2 under radiolysis undergoes complex reactions with the D2, N2
and CO invariably present in an AGS to form polymeric deposits that restrict gas flows
and further compromise coolant leak detection. The chemical reactivity of the CO2 is the
main concern which results in the production of several higher organic polymer
compounds.
20
Organic deposits have been found at Gentilly 2 and at PNGS. Deposit formation in the
AGS has resulted in blockage of pigtails at Bruce A NGS.
Figure 1. 13. PT hydrogen ingress [10].
21
Figure 1. 14. Variation of system dew point with carbon monoxide production [10].
22
1.5. Transmutation in Annulus Gas
Transmutations are caused by highly penetrating nuclear radiations: neutrons. After
absorption of a neutron it becomes a new nuclide, which could undergo further
transformation to form new elements. Neutrons are charge less and can penetrate through
concrete walls and lead shielding. Materials containing light nuclide compounds such as
Water, and Carbon composites are effective in stopping neutrons.
A nucleus may absorb a neutron forming a compound nucleus, which then de-energizes
by emitting uncharged radiations or charged particle, either a proton or an alpha particle.
This produces a nucleus of a different element. Such a reaction transforms one nuclide
into another and is called transmutation. Among neutron reactions and transformations
occurring in CANDU reactors are:
Neutron-Proton Reaction (n, p)
16O captures a neutron and emits a proton to form
16N. Figure 1.15 represents the
16O(n,p)
16N reaction.
Figure 1. 15. Pictorial representation of 16
O(n,p)16
N reaction (Courtesy of CNSC)
The product 16
N, is radioactive with a half-life of 7.1 seconds, is the product of a
transmutation reaction. 16
N is a beta emitter, but more importantly, it emits high-energy
gamma rays.
23
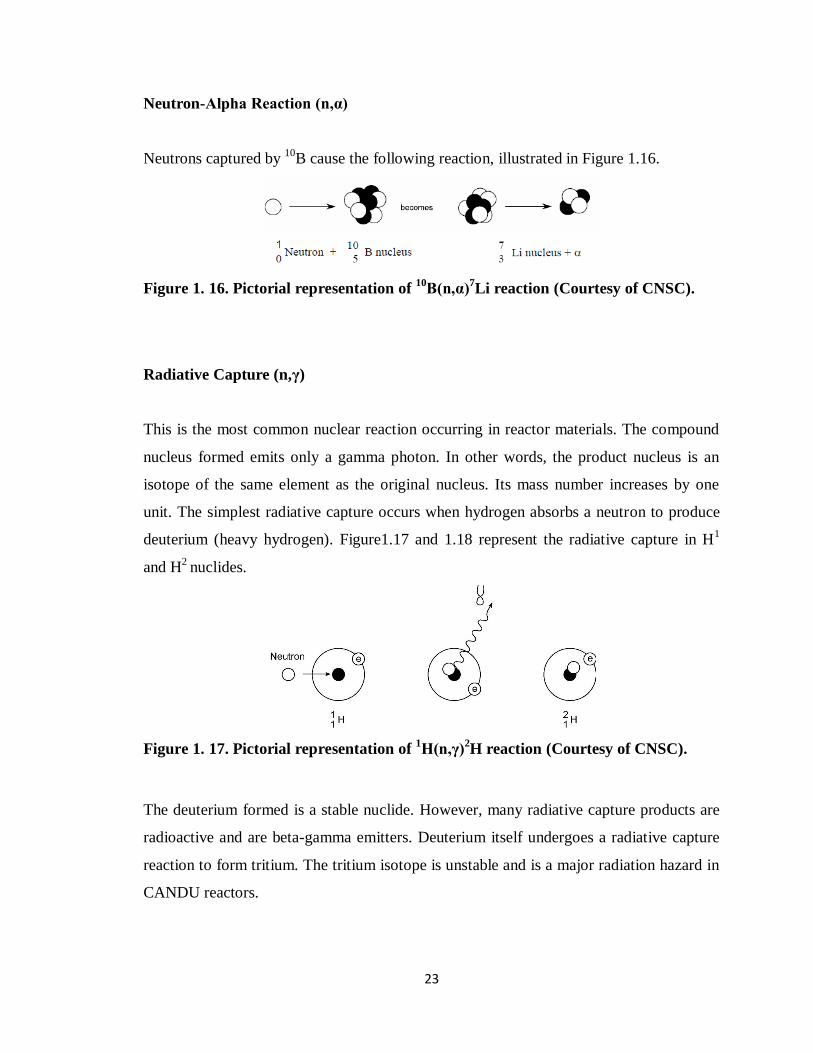
Neutron-Alpha Reaction (n,α)
Neutrons captured by 10
B cause the following reaction, illustrated in Figure 1.16.
Figure 1. 16. Pictorial representation of 10
B(n,α)7Li reaction (Courtesy of CNSC).
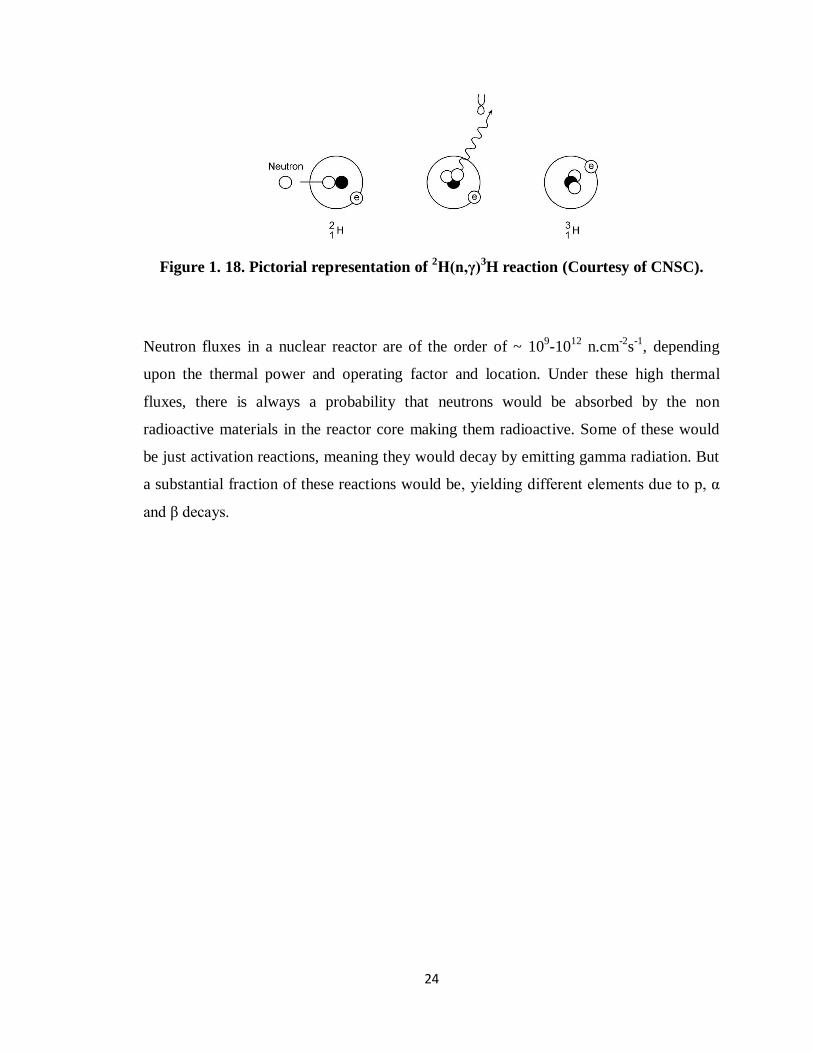
Radiative Capture (n,γ)
This is the most common nuclear reaction occurring in reactor materials. The compound
nucleus formed emits only a gamma photon. In other words, the product nucleus is an
isotope of the same element as the original nucleus. Its mass number increases by one
unit. The simplest radiative capture occurs when hydrogen absorbs a neutron to produce
deuterium (heavy hydrogen). Figure1.17 and 1.18 represent the radiative capture in H1
and H2
nuclides.
Figure 1. 17. Pictorial representation of 1H(n,γ)
2H reaction (Courtesy of CNSC).
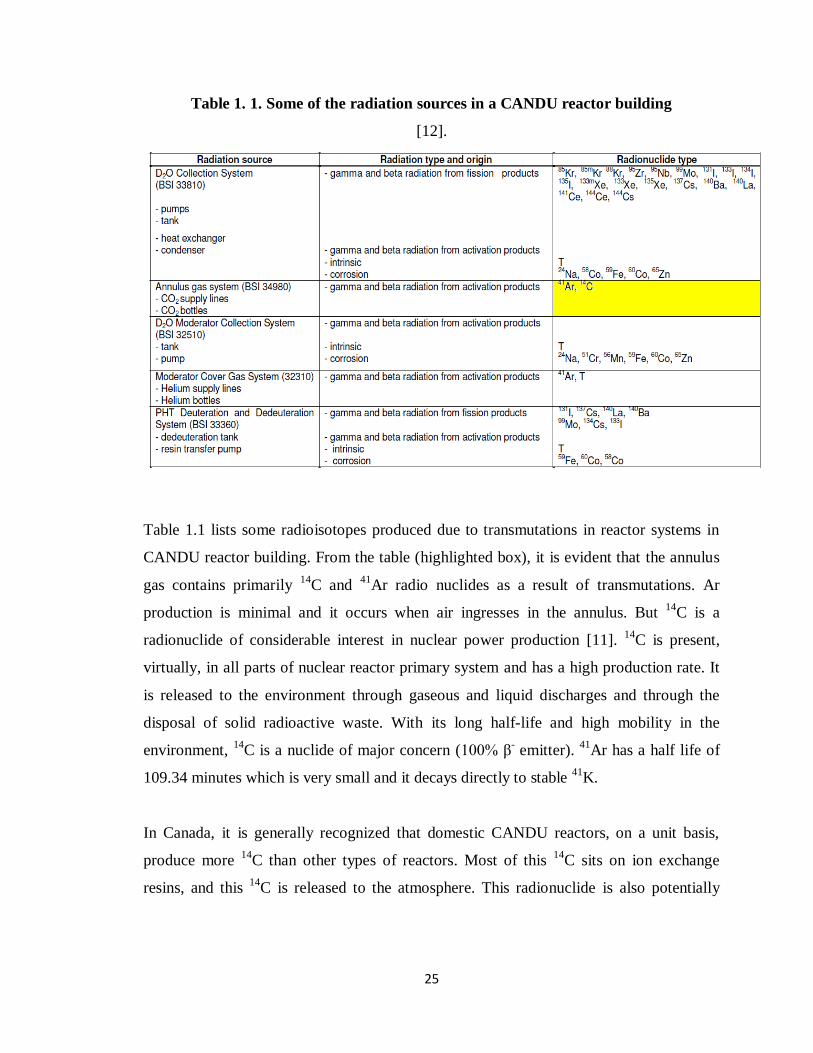
The deuterium formed is a stable nuclide. However, many radiative capture products are
radioactive and are beta-gamma emitters. Deuterium itself undergoes a radiative capture
reaction to form tritium. The tritium isotope is unstable and is a major radiation hazard in
CANDU reactors.
24
Figure 1. 18. Pictorial representation of 2H(n,γ)
3H reaction (Courtesy of CNSC).
Neutron fluxes in a nuclear reactor are of the order of ~ 109-10
12 n.cm
-2s
-1, depending
upon the thermal power and operating factor and location. Under these high thermal
fluxes, there is always a probability that neutrons would be absorbed by the non
radioactive materials in the reactor core making them radioactive. Some of these would
be just activation reactions, meaning they would decay by emitting gamma radiation. But
a substantial fraction of these reactions would be, yielding different elements due to p, α
and β decays.
25
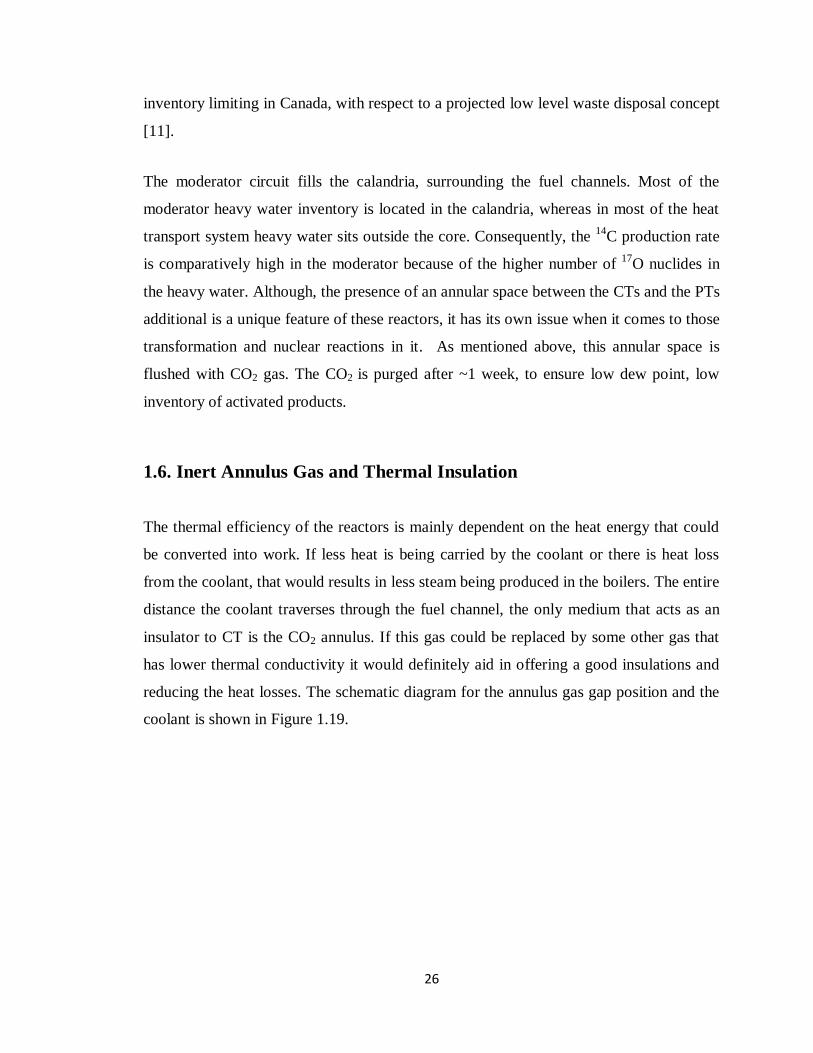
Table 1. 1. Some of the radiation sources in a CANDU reactor building
[12].
Table 1.1 lists some radioisotopes produced due to transmutations in reactor systems in
CANDU reactor building. From the table (highlighted box), it is evident that the annulus
gas contains primarily 14
C and 41
Ar radio nuclides as a result of transmutations. Ar
production is minimal and it occurs when air ingresses in the annulus. But 14
C is a
radionuclide of considerable interest in nuclear power production [11]. 14
C is present,
virtually, in all parts of nuclear reactor primary system and has a high production rate. It
is released to the environment through gaseous and liquid discharges and through the
disposal of solid radioactive waste. With its long half-life and high mobility in the
environment, 14
C is a nuclide of major concern (100% β- emitter).
41Ar has a half life of
109.34 minutes which is very small and it decays directly to stable 41
K.
In Canada, it is generally recognized that domestic CANDU reactors, on a unit basis,
produce more 14
C than other types of reactors. Most of this 14
C sits on ion exchange
resins, and this 14
C is released to the atmosphere. This radionuclide is also potentially
26
inventory limiting in Canada, with respect to a projected low level waste disposal concept
[11].
The moderator circuit fills the calandria, surrounding the fuel channels. Most of the
moderator heavy water inventory is located in the calandria, whereas in most of the heat
transport system heavy water sits outside the core. Consequently, the 14
C production rate
is comparatively high in the moderator because of the higher number of 17
O nuclides in
the heavy water. Although, the presence of an annular space between the CTs and the PTs
additional is a unique feature of these reactors, it has its own issue when it comes to those
transformation and nuclear reactions in it. As mentioned above, this annular space is
flushed with CO2 gas. The CO2 is purged after ~1 week, to ensure low dew point, low
inventory of activated products.
1.6. Inert Annulus Gas and Thermal Insulation
The thermal efficiency of the reactors is mainly dependent on the heat energy that could
be converted into work. If less heat is being carried by the coolant or there is heat loss
from the coolant, that would results in less steam being produced in the boilers. The entire
distance the coolant traverses through the fuel channel, the only medium that acts as an
insulator to CT is the CO2 annulus. If this gas could be replaced by some other gas that
has lower thermal conductivity it would definitely aid in offering a good insulations and
reducing the heat losses. The schematic diagram for the annulus gas gap position and the
coolant is shown in Figure 1.19.
27
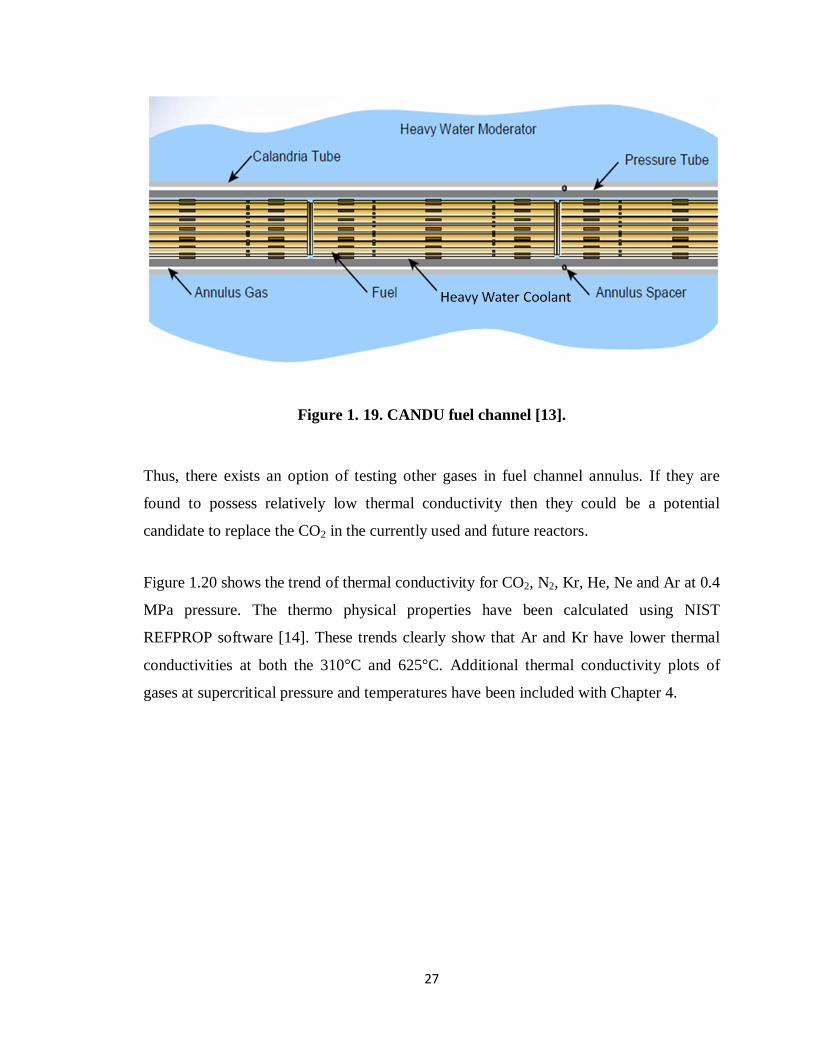
Figure 1. 19. CANDU fuel channel [13].
Thus, there exists an option of testing other gases in fuel channel annulus. If they are
found to possess relatively low thermal conductivity then they could be a potential
candidate to replace the CO2 in the currently used and future reactors.
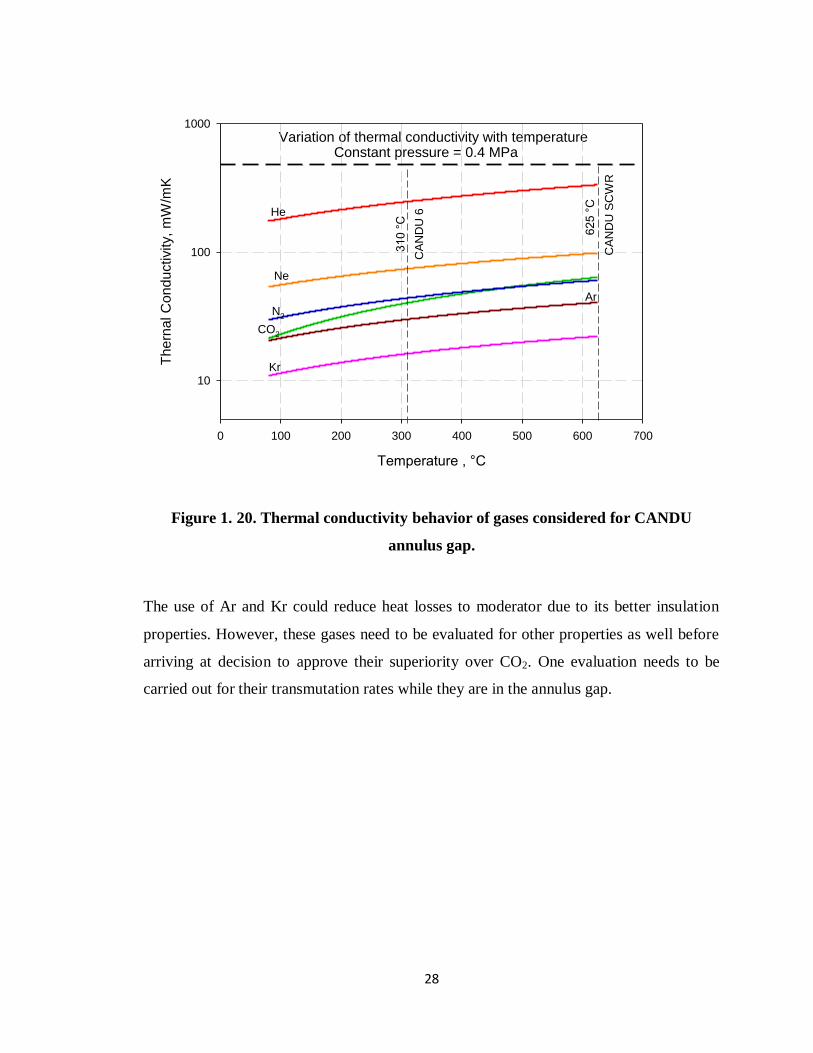
Figure 1.20 shows the trend of thermal conductivity for CO2, N2, Kr, He, Ne and Ar at 0.4
MPa pressure. The thermo physical properties have been calculated using NIST
REFPROP software [14]. These trends clearly show that Ar and Kr have lower thermal
conductivities at both the 310°C and 625°C. Additional thermal conductivity plots of
gases at supercritical pressure and temperatures have been included with Chapter 4.
28
Figure 1. 20. Thermal conductivity behavior of gases considered for CANDU
annulus gap.
The use of Ar and Kr could reduce heat losses to moderator due to its better insulation
properties. However, these gases need to be evaluated for other properties as well before
arriving at decision to approve their superiority over CO2. One evaluation needs to be
carried out for their transmutation rates while they are in the annulus gap.
Variation of thermal conductivity with temperature
Temperature , °C
0 100 200 300 400 500 600 700
Thern
al C
onductivity,
mW
/mK
10
100
1000
Constant pressure = 0.4 MPa
310 °
C
He
Ne
N2
CO2
Ar
Kr
625 °
C
CA
ND
U 6
CA
ND
U S
CW
R

29
CHAPTER 2
APPROACH AND METHODOLOGY
2.1. Neutron Interaction and Transport
Transformations and nuclear reactions occurring in the annulus gas are due to the
absorption of fission neutrons that follow the fission process in the fuel bulk and due to
the delayed neutrons emitted by the fission fragments after a lap of time of the fission
process. Brief description of neutron production and their migration to the annulus gas are
given in the following sections along with the geometry of the fuel bundle to understand
the complexity of the moderation process in PT. In this chapter the modeling approach to
calculate the transmutation rate is also discussed.
2.1.1. Nuclear Fission Reaction
Nuclear power production relies on the fact that uranium nuclides in reactor are
undergoing controlled fission, releasing about 200 MeV energy per fission and splitting
into two or more tightly bound lighter fission fragments. In this process, some of the
nuclear mass is converted into energy. Each Watt of power requires about 3.1 × 10¹⁰
fissions/s. For a CANDU reactor operating at 2250 MWth, the required fission rate is a
steady:
2250 × 106 × 3.1 × 10
10 = 7 × 10
19 fissions/s
The fission process providing neutrons needs to keep itself going, a process known as
Chain reaction. Each fission releases, on average, about 2.7 neutrons. A steady fission
rate requires that neutron losses by capture (radiative capture in fuel or other materials) or
by leakage (escape from the reactor) should not exceed about 1.5 neutrons per fission.

30
Figure 2. 1. Fission product decay chain [15].
One particular mode of fission illustrated in Figure 2.1 is one of several possible ways in
which the nuclides undergo fission. The fission fragments 139
Xe and 95
Sr are just two of
about 300 nuclides that fission produces depending upon the fission product yield.
Initially, the fission fragments are highly excited and get rid of their excitation energy by
emitting neutrons and gamma rays. Most of the fission neutrons are emitted almost
immediately after fission occurs, these are known as prompt fission neutrons, while the
gamma rays are known as prompt gammas. Following de-excitation, fission fragment
does not have sufficient excitation energy to throw off any more neutrons. It decays off
by emitting alpha or beta particles. In a few cases, the daughter nucleus created by beta
decay has sufficient energy to emit a neutron. This decay by neutron emission contributes
to 0.5% of the total fission neutrons. These neutrons are known as the Delayed fission
neutrons. The standard notation for the fission reaction described in Figure 2.1 is as
follows:
1n
+
235U
→
236U →
139 Xe+
95Sr + 2n + γ (2.1)
31
After a 235
U nuclide absorbs a neutron, the compound nucleus (236
U*) formed survives for
about 10-14
s, and then fission occurs in about 85% of the time (in rest 15% time radiative
capture occurs). Equation (2.1) shows the immediate break up of 235
U, with emission of
prompt neutrons and prompt gammas.
The fission energy appears mostly (85%) as kinetic energy of the fission fragments (the 2
large pieces), and in small part (15%) as the kinetic energy of the neutrons and decay
radiations. The energy is quickly reduced to heat, which is utilized to make steam from
water which turns turbines and generates electricity. The energy release per fission of
235U, averaged over all fission reactions in a reactor core, is ~200 MeV. This is
approximately the energy deposited in the reactor core per fission reaction.
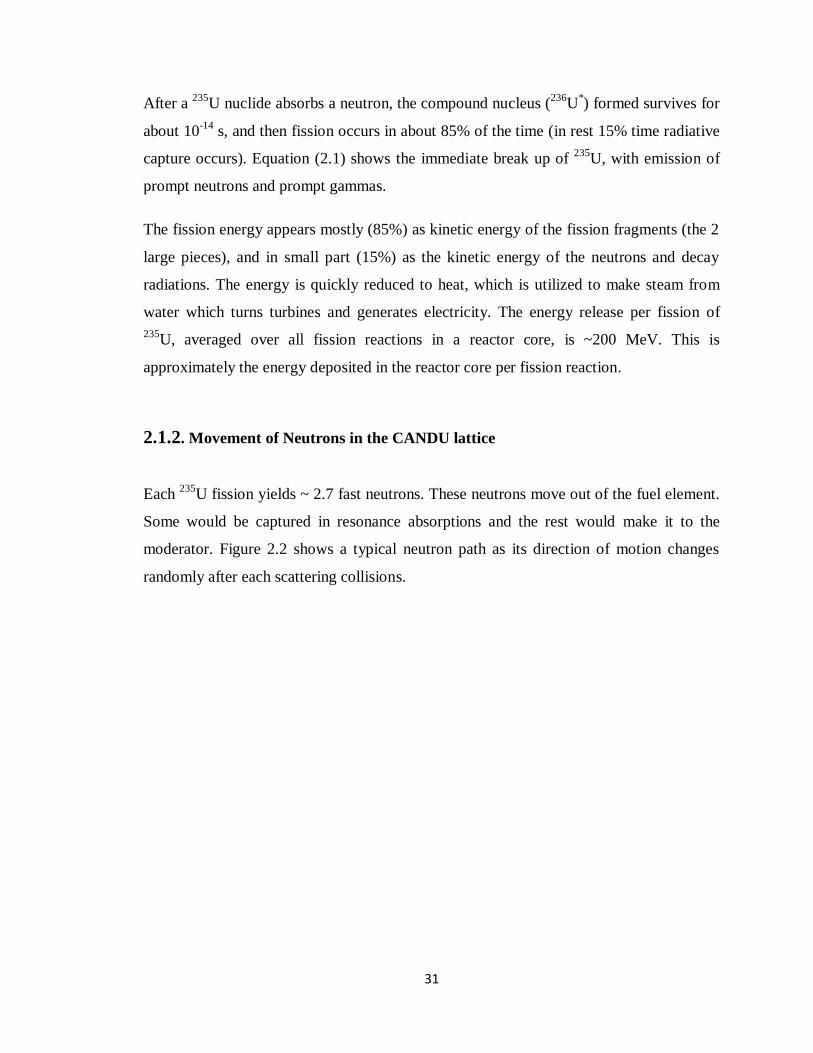
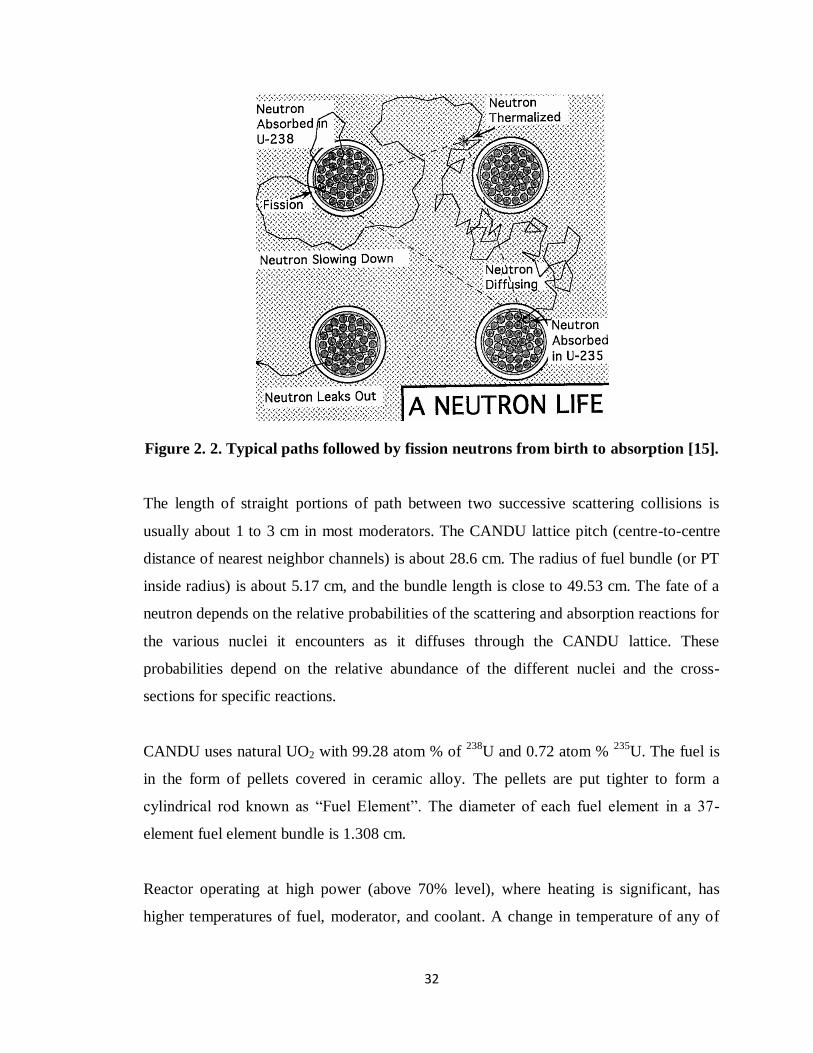
2.1.2. Movement of Neutrons in the CANDU lattice
Each 235
U fission yields ~ 2.7 fast neutrons. These neutrons move out of the fuel element.
Some would be captured in resonance absorptions and the rest would make it to the
moderator. Figure 2.2 shows a typical neutron path as its direction of motion changes
randomly after each scattering collisions.
32
Figure 2. 2. Typical paths followed by fission neutrons from birth to absorption [15].
The length of straight portions of path between two successive scattering collisions is
usually about 1 to 3 cm in most moderators. The CANDU lattice pitch (centre-to-centre
distance of nearest neighbor channels) is about 28.6 cm. The radius of fuel bundle (or PT
inside radius) is about 5.17 cm, and the bundle length is close to 49.53 cm. The fate of a
neutron depends on the relative probabilities of the scattering and absorption reactions for
the various nuclei it encounters as it diffuses through the CANDU lattice. These
probabilities depend on the relative abundance of the different nuclei and the cross-
sections for specific reactions.
CANDU uses natural UO2 with 99.28 atom % of 238
U and 0.72 atom % 235
U. The fuel is
in the form of pellets covered in ceramic alloy. The pellets are put tighter to form a
cylindrical rod known as “Fuel Element”. The diameter of each fuel element in a 37-
element fuel element bundle is 1.308 cm.
Reactor operating at high power (above 70% level), where heating is significant, has
higher temperatures of fuel, moderator, and coolant. A change in temperature of any of
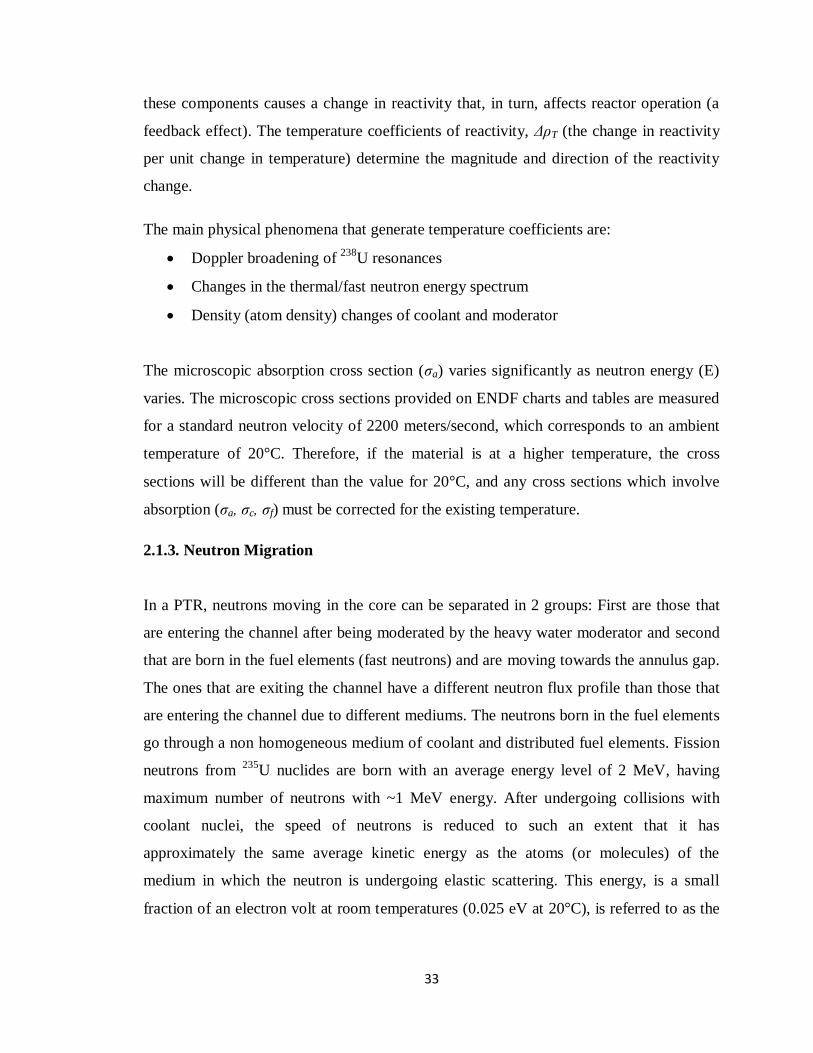
33
these components causes a change in reactivity that, in turn, affects reactor operation (a
feedback effect). The temperature coefficients of reactivity, ΔρT (the change in reactivity
per unit change in temperature) determine the magnitude and direction of the reactivity
change.
The main physical phenomena that generate temperature coefficients are:
Doppler broadening of 238
U resonances
Changes in the thermal/fast neutron energy spectrum
Density (atom density) changes of coolant and moderator
The microscopic absorption cross section (σa) varies significantly as neutron energy (E)
varies. The microscopic cross sections provided on ENDF charts and tables are measured
for a standard neutron velocity of 2200 meters/second, which corresponds to an ambient
temperature of 20°C. Therefore, if the material is at a higher temperature, the cross
sections will be different than the value for 20°C, and any cross sections which involve
absorption (σa, σc, σf) must be corrected for the existing temperature.
2.1.3. Neutron Migration
In a PTR, neutrons moving in the core can be separated in 2 groups: First are those that
are entering the channel after being moderated by the heavy water moderator and second
that are born in the fuel elements (fast neutrons) and are moving towards the annulus gap.
The ones that are exiting the channel have a different neutron flux profile than those that
are entering the channel due to different mediums. The neutrons born in the fuel elements
go through a non homogeneous medium of coolant and distributed fuel elements. Fission
neutrons from 235
U nuclides are born with an average energy level of 2 MeV, having
maximum number of neutrons with ~1 MeV energy. After undergoing collisions with
coolant nuclei, the speed of neutrons is reduced to such an extent that it has
approximately the same average kinetic energy as the atoms (or molecules) of the
medium in which the neutron is undergoing elastic scattering. This energy, is a small
fraction of an electron volt at room temperatures (0.025 eV at 20°C), is referred to as the

34
Thermal Energy. Neutrons whose energies have been reduced to values in this region (<1
eV) are designated as Thermal neutrons. The process of losing energy by successive
collisions by elastic scattering to the thermal region is known as Thermalization or
Moderation. Heavy water is used for the purpose to thermalize neutrons in a PT reactor.
The ideal moderating material should have the following nuclear properties.
Large scattering cross section
Small absorption cross section
Large energy loss per collision
Energy loss per collision is measured by logarithmic energy decrement. The average
logarithmic energy decrement is the average energy decrease per collision in the
logarithm of the neutron energy (See Equation (2.2)).
(2.2)
where,
ξ = Average logarithmic energy decrement,
Ei = Average initial neutron energy,
Ef = Average final neutron energy.
The average change in lethargy in an elastic collision is independent of the energy of
incident neutron. The symbol is commonly called the Average Logarithmic Energy
Decrement, because of the fact that a neutron loses, on the average, a fixed fraction of its
energy per scattering collision independent of its initial energy. Since the fraction of
energy retained by a neutron in a single elastic collision is constant for a given material, ξ
is also a constant.
A good moderator thermalizes fast neutrons in a small number of collisions, but does not
absorb them to any large extent. Slowing down the neutrons in as few collisions as
35
possible is necessary in order to reduce the amount of neutron leakage from the core and
also to reduce the number of resonance absorptions in non-fuel materials.
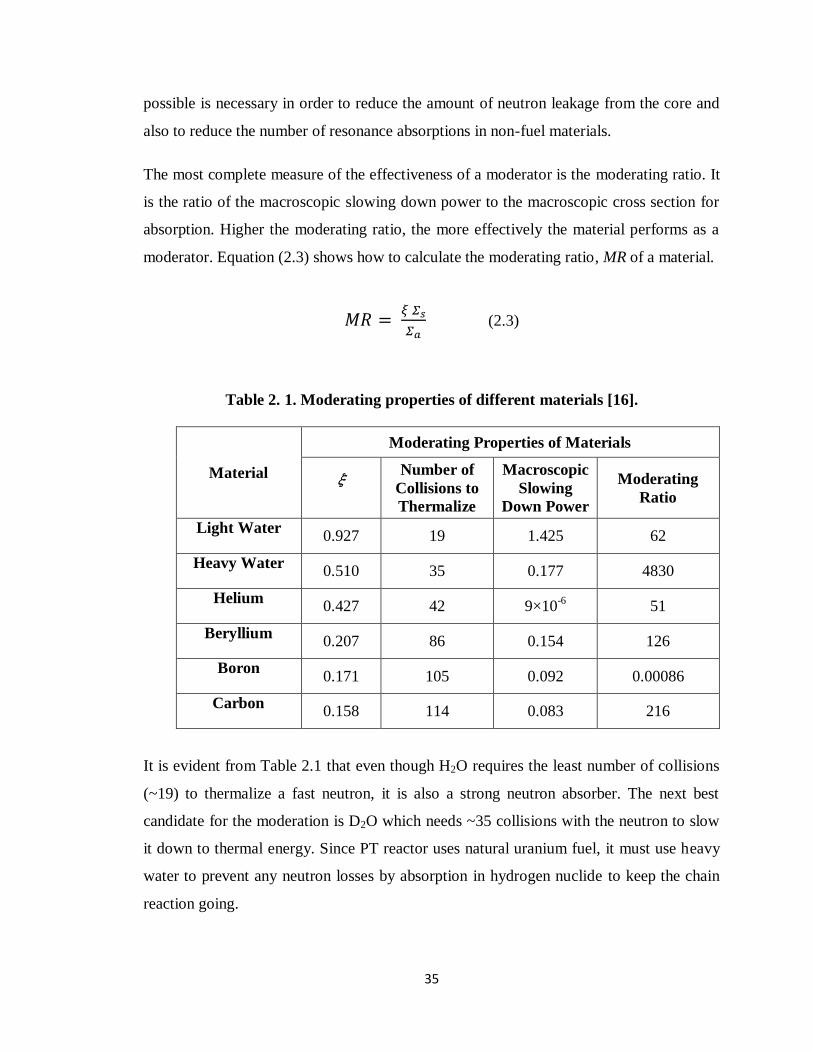
The most complete measure of the effectiveness of a moderator is the moderating ratio. It
is the ratio of the macroscopic slowing down power to the macroscopic cross section for
absorption. Higher the moderating ratio, the more effectively the material performs as a
moderator. Equation (2.3) shows how to calculate the moderating ratio, MR of a material.
(2.3)
Table 2. 1. Moderating properties of different materials [16].
Material
Moderating Properties of Materials
ξ Number of
Collisions to
Thermalize
Macroscopic
Slowing
Down Power
Moderating
Ratio
Light Water 0.927 19 1.425 62
Heavy Water 0.510 35 0.177 4830
Helium 0.427 42 9×10
-6 51
Beryllium 0.207 86 0.154 126
Boron 0.171 105 0.092 0.00086
Carbon 0.158 114 0.083 216
It is evident from Table 2.1 that even though H2O requires the least number of collisions
(~19) to thermalize a fast neutron, it is also a strong neutron absorber. The next best
candidate for the moderation is D2O which needs ~35 collisions with the neutron to slow
it down to thermal energy. Since PT reactor uses natural uranium fuel, it must use heavy
water to prevent any neutron losses by absorption in hydrogen nuclide to keep the chain
reaction going.

36
Figure 2.3 shows that neutrons born in one fuel element (element A) normally traverses
through coolant before reaching the next fuel element (element B). The first steps in their
journey begin in the coolant (deuterium) where they may undergo collisions. The first
elastic collision suffered by a fission neutron with a deuterium nuclide reduces the
neutron energy to below the fast fission threshold. A few collisions could reduce the
energy into the resonance energy range.
In the other hand, the neutron spectrum is much more complex for neutrons exiting the
fuel channel because of the distribution of coolant and fuel elements in the fuel channel.
Fission neutrons from the outer ring elements will suffer small moderation rate as
compared to those that are being generated from the central element. This would be
common for all the fuel elements in each of the ring elements, so this makes the neutron
flux determination even more complex to understand (see later in chapter 4).
Figure 2. 3. Disposition of moderator and coolant around the fuel bundle [15].

37
2.2. Fuel Channel
In connection with what has been discussed in the previous section, for analysis of the
neutron flux in the model, the neutrons in the reactor (see later) have been categorized in
two neutron energy groups: First group is for those neutrons that are entering the fuel
channel (see Figure 2.4 blue arrows), and the other group is for those neutron exiting the
channel. The only source of neutrons in the reactor after it has achieved criticality is the
fuel elements. The fuel channel is modeled in 3D Cartesian co-ordinates in MCNP 4a
code, taking into account the dimensions and isotopic compositions of fuel channel
materials.
This model represents the fuel channel and is used to study the transport of neutrons in a
simulated nuclear fission reaction in the fuel elements. The main purpose of building is to
enable the analyst to predict the effect of changes to the system. An accurate model
should be a close approximation to the real system and incorporate most of its salient
features. On the other hand, it should not be so complex that it is impossible to understand
and experiment it.
Simulation models consist of the following components: system entities, input variables,
performance measures, and functional relationships. Almost all simulation software
packages provide the above components.
Figure 2. 4. Fuel channel modeled in MCNP (Courtesy of AECL).
38
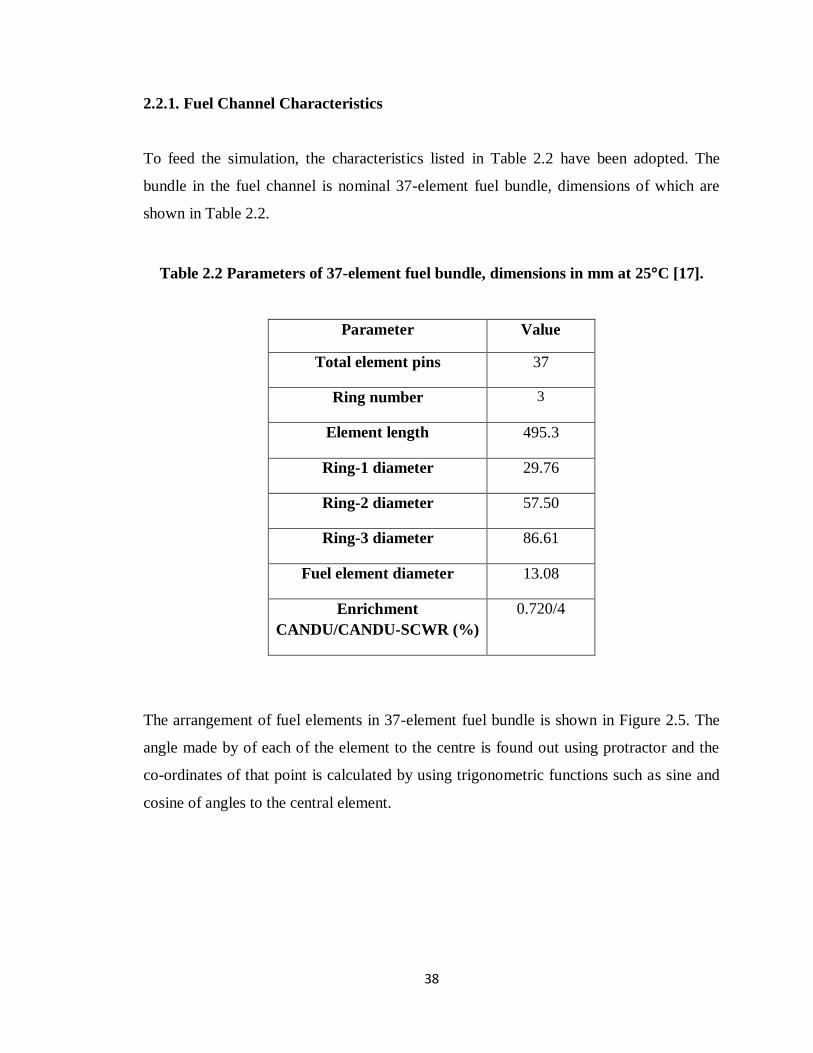
2.2.1. Fuel Channel Characteristics
To feed the simulation, the characteristics listed in Table 2.2 have been adopted. The
bundle in the fuel channel is nominal 37-element fuel bundle, dimensions of which are
shown in Table 2.2.
Table 2.2 Parameters of 37-element fuel bundle, dimensions in mm at 25°C [17].
Parameter Value
Total element pins 37
Ring number 3
Element length 495.3
Ring-1 diameter 29.76
Ring-2 diameter 57.50
Ring-3 diameter 86.61
Fuel element diameter 13.08
Enrichment
CANDU/CANDU-SCWR (%)
0.720/4
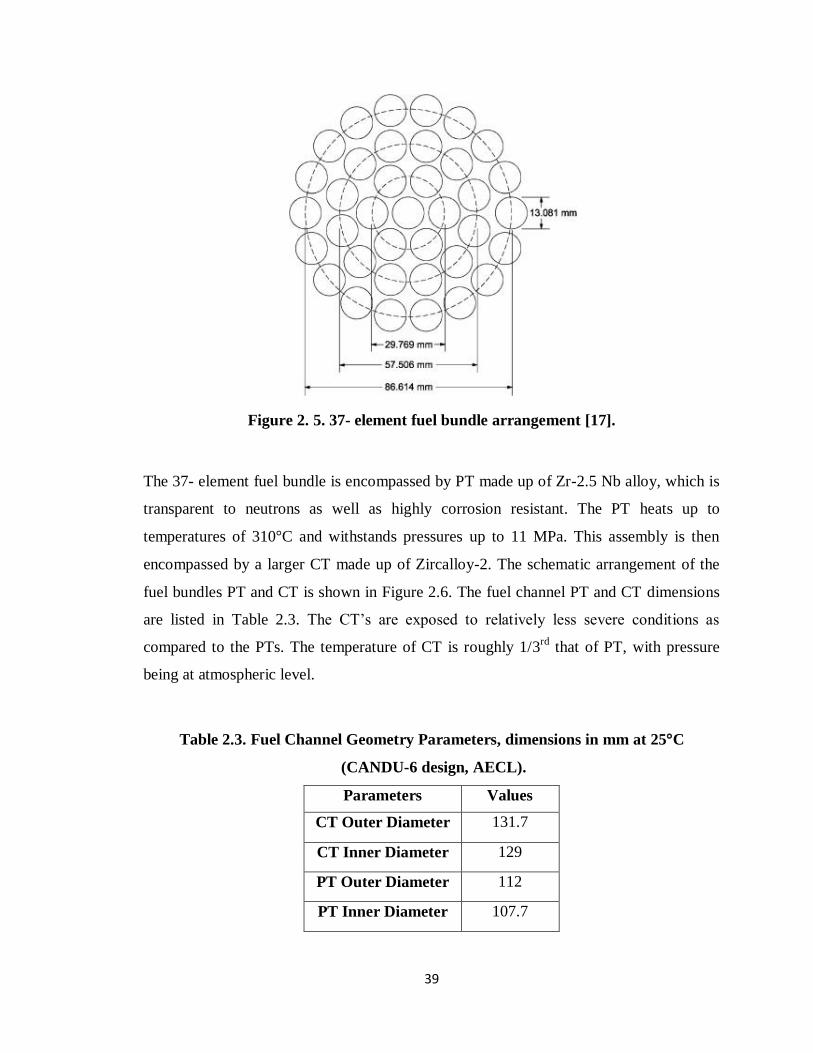
The arrangement of fuel elements in 37-element fuel bundle is shown in Figure 2.5. The
angle made by of each of the element to the centre is found out using protractor and the
co-ordinates of that point is calculated by using trigonometric functions such as sine and
cosine of angles to the central element.
39
Figure 2. 5. 37- element fuel bundle arrangement [17].
The 37- element fuel bundle is encompassed by PT made up of Zr-2.5 Nb alloy, which is
transparent to neutrons as well as highly corrosion resistant. The PT heats up to
temperatures of 310°C and withstands pressures up to 11 MPa. This assembly is then
encompassed by a larger CT made up of Zircalloy-2. The schematic arrangement of the
fuel bundles PT and CT is shown in Figure 2.6. The fuel channel PT and CT dimensions
are listed in Table 2.3. The CT’s are exposed to relatively less severe conditions as
compared to the PTs. The temperature of CT is roughly 1/3rd
that of PT, with pressure
being at atmospheric level.
Table 2.3. Fuel Channel Geometry Parameters, dimensions in mm at 25°C
(CANDU-6 design, AECL).
Parameters Values
CT Outer Diameter 131.7
CT Inner Diameter 129
PT Outer Diameter 112
PT Inner Diameter 107.7
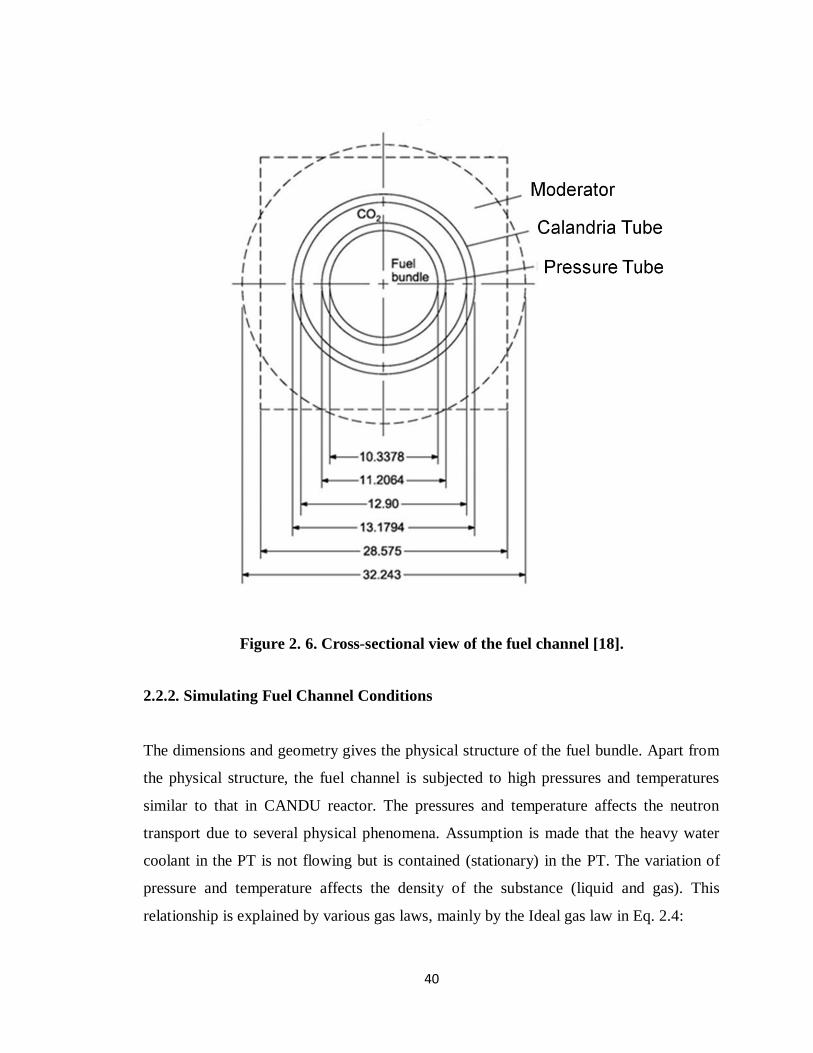
40
Figure 2. 6. Cross-sectional view of the fuel channel [18].
2.2.2. Simulating Fuel Channel Conditions
The dimensions and geometry gives the physical structure of the fuel bundle. Apart from
the physical structure, the fuel channel is subjected to high pressures and temperatures
similar to that in CANDU reactor. The pressures and temperature affects the neutron
transport due to several physical phenomena. Assumption is made that the heavy water
coolant in the PT is not flowing but is contained (stationary) in the PT. The variation of
pressure and temperature affects the density of the substance (liquid and gas). This
relationship is explained by various gas laws, mainly by the Ideal gas law in Eq. 2.4:
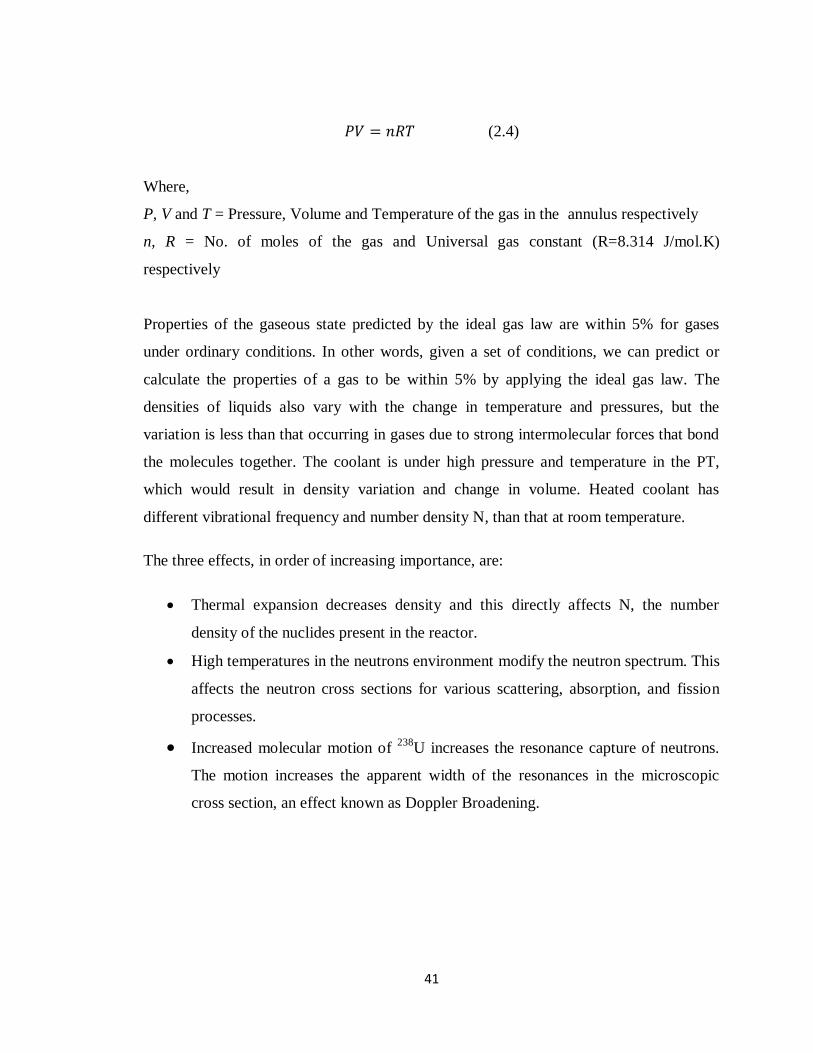
41
(2.4)
Where,
P, V and T = Pressure, Volume and Temperature of the gas in the annulus respectively
n, R = No. of moles of the gas and Universal gas constant (R=8.314 J/mol.K)
respectively
Properties of the gaseous state predicted by the ideal gas law are within 5% for gases
under ordinary conditions. In other words, given a set of conditions, we can predict or
calculate the properties of a gas to be within 5% by applying the ideal gas law. The
densities of liquids also vary with the change in temperature and pressures, but the
variation is less than that occurring in gases due to strong intermolecular forces that bond
the molecules together. The coolant is under high pressure and temperature in the PT,
which would result in density variation and change in volume. Heated coolant has
different vibrational frequency and number density N, than that at room temperature.
The three effects, in order of increasing importance, are:
Thermal expansion decreases density and this directly affects N, the number
density of the nuclides present in the reactor.
High temperatures in the neutrons environment modify the neutron spectrum. This
affects the neutron cross sections for various scattering, absorption, and fission
processes.
Increased molecular motion of 238
U increases the resonance capture of neutrons.
The motion increases the apparent width of the resonances in the microscopic
cross section, an effect known as Doppler Broadening.
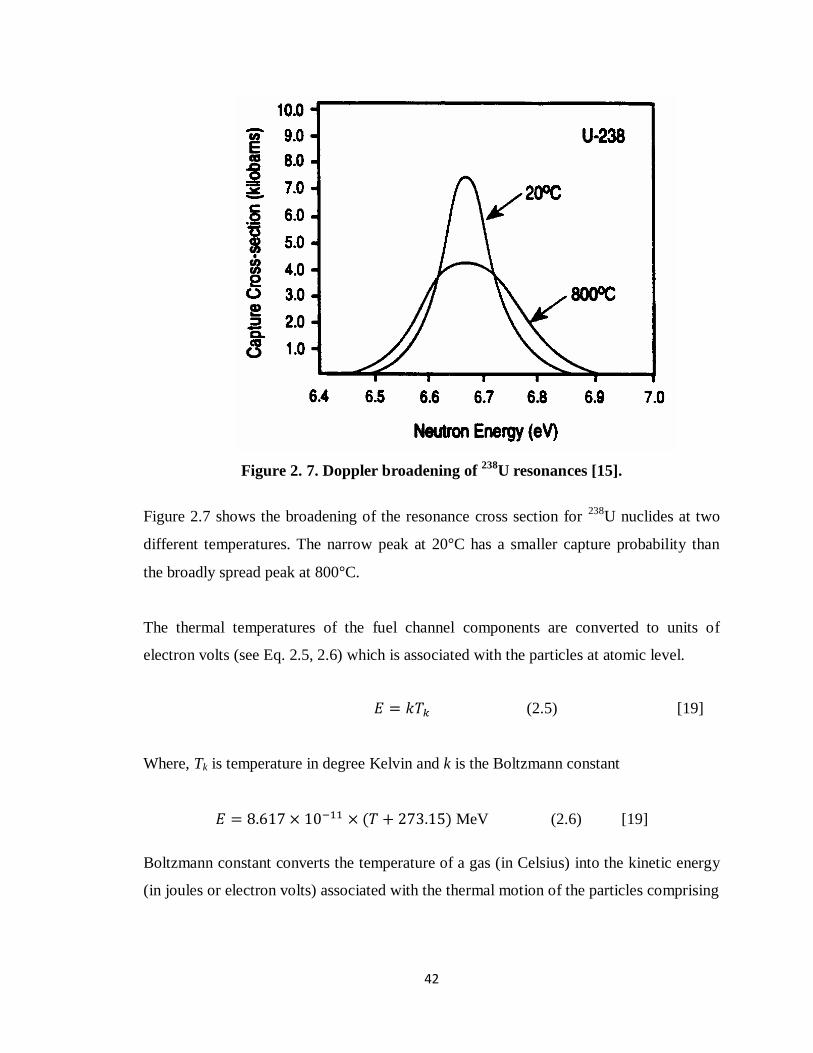
42
Figure 2. 7. Doppler broadening of 238
U resonances [15].
Figure 2.7 shows the broadening of the resonance cross section for 238
U nuclides at two
different temperatures. The narrow peak at 20°C has a smaller capture probability than
the broadly spread peak at 800°C.
The thermal temperatures of the fuel channel components are converted to units of
electron volts (see Eq. 2.5, 2.6) which is associated with the particles at atomic level.
(2.5) [19]
Where, Tk is temperature in degree Kelvin and k is the Boltzmann constant
MeV (2.6) [19]
Boltzmann constant converts the temperature of a gas (in Celsius) into the kinetic energy
(in joules or electron volts) associated with the thermal motion of the particles comprising
43
the gas. It equals the molar gas constant R divided by the Avogadro constant. It is
symbolized by k and has the value 1.380 × 10⁻²³
J/K (8.62 × 10⁻⁵
eV/K).
Generally, the energy present in a gas molecule is directly proportional to the absolute
temperature. So, if there is an increase in the temperature, the same increase takes place
with respect to the kinetic energy per molecule. As a gas is heated, the molecules that it
consists of begin to vibrate rapidly, producing an increase in pressure if the gas is
contained in a space of constant volume, or an increased volume if the pressure is
constant. The physical significance of this constant k is that it helps to calculate the
amount of energy, i.e., heat that corresponds to random thermal motions of the molecules
of a substance.
Table 2.4. Simulated conditions simulated in PTR fuel channel.
Material Density (g/cm3) Cell Temp (°C) Thermal Temp (MeV)
Fuel (UO2) 10.600 310 5.02×10⁻⁸
Cladding (Zr-4) 6.517 310 5.02×10⁻⁸
Pressure tube (Zircalloy) 6.550 310 5.02×10⁻⁸
Coolant, Heavy water
P= 10 MPa, T= 310°C 0.763 310 5.02×10
-8
Calandria tube (Zircalloy-2) 6.550 100 3.21×10⁻⁸
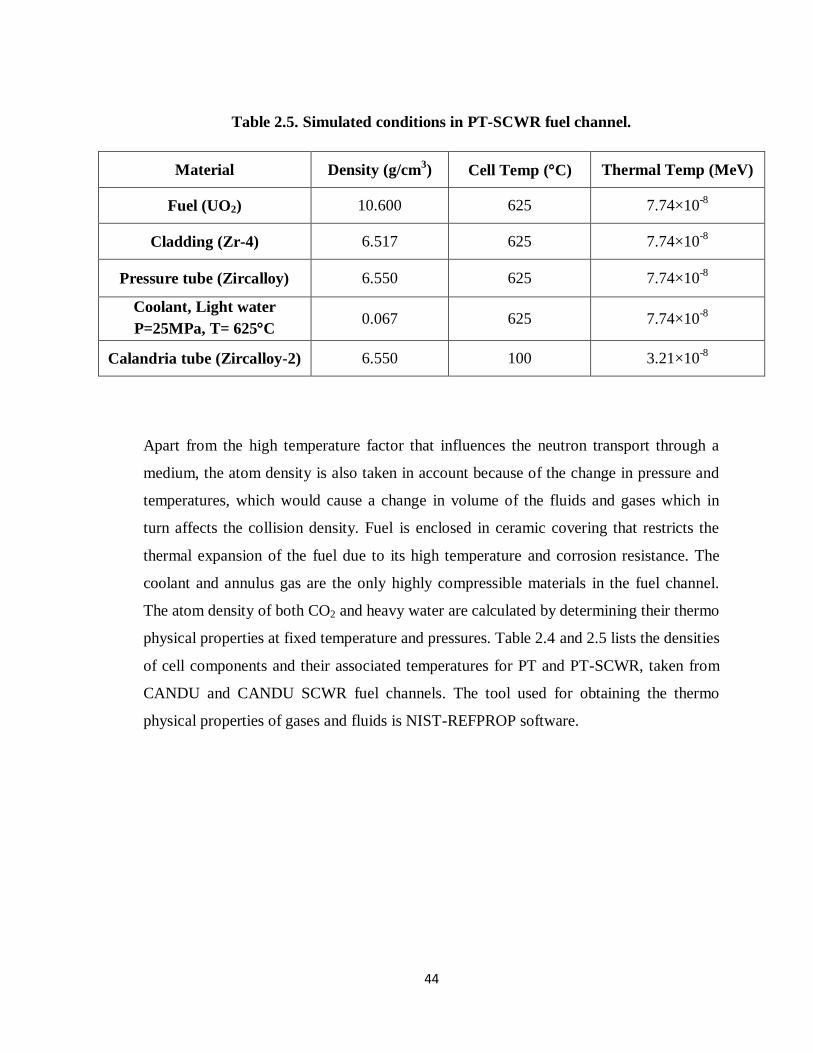
44
Table 2.5. Simulated conditions in PT-SCWR fuel channel.
Material Density (g/cm3) Cell Temp (°C) Thermal Temp (MeV)
Fuel (UO2) 10.600 625 7.74×10⁻⁸
Cladding (Zr-4) 6.517 625 7.74×10⁻⁸
Pressure tube (Zircalloy) 6.550 625 7.74×10⁻⁸
Coolant, Light water
P=25MPa, T= 625°C 0.067 625 7.74×10
-8
Calandria tube (Zircalloy-2) 6.550 100 3.21×10⁻⁸
Apart from the high temperature factor that influences the neutron transport through a
medium, the atom density is also taken in account because of the change in pressure and
temperatures, which would cause a change in volume of the fluids and gases which in
turn affects the collision density. Fuel is enclosed in ceramic covering that restricts the
thermal expansion of the fuel due to its high temperature and corrosion resistance. The
coolant and annulus gas are the only highly compressible materials in the fuel channel.
The atom density of both CO2 and heavy water are calculated by determining their thermo
physical properties at fixed temperature and pressures. Table 2.4 and 2.5 lists the densities
of cell components and their associated temperatures for PT and PT-SCWR, taken from
CANDU and CANDU SCWR fuel channels. The tool used for obtaining the thermo
physical properties of gases and fluids is NIST-REFPROP software.

45
2.3. Simulation Approach
In its broadest sense, simulation is a tool to evaluate the performance of an existing or
proposed system under different configurations of interest and over long periods of real
time [20]. The model is based on some physical processes and a built in data library of
probabilities. Generally, simulation is the first step in many projects, especially, when an
experimental investigation is expensive or when an optimization is needed. The
operation of the model can be studied, and hence, properties concerning the behavior of
the actual system or its subsystem can be inferred. Simulation models consist of the
following components: System entities, input variables, performance measures, and
functional relationships. Figure 2.8 presents some steps of a simulation process.
Figure 2. 8. Schematic study of simulation [20].
46
The iterative nature of the process is indicated by the system under study becoming the
altered system which then becomes the system under study and the cycle repeats.
The steps involved in developing a simulation model, designing a simulation and
performing simulation analysis are [20].
Step 1: Identifying the problem.
Step 2: Formulating the problem.
Step 3: Collect and process real system data.
Step 4: Formulate and develop a model.
Step 5: Perform simulation runs.
Step 6: Interpret and present results.
Step 7: Recommend further course of action
These steps are considered for computer simulation for current case. Depending upon the
complexity and type of system additional steps may be introduced.
In our case, the simulation has been conducted for the PT fuel channel containing 37
element bundle simulated under different reactor core conditions. Two major parameters
have been investigated: the neutrons flux and consequently the transmutation rate, Rrate, in
the annulus gas of PT.
2.4. Transmutation Rates
Transmutation rate, R, is defined as the number of reactions occurring per second per cm3
in a material. Considering, neutron absorption reactions in a material with microscopic
absorption cross section σa (the probability of interaction for each target nucleus) for
neutrons with flux Φ. The macroscopic cross section ( a= Nσa) is the total flat area of
targets that is available for a neutron to interact in 1 cm3
volume. a-1
is the mean free
path to absorption reaction.

47
In 3D geometry, neutron flux Φ is defined as the number of neutrons crossing the surface
of a sphere per second with unit surface area. Dividing flux by the length of track
required (on average) for one absorption, gives the total number of absorptions.
eutron mean free path to absorption
(2.7)
Figure 2. 9. Neutrons crossing the surface of a sphere.
Figure 2.9 shows the neutron flux Φ cm-2
s-1
and number of neutrons, N crossing the
sphere surface per second.
Φ
(2.8)
(2.9)
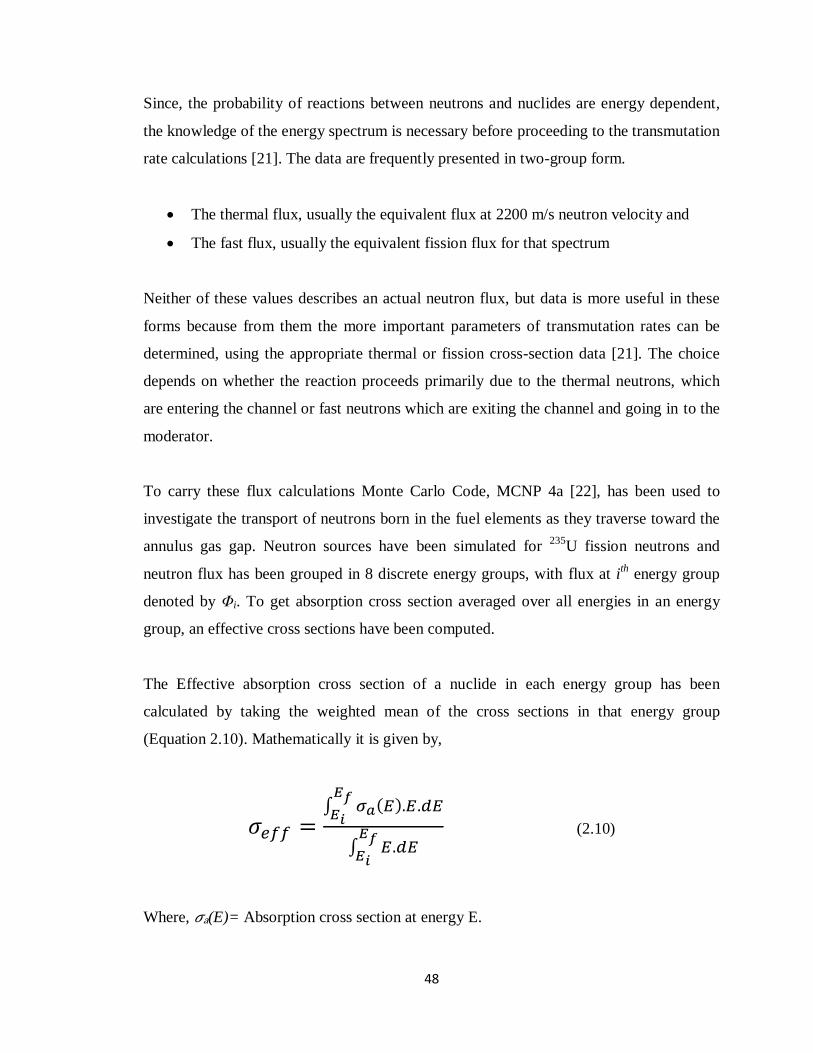
48
Since, the probability of reactions between neutrons and nuclides are energy dependent,
the knowledge of the energy spectrum is necessary before proceeding to the transmutation
rate calculations [21]. The data are frequently presented in two-group form.
The thermal flux, usually the equivalent flux at 2200 m/s neutron velocity and
The fast flux, usually the equivalent fission flux for that spectrum
Neither of these values describes an actual neutron flux, but data is more useful in these
forms because from them the more important parameters of transmutation rates can be
determined, using the appropriate thermal or fission cross-section data [21]. The choice
depends on whether the reaction proceeds primarily due to the thermal neutrons, which
are entering the channel or fast neutrons which are exiting the channel and going in to the
moderator.
To carry these flux calculations Monte Carlo Code, MCNP 4a [22], has been used to
investigate the transport of neutrons born in the fuel elements as they traverse toward the
annulus gas gap. Neutron sources have been simulated for 235
U fission neutrons and
neutron flux has been grouped in 8 discrete energy groups, with flux at ith
energy group
denoted by Φi. To get absorption cross section averaged over all energies in an energy
group, an effective cross sections have been computed.
The Effective absorption cross section of a nuclide in each energy group has been
calculated by taking the weighted mean of the cross sections in that energy group
(Equation 2.10). Mathematically it is given by,
(2.10)
Where, a(E)= Absorption cross section at energy E.

49
σi is microscopic absorption cross section in energy group i. The net transmutation rate is
then given by:
(2.11)
Where, i=1…..8, Neutron energy groups.
N = Number of nuclides in the annulus gas.
σi = Microscopic absorption cross section in ith
energy group (in barns).
Φi = Average neutron flux in ith
energy group cm-2
s-1
.
A total of 8 neutron energy groups are considered in this investigation from G1- G8. The
upper level neutron energy in group G8 is 2 MeV. Neutrons with energies greater than 2
MeV have not been taken into account in transmutation rate calculations. This
investigation has been carried only for neutrons that are born in the fuel elements and
traverse towards the annulus gas. Thermal neutrons entering the fuel channel are not
simulated and therefore not taken into account in rate calculations.
Table 2.6. Energy distributions for i energy groups (G1 to G8)
Neutron flux values have been calculated for 8 energy groups shown in Table 2.6. The
number of nuclides is obtained from the gas density at a specific pressure and
temperature. Neutron transmutation rates corresponding to the 8 energy groups have been
obtained using Equation 2.11. Pressures and temperatures of annulus gases have been
varied to obtain trend of transmutation rates with different gas densities. More details and
description of the code are given in the next chapter (3).
i G1 G2 G3 G4 G5 G6 G7 G8
E 0-1 eV 1-10 eV 10-100 eV 0.1-1 keV 1-10 keV 10 keV-0.5
MeV
0.5-1
MeV
1-2
MeV
50
CHAPTER 3
MONTE CARLO MODELING
3.1. MCNP Code Description
MCNP 4a is a high precision, general purpose, continuous energy, generalized geometry,
time dependent Monte Carlo code that is used to solve the Boltzmann particle transport
equation by randomly tracking a sufficient number of particles through materials [23]. It
makes possible to perform Monte Carlo Simulation of neutrons, γ rays and electron
transport in systems with a complicated 3 D geometry. Neutron energy simulation ranges
from 0 to 20 MeV for all isotopes and up to 150 MeV for some isotopes, the photon
energy ranges are from 1 keV to 100 GeV, and the electron energy ranges is from 1 keV
to 1 GeV. Monte Carlo can be used to duplicate theoretically a statistical process (such as
the interaction of nuclear particles with materials) and is particularly useful for complex
problems that cannot be modeled by computer codes that use deterministic methods. The
individual probabilistic events that comprise a process are simulated sequentially.
The code obtains the solution by simulating individual particle trajectories and recording
some aspects of their average behavior. The average behavior of particles in the physical
system is then inferred from the average behavior of the simulated particles. The
individual probabilistic events are sequentially simulated that comprise a interaction
process of nuclear particle with any material. The probability distributions determining
these events are statistically sampled to describe the total interaction phenomenon. The
statistical sampling process is based on the selection of random numbers. The number of
runs necessary to adequately describe the phenomenon is quite large. It consists of
following each of many particles from a source throughout its life to its death in some
terminal category – absorption, escape, physical cut, etc. Probability distributions are
randomly sampled using transport data to determine the outcome at each step of its life. In
each simulation the number of tracked particles was around 107 tracks to keep an error of
51
simulation no more than 1% [23]. The quantities of interest are tallied, along with
estimates of the statistical precision of the results. MCNPX code verifies the simulation
outputs by performing a series of statistical checks, after successful completion of which
only the output data is said to have passed all the checks. MCNP 4a has been used for the
simulations.
3.1.1. Surface Cards
In Cartesian co-ordinates a surface is represented functionally as f(x, y, z) = 0. The MCNP
input line for a surface such as cylinder, is denoted by the mnemonic C/Z (or c/z, since
MCNP is case insensitive), is
1 C/X 6 6 12 $ a cylindrical surface parallel to z-axis
2 PX 15 $ a plane perpendicular to x axis
Surface 1 is an infinitely long cylindrical surface parallel to X-axis with radius 12 cm and
whose axis passes through the point (x = 6 cm, y = 6 cm, z = 0). Surface 2 is a plane
cutting axis at 90 at x =15 cm, extending infinitely along Y and Z axis. Every surface
has a “positive” side and a “negative” side. These directional senses for a surface are
defined formally as follows: any point at which f(x, y, z) > 0, is located in the positive to
the surface, and any point at which f(x, y, z) < 0, is located in the negative to the surface.
For example, a region within a cylindrical surface is negative with respect to the surface
and a region outside the cylindrical surface is positive with respect to the surface.

52
3.1.2. Cell Cards
Cell cards are used to define the shape and material contents of the physical spaces of the
geometry .The material number should be explicitly set to zero if the cell is a void or
vacuum. A positive density is interpreted as atomic density in unit of 1024
atoms per cubic
centimeter. A negative entry is interpreted as mass density in units of grams per cubic
centimeter. In the geometry specification, a signed surface number stands for the region
on the side of the surface where points have the indicated sense (In a Cartesian coordinate
system). The optional comment card has a C in column 1, followed by a blank and the
comment itself. The second line shows the cell number (3) followed by the material
number (2) and the material density (0.05 g/cm3).
Negative 0.05, implies that density of material 2 is in units of g/cm3. The “-2” indicates
that cell 3 is bounded by surface 2 or by macro body; cube sphere etc. Surface 2 is
defined in the surface card section. The negative sign preceding the surface number
means that cell 3 is the region of space that has a negative sense with respect to surface 2.
C Cell Card
3 2 -0.05 -2 imp:n=1
The specific format for a cell card is shown below.
j m d geo parmet
The cell number, denoted above as “j”, should be a positive integer value <1000000.
Material number, “m”, specifies the material present in a particular cell and is also
an positive integer <1000000. The data card section of the input file is used to define the
composition of each specific material used in a each cells. If two or more cells have same
material, each cell will have a different cell number but the same material number. The
geometry specification, “geo”, uses Boolean operators in conjunction with signed surface
numbers to describe how the surfaces bound regions of space to create cells. “parmet”
feature can be used to specify cell parameters on the cell card line instead of in the data
card section. For example, the importance of a cell card “imp:n” specifies the relative cell

53
importance for neutrons, one entry for each cell of the problem. The “imp:n” card can
also be defined in the data card section, or it can be placed on the cell card line at the end
of the list of surfaces.
3.1.3. Data Cards
The input cards defines the type of particles, problem materials, and radiation sources,
how results are to be scored (or tallied), the level of detail for the physics of particle
interactions, variance reduction techniques, cross section libraries, the amount and type of
output, and much more. The most important data cards for radiation transport applications
includes: problem type, source specification, tally specification, and material and cross
section specification.
3.1.3.1. Material Specifications
Material specifications for filling the various cells in an MCNP model involves the
following: (a) Assigning a unique material number to each material, (b) Defining the
elemental (or isotopic) composition, and (c) the cross section compilations to be used
The isotope ZAID number (Z A IDentification) contains six digits ZZZAAA in which
ZZZ is the atomic number Z and AAA is the atomic mass number A. Thus 235U has a
ZAID number 092235 or simply 92235. density is not specified here. Instead, density is
specified on the cell definition card. This permits one material to appear at different
densities in different cells.
M200 92238.66c -0.99289 $ isotopic U238 mass fraction
92235.66c -0.00711 $ isotopic U235 mass fraction
The material 200 is for natural uranium, having thus having a ZAID number 092235 and
092238. The .66c designation identifies a particular cross section compilation. The
negative sign indicates mass fraction and the sum is unity.

54
3.1.3.2. Source Specifications
Source and type of radiation particles for an MCNP problem are specified by the SDEF
command. The SDEF command has several variables or parameters that are used to
define all the characteristics of all sources in the problem. Only one SDEF card is allowed
in an input file. Defining neutron source particles with 1 MeV energy is by specifying
“par=1” and “erg=1.0.” Specification of the position is at the origin pos=0 0 0.
sdef erg=1 par=1 pos=0 0 0 $ point Source with 1 MeV
neutrons
sdef erg=d1 par=1 pos=0 0 0 rad=0 $point source with
fission neutron energy dist.
sp1 -3 0.988 2.249
The energy in the above sdef card is defined by d1, that is a function whose source
probability is mentioned by -3 0.988 2.249. The -3 stands for the Watt fission spectrum
and the last two values are constant for the thermal neutron fission neutron spectrum.
3.1.4. Tally Cards
The tally cards are used to specify what you want to learn from the Monte Carlo
calculation. For example, current across a surface, flux at a point, etc. The tallies are
identified by tally type and particle type. Tallies are given the numbers 1, 2, 4, 5, 6, 7, 8
or increments of 10 thereof, and are given the particle designator :N or :P or :E (or :N,P
only in the case of tally type 6 or P,E only for tally type 8). The following format
generalizes for defining a Tally card/instruction
Fn:pl S1 S2 S3
n = tally number
pl = N or P or N,P or E

55
Si = problem number of surface or cell for tallying
F2:pl average surface flux N or P or N,P
F4:pl average flux in a cell N or P or N,P
The units for both F2 and F4 tallies are per cm2, unless otherwise specified with an FM
card, tallies are always normalized to one source particle.
3.1.5. Input File Format
The input file describes the geometry of the problem, materials and define radiation
sources and variety of results needed from the calculation. Input lines can have a
maximum of 80 columns and command mnemonics begin in the first 5 columns. Free
field format (one or more spaces separating items on a line) is used and alphabetic
characters can be upper, lower, or mixed case. A continuation line starts with 5 blank
columns or a blank followed by an & at the end of the card to be continued. The input file
structure is detailed below.
Message Block {optional}
blank line delimiter {optional}
One Line Problem Title Card
Cell Cards [Block 1]
blank line delimiter
Surface Cards [Block 2]
blank line delimiter
Data Cards [Block 3]
blank line terminator {optional}

56
3.2. Three Dimensional PTR Fuel Channel
The complete PTR fuel channel created in MCNP 4a code is composed of 78 surfaces and
79 cells. The cell temperatures have been taken into account in the code to simulate the
high temperatures behavior of the coolant and fuel elements nuclides. Six materials have
been used to build the complete model. The model created is shown in Figure 3.1, where
each cell with different material can be seen as having a distinctive color than other cells.
The temperature of PT, fuel elements and coolant are taken as 310°C for subcritical and
625°C for supercritical coolant conditions.
Figure 3. 1. 2-D view of PTR fuel channel (Front View).

57
The fuel for PTR is natural UO2 having a density of 10.6 g/cm3. 4% enriched fuel has
been used in PT SCWR with same density. The ceramic coating on fuel pellets is strong
enough to restrict the thermal expansion of the UO2 in the elements. Therefore, there
would not be much change in the density. Nonetheless, the density of coolant would drop
by a factor of almost 10 times in a supercritical phase.
Model of the PTR fuel channel in 3D is shown in Figure 3.2(a) and (b). The elements are
shown in different colours, to distinguish between different cells in the model. The
annulus gas volume is shown in “Yellow” hollowed space on the outer edge of the PT.
Table 3.1 shows the MCNP 4a calculated mass and atom fraction of materials used in
building the fuel channel.
(a)

58
Figure 3. 2. MCNP model of PTR fuel channel in (a) Angled view and (b) Front
view.
Table 3.1. MCNP 4a calculated mass fraction and atomic fraction of fuel channel
materials
Material Elements Mass Fraction Atom Fraction
Fuel (UO2) U
O
0.8815
0.1185
0.3325
0.6675
Cladding
(Zirconium-4)
Zr
Sn Cr
Fe
Hf
0.9832
0.0140
0.0013
0.0010
0.0005
0.9847
0.0106
0.0021
0.0017
0.0007
Pressure tube (Zr-
2.5 Nb)
Nb
Zr
0.0250 0.9750
0.0247
0.9750
Coolant (D2O) D
O
0.2016 0.7984
0.6680 0.3320
Annulus gas (CO2) C
O
0.2729
0.7271
0.3334
0.6666
Calandria tube
(Zircalloy-2)
Zr
Sn
Fe
Cr
Ni
0.9832
0.0140
0.0013
0.0010
0.0005
0.9847
0.0106
0.0021
0.0017
0.0007

59
3.3. Fuel Channel Simulation Parameters
In a CANDU reactor, fission is occurring in all the fuel elements in a bundle at different
rates, in fissile and fertile isotopes. About 90% of fissions are thermal fissions in 235
U and
less than 3% are fast fissions in 238
U nuclides. As time progresses, there is a buildup of
fission products in the fuel bundle, such as 135
Xe, 131
I and 137
Cs. There is also a
production of fissile isotopes which participate in the fission such as 239
Pu. The neutron
absorption cross sections in a fresh fuel bundle would be considerably different from that
in a burned up fuel one. The model is based on the assumption that the fuel is fresh
having zero burn up, and there are no fission products present in it.
3.3.1. Neutron Sources Placement
The fuel bundle consists of a Central element and 3 rings around it. Every element in a
ring behaves similar to other elements in that ring due to symmetry: Angle subtended at
the centre between adjacent elements in a ring are equal. A neutron source placed in a
fuel element produces fission neutrons which traverse through the fuel element as shown
in Figure 3.3.
Figure 3. 3. Neutron movement in UO2 element.
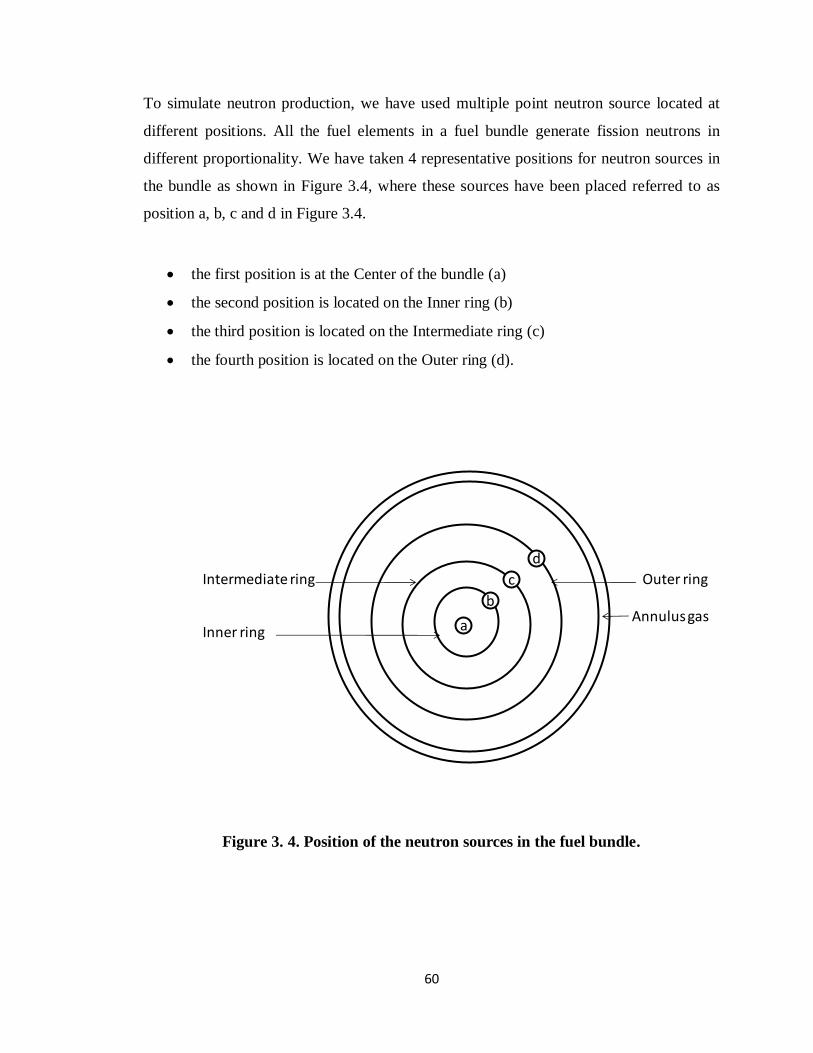
60
To simulate neutron production, we have used multiple point neutron source located at
different positions. All the fuel elements in a fuel bundle generate fission neutrons in
different proportionality. We have taken 4 representative positions for neutron sources in
the bundle as shown in Figure 3.4, where these sources have been placed referred to as
position a, b, c and d in Figure 3.4.
the first position is at the Center of the bundle (a)
the second position is located on the Inner ring (b)
the third position is located on the Intermediate ring (c)
the fourth position is located on the Outer ring (d).
Figure 3. 4. Position of the neutron sources in the fuel bundle.
a
b
c
d
Annulus gas
Outer ring
Inner ring
Intermediate ring
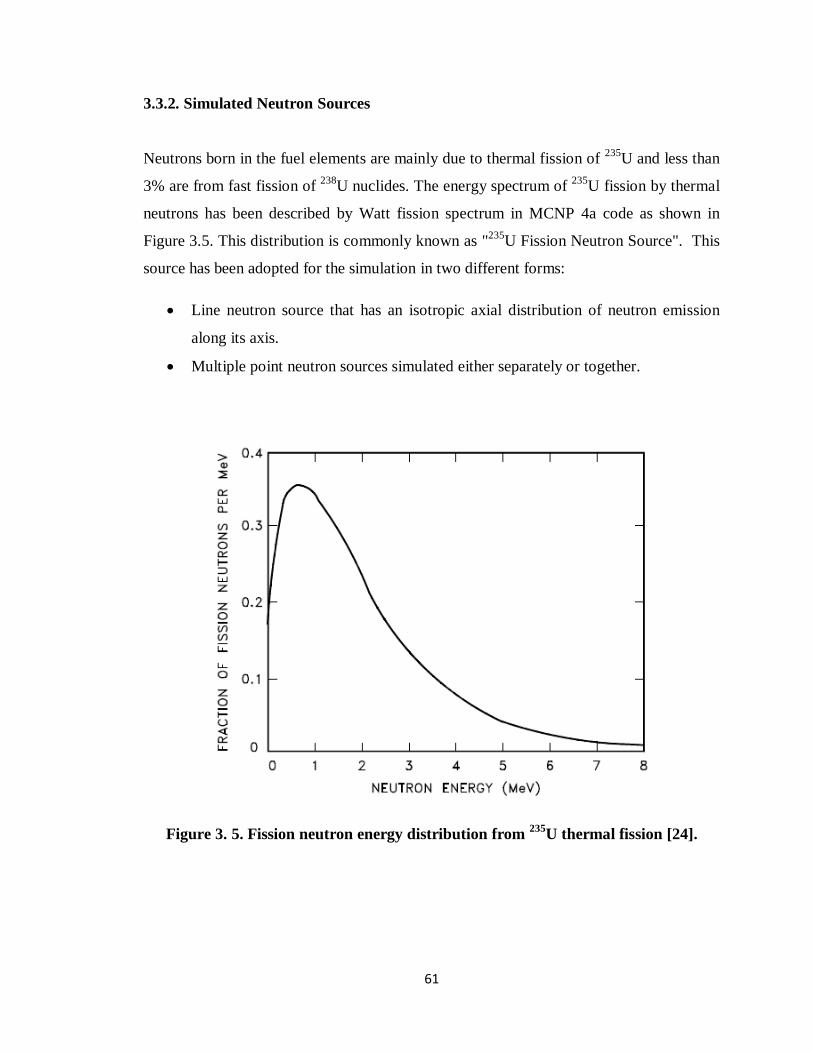
61
3.3.2. Simulated Neutron Sources
Neutrons born in the fuel elements are mainly due to thermal fission of 235
U and less than
3% are from fast fission of 238
U nuclides. The energy spectrum of 235
U fission by thermal
neutrons has been described by Watt fission spectrum in MCNP 4a code as shown in
Figure 3.5. This distribution is commonly known as "235
U Fission Neutron Source". This
source has been adopted for the simulation in two different forms:
Line neutron source that has an isotropic axial distribution of neutron emission
along its axis.
Multiple point neutron sources simulated either separately or together.
Figure 3. 5. Fission neutron energy distribution from 235
U thermal fission [24].
62
3.4. Simulation Model
The simulations have been carried out for both the PT and PT SCWR fuel channels. The
above described neutron sources have been used in the simulation to calculate the neutron
flux and transmutation rates in the annulus gas for different pressure and temperature
conditions.
3.4.1. PTR Fuel Channel Model
Fission neutrons produced in fuel elements in each ring of the bundle traverse different
paths to reach the annulus gas. During their course, neutrons undergo different nuclear
reactions such as scattering or absorption. The determination of a generalized result
widely depends on the assumptions that are available to consider and that will give a
reliable solution. To obtain the neutron flux in the annulus gas, F4 Tally of the code has
been used. This would yield the average neutron flux in the cell. The term “Cell” refers
to a definite physical space filled with a material. In our case, the “Annulus Cell” refers
to the annulus gas gap in the simulated model.
The neutron source has been placed in the central element and then moved to next
element of the other rings. Individual source variation helps to better understand the
degree of moderation provided by the coolant. The flux variation in the annulus caused by
each change in the position of the source has been recorded.
The neutrons in the inner elements have the highest probability to be absorbed in the fuel
elements and would also cause more fission, since they get to travel longer distances
before reaching the moderator.
To illustrate the traveling process of neutron from their point of birth to the annulus gas,
screenshots from MCNP 4a in Figure 3.6 and 3.7 have been presented. They show
numerous “Dots” in the lattice cell representing the collisions which neutrons suffer as
they exit the channel. Neutrons are seen colliding with coolant nuclides of D and O

63
throughout the PT in the fuel channel. In Figure 3.6, single neutron source is placed in
central element and then moved to next ring element, whereas multiple neutron source
placed in the PTR fuel channel shown in Figure 3.7.
(a) (b)
(c) (d)
Figure 3. 6. PTR fuel channel simulation for single neutron sources placed in
(a) Central element (b) Inner ring element (c) Intermediate ring element
(d) Outer ring element (Pgas= 0.4 MPa, Tgas= 100°C).
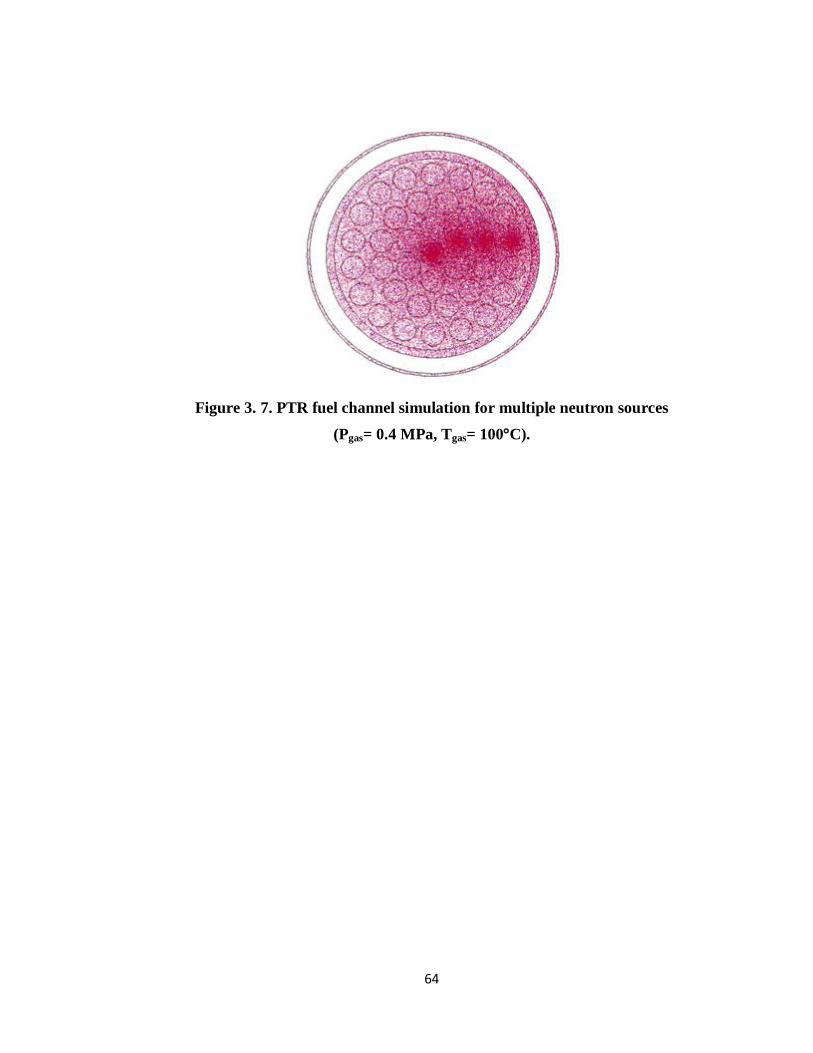
64
Figure 3. 7. PTR fuel channel simulation for multiple neutron sources
(Pgas= 0.4 MPa, Tgas= 100°C).
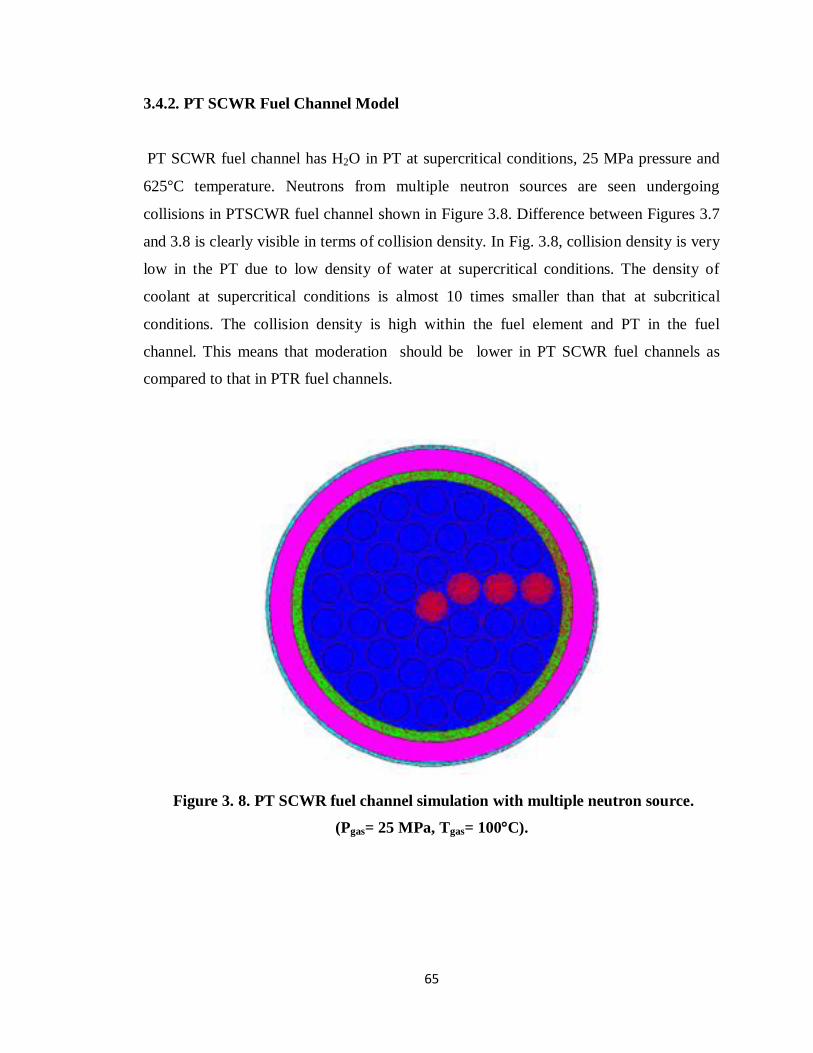
65
3.4.2. PT SCWR Fuel Channel Model
PT SCWR fuel channel has H2O in PT at supercritical conditions, 25 MPa pressure and
625°C temperature. Neutrons from multiple neutron sources are seen undergoing
collisions in PTSCWR fuel channel shown in Figure 3.8. Difference between Figures 3.7
and 3.8 is clearly visible in terms of collision density. In Fig. 3.8, collision density is very
low in the PT due to low density of water at supercritical conditions. The density of
coolant at supercritical conditions is almost 10 times smaller than that at subcritical
conditions. The collision density is high within the fuel element and PT in the fuel
channel. This means that moderation should be lower in PT SCWR fuel channels as
compared to that in PTR fuel channels.
Figure 3. 8. PT SCWR fuel channel simulation with multiple neutron source.
(Pgas= 25 MPa, Tgas= 100°C).
66
CHAPTER 4
RESULTS AND DISCUSSION
Simulations have been carried out for PTR and PT SCWR fuel channels with the same
fuel channel geometries. Each simulation has been executed by filling the annulus with
one single gas and a total of four different gases have been used: CO2, N2, Kr and Ar. The
annulus gas temperature and pressure conditions have been covered for a large span of
values in PTR and PT SCWR channels. Neutrons sources have been placed at central,
inner, intermediate and outer ring elements. Next sections will present the simulation
results and discuss the findings.
4.1. Neutron Flux and Transmutation Rates in PTR Fuel Channel
The flux profiles have been investigated in the annulus gas for the currently used CO2 to
study the effect of coolant moderation on different neutron sources as described above.
This is followed by the computation of transmutation rates in PTR fuel channel annulus.
4.1.1. PTR Annulus Gas Flux with CO2
PTR fuel channel is based on the current CANDU fuel channel design which uses CO2
filled annulus at 0.4 MPa and 100°C. Therefore this annulus gas has been taken as a
reference in the simulation. Flux profiles have been obtained for single point, single line
and multiple neutron sources placed at central, inner, intermediate and outer ring
elements. The results of the simulation are shown in Figure 4.1, 4.2 and 4.3.

67
Source in centre
Source in inner ring
Source in intermediate ring
Source in outer ring
10-4
10-3
10-2
10-1
100
101
102
103
10-7
10-6
10-5
10-4
Single point neutron source
Ne
utr
on
flu
x p
er
so
urc
e n
eu
tro
n, cm
-2s
-1
En, keV
Figure 4. 1(a). Neutron flux in PTR fuel channel annulus with single point source
from low energy to 2 MeV.
From Figure 4.1 (a), when the source was placed at the central position, the neutron
population in the low energy neutron range is about 56% more, when the source was
placed at outer position. This is true for neutron energies up 500 keV, where this value
presents 70%. However, after 600 keV, the population of neutrons is 60% higher when
going from the central position to the outer one. For the first case, neutrons travel very
long distances to reach the annulus gas and therefore their energies are reduced. Thus,
their population is larger than those neutrons coming from the outer position which is
much closer to the annulus gas and they don’t have chances to reduce their energy to the
thermal value. To illustrate this difference of the flux behavior in the two different
regions, Figure 4.1(b) shows the data from 100 to 2000 keV in linear scale. It worthwhile
to notice that at higher neutron energies, the neutron flux does not depend on the position

68
of the source since those neutrons have enough energy to reach the annulus gas with
lower level of moderation.
102
103
1.0x10⁻⁴
2.0x10⁻⁴
3.0x10⁻⁴
4.0x10⁻⁴
5.0x10⁻⁴
6.0x10⁻⁴
Ne
utr
on
flu
x p
er
so
urc
e n
eu
tro
n, cm
-2s
-1
En, keV
Source in centre
Source in inner ring
Source in intermediate ring
Source in outer ring
Figure 4. 1(b). Neutron flux in PTR fuel channel annulus with single point sources
from 100 keV to 2 MeV.
To investigate the influence of the axial source distribution on the behavior of the neutron
flux in the annulus gas, a special run has been conducted in the same conditions with a
single line source placed at the same positions as mentioned above: central, inner,
intermediate and outer ring elements. The results of such simulation are presented in
Figure 4.2(a), (b).
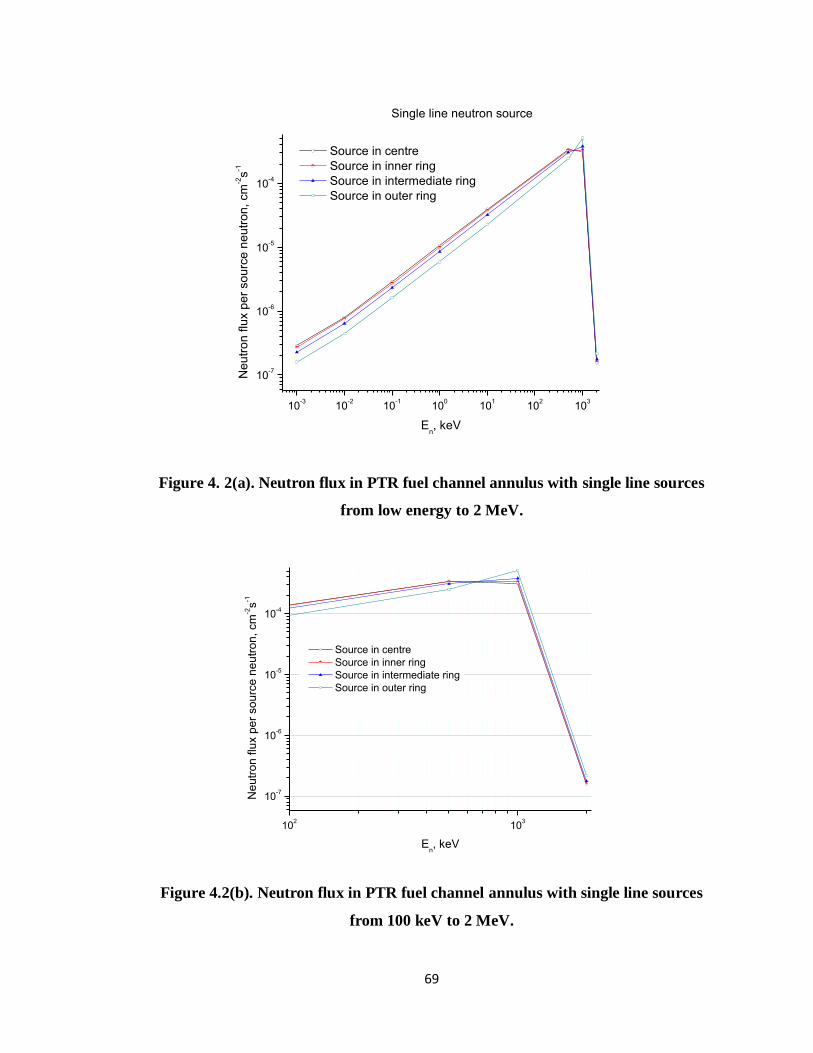
69
Source in centre
Source in inner ring
Source in intermediate ring
Source in outer ring
10-3
10-2
10-1
100
101
102
103
10-7
10-6
10-5
10-4
Single line neutron source
Ne
utr
on
flu
x p
er
so
urc
e n
eu
tro
n, cm
-2s
-1
En, keV
Figure 4. 2(a). Neutron flux in PTR fuel channel annulus with single line sources
from low energy to 2 MeV.
102
103
10-7
10-6
10-5
10-4
Source in centre
Source in inner ring
Source in intermediate ring
Source in outer ring
Ne
utr
on
flu
x p
er
so
urc
e n
eu
tro
n, cm
-2s
-1
En, keV
Figure 4.2(b). Neutron flux in PTR fuel channel annulus with single line sources
from 100 keV to 2 MeV.
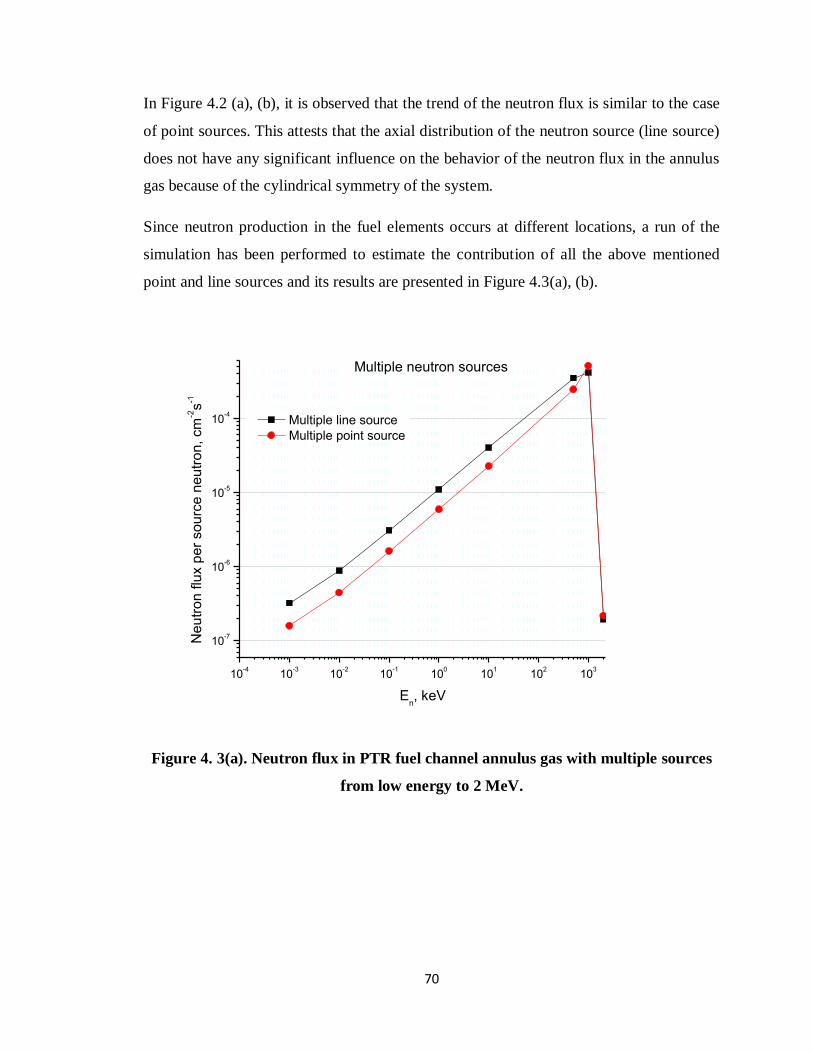
70
In Figure 4.2 (a), (b), it is observed that the trend of the neutron flux is similar to the case
of point sources. This attests that the axial distribution of the neutron source (line source)
does not have any significant influence on the behavior of the neutron flux in the annulus
gas because of the cylindrical symmetry of the system.
Since neutron production in the fuel elements occurs at different locations, a run of the
simulation has been performed to estimate the contribution of all the above mentioned
point and line sources and its results are presented in Figure 4.3(a), (b).
10-4
10-3
10-2
10-1
100
101
102
103
10-7
10-6
10-5
10-4
Multiple line source
Multiple point source
En, keV
Ne
utr
on
flu
x p
er
so
urc
e n
eu
tro
n, cm
-2s
-1
Multiple neutron sources
Figure 4. 3(a). Neutron flux in PTR fuel channel annulus gas with multiple sources
from low energy to 2 MeV.
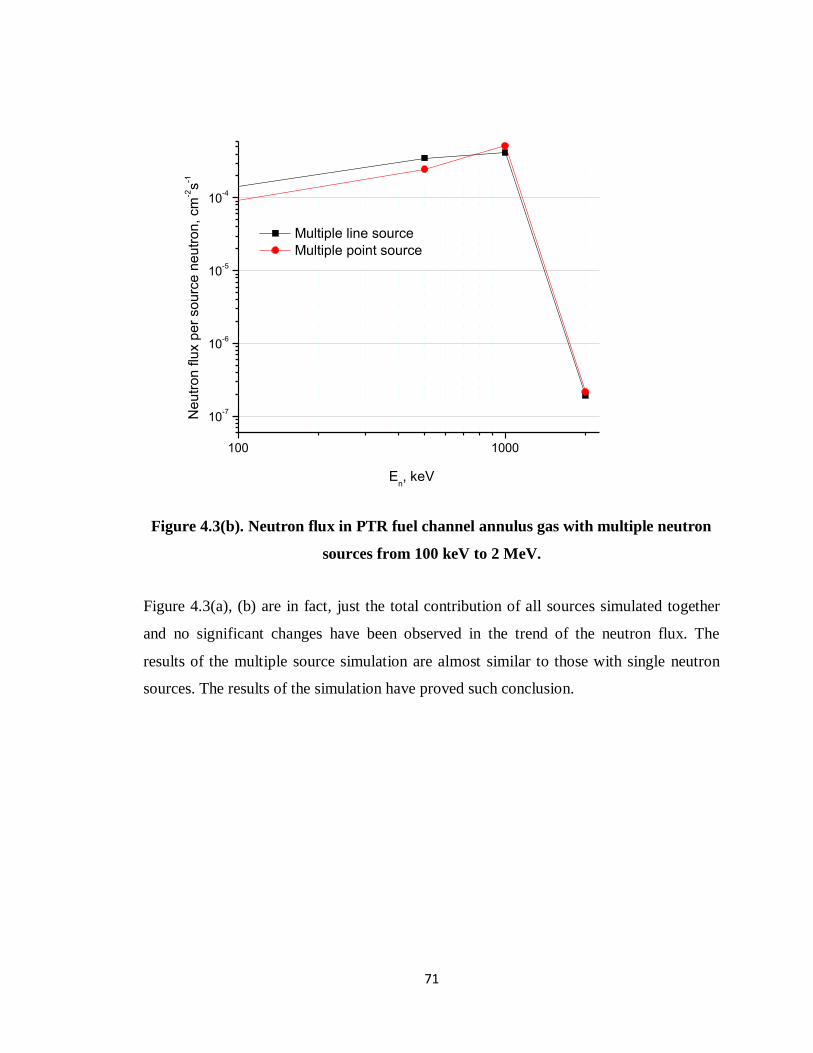
71
100 1000
10-7
10-6
10-5
10-4
En, keV
Multiple line source
Multiple point source
Ne
utr
on
flu
x p
er
so
urc
e n
eu
tro
n, cm
-2s
-1
Figure 4.3(b). Neutron flux in PTR fuel channel annulus gas with multiple neutron
sources from 100 keV to 2 MeV.
Figure 4.3(a), (b) are in fact, just the total contribution of all sources simulated together
and no significant changes have been observed in the trend of the neutron flux. The
results of the multiple source simulation are almost similar to those with single neutron
sources. The results of the simulation have proved such conclusion.
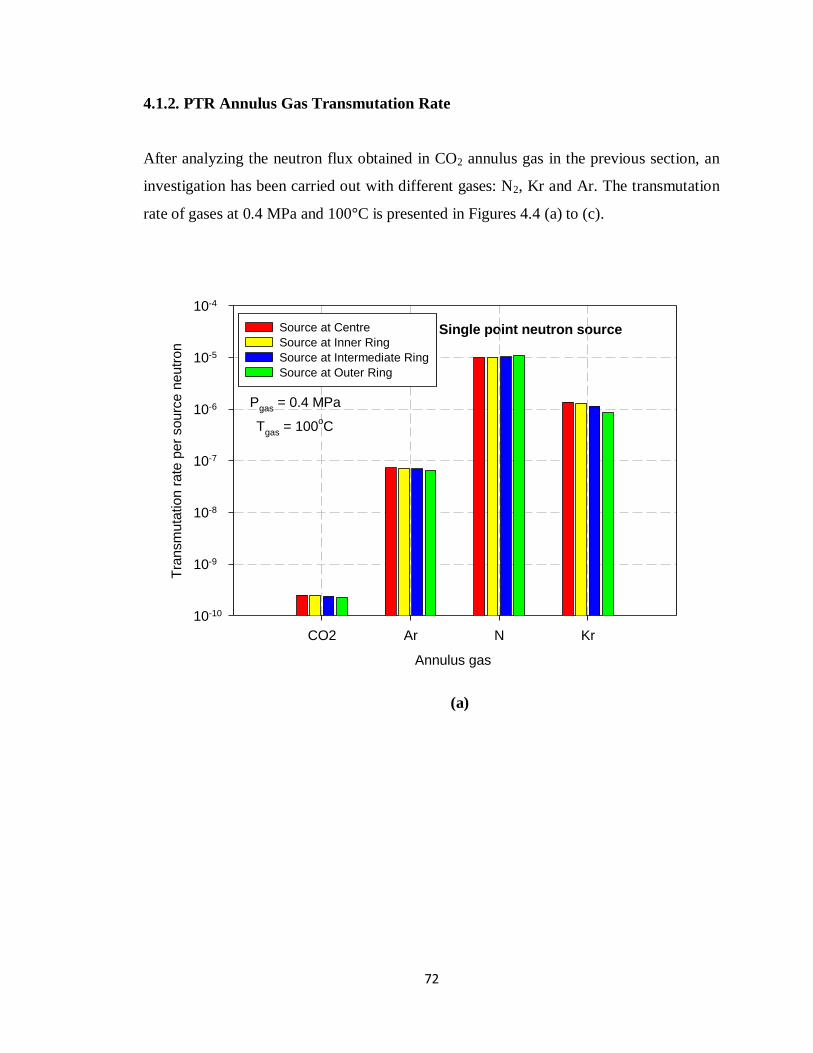
72
4.1.2. PTR Annulus Gas Transmutation Rate
After analyzing the neutron flux obtained in CO2 annulus gas in the previous section, an
investigation has been carried out with different gases: N2, Kr and Ar. The transmutation
rate of gases at 0.4 MPa and 100°C is presented in Figures 4.4 (a) to (c).
Single point neutron source
Annulus gas
CO2 Ar N Kr
Tra
nsm
uta
tion r
ate
per
sourc
e n
eutr
on
10-10
10-9
10-8
10-7
10-6
10-5
10-4
Source at Centre
Source at Inner Ring
Source at Intermediate Ring
Source at Outer Ring
Pgas
= 0.4 MPa
Tgas
= 100oC
(a)

73
Annulus gas
CO2 Ar N Kr
Tra
nsm
uta
tion r
ate
per
sourc
e n
eutr
on
10-10
10-9
10-8
10-7
10-6
10-5
10-4
Source at Centre
Source at Innner Ring
Source at Intermediate Ring
Source at Outer Ring
Pgas
= 0.4 MPa
Tgas
= 100oC
Single line neutron source
Annulus gas
CO2 N Ar Kr
Tra
nsm
uta
tion r
ate
per
sourc
e n
eutr
on
10-10
10-9
10-8
10-7
10-6
10-5
10-4
Multiple Point Source
Multiple Line Source
Pgas
= 0.4 MPa
Tgas
= 100oC
Multiple neutron source
Figure 4.4. Transmutation rates of annulus gases in PTR fuel channel for (a) Single
point (b) Single line (c) Multiple neutron sources.
(b)
(c)

74
In figure 4.4, for CO2 when the source has been placed at the central position, neutrons
traveling towards the annulus gas undergo a large number of collisions and therefore their
energy is greatly reduced. The population of these low energy neutrons is larger as
compared to those when the source is in outer ring. At these low energies, neutrons have
high probability to interact with nuclides of the annulus gas (high cross section Figure
4.5) and consequently, the transmutation rates are greater compared to other position of
the neutron sources.
The same behavior is seen for Kr that has smaller cross section in G8 neutron energy
group as compared to G6 and G7 groups.
In the same figure, for N2 the transmutation rate increases slightly when the neutron
source is moved from the central position towards the outer ring. This can explained as a
result of a combination of high flux of fast neutrons and presence of resonances.
Especially in G8, the absorption resonances are particularly high as compared to G7.
Hence, the transmutation rates of N2 are highest as compared to other gases.
Energy, MeV
10-11 10-10 10-9 10-8 10-7 10-6 10-5 10-4 10-3 10-2 10-1 100 101
Absorp
tion C
ross S
ection, barn
s
10-7
10-6
10-5
10-4
10-3
10-2
10-1
100
101
102
C 12
O 16
N 14
Ar 40
Kr 84
Figure 4.5. Neutron absorption cross sections of different gases (at T=20°C).
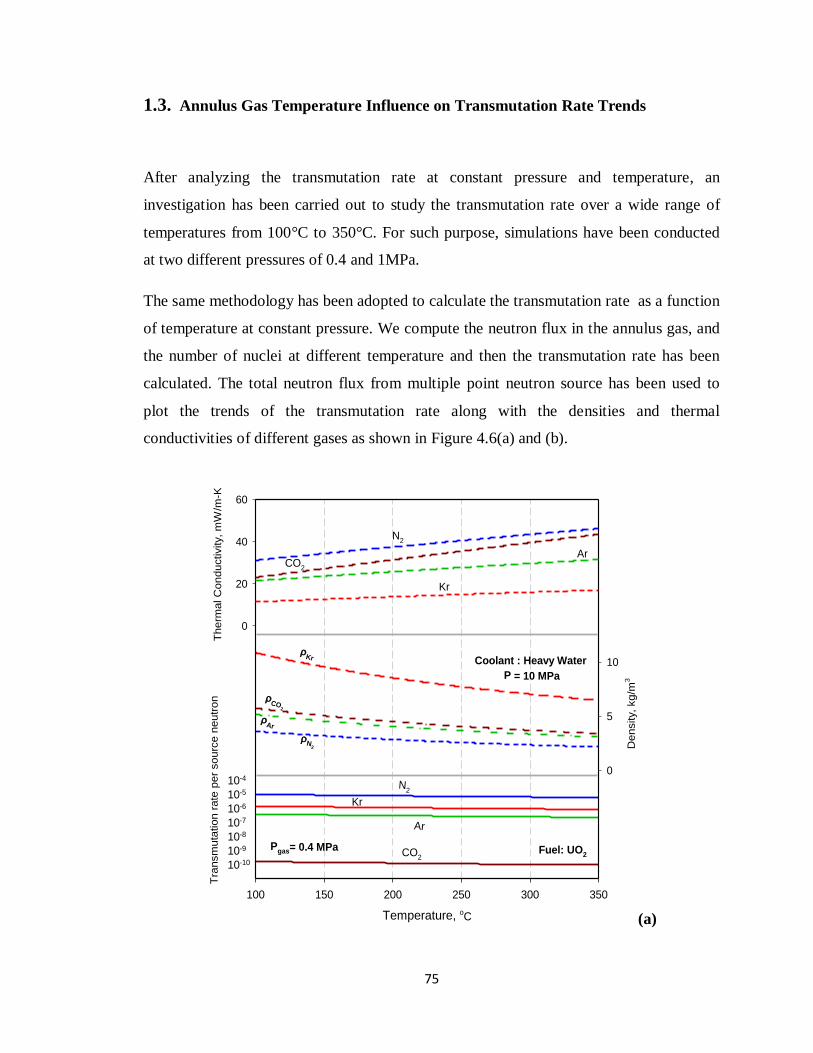
75
1.3. Annulus Gas Temperature Influence on Transmutation Rate Trends
After analyzing the transmutation rate at constant pressure and temperature, an
investigation has been carried out to study the transmutation rate over a wide range of
temperatures from 100°C to 350°C. For such purpose, simulations have been conducted
at two different pressures of 0.4 and 1MPa.
The same methodology has been adopted to calculate the transmutation rate as a function
of temperature at constant pressure. We compute the neutron flux in the annulus gas, and
the number of nuclei at different temperature and then the transmutation rate has been
calculated. The total neutron flux from multiple point neutron source has been used to
plot the trends of the transmutation rate along with the densities and thermal
conductivities of different gases as shown in Figure 4.6(a) and (b).
Temperature, oC
100 150 200 250 300 350
Tra
nsm
uta
tion r
ate
per
sourc
e n
eutr
on
10-10
10-9
10-8
10-7
10-6
10-5
10-4
Density, kg/m
3
0
5
10
Therm
al C
onductivity, m
W/m
-K
0
20
40
60
Pgas= 0.4 MPa
CO2
Ar
Kr
N2
P = 10 MPa
Coolant : Heavy Water
Fuel: UO2
CO
2
N
2
Ar
Kr
CO2
Ar
Kr
N2
(a)
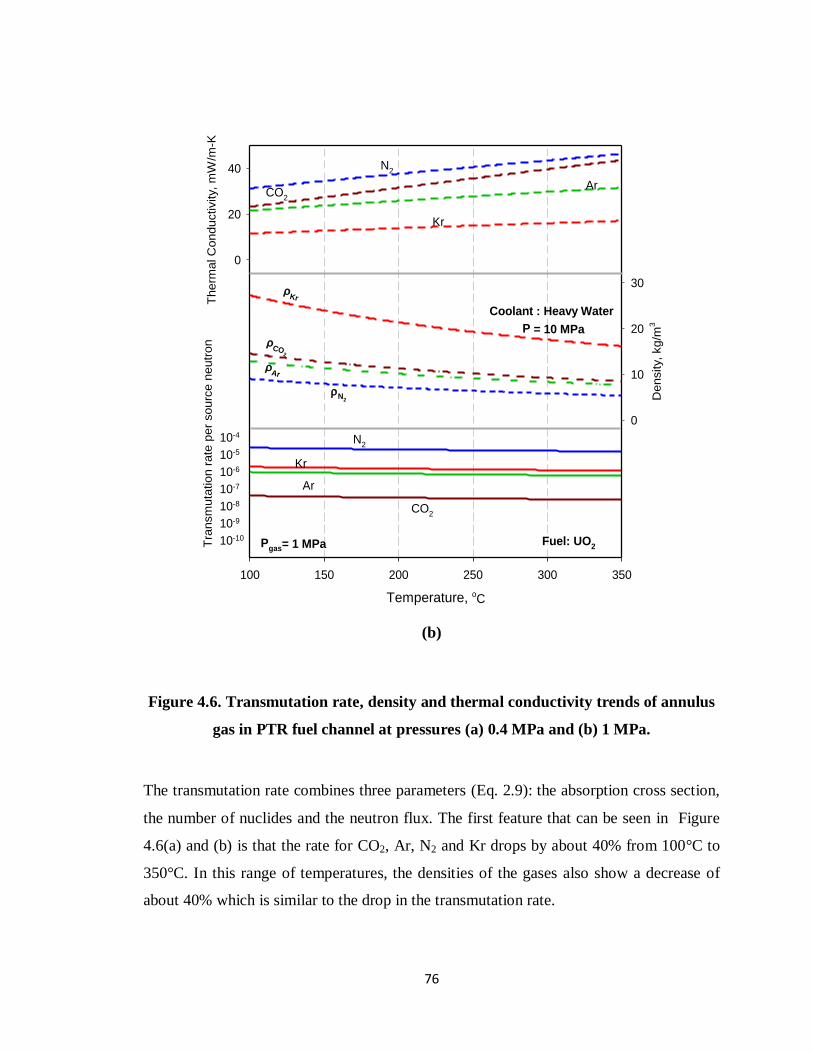
76
Temperature, oC
100 150 200 250 300 350
Tra
nsm
uta
tion r
ate
per
sourc
e n
eutr
on
10-10
10-9
10-8
10-7
10-6
10-5
10-4
Density, kg/m
3
0
10
20
30
Therm
al C
onductivity, m
W/m
-K
0
20
40
Pgas= 1 MPa
CO2
Ar
Kr
N2
P = 10 MPa
Coolant : Heavy Water
Fuel: UO2
CO
2
N
2
Ar
Kr
CO2
Ar
Kr
N2
(b)
Figure 4.6. Transmutation rate, density and thermal conductivity trends of annulus
gas in PTR fuel channel at pressures (a) 0.4 MPa and (b) 1 MPa.
The transmutation rate combines three parameters (Eq. 2.9): the absorption cross section,
the number of nuclides and the neutron flux. The first feature that can be seen in Figure
4.6(a) and (b) is that the rate for CO2, Ar, N2 and Kr drops by about 40% from 100°C to
350°C. In this range of temperatures, the densities of the gases also show a decrease of
about 40% which is similar to the drop in the transmutation rate.
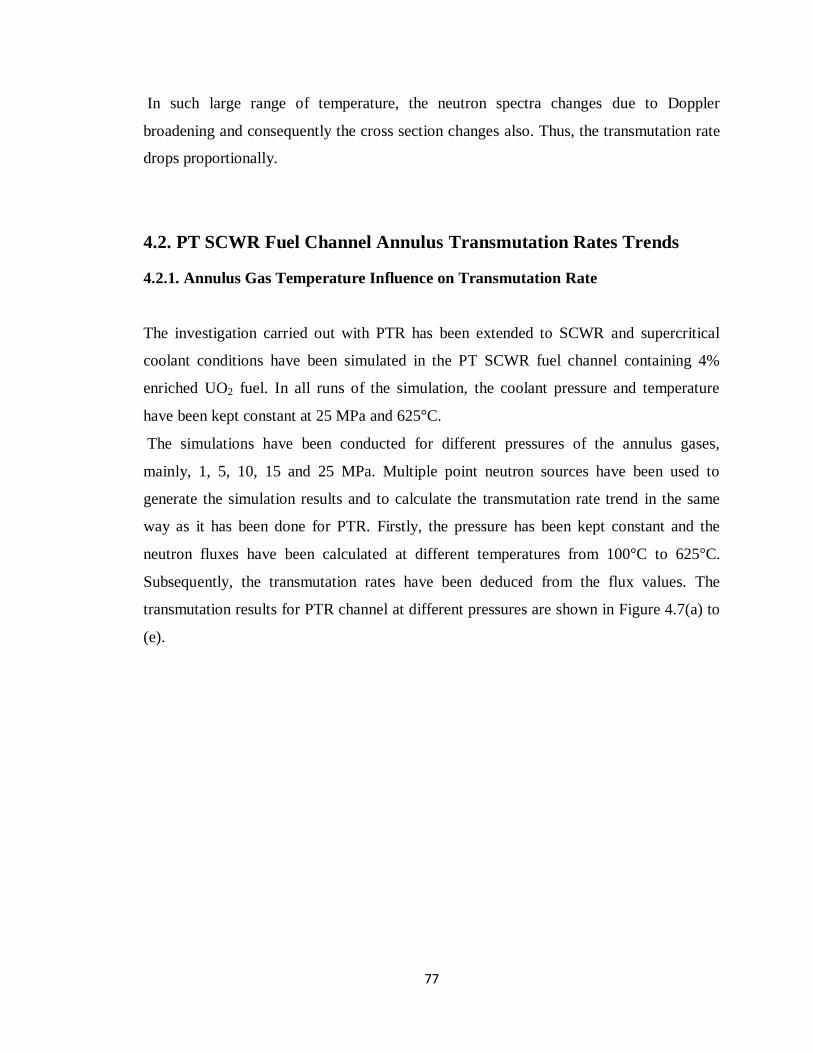
77
In such large range of temperature, the neutron spectra changes due to Doppler
broadening and consequently the cross section changes also. Thus, the transmutation rate
drops proportionally.
4.2. PT SCWR Fuel Channel Annulus Transmutation Rates Trends
4.2.1. Annulus Gas Temperature Influence on Transmutation Rate
The investigation carried out with PTR has been extended to SCWR and supercritical
coolant conditions have been simulated in the PT SCWR fuel channel containing 4%
enriched UO2 fuel. In all runs of the simulation, the coolant pressure and temperature
have been kept constant at 25 MPa and 625°C.
The simulations have been conducted for different pressures of the annulus gases,
mainly, 1, 5, 10, 15 and 25 MPa. Multiple point neutron sources have been used to
generate the simulation results and to calculate the transmutation rate trend in the same
way as it has been done for PTR. Firstly, the pressure has been kept constant and the
neutron fluxes have been calculated at different temperatures from 100°C to 625°C.
Subsequently, the transmutation rates have been deduced from the flux values. The
transmutation results for PTR channel at different pressures are shown in Figure 4.7(a) to
(e).

78
Temperature, oC
100 200 300 400 500 600
Tra
nsm
uta
tion r
ate
s p
er
sourc
e n
eutr
on
10-10
10-9
10-8
10-7
10-6
10-5
10-4
10-3
Density, kg/m
3
0
10
20
30Therm
al C
onductivity, m
W/m
-K
0
25
50
75
Pgas= 1 MPa
CO2
Ar
Kr
N2
Fuel: UO2
CO
2
N
2
Ar
Kr
CO2
Ar
Kr
N2
P = 25 MPa
Coolant : Water
T = 625oC
(a)
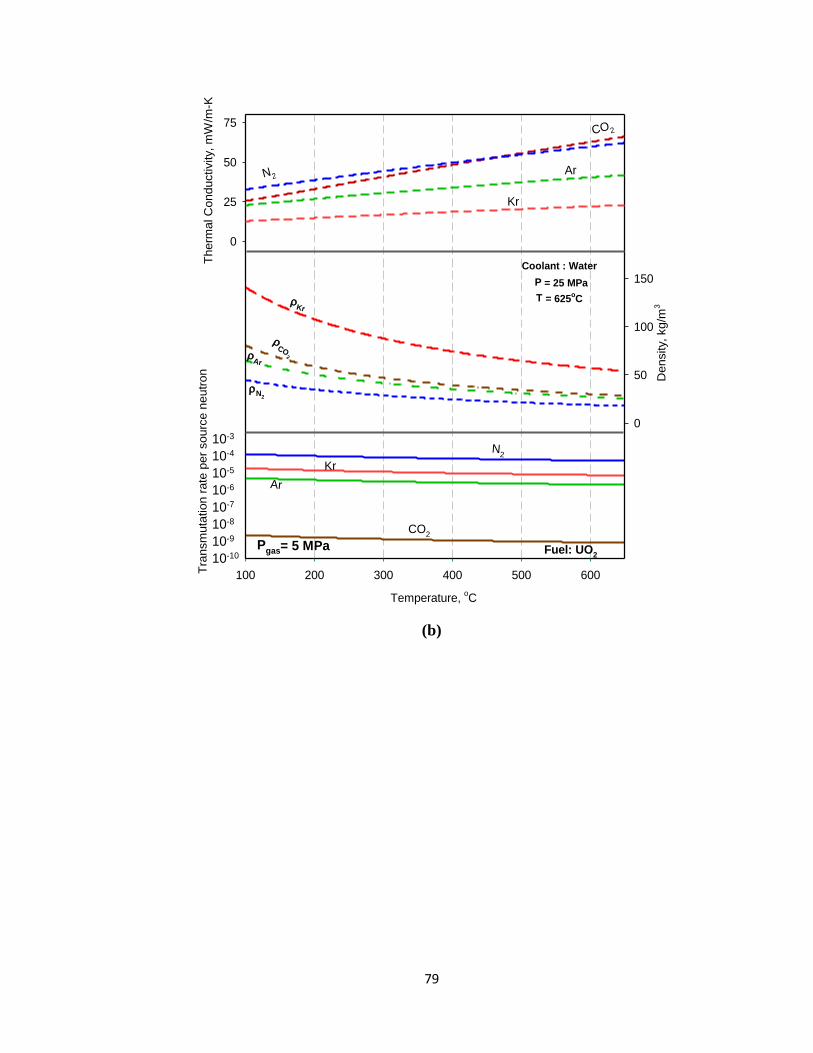
79
Pgas= 5 MPa
Temperature, oC
100 200 300 400 500 600Tra
nsm
uta
tion r
ate
per
sourc
e n
eutr
on
10-10
10-9
10-8
10-7
10-6
10-5
10-4
10-3
Density, kg/m
3
0
50
100
150
Therm
al C
onductivity, m
W/m
-K
0
25
50
75
CO2
Ar
Kr
N2
Fuel: UO2
CO
2
N
2
Ar
Kr
CO2
Ar
Kr
N2
P = 25 MPa
Coolant : Water
T = 625oC
(b)
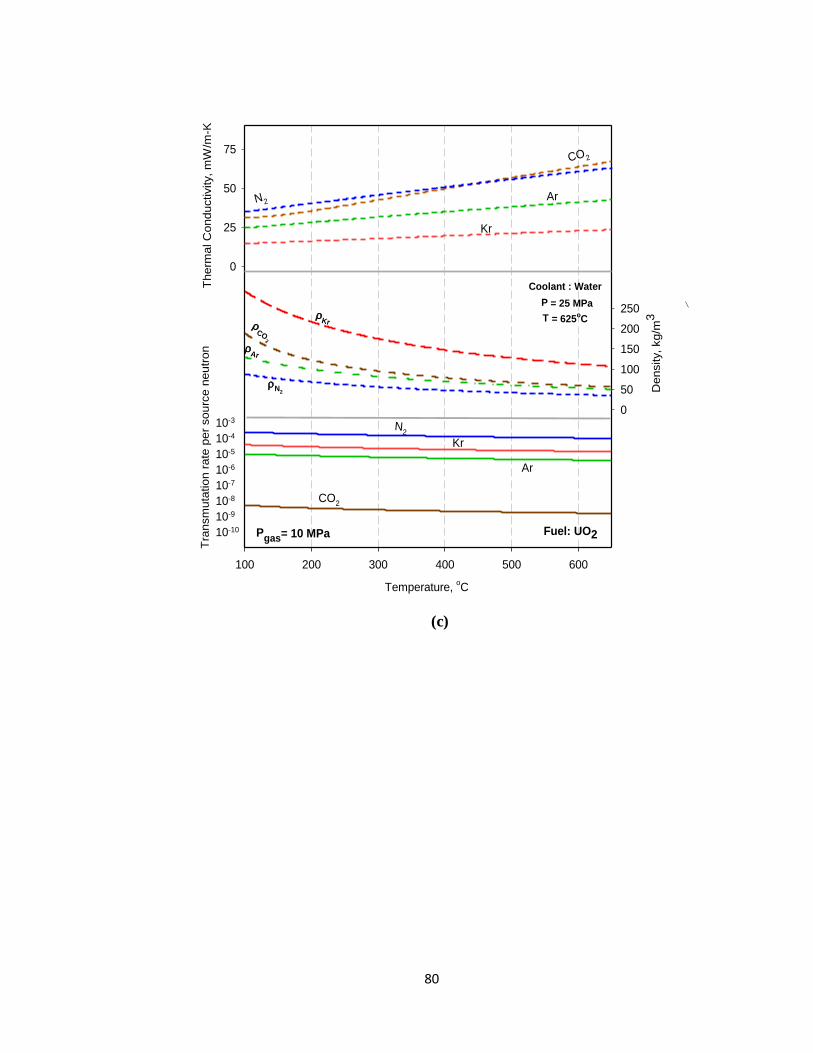
80
Temperature, oC
100 200 300 400 500 600
Tra
nsm
uta
tion r
ate
per
sourc
e n
eutr
on
10-10
10-9
10-8
10-7
10-6
10-5
10-4
10-3
Density, kg/m
3
0
50
100
150
200
250
Therm
al C
onductivity, m
W/m
-K
0
25
50
75
Pgas= 10 MPa
CO2
Ar
Kr
N2
P = 25 MPa
Coolant : Water
Fuel: UO2
T = 625oC
CO
2
N
2
Ar
Kr
CO2
Ar
Kr
N2
(c)

81
Temperature, oC
100 200 300 400 500 600Tra
nsm
uta
tion r
ate
per
sourc
e n
eutr
on
10-10
10-9
10-8
10-7
10-6
10-5
10-4
10-3
Density,
kg/m
3
0
100
200
300
400
Therm
al C
onductivity,
mW
/m-K
0
25
50
75
Pgas= 15 MPa
Ar
Kr
N2
P = 25 MPa
Coolant : Water
Fuel: UO2
T = 625oC
CO
2
N
2
Ar
Kr
CO2
CO2
Ar
Kr
N2
(d)

82
Temperature, oC
100 200 300 400 500 600
Tra
nsm
uta
tion r
ate
per
sourc
e n
eutr
on
10-10
10-9
10-8
10-7
10-6
10-5
10-4
10-3
Density,
kg/m
3
0
150
300
450
600
Therm
al C
onductivity,
mW
/m-K
0
25
50
75
Pgas= 25 MPa
CO2
Ar
Kr
N2
P = 25 MPa
Coolant : Water
Fuel: UO2
T = 625oC
CO2
N
2
Ar
Kr
CO2
Ar
Kr
N2
(e)
Figure 4.7. Transmutation rates, density and thermal conductivity trends of the
annulus gas in PT SCWR fuel channel at pressures (a) 1 MPa, (b) 5 MPa,
(c) 10 MPa, (d) 15 MPa and (e) 25 MPa.
One can see in Figure 4.7 (a) to (e), at constant gas pressures, the gas densities are
exhibiting a decrease with increasing temperature. This leads to a decrease in nuclide
density. In the temperature range between 100°C to 625°C, the transmutation rates drop
by about 60% for all the gases. It is also seen that the thermal conductivities of Ar and Kr
are lower than CO2 and N2 for the same conditions.
83
4.2.2. Annulus Gas Pressure Influence on Transmutation Rate
From the previous simulation conducted at different pressures, in Figure 4.8(a) to (d), we
have plotted the variation of the transmutation rate in the annulus gases as a function of
its pressure and we have picked up few temperature values of 100°C to 500°C. From 1 to
25 MPa, the trends show that the densities of CO2, Ar, Kr and N2 gases increase by about
30, 23, 25 and 22 times; consequently the transmutation rates of these gases go up by the
same factors.
Thermal conductivities of Ar and Kr are maintaining a constant difference of about 10,
12, 13 and 17 units in Fig 4.8 (a), (b), (c) and (d) respectively. At 100°C, CO2 has higher
thermal conductivity than N2 for pressures above 12.5 MPa. At other temperatures,
thermal conductivity curve of CO2 cuts the N2 curve and maintains a small difference.
It should be noted that in a constant volume, the number of nuclides increases when the
pressure increases. However at constant temperature, the Doppler broadening effect
remains constant. Therefore, the dominant factor affecting the transmutation rate is the
number of gas nuclides in the annulus rather than the flux behavior.
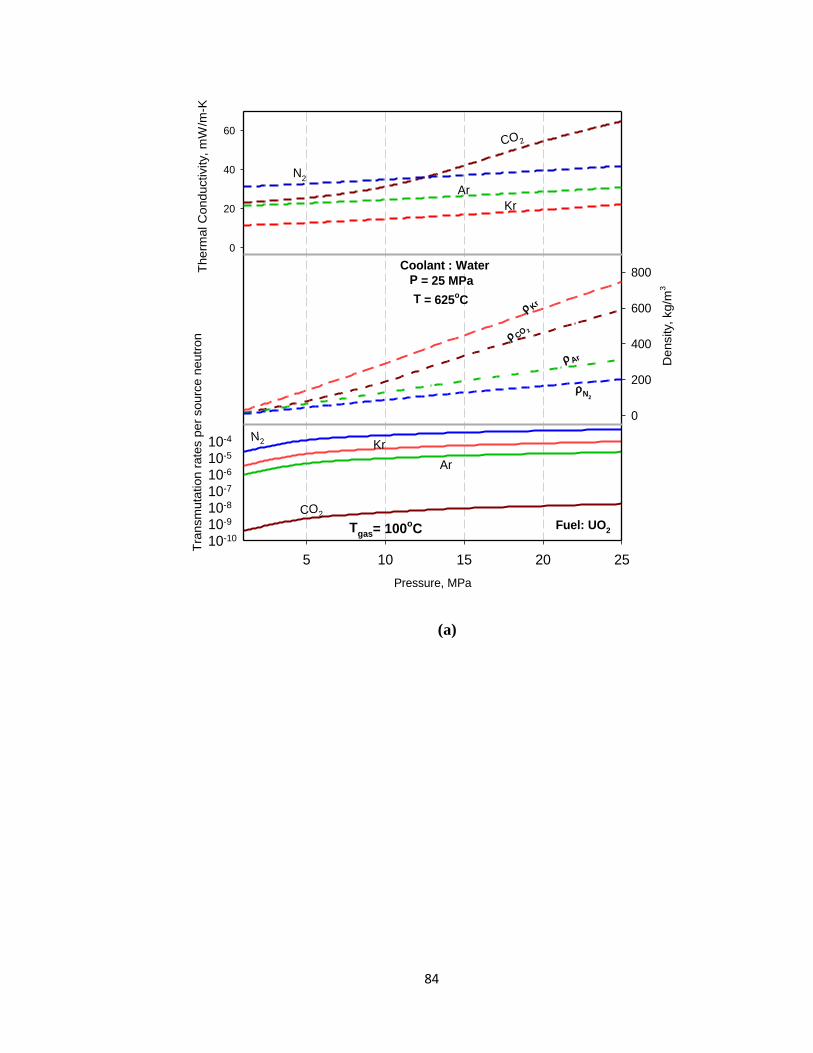
84
Pressure, MPa
5 10 15 20 25
Tra
nsm
uta
tion r
ate
s p
er
sourc
e n
eutr
on
10-10
10-9
10-8
10-7
10-6
10-5
10-4
Density, kg/m
3
0
200
400
600
800Therm
al C
onductivity, m
W/m
-K
0
20
40
60
CO2
Ar
KrN2
Tgas= 100
oC
P = 25 MPa
Coolant : Water
Fuel: UO2
T = 625oC
CO 2
N
2
Ar
Kr
CO2
Ar
Kr
N2
(a)
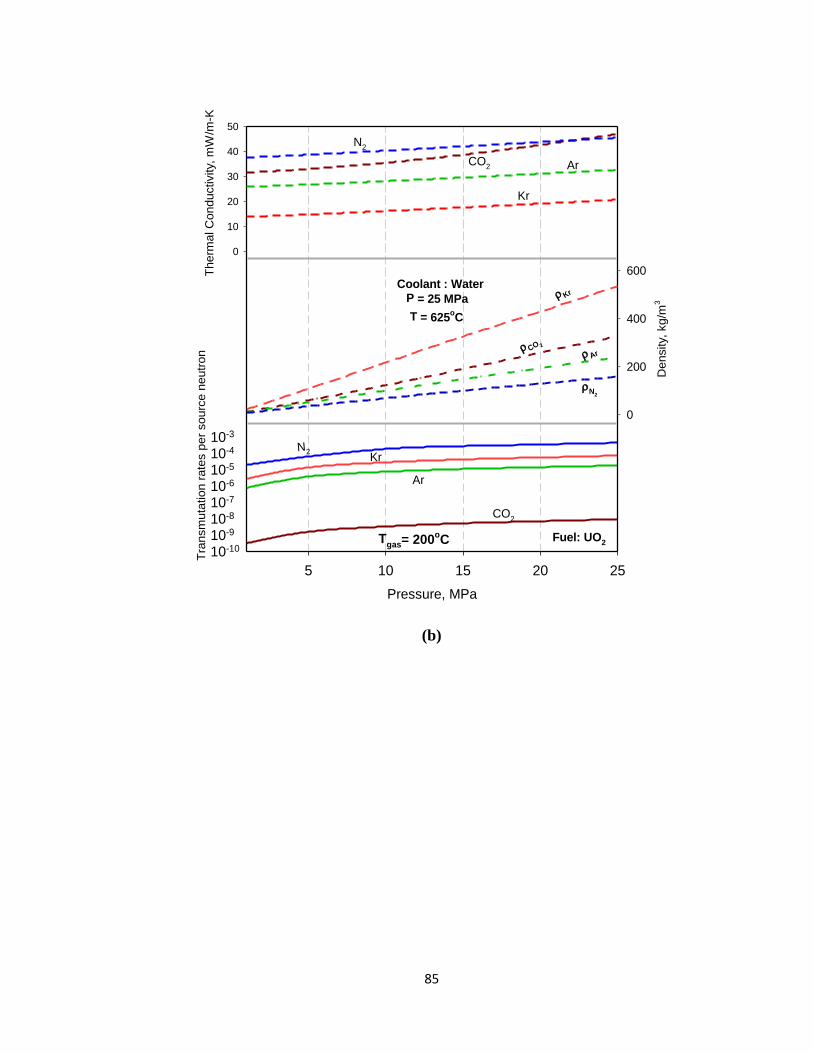
85
Pressure, MPa
5 10 15 20 25
Tra
nsm
uta
tion r
ate
s p
er
sourc
e n
eutr
on
10-10
10-9
10-8
10-7
10-6
10-5
10-4
10-3
Density, kg/m
3
0
200
400
600Therm
al C
onductivity, m
W/m
-K
0
10
20
30
40
50
CO2
Ar
KrN2
Tgas= 200
oC
P = 25 MPa
Coolant : Water
Fuel: UO2
T = 625oC
CO 2
N
2
Ar
Kr
CO2 Ar
Kr
N2
(b)
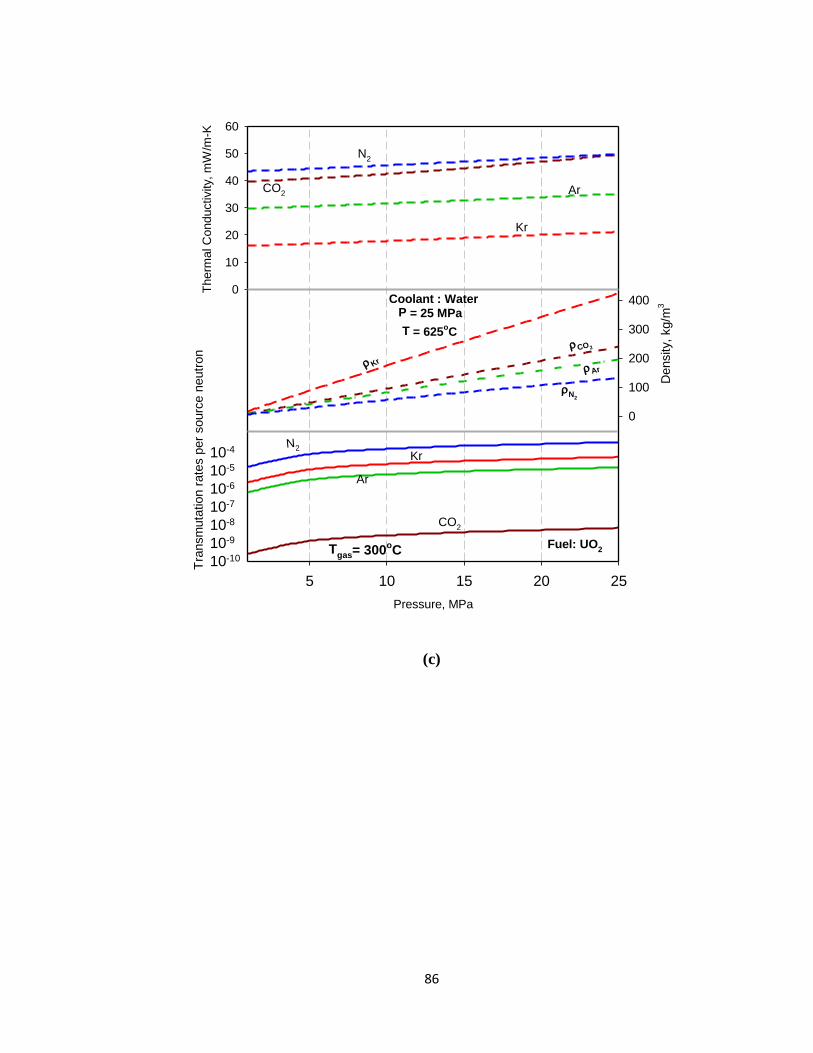
86
Pressure, MPa
5 10 15 20 25
Tra
nsm
uta
tion r
ate
s p
er
sourc
e n
eutr
on
10-10
10-9
10-8
10-7
10-6
10-5
10-4
Density,
kg/m
3
0
100
200
300
400
Therm
al C
onductivity,
mW
/m-K
0
10
20
30
40
50
60
CO2
Ar
KrN2
Tgas= 300
oC
P = 25 MPaCoolant : Water
Fuel: UO2
T = 625oC
CO 2
N
2
Ar Kr
CO2 Ar
Kr
N2
(c)

87
Pressure, MPa
5 10 15 20 25
Tra
nsm
uta
tion r
ate
s p
er
sourc
e n
eutr
on
10-10
10-9
10-8
10-7
10-6
10-5
10-4
Density,
kg/m
3
0
100
200
300
Therm
al C
onductivity,
mW
/m-K
0
20
40
60
CO2
Ar
Kr
N2
Tgas= 500
oC
P = 25 MPa
Coolant : Water
Fuel: UO2
T = 625oC
CO2
N2
Ar
Kr
CO2
Ar
Kr
N2
(d)
Figure 4.8. Transmutation rate, density and thermal conductivity trends of annulus
gas in PT SCWR fuel channel at temperatures (a) 100°C, (b) 200°C, (c) 300°C and
(d) 500°C.

88
4.3. PTR and PT SCWR Comparison
It is crucial in this study to compare the behavior of the annulus gas in both reactors at the
same conditions. This comparison has been done for 1 MPa pressure and 100°C
temperature of annulus gas. In these conditions, PTR and PT SCWR differ only by the
type of coolant which is light water for PT SCWR and heavy water for PTRs. Thus, the
flux in both systems will differ due to the moderation process. Figure 4.9 presents the
histogram of flux behavior in the annulus gases for both reactors.
Energy Groups
G1 G2 G3 G4 G5 G6 G7 G8
Neutr
on flu
x, cm
-2s
-1
10-8
10-7
10-6
10-5
10-4
10-3
PT SCWR annulus flux
PTR annulus flux
Pgas = 1 MPa
Tgas = 100
oC
Figure 4.9. Neutron flux profile in annulus gas for PTR and PT SCWR fuel
channels.
From Figure 4.9, we can see that in PTR, the maximum neutrons are populated in the
energy groups G6, while for PT SCWR, the flux of neutron is highest in group G8. We
have to notice that the cross section of gases in this wide range of neutron changes

89
significantly. For instance, the ratio of effective cross section ( eff) of oxygen in G6 and
G8 is 2.02. But the integral transmutation rate over this energy range depends on the
product of the effective cross section and the neutron flux at constant pressure. Table 4.1
lists the ratio of the integral transmutation rate for PT and PT SCWR at 1 MPa pressure
and 100°C gas temperature for different gases.
Table 4. 1. Ratios of integral transmutation rates in PTR and PT SCWR fuel
channel annulus
Gas
Transmutation rate, s-1
per source neutron in
PTR
Transmutation rate, s-1
per
source neutron in PT SCWR
Ratio
(PTR/PTSCWR)
CO2 3.96×10⁻⁸
4.01×10⁻¹⁰
0.98
Kr 1.92×10
-6 3.50×10
-6 0.56
Ar 9.71×10
-7 9.70×10
-7 1.00
N2 2.50×10⁻⁵
2.4×10⁻⁵
1.04
From table 4.2, it is clear that the transmutation rates are almost the same in both reactors
for CO2, Ar and N2 , while in case of Kr it is around 50% higher in SCWR than in PTR .
90
CONCLUSIONS
A three dimensional model of the PTR and PT SCWR fuel channel containing 37-element
fuel bundle was developed using MCNP 4a code. The annulus gas for the two reactors
has been simulated at different pressure and temperature conditions.
Single and multiple neutron sources were used to study the fluxes and transmutation rates
of different gases at 0.4 MPa and 100°C in PTR fuel channel annulus.
Multiple point neutron sources were placed in fuel bundles of the PTR and PT SCWR
fuel channels. Transmutation rates were investigated in large range of temperature at
constant pressures.
In case of PTR fuel channel, annulus gases were simulated at 0.4 MPa and 1 MPa
whereas in PT SCWR fuel channel higher pressures were considered, mainly 1, 5, 10, 15
and 25 MPa.
Neutron flux profiles in fuel channel annulus gas have been studied for both PTR and PT
SCWR fuel channel. The flux profile shows that the contribution of fast neutrons are
higher for neutron energy group G6 (10-500 keV) in PTR, but it has almost a flat
distribution from G6 (10-500 keV) to G8 (1-2 MeV) in PT SCWR fuel channels. The
difference in densities of subcritical and supercritical coolants is the main contributing
factor to the neutron spectra in the annulus gas.
The calculations show that for PTR and PT SCWR fuel channels, CO2 has the lowest
transmutation rates as compared to other gases. Therefore, replacing CO2 with any inert
gas such as Ar or Kr would not help in any way to reduce the transmutation rate.
The analysis of the simulation data shows that the transmutation rate as function of
temperature and pressure for individual gases remain nearly constant with respect to other
gases.
Increasing the annulus pressures in PTR or PT SCWR fuel channels mainly affects the
gas density. However, when the temperature is increased, the densities of the gases are

91
dropping and transmutation rate is affected. Doppler effect is also contributing to the
transmutation variations in the large energy range.
Transmutation rate depends not only on the neutron flux in the annulus gas but also on
the effective neutron cross section for a specific neutron energy group and the gas
density. In the fast neutron region G7 and G8, high neutron fluxes are compensated by the
small neutron cross section leaving the gas density as the dominant factor in judging the
transmutation rate.
A comparison between PT and PT SCWR shows that at the same P and T, the
transmutation rate ratios are almost the same for all the gases in both the reactors except
for Kr, where the rate differs by about 50%.
92
FUTURE WORK
Future research could focus on determination of transmutation rates for energy groups
upto 15 MeV neutron energies to achieve more precise values. The fuel channel model
can be extended to CANFLEX bundles or any other fuel geometry used in CANDU
reactors to study the flux profile in the annulus of the fuel channel.
The annulus gas could be replaced by a ceramic composite as it is the case of CANDU-
SCWR, to study the performance of the ceramic material in minimizing the heat losses to
the moderator.
Fuel composition can be changed to study the flux spectra in case of enriched fuel, MOX
fuel and Thoria based fuels.
The knowledge of the neutron spectra in the annulus gas would assist in selecting
appropriate material to minimize the transmutation rate.
93
REFERENCES
(1) Dutton R., Moeck E.O., Spinks N.J., Coleman C. E., Cheadle B. A., Lane A. D.,
Miller A. I., Judd R. A.and Lupton L. R., Advanced Technologies for CANDU
Reactors. Nuclear Engineering and Design, 1993, Vol. 144, pp. 269-281.
(2) Winfield A., Reactor Auxiliary Systems, Nuclear Training Course 133, 1977,
OPG Doc ID 20041313.
(3) CANDU 6 Program Team, “CANDU 6 Technical Summary”, Reactor
Development Business Unit, AECL, June 2005.
(4) Li C., Shan J., Leung L.K.H., Sub channel Analysis of CANDU SCWR Fuel,
Progress in Nuclear Energy, 2009, Vol. 51, pp.799-804.
(5) Mokry S., Pioro I., Farah A., King K., Gupta S., Peiman W., Kirilov P.,
Development of Supercritical Water Heat Transfer Correlation for Vertical Bare
Tubes, Nuclear Engineering and Design, 2011, Vol. 241, pp. 1126-1136.
(6) Shan J., Chen W., Rhee B. W., Leung L.K.H., Coupled Neutronics/Thermal-
Hydraulics Analysis of a CANDU-SCWR Fuel Channel. Annals of Nuclear
Energy, 2010, Vol. 37, pp. 58-65.
(7) Chow C.K., Kharbatil H.F., Conceptual Fuel Channel Designs for CANDU-
SCWR, Nuclear Engineering and Technology, 2007, Vol. 40, pp. 139-146.
(8) Walters L.C., Williams A.F., CANDU Fuel Bundle Deformation Model, 2004
International ANSYS Conference 52.

94
(9) Nuclear Reactor Systems, Fundamentals of Power Reactors, Training Course
Module 2, CNSC Technical Documents, January 1996.
(10) Stu Groom, “Chemistry Control Requirement for Generic CANDU Power
Station, IAEA Training, May 2003.
(11) Yim M.S., Caron F., Life Cycle and Management of Carbon-14 from nuclear
Power Generation, Progress in Nuclear Energy, 2006, Vol. 48, pp. 2-36.
(12) Environmental Impact Assessment Report for Cernavoda NPP Units 3 and 4.
The National Institute of Research and Development for Environmental
Protection. ICIM Bucharest Contract 203/2006.
(13) Hopwood J., “The ACR: Advanced CANDU Reactors for North America,
AECL, April 2004.
(14) Lemmon E.W., Huber M.L., Mc Linden M.O., “Reference Fluid
Thermodynamic and Transport Properties, NIST Standard Reference Database 23,
Version 8.0, US Secretary of Commerce, USA.
(15) Reactor Physics- Science and Reactor Fundamental Technical Training Group,
CNSC, Jan 2003.
(16) Murray R., Nuclear energy- An Introduction to the Concepts, Systems, and
Applications of Nuclear Processes, 2009, Butterworth-Heinemann.
(17) Zafar Y., Calculation of Fuel Burn up and Radioactive Inventory in a CANDU
Reactor using WIMS-D4 Code, Annals of Nuclear Energy, 2010, Vol. 37, pp.
66 -70.
95
(18) Sahin S.,Yildiz K., Sahin H.M., Sahin N., Acir A, Increased Fuel Burn up in a
CANDU Thorium Reactor using Weapon Grade Plutonium, Nuclear
Engineering and Design, 2006, Vol. 236, pp. 1778-1788.
(19) Pelowitz D.B., MCNP User’s Manual, 2008, Version 2.6.0.
(20) Maria A., Introduction to Modeling and Simulation, Proceedings of the 1997
Winter Simulation Conference, SUNY, New York, USA.
(21) Briss I.R., Helium Production in Reactor Materials, Journal of Nuclear
Materials, 1970, Vol. 34, pp. 241-259.
(22) Briesmeister J.F., “MCNP- A General Monte Carlo N-Particle Transport Code”,
Los Alamos National Laboratory, New Mexico, USA, LA 12625M, November
1993.
(23) Kovaltchouk V., Machrafi R., Monte Carlo Simulations of Response Functions
for Gas Filled and Scintillator Detectors with MCNPX Code, Annals of Nuclear
Energy, Vol. 38, 2011, pp. 788-793.
(24) Nuclear Physics and Reactor Theory: Fundamentals Handbook. , Vol. 1 of 2.
U.S. Department of Energy FSC-6910, Washington, D.C. 20585, DOE-HDBK-
1019/1-93, January 1993.
(25) ENDFPLOT: Online graph plot for neutron cross section.
“atom.kaeri.re.kr/endfplot.shtml”

96
APPENDIX A
MCNP CODE OF PTR AND PT SCWR FUEL CHANNEL
1 204 -6.55 -75 76 79 -82
2 205 -0.00393 -76 77 79 -82
3 203 -6.55 -77 78 79 -82
4 200 -10.64 -2 80 -81
5 202 -6.517 -1 79 -82 (2 :-80 :81 )
6 200 -10.64 -4 80 -81
7 202 -6.517 -3 79 -82 (4 :-80 :81 )
8 200 -10.64 -5 80 -81
9 202 -6.517 -6 79 -82 (5 :-80 :81 )
10 200 -10.64 -7 80 -81
11 202 -6.517 -8 79 -82 (7 :-80 :81 )
12 200 -10.64 -10 80 -81
13 202 -6.517 -9 79 -82 (10 :-80 :81 )
14 200 -10.64 -11 80 -81
15 202 -6.517 -12 79 -82 (11 :-80 :81 )
16 200 -10.64 -14 80 -81
17 202 -6.517 -13 79 -82 (14 :-80 :81 )
18 200 -10.64 -15 80 -81
19 202 -6.517 -16 79 -82 (15 :-80 :81 )
20 200 -10.64 -18 80 -81
21 202 -6.517 -17 79 -82 (18 :-80 :81 )
22 200 -10.64 -19 80 -81
23 202 -6.517 -20 79 -82 (19 :-80 :81 )
24 200 -10.64 -22 80 -81
25 202 -6.517 -21 79 -82 (22 :-80 :81 )
26 200 -10.64 -23 80 -81
27 202 -6.517 -24 79 -82 (23 :-80 :81 )
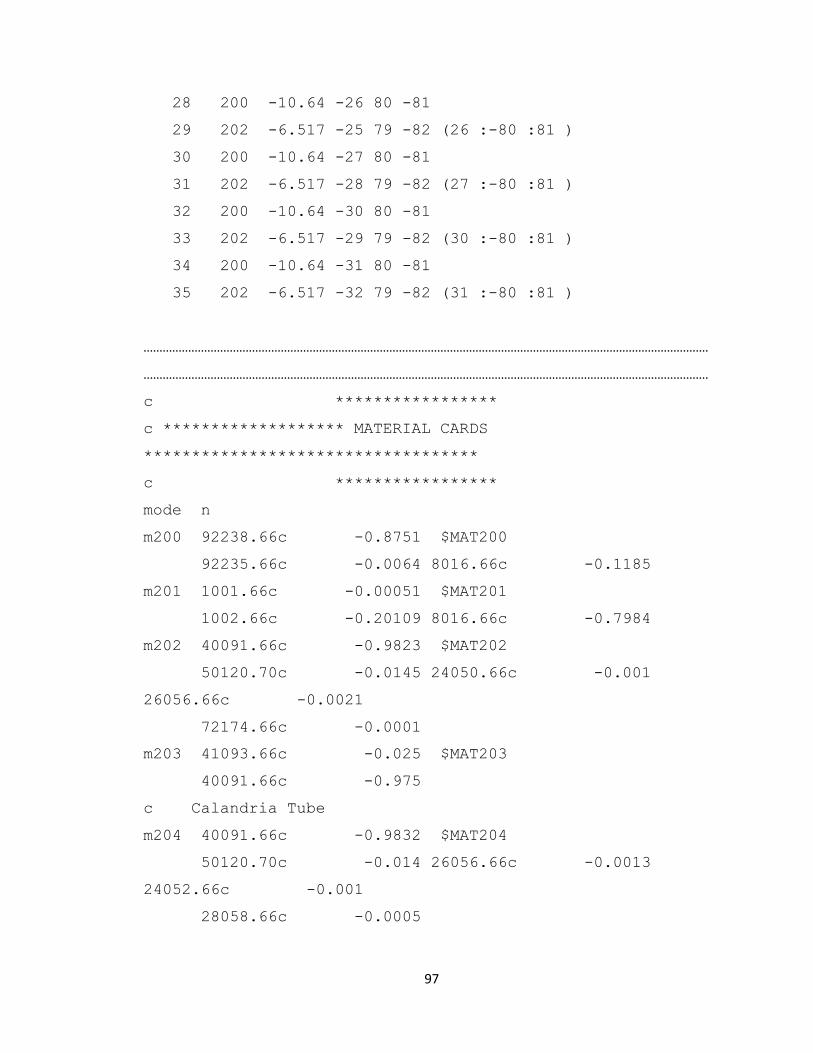
97
28 200 -10.64 -26 80 -81
29 202 -6.517 -25 79 -82 (26 :-80 :81 )
30 200 -10.64 -27 80 -81
31 202 -6.517 -28 79 -82 (27 :-80 :81 )
32 200 -10.64 -30 80 -81
33 202 -6.517 -29 79 -82 (30 :-80 :81 )
34 200 -10.64 -31 80 -81
35 202 -6.517 -32 79 -82 (31 :-80 :81 )
……………………………………………………………………………………………………………………………………………………………
……………………………………………………………………………………………………………………………………………………………
c *****************
c ******************* MATERIAL CARDS
***********************************
c *****************
mode n
m200 92238.66c -0.8751 $MAT200
92235.66c -0.0064 8016.66c -0.1185
m201 1001.66c -0.00051 $MAT201
1002.66c -0.20109 8016.66c -0.7984
m202 40091.66c -0.9823 $MAT202
50120.70c -0.0145 24050.66c -0.001
26056.66c -0.0021
72174.66c -0.0001
m203 41093.66c -0.025 $MAT203
40091.66c -0.975
c Calandria Tube
m204 40091.66c -0.9832 $MAT204
50120.70c -0.014 26056.66c -0.0013
24052.66c -0.001
28058.66c -0.0005

98
m205 6012.66c -0.2729 $MAT205
8016.66c -0.7271
imp:n 1 77r 0 $ 1, 79
tmp1 2.53e-008 1r 5.025e-008 75r $ 1, 78
sdef erg=d1 par=1 pos=d2 axs=1 0 0 ext=d3 rad=0
sp1 -3 0.988 2.249
si2 L 0 0 0 0 1.249 0.72116 0 2.692 0.72116 0 4.182
0.72116
sp2 0.25 0.25 0.25 0.25
si3 -24.718 24.718
sp3 -21 0
c**************************************************
******************
nps 1e7
f4:n 2
e4 1E-6 1E-5 1E-4 1E-3 1E-2 0.5 1 2
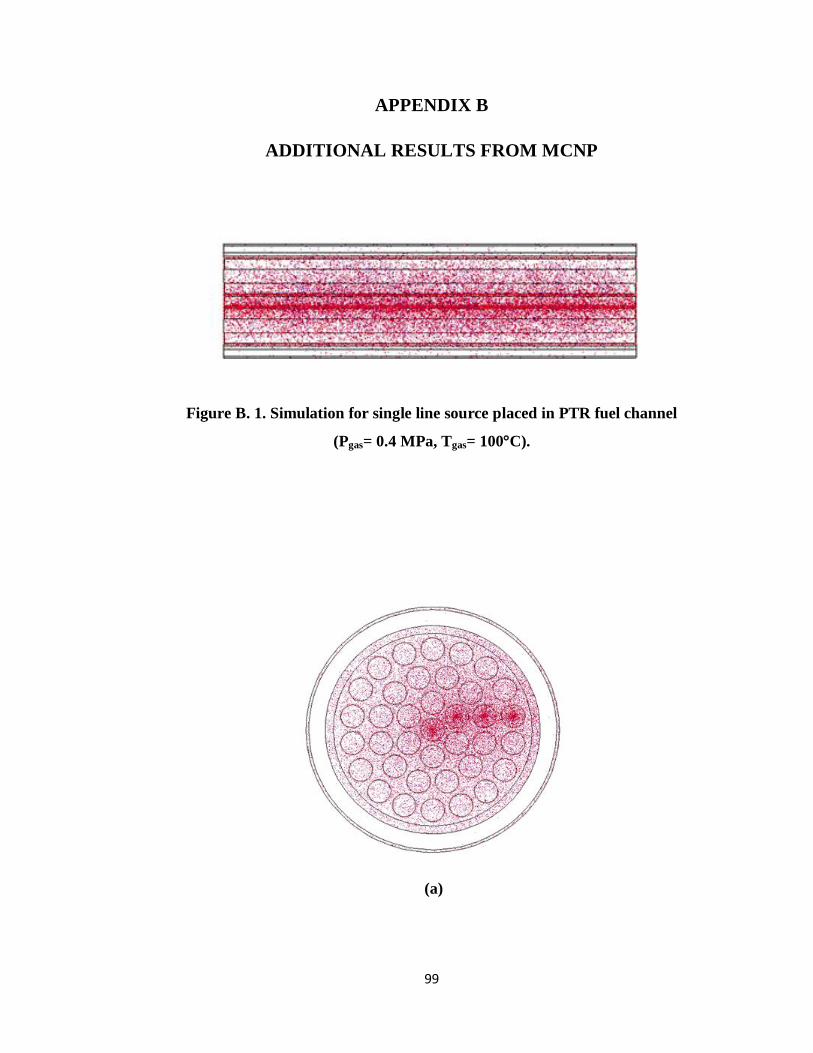
99
APPENDIX B
ADDITIONAL RESULTS FROM MCNP
Figure B. 1. Simulation for single line source placed in PTR fuel channel
(Pgas= 0.4 MPa, Tgas= 100°C).
(a)

100
(b)
Figure B. 2. PTR fuel channel simulation for multiple neutron sources at (a) 50%
histories run (b) 100 % histories run (Pgas= 0.4 MPa, Tgas= 100°C).
(a) (b)

101
(c) (d)
Figure B. 3. PT SCWR fuel channel simulation for single neutron sources placed in
(a) Central Element (b) Inner ring element (c) Intermediate ring element and
(d) Outer ring element (Pgas= 25 MPa, Tgas= 100°C).

102
Energy Groups
G1 G2 G3 G4 G5 G6 G7 G8
Neutr
on flu
x, cm
-2s
-1
10-8
10-7
10-6
10-5
10-4
10-3
10-2
Source at Center
Source at Inner Ring
Source at Intermediate Ring
Source at Outer Ring
1 MeV Point Neutron Source
Pgas
= 0.4 MPa
Tgas
= 100oC
Figure B. 4. Neutron flux profile for single 1 MeV point neutron source in PTR fuel
channel (Pgas= 0.4 MPa, Tgas= 100°C).
Energy Groups
G1 G2 G3 G4 G5 G6 G7 G8
Neutr
on flu
x, cm
-2s
-1
10-8
10-7
10-6
10-5
10-4
10-3
10-2
Source at Centre
Source at Inner Ring
Source at Intermediate Ring
Source at Outer Ring
1 MeV Line Neutron Source
Tgas
= 100oC
Pgas
= 0.4 MPa
Figure B. 5. Neutron flux profile for single 1 MeV line neutron source in PTR fuel
channel (Pgas= 0.4 MPa, Tgas= 100°C).
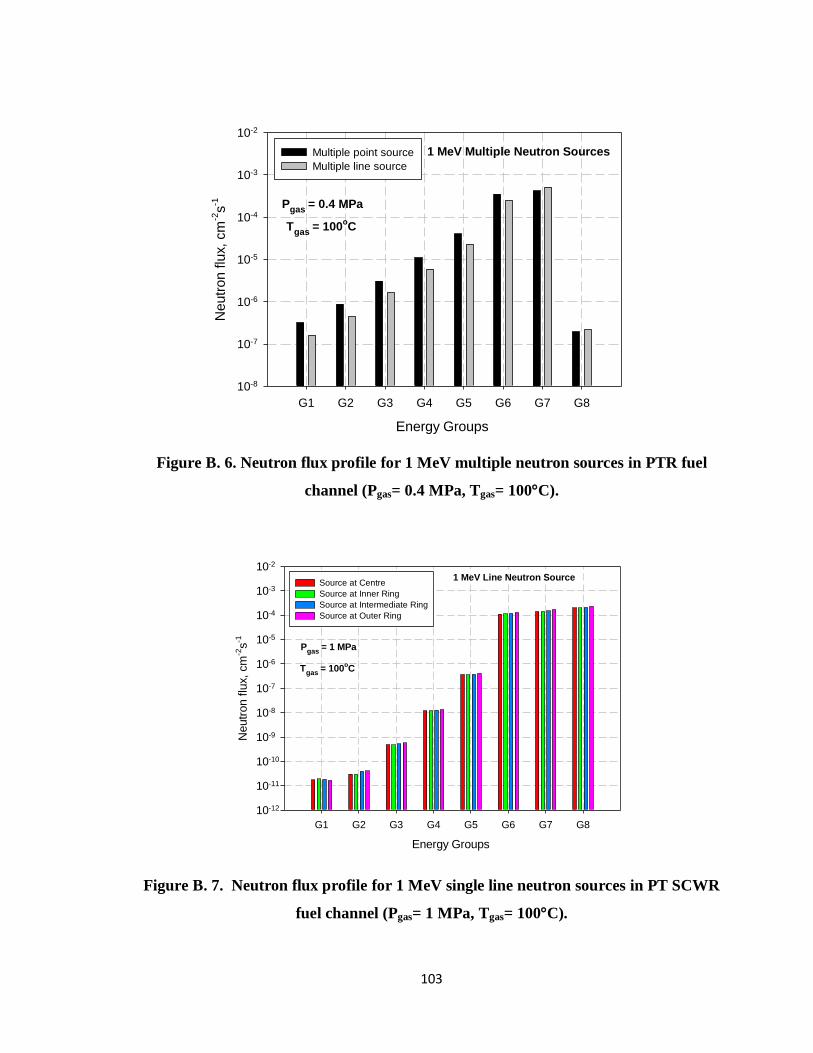
103
Energy Groups
G1 G2 G3 G4 G5 G6 G7 G8
Neutr
on flu
x, cm
-2s
-1
10-8
10-7
10-6
10-5
10-4
10-3
10-2
Multiple point source
Multiple line source
Tgas
= 100oC
1 MeV Multiple Neutron Sources
Pgas
= 0.4 MPa
Figure B. 6. Neutron flux profile for 1 MeV multiple neutron sources in PTR fuel
channel (Pgas= 0.4 MPa, Tgas= 100°C).
Energy Groups
G1 G2 G3 G4 G5 G6 G7 G8
Neutr
on f
lux, cm
-2s
-1
10-12
10-11
10-10
10-9
10-8
10-7
10-6
10-5
10-4
10-3
10-2
Source at Centre
Source at Inner Ring
Source at Intermediate Ring
Source at Outer Ring
Pgas
= 1 MPa
Tgas
= 100oC
1 MeV Line Neutron Source
Figure B. 7. Neutron flux profile for 1 MeV single line neutron sources in PT SCWR
fuel channel (Pgas= 1 MPa, Tgas= 100°C).

104
Energy Groups
G1 G2 G3 G4 G5 G6 G7 G8
Neutr
on flu
x, cm
-2s
-1
10-8
10-7
10-6
10-5
10-4
10-3
PTR annulus flux
PT SCWR annulus flux
Pgas
= 1 MPa
Tgas
= 100oC
Figure B. 8. Neutron flux profile for 1 MeV multiple neutron source in PTR and PT
SCWR fuel channel (Pgas= 1 MPa, Tgas= 100°C).
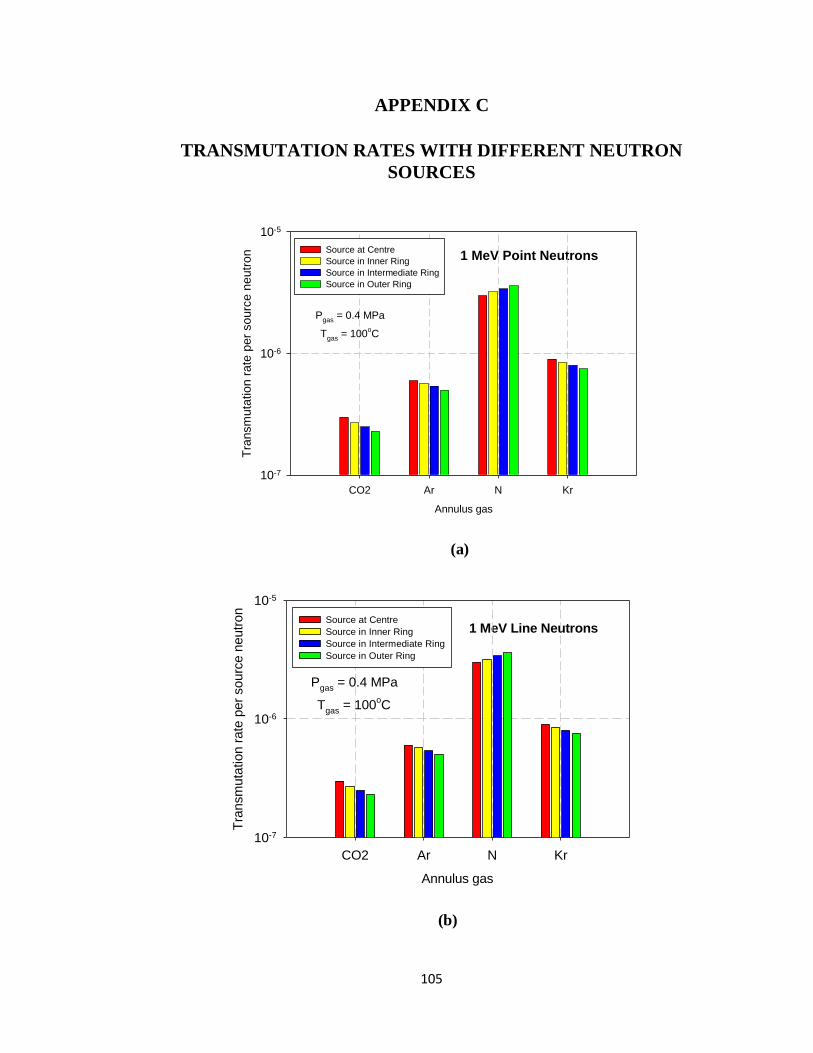
105
APPENDIX C
TRANSMUTATION RATES WITH DIFFERENT NEUTRON
SOURCES
CO2
Ar
1 MeV Point Neutrons
Annulus gas
CO2 Ar N Kr
Tra
nsm
uta
tio
n r
ate
per
sourc
e n
eutr
on
10-7
10-6
10-5
Source at Centre
Source in Inner Ring
Source in Intermediate Ring
Source in Outer Ring
Pgas
= 0.4 MPa
Tgas
= 100oC
(a)
1 MeV Line Neutrons
Annulus gas
CO2 Ar N Kr
Tra
nsm
uta
tion r
ate
per
sourc
e n
eutr
on
10-7
10-6
10-5
Source at Centre
Source in Inner Ring
Source in Intermediate Ring
Source in Outer Ring
Pgas
= 0.4 MPa
Tgas
= 100oC
(b)

106
Annulus gas
CO2 N Ar Kr
Tra
nsm
uta
tion r
ate
per
sourc
e n
eutr
on
10-9
10-8
10-7
10-6
10-5
10-4
10-3
10-2
Multiple PointSources
Multiple Line Sources
1 MeV Multiple Neutrons
Pgas
= 0.4 MPa
Tgas
= 100oC
(c)
Figure C. 1. Transmutation rates in PTR fuel channel annulus gas for 1 MeV
(a) Single point, (b) Single line and (c) Multiple neutron sources.

107
Point Fission Neutrons
Pressure, MPa
1 5 10 15 25
Tra
nsm
uta
tion r
ate
per
sourc
e n
eutr
on
10-8
10-7
10-6
10-5
10-4
Source at Centre
Source at Inner Ring
Source at Intermediate Ring
Source at Outer Ring
Tgas
= 100oC
(a)
Single line neutrons
Pressure, MPa
1 5 10 15 25
Tra
nsm
uta
tion r
ate
per
sourc
e n
eutr
on
10-8
10-7
10-6
10-5
10-4
Source at Centre
Source at Inner Ring
Source at Intermediate Ring
Source at Outer Ring
Tgas
= 100oC
(b)
Figure C. 2. Transmutation rates in PT SCWR fuel channel with CO2 annulus for
(a) Single point and (b) Single line neutron sources.

108
Pgas
= 10 MPa
Annulus gas
CO2 Ar Kr N
Tra
nsm
uta
tion r
ate
per
sourc
e n
eutr
on
10-6
10-5
10-4
10-3
10-2
Tgas
= 100oC
Multiple point neutrons
(a)
Pgas
= 15 MPa
Annulus gas
CO2 Ar Kr N
Tra
nsm
uta
tion r
ate
per
sourc
e n
eutr
on
10-6
10-5
10-4
10-3
10-2
Tgas
= 100oC
Multiple point neutrons
(b)
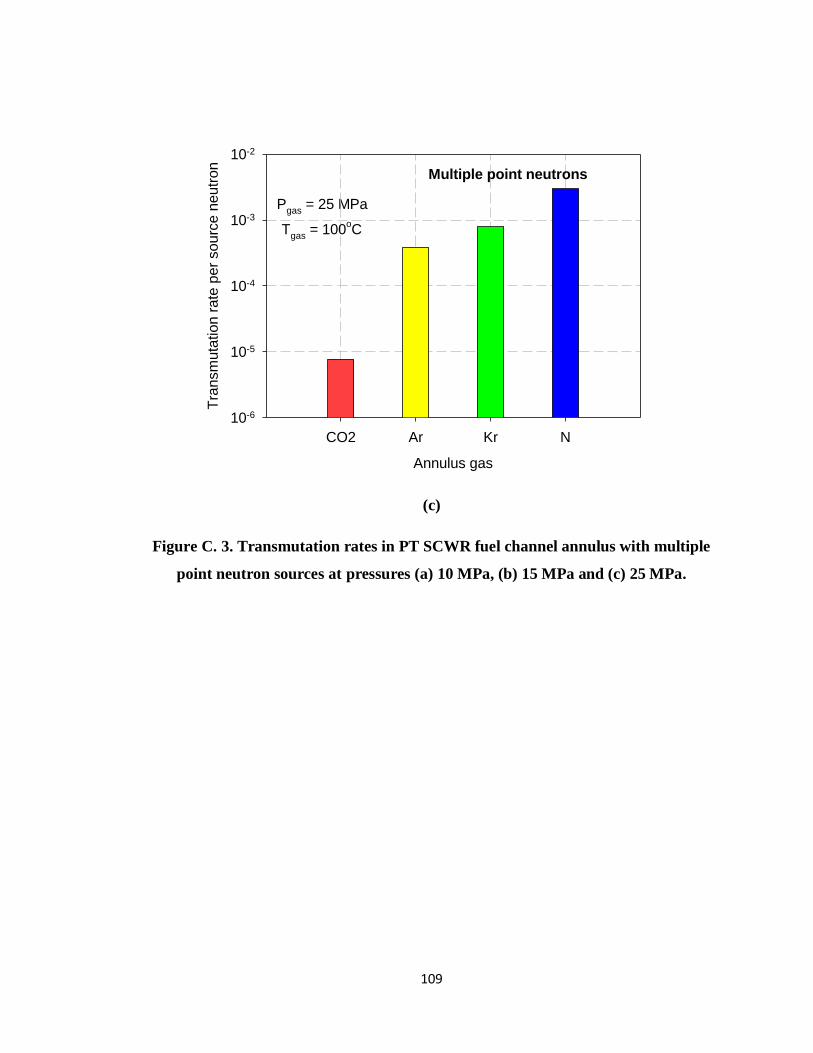
109
Pgas
= 25 MPa
Annulus gas
CO2 Ar Kr N
Tra
nsm
uta
tion r
ate
per
sourc
e n
eutr
on
10-6
10-5
10-4
10-3
10-2
Tgas
= 100oC
Multiple point neutrons
(c)
Figure C. 3. Transmutation rates in PT SCWR fuel channel annulus with multiple
point neutron sources at pressures (a) 10 MPa, (b) 15 MPa and (c) 25 MPa.