transonic flow dynamics over a hemisphere in flightsgordeye/papers/aiaa-2016-1349.pdf54th aiaa...
TRANSCRIPT

54th AIAA Aerospace Sciences Meeting AIAA-2016-1349 4 - 8 Jan 2016, San Diego, CA
1 American Institute of Aeronautics and Astronautics
Transonic Flow Dynamics Over a Hemisphere in Flight
Jacob Morrida1, Stanislav Gordeyev2 and Eric Jumper3 University of Notre Dame, Notre Dame, IN, 46545
The aero-optical environment and pressure field around a hemispherical turret were experimentally studied in flight between Mach numbers 0.5 and 0.8. Optical wavefronts were collected and used to map the spatial distribution of OPDRMS over the turret surface, and to track the optical shock location. The shock was present in the wavefronts at M = 0.7 and 0.8. The average shock location was found to be around 87o and the typical shock frequency was StD ~ 0.15. Pressure data was also collected over the turret surface. The power spectra were calculated for pressure sensors near 90o, and the typical frequency was found also found to be StD ~ 0.15 at the higher Mach numbers where a stronger shock was present. Correlations between pressures between points on the top and at the back of the hemisphere were calculated and discussed. At subsonic speeds the pressure on top of the hemisphere is correlated over a wide range of frequencies. At transonic speeds they become more localized around the frequency of the moving shock; the pressure on top and on the back of the hemisphere are in-phase at transonic speeds. All of these observations indicate a direct link between the moving shock and the shock-induced separation region downstream of the hemisphere.
I. Introduction There are many applications for optical turrets operating on airborne platforms at transonic speeds [1]. However,
the optical distortions associated with the flow features around a turret such as an unsteady shock and flow separation, reduce the beam quality [1]. In order to reduce or eliminate optical aberrations it is necessary to better understand the transonic flow features over a hemispherical turret.
Aero-optical effects in the fully subsonic regime have been thoroughly studied and are well understood [1,3-8], but at Mach numbers above 0.55 the flow becomes locally supersonic near the top of the turret, resulting in an unsteady local shock and earlier shock-induced flow separation [1]. The presence of the shock and early separation point increase the amount of optical distortion.
Pressure and optical measurements have previously been performed and studied on hemisphere-on-cylinder turrets in flight [5,9,14]. More recently, growing interest in higher, transonic speeds has led to the study of the optical field around hemisphere-only turrets. Both numerical simulations [18,19] and wind tunnel experiments [17,20] have been performed with hemispheres to better understand the shock and boundary layer effects on optics. In this paper the study is extended to flight testing.
The interaction between the shocks and the separated wake region over bodies with large spanwise curvature is not yet well understood [10-12]. Measuring the pressure field over the hemisphere surface with give insight into the shock and boundary layer motion from a non-optical point of view. Since both the shock and flow separation are detrimental to beam quality [1,2,14,15,20], it is important to gain a better understanding of the interaction between them. This knowledge will enable adaptive feedback mechanisms and flow control that will mitigate unwanted aero-optical effects [14].
1 Graduate Student, Department of Mechanical and Aerospace Engineering, Hessert Laboratory for Aerospace Research, Notre Dame, IN 46556, AIAA Student Member. 2 Research Associate Professor, Department of Mechanical and Aerospace Engineering, Hessert Laboratory for Aerospace Research, Notre Dame, IN 46556, AIAA Associate Fellow. 3 Professor, Department of Mechanical and Aerospace Engineering, Hessert Laboratory for Aerospace Research, Notre Dame, IN 46556, AIAA Fellow.

Morrida, Gordeyev and Jumper AIAA-2016-1349
2 American Institute of Aeronautics and Astronautics
II. Experimental Setup Unsteady local pressure measurements were performed in February of 2014 during in flight testing using the
AAOL-T [15]. A hemispherical turret of 12-inch diameter was mounted on the Falcon 10 aircraft, see Figure 1, left. The turret was mounted on a frame that allowed for rotation to any desired azimuthal angle and featured a worm-gear system that allowed control the of elevation angle, shown in Figure 1, right. The hemispherical turret was instrumented with 19 unsteady pressure sensors, with locations shown in Figure 2. The pressure sensors were Kulite differential pressure transducers and were placed approximately uniformly over the entire surface of the hemisphere with a cluster of 7 points centered over the aperture as shown in figure 2. Data was collected for 12 different azimuthal angles between 0 to 180 degrees; the elevation of the aperture was fixed at 45 degrees. Data sets were collected at 15,000 feet for Mach numbers of 0.4, 0.5, 0.6, and 28,000 feet for Mach numbers of 0.7, and 0.8, see Table 1 for details; the zero azimuthal angle aligned with the incoming freestream flow. The data was collected at a sampling rate of 25 kHz for 20 seconds during each data set.
Figure 1: The hemispherical turret with the conformal window instrumented with unsteady pressure sensors mounted
on the AAOL-T, left and the interior testing bench, right.
Figure 2. Pressure port locations for elevation angle of 45 degrees.
Table 1: Flight conditions and azimuthal angles for hemispherical turret
Altitude/Mach and Az-anlges (in degrees) 15 kft/0.4: Az = 0 8 20 28 44 90 134 180 15 kft/0.5: Az = 0 8 20 28 44 90 134 180
15 kft/0.6: Az = 0 8 20 28 44 85 88 90 134 180 28 kft/0.7: Az = 0 8 20 28 44 85 88 90 112 134 180
28 kft/0.8: Az = 0 8 20 28 44 85 88 90 97 112 134 180

Morrida, Gordeyev and Jumper AIAA-2016-1349
3 American Institute of Aeronautics and Astronautics
Corresponding optical measurements were performed on the AAOL-T in March of 2015 with the optical turret recessed into the aircraft, so only the hemispherical portion of if sticking out, See Figure 3, left. The AAOL-T program consists of two Falcon 10 aircraft flying in closed formation. The laser aircraft projects a diverging laser beam that overfills the aperture by a factor of 2 onto the turret of the laboratory aircraft, see [15] for details. Aircraft separation is maintained at approximately 50 m while data is being acquired. Measurements at different azimuthal/elevation angles were obtained at M = 0.4-0.6 at an altitude of 15,000 ft and M = 0.7 and 0.8 at 28,000-32,000 ft. Additional measurements with the full, hemisphere-on-cylinder, turret were also performed for M = 0.8 for comparison purposes.
Figure 3: The AAOL turret installed on AAOL-T, left and the instrumented optical bench, right.
The optical setup in the laboratory aircraft was described in details in [14,15], see Figure 3, right, for a picture of
the optical bench with instrumentation. Wavefront measurements were performed using a high-speed Shack-Hartmann wavefront sensor. The sensor featured 32x32 subapertures. Simultaneously with the 2D wavefronts, the beam jitter was also measured using a position sensing device. The jitter was acquired with the turret viewing angle and FSM position information at 30 kHz for 10 seconds. Flight conditions were also obtained simultaneous with the wavefront and jitter measurements. The aircraft separation was measured using a differential GPS system.
Two different acquisition modes were used for wavefronts: slewing maneuvers and fixed data. Slewing maneuvers involved the laser aircraft moving relative to the laboratory aircraft while wavefronts were continuously acquired at 2 kHz for 15 seconds. These maneuvers allow for rapid mapping of the optical environment around the turret and have extensively been used with both AAOL [3,4,5] and AAOL-T [14,15]. Fixed data involved the laser plane maintaining a fixed position with respect to the laboratory aircraft. These acquisitions were performed at a higher sampling rate of 30 kHz for 0.7 seconds. The goal of fixed data acquisitions is to investigate specific flow phenomenon with a better temporal resolution.
III. Data Analysis The Shack-Hartmann images were reduced using in-house software to obtain the wavefronts, W, as a function of
location on the aperture and time, ( )txWW ,= . Through least-squares plane fitting, any residual tip/tilt is removed from the wavefronts, and the steady lensing is removed by removing the mean of the wavefront at every subaperture. The optical path difference (OPD) is the conjugate of the wavefront, ( ) ( )txWtxOPD ,,
−= . To determine the variation of the OPD across the aperture, the spatial variation over the aperture is computed at every time step,
( ) ( )ApxRMS txOPDlocationAptOPD
∈=−
2,; . (1)
The time-averaged OPDRMS quantifies average amount of aberration present in the beam for a specific viewing direction. For fixed points all wavefronts were used to compute OPDRMS, while wavefront sequences during slewing maneuvers were split into intervals of 0.5 sec each and OPDRMS and the corresponding viewing angle was computed

Morrida, Gordeyev and Jumper AIAA-2016-1349
4 American Institute of Aeronautics and Astronautics
for each time interval. Conversion studies have shown that 0.5 second interval is sufficient to have the converged statistics of the time-averaged OPDRMS, yet it is short enough to ignore the variation in the aperture location during the slewing maneuver.
Another way to quantify the aero-optical distortions is to compute the spatial distribution of the temporal variation of the wavefronts [5],
( ) ( )2, txOPDsurfaceOPDRMS
= (2) Later this quantity will be called as spatial OPDRMS. Only fixed points were used to compute the spatial OPDRMS. It is important to recognize the difference between quantities defined in Eqs. (1) and (2). The first one describes the spatial deviation of the aero-optical distortions over a given aperture size and directly related to the far-field intensity [21,22]. The second one describes the temporal variation of optical distortions at a given point over the turret and is related to the strength of aero-optical flow features over the turret.
To quantify the temporal behavior of the wavefronts for a given aperture location, the aperture-averaged
wavefronts spectra were calculated, Apx
W xfWlocationApfS∈
=−
2),(ˆ);( . The temporal behavior of the
optical shock was also quantified by taking 1-D slices of the OPD at β = 60o for each time step and finding the point of maximum slope. The point with maximum slope of the 1-D slice was the point with the highest density variation and was the corresponding location of the shock at that time step.
Similar to subsonic aero-optical studies, [4,5], the both OPDRMS in Eqs (1) and (2) were normalized by the flight
conditions,
= DMOPDOPD
SLRMSNormRMS
2, /
rr to compare the aero-optical performance of the turret across
various Mach numbers. In this normalization, ρ is the freestream density, ρSL is the density at sea level, M is the Mach number and D is the turret diameter.
Any point on the hemispherical surface, whether the center of the aperture or the pressure sensor location, can be described by the azimuthal (Az) and elevation (El) angles. All these surface locations were recast into the (α,β)-coordinate system, which is more useful from a fluid dynamics perspective [4]. The viewing angle is given by
( ) ( )( )ElAz coscoscos 1−=α , and the modified elevation angle is given by ( )( )
= −
AzEl
sintantan 1β .
The pressure data from multiple hemisphere orientations was combined to find pressure data over a range of viewing angles. The pressure was normalized by the dynamic pressure to get the pressure coefficient, 𝐶𝐶 = 𝑃/(12𝜌𝑈2), where U is the freestream velocity. Calculating the root mean square determines the temporal variation of the
pressure coefficient at each location, 𝐶𝐶𝑅𝑅𝑅(𝑡) = �𝐶𝐶(𝑡)2���������. The pressure spectra were also calculated to compare
the frequency with both pressure and optical data from other experiments.
IV. Results Optical results
To study the spatial distribution of different optically-aberrating features on the turret, spatial variations of wavefronts, spatial OPDRMS, defined in Eq. (2), for different aperture locations were projected on the hemispherical turret. Results for M = 0.6, 0.7 and 0.8 are presented in Figure 4. The spatial OPDRMS for the full turret for M = 0.8 is also presented in Figure 4, bottom right, for comparison. As the optical system inside the turret has a small, one inch in diameter, middle obscuration, wavefronts are known only inside rings, clearly seen in Figure 4. At M = 0.6, Figure 4, top left, the shock, while present near the apex of the turret, is fairly weak [5] and all optical distortions are located in the downstream portion of the hemisphere and are primarily related to the “horn” vortices, present in the wake downstream of the turret [1]. The “horn” vortices are located on both sides and close to the bottom of the turret. As they have opposite circulation, they create additional downwash flow along the streamwise centerplane and delay the formation of the separated wake along this plane, we will later call “the quiet valley”. As a consequence, aero-optical distortions along the centerplane stay small for larger α-angles, up to α = 140 degrees, compared to adjacent regions,

Morrida, Gordeyev and Jumper AIAA-2016-1349
5 American Institute of Aeronautics and Astronautics
where optical distortions starts growing after α = 115 degrees. Numerical simulations of the aero-optical distortions around the hemisphere-on-cylinder turret at subsonic speeds show very similar distribution of the optical distortions, including the presence of the horn-vortex-related distortions and “the quiet valley” along the centerline [23].
Figure 4. Spatial variations of the normalized wavefronts, projected on the hemisphere surface for M = 0.6 (top left), M = 0.7 (top right) and M = 0.8 (bottom left). The data for the full turret for M = 0.8 is shown in bottom right plot for comparison. Flow goes along x-axis from negative to positive values. Latitude and longitude lines on the hemisphere
go every 5 degrees.
The similar spatial OPDRMS distribution is observed at M = 0.7, Figure 4, top right. At this Mach number the “quiet valley” also extends up to α = 140 degrees along the centerplane. The shock becomes stronger at this speed and creates additional localized distortions, visible as a line of the increased distortions near the apex of the turret. The average shock location is around α = 88 degrees and was found to be fairly independent of the elevation angle,
Horn-vortex-related region
“Quiet valley”
Shock
Hemi, M=0.6 Hemi, M=0.7
Hemi, M=0.8 Full, M=0.8

Morrida, Gordeyev and Jumper AIAA-2016-1349
6 American Institute of Aeronautics and Astronautics
consistent with tunnel tests [17] and numerical simulations [18,19]. At even higher Mach number of 0.8, Figure 4, bottom left, the shock becomes stronger and increases its extent in the streamwise direction, but it still is located around α = 88 degrees for all elevation angles. As the separation region becomes larger due to the premature shock-related separation over the hemisphere, the horn vortices are intensified and extend in the cross-normal direction away from the centerline. As a consequence, the horn-vortex-related region of optical distortions increases in size and the “quiet valley” extends only up to α = 130 degrees.
Comparison with spatial OPDRMS on the full hemisphere-on-cylinder turret at M = 0.8, shown in Figure 4, bottom right, shows that the horn-vortex-related region is smaller in the cross-stream direction, compared to the hemisphere. The “quiet valley” extends to about the same value of 130 degrees for the full and hemisphere turrets. The shock location for the full turret was found to be located farther upstream, near α = 80 degrees, compared to the shock location of α = 88 degrees for the hemisphere. More details of aero-optical distortion over the full turret can be found in [14].
Figure 5 shows the normalized time-averaged OPDRMS values, defined in Eq. (1), as a function of Mach number and the viewing angle, α, for all modified elevation angles. As M = 0.5 was extensively studied during AAOL program [5], only several points for M = 0.5 were collected, mainly for comparison and repeatability purposes. For M = 0.6, OPDRMS values are fairly small, less than 1, for α < 100 degrees, as the flow is attached over the aperture. At α = 110 degrees the flow separates, so for large viewing angles α > 110 degrees OPDRMS continuously increases due to looking through an increasingly-larger portion of the separated wake, reaching normalized values of 4 for α > 130 degrees. Since the shock is very weak at this Mach number, it does not affect the separated region and OPDRMS values at M = 0.6 are very similar to M = 0.5 values.
Figure 5: Normalized time-averaged OPDRMS versus viewing angle for M = 0.5-0.8.
For a higher M = 0.7, a small unsteady shock appears near α = 88 degrees, as was seen in Figure 4, top left, thus
increasing the local aero-optical distortions near this viewing angle. Similar shock location was also observed in the tunnel tests [17]. Optical distortions at this Mach number start increasing above α = 100 degrees, but the wake arrears to be more optically-aberrating, compared to M = 0.6 case, reaching normalized values of 4.5. For M = 0.8, the shock intensifies further, as seen in Figure 4, bottom left, so the overall levels of OPDRMS are higher around side-looking angles of 90 degrees, compared to values at the same angle range at lower Mach numbers. In general, the dependence of the aero-optical distortions around the hemisphere on Mach number and α were found to be similar to the ones over the hemisphere-on-cylinder turret [14]; for side-looking angles the aero-optical distortions over the hemisphere were found to be slightly weaker that for the hemisphere-on-cylinder turret.
Morrida, Gordeyev and Jumper AIAA-2016-1349
7 American Institute of Aeronautics and Astronautics
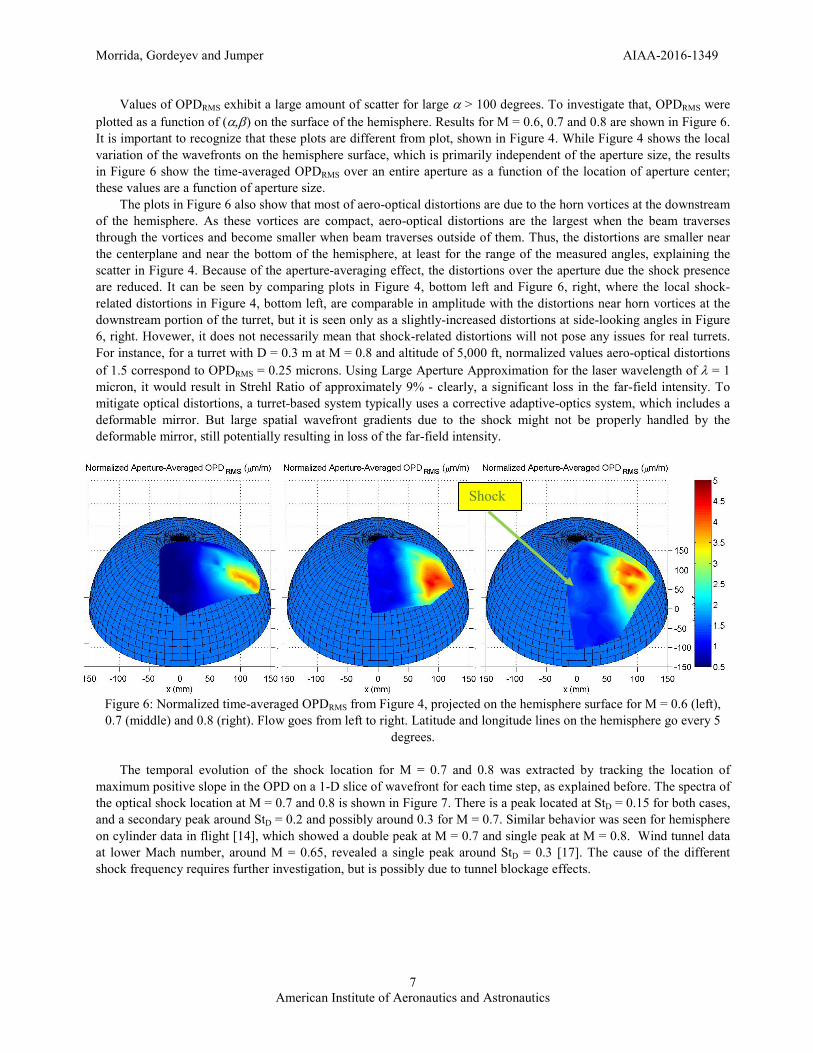
Values of OPDRMS exhibit a large amount of scatter for large α > 100 degrees. To investigate that, OPDRMS were plotted as a function of (α,β) on the surface of the hemisphere. Results for M = 0.6, 0.7 and 0.8 are shown in Figure 6. It is important to recognize that these plots are different from plot, shown in Figure 4. While Figure 4 shows the local variation of the wavefronts on the hemisphere surface, which is primarily independent of the aperture size, the results in Figure 6 show the time-averaged OPDRMS over an entire aperture as a function of the location of aperture center; these values are a function of aperture size.
The plots in Figure 6 also show that most of aero-optical distortions are due to the horn vortices at the downstream of the hemisphere. As these vortices are compact, aero-optical distortions are the largest when the beam traverses through the vortices and become smaller when beam traverses outside of them. Thus, the distortions are smaller near the centerplane and near the bottom of the hemisphere, at least for the range of the measured angles, explaining the scatter in Figure 4. Because of the aperture-averaging effect, the distortions over the aperture due the shock presence are reduced. It can be seen by comparing plots in Figure 4, bottom left and Figure 6, right, where the local shock-related distortions in Figure 4, bottom left, are comparable in amplitude with the distortions near horn vortices at the downstream portion of the turret, but it is seen only as a slightly-increased distortions at side-looking angles in Figure 6, right. Hovewer, it does not necessarily mean that shock-related distortions will not pose any issues for real turrets. For instance, for a turret with D = 0.3 m at M = 0.8 and altitude of 5,000 ft, normalized values aero-optical distortions of 1.5 correspond to OPDRMS = 0.25 microns. Using Large Aperture Approximation for the laser wavelength of λ = 1 micron, it would result in Strehl Ratio of approximately 9% - clearly, a significant loss in the far-field intensity. To mitigate optical distortions, a turret-based system typically uses a corrective adaptive-optics system, which includes a deformable mirror. But large spatial wavefront gradients due to the shock might not be properly handled by the deformable mirror, still potentially resulting in loss of the far-field intensity.
Figure 6: Normalized time-averaged OPDRMS from Figure 4, projected on the hemisphere surface for M = 0.6 (left), 0.7 (middle) and 0.8 (right). Flow goes from left to right. Latitude and longitude lines on the hemisphere go every 5
degrees. The temporal evolution of the shock location for M = 0.7 and 0.8 was extracted by tracking the location of
maximum positive slope in the OPD on a 1-D slice of wavefront for each time step, as explained before. The spectra of the optical shock location at M = 0.7 and 0.8 is shown in Figure 7. There is a peak located at StD = 0.15 for both cases, and a secondary peak around StD = 0.2 and possibly around 0.3 for M = 0.7. Similar behavior was seen for hemisphere on cylinder data in flight [14], which showed a double peak at M = 0.7 and single peak at M = 0.8. Wind tunnel data at lower Mach number, around M = 0.65, revealed a single peak around StD = 0.3 [17]. The cause of the different shock frequency requires further investigation, but is possibly due to tunnel blockage effects.
Shock

Morrida, Gordeyev and Jumper AIAA-2016-1349
8 American Institute of Aeronautics and Astronautics
Figure 7. Spectra of the optical shock location for M = 0.7, 0.8.
Temporal evolution of the wavefronts was used to calculate aperture-averaged wavefront spectra. The spectra for
a side-looking angle of α = 90 degrees for M = 0.6, 0.7 and 0.8 are shown in Figure 8, left. While not visible in the aperture-averaged spectra for M = 0.6 in Figure 8, careful analysis of the weak shock at M = 0.62 [5, 24] has revealed that the shock has a typical normalized frequency of StD = 0.5. At a higher Mach number of 0.7 the spectrum is increased in the range of frequencies between StD = 0.1 and the shock-related frequency is shifted to StD = 0.3, consistent with results shown in Figure 7. For M = 0.8 it is further shifted toward an even lower frequency of 0.15, also in accord with results in Figure 7. The peak at StD = 0.15 has been associated with motion of the separation line [16]. This indicates that while the shock has its own typical frequency of StD = 0.5 at low transonic speed of M = 0.6..0.65, the shock motion is coupled or locked-in to the motion of the separation line at high transonic speeds; this lock-in mechanism was also observed in tunnel tests of a cylindrical turret at transonic speeds [2].
Figure 8. Normalized, aperture-averaged wavefront spectra for α = 90 degrees (left) and α =125 degrees (right) for incoming M = 0.6, 0.7 and 0.8. The spectra for the full turret at the same angles are also shown for comparison.
10 -1 10 0 10 1
StD
10 2
M = 0.7
M = 0.8

Morrida, Gordeyev and Jumper AIAA-2016-1349
9 American Institute of Aeronautics and Astronautics
Wake-related spectra at α = 125 degrees for range of Mach numbers are shown in Figure 8, right, and somewhat
surprisingly exhibit self-similar behavior for subsonic and transonic speeds with a peak at a higher frequency of around StD = 1.3. This value is associated with smaller shear-layer structures, forming in the wake [24]. Thus, while the shock causes the premature flow separation near the apex of the turret at high transonic speeds, after the flow is separated, the presence of shock does not affect the shear-layer structures in the separation region. The only exception is for the spectra for the full turret for M = 0.8, see Figure 8, right, where an additional small peak appears in the spectra at StD = 0.15. As the shock strength is stronger for the full turret, compared to the hemisphere only, see Figure 4, it suggests that the shock motion might start modulating the temporal evolution of the shear-layer structures at high transonic speeds.
Pressure Results
The mean and root-mean-square of the pressure coefficient is shown in Figure 9 for a range of measured Mach numbers between M = 0.5 to 0.8. Figure 9, left, presents the mean Cp distribution, where the red dashed line indicates the tunnel pressure results from [20] at M = 0.64. The tunnel data matches well for α = 45o to 100o, but deviates at higher or lower angles. The difference requires further investigation, but could be caused by tunnel blockage effects or a gap running around the base of the flight-testing turret. At M = 0.7 and 0.8 there is a sharper rise in mean Cp near 90o, which was also seen in wind tunnel data [17], and is caused by the shock near the turret apex. The RMS pressure data is shown in Figure 9, right. The RMS begins high toward the front of the turret, which is most probably due the presence of the neckless vortex in front of the turret. For M = 0.7 and 0.8, there is a peak value near a viewing angle of 80o, which is due to the shock present near this location. At M = 0.8 there is a second peak around a viewing angle of 110o. Although still under investigation, it is suspected that this peak in pressure fluctuations is due to jetting from the small gaps on the hemisphere.
Figure 9. CPMean (left) and CpRMS (right) vs viewing angle on the hemisphere for varying Mach number, with red
dashed line showing results from [20] for M = 0.64.
The pressure spectra at the location near α = 90o is depicted in Figure 10 for different Mach numbers. At M = 0.5 and 0.6 there is no peak in the spectra, then a small shock-related peak forms at M = 0.7 and at M = 0.8; the peak grows larger due to the presence of a stronger shock. The location of the pressure spectrum peak at M = 0.7 and 0.8 is around StD = 0.15 and is related to the unsteady shock motion, shown in Figures 7 and 8.
Using data from the cluster of pressure sensors on the aperture of the turret, see Figure 2, spatial-temporal evolution can be investigated. Figure 11 shows the spatial-temporal pressure field for α between 83 to 104 degrees at a Mach number of 0.8 with the turret aperture pointed to an azimuthal angle of 86o and elevation angle of 45o. This is in the same region as the unsteady shock, which oscillates between 80 and 100 degrees. There is a pressure increase across the shock, causing pressure spikes, seen as yellow regions in Figure 11, and when the shock moves downstream, the pressure decreases, indicated by blue regions in Figure 11. The pressure peaks at non-dimensional

Morrida, Gordeyev and Jumper AIAA-2016-1349
10 American Institute of Aeronautics and Astronautics
times T = 3, 10, and 17, so the non-dimensional time for the pressure oscillations is roughly 7, which corresponds to a Strouhal number of 0.15. This is the same as the dominant frequency of the optical shock motion in Figure 7.
Figure 10. Pressure spectra for varying Mach number near α = 90o.
Figure 11. Spatial-temporal variation of pressure for M = 0.8, Az = 86o.
10 -1 10 0
StD
10 4
10 5M = 0.5
M = 0.6
M = 0.7
M = 0.8
85 90 95 100
(deg)
0
2
4
6
8
10
12
14
16
18
20
T=tU
inf/D

Morrida, Gordeyev and Jumper AIAA-2016-1349
11 American Institute of Aeronautics and Astronautics
Figure 12. The normalized amplitude (left) and the phase (right) of spectral correlation of pressure at 87o with pressure
at 95o for varying Mach number.
Figure 12 depicts spectral correlations between pressure sensors on top of the turret for various Mach numbers. At M = 0.5 there is a strong correlation over a wide frequency range, shown in Figure 12, left. As the Mach number increases the correlation strength decreases, but a peak of higher correlation exists near StD = 0.15, which is the same as the optical shock location frequency in Figure 7. The pressures are roughly in phase on top of the turret, as seen in Figure 12, left. Correlations between the top and back of the turret at different Mach numbers are shown in Figure 13. At M = 0.5, in fully subsonic flow, there is a very broad peak near StD = 0.15 and as Mach number increases the peak narrows. Figure 13, right, indicates that at M = 0.5 the pressure at the top of the turret is lagging behind the back pressure and as the Mach number increases becomes more in phase. One possible explanation of the lag between the top pressure versus the back pressure at fully subsonic speeds is that when the pressure in the separation region increases, the separation bubble grows, which causes high pressure to convect upstream toward the top of the turret. There is a delay associated with the convection, which causes the phase lag seen as a positive linear slope in Figure 13, right. At higher transonic Mach numbers when the shock appears, the flow separation occurs where the shock is, at α=90o instead of α=120o, so the top of the turret in inside the separation bubble. Therefore, there is a more direct link or a lock-in mechanism between the back and top pressures. This lock-in mechanism was also observed in unsteady shock-wake interaction over cylindrical turrets and was explicitly used to develop a model of the shock-wake interaction [2].
Figure 13. The normalized amplitude (left) and the phase (right) of spectral correlation of pressure at 93o correlated
with pressure at 140o for varying Mach number.
0 0.05 0.1 0.15 0.2 0.25 0.3 0.35 0.4 0.45 0.5
StD
0
0.1
0.2
0.3
0.4
0.5
0.6
0.7
0.8
0.9
1
M = 0.5
M = 0.6
M = 0.7
M = 0.8
0 0.05 0.1 0.15 0.2 0.25 0.3 0.35 0.4 0.45 0.5
StD
-150
-100
-50
0
50
100
150
Ang
le (d
eg)
0 0.05 0.1 0.15 0.2 0.25 0.3 0.35 0.4 0.45 0.5
StD
0
0.1
0.2
0.3
0.4
0.5
0.6
0.7
0.8
0.9
1
M = 0.5
M = 0.6
M = 0.7
M = 0.8
0 0.05 0.1 0.15 0.2 0.25 0.3 0.35 0.4 0.45 0.5
StD
-150
-100
-50
0
50
100
150
Ang
le (d
eg)

Morrida, Gordeyev and Jumper AIAA-2016-1349
12 American Institute of Aeronautics and Astronautics
V. Conclusions Optical and pressure data were collected on a hemispherical turret in flight for Mach numbers between 0.5 to 0.8.
Using the optical data, OPD field was mapped over the turret surface to locate regions with high or low aberrations. The aperture-averaged OPDRMS was found to have a small peak due to the presence of the shock near a viewing angle of 90o for transonic Mach numbers and to be very high on the back of the turret due to horn vortices. The spatial distribution of the OPDRMS shows a thin band of high RMS around a viewing angle of 90o for M = 0.7, 0.8 due to the shock presence, and a high RMS in the flow separation region for all Mach numbers, with a “quiet valley” near the centerplane where there are fewer optical distortions. No shock was optically observed at M = 0.6, somewhere between M = 0.6 and 0.7 the shock becomes visible, and the RMS due to the shock presence increases as the Mach number is increased to 0.8. Aperture-averaged spectra and optical shock location spectra indicate that the shock is located near α = 90o , largely independent of the elevation angle, and the shock frequency at StD = 0.15 is the dominant motion in that region. For turret lookback angles near α = 125o the aperture-averaged spectra reveals the turret separation region to have a dominant frequency around StD = 1.3. Furthermore, despite the appearance of the shock at high transonic speeds, forcing a premature separation, the spectra were found to be self-similar between the subsonic and transonic speeds. It indicates that the vortical structures in the wake are largely unaffected by the presence of the shock.
The pressure measurements also indicate the shock location on the hemisphere to be centered between a viewing angle of 80 and 90 degrees. The mean Cp distribution has its highest positive slope in this region due to the pressure increase across the shock, and the RMS of Cp has its peak value in this region due to the unsteady shock moving upstream and downstream of this point. The predominant pressure frequency was found to be near StD = 0.15, which is the same as the optical shock frequency. A possible link between the optical shock and pressure has been shown in other studies [2,13,17]. Pressure correlations reveal that at transonic speeds on the top and on the back of the turret are approximately in phase or locked-in, which agrees with wind tunnel results, and supports the model illustrated in [2], where the wake pressure influences the shock and flow separation location on the turret. Higher pressure in the separation bubble behind the turret pushes the separation point and shock upstream, then the wake pressure decreases, allowing the separation and shock locations to move back downstream.
Future work will include additional wind tunnel tests where optical and pressure measurements will be collected on the turret simultaneously, and correlations between optical and pressure data can be made. Future flight tests may also incorporate pressure sensors downstream of the turret to investigate the possible shock-wake interaction during flight.
References
[1] S. Gordeyev and E. Jumper, “Fluid Dynamics and Aero-Optics of Turrets”, Progress in Aerospace Sciences, 46, (2010), pp. 388-400.
[2] A. Vorobiev, S. Gordeyev, E. Jumper, “Low-Dimensional Dynamics and Modeling of Shock-Separation Interaction over Turrets at Transonic Speeds”, AIAA Paper 2014-2357, 2014.
[3] E Jumper, M Zenk, S Gordeyev, D Cavalieri and M. Whiteley, "Airborne Aero-Optics Laboratory”, Journal of Optical Engineering, 52(7), 071408, 2013.
[4] C. Porter, S. Gordeyev, M. Zenk and E. Jumper, "Flight Measurements of the Aero-Optical Environment around a Flat-Windowed Turret”, AIAA Journal, Vol. 51, No. 6, Jun. 2013, pp. 1394-1403.
[5] N. De Lucca, S. Gordeyev and E.J. Jumper, "In-flight aero-optics of turrets”, Journal of Optical Engineering, 52(7), 071405, 2013.
[6] M. Wang, A. Mani and S. Gordeyev, ”Physics and Computation of Aero-Optics”, Annual Review of Fluid Mechanics, Vol. 44, pp. 299-321, 2012.
[7] B. Vukasinovic, A. Glezer, S.Gordeyev, E. Jumper and V. Kibens, "Hybrid Control of a Turret Wake,” AIAA Journal, Vol. 49, No. 6, pp. 1240-1255, 2011.
[8] M. Palaviccini, L. Cattafesta and B. George,” Passive Flow Control over a Three-Dimensional Turret with a Flat Aperture”, AIAA Paper 2011-3265, 2011.
[9] N. De Lucca, S. Gordeyev and E.J. Jumper, “ Global Unsteady Pressure Fields Over Turrets In-Flight ”, AIAA Paper 2015-0677, 2015.
[10] D.S. Dolling, ”Fifty years of shock-wave/boundary-layer interaction research: what next?”, AIAA Journal, 39(8), pp.1517–1531, 2001.

Morrida, Gordeyev and Jumper AIAA-2016-1349
13 American Institute of Aeronautics and Astronautics
[11] Green J.E. “Interaction between shock waves and boundary layers” Progress in Aerospace Sciences, 11, pp. 235-340, 1970.
[12] Delery J.M. “Shock wave/turbulent boundary layer interaction and control”, Progress in Aerospace Sciences, 22, pp. 209-280, 1985.
[13] R. Burns, S. Gordeyev, E. Jumper, S. Gogineni, M. Paul and D.J. Wittich, “ Estimation of Aero-Optical Wavefronts Using Optical and Non-Optical Measurements ”, AIAA Paper 2014-0319, 2014.
[14] J. Morrida, S. Gordeyev, N. De Lucca, E. Jumper. “Aero-Optical Investigation of Transonic Flow Features and Shock Dynamics on Hemisphere-On-Cylinder Turrets”, AIAA Paper 2015-0676, 2015.
[15] Jumper, E.J., Gordeyev, S., Cavalieri, D. and Rollins, P.”Airborne Aero-Optics Laboratory - Transonic (AAOL-T),” AIAA Paper 2015-0675, 2015.
[16] S. Gordeyev, N. De Lucca, E. Jumper, K. Hird, T.J. Juliano, J.W. Gregory, J. Thordahl and D.J. Wittich, “Comparison of Unsteady Pressure Fields on Turrets with Different Surface Features using Pressure Sensitive Paint ”, Experiments in Fluids, 55, p. 1661, 2014.
[17] J. Morrida, S. Gordeyev, E. Jumper, “Investigation of Shock Dynamics on a Hemisphere in a Wind Tunnel Using Pressure and Optical Measurements”, AIAA Paper 2016-1348, 2016.
[18] Coirier, W.J, Porter, C., Barber, J., Stutts, J., Whiteley, M., Goorskey, D. and Drye, R.,” Aero-Optical Evaluation of Notional Turrets in Subsonic, Transonic and Supersonic Regimes,” AIAA Paper 2014-2355, 2014.
[19] R. Jelic, S. Sherer and R.Greendyke, “Simulation of Various Turret Configurations at Subsonic and Transonic Flight Conditions Using OVERFLOW”, Journal of Aircraft, 50, pp. 398-409, 2013.
[20] B. Vukasinovic, B., Glezer, A., Gordeyev, S., Jumper, E., Kibens, V., “Active Control and Optical Diagnostics of the Flow over a Hemispherical Turret”, AIAA Paper 2008-0598, 2008.
[21] T. S. Ross, “Limitations and applicability of the Maréchal approximation,” Appl. Opt. 48(10), pp.1812–1818, 2009.
[22] C. Porter, S. Gordeyev and E. Jumper, "Large-Aperture Approximation for Not-So-Large Apertures”, Journal of Optical Engineering, 52(7), 071417, 2013.
[23] E. Mathews, K.Wang, M. Wang and E. Jumper, “LES of an Aero-Optical Turret Flow at High Reynolds Number”, AIAA 2016-1461, 2016.
[24] D.J. Goorskey, R. Drye and M.R. Whiteley, “Dynamic model analysis of transonic Airborne Aero-Optics Laboratory conformal window flight- test aero-optics,” Journal of Optical Engineering, 52(7), 071414, 2013.
[25] S.J. Beresh, J.F. Henfling, R.W. Spillers, B. O.M. Pruett, “Unsteady Shock Motion in a Transonic Flow over a Wall-Mounted Hemisphere”, AIAA Paper 2013-3201, 2013.
[26] B. Vukasinovic, D. Brzozowski, A. Glezer, “Fluidic Control of Separation Over a Hemispherical Turret”, AIAA Journal Paper, 47(9)