transparency of extractive industries toward spatial transparency
TRANSCRIPT
Rapid Socio-Spatial Assessment of Extractive Industries in West Kalimantan, Indonesia
Irendra Radjawali, Ph.D

Rapid Socio-Spatial Assessment of Extractive Industries in West Kalimantan, Indonesia
Irendra Radjawali, Ph.D
ReseaRch RepoRt
ii
TRANSPARENCY OF EXTRACTIVE INDUSTRIES, TOWARDS SPATIAL TRANSPARENCYRapid Socio-Spatial Assessment of Extractive Industries in West Kalimantan, Indonesia
Research Report
AuthorIrendra Radjawali
ResearcherIrendra Radjawali Ph.D, Principal InvestigatorArif Munandar, ResearcherHermawansyah, Researcher
Translation Rizky Ananda Wulan SR
Final Review Maryati AbdullahDavid W. Brown
Cover and layoutAgus Wiyono
Transparency of Extractive Industry, Towards Spatial Transparency. Rapid Socio-Spatial Assessment of Extractive Industries in West Kalimantan, Indonesia is a product of Swandiri Institute in collaboration with Publish What You Pay Indonesia, supported by EITI Multi Donor Trust Fund (MDTF) World Bank. Project team was lead by Irendra Radjawali, Ph.D, Arif Munandar and Hermawansyah, assisting by Maryati Abdullah (National Coordinator of Publish What You Pay Indonesia) as consultant of the project, and reviewed by David W. Brown, EITI Adviser of The World Bank.
All right reserved First Edition, September 2014This report is published through support from EITI Multi Donor Trust Fund, The World Bank, through Perkumpulan Artikel 33 as vendor.
Copyright is protected by law. Text on this report may be copied, and adapted for without any other permission from the author.Publish What You Pay IndonesiaJl. Tebet Timur Dalam VIII No.39, Jakarta Selatan, 12820, Indonesiawww.pwyp-indonesia.org , E-mail : [email protected]
Swandiri InstituteJl. Dr. Wahidin, Gang Silva Jaya No. 3Pontianak 78118, Kalimantan Barat, Indonesia
iii
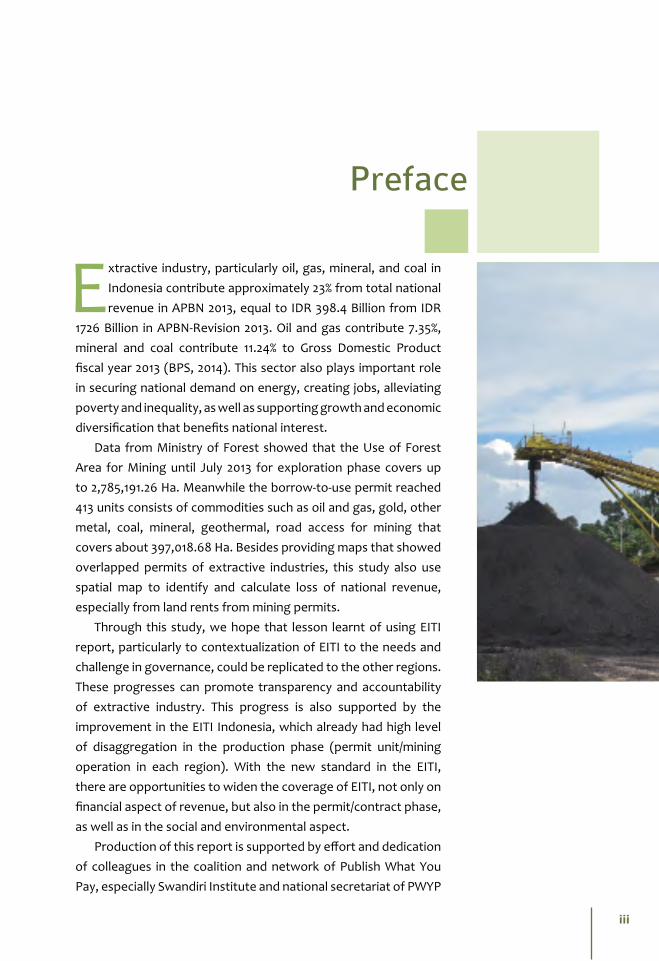
Extractive industry, particularly oil, gas, mineral, and coal in Indonesia contribute approximately 23% from total national revenue in APBN 2013, equal to IDR 398.4 Billion from IDR
1726 Billion in APBN-Revision 2013. Oil and gas contribute 7.35%, mineral and coal contribute 11.24% to Gross Domestic Product fiscal year 2013 (BPS, 2014). This sector also plays important role in securing national demand on energy, creating jobs, alleviating poverty and inequality, as well as supporting growth and economic diversification that benefits national interest.
Data from Ministry of Forest showed that the Use of Forest Area for Mining until July 2013 for exploration phase covers up to 2,785,191.26 Ha. Meanwhile the borrow-to-use permit reached 413 units consists of commodities such as oil and gas, gold, other metal, coal, mineral, geothermal, road access for mining that covers about 397,018.68 Ha. Besides providing maps that showed overlapped permits of extractive industries, this study also use spatial map to identify and calculate loss of national revenue, especially from land rents from mining permits.
Through this study, we hope that lesson learnt of using EITI report, particularly to contextualization of EITI to the needs and challenge in governance, could be replicated to the other regions. These progresses can promote transparency and accountability of extractive industry. This progress is also supported by the improvement in the EITI Indonesia, which already had high level of disaggregation in the production phase (permit unit/mining operation in each region). With the new standard in the EITI, there are opportunities to widen the coverage of EITI, not only on financial aspect of revenue, but also in the permit/contract phase, as well as in the social and environmental aspect.
Production of this report is supported by effort and dedication of colleagues in the coalition and network of Publish What You Pay, especially Swandiri Institute and national secretariat of PWYP
Preface

iv
Indonesia, Mas “Profesor” Radja, mas Arif “Drone”, mas Wawan, Jensi, Abud, Ary, Meli, and friends. We will appreciate inputs, comments, and feedbacks to improve this report.
Jakarta, 1 October 2014
Maryati AbdullahNational Coordinator, Publish What You Pay Indonesia
v
This research conducted by Swandiri Institute and supported by PWYP (Publish What You Pay) Indonesia and aims to elaborate and promote the importance of spatial transparency in extractive industry in Indonesia.
Through this research we have conducted 1) examination of spatial pattern in extractive industry in West Kalimantan, 2) triangulation of examination result with empiric studies, 3) dissemination of findings to public. Transparency in extractive industry is usually understood into transparency on financial data related to extractive industry (i.e. tax payment, national revenue, etc.). Swandiri institute propose that transparency in other aspect should be promoted, for example spatial transparency that directly related to transformation in the ecosystem. In this research, forest ecosystem was chosen as the study focus.
Spatial transparency is usually interpreted as an elaboration in transparency issue that relates to status, spatial management and its utilization in the spatial planning. In this research, spatial transparency was referred to status of area, arrangement of concession permits, spatial management and its utilization for extractive industry. This study applied “go and no go” framework in the analysis, which based on Law No 41/ 1999 about Forestry. In this law, utilization of forest area for non-forest activities is accordingly regulated to enable mining activities are allowed in some type of forest area (production forest and protected forest) through permission from Ministry of Forest (borrow-and-use permit). Arrangement of a permit must consider limit in size and length of activities, as well as sustainability of environment, and highlighted requirement: open pit mining is prohibited in the protected forest. In addition, the “go and no go” framework was applied to analyze transparency in the utilization of forest area for other sector such as plantation (i.e. palm oil).
Executive Summary
vi
This study found that 31.623,825 hectares of mining concession located in conservation forest, which violated law 41/1999 about forest. This study found that 190.561,9328 hectares mining concession in the protected forest located in protected forest, where open pit mining is prohibited based on forest law. However, proportion of open pit mining and underground mining from the total areas cannot be concluded through this study. On the other hand, there are 323.564,8176 hectares of mining concession in production forest. However, it still need further investigation to calculate number of concessions in the protected and production forest that been granted borrow-and-use permit from ministry of forest. Also, this study calculated that in 2012 there is IDR 59.542.372.770 loss of revenue from land rent in mining sector in West Kalimantan. In addition, this study found that more than 450.000 hectares of oil palm plantation located in forest area, which violated Law 41/1999.
vii
EITI : Extractive Industries Transparency Initiative
GIS : Geographical Information System
HGU : Hak Guna Usaha / Commercial Utilization Right
HPH : Hak Pemanfaatan Hutan / Forest Utilization Right
IUP : Ijin Usaha Pertambangan / Mining Operation Permit
IUPHHK : Izin Usaha Pemanfaatan Hasil Hutan Kayu / Commercial Use of Wooden Forest Product Permit
MPR : Majelis Permusyawaratan Rakyat / People’s Consultative Assembly
NGO : Non-Governmental Organization
Perpres : Peraturan Presiden / Presidential Decree
PP : Peraturan Pemerintah / Government Decree
RTRW : Rencana Tata Ruang Wilayah / Spatial Plan Document
Tap : Ketetapan /Decision
UU : Undang-Undang / Law
WP : Wilayah Pertambangan / Mining Area
Glossaries
viii
Preface ............................................................................................................................... iiiExecutive Summary .......................................................................................................... v
I. Introduction ................................................................................................................... 1West Kalimantan: Geographical and Socio-Economic Settings ............................... 3West Kalimantan: An overview on Extractive Industries ......................................... 4West Kalimantan: State of the Forest, a Brief ........................................................... 5
II. Methods ........................................................................................................................ 7Data Collection ........................................................................................................... 7Desk study: Focus on Spatial Data ............................................................................. 7Empirical Study ........................................................................................................... 8“Go” and “No Go” Framework of Analysis ............................................................... 8Data Triangulation ...................................................................................................... 11Public outreach ........................................................................................................... 11
III. Results .......................................................................................................................... 12Overlapping Mining Concessions with Forest........................................................... 12Mining Concessions in Limited Production Forests and Convertible Production Forest .......................................................................................................................... 14Overlapping Mining Concessions with Other Concessions ...................................... 15Empirical Study ........................................................................................................... 15The Companies ........................................................................................................... 16Socio-economic Facts and Figures............................................................................. 17On Transparency ......................................................................................................... 18Web-based GIS ............................................................................................................ 19
Outlines
ix
IV. Discussion ..................................................................................................................... 24On Spatial Transparency and Extractive Industries .................................................. 24Elite Capture ............................................................................................................... 25Amendment of Forestry Status and Allocation in 2013 ............................................ 25Spatial Transparency and Land Grabbing .................................................................. 25Potential State Loss .................................................................................................... 26
V. Conclusion ..................................................................................................................... 28
References ......................................................................................................................... 29Profile ............................................................................................................................... 30
x
List of Figure
Figure 1 : Map of West Kalimantan Province
Figure 2 : Mining permits in West Kalimantan 2012
Figure 3 : Mining commodities West Kalimantan 2012
Figure 4 : Bauxite mining area of PT. HPAM after transformed into oil palm plantation (Courtesy of Zainul Mubarok, 15 Juni 2013)
Figure 5 : Mining site of HPAM at Kendawangan area. Courtesy of Zainul Mubarok, 17th June 2013
Figure 6 : Forest Area of West Kalimantan according to the Minister Decree No. 259 / 2000
Figure 7 : Amendment of forest area based on Minister of Forestree Decree No. 936 / 2013
Figure 8 : Change of forest status according to Minister of Forestry Decree no. 936 / 2013
Figure 9 : Concession areas [mining, timber, oil palm, and logging] in West Kalimantan
Figure 10 : Overlapping concessions in West Kalimantan
Figure 11 : Overlapping concessions with various forest areas.
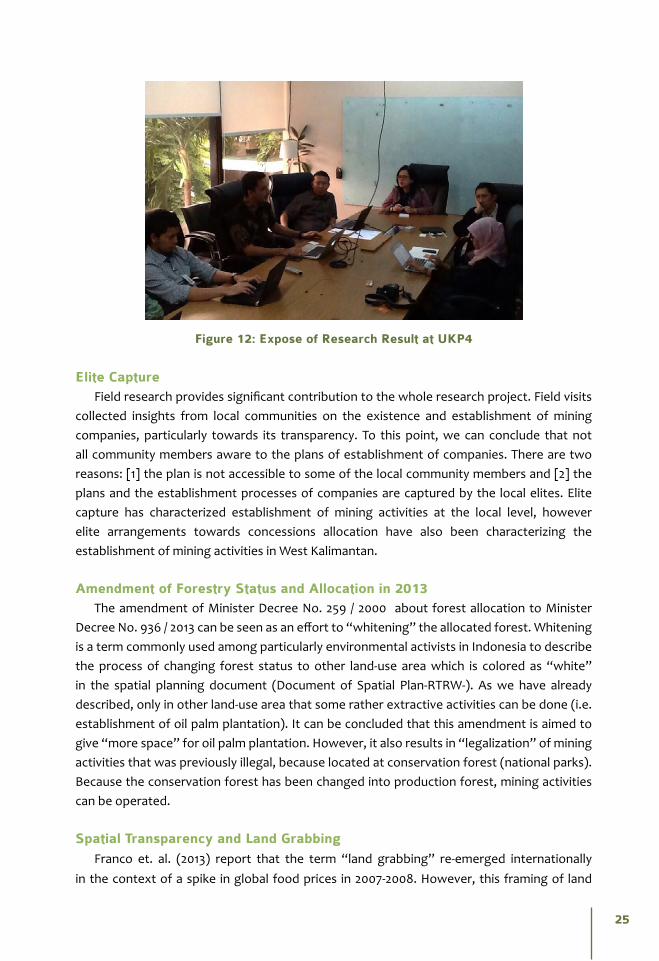
Figure 12 : expose of research result at UKP4
List of Table
Table 1 : Allocation of forest and sea area in West Kalimantan Province. Source : Ministry of Forestry (2011).
Table 2 : List of Maps
Table 3 : List of relevant regulations
Table 4 : “Go” and “No Go” Framework of Analysis Based on Law No. 41 / 1999 on Forestry
Table 5 : Interim Resume of Analysis
Table 6 : “Go” and “No Go” analysis of mining concessions in West Kalimantan
Table 7 : List of Maps from from Spatial Analysis
Table 9 : Overlapping concessions in West Kalimantan
Table 10 : List of CSOs benefiting from the study
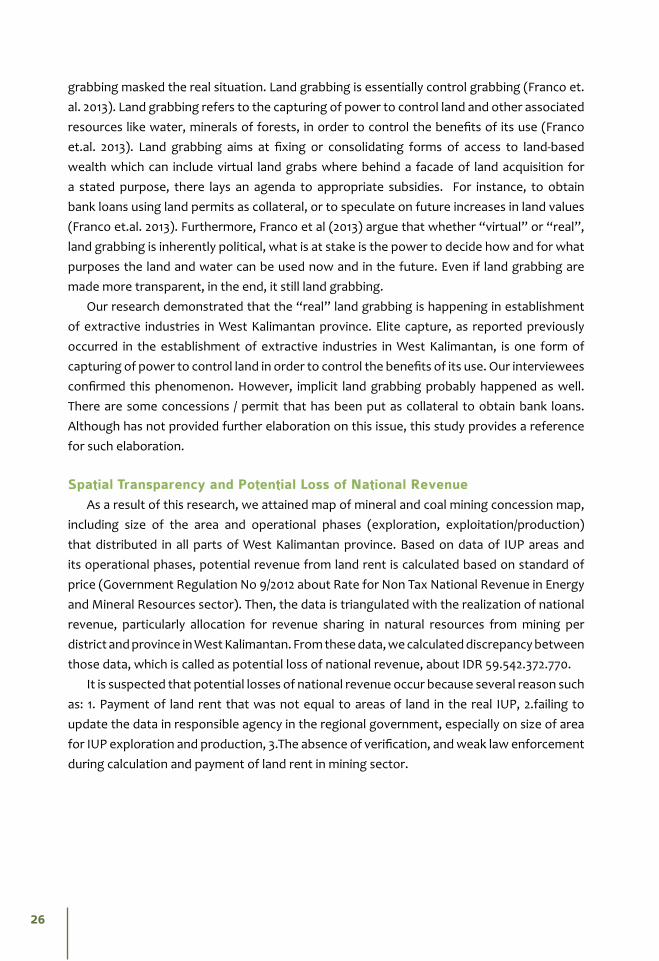
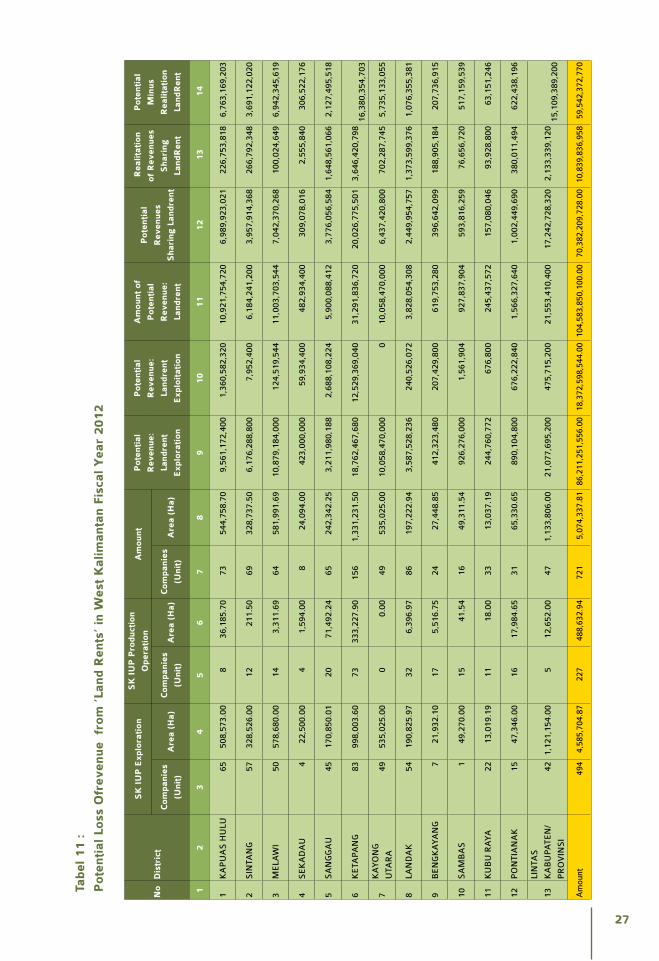
Tabel 11 : Potential loss ofrevenue from ‘land rents’ in West Kalimantan fiscal year 2012
1
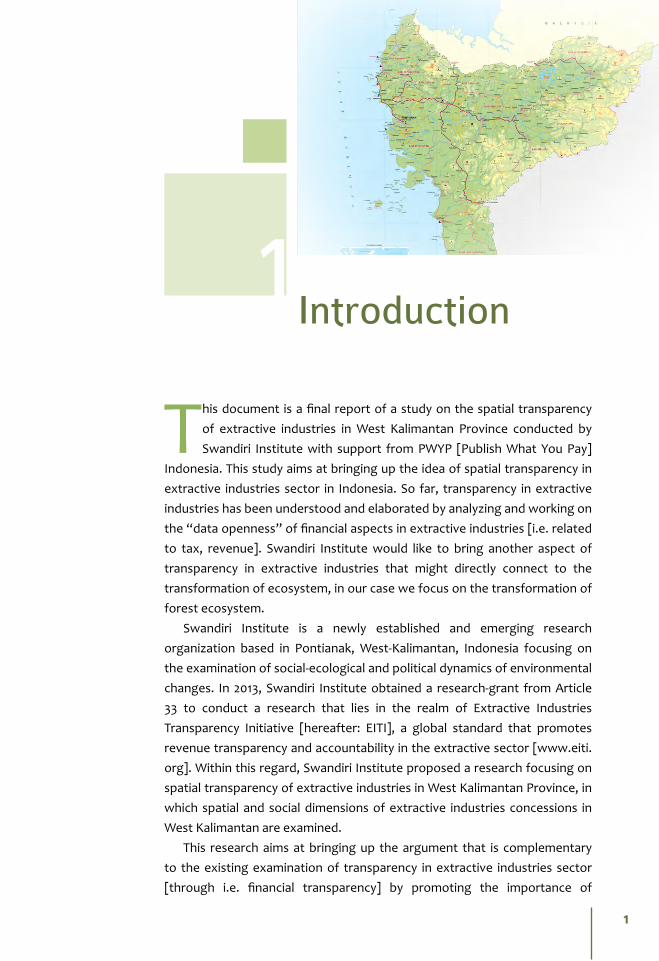
This document is a final report of a study on the spatial transparency of extractive industries in West Kalimantan Province conducted by Swandiri Institute with support from PWYP [Publish What You Pay]
Indonesia. This study aims at bringing up the idea of spatial transparency in extractive industries sector in Indonesia. So far, transparency in extractive industries has been understood and elaborated by analyzing and working on the “data openness” of financial aspects in extractive industries [i.e. related to tax, revenue]. Swandiri Institute would like to bring another aspect of transparency in extractive industries that might directly connect to the transformation of ecosystem, in our case we focus on the transformation of forest ecosystem.
Swandiri Institute is a newly established and emerging research organization based in Pontianak, West-Kalimantan, Indonesia focusing on the examination of social-ecological and political dynamics of environmental changes. In 2013, Swandiri Institute obtained a research-grant from Article 33 to conduct a research that lies in the realm of Extractive Industries Transparency Initiative [hereafter: EITI], a global standard that promotes revenue transparency and accountability in the extractive sector [www.eiti.org]. Within this regard, Swandiri Institute proposed a research focusing on spatial transparency of extractive industries in West Kalimantan Province, in which spatial and social dimensions of extractive industries concessions in West Kalimantan are examined.
This research aims at bringing up the argument that is complementary to the existing examination of transparency in extractive industries sector [through i.e. financial transparency] by promoting the importance of
Introduction1
2
looking at and examining the spatial transparency dimensions, in particular related to the spatial management and spatial planning processes. We would argue that this argument is indispensable if we promote more sustainable thus more just activities in extractive industries sector in West Kalimantan. We believe that spatial transparency is one of the important keys to achieve the above-mentioned outcome.
The objectives of this research are threefold: (1) to examine the spatial arrangement of mining concessions in West Kalimantan province (2) to triangulate the findings with the empirical study in some sites (3) to conduct public outreach of the findings. This research is based on the following research questions: (1) where are concessions of various extractive industries in West Kalimantan located? (2) How do these concessions overlapped among each other (different concessions) and with supposedly conservation and protection forest? Within this regards, this research also develops a framework of analysis called “go and no-go analysis” based on the Law 41 / 1999 on Forestry which will be elaborated further in the section 2 about methods.
This final report is organized into six sections. Section 1 introduces many aspects of West Kalimantan which is related to the extractive industries by providing overviews on: (1) geographic and socio-economic settings, (2) extractive industries, and (3) state of the forest. Section 2 describes methods used in this research consists of methods on data collection, methods on data triangulation and methods on data analysis. Section 3 presents the results of desk studies, empirical studies and the web-based GIS (Geographical Information System) where all the results are stored and can be accessed freely on-line. Section 4 discusses the results and the analysis that focus on the spatial transparency and extractive industries. This section also discusses the connection between spatial transparency and extractive industries and “land grabbing” which dispossess local communities from their land in West Kalimantan Province. Section 5 concludes what have been achieved and what can be learned and what can be recommended for further development from this research. Lastly, section 6 is developed as a policy brief providing some insights for policy makers as well as for general public.
Recent reports have identified 146 cases of land conflict due to the mining, plantation and forest concessions, involving 2.1 million hectares of land. The Ministry of Energy and Mineral Resources (ESDM) reported that there are 5,940 locally licensed mining permits (Izin Usaha Pertambangan or IUP) which are not yet “clean and clear,” in other words, without problems, while 4,626 others are considered as clean and clear. Specifically in West Kalimantan province, as reported by Dinas Energi dan Sumberdaya Mineral / Office of Energy and Mineral Resources (Distamben), the Provincial Government of West Kalimantan has issued 651 IUP, during 2011. Thus, land is a contested ‘space’ which involve the extractive industries (EI) activities, particularly in West Kalimantan. As a contested ‘space’ of multiple actors with various interests, Swandiri Institute argues that spatial transparency is an important component of EITI which need to be elaborated further. Within this regard, Swandiri Institute proposed action research which focuses on the study of the nexus of EITI and spatial planning processes particularly in West Kalimantan Province, Indonesia.
According to the Indonesian legal system, Extractive industries are defined as any kind
3
of activities which extract the natural resources directly from the earth in different forms: minerals, coals, crude oil and gas [Presidential Decree No. 26, 2010: Article 1, Section. 1]. However, in this research Swandiri Institute sees the importance of examining not only the legally defined extractive industry sectors but also other sectors which might have some spatial overlaps with extractive industries and might have direct or indirect impacts to the conservation efforts, particularly in the forest area. Swandiri Institute argues that this inclusion might provide significant insights to the on going discourse and struggle towards spatial transparency. The reasons are threefold: First, promoting spatial transparency needs to take into consideration all sectors that related to the dynamics of land tenure system in Indonesia. Second promoting spatial transparency might provide important insights towards more transparent, equitable and just spatial planning processes. And third, examining spatial articulations and dynamics of various extractive and “non-extractive” industries might provide interesting insights particularly on the “sectoral conflicts”, which might be important for the continuing discourse, debates and struggles towards spatial transparency, not only in West Kalimantan Province, but also in Indonesia.
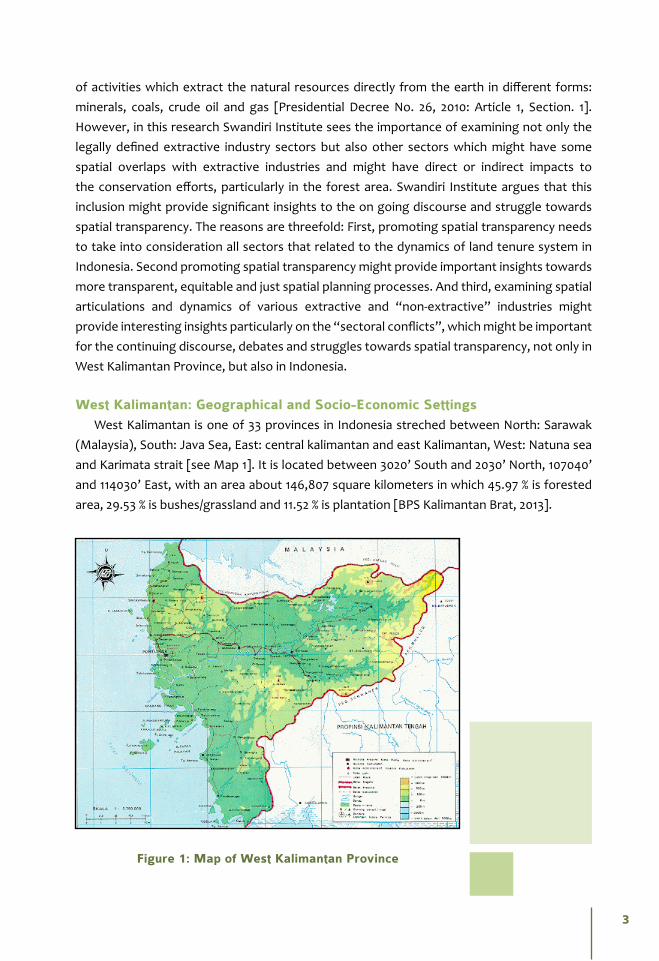
West Kalimantan: Geographical and Socio-Economic SettingsWest Kalimantan is one of 33 provinces in Indonesia streched between North: Sarawak
(Malaysia), South: Java Sea, East: central kalimantan and east Kalimantan, West: Natuna sea and Karimata strait [see Map 1]. It is located between 3020’ South and 2030’ North, 107040’ and 114030’ East, with an area about 146,807 square kilometers in which 45.97 % is forested area, 29.53 % is bushes/grassland and 11.52 % is plantation [BPS Kalimantan Brat, 2013].
Figure 1: Map of West Kalimantan Province
4
OVER-LAPPED
DISTRICT/PROVINCES
KETA- PANG
MELAWI KAYONG UTARA
KAPUAS HULU
SINTANG LANDAK SANG-GAU
SAMBAS PONTI-ANAK
SEKA-DAU
BENG-KAYANG
KUBU RAYA
1.200.000
1.000.000
800.000
600.000
400.000
200.000
0
Hec
tare
s
Mining Permits in West Kalimantan 2012
IUP Exploration
IUP Production Operation
West Kalimantan Province consists of 12 Kabupaten [Regencies] and 2 Kota [Municipalities]. There are several ethnic groups living in West Kalimantan Province: [1] 33.75 % Dayak, [2] 33.75 % Malay, 9.41% Javanese, 3.20 % Bugisnese, 0.66 % Banjarese, and 3.62 % other ethnic groups [Reference: Year]. Statistic reports indicated that out of 4,447,348 people, 30% of the population lives in urban areas and 70% live in rural areas, which might correspond with their livelihood. It is reported that 1,266,432 [63.43%] people work at the agriculture sector, a significant number compare to other sectors while some other 53.729 people work at the mining sectors [BPS Kalbar, 2011].
Mining, Oil Palm Plantation, Forest Estate and Logging have been the four main sectors supporting West Kalimantan economy. Reports shows that in West Kalimantan there are 721 mining concessions [IUP: Izin Usaha Pertambangan] had been issued involving 5.7 Million Hectares of land, 377 Palm Oil concessions involving 4.2 Million Hectares of land, 47 Forest Estate concessions involving 2.2 Million Hectares of land, and 30 Logging concession [HPH: Hak Pengusahaan Hutan] involving 1.3 Million Hectares of land.
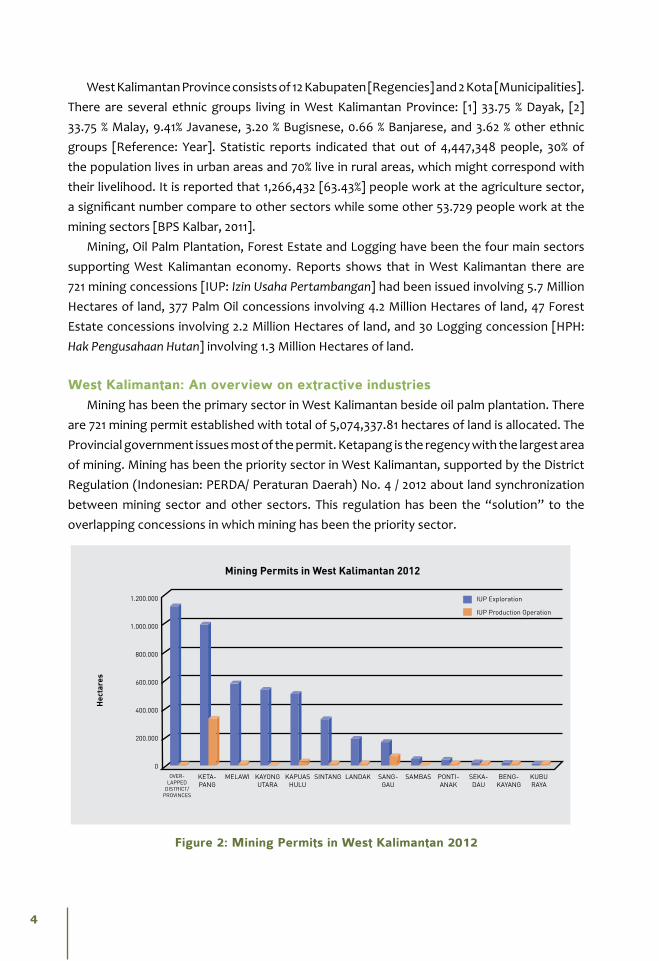
West Kalimantan: An overview on extractive industriesMining has been the primary sector in West Kalimantan beside oil palm plantation. There
are 721 mining permit established with total of 5,074,337.81 hectares of land is allocated. The Provincial government issues most of the permit. Ketapang is the regency with the largest area of mining. Mining has been the priority sector in West Kalimantan, supported by the District Regulation (Indonesian: PERDA/ Peraturan Daerah) No. 4 / 2012 about land synchronization between mining sector and other sectors. This regulation has been the “solution” to the overlapping concessions in which mining has been the priority sector.
Figure 2: Mining Permits in West Kalimantan 2012
5
Figure 2 shows that exploration permits (survey and baseline study) have been given mostly at the provincial level while permits for operation have been given mostly at Ketapang Regency.
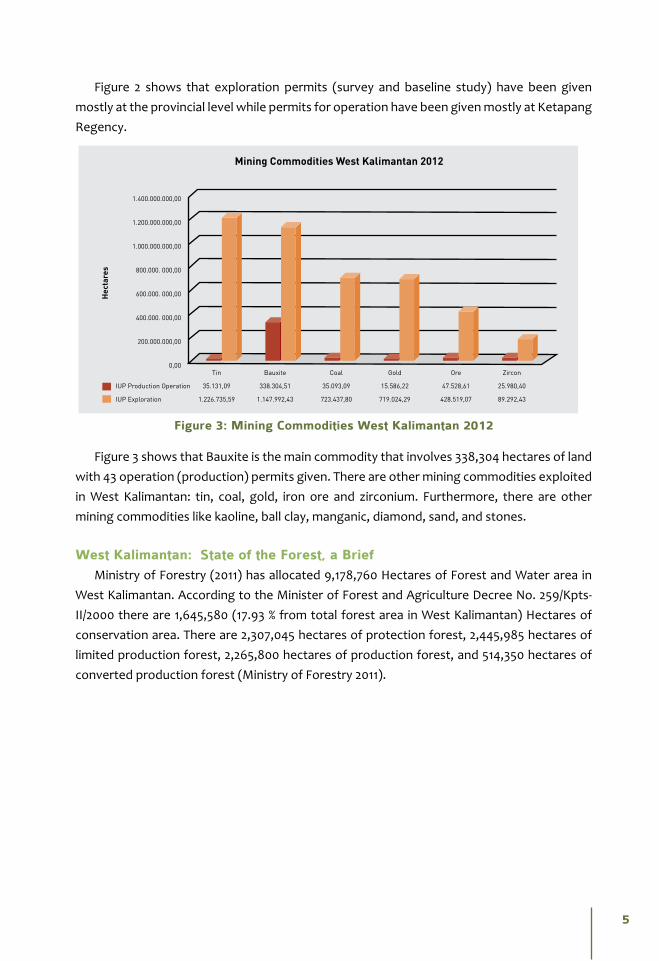
Figure 3: Mining Commodities West Kalimantan 2012
Figure 3 shows that Bauxite is the main commodity that involves 338,304 hectares of land with 43 operation (production) permits given. There are other mining commodities exploited in West Kalimantan: tin, coal, gold, iron ore and zirconium. Furthermore, there are other mining commodities like kaoline, ball clay, manganic, diamond, sand, and stones.
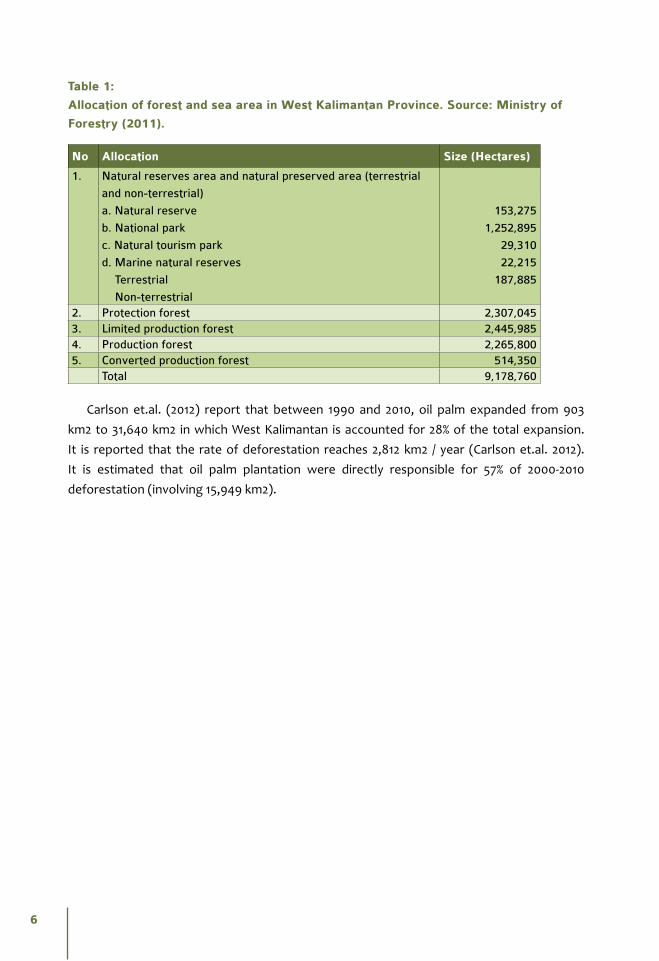
West Kalimantan: State of the Forest, a BriefMinistry of Forestry (2011) has allocated 9,178,760 Hectares of Forest and Water area in
West Kalimantan. According to the Minister of Forest and Agriculture Decree No. 259/Kpts-II/2000 there are 1,645,580 (17.93 % from total forest area in West Kalimantan) Hectares of conservation area. There are 2,307,045 hectares of protection forest, 2,445,985 hectares of limited production forest, 2,265,800 hectares of production forest, and 514,350 hectares of converted production forest (Ministry of Forestry 2011).
1.400.000.000,00
1.200.000.000,00
1.000.000.000,00
800.000. 000,00
600.000. 000,00
400.000. 000,00
200.000.000,00
0,00 Tin Bauxite Coal Gold Ore Zircon
35.131,09 338.304,51 35.093,09 15.586,22 47.528,61 25.980,40
1.226.735,59 1.147.992,43 723.437,80 719.024,29 428.519,07 89.292,43
IUP Production Operation
IUP Exploration
Hec
tare
s
Mining Commodities West Kalimantan 2012
6
Table 1:
Allocation of forest and sea area in West Kalimantan Province. Source: Ministry of
Forestry (2011).
No Allocation Size (Hectares)
1. Natural reserves area and natural preserved area (terrestrial
and non-terrestrial)
a. Natural reserve
b. National park
c. Natural tourism park
d. Marine natural reserves
Terrestrial
Non-terrestrial
153,275
1,252,895
29,310
22,215
187,885
2. Protection forest 2,307,0453. Limited production forest 2,445,9854. Production forest 2,265,8005. Converted production forest 514,350
Total 9,178,760
Carlson et.al. (2012) report that between 1990 and 2010, oil palm expanded from 903 km2 to 31,640 km2 in which West Kalimantan is accounted for 28% of the total expansion. It is reported that the rate of deforestation reaches 2,812 km2 / year (Carlson et.al. 2012). It is estimated that oil palm plantation were directly responsible for 57% of 2000-2010 deforestation (involving 15,949 km2).
7
As previously described, this research focuses on the examination of spatial conflicts of concessions in West Kalimantan particularly in the extractive industries realm. This section elaborates methods on data collection and methods on data analysis.
To ensure the quality of the research, we also employ some methods for data triangulation. Spatial data collection, ground study and triangulation, desk study and analysis, spatial analysis.
Data collectionDesk study: Focus on spatial data
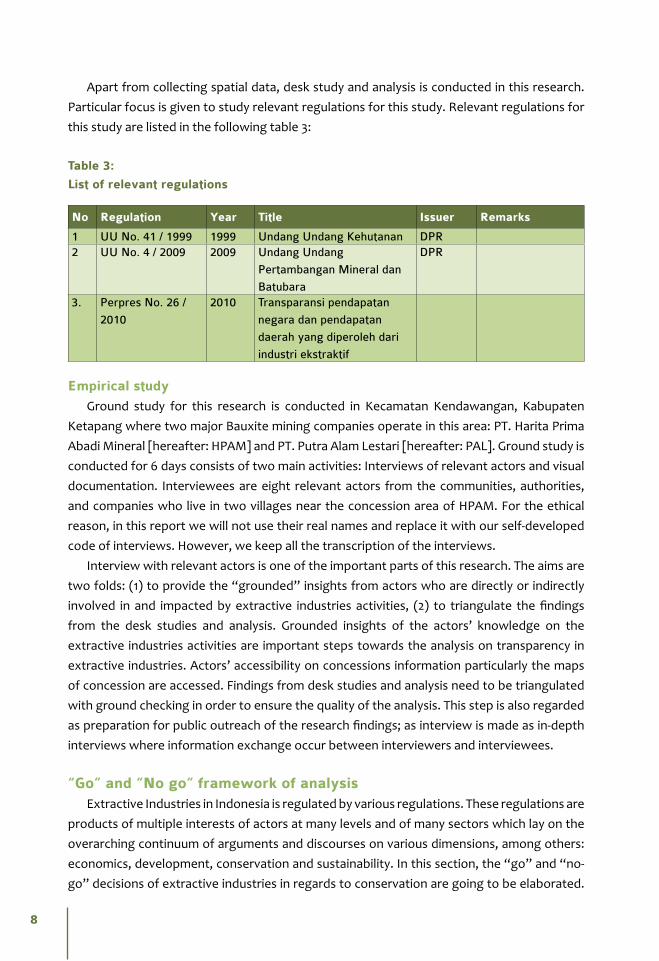
We collect spatial data from relevant governmental offices to support our research. The data that we obtained is listed in the following Table 2:
Table 2:
List of Maps
No Maps Name Year Source Remarks
1 Peta Sebaran Perkebunan Sawit
Kalimantan Barat
2011 Kantor Badan Pertanahan
Provinsi Kalimantan Barat2 Peta Izin Usaha Pemanfaatan
Hasil Hutan Kayu – Hutan
Tanaman (IPHHK_HT / HTI)
2013 Kementrian Kehutanan RI
3 Peta Izin Usaha Pemanfaatan
Hasil Hutan Kayu – Hutan Alam
( IPHHK_HT / HPH)
2013 Kementrian Kehutanan RI
4 Peta Perkebunan Sawit Kalbar
(Update)
2013 Kementrian Kehutanan RI
5 Peta Pertambangan 2012 Dinas Pertambangan dan
Energi Provinsi Kalimantan
Barat6 Rencana Tata Ruang Wilayah
Provinsi Kalimantan Barat
2013 Draft – Local Regulation
Methods2
8
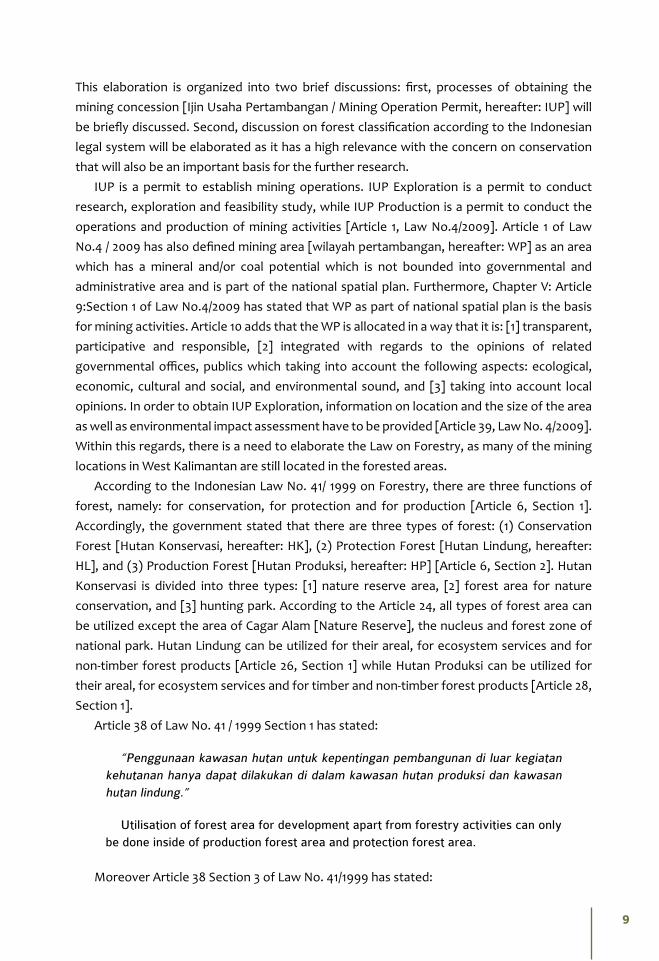
Apart from collecting spatial data, desk study and analysis is conducted in this research. Particular focus is given to study relevant regulations for this study. Relevant regulations for this study are listed in the following table 3:
Table 3:
List of relevant regulations
No Regulation Year Title Issuer Remarks
1 UU No. 41 / 1999 1999 Undang Undang Kehutanan DPR2 UU No. 4 / 2009 2009 Undang Undang
Pertambangan Mineral dan
Batubara
DPR
3. Perpres No. 26 /
2010
2010 Transparansi pendapatan
negara dan pendapatan
daerah yang diperoleh dari
industri ekstraktif
Empirical studyGround study for this research is conducted in Kecamatan Kendawangan, Kabupaten
Ketapang where two major Bauxite mining companies operate in this area: PT. Harita Prima Abadi Mineral [hereafter: HPAM] and PT. Putra Alam Lestari [hereafter: PAL]. Ground study is conducted for 6 days consists of two main activities: Interviews of relevant actors and visual documentation. Interviewees are eight relevant actors from the communities, authorities, and companies who live in two villages near the concession area of HPAM. For the ethical reason, in this report we will not use their real names and replace it with our self-developed code of interviews. However, we keep all the transcription of the interviews.
Interview with relevant actors is one of the important parts of this research. The aims are two folds: (1) to provide the “grounded” insights from actors who are directly or indirectly involved in and impacted by extractive industries activities, (2) to triangulate the findings from the desk studies and analysis. Grounded insights of the actors’ knowledge on the extractive industries activities are important steps towards the analysis on transparency in extractive industries. Actors’ accessibility on concessions information particularly the maps of concession are accessed. Findings from desk studies and analysis need to be triangulated with ground checking in order to ensure the quality of the analysis. This step is also regarded as preparation for public outreach of the research findings; as interview is made as in-depth interviews where information exchange occur between interviewers and interviewees.
“Go” and “No go” framework of analysisExtractive Industries in Indonesia is regulated by various regulations. These regulations are
products of multiple interests of actors at many levels and of many sectors which lay on the overarching continuum of arguments and discourses on various dimensions, among others: economics, development, conservation and sustainability. In this section, the “go” and “no-go” decisions of extractive industries in regards to conservation are going to be elaborated.
9
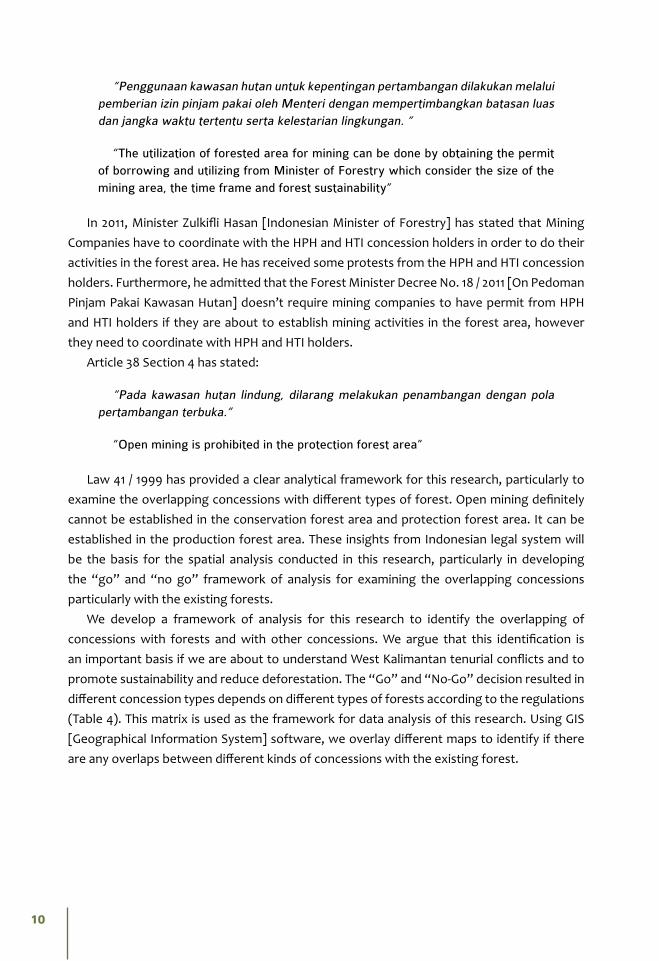
This elaboration is organized into two brief discussions: first, processes of obtaining the mining concession [Ijin Usaha Pertambangan / Mining Operation Permit, hereafter: IUP] will be briefly discussed. Second, discussion on forest classification according to the Indonesian legal system will be elaborated as it has a high relevance with the concern on conservation that will also be an important basis for the further research.
IUP is a permit to establish mining operations. IUP Exploration is a permit to conduct research, exploration and feasibility study, while IUP Production is a permit to conduct the operations and production of mining activities [Article 1, Law No.4/2009]. Article 1 of Law No.4 / 2009 has also defined mining area [wilayah pertambangan, hereafter: WP] as an area which has a mineral and/or coal potential which is not bounded into governmental and administrative area and is part of the national spatial plan. Furthermore, Chapter V: Article 9:Section 1 of Law No.4/2009 has stated that WP as part of national spatial plan is the basis for mining activities. Article 10 adds that the WP is allocated in a way that it is: [1] transparent, participative and responsible, [2] integrated with regards to the opinions of related governmental offices, publics which taking into account the following aspects: ecological, economic, cultural and social, and environmental sound, and [3] taking into account local opinions. In order to obtain IUP Exploration, information on location and the size of the area as well as environmental impact assessment have to be provided [Article 39, Law No. 4/2009]. Within this regards, there is a need to elaborate the Law on Forestry, as many of the mining locations in West Kalimantan are still located in the forested areas.
According to the Indonesian Law No. 41/ 1999 on Forestry, there are three functions of forest, namely: for conservation, for protection and for production [Article 6, Section 1]. Accordingly, the government stated that there are three types of forest: (1) Conservation Forest [Hutan Konservasi, hereafter: HK], (2) Protection Forest [Hutan Lindung, hereafter: HL], and (3) Production Forest [Hutan Produksi, hereafter: HP] [Article 6, Section 2]. Hutan Konservasi is divided into three types: [1] nature reserve area, [2] forest area for nature conservation, and [3] hunting park. According to the Article 24, all types of forest area can be utilized except the area of Cagar Alam [Nature Reserve], the nucleus and forest zone of national park. Hutan Lindung can be utilized for their areal, for ecosystem services and for non-timber forest products [Article 26, Section 1] while Hutan Produksi can be utilized for their areal, for ecosystem services and for timber and non-timber forest products [Article 28, Section 1].
Article 38 of Law No. 41 / 1999 Section 1 has stated:
“Penggunaan kawasan hutan untuk kepentingan pembangunan di luar kegiatan kehutanan hanya dapat dilakukan di dalam kawasan hutan produksi dan kawasan hutan lindung.”
Utilisation of forest area for development apart from forestry activities can only be done inside of production forest area and protection forest area.
Moreover Article 38 Section 3 of Law No. 41/1999 has stated:
10
“Penggunaan kawasan hutan untuk kepentingan pertambangan dilakukan melalui pemberian izin pinjam pakai oleh Menteri dengan mempertimbangkan batasan luas dan jangka waktu tertentu serta kelestarian lingkungan. “
“The utilization of forested area for mining can be done by obtaining the permit of borrowing and utilizing from Minister of Forestry which consider the size of the mining area, the time frame and forest sustainability”
In 2011, Minister Zulkifli Hasan [Indonesian Minister of Forestry] has stated that Mining Companies have to coordinate with the HPH and HTI concession holders in order to do their activities in the forest area. He has received some protests from the HPH and HTI concession holders. Furthermore, he admitted that the Forest Minister Decree No. 18 / 2011 [On Pedoman Pinjam Pakai Kawasan Hutan] doesn’t require mining companies to have permit from HPH and HTI holders if they are about to establish mining activities in the forest area, however they need to coordinate with HPH and HTI holders.
Article 38 Section 4 has stated:
“Pada kawasan hutan lindung, dilarang melakukan penambangan dengan pola pertambangan terbuka.”
“Open mining is prohibited in the protection forest area”
Law 41 / 1999 has provided a clear analytical framework for this research, particularly to examine the overlapping concessions with different types of forest. Open mining definitely cannot be established in the conservation forest area and protection forest area. It can be established in the production forest area. These insights from Indonesian legal system will be the basis for the spatial analysis conducted in this research, particularly in developing the “go” and “no go” framework of analysis for examining the overlapping concessions particularly with the existing forests.
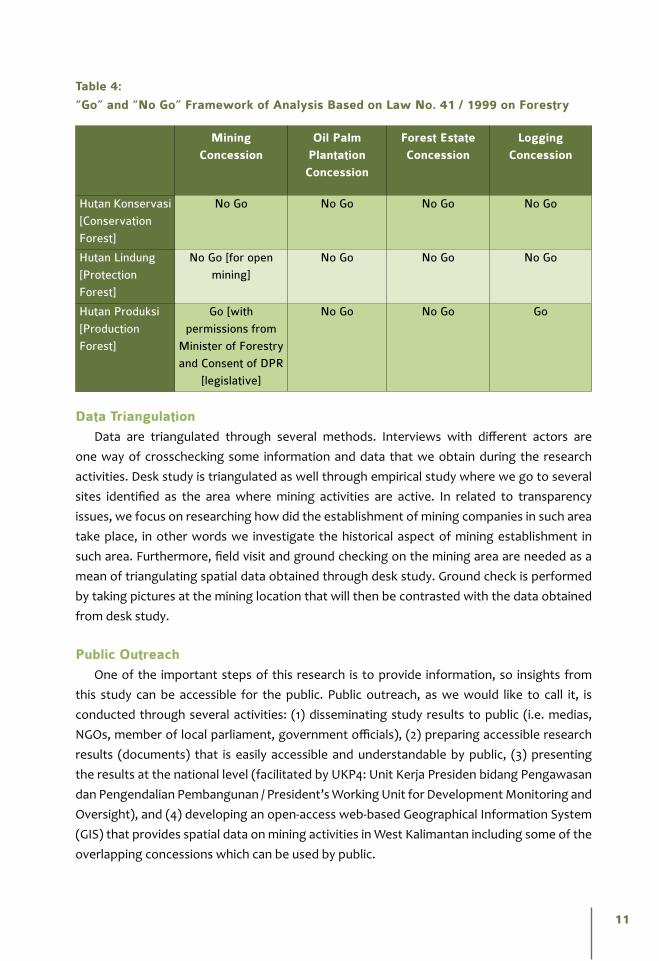
We develop a framework of analysis for this research to identify the overlapping of concessions with forests and with other concessions. We argue that this identification is an important basis if we are about to understand West Kalimantan tenurial conflicts and to promote sustainability and reduce deforestation. The “Go” and “No-Go” decision resulted in different concession types depends on different types of forests according to the regulations (Table 4). This matrix is used as the framework for data analysis of this research. Using GIS [Geographical Information System] software, we overlay different maps to identify if there are any overlaps between different kinds of concessions with the existing forest.
11
Table 4:
“Go” and “No Go” Framework of Analysis Based on Law No. 41 / 1999 on Forestry
Mining Concession
Oil Palm Plantation Concession
Forest Estate Concession
Logging Concession
Hutan Konservasi
[Conservation
Forest]
No Go No Go No Go No Go
Hutan Lindung
[Protection
Forest]
No Go [for open
mining]
No Go No Go No Go
Hutan Produksi
[Production
Forest]
Go [with
permissions from
Minister of Forestry
and Consent of DPR
[legislative]
No Go No Go Go
Data TriangulationData are triangulated through several methods. Interviews with different actors are
one way of crosschecking some information and data that we obtain during the research activities. Desk study is triangulated as well through empirical study where we go to several sites identified as the area where mining activities are active. In related to transparency issues, we focus on researching how did the establishment of mining companies in such area take place, in other words we investigate the historical aspect of mining establishment in such area. Furthermore, field visit and ground checking on the mining area are needed as a mean of triangulating spatial data obtained through desk study. Ground check is performed by taking pictures at the mining location that will then be contrasted with the data obtained from desk study.
Public OutreachOne of the important steps of this research is to provide information, so insights from
this study can be accessible for the public. Public outreach, as we would like to call it, is conducted through several activities: (1) disseminating study results to public (i.e. medias, NGOs, member of local parliament, government officials), (2) preparing accessible research results (documents) that is easily accessible and understandable by public, (3) presenting the results at the national level (facilitated by UKP4: Unit Kerja Presiden bidang Pengawasan dan Pengendalian Pembangunan / President’s Working Unit for Development Monitoring and Oversight), and (4) developing an open-access web-based Geographical Information System (GIS) that provides spatial data on mining activities in West Kalimantan including some of the overlapping concessions which can be used by public.

12
Desk study was conducted by collecting and creating database of existing documents related to the mining activities in West Kalimantan. The data are obtained from various resources
including government offices, NGOs. Then continued with conducting spatial analysis of the data using GIS to overlay different maps (i.e. forest, concessions). We use the “go and no go” framework (will be elaborated further in this section) to analyze the spatial data according to the Law No. 41 / 1999 about forestry. Output of this desk study are maps show overlapping between concessions and some forest that is illegal according to the Law No. 41 /1999 about forestry.
Overlapping Mining Concessions with Forest Our previous study has identified that there are 721 mining concessions
were given which are located in West Kalimantan Province involving in total of 5.7 Million Hectares [Ha] of land. Using the “Go” and “No Go” Framework of Analysis, it is identified that there are 31,623.827 Ha [Thirty one thousands six hundreds and twenty three point eight hundred twenty seven Hectares] of mining concessions located “above” the Conservation Forest. Furthermore, it is also identified that there are 190,561.9328 Ha [One hundred and ninety thousands five hundreds and sixty one point nine thousands three hundreds and twenty eight Hectares] of mining concessions located “above” the Protection Forest and there are 323,564.8176 Ha of mining concessions located in the Production Forest (see Table 5).
3Results
13
Table 5:
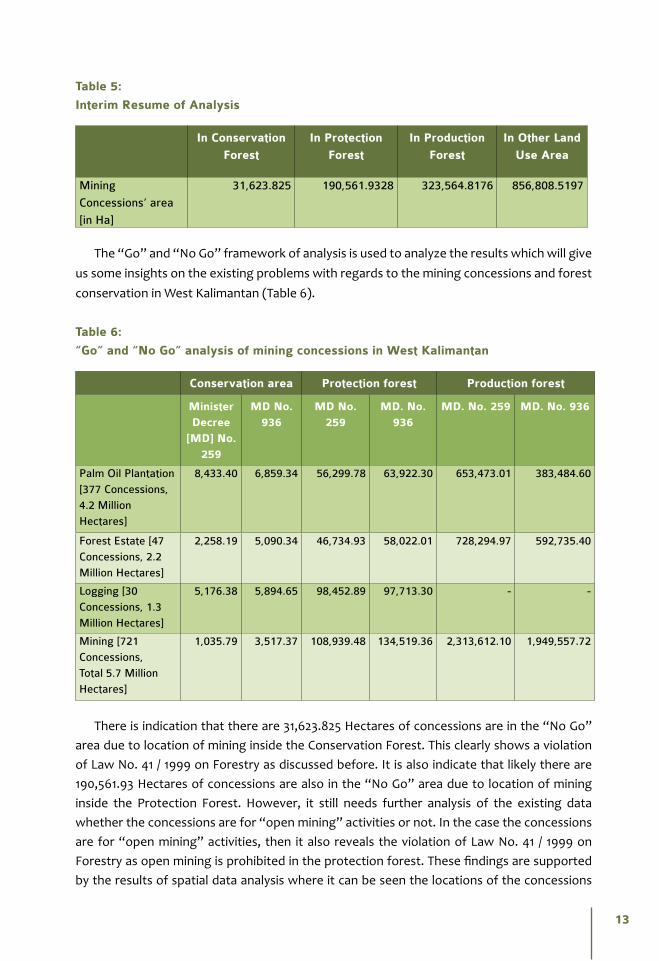
Interim Resume of Analysis
In Conservation Forest
In Protection Forest
In Production Forest
In Other Land Use Area
Mining
Concessions’ area
[in Ha]
31,623.825 190,561.9328 323,564.8176 856,808.5197
The “Go” and “No Go” framework of analysis is used to analyze the results which will give us some insights on the existing problems with regards to the mining concessions and forest conservation in West Kalimantan (Table 6).
Table 6:
“Go” and “No Go” analysis of mining concessions in West Kalimantan
Conservation area Protection forest Production forest
Minister Decree
[MD] No. 259
MD No. 936
MD No. 259
MD. No. 936
MD. No. 259 MD. No. 936
Palm Oil Plantation
[377 Concessions,
4.2 Million
Hectares]
8,433.40 6,859.34 56,299.78 63,922.30 653,473.01 383,484.60
Forest Estate [47
Concessions, 2.2
Million Hectares]
2,258.19 5,090.34 46,734.93 58,022.01 728,294.97 592,735.40
Logging [30
Concessions, 1.3
Million Hectares]
5,176.38 5,894.65 98,452.89 97,713.30 - -
Mining [721
Concessions,
Total 5.7 Million
Hectares]
1,035.79 3,517.37 108,939.48 134,519.36 2,313,612.10 1,949,557.72
There is indication that there are 31,623.825 Hectares of concessions are in the “No Go” area due to location of mining inside the Conservation Forest. This clearly shows a violation of Law No. 41 / 1999 on Forestry as discussed before. It is also indicate that likely there are 190,561.93 Hectares of concessions are also in the “No Go” area due to location of mining inside the Protection Forest. However, it still needs further analysis of the existing data whether the concessions are for “open mining” activities or not. In the case the concessions are for “open mining” activities, then it also reveals the violation of Law No. 41 / 1999 on Forestry as open mining is prohibited in the protection forest. These findings are supported by the results of spatial data analysis where it can be seen the locations of the concessions
14
which are violating the Law No. 41 / 1999, particularly when the concessions are “located above” the conservation forest and protection forest [for open mining]. In these maps, it can be indicated the “Red Colored” area where the concessions are located “above” the Conservation Forest and Protection Forest, in which this reports refers as the “No Go” area. This reports is supported by three maps as the results of spatial analysis which are summarized below:
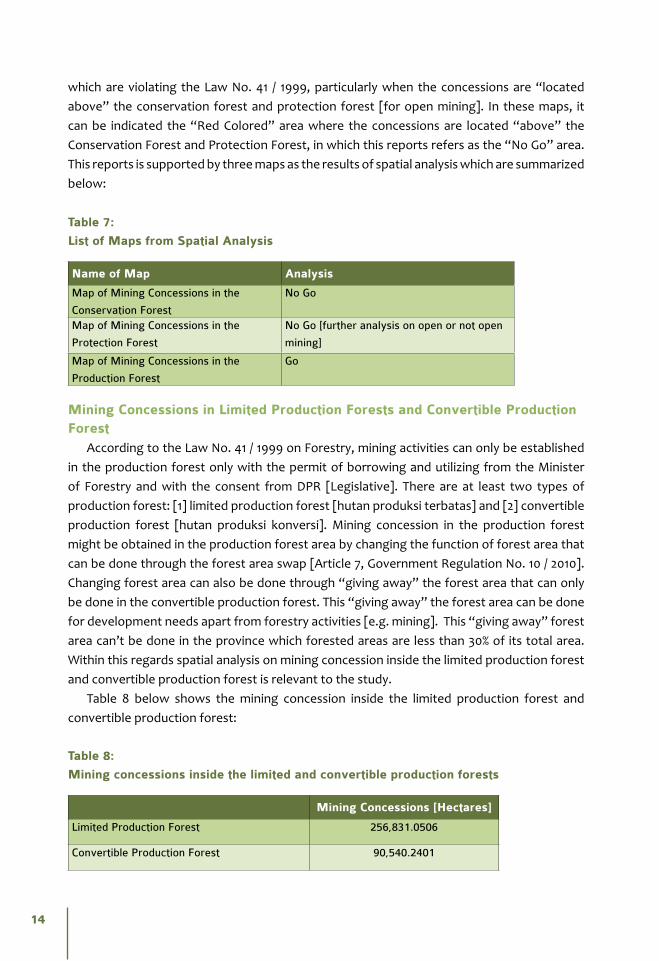
Table 7:
List of Maps from Spatial Analysis
Name of Map Analysis
Map of Mining Concessions in the
Conservation Forest
No Go
Map of Mining Concessions in the
Protection Forest
No Go [further analysis on open or not open
mining]
Map of Mining Concessions in the
Production Forest
Go
Mining Concessions in Limited Production Forests and Convertible Production Forest
According to the Law No. 41 / 1999 on Forestry, mining activities can only be established in the production forest only with the permit of borrowing and utilizing from the Minister of Forestry and with the consent from DPR [Legislative]. There are at least two types of production forest: [1] limited production forest [hutan produksi terbatas] and [2] convertible production forest [hutan produksi konversi]. Mining concession in the production forest might be obtained in the production forest area by changing the function of forest area that can be done through the forest area swap [Article 7, Government Regulation No. 10 / 2010]. Changing forest area can also be done through “giving away” the forest area that can only be done in the convertible production forest. This “giving away” the forest area can be done for development needs apart from forestry activities [e.g. mining]. This “giving away” forest area can’t be done in the province which forested areas are less than 30% of its total area. Within this regards spatial analysis on mining concession inside the limited production forest and convertible production forest is relevant to the study.
Table 8 below shows the mining concession inside the limited production forest and convertible production forest:
Table 8:
Mining concessions inside the limited and convertible production forests
Mining Concessions [Hectares]
Limited Production Forest 256,831.0506
Convertible Production Forest 90,540.2401
15
Further elaboration is needed to identify which of the mining concessions have already permissions from the Minister of Forestry with the consent from DPR [legislative] to identify the “Go” and “No Go” concessions. These findings have given some insights on examining the spatial transparency in extractive industries in West Kalimantan Province.
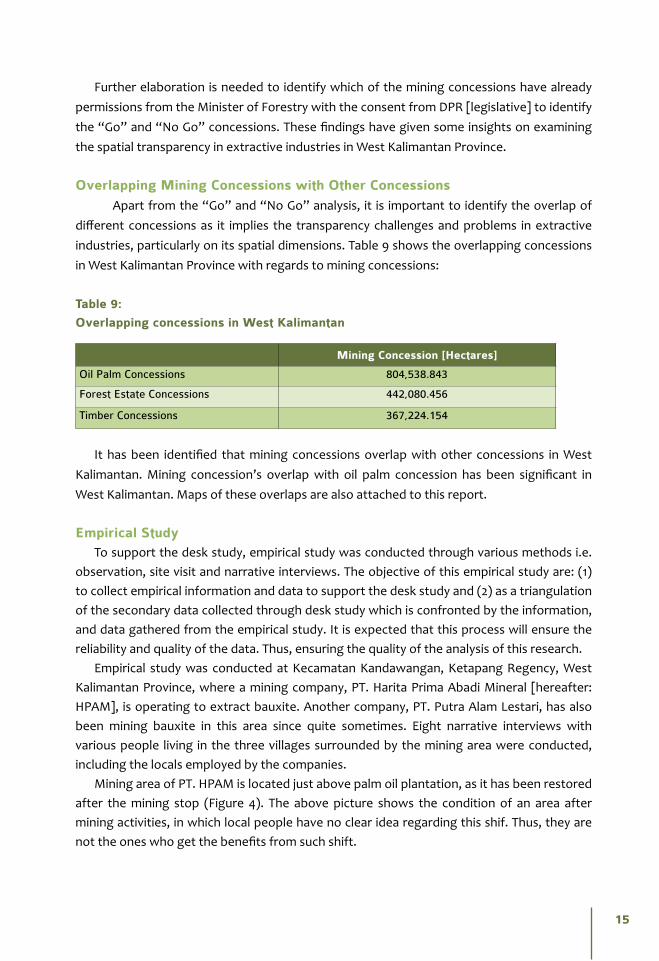
Overlapping Mining Concessions with Other Concessions Apart from the “Go” and “No Go” analysis, it is important to identify the overlap of
different concessions as it implies the transparency challenges and problems in extractive industries, particularly on its spatial dimensions. Table 9 shows the overlapping concessions in West Kalimantan Province with regards to mining concessions:
Table 9:
Overlapping concessions in West Kalimantan
Mining Concession [Hectares]
Oil Palm Concessions 804,538.843
Forest Estate Concessions 442,080.456
Timber Concessions 367,224.154
It has been identified that mining concessions overlap with other concessions in West Kalimantan. Mining concession’s overlap with oil palm concession has been significant in West Kalimantan. Maps of these overlaps are also attached to this report.
Empirical StudyTo support the desk study, empirical study was conducted through various methods i.e.
observation, site visit and narrative interviews. The objective of this empirical study are: (1) to collect empirical information and data to support the desk study and (2) as a triangulation of the secondary data collected through desk study which is confronted by the information, and data gathered from the empirical study. It is expected that this process will ensure the reliability and quality of the data. Thus, ensuring the quality of the analysis of this research.
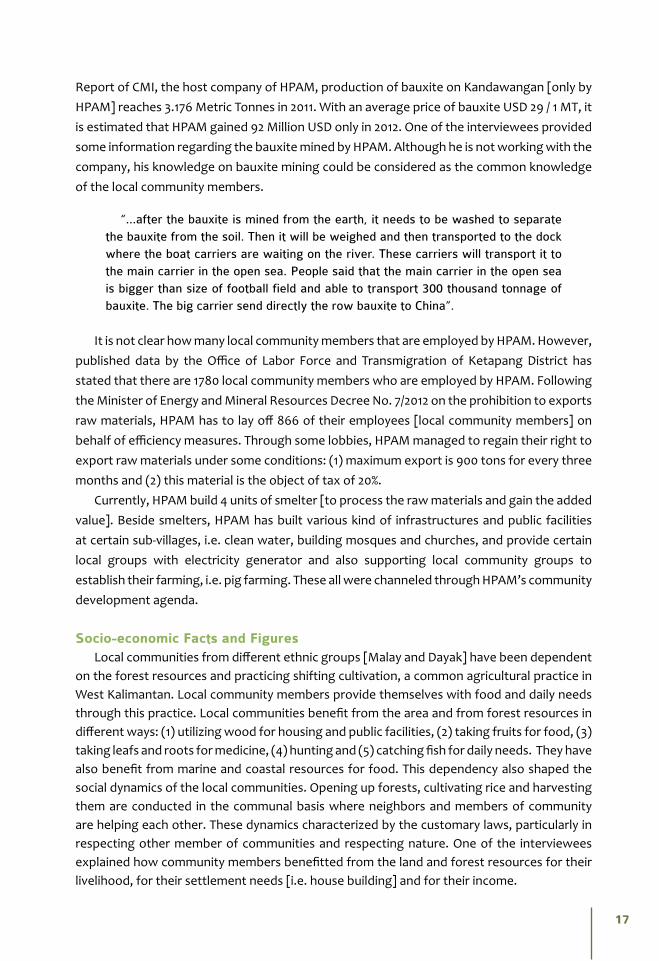
Empirical study was conducted at Kecamatan Kandawangan, Ketapang Regency, West Kalimantan Province, where a mining company, PT. Harita Prima Abadi Mineral [hereafter: HPAM], is operating to extract bauxite. Another company, PT. Putra Alam Lestari, has also been mining bauxite in this area since quite sometimes. Eight narrative interviews with various people living in the three villages surrounded by the mining area were conducted, including the locals employed by the companies.
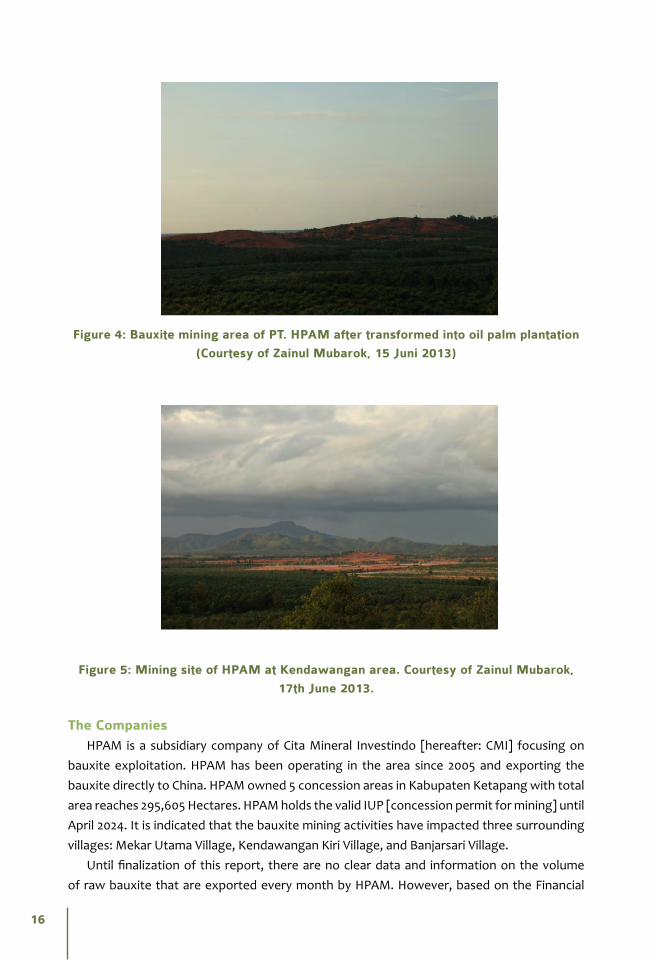
Mining area of PT. HPAM is located just above palm oil plantation, as it has been restored after the mining stop (Figure 4). The above picture shows the condition of an area after mining activities, in which local people have no clear idea regarding this shif. Thus, they are not the ones who get the benefits from such shift.
16
Figure 4: Bauxite mining area of PT. HPAM after transformed into oil palm plantation
(Courtesy of Zainul Mubarok, 15 Juni 2013)
Figure 5: Mining site of HPAM at Kendawangan area. Courtesy of Zainul Mubarok,
17th June 2013.
The CompaniesHPAM is a subsidiary company of Cita Mineral Investindo [hereafter: CMI] focusing on
bauxite exploitation. HPAM has been operating in the area since 2005 and exporting the bauxite directly to China. HPAM owned 5 concession areas in Kabupaten Ketapang with total area reaches 295,605 Hectares. HPAM holds the valid IUP [concession permit for mining] until April 2024. It is indicated that the bauxite mining activities have impacted three surrounding villages: Mekar Utama Village, Kendawangan Kiri Village, and Banjarsari Village.
Until finalization of this report, there are no clear data and information on the volume of raw bauxite that are exported every month by HPAM. However, based on the Financial
17
Report of CMI, the host company of HPAM, production of bauxite on Kandawangan [only by HPAM] reaches 3.176 Metric Tonnes in 2011. With an average price of bauxite USD 29 / 1 MT, it is estimated that HPAM gained 92 Million USD only in 2012. One of the interviewees provided some information regarding the bauxite mined by HPAM. Although he is not working with the company, his knowledge on bauxite mining could be considered as the common knowledge of the local community members.
“...after the bauxite is mined from the earth, it needs to be washed to separate the bauxite from the soil. Then it will be weighed and then transported to the dock where the boat carriers are waiting on the river. These carriers will transport it to the main carrier in the open sea. People said that the main carrier in the open sea is bigger than size of football field and able to transport 300 thousand tonnage of bauxite. The big carrier send directly the row bauxite to China”.
It is not clear how many local community members that are employed by HPAM. However, published data by the Office of Labor Force and Transmigration of Ketapang District has stated that there are 1780 local community members who are employed by HPAM. Following the Minister of Energy and Mineral Resources Decree No. 7/2012 on the prohibition to exports raw materials, HPAM has to lay off 866 of their employees [local community members] on behalf of efficiency measures. Through some lobbies, HPAM managed to regain their right to export raw materials under some conditions: (1) maximum export is 900 tons for every three months and (2) this material is the object of tax of 20%.
Currently, HPAM build 4 units of smelter [to process the raw materials and gain the added value]. Beside smelters, HPAM has built various kind of infrastructures and public facilities at certain sub-villages, i.e. clean water, building mosques and churches, and provide certain local groups with electricity generator and also supporting local community groups to establish their farming, i.e. pig farming. These all were channeled through HPAM’s community development agenda.
Socio-economic Facts and FiguresLocal communities from different ethnic groups [Malay and Dayak] have been dependent
on the forest resources and practicing shifting cultivation, a common agricultural practice in West Kalimantan. Local community members provide themselves with food and daily needs through this practice. Local communities benefit from the area and from forest resources in different ways: (1) utilizing wood for housing and public facilities, (2) taking fruits for food, (3) taking leafs and roots for medicine, (4) hunting and (5) catching fish for daily needs. They have also benefit from marine and coastal resources for food. This dependency also shaped the social dynamics of the local communities. Opening up forests, cultivating rice and harvesting them are conducted in the communal basis where neighbors and members of community are helping each other. These dynamics characterized by the customary laws, particularly in respecting other member of communities and respecting nature. One of the interviewees explained how community members benefitted from the land and forest resources for their livelihood, for their settlement needs [i.e. house building] and for their income.
18
However, he also explained how the situation has changed after this area became subject of different concessions. He stated his concern of their future, as he is aware that the village where he lives is already part of concession area of company. He also indicated emerging horizontal conflicts between community members, due to the establishment of various concessions in their area. It was quoted:
“... but after the companies enter [the area], life started to change. The government through the Forestry Office Officers told [us] that community members can’t practice shifting agriculture and do activities at the land belonging to the customary forest. They say that our customary forest has been designated as state forest. Not long time after, we have heard as well that part of our customary forest had been handed over to PT. Kertas Basuki Rahmat [KBR], a HTI company was in 1997. It was then continued by the oil palm plantation, and in around 2002/2003, there was a survey conducted by a mining company. In around 2004/2005, PT. Harita and PT. PAL [both are mining companies] started their operation in our area. Some of us were welcoming these companies, but most of us refused the companies. However, the ones who refused couldn’t do much as they were afraid of creating problems with the government and the companies.”
Furthermore, he added:
“...We just heard briefly what is RTRW [Spatial Plan]. But we have never known what are the policies. We only know about the existence of companies of HPH, HTI, Palm Oil and Mining in our area after the companies and the government conducted socialization. The Government said that the companies have obtained the permit. We feel coined and we are pushed to accept it”.
Another interviewee stated:
“...there was a socialization process when the companies were about to enter. But only the elites of the villages and the important people attended [the meeting]. And as usual, the companies were full of promises, particularly regarding the recruitment of the local laborers and the development of our area”.
On TransparencyIt is identified that most of the villagers were not informed about and involved on
the establishment of PT. HPAM. Although the company has conducted public outreach, this outreach was only involving the elites of the villages, officials from sub-district, and representatives of local police and military offices. Some of the elites refused this establishment. However, several of them accepted this establishment, as they probably were interested in the “benefit” promised by the companies: (1) jobs creation, (2) contribution to the local development, (3) and fees for village officials. One of the interviewees reported:
“...most of the villagers had difficulties to resist the establishment of mining companies as almost all the village elites, government officials (Head of Regency, Camat) including the “local bodygoards” have been controlled by the company.
19
Honest information regarding mining in this area is hard to accessed by the community members as there are some vested of interests and also the community members are afraid of creating troubles.”
Furthermore, related to spatial planning documents, another interviewee stated:
“...we only heard about what is RTRW (spatial planning document)? But we never know what are the policies. We only know the existence of companies with HPH (logging concession), HTI (forest concession), palm oil and mining in our area after the companies and government officials conducted public outreaching. Government says that the companies have the permits, so we are coined and forced to accept.”
Right after “public outreach”, PT. HPAM started to acquire the land. The company recruited influential community members to persuade villagers to give away their land and their gardens. In return, the company promised them to provide jobs and to return or reclaim the land with rubber trees and other trees (i.e. oil palm) if the mining activities over. Negotiation on land price was carried out afterwards. This negotiation was organized by one of the company’s employee member in the community development team. At the beginning, community member received IDR 2,000,000 per hectare. However, after 2010 each community member who gives their land away receive in general IDR 10,000,000 per hectare.
Web-based GISResults of spatial analysis are displayed as an interactive web-based GIS that can be
accessed at http://editor.giscloud.com/map/230430/eispatialtranparency. This platform is used in order to provide general public with spatial data and information regarding mining sectors in West Kalimantan. Visitors of this website can perform various query related to different concessions and state of forestry in West Kalimantan.
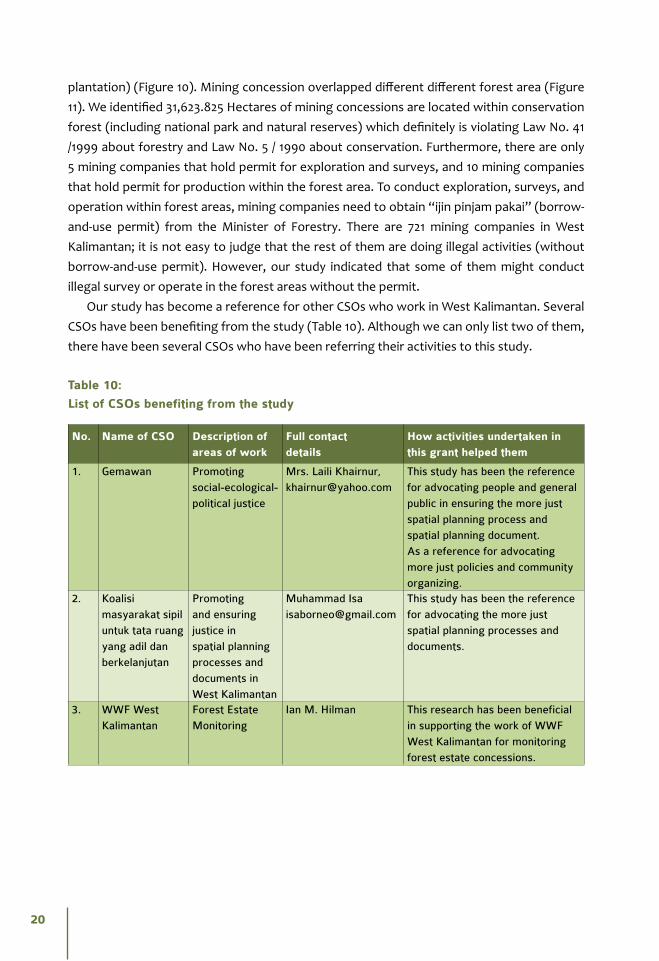
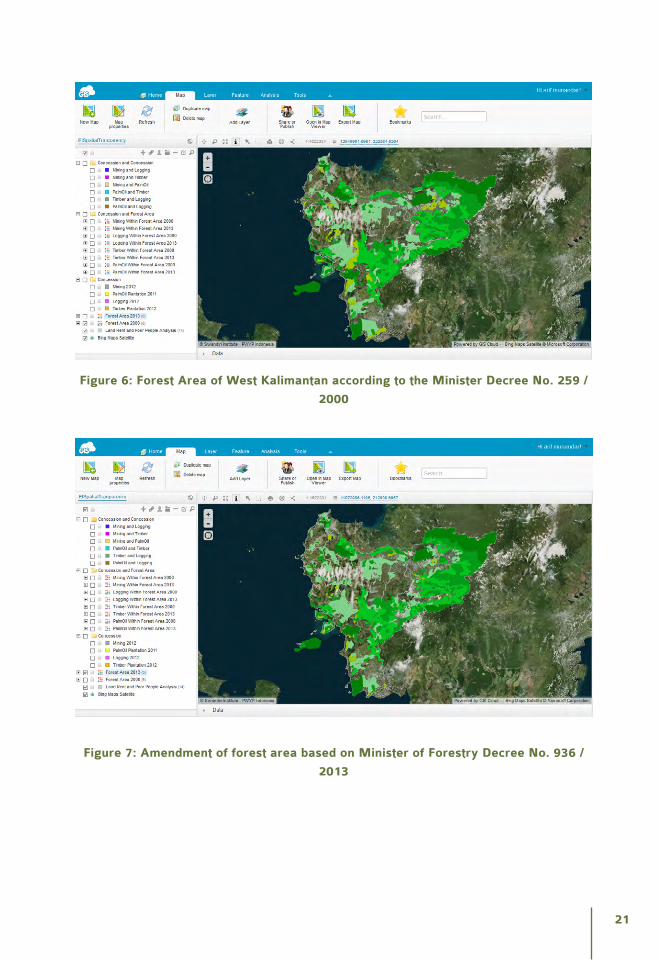
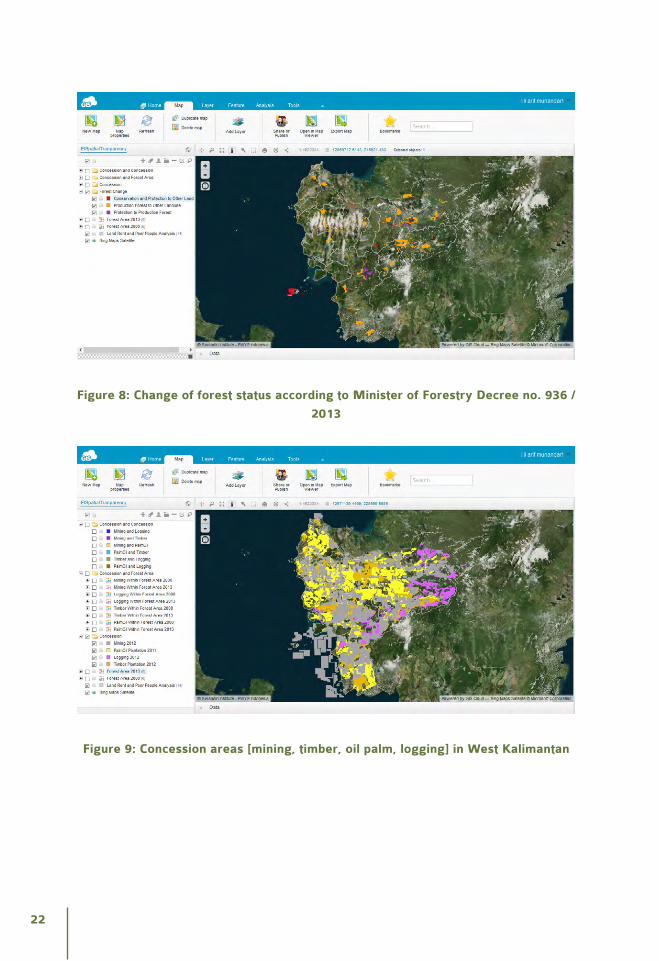
Minister of Forestry Decree No. 259 /2000 has allocated forest area in West Kalimantan (Figure 6). However, this decree had been revised and amended with Minister of Forestry Decree No. 936 / 2013 (see figure 7), which we argue, legalize the “illegal activities” (i.e. oil palm plantation concessions within the forest area). There are some changes in the newly allocated forest according to the Minister of Forestry Decree No. 936 / 2013 (Figure 7). For instance, from forest area to non-forest area: 554,137 hectares, from forest area to another type of forest area (i.e. protection forest to production forest, etc.): 352,772 hectares, from non-forest area (other land-use area) to forest area: 52,386 hectares (Figure 8). Furthermore, we identified that there are 69,294 hectares of forest area (conservation and protection forest) that has been “changed” into other land-use area. This forest area has been “changed” dramatically from the “highest” categories of forest to the other land-use area (APL) category. The Minister of Forestry Decree No. 936 / 2013 is going to affirm by the parliament.
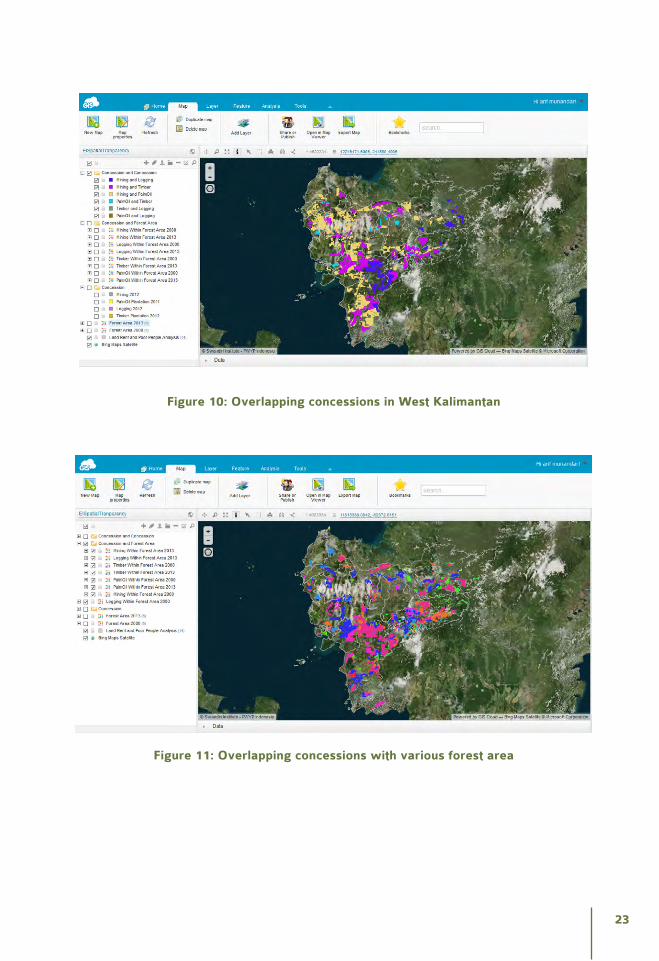
Overlapping of concessions areas in the forest areas violate Law No. 41 /1999 (i.e. mining concession inside national park, oil palm inside any kind of forest area) (Figure 9). The overlapping also occurred among different concessions (i.e. mining, timber, logging, oil palm
20
plantation) (Figure 10). Mining concession overlapped different different forest area (Figure 11). We identified 31,623.825 Hectares of mining concessions are located within conservation forest (including national park and natural reserves) which definitely is violating Law No. 41 /1999 about forestry and Law No. 5 / 1990 about conservation. Furthermore, there are only 5 mining companies that hold permit for exploration and surveys, and 10 mining companies that hold permit for production within the forest area. To conduct exploration, surveys, and operation within forest areas, mining companies need to obtain “ijin pinjam pakai” (borrow-and-use permit) from the Minister of Forestry. There are 721 mining companies in West Kalimantan; it is not easy to judge that the rest of them are doing illegal activities (without borrow-and-use permit). However, our study indicated that some of them might conduct illegal survey or operate in the forest areas without the permit.
Our study has become a reference for other CSOs who work in West Kalimantan. Several CSOs have been benefiting from the study (Table 10). Although we can only list two of them, there have been several CSOs who have been referring their activities to this study.
Table 10:
List of CSOs benefiting from the study
No. Name of CSO Description of areas of work
Full contact details
How activities undertaken in this grant helped them
1. Gemawan Promoting
social-ecological-
political justice
Mrs. Laili Khairnur,
This study has been the reference
for advocating people and general
public in ensuring the more just
spatial planning process and
spatial planning document.
As a reference for advocating
more just policies and community
organizing. 2. Koalisi
masyarakat sipil
untuk tata ruang
yang adil dan
berkelanjutan
Promoting
and ensuring
justice in
spatial planning
processes and
documents in
West Kalimantan
Muhammad Isa
This study has been the reference
for advocating the more just
spatial planning processes and
documents.
3. WWF West
Kalimantan
Forest Estate
Monitoring
Ian M. Hilman This research has been beneficial
in supporting the work of WWF
West Kalimantan for monitoring
forest estate concessions.
21
Figure 6: Forest Area of West Kalimantan according to the Minister Decree No. 259 /
2000
Figure 7: Amendment of forest area based on Minister of Forestry Decree No. 936 /
2013
22
Figure 8: Change of forest status according to Minister of Forestry Decree no. 936 /
2013
Figure 9: Concession areas [mining, timber, oil palm, logging] in West Kalimantan
23
Figure 10: Overlapping concessions in West Kalimantan
Figure 11: Overlapping concessions with various forest area
24
In this section, we will discuss four main issues related to the spatial transparency extractive industries in West Kalimantan. Our study on extractive industries and their concessions in West Kalimantan has demonstrated that spatial transparency has become one of
the challenge that need to be overcome to achieve fairness in spatial planning processes and documents. Firstly, we will discuss the extractive industries and spatial transparency. Then followed by discussion on elite capture in extractive industries establishment in West Kalimantan, amendment of forestry status, and allocation in 2013. Lastly, we elaborate the connection between spatial transparency and land grabbing issues.
On Spatial Transparency and Extractive IndustriesAs we have shown in our research, spatial transparency particularly in extractive industries
sector is still one of the biggest challenges for promoting fairness in spatial planning processes and documents. We found that there are overlaps between mining concession and forest areas. For instance, some mining concessions located “inside” the conservation forest. Such concessions violate Law No. 41 / 1999 about Forestry and Law No. 5 / 1990 about Conservation. This fact highlights the need to promote spatial transparency, particularly in extractive industries. Spatial transparency is indispensable, if we want to promote fairness in the development of spatial planning processes. Examining spatial transparency in extractive industries might lead to the fairness in spatial planning processes and spatial planning documents.
4Discussion
25
Figure 12: Expose of Research Result at UKP4
Elite CaptureField research provides significant contribution to the whole research project. Field visits
collected insights from local communities on the existence and establishment of mining companies, particularly towards its transparency. To this point, we can conclude that not all community members aware to the plans of establishment of companies. There are two reasons: [1] the plan is not accessible to some of the local community members and [2] the plans and the establishment processes of companies are captured by the local elites. Elite capture has characterized establishment of mining activities at the local level, however elite arrangements towards concessions allocation have also been characterizing the establishment of mining activities in West Kalimantan.
Amendment of Forestry Status and Allocation in 2013The amendment of Minister Decree No. 259 / 2000 about forest allocation to Minister
Decree No. 936 / 2013 can be seen as an effort to “whitening” the allocated forest. Whitening is a term commonly used among particularly environmental activists in Indonesia to describe the process of changing forest status to other land-use area which is colored as “white” in the spatial planning document (Document of Spatial Plan-RTRW-). As we have already described, only in other land-use area that some rather extractive activities can be done (i.e. establishment of oil palm plantation). It can be concluded that this amendment is aimed to give “more space” for oil palm plantation. However, it also results in “legalization” of mining activities that was previously illegal, because located at conservation forest (national parks). Because the conservation forest has been changed into production forest, mining activities can be operated.
Spatial Transparency and Land GrabbingFranco et. al. (2013) report that the term “land grabbing” re-emerged internationally
in the context of a spike in global food prices in 2007-2008. However, this framing of land
26
grabbing masked the real situation. Land grabbing is essentially control grabbing (Franco et. al. 2013). Land grabbing refers to the capturing of power to control land and other associated resources like water, minerals of forests, in order to control the benefits of its use (Franco et.al. 2013). Land grabbing aims at fixing or consolidating forms of access to land-based wealth which can include virtual land grabs where behind a facade of land acquisition for a stated purpose, there lays an agenda to appropriate subsidies. For instance, to obtain bank loans using land permits as collateral, or to speculate on future increases in land values (Franco et.al. 2013). Furthermore, Franco et al (2013) argue that whether “virtual” or “real”, land grabbing is inherently political, what is at stake is the power to decide how and for what purposes the land and water can be used now and in the future. Even if land grabbing are made more transparent, in the end, it still land grabbing.
Our research demonstrated that the “real” land grabbing is happening in establishment of extractive industries in West Kalimantan province. Elite capture, as reported previously occurred in the establishment of extractive industries in West Kalimantan, is one form of capturing of power to control land in order to control the benefits of its use. Our interviewees confirmed this phenomenon. However, implicit land grabbing probably happened as well. There are some concessions / permit that has been put as collateral to obtain bank loans. Although has not provided further elaboration on this issue, this study provides a reference for such elaboration.
Spatial Transparency and Potential Loss of National Revenue As a result of this research, we attained map of mineral and coal mining concession map,
including size of the area and operational phases (exploration, exploitation/production) that distributed in all parts of West Kalimantan province. Based on data of IUP areas and its operational phases, potential revenue from land rent is calculated based on standard of price (Government Regulation No 9/2012 about Rate for Non Tax National Revenue in Energy and Mineral Resources sector). Then, the data is triangulated with the realization of national revenue, particularly allocation for revenue sharing in natural resources from mining per district and province in West Kalimantan. From these data, we calculated discrepancy between those data, which is called as potential loss of national revenue, about IDR 59.542.372.770.
It is suspected that potential losses of national revenue occur because several reason such as: 1. Payment of land rent that was not equal to areas of land in the real IUP, 2.failing to update the data in responsible agency in the regional government, especially on size of area for IUP exploration and production, 3.The absence of verification, and weak law enforcement during calculation and payment of land rent in mining sector.
27
Tabel
11
:
Pote
ntia
l Loss
Ofr
even
ue
from
‘La
nd R
ents
’ in
Wes
t K
alim
anta
n Fi
scal
Yea
r 2
01
2
No
Dis
tric
t
SK
IU
P E
xplo
rati
on
SK
IU
P P
roduc
tion
Oper
atio
nA
moun
tP
ote
ntia
l
Rev
enue
:
Land
rent
Exp
lora
tion
Pote
ntia
l
Rev
enue
:
Land
rent
Exp
loit
atio
n
Am
oun
t of
Pote
ntia
l
Rev
enue
:
Land
rent
Pote
nti
al
Rev
enue
s
Sha
ring
Lan
dre
nt
Rea
litat
ion
of
Rev
enue
s
Sha
ring
LandR
ent
Pote
nti
al
Min
us
Rea
litat
ion
LandR
ent
Com
pan
ies
(Uni
t)A
rea
(Ha)
Com
pan
ies
(Uni
t)A
rea
(Ha)
Com
pan
ies
(Uni
t)A
rea
(Ha)
12
34
56
78
91
01
112
13
14
1K
AP
UA
S H
ULU
6550
8,57
3.00
836
,185
.70
7354
4,75
8.70
9,56
1,17
2,40
01,
360,
582,
320
10,9
21,7
54,7
206,
989,
923,
021
226
,753
,818
6
,763
,169
,203
2S
INTA
NG
5732
8,52
6.00
1221
1.50
6932
8,73
7.50
6,17
6,28
8,80
07,
952,
400
6,18
4,24
1,20
03,
957,
914,
368
266
,792
,348
3
,691
,122
,020
3M
ELA
WI
5057
8,68
0.00
143,
311.
6964
581,
991.
6910
,879
,184
,000
124,
519,
544
11,0
03,7
03,5
447,
042,
370,
268
100
,024
,649
6
,942
,345
,619
4S
EK
AD
AU
422
,500
.00
41,
594.
008
24,0
94.0
042
3,00
0,00
059
,934
,400
482,
934,
400
309,
078,
016
2,5
55,8
40
306
,522
,176
5S
AN
GG
AU
4517
0,85
0.01
2071
,492
.24
6524
2,34
2.25
3,21
1,98
0,18
82,
688,
108,
224
5,90
0,08
8,41
23,
776,
056,
584
1,6
48,5
61,0
66
2,1
27,4
95,5
18
6K
ETA
PAN
G83
998,
003.
6073
333,
227.
9015
61,
331,
231.
5018
,762
,467
,680
12,5
29,3
69,0
4031
,291
,836
,720
20,0
26,7
75,5
01 3
,646
,420
,798
16,3
80,3
54,7
03
7K
AY
ON
G
UTA
RA
4953
5,02
5.00
00.
0049
535,
025.
0010
,058
,470
,000
010
,058
,470
,000
6,43
7,42
0,80
0 7
02,2
87,7
45
5,7
35,1
33,0
55
8LA
ND
AK
5419
0,82
5.97
326,
396.
9786
197,
222.
943,
587,
528,
236
240,
526,
072
3,82
8,05
4,30
82,
449,
954,
757
1,3
73,5
99,3
76
1,0
76,3
55,3
81
9B
EN
GK
AY
AN
G7
21,9
32.1
017
5,51
6.75
2427
,448
.85
412,
323,
480
207,
429,
800
619,
753,
280
396,
642,
099
188
,905
,184
2
07,7
36,9
15
10S
AM
BA
S1
49,2
70.0
015
41.5
416
49,3
11.5
492
6,27
6,00
01,
561,
904
927,
837,
904
593,
816,
259
76,
656,
720
517
,159
,539
11K
UB
U R
AY
A22
13,0
19.1
911
18.0
033
13,0
37.1
924
4,76
0,77
267
6,80
024
5,43
7,57
215
7,08
0,04
6 9
3,92
8,80
0 6
3,15
1,24
6
12P
ON
TIA
NA
K15
47,3
46.0
016
17,9
84.6
531
65,3
30.6
589
0,10
4,80
067
6,22
2,84
01,
566,
327,
640
1,00
2,44
9,69
0 3
80,0
11,4
94
622
,438
,196
13
LIN
TAS
KA
BU
PATE
N/
PR
OV
INS
I
421,
121,
154.
005
12,6
52.0
047
1,13
3,80
6.00
21,0
77,6
95,2
0047
5,71
5,20
021
,553
,410
,400
17,2
42,7
28,3
20 2
,133
,339
,120
15,1
09,3
89,2
00
Am
ount
494
4,58
5,70
4.87
227
488,
632.
9472
15,
074,
337.
8186
,211
,251
,556
.00
18,3
72,5
98,5
44.0
010
4,58
3,85
0,10
0.00
70,3
82,2
09,7
28.0
0 1
0,83
9,83
6,95
8 5
9,54
2,37
2,77
0
28
Framework that is developed in this study is used to analyze other type of concessions, namely: palm oil concessions and logging concessions. It is argued that this analysis would give important insights for the ongoing debates, discussions and struggles
in promoting spatial transparency, particularly in the extractive industries sector. It is also argued that this kind of analysis could be developed further for the continuing discourses and struggles in promoting transparency in extractive industries. There is a need to tackle and to focus on the spatial dimensions of transparency in extractive industries to complement the ongoing debates, discussions and struggles in promoting EITI.
To this point, this research has identified transparency problems in extractive industries through conducting spatial analysis of mining concessions and forestry. It has also identified some facts in which the plans for establishing mining activities are not accessible by some of the local community members. At this point, this research would conclude that transparency in extractive industries is an ongoing debate, discourses and struggles, which need to be further, elaborated and examined if we are about to promote EITI and sustainability. This research will also examine different type of concessions [palm oil and logging] in order to identify the “Go” or “No Go” dimensions of such concessions in West Kalimantan Province. The results will be brought to, discussed, elaborated with and examined by local community members and various governmental and non-governmental actors, including private sectors in order to support the promotion of spatial transparency and good spatial governance. Furthermore, this research attempts to link the issues of transparency in extractive industry with land-grabbing phenomenon. It is expected that insights provided through this research will be beneficial for the promotion of justice in spatial planning process in Indonesia.
5Conclusion
29
References:
1. Rongiyati, S. [2012]. Kajian Yuridis Izin Pertambangan di Kawasan Hutan. Info Singkat Hukum Vol. IV. No. 13/I/P3DI.
2. Pahan, I. [2006]. Panduan Lengkap Kelapa Sawit: Manajemen Agribisnis dari Hulu hingga Hilir. PT. Penebar Swadaya. Jakarta.
3. Borras, Jr. S.M. & Franco, J. (2011). Political dynamics of land grabbing in Southeast Asia: Understanding Europe’s role. Transnational Institute in the context of the Just Trade project. Amsterdam.
4. Borras, Jr. S.M., Franco, J. & Wang, C. (2012). Competing political tendencies in global governance of land grabbing. Discussion paper. TNI Agrarian Justice Programme. Amsterdam.
5. Carlson, K.M., Curran, L.M., Asner, G.P., Pittman, A. M., Trigg, S.N. & Adeney, J.M. (2012). Carbon emissions from forest conversion by Kalimantan oil palm plantations. Nature Climate Change. DOI: 10.1038/NCLIMATE1702.
6. Trans National Institute (2013). The global land grab: The primer. TNI Agrarian Justice Programme. Amsterdam.
7. Sardana, A., Hernawati, J., Dharma, N.G.G.Y., Nugroho, A.E. & Aliyah, N. (2011). Potret Hutan Provinsi Kalimantan Barat. Kementrian Kehutanan Direktorat Jenderal Planoloti Kehutanan Balai Pemantapan Kawasan Hutan Wilayah III. Pontianak.
Regulations:1. Peraturan Presiden Nomor 26 tahun 2010 tentang Transparansi pendapatan negara dan
pendapatan daerah yang diperoleh dari industri ekstraktif.2. Peraturan Pemerintah Republik Indonesia Nomor 10 tahun 2010 tentang Tata cara
perubahan peruntukan dan fungsi kawasan hutan. 3. Peraturan Pemerintah Republik Indonesia Nomor 9 Tahun 2012 tentang Penerimaan
negara bukan pajak di sektor energi dan sumber daya mineral4. Undang-Undang Republik Indonesia No. 4 / 2009 Tentang Pertambangan Mineral dan
Batubara.5. Undang-Undang Republik Indonesia No. 41 / 1999 Tentang Kehutanan6. Undang-Undang Republik Indonesia No. 5 / 1990 Tentang Konservasi
Online Sources:1. Badan Pusat Statistik [BPS] Kalimantan Barat [2011]. Statistik Ketenagakerjaan Provinsi
Kalimantan Barat: 2011. URL: kalbar.bps.go.id/flippingbook/naker kalbar as 2011/2. Badan Pusat Statistik [BPS] Kalimantan Barat [2013]. Kalimantan Barat Dalam Angka 2012.
URL: www.kalbar.bps.go.id
30
Profile
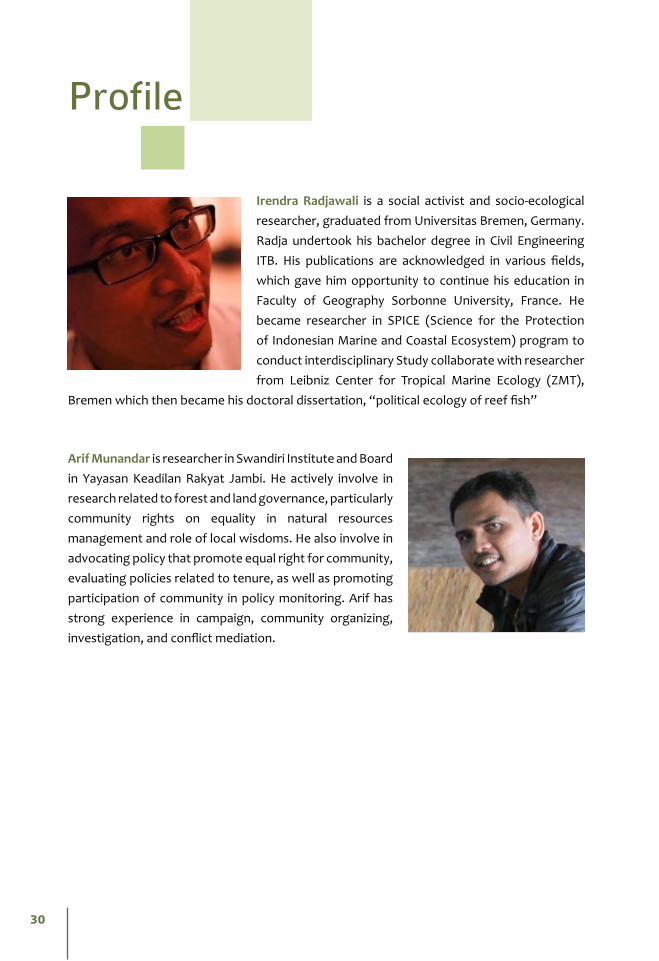
Irendra Radjawali is a social activist and socio-ecological researcher, graduated from Universitas Bremen, Germany. Radja undertook his bachelor degree in Civil Engineering ITB. His publications are acknowledged in various fields, which gave him opportunity to continue his education in Faculty of Geography Sorbonne University, France. He became researcher in SPICE (Science for the Protection of Indonesian Marine and Coastal Ecosystem) program to conduct interdisciplinary Study collaborate with researcher from Leibniz Center for Tropical Marine Ecology (ZMT),
Bremen which then became his doctoral dissertation, “political ecology of reef fish”
Arif Munandar is researcher in Swandiri Institute and Board in Yayasan Keadilan Rakyat Jambi. He actively involve in research related to forest and land governance, particularly community rights on equality in natural resources management and role of local wisdoms. He also involve in advocating policy that promote equal right for community, evaluating policies related to tenure, as well as promoting participation of community in policy monitoring. Arif has strong experience in campaign, community organizing, investigation, and conflict mediation.
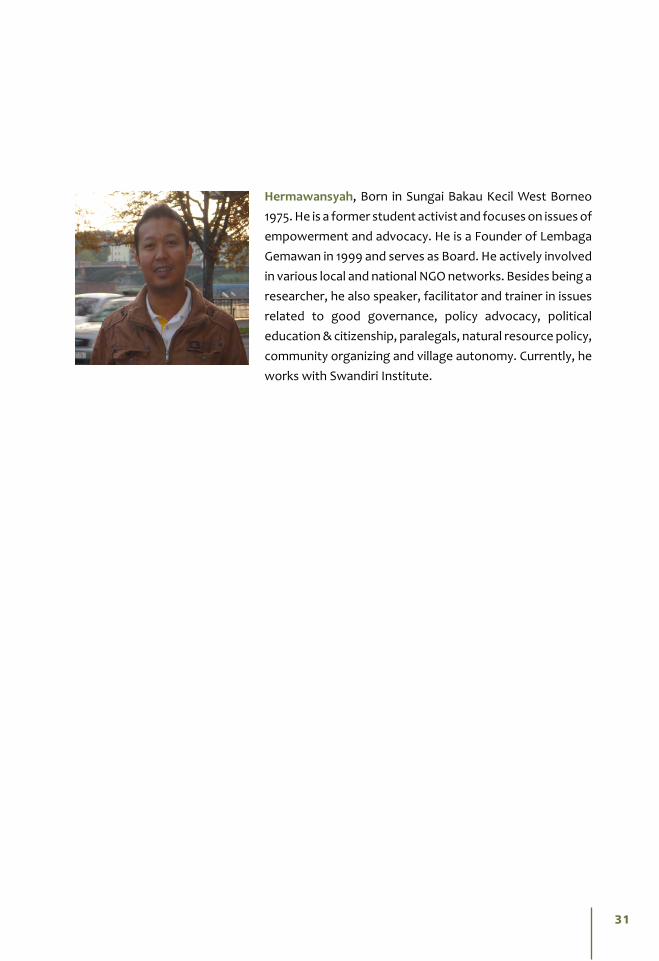
31
Hermawansyah, Born in Sungai Bakau Kecil West Borneo 1975. He is a former student activist and focuses on issues of empowerment and advocacy. He is a Founder of Lembaga Gemawan in 1999 and serves as Board. He actively involved in various local and national NGO networks. Besides being a researcher, he also speaker, facilitator and trainer in issues related to good governance, policy advocacy, political education & citizenship, paralegals, natural resource policy, community organizing and village autonomy. Currently, he works with Swandiri Institute.
PWYP Indonesia is a coalition of civil societies for transparency and accountability of extractive resources governance in Indonesia. PWYP Indonesia was established in 2007, legalised under Indonesia’s law in 2012 as Yayasan Transparansi Sumberdaya Ekstraktif , and affiliates to the network of PWYP global campaign. PWYP Indonesia
works in transparency and accountability along the chain of extractive resource, from development phase of contract and mining operation (publish why you pay and how
you extract), production phase and revenue from industries (publish what you pay), to the spending phase of revenue for sustainable development and social welfare (publish
what you earn and how you spent).
Website: www.pwyp-indonesia.orgEmail: [email protected] Fanpage: Publish What You Pay Indonesia Twitter: @PWYP_Indonesia