transporation in scm15
TRANSCRIPT
A SEMINAR ON
TRANSPORTATION IN SUPPLY CHAIN MANAGEMENT

14-2
Outline The role of transportation in the supply chain Factors affecting transportation decisions Modes of transportation and their performance
characteristics Design options for a transportation network Trade-offs in transportation design Tailored transportation Routing and scheduling in transportation Making transportation decisions in practice
14-3
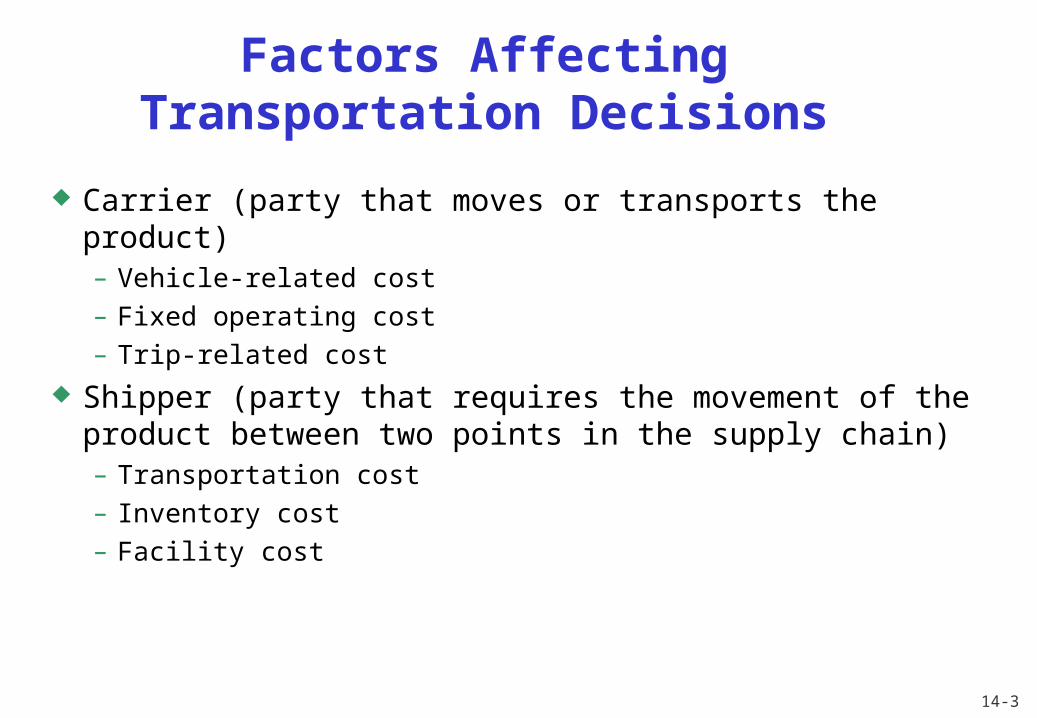
Factors AffectingTransportation Decisions
Carrier (party that moves or transports the product)– Vehicle-related cost– Fixed operating cost– Trip-related cost
Shipper (party that requires the movement of the product between two points in the supply chain)– Transportation cost– Inventory cost– Facility cost

14-4
Transportation Modes Trucks
– TL– LTL
Rail Air Package Carriers Water Pipeline
14-5
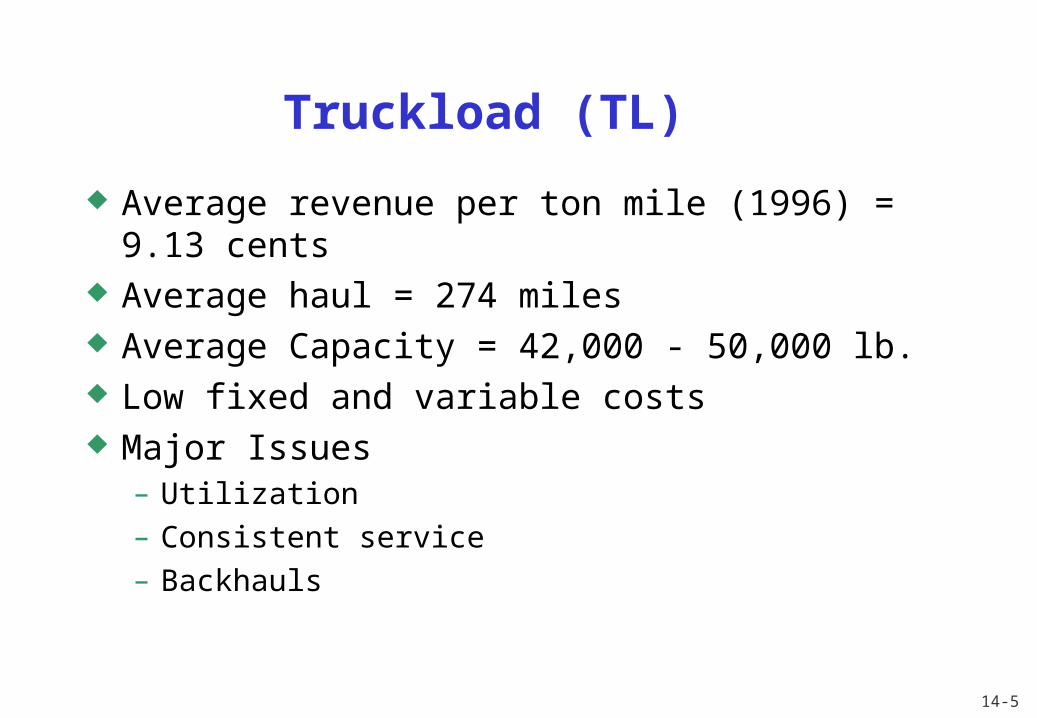
Truckload (TL) Average revenue per ton mile (1996) = 9.13 cents Average haul = 274 miles Average Capacity = 42,000 - 50,000 lb. Low fixed and variable costs Major Issues
– Utilization– Consistent service– Backhauls

14-6
Less Than Truckload (LTL) Average revenue per ton-mile (1996) = 25.08 cents Average haul = 646 miles Higher fixed costs (terminals) and low variable costs Major issues:
– Location of consolidation facilities– Utilization– Vehicle routing– Customer service

14-7
Rail Average revenue / ton-mile (1996) = 2.5 cents Average haul = 720 miles Average load = 80 tons Key issues:
– Scheduling to minimize delays / improve service– Off-track delays (at pickup and delivery end) – Yard operations– Variability of delivery times

14-8
Air Key issues:
– Location/number of hubs– Location of fleet bases/crew bases– Schedule optimization– Fleet assignment– Crew scheduling– Yield management

14-9
Package Carriers Companies like FedEx, UPS, USPS, that carry small packages
ranging from letters to shipments of about 150 pounds Expensive Rapid and reliable delivery Small and time-sensitive shipments Preferred mode for e-businesses (e.g., Amazon, Dell, McMaster-
Carr) Consolidation of shipments (especially important for package
carriers that use air as a primary method of transport)

14-10
Water Limited to certain geographic areas Ocean, inland waterway system, coastal waters Very large loads at very low cost Slowest Dominant in global trade (autos, grain, apparel, etc.)

14-11
Pipeline High fixed cost Primarily for crude petroleum, refined petroleum
products, natural gas Best for large and predictable demand Would be used for getting crude oil to a port or
refinery, but not for getting refined gasoline to a gasoline station (why?)

14-12
Intermodal Use of more than one mode of transportation to move a shipment to its
destination Most common example: rail/truck Also water/rail/truck or water/truck Grown considerably with increased use of containers Increased global trade has also increased use of intermodal
transportation More convenient for shippers (one entity provides the complete service) Key issue involves the exchange of information to facilitate transfer
between different transport modes

14-13
Design Options for aTransportation Network
What are the transportation options? Which one to select? On what basis?
Direct shipping network Direct shipping with milk runs All shipments via central DC Shipping via DC using milk runs Tailored network

14-14
Trade-offs in Transportation Design Transportation and inventory cost trade-off
– Choice of transportation mode– Inventory aggregation
Transportation cost and responsiveness trade-off
14-15
Choice of Transportation Mode A manager must account for inventory costs when
selecting a mode of transportation A mode with higher transportation costs can be justified
if it results in significantly lower inventories

14-16
Inventory Aggregation: Inventory vs. Transportation Cost
As a result of physical aggregation– Inventory costs decrease– Inbound transportation cost decreases– Outbound transportation cost increases
Inventory aggregation decreases supply chain costs if the product has a high value to weight ratio, high demand uncertainty, or customer orders are large
Inventory aggregation may increase supply chain costs if the product has a low value to weight ratio, low demand uncertainty, or customer orders are small

14-17
Trade-offs Between Transportation Cost and Customer Responsiveness
Temporal aggregation is the process of combining orders across time
Temporal aggregation reduces transportation cost because it results in larger shipments and reduces variation in shipment sizes
However, temporal aggregation reduces customer responsiveness
14-18
Tailored Transportation The use of different transportation networks and modes
based on customer and product characteristics Factors affecting tailoring:
– Customer distance and density– Customer size– Product demand and value
14-19
Role of IT in Transportation The complexity of transportation decisions demands to use
of IT systems IT software can assist in:
– Identification of optimal routes by minimizing costs subject to delivery constraints
– Optimal fleet utilization– GPS applications

14-20
Risk Management in Transportation
Three main risks to be considered in transportation are:– Risk that the shipment is delayed– Risk of disruptions– Risk of hazardous material
Risk mitigation strategies:– Decrease the probability of disruptions– Alternative routings– In case of hazardous materials the use of modified containers, low-
risk transportation models, modification of physical and chemical properties can prove to be effective

14-21
Making TransportationDecisions in Practice
Align transportation strategy with competitive strategy Consider both in-house and outsourced transportation Design a transportation network that can handle
e-commerce Use technology to improve transportation performance Design flexibility into the transportation network

14-22
Summary of Learning Objectives What is the role of transportation in a supply chain? What are the strengths and weaknesses of different
transport modes? What are the different network design options and what
are their strengths and weaknesses? What are the trade-offs in transportation network design?

CASE STUDY
14-23
The impact of supply chain reconfiguration on transports.The impact of supply chain reconfiguration on transports.
- - The Danish mechanical, electronic and medical industriesThe Danish mechanical, electronic and medical industries
Theoretical Approach
It was found
Many examples of companies reconfiguring their supply chains
Quite limited empirical evidence on the consequences of reconfiguration process on transport
due toTheoretical/empirical difficulties in determining cause-effect relationships between variables
Explanatory variables sensitive to individual logistical systems
Research objectives and methodology- Objectives
To illustrate the implications of reconfiguration supply chains on transport by using quantitative and qualitative data from Denmark
Focus on the future transport demands. Amount of transports and the total transport work

Supply chains under analysis
Three Danish supply chains:
Grain and feedstuff
Fresh-foods
Highly manufactured industrial goods

- Highly manufactured goods
No clear signs towards a reduction in the supplier base. Only carrier base has been dimished
Number of production facilities and warehouses do not show signs of modifications
Among those companies reporting and expecting changes: a trend towards a growth in the number of suppliers, production and warehouse facilities outside Europe
Direct distribution New customers requirements

- Qualitative data
An in-depth study
Goal: To achieve a better understanding of supply chain reconfiguration and firm’s transport patterns
The firm was just at the beginning of SC redesign, facilitating the analysis of the impact “old” and “new” logistics trends can have on the demand of transports

- Supplier base
Supplier baseSupplier base
The number of suppliers has been quite stable
The firm has launched a project to reduce the amount of suppliers
Production: Production:
Expansion of production capacity outside of Europe during the last five years.
No further changes are expected in the near future
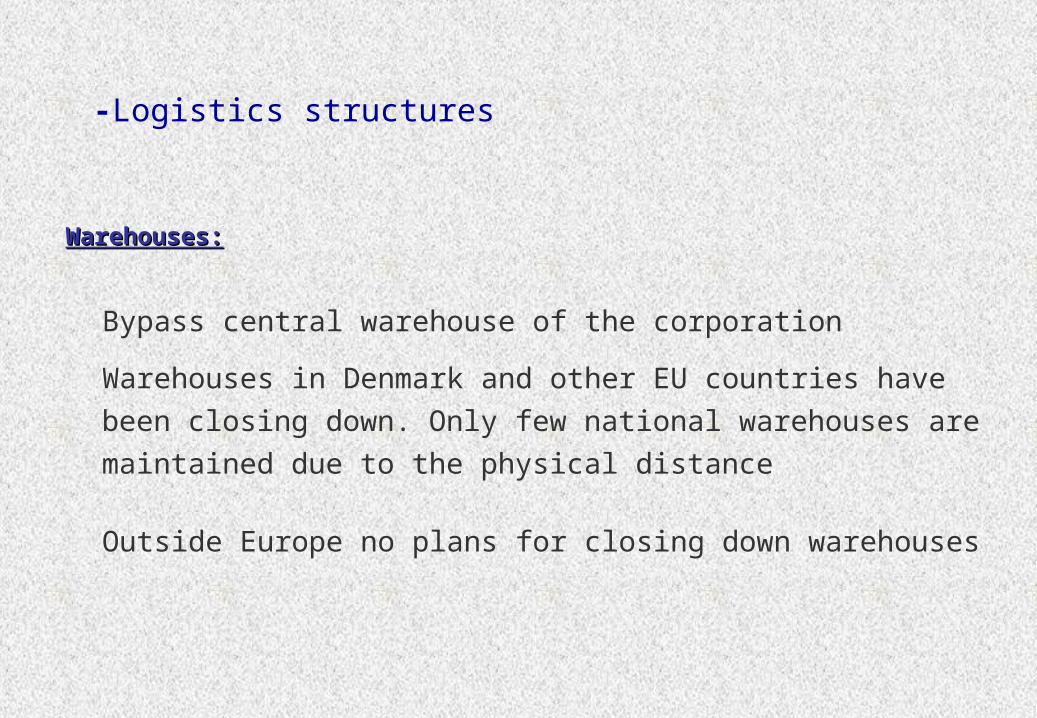
Warehouses:Warehouses:
Bypass central warehouse of the corporationWarehouses in Denmark and other EU countries have been closing down. Only few national warehouses are maintained due to the physical distance
Outside Europe no plans for closing down warehouses
-Logistics structures

Customers
Denmark Other countries
Europe
Production facilities
Suppliers/ clients
Production facilitiesin Denmark
Own warehouses
Distributors, wholesalers, agents
Transport firmshubs
Denmark Other countriesEurope
Changes in Distribution patterns
Customers
Denmark Other countries
Europe
Production facilities
Future development: Direct distribution to customers in Europe
Suppliers/ clients
Production facilitiesin Denmark
Own warehouses
Distributors, wholesalers, agents
Transport firmshubs
Denmark Other countriesEurope

Amount of goods produced
Market andlogistic strategies of the firm
Quantity of tons transported
Destination of the products
Traveled distance
Amount of lorries/trips traveling between the nodes
Total nodes in the chain
Frequency of transport/trips
- Freight transport activity

Status-quo scenarioIn the status quo scenario the amount of trucks/trips is anticipated to grow linear
0
5000
10000
15000
20000
25000
1 2 3 4 5 6
Year
Amou
nt o
f tru
cks/
trip
s
Amount of tonnes
3,640
9,057
6,700 trucks
Firms’s logisticsstrategies scenario
In the scenario with firm’s logistics strategiesthe number of transports is anticipated to grow exponentiallyMain reason:
New distribution strategies
Two scenarios were developed:
No. 1. Status quo. No reconfiguration
No. 2. Firm’s new logistics strategies

-100%
0%
100%
200%
300%
2001 2006 2006
DenmarkOther European countriesRest of the world
Status-quo scenario
Firm’s logistics strategies
Ton-
km –
Dev
elop
men
t in
perc
ent
Elimination of warehouses in Denmark and Europe implies erradication of a node in the chain.
Reduction in the national transport work.

Conclusions
Production, location, distribution and marketing decisions have a tremendous impact on the transport content of the supply chains.
There is no clear-cut cause-effect relationship between supply chain reconfiguration, and demand for transport. The demand for transport is influenced not only by company specific logistic and marketing strategies, but also by characteristics of the products and supply chains involved – e.g. fresh food vs. highly manufactured goods.
Transport demands also depend on how transport is organized, and how capable the global carriers are of consolidating and utilizing the capacities of their transport equipment
Conclusions
Logistics and supply chain managers decisions can help to
Slow down or boost the rate of tonne-km, the amount of vehicles/trips used
And
The impact of transport on the environment

THANK You!!