transport and communications - financefinance.gov.pk/survey/chapters/14-transport final08.pdf ·...
TRANSCRIPT

223
Chapter 14
TRANSPORT AND COMMUNICATIONS
Infrastructure is both a cause and a consequence of economic growth. The role of infrastructure in integrating countries into the global economy by providing transport and telecommunication services is well known. Infrastructure can also raise the quality of human capital, which is a key factor in achieving high and sustainable levels of growth. Improvements in the quality and quantity of infrastructure have a disproportionately positive impact on the poor, and thus play a vital role in reducing income inequality.
A well performing Transport and communication structure is vital for a country’s development. Investment in a country’s infrastructure directly affects economic growth as producers find the best markets for their goods, reducing transportation time and cost, and generating employment opportunities.
Pakistan, with 161 million people, has a reasonably developed transport infrastructure. The country generates a total domestic transport load of around 239 billion passenger kilometers and 153 billion tonne kilometers annually. The growth in demand for transportation services is considerably higher than the growth in GDP. Road transport is the backbone of Pakistan's transport system. The 9,574 km long National Highway and Motorway network - which is 3.65 percent of the total road network - carries 80 percent of Pakistan's total traffic. Over the past ten years, road traffic – both passenger and freight - has grown significantly faster than the national economy. Currently, it is accounting for 91 percent of national passenger traffic and 96 percent of freight. However, neglect of other modes of transportation in favor of improvement
of the road infrastructure has been a prevalent problem in the country’s transportation sector. Recent initiatives and developments in sectors such as shipping, railways, and aviation are a welcomed step towards mending this bias.
Port traffic in Pakistan has been growing at 8 percent annually in recent years. Two major ports, Karachi Port and Port Qasim, handle 95 percent of all international trade. Gwadar Port, which was inaugurated in March 2007 and is being operated by Singapore Port Authority, is aiming to develop into a central energy port in the region. In addition, 14 dry ports cater to high value external trade.
Pakistan Railways (PR) has a broad gauge system (with a small network of meter gauge in the South East). The network consists of the main North – South corridor, connecting the Karachi ports to the primary production and population centers in Pakistan. The track is in good condition with an axle-load of 23 tons and maximum permitted speeds of 100/110 Kilometers per hour.
There are 36 operational airports. Karachi is Pakistan's main airport but significant levels of both domestic and international cargo are also handled at Islamabad and Lahore. Pakistan International Airlines (PIA), the major public sector airline, though facing the competition from a few private airlines, carries approximately 70 percent of domestic passengers and almost all domestic freight traffic.
The transport and communications sector accounts for about 10.0 percent of the country’s GDP, and 22.0 percent of Gross Fixed Capital Formation in
Pakistan Economic Survey 2007-08
224
FY07/08. It provides over 2.3 million jobs in the country (6% of all employment) and receives 12 to 15 percent of funds from the annual Federal Public Sector Development Program (PSDP). Apart from being a significantly large source of budgetary expenditure, the transportation sector imposes huge demand on Pakistan’s energy supply, absorbing approximately 35% of total energy annually.
Infrastructure development has been a priority area for Pakistan as evident from a number of projects completed or in progress. In the long term, the transport system is likely to experience tremendous improvement with the implementation of the National Trade Corridor (NTC) program.
The telecommunication sector of Pakistan witnessed a robust growth over the last few years with its share in total GDP increasing every year. Teledensity of the country has crossed 57% which has placed Pakistan’s telecom sector among those of the rising East Asian economies.
I. TRANSPORT
Pakistan’s transportation network, albeit not as modern and efficient as that of developed countries, is considerably more efficient than it was a decade ago. Users of the network have a wider range of modes to choose from. Pakistan Railway is still the only enterprise providing rail service in the country, but the Airline industry has greatly benefited from the competition provided by private sector players such as Air Blue, Shaheen Air and Aero Asia. The road network has been expanding constantly. New motorways and expressways made throughout the country have significantly reduced the time it takes for goods and people to reach their destinations. The successes of service providers such as Daewoo have provided consumers with benefits of choice and affordability. New initiatives like the establishment of Gwadar Port and the construction and upgradation of new airports around the country and a further expansion of the highway network hold promises of a brighter future.
While visible progress has been made in the transportation sector, key issues and challenges
remain. A comprehensive and holistic National Transportation Policy that covers all modes of transportation for both Urban and Rural transport is yet to be implemented. Urban traffic congestion, lack of quality public transport, environmental pollution and other negative spill-overs from the transportation sector, along with safety (especially road safety) are all matters that need to be addressed if Pakistan’s transportation is expected to perform efficiently and provide the benefits of a modern, well functioning and fully equipped transportation network.
i. Road Transport
Pakistan’s transport system is primarily dependent on road transport, which makes up 90 percent of national passenger traffic and around 96 percent of freight movement. Over the past several years, road traffic – both passenger and freight – has grown much faster than the country’s overall economic growth. The National Highway and Motorway network, which stretches an impressive 10,849 km, contributes 4.2 percent of the total road network and carries 90 percent of Pakistan’s total traffic.
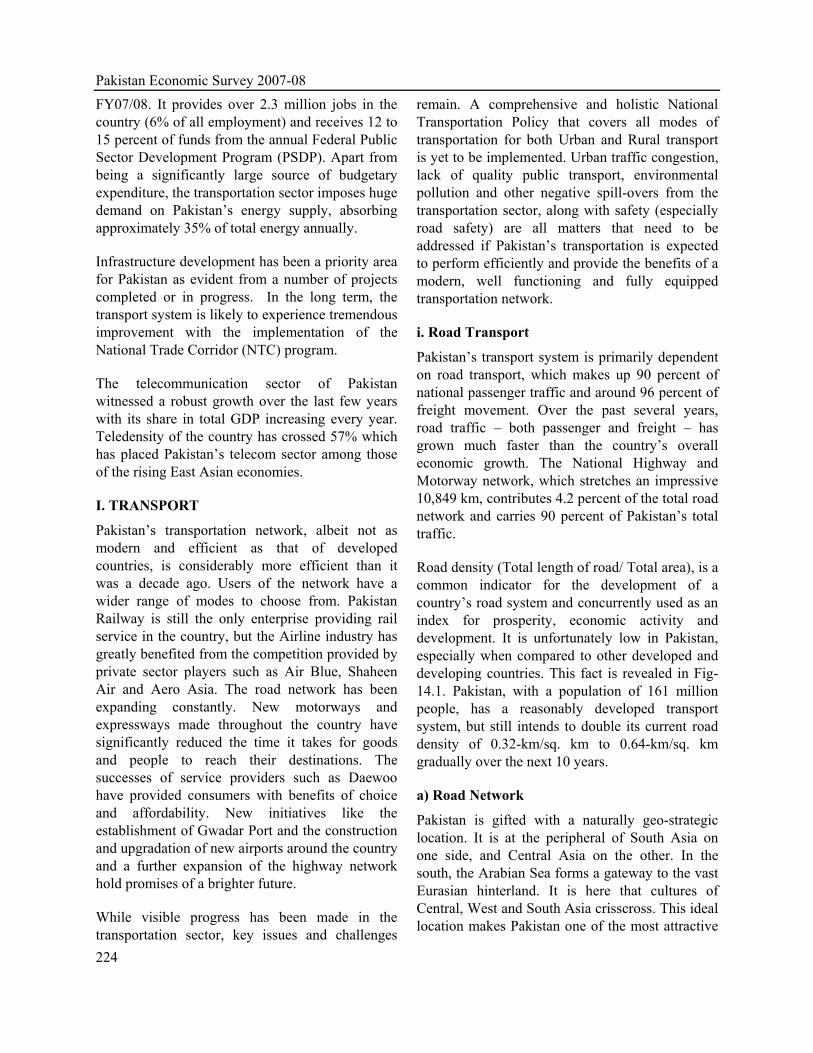
Road density (Total length of road/ Total area), is a common indicator for the development of a country’s road system and concurrently used as an index for prosperity, economic activity and development. It is unfortunately low in Pakistan, especially when compared to other developed and developing countries. This fact is revealed in Fig-14.1. Pakistan, with a population of 161 million people, has a reasonably developed transport system, but still intends to double its current road density of 0.32-km/sq. km to 0.64-km/sq. km gradually over the next 10 years.
a) Road Network
Pakistan is gifted with a naturally geo-strategic location. It is at the peripheral of South Asia on one side, and Central Asia on the other. In the south, the Arabian Sea forms a gateway to the vast Eurasian hinterland. It is here that cultures of Central, West and South Asia crisscross. This ideal location makes Pakistan one of the most attractive

Transport and Communications
225
and shortest routes for transit to the Central Asian Republics (CARs). Indian trade to that region, in an economical/convenient manner, is also dependent on the availability of passage through Pakistan. The rapid development of Asian
economies in the recent past has also necessitated the establishment/effectiveness of operations regarding the transcontinental transport links, warranting the development of land transport corridors to facilitate trade flows.
This fact has been recognized by the United Nations Economic & Social Commission for Asia & Pacific (UNESCAP) by designating different routes passing through various Asian countries as the Asian Highway Network (AHN). A number of inter-provincial national highways of Pakistan are a component of AHN.
Pakistan’s road network is vital for the movement of people and goods and plays an important role in integrating the country, facilitating economic growth and reducing poverty. The total road network is about 260,000 km of which around 60% is paved. Road density is 0.32 km/km2 which is low and compares unfavorably with other South Asian countries (Bangladesh-1.7 km/km2, Sri Lanka-1.5 km/km2 and India-1.0 km/km2). The Government intends to generate/ mobilize all possible resources to double road density to 0.64 km/km2. Total roads, which were 229,595 KM in 1996-97, increased to 264,853 KM by 2007-08 ― an increase of 15.4 percent. During the out-going fiscal year, the length of the high typed road network increased by 3.2 percent but the length of the low type road network declined by 2.8 percent. Extent of high type roads have increased by 41.5
percent since 1996-97. A sizable and continuous improvement of the high type road network can be observed from 2001 to 2007, where the network grew at an average rate of above 3 percent. The continuous improvement and rehabilitation of the existing roads reflects the government’s enhanced focus on infrastructure. As a result of an emphasis on high type roads, many low typed roads were converted to high typed roads during this period. There are many ways by which availability of improved and wide spread modern road networks can facilitate economic activity. For example, they could help alleviate poverty by providing access to far flung rural areas, create more jobs by supporting economic activity along the network and provide numerous small-scale investment opportunities. In addition, introduction of Khushal Pakistan Programme, has helped to rehabilitate and modernise rural road network along with implementation of wide ranging development activities through various district governments under the devolution programme. The annual growth of roads in Pakistan between 1996-97 and 2007-08 is given in Table-14.1 and Fig-14.2
Fig-14.1 Road Density Comparisons
0
0.5
1
1.5
2
2.5
3
3.5
Japan
France
Hungary
UK Italy
India
USA
Spain
Malaysia
Pakistan
Brazil
Indonesia
China
Argentina
Source: National Highway Authority
Roa
d Le
ngth
/ Sq
. Km
of A
rea

Pakistan Economic Survey 2007-08
226
Table 14.1: Length of Roads (Kilometres)Fiscal Year High Type Low Type # Total
Length %Change Length %Change Length % Change 1996-97 126,117 6.5 103,478 3.6 229,595 5.2 1997-98 133,462 5.8 107,423 3.8 240,885 4.9 1998-99 137,352 2.9 110,132 2.5 247,484 2.7 1999-2000 138,200 0.6 110,140 0 248,340 0.3 2000-01 144,652 4.7 105,320 -4.4 249,972 0.7 2001-02 148,877 2.9 102,784 -2.4 251,661 0.7 2002-03 153,225 2.9 98,943 -3.7 252,168 0.2 2003-04 158,543 3.5 97,527 -1.4 256,070 1.5 2004-05 162,841 2.7 95,373 -2.2 258,214 0.8 2005-06 167,530 2.9 91,491 -4.1 259,021 0.3 2006-07 172,891 3.2 88,930 -5.6 261,821 0.1 2007-08 178,423 3.2 86,430 -2.8 264,853 1.2 * Estimated Source: Ministry of Communications # : The percentage change in low type roads can be negative as many of these roads are being converted to high type roads.
b) National Highway Authority (NHA)
The responsibility for development, operation, maintenance and preservation of the national highway network has been assigned to the National Highway Authority. Its objective is to secure the delivery of an efficient, reliable, safe and environment-friendly national highway network with a view to improving the quality of life in Pakistan.
The Authority plays a major role in all-weather reliability, reduced transportation costs and increased access to markets for local produce and products, access to new employment centres,
employment of local workers on various projects, better access to health care and other social services, as well as strengthening of local economies.
The NHA is currently the custodian of nearly all of Pakistan's major inter-provincial road links called the national highways, including the motorways and strategic roads. This network represents the main transport corridors linking ports to population centers and providing linkages to Afghanistan, the Central Asian Republics, China, Iran and India. These roads comprise of only around 4 percent of Pakistan's total road network but carry 80 percent
Fig-14.2: Length of Roads
50000
70000
9000011
0000
130000
150000
170000
190000
1996-
97
1997-
98
1998-
99
1999-
2000
2000-
01
2001-
02
2002-
03
2003-
04
2004-
05
2005-
06
2006-
07
2007-
08
Kilo
met
ers
High Type Road Low Type Road

Transport and Communications
227
of the country’s commercial traffic. Consequently, the network is under pressure and its importance from a development perspective cannot be over emphasized. The province wise breakup of NHA network is given in Table.14.2.
Table:14.2 Province Wise Break-up Province Km % Share Punjab 2659 23.16 Sindh 1604 13.96 NWFP 1651 14.38 Balochistan 4629 40.30 NA/AJK 942 08.20 Total 11485 100%
Source: NHA The total NHA network of 11,485 km primarily consists of “low capacity” roads. About 75 percent are 2-lane (6.1m single carriageway), 20 percent are 4-lane divided highways (7.3m dual carriageways) and only 5 percent 6-lane highways (11m dual carriageways). Approximately 25 percent (or 2500 km) of the NHA network is in need of rehabilitation. This results in very low number of travel trips, slow speeds and an un-safe driving environment. Commercial traffic running speeds are between 35-45 kph, and average trip speeds are around 25kph; 1/3rd of the average trip speeds in developed countries.
The present highway network is under strain because of rising traffic flow and a slow pace of increase in capacity. Consolidation, preservation and improvement of the existing highways are needed on an urgent basis. A Gradual extension of the network is also equally important to develop remote areas and to better connect major economic and social centers of Pakistan. The details of some selected major projects for the next five years are shown in Table.14.3.
Operation & Maintenance: The NHA is giving special emphasis to the preservation of the existing highway infrastructure and on highway safety. Its endeavors to operate and maintain the network in a safe condition at an optimum cost while ensuring user satisfaction is limited by immense traffic and insufficient resources to meet the growing needs of the sector. Since O&M activities are dependent on toll, special attention is being accorded to enhance the efficiency of tolling systems and revenue
management through installation of Electronic Toll and Traffic Management Systems (ETTMS) under a phased program. Under the Annual Maintenance Plan 2007-08, NHA incurred an expenditure of Rs 5951 million for operation & maintenance of 9098 km of its network. The breakdown of this expenditure is given below:
Description Km Rs in Millions Rehabilitation 114 1417
Structural Overlay 287 1638 Functional Overlay 514 1676
Routine Maintenance 8183 810 Highway Safety N/A 410
Total 9098 5951 Providing adequate capacity is one of the key aims of the NHA presently. Pakistan’s primary traffic movements are concentrated along the Karachi-Lahore-Islamabad-Peshawar links which serves domestic needs. This also links Punjab and the northern parts of the country with ports and commercial hubs in the south. The main artery along this corridor is the 1819 km long N-5 which serves 80% of Pakistan’s urban population and carries over 65% of intercity traffic. The other main corridor is the Indus Highway (N-55). N-5 is an access-free, 4-lane divided facility with a capacity of 66,000 Passenger Car Units (PCUs). The current traffic volumes range from 7,000 to 40,000 vehicles per day which is 35% to 93% of existing capacity. Presently, 50% length of N-5 is in poor condition. Karachi - Lahore (1260 km) travel time is 48 hours and Karachi - Peshawar (1700 km) is 72 hours. Moreover, the average commercial operating speed is only 23 to 26 kph. The Government’s goal of sustaining 7-8% economic growth would double traffic demand by 2017 but the N-5 will not be able to support this projected transport demand.
The NHA’s portfolio cost is Rs 705.48 billion with a “throw-forward” of Rs 570.84 billion. The ratio of throw-forward to annual allocation is 31, meaning that at current funding level of Rs 29 billion; approximately three years are needed to complete the ongoing portfolio. Due to limited fiscal space and an increase in yearly allocation being rather unlikely, NHA is looking towards new and innovative methods of financing. A new
Pakistan Economic Survey 2007-08
228
business plan is currently under finalization for approval by the Government.
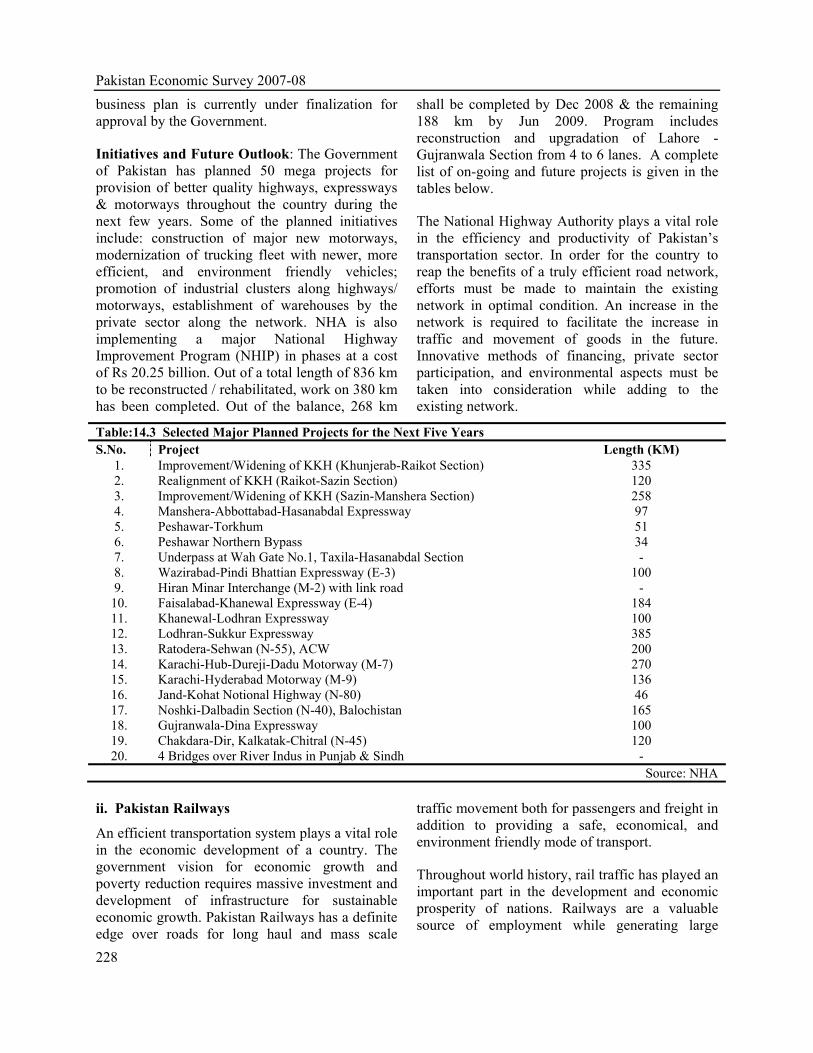
Initiatives and Future Outlook: The Government of Pakistan has planned 50 mega projects for provision of better quality highways, expressways & motorways throughout the country during the next few years. Some of the planned initiatives include: construction of major new motorways, modernization of trucking fleet with newer, more efficient, and environment friendly vehicles; promotion of industrial clusters along highways/ motorways, establishment of warehouses by the private sector along the network. NHA is also implementing a major National Highway Improvement Program (NHIP) in phases at a cost of Rs 20.25 billion. Out of a total length of 836 km to be reconstructed / rehabilitated, work on 380 km has been completed. Out of the balance, 268 km
shall be completed by Dec 2008 & the remaining 188 km by Jun 2009. Program includes reconstruction and upgradation of Lahore - Gujranwala Section from 4 to 6 lanes. A complete list of on-going and future projects is given in the tables below.
The National Highway Authority plays a vital role in the efficiency and productivity of Pakistan’s transportation sector. In order for the country to reap the benefits of a truly efficient road network, efforts must be made to maintain the existing network in optimal condition. An increase in the network is required to facilitate the increase in traffic and movement of goods in the future. Innovative methods of financing, private sector participation, and environmental aspects must be taken into consideration while adding to the existing network.
Table:14.3 Selected Major Planned Projects for the Next Five Years S.No. Project Length (KM)
1. Improvement/Widening of KKH (Khunjerab-Raikot Section) 335 2. Realignment of KKH (Raikot-Sazin Section) 120 3. Improvement/Widening of KKH (Sazin-Manshera Section) 258 4. Manshera-Abbottabad-Hasanabdal Expressway 97 5. Peshawar-Torkhum 51 6. Peshawar Northern Bypass 34 7. Underpass at Wah Gate No.1, Taxila-Hasanabdal Section - 8. Wazirabad-Pindi Bhattian Expressway (E-3) 100 9. Hiran Minar Interchange (M-2) with link road - 10. Faisalabad-Khanewal Expressway (E-4) 184 11. Khanewal-Lodhran Expressway 100 12. Lodhran-Sukkur Expressway 385 13. Ratodera-Sehwan (N-55), ACW 200 14. Karachi-Hub-Dureji-Dadu Motorway (M-7) 270 15. Karachi-Hyderabad Motorway (M-9) 136 16. Jand-Kohat Notional Highway (N-80) 46 17. Noshki-Dalbadin Section (N-40), Balochistan 165 18. Gujranwala-Dina Expressway 100 19. Chakdara-Dir, Kalkatak-Chitral (N-45) 120 20. 4 Bridges over River Indus in Punjab & Sindh -
Source: NHA ii. Pakistan Railways
An efficient transportation system plays a vital role in the economic development of a country. The government vision for economic growth and poverty reduction requires massive investment and development of infrastructure for sustainable economic growth. Pakistan Railways has a definite edge over roads for long haul and mass scale
traffic movement both for passengers and freight in addition to providing a safe, economical, and environment friendly mode of transport.
Throughout world history, rail traffic has played an important part in the development and economic prosperity of nations. Railways are a valuable source of employment while generating large

Transport and Communications
229
amounts of revenue to the benefit of the economy. An effective railway system facilitates commerce and trade, reduces transportation costs (monetary and non-monetary), and promotes rural development and national integration while reducing the burden on commuters. Pakistan Railways was the primary mode of transportation in the country till the seventies. However, owing primarily to a diversion of already scarce resources towards the expansion of the road network, the performance and condition of Pakistan Railway declined and it’s share of inland traffic reduced from 41 percent to 10 percent for passenger and 73 percent to 4 percent for freight traffic.
During the last seven years (2000-2007), Pakistan Railways has shown improving trend in both passenger and freight traffic, registering an average increase of 5.2 percent and 5.8 percent per annum, respectively. A reduction in passenger traffic has been seen for this year with a negative growth rate of -12.5 percent whereas freight traffic has grown by 18 percent over the same period last year. The
positive growth trend for the past seven consecutive years can be attributed to the wide range of improvements made by the Pakistan Railways through completion of a number of development projects and better policies aimed at modernization of PR. The fall in growth rates for passenger traffic this year can be attributed to the chaos, political strife, and rioting that the year 2007-08 has seen. Many parts of the railway track have been destroyed with immense damage being caused to the property of Pakistan Railways. The service remained closed for a substantial amount of time following the violence witnessed in the country in December 2007 after the assassination of one of its political leaders. Some estimates put the loss suffered by Pakistan Railways at the expense of this year’s disturbance at Rs 10 billion.
Pakistan Railways has introduced 9 new train services in order to facilitate passengers as well as freight customers. (See Table.14.5). PR has also improved the quality of its services, timeliness and cleanliness. This trend is reported in Table.14.4.
Table 14.4 Trend of Passengers Traffic and Freight Traffic (Road vs Rail)
Fiscal Year Passenger Traffic (Million passenger Km) Freight (Million Ton KM) Road %Change Rail %Change Road %Change Rail %Change
1996-97 163,751 5.9 19,114 1.1 84,345 5.6 4,607 -9.3 1997-98 173,857 6.2 18,774 -1.8 89,527 6.1 4,447 -3.5 1998-99 185,236 6.5 18,980 1.1 95,246 6.4 3,967 -10.8 1999-00 196,692 6.2 18,495 -2.6 101,261 6.3 3,753 -5.4 2000-01 208,370 5.9 19,590 5.9 107,085 5.7 4,520 20.4 2001-02 209,381 0.5 20,783 6.1 108,818 0.2 4,573 1.2 2002-03 215,872 3.1 22,306 7.3 110,172 1.2 4,820 5.4 2003-04 222,779 3.2 23,045 3.3 114,244 3.7 5,336 10.7 2004-05 232,191 4.2 24,238 5.2 116,327 1.8 5,532 3.6 2005-06 238,077 2.5 25,621 5.7 117,035 0.6 5,916 6.9 2006-07
26,446 3.2
5,453 -7.8
Jul-Mar 2006-07 2007-08*
191,057 --
--
20,921 18,296
-12.5
88,032 ----
--
3,786 4,488
18.5 * Estimated Source: Ministry of Railways & Ministry of Communications In order to continue improvements and to consolidate reforms, Pakistan Railways has prepared a business plan for 2005-11. The plan places emphasis on encouraging private sector participation in order to increase its competitiveness, responsiveness and efficiency. Pakistan Railway is planning to take a series of interlinked initiatives, which will enable it to
compete efficiently in the fast growing transport sector in Pakistan.
Pakistan has awarded a contract to an international consortium to carry out a feasibility study for establishing a rail link with China. A rail link could further boost trade relations between the two countries by facilitating the already growing trade with China and operations of Gwadar Sea Port.

Pakistan Economic Survey 2007-08
230
The PDSP allocations for the Railway sector were increased from Rs 3. billion during 2000-01 to Rs 11.642 billion in 2007-08. Major development schemes include track renewal of 240 KM of rails and 220 KMs of sleepers planned for main line from Karachi- Khanpur. Additionally, 20 units of locomotives in CKD condition received from China will be manufactured at the Pakistan Locomotive Factory in Risalpur. This will complete the scheme for Procurement. Manufacture of 69 DE locomotives. The scheme for recomissioning of 55 DE locomotives will be completed in the year 2007-08 as well. 655 CKD wagons received from China will be manufactured at Pakistan Railway Workshop in Moghalpura thus completing the scheme for Procurement/Manufacture of 1300 high capacity wagons. Rehabilitation of 400 old coaches is underway with 130 coaches expected to be rehabilitated in this fiscal year. Another on-going development project is the next phase in the doubling of tracks from Khanewal- Lahore (246 KM).
In addition to these development projects, the following feasibility studies have also been sanctioned to explore future prospects and initiatives:
• High Speed Double Track between Lahore and Rawalpindi.
• Rail link from Havelian to Pak-China Border.
• Doubling of track and realignment between Shahdara-Rawalpindi.
• Doubling and Realignment of track between Golra Sharif-Peshawar.
The earning of Pakistan Railways since 1998-99 are given in Table.14.6.
Table-14.6 : Earnings of Pakistan Railways (Rs. Million)
Year Earnings % Change 1998-99 9,310 -- 1999-2000 9,889 6.2 2000-01 11,938 20.7 2001-02 13,046 9.3 2002-03 14,812 13.5 2003-04 14,636 -1.2 2004-05 18,027 23.2 2005-06 18,184 0.9 2006-07 July-Mar
19,194 5.5
2007-08 13,954 Source: Ministry of Railways
iii) Civil Aviation Authority (CAA)
Civil aviation plays an important role in the development of a country’s economy by providing fast and efficient access between different parts of the country as well as different destinations around the world. Private participation on this front has been encouraged through concessions and incentives for development of airports and airlines to increase the availability of air transport services both domestically and internationally. It is important to construct and maintain airports in the country to facilitate economic activity in an increasingly globalized world. The construction of the new Islamabad international airport (NIIA) is expected to play a major role in the national
Table: 14.5 New Trains S.No Trains Section Date of Commencement
i) Thar Express Karachi-Zero Point 18-02-2006 ii) Margala Express Lahore-Rawalpindi 22-05-2006 iii) Marvi Express Mirpurkhas-Khokhropar 07-06-2006 iv) Sindh Express Lahore-Karachi 24-07-2006 v) Buraq Express Rawalpindi-Karachi 14-08-2006 vi) Peshawar Express Peshawar-Rawalpindi 15-12-2006 vii) Pakistan Express Rawalpindi-Karachi
(Via Hafizabad, Faisalabad And Multan) 16-12-2006 viii) Jinnah Express Karachi-Rawalpindi. 08-01-2007 ix) Sir Syed Express Rawalpindi-Karachi 08-03-2007
Source: M/O Railways

Transport and Communications
231
aviation sector. The airport will be developed by the Civil Aviation Authority (CAA) on a self-finance basis with an estimated cost of Rs. 30 billion on 3200 acres of land, and is expected to be completed by December 2010. The project has been designed with all the essential facilities to handle an annual traffic of 9 million passengers as well as 100,000 metric tons of cargo.
To supplement the growth and development of Balochistan, the CAA is going to construct the New Gwadar International Airport (NGIA) through the Public Sector Development Programme (PSDP), at a total estimated cost of Rs. 3.6 billion. The airport will be developed as a major hub for all aviation activities in the region, and it is expected to be completed by November 2010. The upgrading of Multan and Peshawar International Airports have also been initiated with estimated costs of Rs. 2.6 billion and Rs. 0.6 billion respectively.
a) Pakistan International Airlines (PIA)
The year 2007 turned out to be an exceptionally difficult year for PIA. The Airline experienced a series of financial, operational and marketing problems during the past year that severely hampered its performance. In the early part of the year, an operating restriction was placed on PIA flights by the European Union. Apart from providing a negative image for the Corporation, this translated to a loss in market share as well as growth in business which made the situation exceptionally difficult. An unprecedented increase in oil prices adversely impacted PIA’s bottom line and neutralized recovery efforts. Attempts were made to contain the impact of a rising fuel bill by reducing the utilization of older and fuel in-efficient planes. The airline was also mired by increases in pay to certain categories of personnel and a depreciation of the Rupee against the Dollar.
Ever increasing competition and entry of new operators in certain key markets reduced the level of traffic for PIA. Yields were increased despite the added competition but revenues remained static for the year. The financial position of the company remains under strain as financial costs increased by almost 50 percent, negating a reduction in operating expenses of Rs 2.6 billion.
The restrictions imposed by the EU were lifted near the end of 2007 as PIA was able to satisfactorily address the issues highlighted by the Air Safety Committee. A route rationalization plan was implemented whereby services to some non-performing sectors were discontinued while capacity on other routes were realigned with available traffic. These and various cost reducing measures taken by the management did not result in profits for the airline, but was effective in reducing the magnitude of the losses suffered.
Despite these financial difficulties, the airline remained on track on its fleet modernization plan and by December 2007, the average age of PIA;s fleet was reduced to 13 years.
The total international passenger traffic to and from Pakistan increased by 5.7 percent over the last year, but due to EU restrictions on PIA flights and the damage to its image, PIA’s international passengers declined by 4.2 percent. Thus against an international market share of 48 percent in 2006, PIA’s market share dropped to 43.5 percent. In the domestic market, despite an overall traffic decline of 6.4percent, PIA was able to retain its market share at 69.4 percent. On a system-wide basis, PIA’s market share was 51.2 percent against 54.9 percent last year. In terms of capacity utilization, the System Passenger Seat Factor (excluding Haj) was 69 percent against 70 percent last year while with the Haj inclusion, the System Seat Factor was 67.4 percent against 68.5 percent last year. Though the airline faced shortfall in ASKs (Available Seat kilometres) by 8 percent in 2007 as against 2006, it registered an increase of Rs 1.1 billion in passenger revenue as compared to 2006. PIA’s cargo traffic in terms of RFTKs (Revenue Freight Tonne Kilometers) was significantly down by 17.9% over last year
Pakistan International Airlines’ revenue passengers carried for the year 2007 was 5.415 million as compared to 5.732 million passengers in the same period of last year, showing a decline of 5.5 percent. The airline’s revenue was Rs. 70,480.73 million in 2007 as against Rs. 70,587.15 million generated in the corresponding period of 2006, registering a marginal decrease of 0.2 percent. During 2007, cargo traffic was 350.76 million

Pakistan Economic Survey 2007-08
232
Revenue Freight Tonne Kilometre (RFTKS) as against 427.01 RFTKS in the same period last year thus registering a decline of 17.9 percent. The unprecedented hike in oil prices over the course of the year adversely impacted PIA’s bottom line and neutralized the efforts for recovery. PIA, however, made efforts for containing the fuel bill by reducing utilization of older fuel-inefficient fleet. The total number of aircrafts in PIA’s fleet to stood at 42.
iv) Ports & Shipping
a) Karachi Port Trust (KPT)
The steady and continuous progress made by KPT has helped boost the national economy over the
years with international trade ever-increasing in a globalized world. The KPT had an annual cargo handling size of 30.8 million tons during 2006-07, showing a slight decrease of 4.4 percent over last years record cargo handling of 32.3 million tons. However, there has been a rise in activity during the first seven months of the current fiscal year, showing remarkable increase in all types of cargo handling including bulk, Break bulk and containers. Figures show that during the first seven months of the current fiscal year, already 20.5 million tonnes of cargo has been handled. Statistics of cargo handled during the last ten years are given in Table 14.7
Table 14.7 : Cargo Handled at Karachi Port (000 Ton) Year Imports %Change Exports %Change Total % Change 1996-97 18,362 -1.9 5,113 5.2 23,457 -0.4 1997-98 17,114 -6.8 5,570 8.9 22,684 -3.4 1998-99 18,318 7 5,735 3 24,053 6 1999-2000 17,149 -0.9 5,613 -2.1 23,762 -1.2 2000-01 20,064 10.5 5,918 5.4 25,98 9.3 2001-02 20,330 1.3 6,362 7.5 26,692 2.7 2002-03 19,609 -3.5 6,273 -1.4 25,852 -3.1 2003-04 21,732 10.8 6,081 -3.1 27,813 7.6 2004-05 22,100 1.7 6,515 7.1 28,615 2.9 2005-06 25,573 15.7 6,697 2.8 32,270 12.8 2006-07 (July-Jan)
23,329 -8.77 7,517 12.24 30,846 -4.41
2007-08 15,090 - 5,455 - 20,545 - Source: KPT
The existing port facilities appear to be inadequate to handle the growing cargo at the port. In order to address these constraints, the KPT has launched a number of projects that are at different stages of execution. A number of these projects have been formulated for phased implementation on a BOT basis, covering various activities in port operations. The KPT has commissioned the project titled “Karachi Interval Container Terminal (KICT)”. The project is already operational at the west wharf and it has annual capacity of 350,000 twenty equal units (TEU). An additional $ 65 million was invested to enhance its capacity upto 525,000 TEU. The 3rd phase of the project was launched on March 7, 2005, with an investment of US$ 55 million to extend the capacity up to 700,000 TEU. In addition, KPT has awarded a contract for a second container terminal on BOT basis with
estimated cost of US$ 75 million. To ease transportation problem between the port and the factory, the KPT has pledged to contribute over Rs.2.8 billion for reconstruction of roads. As the new generation of container ships come on board, KPT is taking initiatives to be able to cater to the even higher capacity fifth and sixth generation ships. This involves the development of 10 deep draught berths with the total cost of US $ 1,087 million. Furthermore, a Cargo Village and Industrial Park in the Western backwaters of Karachi Port has also been proposed. Finally, to provide connectivity between the Pakistan Deep Water Container Port and the Cargo Village, KPT is planning to construct a Cable Stayed Bridge across the channel, which will also connect Clifton with Manora and Hawksbay.

Transport and Communications
233
b) Port Qasim
Port Qasim is the first industrial and commercial port of Pakistan operating under landlord concept. Today it caters for around 40% of shipping requirements of the national economy. During the last financial year 2006-07, PQA handled a record volume of 24.3 million tonnes cargo showing an impressive growth of around 13% over corresponding period. However, from July to March of the current financial year, 2007-08, PQA handled 19.76 million tonnes of cargo depicting a growth rate of 10% over the same period last year. Cargo volume also surpassed the budget targets by 3% during the same period under review.
There has been a vast improvement in cargo handling over last five years. Average annual growth has been around 13.5% over the last five years which calls for development of new berths/terminals for capacity enhancement. The current handling capacity of the port, with ten berths, is 34 million tonnes per annum. To meet the ever growing requirement of capacity enhancement, PQA has chalked out an ambitious development plan. As against 3 private sector projects, 9 private sector projects which include Liquid Cargo Terminal, 2nd Container Terminal. Grain & Fertilizer Terminal, Coal & Cement/clinker Terminal, Gasport LNG Floating terminal, Granada LNG Terminal, 2nd IOCB, 2ND Oil Jetty and Mashal project by Sui Southern Gas Company are being implemented by the private sector with the completion of these terminals expected by 2010. With the projects in the pipelines, the PQA aims to increase its handling capacity to 85 million tonnes per annum, an increase of 150%.
PQA is committed to the objectives laid out under the National Trade Corridor, i.e. capacity enhancement, deeper draught berths, competitive tariffs and uninterrupted flow of cargo. PQA plans to deepen its navigation channel at a cost of US$ 100 million.
The Port Authority is also pursuing the development of industrial zones. Plans are in the pipelines to spend more than Rs. 13 billion on infrastructure facilities in various industrial zones.
Currently 104 projects are already operational while 179 are in construction phase. The completion of these will not only accelerate industrialisation in the country, but will also be a valuable source of employment generation.
During the last 3 years a marked improvement has also been witnessed in revenue growth. The revenue generation over the last five years was increased from Rs. 2 billion to Rs.3.4 billion. The PQA is currently pursuing a large number of projects for capacity enhancement and industrialization, attracting foreign direct investment (FDI) and simultaneously undertaking major infrastructure development to enhance its efficiency. The port has already attracted US $ 1.5 billion of FDI.
c) Pakistan National Shipping Corporation (PNSC)
PNSC fleet comprises of 14 vessels with a total capacity of 536,821 dwt. The fleet consists of 10 multi-purpose cargo vessels, 3 Aframax crude oil tankers and one Panamax bulk carrier vessel which were acquired through PNSC’s own resources. The three Aframax oil tankers are participating in national and regional crude oil trade. PNSC has carried crude oil cargoes for India, Bangladesh and Sri Lanka. During fist six months of the current fiscal year, the PNSC has lifted 5.87 million tonne of liquid cargo and 1.3 million tonne of dry cargo. The Corporation is continuing with its efforts to add more vessels. The share of lifting cargo has increased from 10.55% in 2001 to 17.47% in 2007. PNSC is expected to increase its fleet in 2007-08 by acquiring 3 new ships. A loan agreement has been signed with a foreign bank for this very purpose for an amount of US$ 135 million. For the first six months of the current fiscal year, the PNSC group has generated Rs 7,471 million in revenue, a 11 percent increase from the revenue earned during the same period last year. For FY 2007-08, PNSC has posted a before tax profit of 1,957 Rs million, an increase of Rs 100 million from profits in the same period last year. The Corporation also witnessed a healthy increase of 9.1 percent in earnings per share.
Pakistan Economic Survey 2007-08
234
d) Gwadar Port
Gwadar, a district of Balochistan enjoys a strategic position on the coastline with immense trade potential for not only Pakistan, but also for the region in general. The purpose of developing a port at Gwadar is to stimulate economic growth in the western and northern parts of Pakistan, utilizing the available coastline resources of the country and also providing and outlet for land-locked Central Asian Countries and Afghanistan through transit trade and offering trans-shipment facilities. With a fully equipped and well-functioning port at Gwadar, Pakistan will be able to promote trade and transport with Gulf States, China, Europe, Africa and Central Asian Countries; unlock the development potential of hinterland; divert the influx of human resources from upcountry to Gwadar instead of Karachi; provide a socio-economic uplift of Gwadar, the province of Balochistan and the country in general; establish shipping related industries; reduce the congestion and dependency on existing ports; and serve as a regional hub for major trade and commercial activities.
Work on Gwadar Port started in 2002 with major construction having been completed in early 2007 and the official inauguration on 20th March 2007. The total cost of Phase I of the Gwadar Deep Water Port Project was Rs. 17.3 billion with generous support from the Chinese Government, who not only provided financial support but also technical expertise.
To facilitate the growth and development of Gwadar Port, the Government of Pakistan has granted special waivers and tax exemptions on construction equipment, machinery, corporate income and provisional and local taxes.
A deep sea port like Gwadar is already attracting global attention, and once it is fully developed with all supporting facilities required to handle trans-shipment and trade, Gwadar will become one of the important gateways to the region. In order to achieve the objectives of the Gwadar Deep Water Project and enhance the economic development of Pakistan, the operations and management of the port was handed over to the Port of Singapore Authority (PSA) under a 40 year agreement. PSA
is a global leader in port operations, and is already operating 19 ports in 11 different countries. They have the plans and capacity to turn Gwadar into a regional hub through their strong links in the Maritime world and their contacts with various shipping lines.
e) Future Outlook
National Trade Corridor
In 2005, the Government of Pakistan launched major initiatives around the National Trade Corridor Improvement Program (NTCIP) to reduce the cost of trade and transport logistics and bring the quality of services offered to international standards. The aim being a reduction in the cost of doing business and ultimately enhance industrialization and the competitiveness of the Pakistani economy
The word “corridor” is a vestige of the initial Peshawar-Karachi (North-South) focus of this initiative, but at present NTCIP has evolved into a national program to improve the overall cost and efficiency of all links in the chain (infrastructure and services) that support trade logistics. The NTCIP also aims to meet increased demand through both improved infrastructure and more efficient services, while keeping costs under control. It is a medium term program that eventually links to the Government’s Vision 2030.
With a reform agenda supplemented by a strong investment program, NTCIP has become, essentially, the medium term development framework for the transport sector. Policies have been developed to meet NTCIP’s challenges: (a) modernize and streamline trade and transport logistics practices and customs; (b)improve port efficiency, reduce the costs for port users and enhance port management accountability; (c) create a commercial and accountable environment in Pakistan Railways and increase private sector participation in operation of rail services; (d) modernize the trucking industry and reduce the cost of externalities for the country; (e)sustain delivery of an efficient, safe and reliable National Highways system; and (f) promote and ensure safe, secure, economical and efficient civil aviation operations and boost air trade.

Transport and Communications
235
Since the launch of the NTCIP, some early gains of the program have already been achieved: (i) reduction of port entry charges by 15 percent at Karachi and Port Qasim; (ii) reduction of port transit times from nine to four days and reductions of customs clearance times from four to less than one day for containers; (iii) increase in daily freight express trains on the main north-south corridor from 1 to 5, reducing up-country container travel times by 10-20 percent; (iv) reduction of import tariffs on new trucks; (v) the approval of the first Trucking Policy (covering the overall road freight industry) followed by an organized effort to start preparation and implementation of this policy; (vi) the approval of the new civil aviation policy after a long series of consultations (including the Government seeking public comments for the first time in the history of civil aviation in Pakistan); (vii) the approval of the trade facilitation policy for Pakistan;(viii) Pakistan Railways preparing the very first draft “Network Statement” which is a key step towards movement on track access; (ix) main-streaming of Public Private Partnership in the NTCIP effort by the setting up of a specific sub-
committee under the NTCIP task force led by the Infrastructure Projects Development Facility; (x) finalizing the overall transport policy document for Pakistan with ADB and World Bank collaborating on its development and a road map being laid down by the Planning Commission for its finalization; (xii) Port Qasim Authority preparing its first Business Plan which is now in the system for approval; (xiii) the discussion of the first draft of the revised Afghanistan- Pakistan Transit Trade Agreement; (xiv) the procurement of Pakistan Automated Customs Community System.
Telecom Sector
Telecom sector continued to show stellar growth in last few years. Tele-density in the country has jumped from a mere 6% to 57% (Mar- 08) in few years. Pakistan was far behind in terms of telecom penetration few years back compare to its peer countries like India and Sri Lank however; its tele-density crossed both of these countries in last two years. Prudent policies of the government and concrete steps by the regulator have placed Pakistan telecom sector among rising economies like Malaysia and Singapore. Pakistan telecom sector has emerged as the fastest growing sector in the world where the infrastructure and subscriber growth patterns are unmatched all across the region. On average, more than 2 million subscribers are being added on cellular mobile networks per month which is an exemplary growth in the region. Currently, the total subscription base of cellular mobile companies is about 80 million while the WLL subscribers are 2.2 million. WLL is a latest technology introduced in Pakistan especially to cover the digital divide between rural and urban areas.
Telecom Sector Overview
Fixed Tele-density has slightly declined from 3.1% in 2006-07 to 2.9% in 2007-08 (Mar-08). Major reason behind this decline is the churn of subscribers from fixed line to wireless based services like WLL and mobile services. WLL sector is performing well and its tele-density has reached to 1.48% in 2007-08 (Mar-08). Total subscribers of WLL in Pakistan crossed 2.3 million in March 2008 which has boosted tele-density in the country.
Tele-densities of Regional Countries (%)
46
12
26
45
12
17
23
29
37
79
1213
20
2 25
9
15
2 2 3 47
57
51
24
19
10
0
10
20
30
40
50
60
2002
-03
2003
-04
2004
-05
2005
-06
2006
-07
2007
-08
Pakistan
Sri Lanka
India
Bangladesh
Nepal
• Teledensity includes fixed, WLL and mobile • Bangladesh 2007-08 (Estimated) • As of Dec 2007 execpt Pakistan Mar 08
Source: Websites of Telecom Regulatory Authorities

Pakistan E
236
Cellular M
Pakistan mobile mmarkets. whereas athan 100%82.5 millmillion intremendouand exterdown toPortabilitytrying themaking eevery corn
Out of theof populaaddition tto this ptheir netwUpto De
Telen10%
Million
Economic Sur
(
Mobile
has become markets amo
This year average growt%. Today totlion (Mar 2n 2006 and us growth is rnal factors implementy. The goveeir best to fevery effort tner of the cou
e total populaation is coverto availabilitypercentage. Aworks to numbcember 2007
Ufone22%
nor%
Warid14%
Pak3%
Cellula
2.40102030405060708090
2002
-03
2003
-
Million
rvey 2007-08
Sub(2005-06)
one of the ong the eme
the sector th rate in last tal subscriber008) wherea12.7 millionattributed tostarting from
ation of Mernment andfacilitate the to provide muntry.
ation of Pakistred with moby of fixed andAll operators ber of cities/ 7 more than
ktel% Instaphone
1%
ar Subscriber
34.5
12.75
04
2004
-05
2005
-06
8
bscriber Wise
fastest growierging telecogrew by 804 years is mo
r base standsas it was 34n in 2005. To many internm deregulati
Mobile Numbd regulator a
sector and amobile access
tan, almost 90bile networksd WLL servic
are increasitowns/ villagn 7,011 citi
Mobilink 50%
e
rs
82.5
62.3
5
06
2006
-07
'Mar
-08
e share in mo
ing om 0% ore s at 4.5 his nal ion ber are are to
0% in ces ing
ges. ies/
towns aall oper
Long D
The LsegmenPakistalicenseserviceonly McellularThe LDthe loclarge ntariffs direct dconnecSimilarnumbe
The setelecomlow asWateenbecomioperatogrowinhave ssurviveof its sBurraqThese inertestthe tele
Insta0
Teleno20.2%
obile market
and villages hrators.
Distance and
Long Distannt has evolvan telecom sees for Longes till 2007. O
Multinet has nor operators haDI operators cal market bynumber of coat the end odialing facilit
ction and callrly internationr has also rev
ector witnessm consumers s Rs. 1/- minn). Due to thing increasinors to sustaing pressures started lookine in the markshares to Omaq have been changes in tht of Mid-Easecom market
Paktel2.6%
aphone0.4%
or%
Warid17.4%
t (Mar-08)
have mobile n
d Internation
nce and Intved after theector in 2004g Distance Out of these ot started its save also acquare performi
y offering affountries. PTCof 2006 and ty is availabll booking is nal dialing fa
volutionized th
sed bloominenjoyed internute (to spe
his aggressivengly difficuin their finafrom the m
ng for foreiket e.g. Worldan telecom, a
acquired byhe market alsst based telecof Pakistan.
Ufone20.8%
networks by o
nal
ternational e deregulatio. PTA awardand Interna14 LDI lice
services. 3 ouuired LDI liceng aggressivefordable tarif
CL also reducnow interna
le on every Pno more req
acility from mhe LDI segme
ng health whrnational dialicific countriee competition
ult for ineffancial health
market. Compign investmedcall has soldalso 30% shary Qatar Teleso show increcom compan
Mobilin38.5%
one or
(LDI) on of
ded 14 ational ensees ut of 6 enses. ely in
ffs for ced its ational PTCL uired.
mobile ent.
herein ing as es by n it is ficient h and panies ent to d 65% res of ecom. easing ies in
k%

Transport and Communications
237
Fixed Local Loop Services
Fixed-line telephony in Pakistan is one of the difficult areas where the incumbent operator, PTCL, holds monopoly with share of more than 98% of the total Fixed-line subscribers. Fixed Local Loop (FLL) growth remained about half percent during the previous year, slow growth is due to the cumbersome activity of laying cables. However, new operators are gaining momentum in fixed-line telephony though their services remained localized in main cities by targeting businesses in the first place. FLL subscribers reported 4.6 million and tele-density is 2.9% at the end of March 2008.
Wireless Local Loop
Wireless Local Loop services were introduced in Pakistan after deregulation of local loop sector in 2004. The Authority auctioned frequency for commercial operations of WLL services. A total of 17 companies won WLL licenses, out of which six operators obtained WLL license in all 14 telecom regions after winning the frequency. Out of these 17 WLL companies 7 (PTCL, Worldcall, Telecard, Great Bear, Burraq, Wateen and Mytel) are fully operational. The recent development is the introduction of WiMax technology by WLL operators, which will make available high quality broadband data/ Internet services. Total WLL subscribers have reached 2.3 million and the tele-density is 1.48. The sector has witnessed 65% growth in subscribers during 2006-07. PTCL is currently leading the WLL market as well with maximum share of 53% followed by
26% share of Telecard. In addition, the WLL operators are also providing Payphone facilities to the general public. There are a total of 225,980 wireless PCOs in Pakistan.
Value Added Services
Value added Services have been deregulated since 1990 in Pakistan and private operators are providing these services to consumers. In 2005 PTA introduced Class Value Added Service (CVAS ) regime where most of the CVAS licenses have been merged into one single license. Some of the services have been exempted by the Authority from obtaining license and the process of simple registration has been established for convenience of operators and telecommunication services users.
Since the introduction of CVAS licensing regime in October 2005, PTA has issued 224 CVAS licenses and 4 Class Value Added Registrations (161-Voice Class Value Added Services licenses, 67-Data Class Value added services Licenses). Out of 161 “Voice TYPE” CVAS licenses, 153 Licenses have been issued to CPP operators
Payphones
All over the world, payphones are regarded as the poor man’s telephony. They provide easy access to people who can not afford to have telephone access at home. It is also a source of self employment in developing countries. Card payphone service in Pakistan was deregulated in 1990s.
17,3
91 264,
828
1,02
5,32
8
1,70
2,09
8
2,35
6,08
1
0
500,000
1,000,000
1,500,000
2,000,000
2,500,000
2003
-04
2004
-05
2005
-06
2006
-07
'Mar
- 08
WLL Subscribers
3.7 4.0
4.55.2 5.24
4.8 4.6
0.0
1.0
2.0
3.0
4.0
5.0
6.0
Mill
ion
2002
2003
2004
2005
2006
2007
'Mar
- 08
Fixed Line Connections (2004-2007)

Pakistan Economic Survey 2007-08
238
During the last one and a half year a number of new companies have applied for Voice Class Value Added services license. Now, these companies are joining hands with mobile Companies to establish Mobile PCOs rather than fixed line PCO. Mobilink, Telenor and CMPak (Paktel) have started providing Mobile PCOs after obtaining the permission from PTA. Similarly, some old players of CPP industry themselves got licenses for WLL and now they are offering services on their WLL networks.
Total payphones reached to 471,410 at the end of December 2007. Currently, more than 121,358 Fixedline, 262,116 WLL and 57,939 Mobile PCOs are working all across the country.
Broadband Services
Pakistan's broadband market has been slow despite the fact that services have been available since almost five years. Currently there are a total of almost 12,689 Broadband subscribers which provide dismal picture when compared with other similar economies. Telecom regulator is trying hard to improve broadband penetration in Pakistan; however, factors like lack of education, IT equipments are main hurdles in the way of its growth. To make the service affordable for common man, PTA has already reduced Bandwidth charges tremendously.
Internet Services
Internet service is becoming an integral part of life in Pakistan particularly in urban areas where large portion of populace using it for different purposes. Most Airlines including PIA and Air Blue have started e-ticketing through Internet to provide better and efficient services to its customers. Internet is also being used for educational and entertainment purposes and its use is increasing very fast. Major reason for rapid growth of the service is low cost of the service which make service affordable to poor strata of the population. Almost 70 companies are providing Internet service all across the country.
According to estimates by the Internet Service Providers Association of Pakistan (ISPAK), currently there are about 3.5 million internet subscribers all across in Pakistan where total users crossed 17 million marks. Currently around 3,008 cities are connected to internet cities.
Telecom Economy
Foreign Direct Investment (FDI)
Government has created a conducive and investor friendly environment in the telecom sector by awarding licenses in a fair and transparent manner. Award of cellular mobile licenses increased Foreign Direct Investment considerably.
127,910
184,920
279,320
353,194387,490
471,410
050,000
100,000150,000200,000250,000300,000350,000400,000450,000500,000
2002
-03
2003
-04
2004
-05*
2005
-06*
2006
-07*
Dec-0
7
Payphones in Pakistan
*Including Payphones of FLL, WLL and Mobile companies
0.81.0
1.62.0 2.1
2.4
3.5
0.0
0.5
1.0
1.5
2.0
2.5
3.0
3.5
2001
2002
2003
2004
2005
2006
2007
Internet Subscribers (Millions)

Transport and Communications
239
During 2007-08 (July-March), an FDI inflow of US$ 811.6 million has come in the telecom sector which is almost one third of the total FDI in the country during the period. This trend has continued and during Jul 07-Dec 07, US$ 653.4 million FDI inflows came in the telecom sector and it is expected that during 2007-08 this will be increase further.
Contribution to Government Revenues
Telecom sector is a major contributor in generating revenues for the Government. During 2006-07 total revenue collected by the Government in the form of taxes, duties and regulatory charges was more than Rs. 100.5 billion. The government collected total of Rs. 36.6 billion against GST/CED, it is expected that this collection would grow exponentially in the coming years. The government also collects activation tax on new mobile connections @ Rs.500. During 2006-07 total amount collected in the form of activation tax was Rs. 17.6 billion. Similarly PTA also deposited Rs. 7 billion to the national exchequer [Table 14.8].
Employment
The telecommunications sector liberalization in Pakistan has created huge employment opportunities (direct and indirect) in the country. It is estimated that over one million job opportunities have been created since the liberalization of the sector in 2003.
Table-14.8: Telecom Contribution to Exchequer (2007) (Rs. in Billions ) Period GST Activation Tax PTA Deposits Others Total
2001-02 8.9 0.12 0.04 0.99 10.05 2002-03 11.5 1.91 0.47 15.75 29.63 2003-04 12.1 4.02 0.69 21.59 38.40 2004-05 20.5 7.53 17.72 21.38 67.13 2005-06 26.8 11.40 17.38 21.55 77.10 2006-07 36.28 17.58 9.72 36.95 100.55 Source: Central Board of Revenue and Pakistan Telecommunication Authority. Others include custom duties, WH Tax and other taxes. Regulatory Steps for Promoting Telecom in Pakistan
Rural Telephony
PTA Launched a project of Tele-centres (Rabta Ghar) across Pakistan to provide basic telecom facilities to the people who cannot afford such telecom facilities at their own. PTA planned to set up 400 Tele-centres (Rabta Ghars) free of cost. The first phase of Rabta Ghar scheme has been launched during the year where 353 Rabta Ghar are being established. Each Rabta Ghar is being equipped with a PC, one Wireless PCO, One Internet enabled Wireless set, Printer, scanner, copier and fax (4 in 1 machine). In addition to that
each Rabta Ghar owner is being provided with a comprehensive training from the GID.
Technical Solution to Counter Illegal Telecom Traffic
PTA had taken several regulatory measures to counter the grey (Illegal) traffic in the country which is causing huge losses to the national exchequer and to the operators in Pakistan who have invested heavily in telecommunications infrastructure. PTA has estimated that approximately US$ 50 million (Rs 3 billion approx) loss accrued per annum to national exchequer due to international traffic leakage. To
FDI in Telecom Sector
1905.1 1,824.20
653.4
0
500
1000
1500
2000
2005-06 2006-07 Jul-Dec 07
US$
Milli
on
Pakistan Economic Survey 2007-08
240
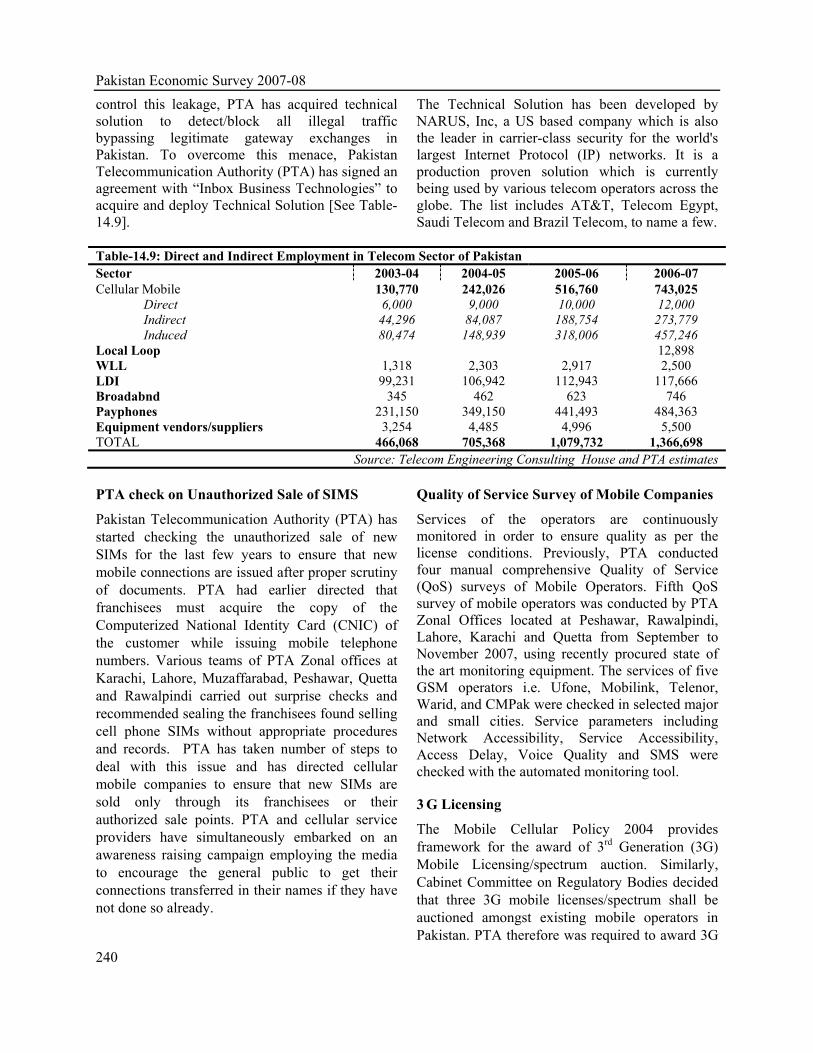
control this leakage, PTA has acquired technical solution to detect/block all illegal traffic bypassing legitimate gateway exchanges in Pakistan. To overcome this menace, Pakistan Telecommunication Authority (PTA) has signed an agreement with “Inbox Business Technologies” to acquire and deploy Technical Solution [See Table-14.9].
The Technical Solution has been developed by NARUS, Inc, a US based company which is also the leader in carrier-class security for the world's largest Internet Protocol (IP) networks. It is a production proven solution which is currently being used by various telecom operators across the globe. The list includes AT&T, Telecom Egypt, Saudi Telecom and Brazil Telecom, to name a few.
Table-14.9: Direct and Indirect Employment in Telecom Sector of Pakistan Sector 2003-04 2004-05 2005-06 2006-07 Cellular Mobile 130,770 242,026 516,760 743,025 Direct 6,000 9,000 10,000 12,000 Indirect 44,296 84,087 188,754 273,779 Induced 80,474 148,939 318,006 457,246 Local Loop 12,898 WLL 1,318 2,303 2,917 2,500 LDI 99,231 106,942 112,943 117,666 Broadabnd 345 462 623 746 Payphones 231,150 349,150 441,493 484,363 Equipment vendors/suppliers 3,254 4,485 4,996 5,500 TOTAL 466,068 705,368 1,079,732 1,366,698
Source: Telecom Engineering Consulting House and PTA estimates PTA check on Unauthorized Sale of SIMS
Pakistan Telecommunication Authority (PTA) has started checking the unauthorized sale of new SIMs for the last few years to ensure that new mobile connections are issued after proper scrutiny of documents. PTA had earlier directed that franchisees must acquire the copy of the Computerized National Identity Card (CNIC) of the customer while issuing mobile telephone numbers. Various teams of PTA Zonal offices at Karachi, Lahore, Muzaffarabad, Peshawar, Quetta and Rawalpindi carried out surprise checks and recommended sealing the franchisees found selling cell phone SIMs without appropriate procedures and records. PTA has taken number of steps to deal with this issue and has directed cellular mobile companies to ensure that new SIMs are sold only through its franchisees or their authorized sale points. PTA and cellular service providers have simultaneously embarked on an awareness raising campaign employing the media to encourage the general public to get their connections transferred in their names if they have not done so already.
Quality of Service Survey of Mobile Companies
Services of the operators are continuously monitored in order to ensure quality as per the license conditions. Previously, PTA conducted four manual comprehensive Quality of Service (QoS) surveys of Mobile Operators. Fifth QoS survey of mobile operators was conducted by PTA Zonal Offices located at Peshawar, Rawalpindi, Lahore, Karachi and Quetta from September to November 2007, using recently procured state of the art monitoring equipment. The services of five GSM operators i.e. Ufone, Mobilink, Telenor, Warid, and CMPak were checked in selected major and small cities. Service parameters including Network Accessibility, Service Accessibility, Access Delay, Voice Quality and SMS were checked with the automated monitoring tool.
3 G Licensing
The Mobile Cellular Policy 2004 provides framework for the award of 3rd Generation (3G) Mobile Licensing/spectrum auction. Similarly, Cabinet Committee on Regulatory Bodies decided that three 3G mobile licenses/spectrum shall be auctioned amongst existing mobile operators in Pakistan. PTA therefore was required to award 3G

Transport and Communications
241
licenses after vacation of the 3G bands by FAB. Consequently Frequency Allocation Board was tasked to vacate frequency spectrum identified for the 3G auction and the Authority prepared Information Memorandum for 3G spectrum auction/licensing The draft IM was circulated to all stake holders including mobile operators for their opinion and input. The industry strongly recommended delay in the licensing of 3G services. The industry is of the view that the mobile data market in Pakistan is insignificant, the base price is very high and the local market is not ready for it. The Authority therefore considering operators (who are the main stake holders) viewpoint, has forwarded industry’s concern and its own viewpoint to the government of Pakistan. The industries is worried about the cost of the spectrum and are interested that instead of auction the spectrum should be given to all of the operators at reasonable price. FAB is still working on the vacation of the band and as soon the same is cleared, PTA would issue IM and initiate process for 3G spectrum auctions.
III. Electronic Media
a) Pakistan Electronic Media Regulatory Authority (PEMRA)
PEMRA was setup under an Ordinance in March 2002 to oversee and regulate private broadcast media affairs in the country. For more than five decades since independence, people have had very limited access to information, education and entertainment. The environment was never as conducive for the private media to flourish. It was for the first time that electronic media was opened up to the private sector in 2002. Complete freedom and facilitation served as a catalyst for the unprecedented growth of electronic media in a short span. Today there are nearly 50 private TV channels transmitting information, entertainment and education to all nooks and corners of the country against none, five to six years ago. This has also opened new vistas for investment and employment.
Within a few years, Pakistan has developed a modern media network encompassing all mediums such as Satellite TV, Mobile TV, IPTV, FM Radio
Stations, MMDS, and Cable networks etc etc. free and widespread access to media has kept large portions of the nation up to-date with national and international developments, and disseminated information and education at an unprecedented level.
PEMRA has issued IPTV licences to two mainstream companies making Pakistan the sixth country in the region to adopt such technology. This service is due to be rolled out in the fiscal year 2008-09. Telenor and Mobilink have also attained Mobile Tv licenses from PEMRA.
During the last three years, PEMRA has issued 33 new licenses for Satellite TV stations with the total reaching 36 by December 2007. 24 new satellite TV licences have been issued in the year 2007-08. The introduction of “Landing Rights” has brought foreign channels under the regulatory province of PEMRA. To date, 33 foreign channels have been granted Landing Right permissions, including 8 new channels in the fiscal year 2007-08.
PEMRA has maintained its efforts to reach the milestone of having at least one FM radio station in each district of the country. 51 new FM radio licences have been issued so far through an open and transparent bidding process. Total number of FM radio licenses issued to date is now 106, with 14 for Universities teaching Mass Communications. Of these 82 FM stations are already on air. 6 FM licenses have also been granted for the AJK, a first for the area. Radio licenses have been awarded to 3 new stations during July 2007- March 2008.
State of the art broadband wireless point-to-multipoint technology is also being encouraged by PEMRA, with a total of 6 MMDS licenses having been issued throughout the country.
Cable TV remained the fastest growing sector in the national electronic media area. To date, PEMRA has issued 1874 licenses to cable operators.

Pakistan Economic Survey 2007-08
242
b) Pakistan Television Corporation Limited (PTV)
This year, PTV played a significant role in covering and conducting the Elections of 2008 for the National Assembly as well as the Provincial Assemblies. In this regard, PTV had made extra ordinary arrangements by providing a live telecast all over the world, with a marathon transmission that lasted 72 hours. PTV was also efficient in providing the latest positions of the Election 2008 results for the public as soon as they received the information from their correspondents that were placed across the different constituencies of the country.
PTV also imported four Drive Away Digital Satellites News Gathering (DSNG) units that are installed in the vans and also handed to the respective centres for live coverage of news, current affairs and sports. Besides this, PTV procured a number of electronic equipment for their TV centres as well as Satellite Video phones and BGAN equipment for efficient news reporting.
PTV is now operating five channels in the country, namely: PTV Home; PTV News; PTV Bolan; PTV National; and PTV Global (for UK, USA). For this, it installed Satellite Earth Stations for all five channels, digitalization of two studios at all five TV centres and the provision of one main OB Van each for the five TV centres.
c) Pakistan Broadcasting Corporation (PBC)
Radio is the fastest, mobile and cheapest electronic media which is capable of reaching the masses far and near. With its varied and wide ranging programmes, PBC is catering to all segments of society. PBC has 31 Broadcasting Houses, 33 medium wave transmitters, 8 short wave transmitters and 21 FM transmitters which transmitted programmes for listeners at home and abroad. Programmes in 21 national and regional languages are broadcast on the medium wave in Home Service and 16 foreign languages in the External Service for foreigners and in national language in the World Service for Pakistanis living abroad. The network of Radio Pakistan covers 98 percent of the population and 80 percent of the total area of the country.
Presently 8 FM Stations are broadcasting FM 101 Service. In addition to FM-101 and 93, other FM stations have also been established in 12 important cities of Pakistan which besides National circuit programs radiate regional services emphasizing on community issues and matters related to local populations.
PBC News is the biggest source of dissemination of news in the country. Its General News room in Islamabad and attached units are presently putting on air 136 news bulletins daily. PBC is now accessible to audiences around the world through Internet and Asia SAT-3.
PBC took an active role in fostering motivation and awareness about the local elections held this year among the general population. Equitable and equal opportunities were provided to all political parties to air their point of view.
An amount of Rs. 483,953 million has been allocated in the PSDP of current fiscal year, for the implementation of 10 on-going/ new development projects. An additional amount to the tune of Rs 50 million has been sanctioned by the Planning Commission for establishment of 15 FM Radio Stations. Out of the allocated amount, a sum of Rs 120.988 million was released in November, 2007 for the first quarter, and has been fully utilized. A sum of Rs 76.2 million was released in April 2008 for the second quarter. The following development projects are under way:
• Completion of 100 KW MW Transmitting Station and Broadcasting house at Turbat.
• Balancing & Modernization of Equipment Phase-V
• Commissioning of 100KW SW Transmitter installed at HPT-COMPLEX, Rawat.
• 8 FM transmitters for the radio coverage of G.T Road between Rawalpindi and Lahore.
• 10 FM transmitters for coverage of M-1 and M2 motorways.
• Establishment of 47 FM radio stations

Transport and Communications
243
• Establishment of satellite up-linking stations at PBC Islamabad, Lahore, Karachi, Peshawar, and Quetta.
Pakistan Post Office
Pakistan Post Office is a dedicated state enterprise that provides a wide range of postal services and products. For a vast country like Pakistan, an efficient postal system is essential for cohesiveness of a large population. Its commitment is for serving every one, every day and every where. It provides postal facilities through a network of over 12, 343 post offices strategically placed across the country. In compliance with Government welfare policies, the Pakistan Post Office is providing a variety of services on behalf of both Federal and Provincial Governments and autonomous/corporate entities.
Pakistan Post has also taken various measures to streamline the post office system on more modern lines. One major area of improvement is the introduction of information technology, where a number of projects have already been completed and a few more in the pipeline. These projects include: Counter Automation; Express Mail Track
& Trace System (EMTTS); Electronic Money Transfer; Computerized Military Pension Payment System; Computerization of Postal Life Insurance; and Computerization of the office of the Chief Controller Stamps (CCS).
Pakistan Post is also involved in international postal services and has mail links with all countries except Israel. The mail exchange with these countries takes places under the Universal Union Rules & Regulations. Accounts with foreign postal administrations are settled under these regulations. The net earnings of the Pakistan Post Office in foreign exchange services during July-March 2008 stood at Rs. 81.6 million. Foreign remittances in the form of money orders totalled Rs. 8.22 million during the same period. Furthermore, keeping in view the difficulties faced by the general public for depositing their utility bills, Pakistan Post has started collecting PTCL, Electricity and Gas bills throughout the country while WASA bills are collected in Hyderabad, Faisalabad, Karachi, Lahore, Multan, Quetta and Sialkot. It earned a healthy Rs. 483.47 million from these utility bills collection in the shape of commission for the period of July-March 2008.

TABLE 13.1
Railways Length of RoadsNumber of Freight Freight Locomo- Freight
Fiscal Route Passengers carried Tonne tives Wagons KilometersYear (Kilometres) carried (Million (Kilometres (Nos.) (Nos.) High Low
*(Million) Tonnes) Million) Total Type Type1990-91 8,775 84.90 7.72 5,709 753 34,851 170,823 86,839 83,9841991-92 8,775 73.30 7.56 5,962 752 30,369 182,709 95,374 87,3351992-93 8,775 59.00 7.77 6,180 703 29,451 189,321 99,083 90,2381993-94 8,775 61.72 8.04 5,938 676 29,228 196,817 104,001 92,8161994-95 8,775 67.70 8.11 6,711 678 30,117 207,645 111,307 96,3381995-96 8,775 73.65 6.85 5,077 622 26,755 218,345 118,428 99,9171996-97 8,775 68.80 6.36 4,607 633 25,213 229,595 126,117 103,4781997-98 8,775 64.90 5.98 4,447 611 24,275 240,885 133,462 107,423 1998-99 7,791 64.90 5.45 4,330 596 24,456 247,484 137,352 110,132 1999-00 7,791 68.00 4.77 3,612 597 23,906 248,340 138,200 110,140 2000-01 7,791 68.80 5.89 4,520 610 23,893 249,972 144,652 105,320 2001-02 7,791 69.00 5.90 4,573 577 23,460 251,661 148,877 102,784 2002-03 7,791 72.40 6.18 4,820 577 23,722 252,168 153,225 98,943 2003-04 7,791 75.70 6.14 4,796 592 21,812 256,070 158,543 97,5272004-05 7,791 78.18 6.41 5,014 557 21,556 258,214 162,841 95,3732005-06 7,791 81.43 6.03 4,971 544 20,809 259,021 167,530 91,4912006-07 7,791 83.89 6.42 5,453 544 19,638 261,821 172,891 88,930(Jul-Mar)2007-08 P 7,791 59.74 5.20 4,488 520 20,161 264,853 178,423 86,430P: Provisional (Contd.)
TRANSPORT
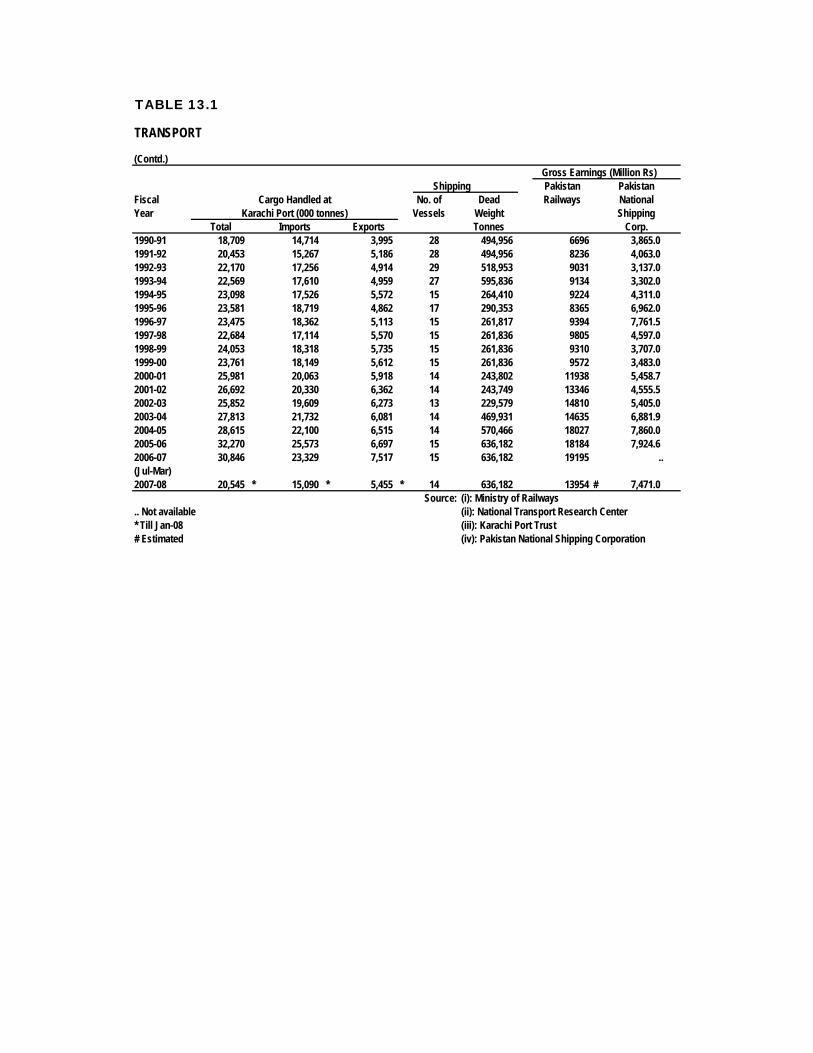
TABLE 13.1
(Contd.)Gross Earnings (Million Rs)
Shipping Pakistan PakistanFiscal Cargo Handled at No. of Dead Railways NationalYear Karachi Port (000 tonnes) Vessels Weight Shipping
Total Imports Exports Tonnes Corp.1990-91 18,709 14,714 3,995 28 494,956 6696 3,865.01991-92 20,453 15,267 5,186 28 494,956 8236 4,063.01992-93 22,170 17,256 4,914 29 518,953 9031 3,137.01993-94 22,569 17,610 4,959 27 595,836 9134 3,302.01994-95 23,098 17,526 5,572 15 264,410 9224 4,311.01995-96 23,581 18,719 4,862 17 290,353 8365 6,962.01996-97 23,475 18,362 5,113 15 261,817 9394 7,761.51997-98 22,684 17,114 5,570 15 261,836 9805 4,597.01998-99 24,053 18,318 5,735 15 261,836 9310 3,707.01999-00 23,761 18,149 5,612 15 261,836 9572 3,483.02000-01 25,981 20,063 5,918 14 243,802 11938 5,458.72001-02 26,692 20,330 6,362 14 243,749 13346 4,555.52002-03 25,852 19,609 6,273 13 229,579 14810 5,405.02003-04 27,813 21,732 6,081 14 469,931 14635 6,881.92004-05 28,615 22,100 6,515 14 570,466 18027 7,860.02005-06 32,270 25,573 6,697 15 636,182 18184 7,924.62006-07 30,846 23,329 7,517 15 636,182 19195 ..(Jul-Mar)2007-08 20,545 * 15,090 * 5,455 * 14 636,182 13954 # 7,471.0
Source: (i): Ministry of Railways.. Not available (ii): National Transport Research Center* Till Jan-08 (iii): Karachi Port Trust# Estimated (iv): Pakistan National Shipping Corporation
TRANSPORT

TABLE 13.2
Fiscal Route Revenue Revenue Revenue Revenue Available PassengerYear Kilo- Kilome- Hours Passengers Passengers Seat Load
metres tres Flo- Flown Carried Kilome- Kilome- Factorwn (000) (000) tres (mln) tres(mln) %
1990-91 255,336 60,255 116,616 5,033 8,998 13,401 67.11991-92 258,558 66,570 127,423 5,584 9,925 15,066 65.91992-93 270,536 69,377 132,775 5,780 10,102 15,733 64.21993-94 303,321 69,024 131,122 5,645 10,108 15,159 66.71994-95 353,221 72,544 134,683 5,517 10,382 15,848 65.51995-96 310,205 74,288 138,014 5,399 10,592 16,573 63.91996-97 336,230 78,796 143,686 5,883 11,661 17,528 66.51997-98 325,744 73,663 136,104 5,531 11,147 16,952 65.81998-99 335,348 70,697 129,379 5,086 10,722 16,752 64.01999* 332,417 75,483 135,136 4,914 10,653 17,839 59.72000* 317,213 76,212 134,066 5,297 12,056 18,692 64.52001* 324,815 40,158 65,615 2,729 6,305 9,885 63.82001-02 291,428 62,974 110,136 4,290 10,843 15,778 68.72002-03 311,152 63,863 108,942 4,391 11,276 16,264 69.32003-04 294,082 58,146 96,765 4,796 12,769 18,299 69.82004-05 354,664 80,699 131,262 5,132 13,634 20,348 67.02005-06 343,525 87,273 141,666 5,828 15,260 21,991 69.42006-07 446,570 80,302 141,479 5,732 15,124 22,092 68.5(Jul-Mar)2007-08 683,574 80,759 132,416 5,415 13,680 20,313.3 67.4*: PIA's Financial Year is based on Calender Year. (Contd.)
TABLE 13.2
Fiscal Revenue Available Revenue Operating Operating PIA FleetYear Tonne Tonne Load Revenue Expenses No.of
Kilome- Kilome- Factor (Million (Million Planestres (Mln) tres (Mln) (%) Rupees) Ruppes)
1990-91 1,228 2,045 60.0 16,849 16,966 441991-92 1,304 2,265 57.6 20,441 18,861 451992-93 1,333 2,352 56.7 21,970 21,347 451993-94 1,365 2,347 58.2 23,631 22,713 471994-95 1,408 2,452 57.4 25,417 24,199 471995-96 1,402 2,526 55.5 27,505 27,150 471996-97 1,495 2,649 56.4 32,732 32,809 471997-98 1,425 2,435 58.5 .. .. 471998-99 1,313 2,403 54.6 .. .. 451999 * 1,307 2,560 51.0 35,492 36,395 512000 * 1,452 2,631 55.2 39,228 42,033 462001 * 769 1,438 53.5 21,966 23,296 452001-02 1,325 2,270 58.4 42,844 39,377 442002-03 1,389 2,401 57.8 45,442 39,125 432003-04 1,456 2,528 55.0 51,041 47,197 422004-05 1,657 3,033 54.6 61,308 62,360 422005-06 1,818 3,302 55.1 67,574 73,074 422006-07 1,801 3,369 53.5 70,587 79,164 39(Jul-Mar)2007-08 1,593 3,126 51.0 70,480 76,416 42.. Not available Source: Pakistan International Airlines Corporation*: PIA's Financial Year is based on Calender Year.
PAKISTAN INTERNATIONAL AIRLINES CORPORATION
PAKISTAN INTERNATIONAL AIRLINES CORPORATION

TABLE 13.3
Calendar Motor Cars Motor Motor MotorYear Jeeps & Sta- Cabs/ Buses Trucks Cycle Cycle Others Total
tion Wagons Taxis (2 Wheels) (3 Wheels)1990 682,636 32,304 84,016 105,245 1,250,749 50,862 507,025 2,712,8371991 731,960 33,235 89,094 107,171 1,381,136 52,439 528,878 2,923,9131992 819,350 41,245 94,988 111,391 1,497,017 56,267 558,926 3,179,1841993 868,159 47,897 98,681 114,394 1,573,370 59,510 589,281 3,351,2921994 902,654 52,444 107,440 118,389 1,679,259 62,183 615,497 3,537,8661995 923,577 53,400 113,516 119,174 1,754,737 63,370 642,174 3,669,9481996 966,747 54,501 114,415 123,658 1,842,531 69,756 666,549 3,838,1571997 1,068,116 83,182 119,365 131,322 1,995,421 76,224 700,315 4,173,9451998 1,085,969 83,687 125,929 132,895 2,068,730 81,777 724,309 4,303,2961999 1,162,876 83,844 150,108 145,111 2,175,488 95,345 746,718 4,559,4902000 1,182,307 83,892 154,401 148,569 2,260,772 99,376 772,279 4,701,5962001 1,201,738 93,940 158,694 157,027 2,346,056 103,407 797,840 4,843,7022002 1,282,371 83,954 162,672 170,615 2,407,466 115,919 825,552 5,048,5492003 1,292,888 84,277 162,957 178,883 2,444,567 122,448 846,017 5,132,0372004 1,301,406 84,311 163,242 181,150 2,681,066 124,076 860,480 5,395,7312005 1,321,590 85,619 165,775 183,962 2,722,645 126,004 873,825 5,479,4172006 1,375,419 89,105 172,530 191,454 2,833,540 131,134 909,416 5,702,5982007 1,444,190 93,560 181,157 201,027 2,975,217 137,691 954,887 5,987,729
Source: Federal Bureau of Statistics
NUMBER OF MOTOR VEHICLES REGISTERED
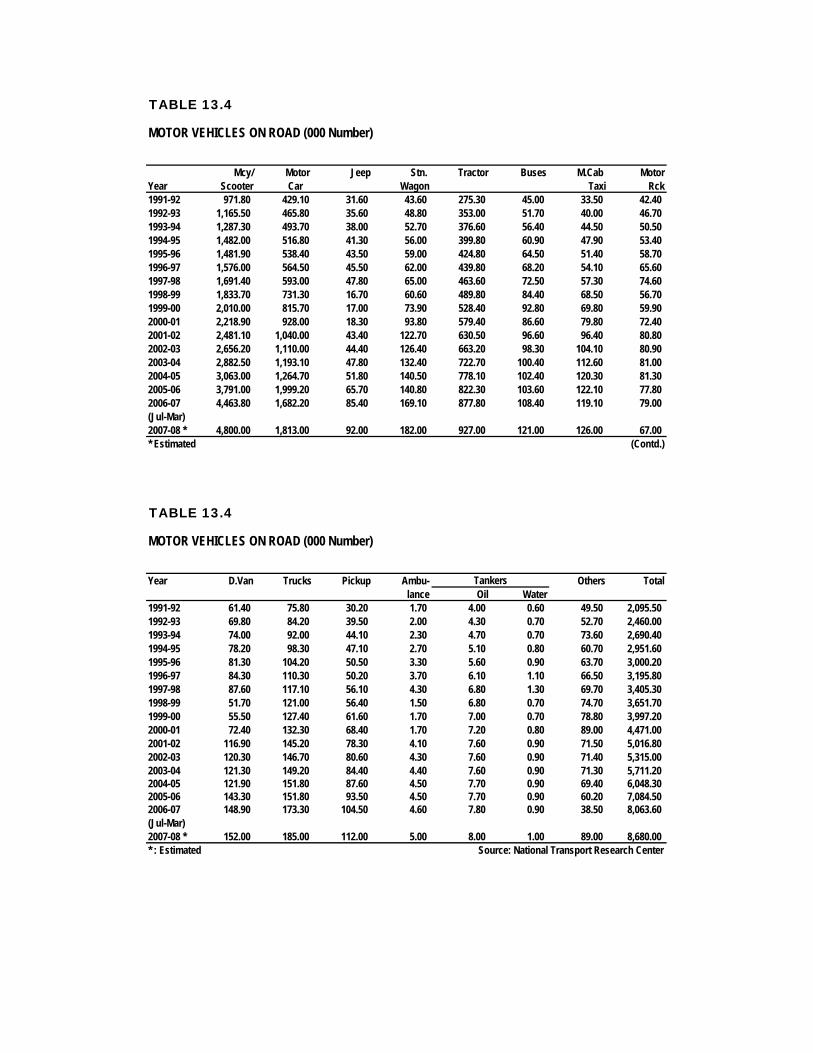
TABLE 13.4
Mcy/ Motor Jeep Stn. Tractor Buses M.Cab MotorYear Scooter Car Wagon Taxi Rck1991-92 971.80 429.10 31.60 43.60 275.30 45.00 33.50 42.401992-93 1,165.50 465.80 35.60 48.80 353.00 51.70 40.00 46.701993-94 1,287.30 493.70 38.00 52.70 376.60 56.40 44.50 50.501994-95 1,482.00 516.80 41.30 56.00 399.80 60.90 47.90 53.401995-96 1,481.90 538.40 43.50 59.00 424.80 64.50 51.40 58.701996-97 1,576.00 564.50 45.50 62.00 439.80 68.20 54.10 65.601997-98 1,691.40 593.00 47.80 65.00 463.60 72.50 57.30 74.601998-99 1,833.70 731.30 16.70 60.60 489.80 84.40 68.50 56.701999-00 2,010.00 815.70 17.00 73.90 528.40 92.80 69.80 59.902000-01 2,218.90 928.00 18.30 93.80 579.40 86.60 79.80 72.402001-02 2,481.10 1,040.00 43.40 122.70 630.50 96.60 96.40 80.802002-03 2,656.20 1,110.00 44.40 126.40 663.20 98.30 104.10 80.902003-04 2,882.50 1,193.10 47.80 132.40 722.70 100.40 112.60 81.002004-05 3,063.00 1,264.70 51.80 140.50 778.10 102.40 120.30 81.302005-06 3,791.00 1,999.20 65.70 140.80 822.30 103.60 122.10 77.802006-07 4,463.80 1,682.20 85.40 169.10 877.80 108.40 119.10 79.00(Jul-Mar)2007-08 * 4,800.00 1,813.00 92.00 182.00 927.00 121.00 126.00 67.00* Estimated (Contd.)
TABLE 13.4
Year D.Van Trucks Pickup Ambu- Others Totallance Oil Water
1991-92 61.40 75.80 30.20 1.70 4.00 0.60 49.50 2,095.501992-93 69.80 84.20 39.50 2.00 4.30 0.70 52.70 2,460.001993-94 74.00 92.00 44.10 2.30 4.70 0.70 73.60 2,690.401994-95 78.20 98.30 47.10 2.70 5.10 0.80 60.70 2,951.601995-96 81.30 104.20 50.50 3.30 5.60 0.90 63.70 3,000.201996-97 84.30 110.30 50.20 3.70 6.10 1.10 66.50 3,195.801997-98 87.60 117.10 56.10 4.30 6.80 1.30 69.70 3,405.301998-99 51.70 121.00 56.40 1.50 6.80 0.70 74.70 3,651.701999-00 55.50 127.40 61.60 1.70 7.00 0.70 78.80 3,997.202000-01 72.40 132.30 68.40 1.70 7.20 0.80 89.00 4,471.002001-02 116.90 145.20 78.30 4.10 7.60 0.90 71.50 5,016.802002-03 120.30 146.70 80.60 4.30 7.60 0.90 71.40 5,315.002003-04 121.30 149.20 84.40 4.40 7.60 0.90 71.30 5,711.202004-05 121.90 151.80 87.60 4.50 7.70 0.90 69.40 6,048.302005-06 143.30 151.80 93.50 4.50 7.70 0.90 60.20 7,084.502006-07 148.90 173.30 104.50 4.60 7.80 0.90 38.50 8,063.60(Jul-Mar)2007-08 * 152.00 185.00 112.00 5.00 8.00 1.00 89.00 8,680.00* : Estimated Source: National Transport Research Center
Tankers
MOTOR VEHICLES ON ROAD (000 Number)
MOTOR VEHICLES ON ROAD (000 Number)

TABLE 13.5
Fiscal Year/Type of Vehicles 1992-93 1993-94 1994-95 1995-96 1996-97 1997-98 1998-99 1999-00 2000-01PRODUCTION (Nos.) Trucks 2,222 1,394 703 3,030 2,916 1,850 1,131 977 952 Buses 1,177 427 312 438 862 425 1,220 1,508 1,337 L.C.Vs 11,478 5,128 5,154 6,834 9,817 4,886 8,079 6,656 6,965 4x4 Vehicles 1,324 816 1,310 2,274 792 651 622 380 459 Tractors 17,127 14,907 17,144 16,208 10,417 14,144 26,885 35,038 32,533 Motor Cycle/Scooters/ Rickshaw 95,793 63,958 60,960 121,809 117,188 96,991 93,167 94,881 117,858 Cars 26,945 19,514 20,955 31,079 33,462 33,683 38,682 32,461 39,573IMPORTS (Nos.) Cars 100,188 38,216 31,743 35,100 31,817 36,851 46,363 34,988 62,187 Jeeps 1,484 343 1,535 959 542 1 165 48 338 Motor Rickshaw 2,773 548 250 .. .. 900 8 20 Station Wagon 746 251 326 265 173 143 97 71 115 Buses Including Trolly Buses 2,247 893 267 344 396 498 603 917 588 Lorries/Trucks Includ- ing Ambulance 4,743 2,673 882 1,948 2,101 1,034 443 500 545 special Lorries, Trucks & Vans 535 461 219 102 198 99 152 109 138 Motor Cycle 119,970 86,349 62,100 115,235 135,220 90,435 79,738 85,592 15,771 Scooter 308 3 40 .. .. 7 8 145 - Motorised Cycles 426 26 234 1,305 990 925 44 3 Passengers M. Cars (n.S) 212 88 224 919 338 318 162 161 99 Road Tractors for Trailers 10 27 4 193 340 38 37 7 36 Tractor Agricultural .. 952 10,084 6,805 2,020 1,086 3,281 2,469 55 Tractor Caterpiller .. 3 2 1 6 .. 1 .. Tractor Heavy Duty for const. 115 14 2 .. 14 28 .. 5 13 Tractor Roads .. .. .. .. 8 .. .. 3 25,964 Tractor (NES) 78 115 80 323 179 113 436 1 15 Car's Chassis with Engine 11 1 .. .. 28 2 .. 10 4 Bus etc. Chassis 102 24 48 12 .. .. 277 57 Spl. Truck etc. Chassis .. 26 .. .. .. .. .. .. 4 Rickshaw, Chassis with Engine .. .. .. .. .. .. .. .. 17 Pickup 17,931 6,099 5,751 5,506 5,511 6,314 3,734 3,672 2,703 Delivery Van 22,343 2,823 1,940 1,831 4,851 5,218 3,149 3,379 1,573 Chassis Un-Mounted Motor Vehicles No 457 .. 127 1 194 9 .. .. 62 Bicycle 468 928 9,916 8,303 3,618 7,844 29,218 22,211 14,505 Motor Vehicles for Goods 134 57 43 151 22 18 146 160 ..Passenger Vehicles Public No 17 15 8 27 22 4 61 183 62 Tractor Chassis with Engine .. .. 480 .. .. .. .. .. .... not available (Contd.)
PRODUCTION AND IMPORTS OF MOTOR VEHICLES

TABLE 13.5
Fiscal Year/Type of Vehicles 2001-02 2002-03 2003-04 2004-05 2005-06 2006-07 2006-07 2007-08 PPRODUCTION (Nos.) Trucks 1,141 1,950 2,022 3,204 4,518 4,410 3,266 3,317 Buses 1,099 1,340 1,380 1,762 627 993 627 828 L.C.Vs 8,491 12,174 14,089 23,613 29,581 24,489 13,436 15,652 Tractors 24,331 76,501 36,103 43,746 49,439 54,610 39,568 37,514 Motor Cycle 133,334 176,591 327,446 476,333 752,603 839,224 609,528 780,591 Cars 40,601 62,893 99,263 126,817 163,114 173,271 128,145 123,107IMPORTS (Nos.) Cars 40,079 60,554 88,130 66,338 36,563 202,785 * 153,739 333,887 Jeeps 666 6,010 11,435 5,409 2,108 1,938 * 1,387 201 Motor Rickshaw 101 3 3 15 1,727 1,407 3,870 Station Wagon 165 440 154 37 284 2,857 * 2,802 348 Buses Including Trolly Buses 700 1,230 2,429 411 2,104 652 449 185 Lorries/Trucks Includ- ing Ambulance 728 14,036 2,883 2,616 13,463 16,610 13,171 7,499 special Lorries, Trucks & Vans 157 54 95 1,544 551 573 443 312 Motor Cycle 111,711 143,952 127,861 189,721 167,626 164,078 * 116,132 184,868 Scooter .. .. .. .. .. .. .. .. Motorised Cycles 509 675 4,143 9,472 12,467 7,173 11,517 Passengers M. Cars (n.S) 161 194 243 244 1,587 1,174 897 579 Road Tractors for Trailers 18 122 124 117 498 997 631 1,453 Tractor Agricultural 220 14,000 11,420 6,543 20,769 30,588 22,956 14,628 Tractor Caterpiller 44 1 30 91 12 1 1 1 Tractor Heavy Duty for const. 4 120 219 563 632 845 501 630 Tractor Roads 15,174 1,115 2,104 1,646 2,284 904 713 1,074 Tractor (NES) 115 496 736 2,167 3,378 * 7,213 4,204 13,816 Car's Chassis with Engine 1 .. .. .. .. 6 6 .. Bus etc. Chassis 60 46 164 18 7 24 10 142 Spl. Truck etc. Chassis .. .. .. .. 38 48 16 339 Rickshaw, Chassis with .. Engine 36 10 2 144 315 * 421 * 421 187 Pickup 3,600 5,162 6,857 5,394 23,303 21,898 14,734 16,703 Delivery Van 2,120 471 26 178 2,586 1,583 1,035 7,035 Chassis Un-Mounted 168 .. .. .. .. .. .. .. Motor Vehicles No Bicycle 20,240 37,836 39,894 61,187 52,022 28,509 23,757 23,630 Motor Vehicles for Goods 2 234 511 269 3,844 297 292 20Passenger Vehicles Public No 6 473 721 1,519 5,228 2,123 1,405 763 Tractor Chassis with Engine.. not availableP: Provisional* : Data has been revised according to new codification and introduction, shifting and deleting of new HS code for 2005-06 onwards
PRODUCTION AND IMPORTS OF MOTOR VEHICLES
July - March

TABLE 13.6
Fiscal No of Post Telephones Internet No.of Internet No of MobileYear Offices (000 Nos.) Connections Cities PCO Phones
Urban Rural Total Urban Rural Total (Million) connected *1990-91 1,867 11,546 13,413 195 302 497 1188 .. 3,861 ..1991-92 1,909 11,471 13,380 299 210 509 1461 .. 4,676 ..1992-93 1,983 11,213 13,196 320 210 530 1548 .. 5,618 ..1993-94 1,970 11,315 13,285 327 85 412 1801 .. 6,422 ..1994-95 2,026 11,294 13,320 330 86 416 2126 .. 4,600 ..1995-96 2,092 11,327 13,419 319 104 423 2376 .. 9,410 68,038 1996-97 2,024 11,192 13,216 340 93 433 2558 .. 10,040 135,027 1997-98 2,044 11,250 13,294 356 92 448 2756 0.01 10,071 196,096 1998-99 2,103 10,751 12,854 308 93 401 2861 0.20 10,107 265,614 1999-00 2,103 10,751 12,854 293 91 384 3124 0.50 10,400 306,463 2000-01 2,302 9,932 12,234 293 91 384 3340 0.80 66,968 742,606 2001-02 1,983 10,284 12,267 258 104 362 3656 1.00 97,751 1,698,536 2002-03 1,808 10,446 12,254 239 87 326 4940 1.60 1,350 139,493 2,404,400 2003-04 2,267 9,840 12,107 215 73 288 4460 2.00 1,898 180,901 5,022,908 2004-05 1,831 10,499 12,330 215 77 292 5191 2.10 2,210 217,597 12,771,203 2005-06 1,845 10,494 12,339 .. .. .. 5128 2.40 2,389 353,194 34,506,5572006-07 1,849 10,494 12,343 4806 3.50 2,419 387,490 63,160,874Jul-Mar2006-07 1,845 10,494 12,339 .. .. .. 5,200 2.50 2,444 353,194 55,600,2112007-08 1,849 10,494 12,343 .. .. .. 4,675 3.50 3,008 387,490 82,150,000
Source: (i): Pakistan Post Office(ii): Pakistan Telecommunications Company Ltd
Note : Telegraph offices closed in 2006 (iii): Pakistan Telecommunication Authority
POST AND TELECOMMUNICATIONS
.. Not Available* Included Cardpay Phones
No of Tele-graph Offices