transport canada - child anthropometry - a literatura scan (2007)
TRANSCRIPT

Child Anthropometry:A Literature Scan of National and
International Publications
Submitted to Transport Canada,Road Safety and Motor Vehicle Regulation Directorate

cover photos courtesy of Health Canada and www.howmade.com
Child Anthropometry Literature Scan
Canadian Inst itute of Chi ld Health � Transpor t Canada i
Canadian Institute of Child HealthInstitut canadien de la santé infantile
Child Anthropometry:A Literature Scan of
National and InternationalPublications
March 19, 2007
Submitted to Transport Canada,Road Safety and Motor Vehicle Regulation Directorate
by the Canadian Institute of Child Health

Child Anthropometry Literature Scan
Canadian Inst itute of Chi ld Health � Transpor t Canada iii
Table of ContentsAcknowledgements . . . . . . . . . . . . . . . . . . . . . . . . . . . . . . . . . . . . . . . . . . . . . . . . . . . . . . . . . . . . . . . . . . . . . . . . . . . . . . . . . . . . . . . . . . . . . . . . . . . . . . . . . iv
Executive Summary . . . . . . . . . . . . . . . . . . . . . . . . . . . . . . . . . . . . . . . . . . . . . . . . . . . . . . . . . . . . . . . . . . . . . . . . . . . . . . . . . . . . . . . . . . . . . . . . . . . . . . . . . 1
Background . . . . . . . . . . . . . . . . . . . . . . . . . . . . . . . . . . . . . . . . . . . . . . . . . . . . . . . . . . . . . . . . . . . . . . . . . . . . . . . . . . . . . . . . . . . . . . . . . . . . . . . . . . . . . . 2
Purpose . . . . . . . . . . . . . . . . . . . . . . . . . . . . . . . . . . . . . . . . . . . . . . . . . . . . . . . . . . . . . . . . . . . . . . . . . . . . . . . . . . . . . . . . . . . . . . . . . . . . . . . . . . . . . . . 2
Methods
Search Strategy . . . . . . . . . . . . . . . . . . . . . . . . . . . . . . . . . . . . . . . . . . . . . . . . . . . . . . . . . . . . . . . . . . . . . . . . . . . . . . . . . . . . . . . . . . . . . . . . . . . . . . . . . . 2
Results
Nutritional Status and the Body Sizes of Children . . . . . . . . . . . . . . . . . . . . . . . . . . . . . . . . . . . . . . . . . . . . . . . . . . . . . . . . . . . . . . . . . . . . . . . . . . . . . 3
Child Anthropometry for Restraint System Design . . . . . . . . . . . . . . . . . . . . . . . . . . . . . . . . . . . . . . . . . . . . . . . . . . . . . . . . . . . . . . . . . . . . . . . . . . . . 5
Child Anthropometry for Safety and Injury Prevention . . . . . . . . . . . . . . . . . . . . . . . . . . . . . . . . . . . . . . . . . . . . . . . . . . . . . . . . . . . . . . . . . . . . . . . . 7
Training . . . . . . . . . . . . . . . . . . . . . . . . . . . . . . . . . . . . . . . . . . . . . . . . . . . . . . . . . . . . . . . . . . . . . . . . . . . . . . . . . . . . . . . . . . . . . . . . . . . . . . . . . . . . . . . 8
Types of child anthropometry measurements . . . . . . . . . . . . . . . . . . . . . . . . . . . . . . . . . . . . . . . . . . . . . . . . . . . . . . . . . . . . . . . . . . . . . . . . . . . . . . . 10
Statistical and Sampling Methods . . . . . . . . . . . . . . . . . . . . . . . . . . . . . . . . . . . . . . . . . . . . . . . . . . . . . . . . . . . . . . . . . . . . . . . . . . . . . . . . . . . . . . . . . 12
Conclusion . . . . . . . . . . . . . . . . . . . . . . . . . . . . . . . . . . . . . . . . . . . . . . . . . . . . . . . . . . . . . . . . . . . . . . . . . . . . . . . . . . . . . . . . . . . . . . . . . . . . . . . . . . . . . . 15
Going Forward . . . . . . . . . . . . . . . . . . . . . . . . . . . . . . . . . . . . . . . . . . . . . . . . . . . . . . . . . . . . . . . . . . . . . . . . . . . . . . . . . . . . . . . . . . . . . . . . . . . . . . . . . . . . . 16
Reference List . . . . . . . . . . . . . . . . . . . . . . . . . . . . . . . . . . . . . . . . . . . . . . . . . . . . . . . . . . . . . . . . . . . . . . . . . . . . . . . . . . . . . . . . . . . . . . . . . . . . . . . . . . . . . . 17
Appendix A — Summaries of Most Relevant Publications . . . . . . . . . . . . . . . . . . . . . . . . . . . . . . . . . . . . . . . . . . . . . . . . . . . . . . . . . . . . . . . . . . . . . 19
Record 1 Reliability of anthropometry measurements in the WHO Multicentre Growth Reference Study . . . . . . . . . . . . . . . . . . . . . . . . . . . . 20
Record 2 2000 CDC Growth Charts for the United States: Methods and Development . . . . . . . . . . . . . . . . . . . . . . . . . . . . . . . . . . . . . . . . . . . . . 21
Record 3 Anthropometry Report: height, weight and body dimensions, Nutrition Canada . . . . . . . . . . . . . . . . . . . . . . . . . . . . . . . . . . . . . . . . . 22
Record 4 National Health and Nutrition Examination Survey III: Body Measurements (Anthropometry) . . . . . . . . . . . . . . . . . . . . . . . . . . . 23
Record 5 Secular trends in the body mass index of Canadian children . . . . . . . . . . . . . . . . . . . . . . . . . . . . . . . . . . . . . . . . . . . . . . . . . . . . . . . . . 24
Record 6 Anthropometry Indicators Measurement Guide, USAID . . . . . . . . . . . . . . . . . . . . . . . . . . . . . . . . . . . . . . . . . . . . . . . . . . . . . . . . . . . . . 25
Record 7 Canadian Paediatric Surveillance Report 2005: Lap Belt Syndrome Report, CPC . . . . . . . . . . . . . . . . . . . . . . . . . . . . . . . . . . . . . . . . . 26
Record 8 Child anthropometry for restraint system design . . . . . . . . . . . . . . . . . . . . . . . . . . . . . . . . . . . . . . . . . . . . . . . . . . . . . . . . . . . . . . . . . . . 27
Record 9 Infants and children in the adult world of automobile safety design: pediatric and anatomical considerations for design of child restraints . . . . . . . . . . . . . . . . . . . . . . . . . . . . . . . . . . . . . . . . . . . . . . . . . . . . . . . . . . . . . . . . . . . . . . . . . . . . . . . . . . . . . . . . 28
Record 10 A New Database of Child Anthropometry and Seated Posture for Automotive Safety Applications . . . . . . . . . . . . . . . . . . . . . . . . . . 29
Record 11 Anthropometry of infants, children and youths to age 18 for product safety design . . . . . . . . . . . . . . . . . . . . . . . . . . . . . . . . . . . . . . 31
Record 12 Classroom furniture dimensions and anthropometry measures in primary school . . . . . . . . . . . . . . . . . . . . . . . . . . . . . . . . . . . . . . . 33
Record 13 Influence of knowledge, training and experience of observers on the reliability of anthropometry measurements in children . . 34
Record 14 Measurement and standardization protocols for anthropometry used in the construction of a new international growth reference . . . . . . . . . . . . . . . . . . . . . . . . . . . . . . . . . . . . . . . . . . . . . . . . . . . . . . . . . . . . . . . . . . . . . . . . . . . . . . . . . . . . . . . . . . . . . . . 35
Appendix B — Reference List by Category and Abstracts
Reference List by Subject . . . . . . . . . . . . . . . . . . . . . . . . . . . . . . . . . . . . . . . . . . . . . . . . . . . . . . . . . . . . . . . . . . . . . . . . . . . . . . . . . . . . . . . . 37
Nutritional Status and the Body Sizes of Children . . . . . . . . . . . . . . . . . . . . . . . . . . . . . . . . . . . . . . . . . . . . . . . . . . . . . . . . . . . . . . . . . . . 37
Obesity . . . . . . . . . . . . . . . . . . . . . . . . . . . . . . . . . . . . . . . . . . . . . . . . . . . . . . . . . . . . . . . . . . . . . . . . . . . . . . . . . . . . . . . . . . . . . . . . . . . . . . . 52
Child Anthropometry for Restraint System Design . . . . . . . . . . . . . . . . . . . . . . . . . . . . . . . . . . . . . . . . . . . . . . . . . . . . . . . . . . . . . . . . . . 62
Child Anthropometry for Safety and Injury Prevention . . . . . . . . . . . . . . . . . . . . . . . . . . . . . . . . . . . . . . . . . . . . . . . . . . . . . . . . . . . . . . 65
Training . . . . . . . . . . . . . . . . . . . . . . . . . . . . . . . . . . . . . . . . . . . . . . . . . . . . . . . . . . . . . . . . . . . . . . . . . . . . . . . . . . . . . . . . . . . . . . . . . . . . . . 67
Types of child anthropometry measurements . . . . . . . . . . . . . . . . . . . . . . . . . . . . . . . . . . . . . . . . . . . . . . . . . . . . . . . . . . . . . . . . . . . . . . 74

Child Anthropometry Literature Scan
Canadian Inst itute of Chi ld Health � Transpor t Canada iv
AcknowledgementsThe Canadian Institute of Child Health (CICH) would like to thank Transport Canada for providing financial support to complete this Child Anthropometry Literature Scan.
CICH wishes to acknowledge the hard work and commitment of the members of both the Steering Committee and TechnicalAdvisory Committee who shared their expertise, vision and guidance in the development of the Literature Scan.
Steering Committee Members
Paul Boase, Road Safety Directorate, Transport Canada
Shelley Callaghan, Canadian Institute of Child Health
Regina De La Campa, Canadian Institute of Child Health
Shawna DiFilippo, Child Passenger Safety and Sports &Recreation Programs, Safe Kids Canada
Louise Hanvey, Canadian Nurses Association
Elaine Orrbine, Canadian Association of PaediatricHealth Centres
Ian Pike, British Columbia Injury Research andPrevention Unit
Louise Poulin, CIHR, Institute of Human Development,Child and Youth Health
Maire Sinha, Road Safety Directorate, Transport Canada
Lynne Warda, Injury Prevention Committee, CanadianPaediatric Society
Technical Advisory Committee Members
Barbara Baines, Defect Investigations and Recalls,Transport Canada
Shelley Callaghan, Canadian Institute of Child Health
Aline Chouinard, Evaluation and Data Systems,Transport Canada
Peter Cripton, Department of Mechanical Engineering &Division of Orthopaedic Engineering Research,University of British Columbia
Regina De La Campa, Canadian Institute of Child Health
Jeannine Fraser, Canadian Institute of Child Health
Robin Moore-Orr, Board of Directors, Canadian Instituteof Child Health
Jay Rieger, Standards and Regulations, Transport Canada
Maire Sinha, Road Safety Directorate, Transport Canada
Anne W. Snowdon, Faculty of Nursing, University of Windsor
A special thanks to the CICH Project staff who were directly involved in researching, writing and editing the Literature Scan.
Shelley Callaghan, Project Manager, Canadian Institute of Child Health
Regina De La Campa, Project Coordinator, Canadian Institute of Child Health
Jeannine Fraser, Scientific Advisor, Canadian Institute of Child Health
Design: Blackbird Publications, Communication and Design
Date of Publication: March 2007

Executive SummaryIn 2003 motor vehicle collisions remained the leading cause ofdeath and injury for children of all ages and as many as10,000 children 12 years and under are injured or killed intraffic collisions every year in Canada (CICH e-ParentingNetwork Vehicle Passenger Safety Fact Sheet, 2004). It is importantthat the most appropriate and current data be used to ensurethat car safety seats and restraints provide the best possibleprotection for children according to age, weight, height, seatedheight and other body measurements. Currently, Canada doesnot have a national pediatric surveillance system for collectingchild anthropometry or nutritional data and the last time thisinformation was collected was in 1970–1972.
The lack of current child anthropometry measurement dataraises important technical questions. Can Canada rely on datedanthropometry data? Are the body dimensions of children inthe 1970s still relevant in light of social and economic changesin Canadian society? Should Canada borrow or adopt U.S. orinternational reference anthropometry data? If Canada con-ducted a child anthropometry measurement study, what wouldbe the design/methodological approach?
In light of these important research questions, TransportCanada’s Road Safety and Motor Vehicle Regulation Directorateissued a competitive bid in October 2006, to undertake aCanadian-based child anthropometry measurement study. Theresult of this competitive tendering process was a partnershipwith the Canadian Institute of Child Health (CICH) to conducta demonstration project on child anthropometry measurement.
The project involved four main activities:
a) A review of the types of child anthropometry data that cur-rently exist, in Canada and internationally, and how thisinformation is collected.
b) The identification of effective and reliable methodologiesand protocols to measure children ages 0–12.
c) The assembly of tools, including training, for takingmeasurements and testing the agreed upon methodologyon infants and children in Ottawa area child care centresand after school programs with a diverse socio-economicmix.
d) Preparation of reports that summarize the results of thereview and the demonstration study including recommen-dations on the most accurate measurement protocols andappropriate methodology for collecting consistent, accurate,reliable and comprehensive child anthropometry data at anational level.
This report is the result of the information collected during thereview of the available literature on child anthropometry inCanada and internationally. The methodology for this literaturescan identified the following steps that were integral to theprocess:
1) identification of search terms to focus the literature scan;
2) a broad search of a variety of information sources;
3) establishment of inclusion criteria to ensure high-qualityresults;
4) review and summarization of appropriate articles andother information sources; and,
5) organization of information into a usable format.
The information was compiled under six broad categories:Nutritional Status and the Body Sizes of Children; ChildAnthropometry for Restraint System Design; ChildAnthropometry for Safety and Injury Prevention; Training;Types of Child Anthropometry Measurements; and, Statisticsand Sampling Methods. The scan identified: 64 papers relevantto the Nutritional Status and the Body Sizes of Children(22 studies dealt specifically with childhood obesity issues);15 papers were relevant to Child Anthropometry for RestraintSystem Design; 6 papers on Child Anthropometry for Safetyand Injury Prevention; 21 publications on AnthropometryTraining; and 16 studies on the Types of Child AnthropometryMeasurements. These publications were reviewed for theirStatistics and Sampling Methods and presented in the final category.
A number of issues emerge from the information collected inthis literature review, including: a lack of child anthropometrydata that is current, standardized, reliable and accurate withinCanada and internationally. This is partly due to the fact thataccurate weighing and measuring have three critical compo-nents that need to be met: technique, equipment, and trainedmeasurers. The measuring technique needs to be standardized,
Child Anthropometry Literature Scan
Canadian Inst itute of Chi ld Health � Transpor t Canada 1
the equipment needs to be calibrated and trained measurersneed to be reliable and accurate; this tends to be difficult to doas it is very time consuming and costly.
This scan of child anthropometry publications, availablenationally and internationally, only provides a ‘snapshot’ ofactivities and gaps at the time it was conducted. The publica-tions presented through this scan are diverse in nature, eachlooking at child anthropometry from their own unique per-spective depending on their different priorities (e.g., develop-ment of growth charts, car seats, etc.) and areas of interest.However, through this scan a wealth of information on childanthropometry was gathered and consolidated, making itvery useful to individuals working in the area of childanthropometry.
BackgroundThe Canadian Institute of Child Health (CICH) and TransportCanada’s Road Safety and Motor Vehicle Regulation Directorateare working together to provide the best protection possible toinfants and children in their car and booster seats. In order toassess safety issues related to car and booster seats, reliableinformation on the physical characteristics of Canadian chil-dren and youth is essential.
Information about the size of children in Canada needs to beupdated, as the most recent child anthropometry data was pub-lished in 1980 (Demirijan, 1980). Since then, there have beensignificant societal, health, environmental, and economicchanges in Canada indicating that the physical measurements ofchildren may have changed. This information is essential for carand booster seat manufacturers among other professionals, ascar and booster seat designs need to accommodate the sizes anddimensions of the full age range of children who will use them.
The aim of the project was to 1) develop a methodology to collect anthropometry data on children aged 0–12 in Canadaafter a thorough scan of the national and international scien-tific literature; 2) develop and implement a protocol to pilottest the methodology; 3) make recommendations and proposea methodology for obtaining national data that would be usedin the development of standards and regulations for automo-bile safety devices for safety car seats and restraints for childpassengers.
The project was directed by a Steering Committee and aTechnical Advisory Committee composed of members from theCanadian Association of Paediatric Health Centers, the Instituteof Human Development, Child and Youth Health at theCanadian Institutes of Health Research, the BC Injury andResearch & Prevention Unit, Safe Kids Canada, the CanadianNurses Association, the Faculty of Nursing at the University ofWindsor, the Canadian Paediatric Society, CICH and TransportCanada.
PurposeThe purpose of this report is to present a compilation of childanthropometry studies relevant to the development and implementation of protocols to measure children aged 0–12.The primary objectives of the literature search were to reviewand analyze information related to methods for measuring chil-dren. This was done to determine the best methodology to beused to collect child anthropometry data during the demon-stration phase of this study.
The information presented in this report comes from a reviewand analysis of the available national and international scientif-ic literature. Although every attempt was made to ensure thisscan is as comprehensive as possible, it is important to notethat it is not exhaustive, specifically at the international levelwhere there were a large number of studies that were not rele-vant to the project.
MethodsThe following search strategy was used to collect informationon child anthropometry and child anthropometry data inCanada and around the world.
Search StrategyThe first step of the strategy was to conduct a broad search toidentify key terms in order to learn what types of informationrelating to child anthropometry and child anthropometry stud-ies were available. The idea was to become familiar with meas-urement devices, procedures, sample sizes, statistics andspecialized software that are commonly used or that haveworked in the past. This was accomplished by using Internetsearch engines such as Google and Yahoo.
Child Anthropometry Literature Scan
Canadian Inst itute of Chi ld Health � Transpor t Canada 2
The following search terms and parameters were used duringthis initial search:
Anthropometry; anthropometry studies; Anthropometry +children; Anthropometry + car safety; Anthropometry +restraints; Anthropometry + methods; Anthropometry + tech-niques; Anthropometry + ethics; Anthropometry + best prac-tices; Anthropometry + guidelines; Anthropometry + research;Anthropometry + standards, Anthropometry + measurements,Anthropometry + databases, Anthropometry + statistics;Anthropometry + indices; and, various combinations of these.
Potential sources of information were identified using theabove search terms/parameters and presented to the Steeringand Technical Advisory Committees. The members made rec-ommendations on more specific search terms. This searchprocess identified organizations, associations and collaborativegroups associated with the field of child anthropometry as wellas potential initiatives and research projects.
Published scientific literature was identified through a system-atic search of standard database search engines (PubMed,MedLine, SciFinder, Google scholar, etc.). Material thatappeared relevant was downloaded, requested from the authorsor purchased.
Articles were screened for relevance according to predeter-mined selection criteria based on relevance to the projectobjectives. Additional publications were identified by searchingthe bibliography of already screened articles. Informationdirectly related to the project objectives was selected for reviewand incorporated into this report. Databases of literature weresearched and citations were captured using ReferenceManager™ software for ease in organization. Relevant articlesand information were then categorized, summarized and incor-porated into the main body of this report.
The large amount of information collected was synthesized andorganized into 6 major groups based on categories that becameapparent during the search. The categories were: nutritionalstatus and the body sizes of children; restraint system design;safety and injury prevention; training; relevant child anthro-pometry measurements; and, statistics and sampling strategies.Furthermore, the information collected within each categorywas organized in a table format with the following headings:program focus, geographical focus, program objectives, target
audience, date, training, measurement instruments, data,statistical analysis, summary of measured results, conclusions,problems and limitations and contact information. Some of thestudies, reports or databases overlap between the categoriesselected but this was the most straightforward way to gatherthe information and present it in a format that would be usable.
ResultsThe results information was presented using the six maincategories: Nutritional Status and the Body Sizes of Children,Child Anthropometry for Restraint System Design, ChildAnthropometry for Safety and Injury Prevention, Training,Types of Child Anthropometry Measurements, Statistics andSampling Methods. Appendix A highlights the most relevantstudies under each of the main categories and presents thisinformation in individual table format for quick reference.Appendix B is a collection of abstracts. The abstracts inAppendix B are organized by using the six main categories,described above.
Nutritional Status and the Body Sizes of ChildrenThe scan identified 64 papers relevant to the Nutritional Statusand the Body Sizes of Children, with 22 dealing specificallywith childhood obesity issues (for abstracts see Appendix B).Of these studies the following six studies were considered themost relevant because they explored the area of child anthro-pometry specifically, were population based and describedtheir procedures and techniques in detail. Below please find adescription of these specific studies with detailed tables sum-marized in Appendix A, records 1 to 6.
WHO Multicenter Growth and Reference Study, WHOA few major organizations over the last decades, including theWorld Health Organization (WHO) and the US Center forDisease Control and Prevention (CDC) have ventured into thearea of child anthropometry. Their purpose has been to creategrowth charts to assess the degree to which physiological needsfor growth and development are being met during the life of achild. In 1970, the first growth reference standard was recom-mended for international use by the National Centre for HealthStatistics (NCHS) and WHO. However, in the early 1990’s agroup of experts selected to evaluate this international growth
Child Anthropometry Literature Scan
Canadian Inst itute of Chi ld Health � Transpor t Canada 3
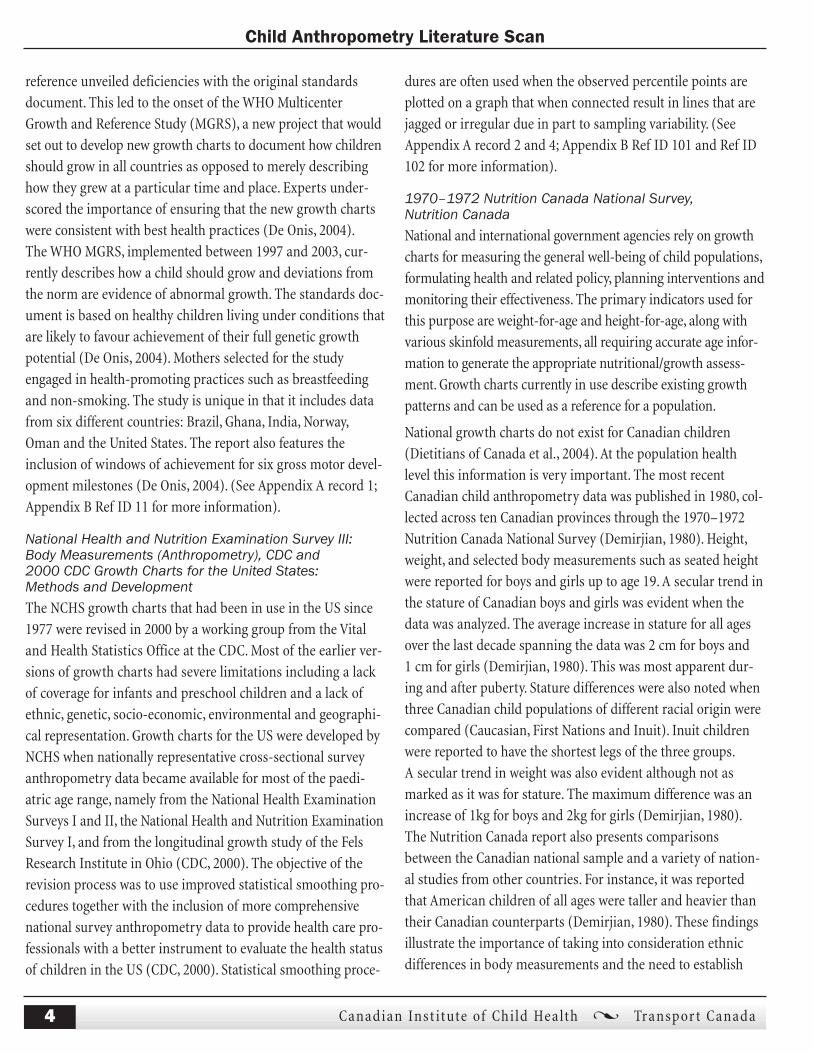
reference unveiled deficiencies with the original standardsdocument. This led to the onset of the WHO MulticenterGrowth and Reference Study (MGRS), a new project that wouldset out to develop new growth charts to document how childrenshould grow in all countries as opposed to merely describinghow they grew at a particular time and place. Experts under-scored the importance of ensuring that the new growth chartswere consistent with best health practices (De Onis, 2004).The WHO MGRS, implemented between 1997 and 2003, cur-rently describes how a child should grow and deviations fromthe norm are evidence of abnormal growth. The standards doc-ument is based on healthy children living under conditions thatare likely to favour achievement of their full genetic growthpotential (De Onis, 2004). Mothers selected for the studyengaged in health-promoting practices such as breastfeedingand non-smoking. The study is unique in that it includes datafrom six different countries: Brazil, Ghana, India, Norway,Oman and the United States. The report also features theinclusion of windows of achievement for six gross motor devel-opment milestones (De Onis, 2004). (See Appendix A record 1;Appendix B Ref ID 11 for more information).
National Health and Nutrition Examination Survey III:Body Measurements (Anthropometry), CDC and 2000 CDC Growth Charts for the United States: Methods and DevelopmentThe NCHS growth charts that had been in use in the US since1977 were revised in 2000 by a working group from the Vitaland Health Statistics Office at the CDC. Most of the earlier ver-sions of growth charts had severe limitations including a lackof coverage for infants and preschool children and a lack ofethnic, genetic, socio-economic, environmental and geographi-cal representation. Growth charts for the US were developed byNCHS when nationally representative cross-sectional surveyanthropometry data became available for most of the paedi-atric age range, namely from the National Health ExaminationSurveys I and II, the National Health and Nutrition ExaminationSurvey I, and from the longitudinal growth study of the FelsResearch Institute in Ohio (CDC, 2000). The objective of therevision process was to use improved statistical smoothing pro-cedures together with the inclusion of more comprehensivenational survey anthropometry data to provide health care pro-fessionals with a better instrument to evaluate the health statusof children in the US (CDC, 2000). Statistical smoothing proce-
dures are often used when the observed percentile points areplotted on a graph that when connected result in lines that arejagged or irregular due in part to sampling variability. (SeeAppendix A record 2 and 4; Appendix B Ref ID 101 and Ref ID102 for more information).
1970–1972 Nutrition Canada National Survey, Nutrition CanadaNational and international government agencies rely on growthcharts for measuring the general well-being of child populations,formulating health and related policy, planning interventions andmonitoring their effectiveness. The primary indicators used forthis purpose are weight-for-age and height-for-age, along withvarious skinfold measurements, all requiring accurate age infor-mation to generate the appropriate nutritional/growth assess-ment. Growth charts currently in use describe existing growthpatterns and can be used as a reference for a population.
National growth charts do not exist for Canadian children(Dietitians of Canada et al., 2004). At the population healthlevel this information is very important. The most recentCanadian child anthropometry data was published in 1980, col-lected across ten Canadian provinces through the 1970–1972Nutrition Canada National Survey (Demirjian, 1980). Height,weight, and selected body measurements such as seated heightwere reported for boys and girls up to age 19. A secular trend inthe stature of Canadian boys and girls was evident when thedata was analyzed. The average increase in stature for all agesover the last decade spanning the data was 2 cm for boys and1 cm for girls (Demirjian, 1980). This was most apparent dur-ing and after puberty. Stature differences were also noted whenthree Canadian child populations of different racial origin werecompared (Caucasian, First Nations and Inuit). Inuit childrenwere reported to have the shortest legs of the three groups.A secular trend in weight was also evident although not asmarked as it was for stature. The maximum difference was anincrease of 1kg for boys and 2kg for girls (Demirjian, 1980).The Nutrition Canada report also presents comparisonsbetween the Canadian national sample and a variety of nation-al studies from other countries. For instance, it was reportedthat American children of all ages were taller and heavier thantheir Canadian counterparts (Demirjian, 1980). These findingsillustrate the importance of taking into consideration ethnicdifferences in body measurements and the need to establish
Child Anthropometry Literature Scan
Canadian Inst itute of Chi ld Health � Transpor t Canada 4

national standards for each country (See Appendix A record 3;Appendix B Ref ID 68 for more information).
Secular trends in the body mass index of Canadian chil-dren, Tremblay et al.Since the publication of the Nutrition Canada report in 1980,there have been significant societal, health, environmental, andeconomic changes in Canada indicating that the physical meas-urements of children may have changed. For example, theprevalence of overweight and obesity in school-aged childrenhas increased significantly in recent years (Tremblay, M.S. et al.,2000; Janssen, I. et al., 2004; Veuglers, P.J. et al., 2005; Willms,J.D. et al., 2005). In 2004 it was reported that 18% of childrenand youth were overweight and 8% were deemed obese(Canadian Institute for Health Information, 2004). Similar rateshave been reported for preschool children, suggesting similartrends of overweight and obesity in early childhood (Canning,P.M., et al. 2004; Willms, J.D. et al., 2004; Flynn, M.A., 2005;He, M. et al., 2004). In addition, there has also been a change inpatterns of immigration to Canada. New immigrants are mostnotably from China, India and the Philippines; 20% of theCanadian population is now from visible minorities.(www.clbc.ca/files/ Reports/IHB_section_a.pdf). A study byLin, Y.C. et al., (2004) presents comparisons of ethnic differ-ences in anthropometry characteristics among four Asian peo-ples (Chinese, Japanese, Korean and Taiwanese). The means of33 body dimensions and 31 bodily proportions are presented.The results show that there is a significant morphological dif-ference among these groups of people in the same region. Thishighlights the need to investigate ethnic diversity as related tobodily dimensions and proportions. (See Appendix A record 5;Appendix B Ref ID 62 for more information).
Guide for Anthropometry Indicator Measurements, USAIDIn 2003, the US Agency for International Development (USAID)developed a complete guide for Anthropometry IndicatorMeasurements as part of a series of reports prepared by theFood and Nutrition Technical Assistance Project (FANTA).USAID provides support for the development of monitoringand evaluation systems for developing countries. The guide isintended to provide the technical basis for the indicators andthe recommended method for collecting, analyzing and reporting on the indicators (Cogill, B. 2003). The guide providesinformation on the impact indicators of child malnutrition:
decreased percent of stunted children and decreased percent ofunderweight children, as well as on monitoring indicators ofchild malnutrition: increased percent of eligible children ingrowth monitoring/promotion and increased percent of chil-dren in growth promotion program gaining weight in the pastthree months. (See Appendix A record 6; Appendix B Ref ID 8for more information).
Child Anthropometry for Restraint System DesignThe scan identified 15 papers relevant to Child Anthropometryfor Restraint System Design (for abstracts see Appendix B).Of these studies the following six studies were considered themost relevant because researchers have noted the importanceof recognizing the marked differences between a child’s bodydimensions, proportions and biomechanical properties in addi-tion to those of adults. In particular, the infant and child differstructurally from the adult in a number of ways that are criticalto the design of products aimed to protect against impactforces. Below is a description of these specific studies withdetailed tables summarized in Appendix A.
Canadian Paediatric Surveillance Report 2005: Lap Belt Syndrome Report, CPSIn 2003 motor vehicle collisions remained the leading cause ofdeath and injury for children of all ages and as many as10,000 children 12 years and under are injured or killed intraffic collisions every year in Canada (CICH e-ParentingNetwork Vehicle Passenger Safety Fact Sheet, 2004). There is aneed to ensure that infant and children’s safety car seats areproperly installed and used. The 1996–2005 CanadianPaediatric Surveillance Program (Cyr et al., 2005) reports thatat least 28 children in Canada (ages 4 to 12) suffered from lap-belt syndrome over a 24-month period. Lap-belt syndromerefers to injuries to the abdominal viscera and to the lumbarspine associated with seat-belt restraints (Cyr et al., 2005).These injuries are caused by the rapid deceleration characteris-tics of high-impact crashes, resulting in sudden flexion of theupper body around the fixed lap belt compressing on theabdominal viscera between the lap belt and the spine. Childrenare especially vulnerable to these injuries. Their organs are lessprotected by the thorax and pelvis, they have a lower centre ofgravity, and their iliac crests are less developed than those of
Child Anthropometry Literature Scan
Canadian Inst itute of Chi ld Health � Transpor t Canada 5

adults, allowing the belt to ride up over the abdomen (Cyret al., 2005). The authors report that only 4 out of the 28 chil-dren injured in this study were adequately restrained accordingto their age. When children outgrow their child safety seats, theuse of seat belts designed for adults is not an acceptable alter-native for booster seats (Cyr et al., 2005).
As more provinces/territories move to legislation requiring theuse of booster seats in automobiles, the design, effectivenessand comfort of booster seats will become a greater concern.Currently, infant car seats, carriers and booster seats have beendesigned based on research and crash impact studies. Thisequipment is meant to best protect the child at each physicalstage of development, related body strength and vulnerabilities.For instance, back-facing car seats with the appropriate reclineare used in younger infants with padded harness straps torestrain the child.1 Effective April 2007 an interim order hasbeen brought in to all stage II CRS to 65lbs. Please visitTransport Canada’s website for more information.
Product manufacturers provide information on the use of theirproduct according to weight and standing height, or the heightof the child’s head on the seat or location of the shoulders inrelationship to the harness. Information is needed on the rela-tionship between seated height and stature, seated height andweight and seated height and age, together with an understand-ing of developmental stages of children so that this informationcan be incorporated into safety regulations as well as safetydevices. Only in Quebec is a child’s seated height used to deter-mine the transition point from the use of a booster seat tousing a seat belt (Cyr et al., 2005). (See Appendix A record 7;Appendix B Ref ID 115 for more information). Ontario usesstanding height because no agreement has been reached onaverages by age.
Child anthropometry for restraint system design,University of MichiganThe University of Michigan funded a study to allow for a com-pilation of a database of child anthropometry measurementsfor restraint system design (Weber, 1985). The purpose of the
report was to present all available measurements that were like-ly to be of interest to the restraints designer in one singlesource. Because measurement procedures were as consistent aspossible among the studies, raw data for the same measureswere combined and are displayed as single data sets. Datatables and scatter plots are presented (scatter plots are truncat-ed at age 10) for child dimensions from 0–10 years. This reportis limited in that it only incorporates measurements taken bythe researchers at the University of Michigan between 1975 and1985. (See Appendix A record 8; Appendix B Ref ID 89 for moreinformation).
Description and Performance of the Hybrid III 3 year-old,6 year-old and small female test dummies in restraint sys-tem and out-of-position air bag environments, NationalHighway Traffic Safety Administration and TransportationResearch Center Inc.In 1987, with the introduction of air bags into the market andforeseeing the need for assessing the safety benefits for all sizesof vehicle occupants, the CDC funded a study on the develop-ment of a multi-sized Hybrid III-Based dummy family (Saulet al, 1997). Recognizing the need for dummies with improvedbiofidelity and extended measuring capability and capacity toevaluate the safety of children, CDC provided additional fundingin 1989 to develop a design foundation for the Hybrid III-typechild size dummies. The Society of Automotive Engineers (SAE),through its Hybrid III Dummy Family Task Group and later, alsothrough the Dummy Testing Equipment Subcommittee, has con-tinued the development work resulting in the construction ofprototype Hybrid III-type 5th percentile female, 95th percentilemale, six-year-old, three-year-old, and CRABI 12-month-olddummies. These families of dummies are used by car andbooster seat manufacturers and researchers to design and testchild restrain systems. (See Appendix B Ref ID 113 for moreinformation). The dummies are a world SID ATD whichTransport Canada helped to create.
Infants and children in the adult world of automobilesafety design: pediatric and anatomical considerationsfor design of child restraints, Burdi et al.A child’s body dimensions, proportions and biomechanicalproperties are markedly different from that of an adult.Consequently, for design purposes, a child cannot be simplyconsidered a scaled-down adult (Burdi, 1969). Protection ofchildren against impact forces, notably occupant restraint sys-
Child Anthropometry Literature Scan
Canadian Inst itute of Chi ld Health � Transpor t Canada 6
1 Rear-facing seats are encouraged until the child is as heavy as 30–35 lbs. and atleast one year of age to reduce the risk of spinal cord injury. These seats have theeffect of spreading the impact force over the baby’s entire back, neck and head toprotect the spine. This is in recognition of the baby’s larger and heavier head size inrelation to their bodies, low-neck strength, soft bones and loose ligaments.
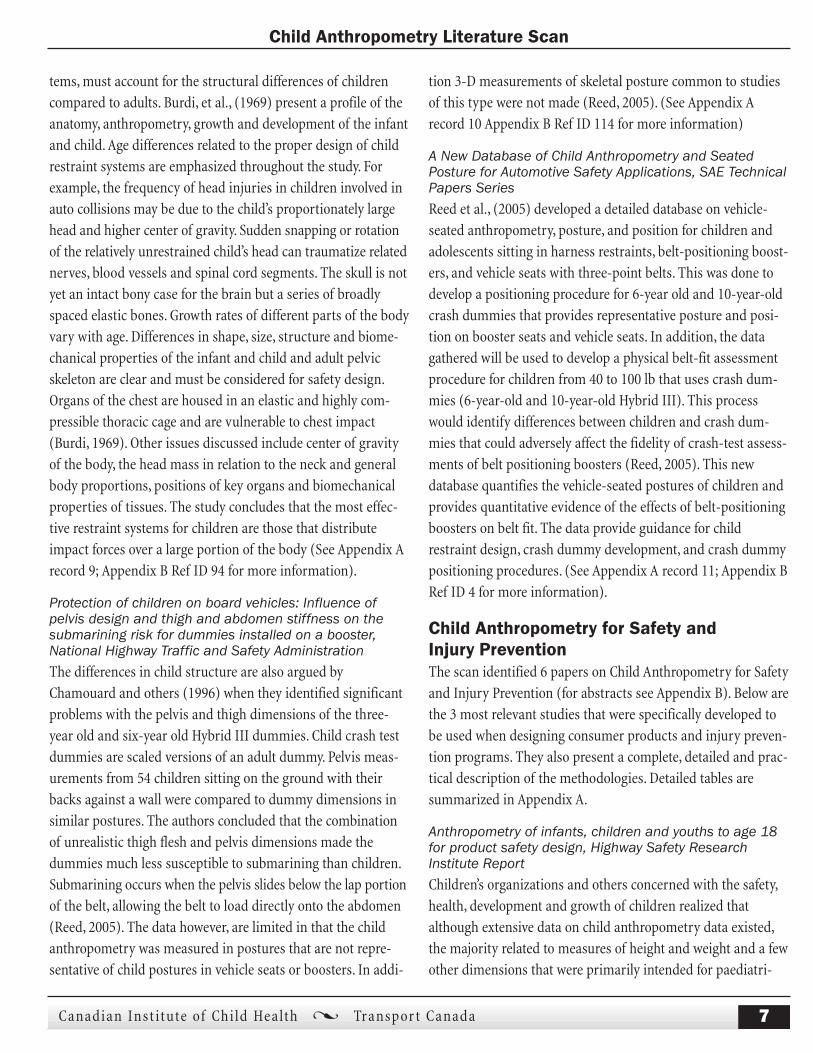
tems, must account for the structural differences of childrencompared to adults. Burdi, et al., (1969) present a profile of theanatomy, anthropometry, growth and development of the infantand child. Age differences related to the proper design of childrestraint systems are emphasized throughout the study. Forexample, the frequency of head injuries in children involved inauto collisions may be due to the child’s proportionately largehead and higher center of gravity. Sudden snapping or rotationof the relatively unrestrained child’s head can traumatize relatednerves, blood vessels and spinal cord segments. The skull is notyet an intact bony case for the brain but a series of broadlyspaced elastic bones. Growth rates of different parts of the bodyvary with age. Differences in shape, size, structure and biome-chanical properties of the infant and child and adult pelvicskeleton are clear and must be considered for safety design.Organs of the chest are housed in an elastic and highly com-pressible thoracic cage and are vulnerable to chest impact(Burdi, 1969). Other issues discussed include center of gravityof the body, the head mass in relation to the neck and generalbody proportions, positions of key organs and biomechanicalproperties of tissues. The study concludes that the most effec-tive restraint systems for children are those that distributeimpact forces over a large portion of the body (See Appendix Arecord 9; Appendix B Ref ID 94 for more information).
Protection of children on board vehicles: Influence ofpelvis design and thigh and abdomen stiffness on thesubmarining risk for dummies installed on a booster,National Highway Traffic and Safety AdministrationThe differences in child structure are also argued byChamouard and others (1996) when they identified significantproblems with the pelvis and thigh dimensions of the three-year old and six-year old Hybrid III dummies. Child crash testdummies are scaled versions of an adult dummy. Pelvis meas-urements from 54 children sitting on the ground with theirbacks against a wall were compared to dummy dimensions insimilar postures. The authors concluded that the combinationof unrealistic thigh flesh and pelvis dimensions made the dummies much less susceptible to submarining than children.Submarining occurs when the pelvis slides below the lap portionof the belt, allowing the belt to load directly onto the abdomen(Reed, 2005). The data however, are limited in that the childanthropometry was measured in postures that are not repre-sentative of child postures in vehicle seats or boosters. In addi-
tion 3-D measurements of skeletal posture common to studiesof this type were not made (Reed, 2005). (See Appendix Arecord 10 Appendix B Ref ID 114 for more information)
A New Database of Child Anthropometry and SeatedPosture for Automotive Safety Applications, SAE TechnicalPapers SeriesReed et al., (2005) developed a detailed database on vehicle-seated anthropometry, posture, and position for children andadolescents sitting in harness restraints, belt-positioning boost-ers, and vehicle seats with three-point belts. This was done todevelop a positioning procedure for 6-year old and 10-year-oldcrash dummies that provides representative posture and posi-tion on booster seats and vehicle seats. In addition, the datagathered will be used to develop a physical belt-fit assessmentprocedure for children from 40 to 100 lb that uses crash dum-mies (6-year-old and 10-year-old Hybrid III). This processwould identify differences between children and crash dum-mies that could adversely affect the fidelity of crash-test assess-ments of belt positioning boosters (Reed, 2005). This newdatabase quantifies the vehicle-seated postures of children andprovides quantitative evidence of the effects of belt-positioningboosters on belt fit. The data provide guidance for childrestraint design, crash dummy development, and crash dummypositioning procedures. (See Appendix A record 11; Appendix BRef ID 4 for more information).
Child Anthropometry for Safety andInjury PreventionThe scan identified 6 papers on Child Anthropometry for Safetyand Injury Prevention (for abstracts see Appendix B). Below arethe 3 most relevant studies that were specifically developed tobe used when designing consumer products and injury preven-tion programs. They also present a complete, detailed and prac-tical description of the methodologies. Detailed tables aresummarized in Appendix A.
Anthropometry of infants, children and youths to age 18for product safety design, Highway Safety ResearchInstitute ReportChildren’s organizations and others concerned with the safety,health, development and growth of children realized thatalthough extensive data on child anthropometry data existed,the majority related to measures of height and weight and a fewother dimensions that were primarily intended for paediatri-
Child Anthropometry Literature Scan
Canadian Inst itute of Chi ld Health � Transpor t Canada 7

cians. While the information could assist in the identification ofhealth trends, dietary requirements and supplements, it waslimited for the development of consumer products and injuryprevention programs. Comprehensive, specific and functionalchild anthropometry data for consumer product design wasnon-existent until 1975 when the Consumer Product SafetyCommission and the National Bureau of Standards of the USAcommissioned a study to look at the physical characteristics ofchildren as related to death and injury for consumer productdesign and use. As a result, many of the measurements takenduring the study represented new information needed for thedirect application to specific child safety problem areas. Forexample, infant buttock depth was determined to be the mostcritical measurement for the application to safe crib-slat inter-face design; crotch height was useful for bicycle frame heightdetermination and minimum hand clearance is a unique dimen-sion needed for determining what size openings a child orinfant can squeeze a hand through (Snyder, 1977). For thisstudy new measurement tools were designed, fabricated, testedand developed in order to ensure accurate and reproduciblemeasurements of infants and children. The project continuedin 1977 in order to expand on the database. This child anthro-pometric database represents one of the most comprehensivesources of anthropometric information for child product safetyapplications. (See Appendix A record 11; Appendix B Ref ID 85for more information).
Anthropometry data of children for non-specialist users,Steenbekkers et al.In a pilot study conducted by Steenbekkers et al. (1990),33 anthropometry variables were measured on 633 childrenaged 0–5½ years. The variables for the measurements werechosen on the basis of international standards and on theresults of preliminary data analysis of child injuries. This studyfocuses on two specific applications: anthropometry aspects ofcurrent regulations for cribs, playpens and toys and anthro-pometry aspects in the selection of wheelchairs for children.The paper concludes with a discussion on how to presentanthropometry data for non-special users (Steenbekkers,1990). (See Appendix B Ref ID 78 for more information).
Classroom furniture dimensions and anthropometrymeasures in primary school, Panagiotopoulou et al.Several studies compare students’ dimensions to the dimensionof school furniture and determine whether this type of furni-ture is well-designed and promotes good sitting posture.(Knight, 1991; Linton, 1994; Evans, 1998; Balague, 2003).In Greece, a total of 180 (90 male and 90 female) students fromthree primary schools, aged seven to 12 years were measuredfor: stature, elbow height, shoulder height, upper arm length,knee height, popliteal height and buttock–popliteal length. Inaddition, the dimensions were measured for four differenttypes of chairs and five types of desks used in classrooms.Finally, the anthropometry measures of the students and thefurniture dimensions were compared in order to identify anyincompatibility between them. The data indicated a mismatchbetween the students’ bodily dimensions and the classroomfurniture available to them. The chairs were too high and toodeep and desks were also too high for the students. This situa-tion has negative effects on the sitting posture of the childrenespecially when reading and writing. (Panagiotopoulou, 2004)(See Appendix A record 12; Appendix B Ref ID 86 for moreinformation).
TrainingThe scan identified 21 publications on anthropometry training(for abstracts see Appendix B). Of these studies the followingsix studies were considered the most relevant because stan-dardized methods for training measurers and for collectinganthropometry data were utilized. Below are the details of thesespecific studies with complete abstracts found in Appendix Aand B.
International Standards for Anthropometry Assessment, ISAKAnthropometry similar to any other area of science depends onthe measurer’s compliance to particular rules of measurementas determined by the national and international standard bod-ies. Over the years, anthropometry has followed several tradi-tions or schools of thought. As a result there has been a lack ofstandardization across the field, especially with regard to theidentification of measuring sites or anatomical landmarks andin measurement techniques. This makes comparisons acrosstime very difficult and in turn, the data become specific to theuser (Marfell-Jones, et al. 2006).
Child Anthropometry Literature Scan
Canadian Inst itute of Chi ld Health � Transpor t Canada 8

Child anthropometry measurements comprise a series ofnoninvasive, inexpensive, and easy-to-perform methods forestimating body composition. However, they are operatordependent and to be useful they must be performed in a pre-cise, standardized, and reproducible manner. Research recom-mends that any individual who performs the measurementsshould first undergo training to increase precision and skill.Without such training, considerable variance will occur bothwithin and between observers in obtaining and interpreting themeasurements. Standardized methods for collecting anthro-pometry data are available and should be utilized (Marfell-Jones, et al. 2006). (See Appendix B Ref ID 123 for moreinformation).
Teaching modules, US Department of Health and Human ServicesWith the revision of the CDC Growth Charts in 2000, pediatrichealth care providers were in need to re-evaluate the tools theyused and the approach in their clinical settings for the meas-urement of child anthropometry data. The US Department ofHealth and Human Services (2006) developed a series of teach-ing modules focusing on the techniques for measuring andrecording infant length, weight, and head circumference andthe techniques for obtaining and recording weight and staturefor children and adolescents. The information in the modules isintended for the measurement of typically developing children.The modules present the importance of reliable and accuratemeasurements, the equipment used, techniques and growthchart interpretation information. (See Appendix B Ref ID 64 formore information).
Influence of knowledge, training and experience ofobservers on the reliability of anthropometry measure-ments in children, Vegelin, et al.Several studies have investigated the impact of the measurer’slevel of technical knowledge, training and experience withmeasuring on the reliability of child anthropometry measure-ments. Despite instructions and encouraging careful measure-ments, these factors often significantly affect measurementsand lead to interpretation difficulties, especially of short-termgrowth data. In 2003, Vegelin et al., designed a study where across-sectional study of 18 children, aged 2–7 years, weremeasured in duplicate by 12 observers with different back-grounds and levels of experience, protocol knowledge and pro-
tocol training (Vegelin, 2003). The main outcome measures,precision and accuracy, were expressed as technical error ofmeasurement and average bias in comparison with an expertanthropometrist. As expected, the best educated and mostexperienced observers scored the best precision and accuracy(Vegelin, 2003). A practical training course of only a few hoursdoes not seem to improve reliability significantly. To get a morereliable insight in growth of a child it is important to be awareof the influence on measurement outcome values of protocolknowledge and years of experience. Growth studies should usedetailed anthropometry standardization protocols and trainpeople to acquire better insight into these protocols. (Vegelin,2003). (See Appendix A record 13; Appendix B Ref ID 25 formore information).
Measurement and standardization protocols for anthro-pometry used in the construction of a new internationalgrowth reference, WHO Multicentre Growth ReferenceStudy, WHOThe WHO Multicentre Growth Reference Study (MGRS) (2004)was undertaken to generate new growth curves for assessingthe growth and development of infants and young childrenfrom around the world. Appropriate training and continuedstandardization, adherence to specified methods and proce-dures, and monitoring of data quality were essential to reducemeasurement error and minimize bias in multi-site studies. Allcandidates received standardized training, and only those whomet the MGRS performance criteria were retained for the study.The measurement procedures and training guidelines were pre-pared by the MGRS Coordinating Centre at WHO in Geneva,based on best practices recommended in anthropometry manu-als and in the literature. The initial training of anthropometristsat each site was carried out by an experienced anthropometristfollowing the procedures detailed in the MGRS protocol. Allanthropometrists were trained to interview mothers, completethe study questionnaires, measure children as described in theprotocol, avoid digit preference or transposition of numbers,record measurement values immediately after reading them,and write legibly to reduce mistakes during data transfer. Strictadherence to the measuring techniques and recording proce-dures was emphasized throughout the study. (See Appendix Arecord 14; Appendix B Ref ID 11 for more information).
Child Anthropometry Literature Scan
Canadian Inst itute of Chi ld Health � Transpor t Canada 9
Reliability of three length measurement techniques interm infants, Johnson et al.A study of two experienced nurses described and compared theintra- and inter-examiner reliability of three length measure-ment techniques and to determine if the three measurementtechniques yield significantly different measurements. Thenurses obtained length measurements using the supine, paperbarrier, and auto-length measurement techniques twice eachfrom 48 healthy term infants. The nurses were blind to theirown and to each other’s measurements. The differencesbetween length measurements by individual examiners andpairs of examiners are relatively large. Clinicians should beaware of the magnitude of error in length measurements andshould interpret length measurements with caution. Thesefindings also demonstrate that all clinicians in any settingshould use the same technique to obtain length measurements.(Johnson, 1999). (See Appendix A; Appendix B Ref ID 99 formore information).
Child factor in measurement dependability, Lampl et al.A primary consideration in longitudinal growth studies is theidentification of growth from error components. While previ-ous research has considered matters of measurement accuracyand reproducibility in detail, few reports have investigated theerrors of measurement due to aspects of the physiology andcooperation of the child. In a study by Lampl et al (2001) theresearchers directly assess this source of measurement unde-
pendability for the first time. Investigation of total measure-ment error variance in 925 recumbent length replicates takenover stasis intervals in growth identifies that between 60% and70% of total measurement unreliability is due to child factorundependability. Individual differences are significant and lon-gitudinal growth analyses should consider two to three timesthe technical error of measurement statistic as a reasonableestimate of the total unreliability for any single measurement ofan infant’s recumbent length (Lampl, 2001). (See Appendix BRef ID 20 for more information).
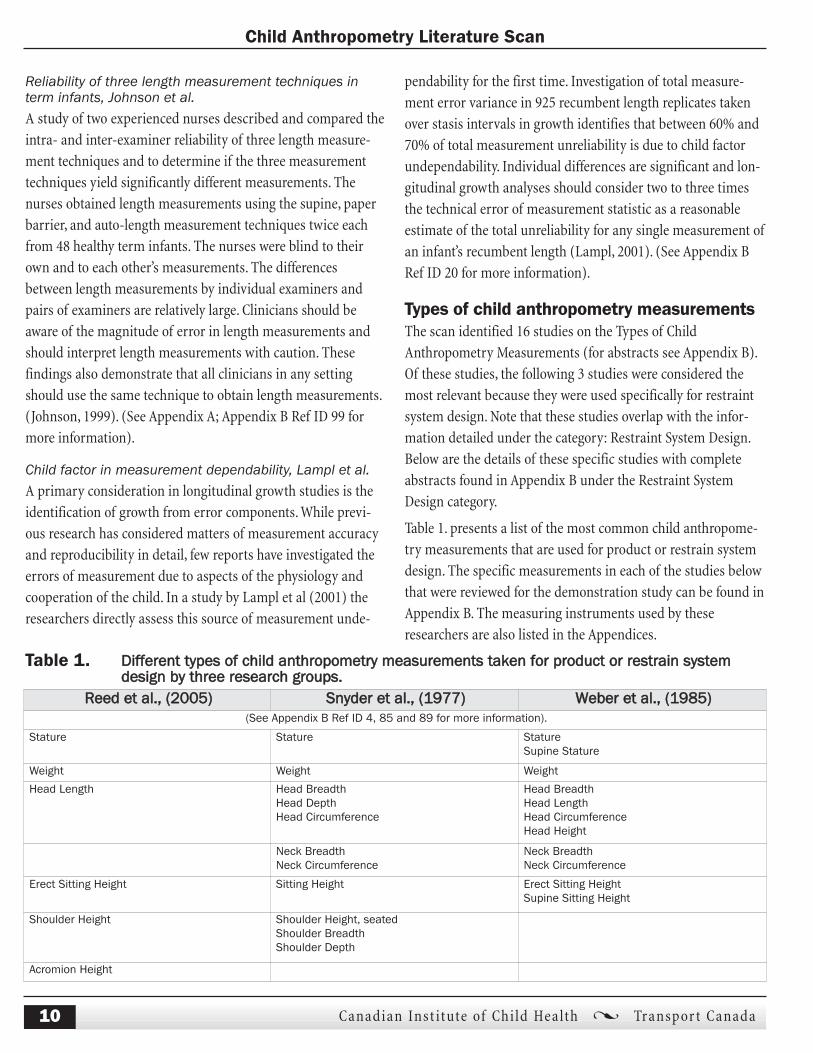
Types of child anthropometry measurementsThe scan identified 16 studies on the Types of ChildAnthropometry Measurements (for abstracts see Appendix B).Of these studies, the following 3 studies were considered themost relevant because they were used specifically for restraintsystem design. Note that these studies overlap with the infor-mation detailed under the category: Restraint System Design.Below are the details of these specific studies with completeabstracts found in Appendix B under the Restraint SystemDesign category.
Table 1. presents a list of the most common child anthropome-try measurements that are used for product or restrain systemdesign. The specific measurements in each of the studies belowthat were reviewed for the demonstration study can be found inAppendix B. The measuring instruments used by theseresearchers are also listed in the Appendices.
Child Anthropometry Literature Scan
Canadian Inst itute of Chi ld Health � Transpor t Canada 10
Reed et al., (2005) Snyder et al., (1977) Weber et al., (1985)(See Appendix B Ref ID 4, 85 and 89 for more information).
Stature Stature StatureSupine Stature
Weight Weight Weight
Head Length Head BreadthHead DepthHead Circumference
Head BreadthHead LengthHead CircumferenceHead Height
Neck BreadthNeck Circumference
Neck BreadthNeck Circumference
Erect Sitting Height Sitting Height Erect Sitting HeightSupine Sitting Height
Shoulder Height Shoulder Height, seatedShoulder BreadthShoulder Depth
Acromion Height
Table 1. Different types of child anthropometry measurements taken for product or restrain system design by three research groups.

Child Anthropometry Literature Scan
Canadian Inst itute of Chi ld Health � Transpor t Canada 11
Reed et al., (2005) Snyder et al., (1977) Weber et al., (1985)Knee Height Knee Height
Bideltoid Breadth
Biacromial Breadth Biacromial BreadthShoulder BreadthClavicale-Acromiun LengthAcromiun-Radial LengthRadial-Stylion Length
Thigh Breadth, seatedThigh Breadth, standingThigh Depth, seated
Thigh Breadth, seatedThigh ClearanceUpper Thigh CircumferenceUpper Thigh Depth
Tibial HeightCalf CircumferenceCalf Circumference HeightCalf Depth
Gluteal Furrow Height
Hip Breadth Hip breadth, seated Hip breadth, seatedHip Height at ButtocksHip CircumferenceHip Breadth at TrochanterIliocristale HeightIliospinale Height
Shoulder-Elbow Length Shoulder-Elbow Length Shoulder-Elbow Length
Elbow-Fingertip Length Elbow-Fingertip Length Elbow-Hand Length
Buttock-Knee Length Buttock-Knee Length
Chest DepthChest Width
Chest BreadthChest DepthChest Circumference
Chest BreadthChest DepthChest CircumferenceChest Height
Abdomen DepthAbdomen Width
Abdominal depth, seated
Waist BreadthWaist Circumference
Waist BreadthWaist CircumferenceWaist Height
Crotch Height
Rump-sole LengthRump-knee Length
Knee-sole Length
Upper Arm CircumferenceUpper Arm LengthForearm CircumferenceForearm Breadth
Table 1. (continued)
Statistics and Sampling MethodsThe publications mentioned in the above categories werereviewed for their Statistics and Sampling Methods and presentedin this final category are the 5 publications with the most detailon sampling strategy and statistical analysis. Below are the detailsof these specific studies with complete abstracts found inAppendix A, records 3, 11, 4, 6 and 14.
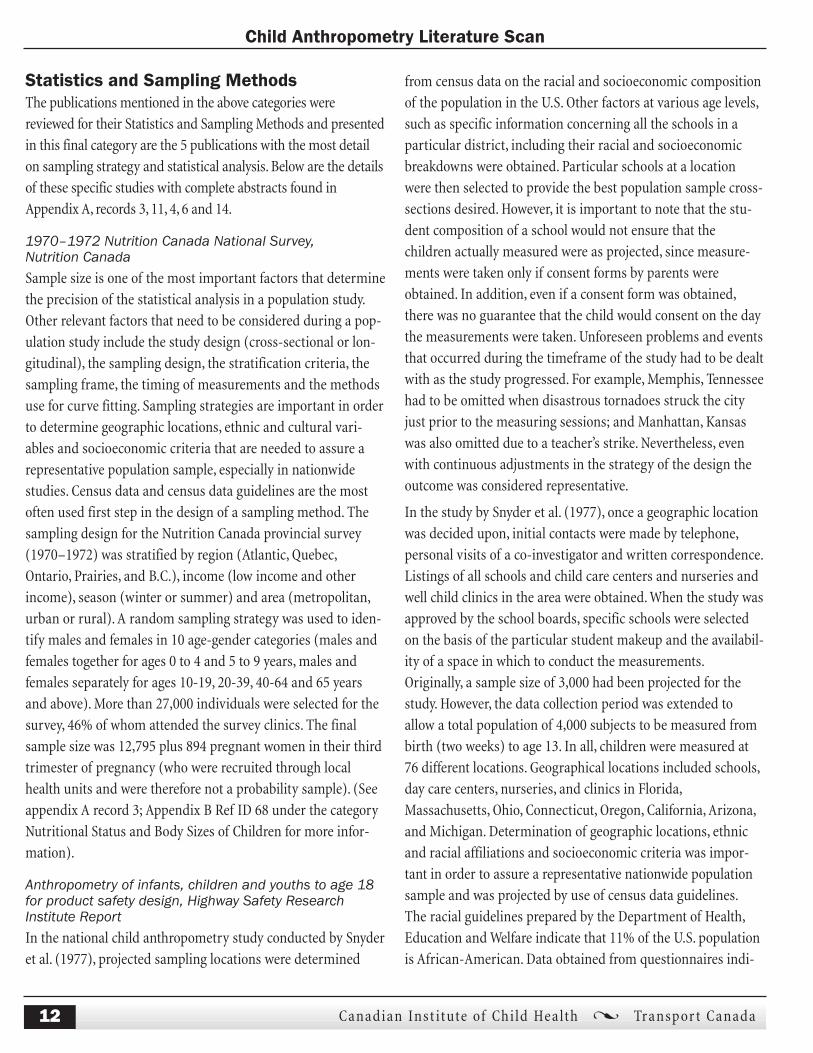
1970–1972 Nutrition Canada National Survey, Nutrition CanadaSample size is one of the most important factors that determinethe precision of the statistical analysis in a population study.Other relevant factors that need to be considered during a pop-ulation study include the study design (cross-sectional or lon-gitudinal), the sampling design, the stratification criteria, thesampling frame, the timing of measurements and the methodsuse for curve fitting. Sampling strategies are important in orderto determine geographic locations, ethnic and cultural vari-ables and socioeconomic criteria that are needed to assure arepresentative population sample, especially in nationwidestudies. Census data and census data guidelines are the mostoften used first step in the design of a sampling method. Thesampling design for the Nutrition Canada provincial survey(1970–1972) was stratified by region (Atlantic, Quebec,Ontario, Prairies, and B.C.), income (low income and otherincome), season (winter or summer) and area (metropolitan,urban or rural). A random sampling strategy was used to iden-tify males and females in 10 age-gender categories (males andfemales together for ages 0 to 4 and 5 to 9 years, males andfemales separately for ages 10-19, 20-39, 40-64 and 65 yearsand above). More than 27,000 individuals were selected for thesurvey, 46% of whom attended the survey clinics. The finalsample size was 12,795 plus 894 pregnant women in their thirdtrimester of pregnancy (who were recruited through localhealth units and were therefore not a probability sample). (Seeappendix A record 3; Appendix B Ref ID 68 under the categoryNutritional Status and Body Sizes of Children for more infor-mation).
Anthropometry of infants, children and youths to age 18for product safety design, Highway Safety ResearchInstitute ReportIn the national child anthropometry study conducted by Snyderet al. (1977), projected sampling locations were determined
from census data on the racial and socioeconomic compositionof the population in the U.S. Other factors at various age levels,such as specific information concerning all the schools in aparticular district, including their racial and socioeconomicbreakdowns were obtained. Particular schools at a locationwere then selected to provide the best population sample cross-sections desired. However, it is important to note that the stu-dent composition of a school would not ensure that thechildren actually measured were as projected, since measure-ments were taken only if consent forms by parents wereobtained. In addition, even if a consent form was obtained,there was no guarantee that the child would consent on the daythe measurements were taken. Unforeseen problems and eventsthat occurred during the timeframe of the study had to be dealtwith as the study progressed. For example, Memphis, Tennesseehad to be omitted when disastrous tornadoes struck the cityjust prior to the measuring sessions; and Manhattan, Kansaswas also omitted due to a teacher’s strike. Nevertheless, evenwith continuous adjustments in the strategy of the design theoutcome was considered representative.
In the study by Snyder et al. (1977), once a geographic locationwas decided upon, initial contacts were made by telephone,personal visits of a co-investigator and written correspondence.Listings of all schools and child care centers and nurseries andwell child clinics in the area were obtained. When the study wasapproved by the school boards, specific schools were selectedon the basis of the particular student makeup and the availabil-ity of a space in which to conduct the measurements.Originally, a sample size of 3,000 had been projected for thestudy. However, the data collection period was extended toallow a total population of 4,000 subjects to be measured frombirth (two weeks) to age 13. In all, children were measured at76 different locations. Geographical locations included schools,day care centers, nurseries, and clinics in Florida,Massachusetts, Ohio, Connecticut, Oregon, California, Arizona,and Michigan. Determination of geographic locations, ethnicand racial affiliations and socioeconomic criteria was impor-tant in order to assure a representative nationwide populationsample and was projected by use of census data guidelines.The racial guidelines prepared by the Department of Health,Education and Welfare indicate that 11% of the U.S. populationis African-American. Data obtained from questionnaires indi-
Child Anthropometry Literature Scan
Canadian Inst itute of Chi ld Health � Transpor t Canada 12
cated about 10% African-American, 86% Caucasian, 2% Asian,and 2% of mixed racial parentage. Also, the economic groupingfrom data provided by the Institute for Social Research (i.e.,family income) proved to be a non-responsive item and it wasremoved from the later forms. (See appendix A record 11;Appendix B Ref ID 85 under the category Restraint SystemDesign for more information).
National Health and Nutrition Examination Survey III:Body Measurements (Anthropometry), CDCThe NHANES (1999–2000) was a complex, multistage proba-bility sample of the civilian non-institutionalized population ofthe United States. In-home personal interviews and MobileExamination Center data were collected. The NHANES III(1999–2004) survey is designed to give an annual sample thatis nationally representative. The survey is subject to the limitsof increased sampling error due to (1) the smaller number ofindividuals sampled in the annual sample and (2) the smallernumber of Primary Sampling Units (PSU) available for eachannual sample. For NHANES 1999–2000, the first stage ofselection was the PSU-level. The PSUs were defined as singlecounties. The sample frame for the NHANES PSUs was the listof PSUs selected for the current design of the National HealthInterview Survey (NHIS).
For the current NHIS design, there are 358 PSUs in the annualsample. These PSUs are divided into four panels with each ofthe four panels comprising a nationally representative sample.In forming the four panels, large PSUs are split and the remain-ing PSUs are stratified according to population size, geographicregion, and demographic characteristics. The National MedicalExpenditure Survey (NMEP), conducted by the Agency forHealth Research and Quality, uses two of the four panels. Theremaining two panels are available for use by the NHANES.By splitting the large NHIS PSUs, there are approximately200 PSUs available in the two national panels for the first stage-sampling frame for the NHANES.
In order to create six annual national samples, 120 of the200 NHIS PSUs were selected using a measure of size related to1990 Census county-specific information on the percentMexican-American, percent African-American and the NHISPSU-selection probability. Twenty PSUs were randomlyassigned to each year in 1999–2004. For each year, a subset of15 PSUs was selected with the remaining five PSUs held in
reserve. Once a PSU was selected, the most current Censusinformation, in this case the 1990 Census, was used to definesegments of households. Within PSUs, the percent Mexican-American population was used to form four density strata:(1) less than 10 percent, (2) 10–25 percent, (3) 25–60 percentand (4) over 60 percent. In order to achieve a sufficient samplesize of non-Hispanic Black and Mexican-Americans, withinPSU selection probabilities for these domains were adjustedand extensive screening at the household level was required.
For the 26 PSUs in 1999–2000, the final sample consisted of681 segments. Once a segment was selected, field representa-tives visited all households in the segment and a screener ques-tionnaire was used to determine sample person eligibility.Individuals were selected into the sample according to fixedsampling fractions. The sampling fractions were adjusted foreach of the four segment density strata by the factors 1.0, 1.9,2.5, and 3.0 (for the corresponding density strata). Individualsampling fractions were set that distribute the sample into53 age-sex-race-ethnicity domains for 1999. In order to meetsurvey objectives related to nutrition, the 2000 sample individ-ual selection probabilities were modified to increase the num-ber of sampled persons in low-income non-Hispanic Whitepopulation domains. The addition of the low-income sub-domains for non-Hispanic White domains gave 76 age-sex-race-ethnicity-income domains for 2000.
With 15 PSUs per year, approximately 5,000 sample personscan be examined. Because both the actual duration of data col-lection as well as the response rates varies by PSU, the actualrange for the number of examined sample persons per PSUwas from approximately 250 to 400. In sample selection forNHANES 1999–2000, there were 22,839 households screened.Of these, 6,005 households had at least one eligible sample per-son identified for interviewing. There were a total of 12,160 eli-gible sample persons identified. Of these, 9,965 wereinterviewed and 9,282 were examined. The overall responserate for those interviewed was 81.9 percent (9,965 out of12,160) and the response rate for those examined was 76.3 per-cent (9,282 out of 12,160). Due to confidentiality considera-tions, the data year is not available on the current NHANES1999–2000 public use data files.
Because differential probabilities of selection were used inNHANES 1999–2000, it was highly recommended that any sta-
Child Anthropometry Literature Scan
Canadian Inst itute of Chi ld Health � Transpor t Canada 13

tistical inference based on the survey data use the sampleweights that are provided on the data file. The sample weightswere calculated from the base probabilities of selection, adjust-ed for non-response, and post-stratified to match populationcontrol totals. For NHANES 1999–2000, weighting adjustmentsinvolved multiple levels. Due to the nested levels of data collec-tion (screener, household interview, examination) and to keepthe weights from being too variable, a non-response adjust-ment was applied at each level of data collection, that is, for thescreener interview, the household interview and the MECexamination. Post-stratification was applied at each nestedlevel as well. Both the final interview and final examinationweights are provided. The interview weight should be usedwhen an analysis uses only data from the household interview.If an analysis uses data from the MEC (MEC interview, exami-nation, or laboratory data on the full MEC sample) exclusively,or in conjunction with the household interview data, the exam-ination weight should be used. (See appendix A record 4;Appendix B Ref ID 102 under the category Nutritional Statusand Body Sizes of Children for more information).
Guide for Anthropometry Indicator Measurements, USAIDSample surveys are often the most feasible means of gatheringthe data required for program evaluations. The AnthropometricIndicator Measurements guide prepared by the Food andNutrition Technical Assistance Project in 2003, is designed toprovide guidance on how to choose samples of communities,households, and/or individuals for surveys in a manner that,when combined with appropriate indicators and evaluationstudy designs, will permit valid conclusions to be drawn onprogram effectiveness. The guide emphasizes the use of proba-bility sampling methods, which are deemed essential to ensureobjectivity in program evaluations. Estimates of populationcharacteristics derived from sample surveys conducted follow-ing suggested guidelines may be expected to approximate thetrue population value within a specified margin of error with aknown probability.
Defining measurement objectives involves answering the fol-lowing three questions, which are discussed in detail in thetext: What is to be measured? From whom? At what level of pre-cision? The guide explains how to calculate sample sizes after ithas been decided what is being measured and how to measureit. The procedure is broken down into three steps. First, the
total number of sample elements must be determined. For this,formulas are provided to identify how many individuals mustbe sampled depending on whether progress is to be measuredby changes in the proportion of the population that has a givencharacteristic or by changes in the mean of a given indicator.Second, the total number of elements must be converted intothe number of households that must be contacted. Third, thetotal number of households needs to be turned into practicalunits (clusters and subjects within them) that will be visited bythe survey team.
Sample selection is important and the guide defines probabilitysampling, explains why it is recommended, and explains step-by-step the various ways in which the clusters and elements inthe sample size can be selected, depending on various circum-stances. Suggestions are also given on how to deal with opera-tional problems. Data analysis is addressed with a focus on thestatistical issues of calculating weights and standard errors asthey arise as a result of the combination of methods used toselect clusters and elements. Formulas are provided for weightcalculation for several typical combinations. (See appendix Arecord 6; Appendix B Ref ID 8 under the category NutritionalStatus and Body Sizes of Children for more information).
The WHO Multicentre Growth Reference Study: Planning,study design, and methodology, WHOIn the WHO Multi-Growth Reference Study Group (MGRS) fourset of criteria were used to arrive at the final sample size: thepercentile of a given centile at a particular age, the precision ofthe slope of the median curve over a given age range, the preci-sion of the median curve overall and the influence of the dataat particular ages and the precision of the correlation betweenmeasurements in the same subjects at different ages (de Onis,2004). Sample sizes were calculated for each of these four crite-ria and it was apparent that for each gender, a sample size of200 for the longitudinal study and 200 for the cross-sectionalstudy would provide adequate precision. Complex formulas areavailable to get these numbers but will not be presented here(de Onis, 2004).
A sampling strategy can also be applied to an internationalsample population. In 1996, the WHO Multi-Growth ReferenceStudy Group (MGRS) began the process of selecting sites forthe implementation of the study. The group needed to identifysites in each of the six major geographic regions of the world
Child Anthropometry Literature Scan
Canadian Inst itute of Chi ld Health � Transpor t Canada 14
and the process lasted for two years. The process entailed eval-uation of specific eligibility criteria for study subpopulationsbased on their study protocol. Interested countries were askedto submit a checklist of criteria documenting the source of theepidemiological data provided. The main objective was toassess the growth of children in affluent communities andidentify socioeconomic characteristics associated with growthin these populations. Information that was also important tothe group included infant feeding patterns, mobility of the population, and availability of epidemiological data andsources of funding.
The MGRS study had two components, a longitudinal follow-upin which the children were recruited at birth and followed up athome until 24 months of age and a cross-sectional surveyinvolving children 18 to 71 months. Infants for the longitudinalcomponent were recruited from the selected hospitals and clin-ics where at least 80% of the subpopulations of interest lived.The recruitment strategies for the cross-sectional study variedby site. In Brazil, India and the US, children were recruitedthrough a door-to-door survey of selected study areas. InNorway and Oman, children were identified through a nationalor health registry and in Ghana the children came from daycare centers and nursery schools (de Onis, 2006).(See appendix A record 1; Appendix B Ref ID 10 under the category Types of Child Anthropometry Measurements(Software and Technology) for more information).
ConclusionA number of issues emerge from the information collected inthis literature review, including: a lack of child anthropometrydata that is current, standardized, reliable and accurate withinCanada and internationally. This is partly due to the fact thataccurate weighing and measuring have three critical compo-nents that need to be met: technique, equipment, and trainedmeasurers. The measuring technique needs to be standardized,the equipment needs to be calibrated and trained measurersneed to be reliable and accurate; this tends to be difficult to doas it is very time consuming and costly.
Some issues encountered in the child anthropometry field aftera thorough scan of the literature were:
1) A lack of co-ordination between the sectors (health, safetyand injury prevention, restraint systems design, road safety,etc.) pertaining to data collection and methods for collect-ing the data. Researchers collecting child anthropometryinformation need to communicate with each other toensure that the data will be useful across the sectors. As itstands now, data collection tends to be specific for a partic-ular purpose (i.e., nutritional or development status) anddesigners, health practitioners, etc. would benefit fromsystematic data collection that could result in a pool ofusable, reliable and current set of child measurements.
2) Lack of funding for training, research, data collection anddata management studies. The measuring technique needsto be standardized, the equipment needs to be calibratedand trained measurers need to be reliable and accurate.These necessary components make accurate data collectiondifficult and costly.
3) Limited data available on training, training techniques andqualified trainers. There are no national standards foranthropometry assessment and there is no national accred-itation scheme. This is a key element in the objective main-tenance of quality assurance.
4) No national child anthropometry data are available inCanada. Data users and data collectors are not workingtogether. The data available are outdated and there havebeen significant societal, health, environmental, and eco-nomic changes in Canada indicating that the physicalmeasurements of children may have changed.
5) The field of child anthropometry looks at children as scaleddown models of adults. No special instruments, manuals orprotocols for children are presently available except forthose that address a few basic measurements such as heightand weight. There are standardized methods for classicalanthropometry that should be adapted to children.
A national child anthropometry strategy to address the lack ofdata available and to help individuals with the design of baby car seats, infant seats, child restraints, boosters seats and cush-ions is necessary to fill the co-ordination gap. However, the
Child Anthropometry Literature Scan
Canadian Inst itute of Chi ld Health � Transpor t Canada 15

strategy must reflect the regional differences in levels ofactivity and be flexible to accommodate regional/communitypriorities and perspectives.
This was a scan of child anthropometry publications, availablenationally and internationally and it only provides a ‘snapshot’of activities and gaps at the time it was conducted. Clearly, eachpublication is at a different place with regard to addressingchild anthropometry, each is looking at it from different per-spectives, each having different priorities, and each workingwithin different political and social environments. However,through this scan a wealth of information on child anthropom-etry was gathered and consolidated, making it very useful toindividuals working in the area of child anthropometry. Thefield of anthropometry is evolving and to be relevant, this scanshould be updated on a regular basis.
Going forwardBased on the information coming out of the literature scan,CICH with direction from the Technical Advisory and SteeringCommittees will build on previous studies to implement thefollowing components as part of the Demonstration Study forthis project:
Data Collectors: In several of the studies presented,researchers employed nurses to collect data. Nurses were cho-sen because they have experience in taking measurements,have a high level of theoretical knowledge and are good withhandling children on a day-to-day basis. These studies reportedhaving good success with using nurses to collect data andbased on this it was agreed that nurses would collect the datafor the demonstration project.
Training: In all studies reviewed it was recommended thatmeasurers need to be first trained by a certified anthro-pometrist since anthropometry involves meticulous proce-dures. Based on this it was agreed that a level 4 certifiedanthropometrist with experience on field measurements behired to demonstrate the proper techniques and conduct a twoday training for nurses.
Sampling strategy: To make sure the sample was indicativeof the population, most studies collected national, regional orlocal data on the socio-economic and multicultural nature ofcommunities to obtain a representative sample. Additionally,
standard age ranges in studies involving children were basedon one year. Based on this it was agreed that the samplingstrategy should be based on 1-year age categories with equalnumbers of boys and girls in each age range (0-12). It was alsoagreed that multi-cultural and socio-economic statistics forOttawa would be used to assist in obtaining a representativesample.
Measurements: When determining what measurementswould be taken during the demonstration project, classicalanthropometry measurements were taken into consideration aswell as additional measurements based on studies dealing withrestraint system design.
Data collection: It was agreed that standard spreadsheetsused to collect and record data in the field studies would bereviewed to assist in developing a standard spreadsheet for thedemonstration project. It was also agreed that a standardizedinstrument kit, referenced in several studies would be used toobtain the measurements, however the team would be open tothe development of new child measurement techniques thatcan be standardized based on the direction of the certifiedanthropometrist.
Statistics: After a review of the literature on statistical analy-sis, it was agreed that SPSS software be used to analyze the datacollected.
This demonstration study will be approached from a broad-based understanding of the whole child from ages 0–12: theirphysical attributes, behaviour characteristics, developmentalstages and capability. CICH will work in consultation with tech-nical experts in the areas of anthropometry, biomechanicalengineering and statistical methodology as well as govern-ments and NGOs at both the national and provincial levels.
CICH recognizes that the resulting information will help preventinjuries and has the potential to increase the correct use ofchild restraints. This project highlights the need for collabora-tive efforts of professional organizations and health agencies tomaximize limited community resources to realize healthy out-comes for children.
Child Anthropometry Literature Scan
Canadian Inst itute of Chi ld Health � Transpor t Canada 16
Reference List1. Balague, F., Dutoit, G., and Waldburger, M. Low back pain
in school children. Lancet 361[9367], 1403-1404. 2003.
2. Burdi AR, Huelke DF, Snyder RG, and Lowrey GH. Infantsand children in the adult world of automobile safetydesign: pediatric and anatomical considerations for designof child restraints. Journal of Biomechanics 2[3], 267-280.1969.
3. Canning, P. M., Courage, M. L., and Frizzell, L. M.Prevalence of overweight and obesity in a provincial popu-lation of Newfoundland children. Canadian MedicalAssociation Journal 171, 240-242. 2004.
4. CDC. National Health and Nutrition Examination SurveyIII: Body Measurements (Anthropometry). National Centerfor Health Statistics. 1-57. 1988. US Centers for DiseaseControl and Prevention.
5. Chamouard, F., Tarriere, C, and Boudrit, P. Protection ofchildren on board vehicles: Influence of pelvis design andthigh and abdomen stiffness on the submarining risk fordummies installed on a booster. Proceedings of the 15thInternational Conference on Enhanced Safety of Vehicles.1063-1075. 1996. Washington, D.C., National HighwayTraffic and Safety Administration.
6. Cogill, B. Anthropometry Indicators Measurement Guide. USAgency for International Development [Food and NutritionTechnical Assistance Project FANTA]. 2003. Washington,D.C., Academy for Educational Development.
7. Cyr, C., Lemoine, C., and Santschi, M. Canadian PaediatricSurveillance Report 2005: Lap Belt Syndrome Report. 38-39.2005. Ottawa, Ontario, Canadian Paediatric Society.
8. de Onis, M., Garza, C., Victora, C. G., Onyango, A. W.,Frongillo, E. A., Martines, J., and WHO MULTICENTREGROWTH REFERENCE STUDY GROUP. The WHOMulticentre Growth Reference Study: Planning, studydesign, and methodology. Food Nutrition Bulletin25[Supplement 1], 15-26. 2004.
9. de Onis, M., Onyango, A. W., Van den Broeck, J., Chumlea,W. C., Martorell, R., and WHO MULTICENTRE GROWTHREFERENCE STUDY GROUP. Measurement and standardi-zation protocols for anthropometry used in the construc-
tion of a new international growth reference. FoodNutrition Bulletin 25[Supplement 1], 27-36. 2004.
10. de Onis, M. and WHO MULTICENTRE GROWTH REFERENCE STUDY GROUP. WHO Child GrowthStandards based on length/height, weight and age.95[Supplement 450], 76-85. 2006.
11. Demirjian, A. Anthropometry Report-height, weight andbody dimensions: a report from Nutrition Canada. 1980.Ottawa, Health and Welfare Canada.
12. Dieticians of Canada, The College of Family Physicians ofCanada, and Community Health Care Nurse Association ofCanada. The Use of Growth Charts for Assessing andMonitoring Growth in Canadian Infants and Children.Canadian Journal of Dietetic Practice and Research 65[1],22-32. 2004.
13. Evans, W. A., Courtney, A. J., and Fok, K. F. The design ofschool furniture of Hong Kong school children an anthro-pometry case study. Applied Ergonomics 19[2], 122-134.1988.
14. Flynn, M. A., Hall, K., Noack, A., Clovechok, S., Enns, E.,Pivnick, J., Naimish, A., Wouts, P., Best, M., and Pryce, C.Promotion of healthy weights at preschool public healthvaccination clinics in Calgary: an obesity surveillance pro-gram. Canadian Journal of Public Health 96[6], 421-426.2005.
15. He, M. and Sutton, J. Using routine growth monitoring datain tracking overweight prevalence in young children.Canadian Journal of Public Health 95, 419-423. 2004.
16. Janssen, I., Katzmarzyk, P. T., Boyce, W. F., King, M. A., andPickett, W. Overweight and obesity in Canadian adolescentsand their associations with dietary habits and physicalactivity patterns. Journal of Adolescent Health 35[5], 360-367. 2004.
17. Johnson, T. S., Engstrom, J. L., Haney, S. L., and Mulcrone, S.L. Reliability of three length measurement techniques interm infants. Pediatric Nursing 25[1], 13-17. 1999.
18. Knight, G. and Noyes, J. Children’s behaviour and the designof school furniture. Ergonomics 42[5], 747-760. 1999.
Child Anthropometry Literature Scan
Canadian Inst itute of Chi ld Health � Transpor t Canada 17

19. Lampl, M., Birch, L., Picciano, M. F., Johnson, M. L., andFrongillo, E. A. Jr. Child factor in measurement dependabil-ity. American Journal of Human Biology 13[4], 548-557.2001.
20. Lin, Y. C., Wang, M. J. J., and Wang, E. M. The comparisonsof anthropometry characteristics among four peoples inEast Asia. Applied Ergonomics 35, 173-178. 2004.
21. Linton, S. J., Hellsing, A. L., Halme, T., and Akerstedt, K. Theeffects of ergonomically designed school furniture onpupils’ attitudes, symptoms and behaviour. AppliedErgonomics 25[5], 299-304. 1994.
22. Marfell-Jones, M., Olds, T., Stewart, A., and Carter, L. J. E.International Standards for Anthropometry Assessment.1-137. 2006. Australia, International Society for theAdvancement of Kinanthropometry.
23. Panagiotopoulou, G., Christoulas, K., Papanckolaou, A., andMandroukas, K. Classroom furniture dimensions andanthropometry measures in primary school. AppliedErgonomics 35[2], 121-128. 2004.
24. Reed, M. P., Ebert-Hamilton, S. M., Manary, M. A., Klinich,K. D., and Schneider, L. W. A New Database of ChildAnthropometry and Seated Posture for Automotive SafetyApplications. SAE Technical Papers Series, 1-16. 2005. 400Commonwealth Drive, Warrendale, PA 15096-0001 U.S.A.Tel: (724) 776-4841 Fax: (724) 776-5760, www.sae.org.
25. Saul, R. A., Pritz, H. P., McFadden, J., Backaitis, S. H.,Hallenbeck, H., and Rhule, D. Description and Performanceof the Hybrid III 3 year-old, 6 year-old and small femaletest dummies in restrain system and out-of-position airbag environments. Paper Number: 98-S7-O-01, 1-20. 1997.National Highway Traffic Safety Administration andTransportation Research Center Inc.
26. Snyder RG, Spencer, M. L., Owings, C. L., and Schneider, L. W.Physical characteristics of children as related to death andinjury for consumer product design and use. 1-54. 1975. AnnArbor, MI, Highway Safety Research Institute.
27. Snyder, R. G., Schneider, L. W., Owings, C. L., Reynolds, H. M.,Golomb, D. H., and Schork, M. A. Anthropometry of infants,children and youths to age 18 for product safety design.Highway Safety Research Institute Report No. UM-HSRI-77-17. 1977. Ann Arbor, MI.
28. Steenbekkers, L. P. and Moenbroek, J. F. Anthropometrydata of children for non-specialist users. Ergonomics 33[4],421-429. 1990.
29. Tremblay, M. S. and Willms, J. D. Secular trends in the bodymass index of Canadian children. Canadian MedicalAssociation Journal 163[11], 1429-1433. 2000.
30. Vegelin, A. L., Brukx, L. J., Waelkens, J. J., and Van den Broeck, J. Influence of knowledge, training andexperience of observers on the reliability of anthropometrymeasurements in children. Annals of Human Biology 30[1],65-79. 2003.
31. Veugelers, P. J. and Fitzgerald, A. L. Prevalence of and riskfactors for childhood overweight and obesity. CanadianMedical Association Journal 173, 607-613. 2005.
32. Weber, K., Lehman, R. J., and Schneider, L. W. Child anthro-pometry for restraint system design. Technical Report No.UMTRI-85-23. 1985. Ann Arbor, MI, University ofMichigan Transportation Research Institute.
33. Wijnhoven, T. M. A., de Onis, M., Onyango, A. W., Wang, T.,Bjoerneboe, G. E. A., Bhandari, N., Lartey, A., and Alasfoor, D.Assessment of gross motor development in the WHOMulticentre Growth Reference Study. Food and NutritionBulletin 25[1 (supplement 1)], S37-S45. 2004. UnitedNations University.
34. Willms, J. D. Early childhood obesity: a call for early surveil-lance and preventive measures. 171[3], 243-244. 2004.
35. Willms, J. D., Tremblay, M. S., and Katzmarzyk, P. T.Geographic and demographic variation in the prevalence ofoverweight Canadian children. Obesity Research 11[5],668-673. 2003.
Child Anthropometry Literature Scan
Canadian Inst itute of Chi ld Health � Transpor t Canada 18
Appendix A: Summaries of Most Relevant PublicationsSeveral of the main publications referred to in the first section of this literature scan are presented here in table format to providemore detailed information that may have not been captured in the abstract (additional publications referred to in the first sectioncan be found in Appendix B). The tables are divided into categories to provide information in an organized manner. Reference idnumber and category refer to the abstract number as found in Appendix B. The tables list the project/program name, the organiza-tion (s) offering the program, the source of the publication, the geographical and program focus, the target audience and the datethe program was first established. The tables present information on whether there was anthropometry training involved and whattypes of measuring instruments were used, the type of data that was collected and the statistical analysis or sampling strategiesutilized. A summary of the measured results, conclusions reached together with any problems or limitations found are listed aswell. The principal authors contact information is provided.
Child Anthropometry Literature Scan
Canadian Inst itute of Chi ld Health � Transpor t Canada 19

Child Anthropometry Literature Scan
Canadian Inst itute of Chi ld Health � Transpor t Canada 20
RECORD 1 (Appendix A: Summaries of Most Relevant Publications)
Description of Activity, Project or ProgramReference Id # 11
Category Nutritional Status and the Body Sizes of Children
Project/Program Name Reliability of anthropometry measurements in the WHO Multicentre Growth Reference Study
Organization(s) Offeringthe Program
World Health Organization (WHO)
Source Food and Nutrition Bulletin
Program Focus The WHO Multicentre Growth Reference Study (MGRS) was undertaken to generate new growth curves forassessing the growth and development of infants and young children from around the world.
Geographical Focus Brazil, Ghana, India, Norway, Oman and the USA
Program Objectives To describe how reliability assessment data in the WHO Multicentre Growth Reference Study were collected andanalyzed, and to present the results
Target Audience(s) Infants and children from Brazil, Ghana, India, Norway, Oman and the USA
Date First Established 2006
Training Described elsewhere (See record # 14)
Measurement Instruments Described elsewhere (See record # 14)
Data • There were two sources of anthropometry data (length, head and arm circumferences, triceps andsubscapular skinfolds, and height) for these analyses
• Data for constructing the WHO Child Growth Standards, collected in duplicate by observer pairs, were usedto calculate inter-observer technical error of measurement (TEM) and the coefficient of reliability
• The second source was the anthropometry standardization sessions conducted throughout the datacollection period with the aim of identifying and correcting measurement problems
Statistical Analysis • An anthropometry expert visited each site annually to participate in standardization sessions and provideremedial training as required
• Reliability statistics reported for the standardization sessions were intra-observer technical error of measurement (TEM), inter-observer TEM and average bias
• Coefficient of reliability, R, was measured for 6 anthropometry variables• Detailed equations given and explained
Summary of Measured Results • Average bias was within acceptable limits of deviation from the expert, with head circumference having bothlowest bias and lowest TEM
• Teams tended to underestimate length, height and arm circumference, and to overestimate skinfoldmeasurements
• Intra- and inter-observer TEMs were comparable, and newborns, infants and older children were measuredwith equal reliability
• The coefficient of reliability was above 95% for all measurements except skinfolds whose R coefficientwas 75-93%
Conclusion • Reliability of the MGRS teams compared well with the study’s anthropometry expert and publishedreliability statistics.
• Problems and limitations• Difficulties associated with keeping children fully stretched out and still for length/height measurements
and in manipulating soft tissues for the other measurements were encountered
Contact Information Dr. Mercedes de Onis Coordinator Growth Assessment and SurveillanceNutrition for Health and Development (NHD)World Health Organization1211 Geneva, Switzerland 27Fax: (41 22) 791 4156

Child Anthropometry Literature Scan
Canadian Inst itute of Chi ld Health � Transpor t Canada 21
RECORD 2 (Appendix A: Summaries of Most Relevant Publications)
Description of Activity, Project or ProgramReference Id # 63
Category Nutritional Status and the Body Sizes of Children
Project/Program Name 2000 CDC Growth Charts for the United States: Methods and Development
Organization(s) Offeringthe Program
US Centers for disease control and prevention (CDC)
Source CDC, Department of Human Health and Human Services
Program Focus To revise the growth charts from 1977 with more recent and comprehensive national data on bodymeasurements in the US
Geographical Focus USA
Program Objectives This report provides detailed information on how the 2000 CDC growth charts for the United States weredeveloped, expanding upon the report that accompanied the initial release of the charts in 2000.
Target Audience(s) Infants and children from the USA
Date First Established 2000
Training N/A
Measurement Instruments N/A
Data • Data obtained from the National Health Examination Surveys and the National Health and NutritionExamination Surveys
Statistical Analysis • Very detailed statistics on the derivation of growth charts are available• Smoothed percentile curves were developed in two stages. In the first stage, selected empirical percentiles
were smoothed with a variety of parametric and nonparametric procedures. In the second stage, parameterswere created to obtain the final curves, additional percentiles and z-scores
• The revised charts were evaluated using statistical and graphical measures
Summary of Measured Results • The 1977 National Center for Health Statistics (NCHS) growth charts were revised for infants (birth to36 months) and older children (2 to 20 years). New body mass index-for-age (BMI-for-age) charts werecreated. Use of national data improved the transition from the infant charts to those for older children
Conclusion • The evaluation of the charts found no large or systematic differences between the smoothed percentilesand the empirical data.
Problems and limitations N/A
Contact Information U.S. Department of Health and Human ServicesCenters for Disease Control and PreventionNational Center for Health StatisticsHyattsville, MD 20782Tel: (301) 458-4000or 1-866-441-NCHS

Child Anthropometry Literature Scan
Canadian Inst itute of Chi ld Health � Transpor t Canada 22
Description of Activity, Project or ProgramReference Id # 68
Category Nutritional Status and the Body Sizes of Children
Project/Program Name Anthropometry Report: height, weight and body dimensions
Organization(s) Offeringthe Program
Nutrition Canada
Source Health and Welfare Canada
Program Focus To assess the health and nutritional status of the Canadian child and adult population.
Geographical Focus Canada across the ten Canadian provinces recognized at the time.
Program Objectives To form a database against which past and future trends can be compared
Target Audience(s) • Infants and children from the USA-Canadian population in general. Children of all ages.• The focus of this report is national but includes data on First Nations and Inuit• Comparisons, where appropriate, are made with data from other countries
Date First Established 1980
Training • The technicians responsible for the anthropometry measurements were trained at the Centre de Recherchesur la Croissance Humaine of the University of Montreal.
• The International Biological Program techniques were taught as used at the Growth Centre.
Measurement Instruments • The Harpenden anthropometer for all length measurements• The Harpenden skinfold calipers• Toledo beam balance and a metal tape for weight and circumferences
Data Available • Data was obtained from the Nutrition Canada National Survey of nutritional status carried out during1970–1972
• These data provide the only nationally representative data for the Canadian population since the firstnational survey of height and weight carried out over 25 years ago
Statistical Strategy • Probability sample design and estimates are based on weighted observations
Statistical Analysis • For most measurements tables and curves give the mean, standard deviation, standard error, as well as thesample size and estimated population size for each age group
• Tables also report the median value, 5th, 10th, 25th, 75th, 90th and 95th percentiles for each age interval• The inter and intra-measurer errors were not checked for statistical significance.
Summary of Measured Results • The results of 19 child body measurements are given together with comparisons by sex, socio-economicstatus and racial/ethnic differences
Conclusion • Along with secular trends identified for height and weight, the findings illustrate the importance of takinginto consideration ethnic differences in body measurements and the need to establish national standardsfor each country.
Problems and limitations N/A
Contact Information Health Canada
RECORD 3 (Appendix A: Summaries of Most Relevant Publications)
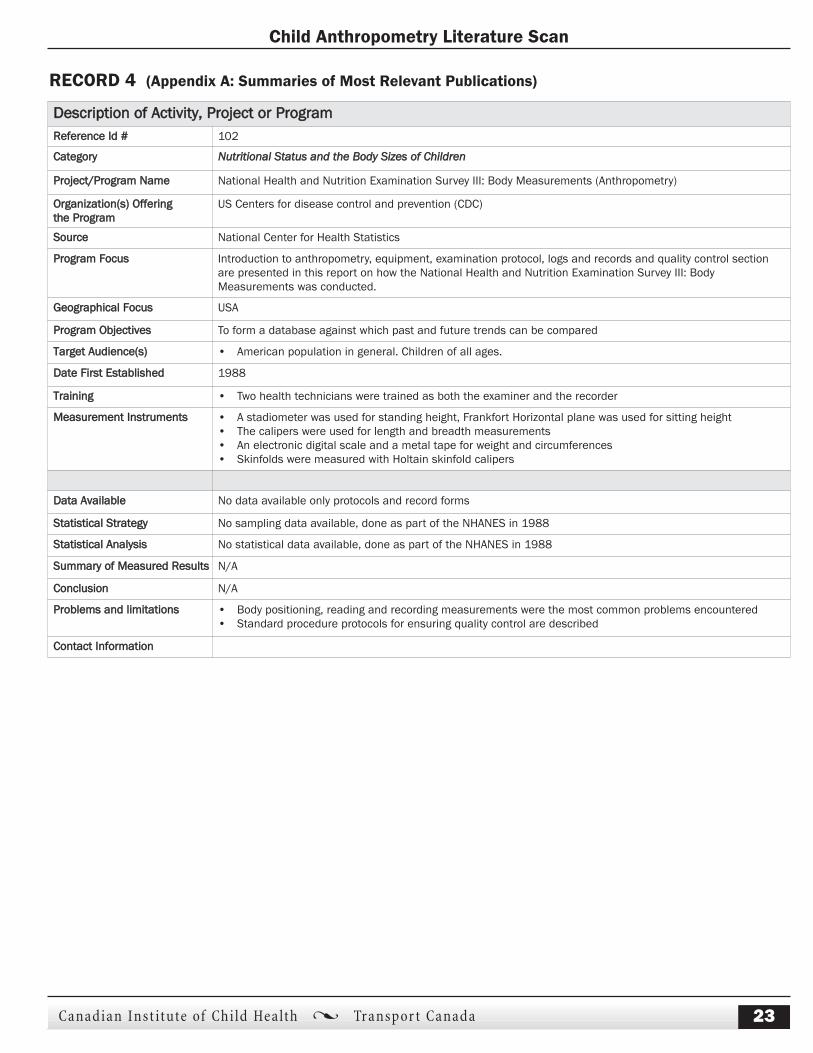
Child Anthropometry Literature Scan
Canadian Inst itute of Chi ld Health � Transpor t Canada 23
RECORD 4 (Appendix A: Summaries of Most Relevant Publications)
Description of Activity, Project or ProgramReference Id # 102
Category Nutritional Status and the Body Sizes of Children
Project/Program Name National Health and Nutrition Examination Survey III: Body Measurements (Anthropometry)
Organization(s) Offeringthe Program
US Centers for disease control and prevention (CDC)
Source National Center for Health Statistics
Program Focus Introduction to anthropometry, equipment, examination protocol, logs and records and quality control sectionare presented in this report on how the National Health and Nutrition Examination Survey III: BodyMeasurements was conducted.
Geographical Focus USA
Program Objectives To form a database against which past and future trends can be compared
Target Audience(s) • American population in general. Children of all ages.
Date First Established 1988
Training • Two health technicians were trained as both the examiner and the recorder
Measurement Instruments • A stadiometer was used for standing height, Frankfort Horizontal plane was used for sitting height• The calipers were used for length and breadth measurements• An electronic digital scale and a metal tape for weight and circumferences• Skinfolds were measured with Holtain skinfold calipers
Data Available No data available only protocols and record forms
Statistical Strategy No sampling data available, done as part of the NHANES in 1988
Statistical Analysis No statistical data available, done as part of the NHANES in 1988
Summary of Measured Results N/A
Conclusion N/A
Problems and limitations • Body positioning, reading and recording measurements were the most common problems encountered• Standard procedure protocols for ensuring quality control are described
Contact Information
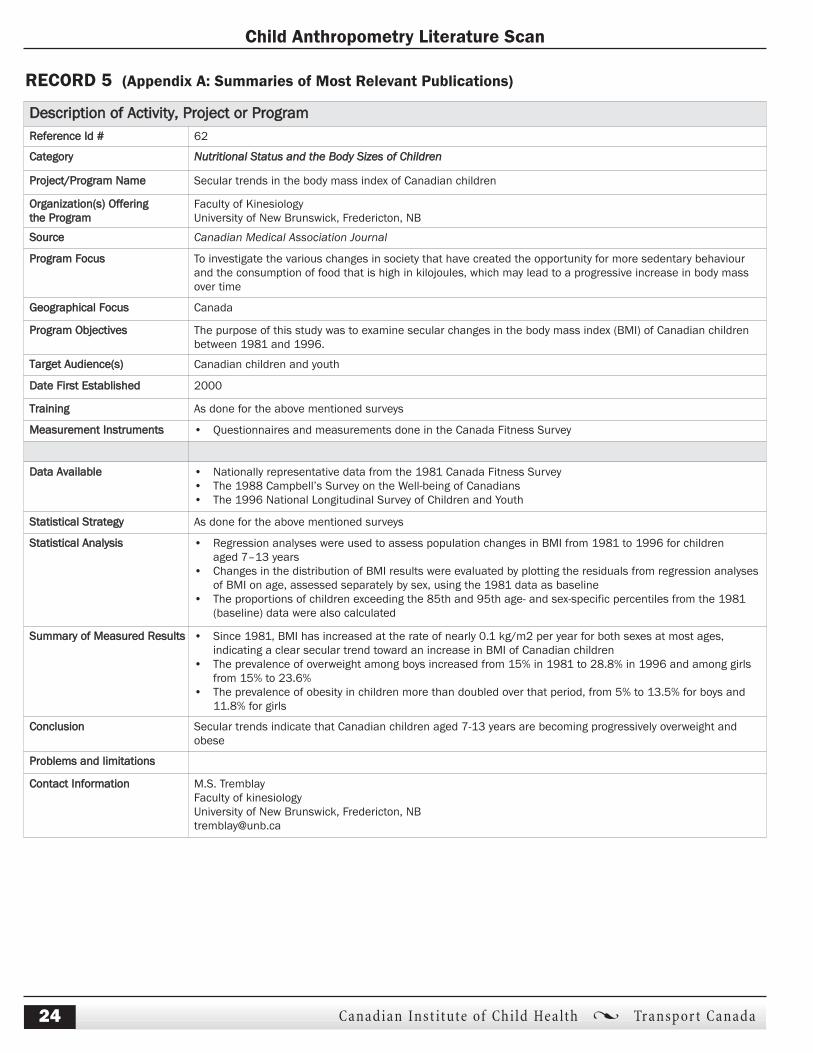
Child Anthropometry Literature Scan
Canadian Inst itute of Chi ld Health � Transpor t Canada 24
RECORD 5 (Appendix A: Summaries of Most Relevant Publications)
Description of Activity, Project or ProgramReference Id # 62
Category Nutritional Status and the Body Sizes of Children
Project/Program Name Secular trends in the body mass index of Canadian children
Organization(s) Offeringthe Program
Faculty of KinesiologyUniversity of New Brunswick, Fredericton, NB
Source Canadian Medical Association Journal
Program Focus To investigate the various changes in society that have created the opportunity for more sedentary behaviourand the consumption of food that is high in kilojoules, which may lead to a progressive increase in body massover time
Geographical Focus Canada
Program Objectives The purpose of this study was to examine secular changes in the body mass index (BMI) of Canadian childrenbetween 1981 and 1996.
Target Audience(s) Canadian children and youth
Date First Established 2000
Training As done for the above mentioned surveys
Measurement Instruments • Questionnaires and measurements done in the Canada Fitness Survey
Data Available • Nationally representative data from the 1981 Canada Fitness Survey• The 1988 Campbell’s Survey on the Well-being of Canadians• The 1996 National Longitudinal Survey of Children and Youth
Statistical Strategy As done for the above mentioned surveys
Statistical Analysis • Regression analyses were used to assess population changes in BMI from 1981 to 1996 for childrenaged 7–13 years
• Changes in the distribution of BMI results were evaluated by plotting the residuals from regression analysesof BMI on age, assessed separately by sex, using the 1981 data as baseline
• The proportions of children exceeding the 85th and 95th age- and sex-specific percentiles from the 1981(baseline) data were also calculated
Summary of Measured Results • Since 1981, BMI has increased at the rate of nearly 0.1 kg/m2 per year for both sexes at most ages,indicating a clear secular trend toward an increase in BMI of Canadian children
• The prevalence of overweight among boys increased from 15% in 1981 to 28.8% in 1996 and among girlsfrom 15% to 23.6%
• The prevalence of obesity in children more than doubled over that period, from 5% to 13.5% for boys and11.8% for girls
Conclusion Secular trends indicate that Canadian children aged 7-13 years are becoming progressively overweight andobese
Problems and limitations
Contact Information M.S. TremblayFaculty of kinesiologyUniversity of New Brunswick, Fredericton, [email protected]

Child Anthropometry Literature Scan
Canadian Inst itute of Chi ld Health � Transpor t Canada 25
RECORD 6 (Appendix A: Summaries of Most Relevant Publications)
Description of Activity, Project or ProgramReference Id # 8
Category Nutritional Status and the Body Sizes of Children
Project/Program Name Anthropometry Indicators Measurement Guide[part of the Standardized Monitoring and Assessment of Relief and Transitions (SMART) Program]
Organization(s) Offeringthe Program
US Agency for International Development (USAID)
Source Food and Nutrition Technical Assistance Project FANTA
Program Focus To evaluate and monitor changes in body dimensions of children under 5 years to reflect the overall health andwelfare of these populations in developing countries
Geographical Focus International
Program Objectives • To present a programming tool for use in consistent collection and reporting of nutritional anthropometryindicators and annual monitoring indicators and to provide suggestions for additional information related tomonitoring and evaluation
• This information will be used to track and improve child nutrition activities and performance
Target Audience(s) • Children under the age of 5 in developing countries
Date First Established 2003
Training • The guide is not meant to substitute for adequate technical and academic training needed to conductproblem analysis, design programs and for implementation
• Field staff need to be trained to take anthropometry measurements, interviewing techniques and recordingrequirements
Measurement Instruments • UNICEF electronic and hanging scales, TALC weighing scale• UNICEF length/height board, infant recumbent length board• UNICEF circumference metal tape• Step-by-step procedures available for taking measurements are presented to ensure a standard method for
taking the measurements
Data Available No data is available. The impact indicators discussed are: decreased percent of stunted children, decreasedpercent of underweight children, increased percent of eligible children in growth monitoring/promotion,increased percent of children in growth promotion program gaining weight in past 3 months.
Statistical Strategy Detailed information provided on sampling error, sample size, survey sample size requirements
Statistical Analysis • Statistical information on how to compare anthropometry data to reference standards• Z-scores, standard deviation, percentage of the median and percentiles, cut offs• Section on data analysis, how to present the data, calculation of indices and EPI INFO software
Summary of Measured Results
Conclusion To consider the advantages of including the monitoring indicators in annual reports to modify training,implementation and information management systems to incorporate these indicators in the future
Problems and limitations
Contact Information Food and Nutrition Technical Assistance ProjectAcademy of Educational Development1825 Connecticut Ave., NWWashington, D.C. 20009-5721Tel: 202-884-8000Fax: [email protected]
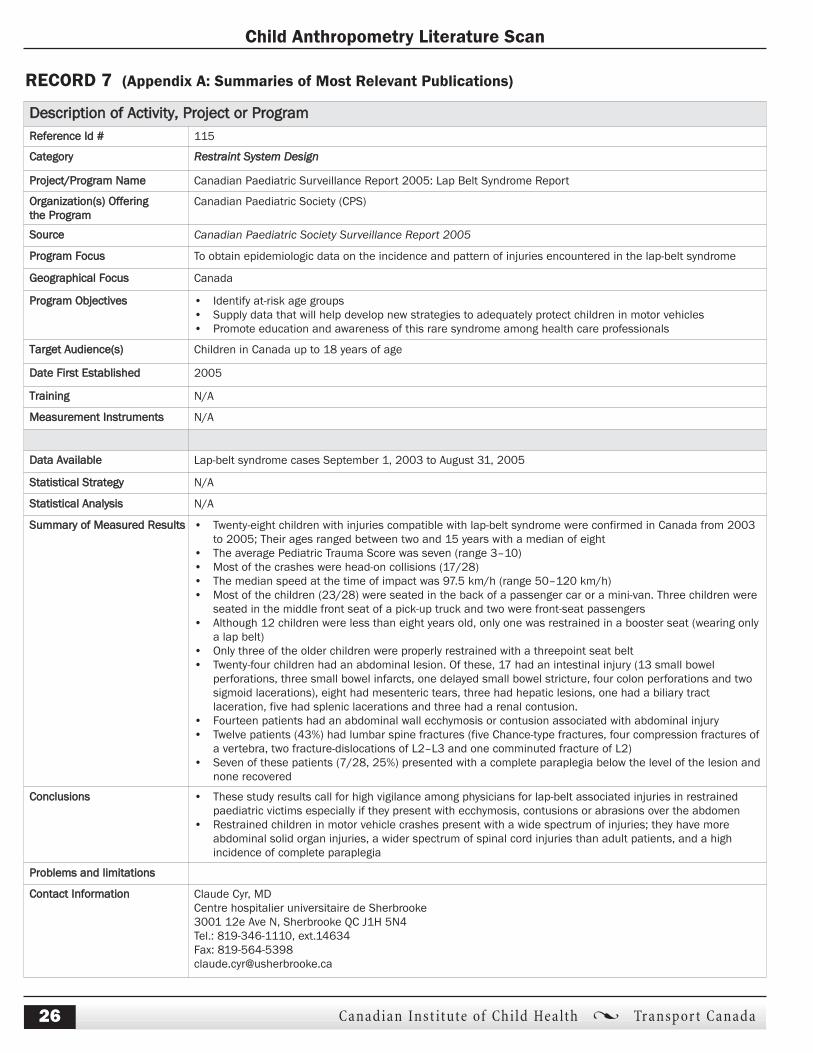
Child Anthropometry Literature Scan
Canadian Inst itute of Chi ld Health � Transpor t Canada 26
RECORD 7 (Appendix A: Summaries of Most Relevant Publications)
Description of Activity, Project or ProgramReference Id # 115
Category Restraint System Design
Project/Program Name Canadian Paediatric Surveillance Report 2005: Lap Belt Syndrome Report
Organization(s) Offeringthe Program
Canadian Paediatric Society (CPS)
Source Canadian Paediatric Society Surveillance Report 2005
Program Focus To obtain epidemiologic data on the incidence and pattern of injuries encountered in the lap-belt syndrome
Geographical Focus Canada
Program Objectives • Identify at-risk age groups• Supply data that will help develop new strategies to adequately protect children in motor vehicles• Promote education and awareness of this rare syndrome among health care professionals
Target Audience(s) Children in Canada up to 18 years of age
Date First Established 2005
Training N/A
Measurement Instruments N/A
Data Available Lap-belt syndrome cases September 1, 2003 to August 31, 2005
Statistical Strategy N/A
Statistical Analysis N/A
Summary of Measured Results • Twenty-eight children with injuries compatible with lap-belt syndrome were confirmed in Canada from 2003to 2005; Their ages ranged between two and 15 years with a median of eight
• The average Pediatric Trauma Score was seven (range 3–10)• Most of the crashes were head-on collisions (17/28)• The median speed at the time of impact was 97.5 km/h (range 50–120 km/h)• Most of the children (23/28) were seated in the back of a passenger car or a mini-van. Three children were
seated in the middle front seat of a pick-up truck and two were front-seat passengers• Although 12 children were less than eight years old, only one was restrained in a booster seat (wearing only
a lap belt)• Only three of the older children were properly restrained with a threepoint seat belt• Twenty-four children had an abdominal lesion. Of these, 17 had an intestinal injury (13 small bowel
perforations, three small bowel infarcts, one delayed small bowel stricture, four colon perforations and twosigmoid lacerations), eight had mesenteric tears, three had hepatic lesions, one had a biliary tractlaceration, five had splenic lacerations and three had a renal contusion.
• Fourteen patients had an abdominal wall ecchymosis or contusion associated with abdominal injury• Twelve patients (43%) had lumbar spine fractures (five Chance-type fractures, four compression fractures of
a vertebra, two fracture-dislocations of L2–L3 and one comminuted fracture of L2)• Seven of these patients (7/28, 25%) presented with a complete paraplegia below the level of the lesion and
none recovered
Conclusions • These study results call for high vigilance among physicians for lap-belt associated injuries in restrainedpaediatric victims especially if they present with ecchymosis, contusions or abrasions over the abdomen
• Restrained children in motor vehicle crashes present with a wide spectrum of injuries; they have moreabdominal solid organ injuries, a wider spectrum of spinal cord injuries than adult patients, and a highincidence of complete paraplegia
Problems and limitations
Contact Information Claude Cyr, MDCentre hospitalier universitaire de Sherbrooke3001 12e Ave N, Sherbrooke QC J1H 5N4Tel.: 819-346-1110, ext.14634Fax: [email protected]
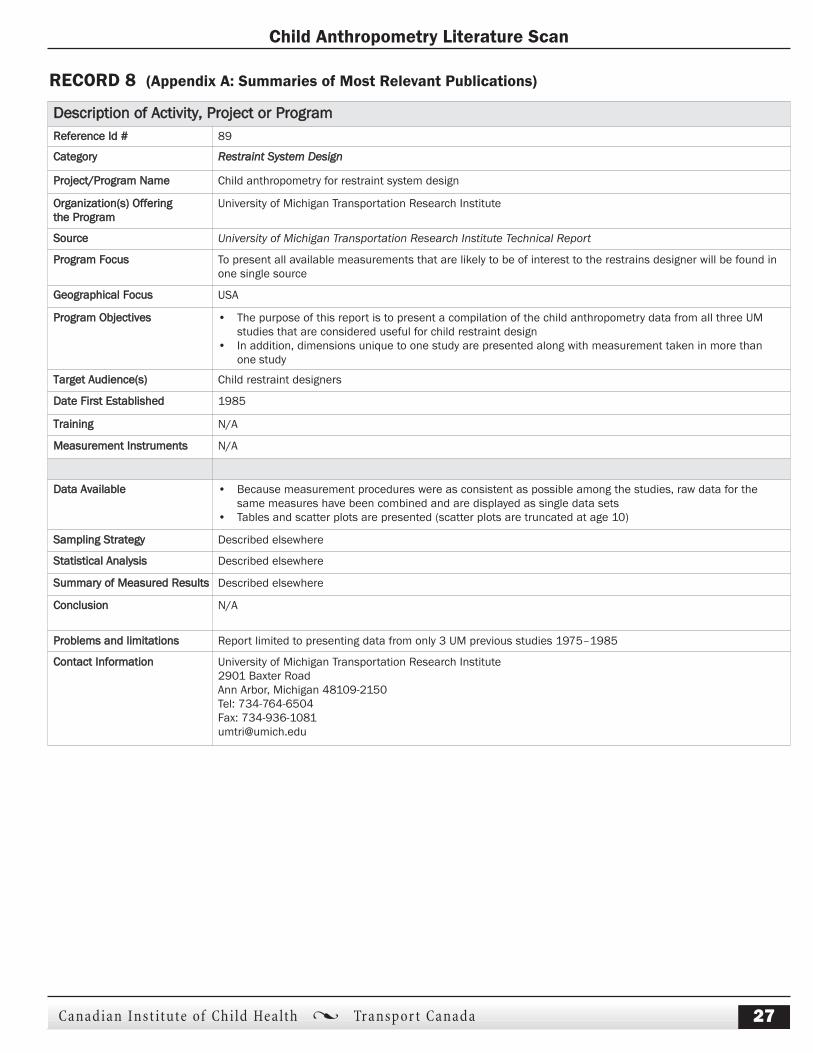
Child Anthropometry Literature Scan
Canadian Inst itute of Chi ld Health � Transpor t Canada 27
RECORD 8 (Appendix A: Summaries of Most Relevant Publications)
Description of Activity, Project or ProgramReference Id # 89
Category Restraint System Design
Project/Program Name Child anthropometry for restraint system design
Organization(s) Offeringthe Program
University of Michigan Transportation Research Institute
Source University of Michigan Transportation Research Institute Technical Report
Program Focus To present all available measurements that are likely to be of interest to the restrains designer will be found inone single source
Geographical Focus USA
Program Objectives • The purpose of this report is to present a compilation of the child anthropometry data from all three UMstudies that are considered useful for child restraint design
• In addition, dimensions unique to one study are presented along with measurement taken in more thanone study
Target Audience(s) Child restraint designers
Date First Established 1985
Training N/A
Measurement Instruments N/A
Data Available • Because measurement procedures were as consistent as possible among the studies, raw data for thesame measures have been combined and are displayed as single data sets
• Tables and scatter plots are presented (scatter plots are truncated at age 10)
Sampling Strategy Described elsewhere
Statistical Analysis Described elsewhere
Summary of Measured Results Described elsewhere
Conclusion N/A
Problems and limitations Report limited to presenting data from only 3 UM previous studies 1975–1985
Contact Information University of Michigan Transportation Research Institute2901 Baxter RoadAnn Arbor, Michigan 48109-2150Tel: 734-764-6504Fax: [email protected]

Child Anthropometry Literature Scan
Canadian Inst itute of Chi ld Health � Transpor t Canada 28
RECORD 9 (Appendix A: Summaries of Most Relevant Publications)
Description of Activity, Project or ProgramReference Id # 94
Category Restraint System Design
Project/Program Name Infants and children in the adult world of automobile safety design: pediatric and anatomical considerations fordesign of child restraints
Organization(s) Offeringthe Program
• University of Michigan Medical School, Biosciences Section and Department of Anthropology, The HighwaySafety Research Institute, University of Michigan
• Department of Paediatrics, University of Michigan Medical School
Source Journal of Biomechanics
Program Focus To demonstrate how infant and child differ structurally from the adult in a number of ways which are critical tothe design for protection against impact forces and for adequate occupant restraint systems
Geographical Focus USA
Program Objectives The purpose of this paper is to bring together a profile of the anatomy, anthropometry, growth and developmentof the infant and child. Age differences related to the proper design of child restraint systems are emphasized
Target Audience(s) Infants, children and youth
Date First Established 1969
Training N/A
Measurement Instruments N/A
Data Available Data on the growth of the infant body as a whole, the head and neck, the chest, the abdomen, the vertebralcolumn, the limbs and the biomechanical properties of the tissues
Sampling Strategy N/A
Statistical Analysis N/A
Summary of Measured Results • The frequency of head injuries in children involved in auto collisions may be due to the child’sproportionately large head and higher center of gravity
• Sudden snapping or rotation of the relatively unrestrained child’s head can traumatize related nerves, bloodvessels and spinal cord segments
• The skull is not yet an intact bony case for the brain but a series of broadly spaced elastic bones• Growth rates of different parts of the body vary with age• Differences in shape, size, structure and biomechanical properties of the infant and child and adult pelvic
skeleton are clearcut and must be considered for safety design• Organs of the chest are housed in an elastic and highly compressible thoracic cage and are vulnerable to
chest impact
Conclusion Most effective restrain systems for children are those which distribute impact forces over a large portion ofthe body
Problems and limitations Problems discussed include child-adult structural differences, center of gravity of the body, the head mass inrelation to the neck and general body proportions, positions of key organs and biomechanical
Contact Information Not available
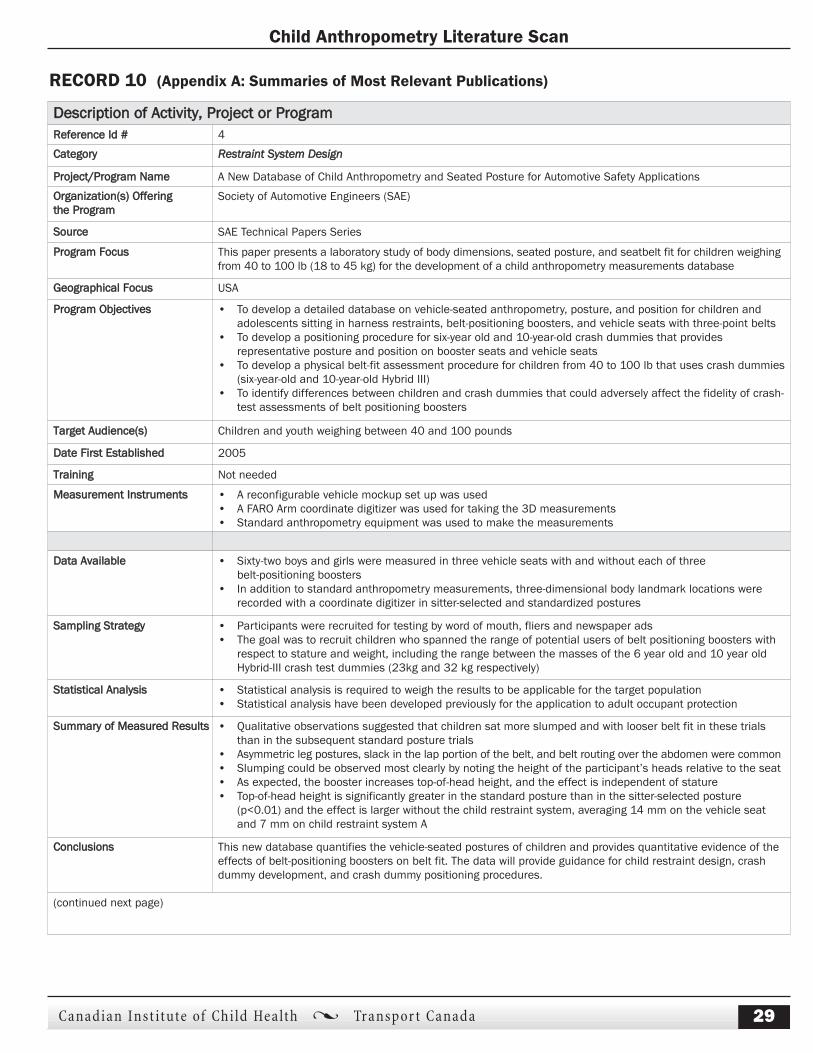
Child Anthropometry Literature Scan
Canadian Inst itute of Chi ld Health � Transpor t Canada 29
RECORD 10 (Appendix A: Summaries of Most Relevant Publications)
Description of Activity, Project or ProgramReference Id # 4
Category Restraint System Design
Project/Program Name A New Database of Child Anthropometry and Seated Posture for Automotive Safety Applications
Organization(s) Offeringthe Program
Society of Automotive Engineers (SAE)
Source SAE Technical Papers Series
Program Focus This paper presents a laboratory study of body dimensions, seated posture, and seatbelt fit for children weighingfrom 40 to 100 lb (18 to 45 kg) for the development of a child anthropometry measurements database
Geographical Focus USA
Program Objectives • To develop a detailed database on vehicle-seated anthropometry, posture, and position for children andadolescents sitting in harness restraints, belt-positioning boosters, and vehicle seats with three-point belts
• To develop a positioning procedure for six-year old and 10-year-old crash dummies that providesrepresentative posture and position on booster seats and vehicle seats
• To develop a physical belt-fit assessment procedure for children from 40 to 100 lb that uses crash dummies(six-year-old and 10-year-old Hybrid III)
• To identify differences between children and crash dummies that could adversely affect the fidelity of crash-test assessments of belt positioning boosters
Target Audience(s) Children and youth weighing between 40 and 100 pounds
Date First Established 2005
Training Not needed
Measurement Instruments • A reconfigurable vehicle mockup set up was used• A FARO Arm coordinate digitizer was used for taking the 3D measurements• Standard anthropometry equipment was used to make the measurements
Data Available • Sixty-two boys and girls were measured in three vehicle seats with and without each of three belt-positioning boosters
• In addition to standard anthropometry measurements, three-dimensional body landmark locations wererecorded with a coordinate digitizer in sitter-selected and standardized postures
Sampling Strategy • Participants were recruited for testing by word of mouth, fliers and newspaper ads• The goal was to recruit children who spanned the range of potential users of belt positioning boosters with
respect to stature and weight, including the range between the masses of the 6 year old and 10 year oldHybrid-III crash test dummies (23kg and 32 kg respectively)
Statistical Analysis • Statistical analysis is required to weigh the results to be applicable for the target population• Statistical analysis have been developed previously for the application to adult occupant protection
Summary of Measured Results • Qualitative observations suggested that children sat more slumped and with looser belt fit in these trialsthan in the subsequent standard posture trials
• Asymmetric leg postures, slack in the lap portion of the belt, and belt routing over the abdomen were common• Slumping could be observed most clearly by noting the height of the participant’s heads relative to the seat• As expected, the booster increases top-of-head height, and the effect is independent of stature• Top-of-head height is significantly greater in the standard posture than in the sitter-selected posture
(p<0.01) and the effect is larger without the child restraint system, averaging 14 mm on the vehicle seatand 7 mm on child restraint system A
Conclusions This new database quantifies the vehicle-seated postures of children and provides quantitative evidence of theeffects of belt-positioning boosters on belt fit. The data will provide guidance for child restraint design, crashdummy development, and crash dummy positioning procedures.
(continued next page)

Child Anthropometry Literature Scan
Canadian Inst itute of Chi ld Health � Transpor t Canada 30
RECORD 10 (continued)
Description of Activity, Project or ProgramReference Id # 4
Category Restraint System Design
Project/Program Name A New Database of Child Anthropometry and Seated Posture for Automotive Safety Applications
Organization(s) Offeringthe Program
Society of Automotive Engineers (SAE)
Problems and limitations • Study is limited by the range of test conditions possible within the attention span of the participants• Only five child restrains systems were used a small fraction of the market• Study sample was relatively small• Recent data from the NCHS indicate that the upper percentiles of weight-for-stature, as measured by body
mass index, are increasing for U.S. children (as they are for adults)• The current sample includes a wide distribution of weight-for-stature only in the upper stature ranges (above
130 cm)• An analysis of trends in this group should show the potential impact of shifts in average body mass index on
belt fit for most children• Morbidly obese children were not included in this sample and additional data collection would be needed to
quantify the effects of child obesity on posture and belt fit
Contact Information SAE Permissions400 Commonwealth DriveWarrendale, PA 15096-0001-USAEmail: [email protected]: 724-772-4028Fax: 724-772-4891

Child Anthropometry Literature Scan
Canadian Inst itute of Chi ld Health � Transpor t Canada 31
Description of Activity, Project or ProgramReference Id # 85
Category Child Anthropometry for Safety and Injury Prevention
Project/Program Name Anthropometry of infants, children and youths to age 18 for product safety design
Organization(s) Offeringthe Program
Highway Safety Research Institute
Source http://ovrt.nist.gov/projects/anthrokids/
Program Focus The present study is a continuation and extension of the 1975 anthropometry survey sponsored by theBiomedical Department of the Highway Safety Research Institute and the Consumer Product Safety Commissionand is an attempt to provide a more complete source of useful anthropometry data on children and youthsthrough age 78
Geographical Focus USA
Program Objectives • To provide a complete source of anthropometry data on U.S. children for consumer product design, hazardassessment and guidance in establishing requirements or recommendations in standards
• To develop a 1ist of traditional and functional anthropometry measurements most urgently needed oninfants, children and youth from 2 weeks to 18 years for broad application to product safety design
• To determine a measurement strategy and sampling procedure that would efficiently and accurately collectthese data on a sample representative of the total U.S. population of infants, children and youth
• To make necessary modifications to existing anthropometry instruments and assemble a second portablecomputer system for collecting these anthropometry data
• Collect, reduce, and analyze the required dimensional data• Tabulate and present the data in a format or formats most useful to persons concerned with designing or
establishing guidelines and standards for children’s products, taking into consideration the potentialfunctional applications
Target Audience(s) USA infants (0-2 years), children and youth (2-18 years)
Date First Established 1975–1977
Training Measurements were taken by two teams of trained anthropometrists
Measurement Instruments • Standard anthropometers, calipers, and tape devices were modified to read electronically and inputdimensional data directly to a mini-computer for data processing and storage
• Each measurement is described along with a photograph and illustration• An automated anthropometry data acquisition system was used.• GPM Swiss standard anthropometers, calipers and measuring tapes were modified to provide electrical
readouts.
Data Available • Data on 87 measurements have been obtained on over 4100 additional subjects two weeks through18 years of age, representing as nearly as possible the U.S. population with regard to race, demographic,and socio-economic factors
• Tables and figures are available as well as diagrams of every measurement taken (2–18 years)• Separate tables, figures and diagrams for infants (0–2 years)
(continued next page)
RECORD 11 (Appendix A: Summaries of Most Relevant Publications)
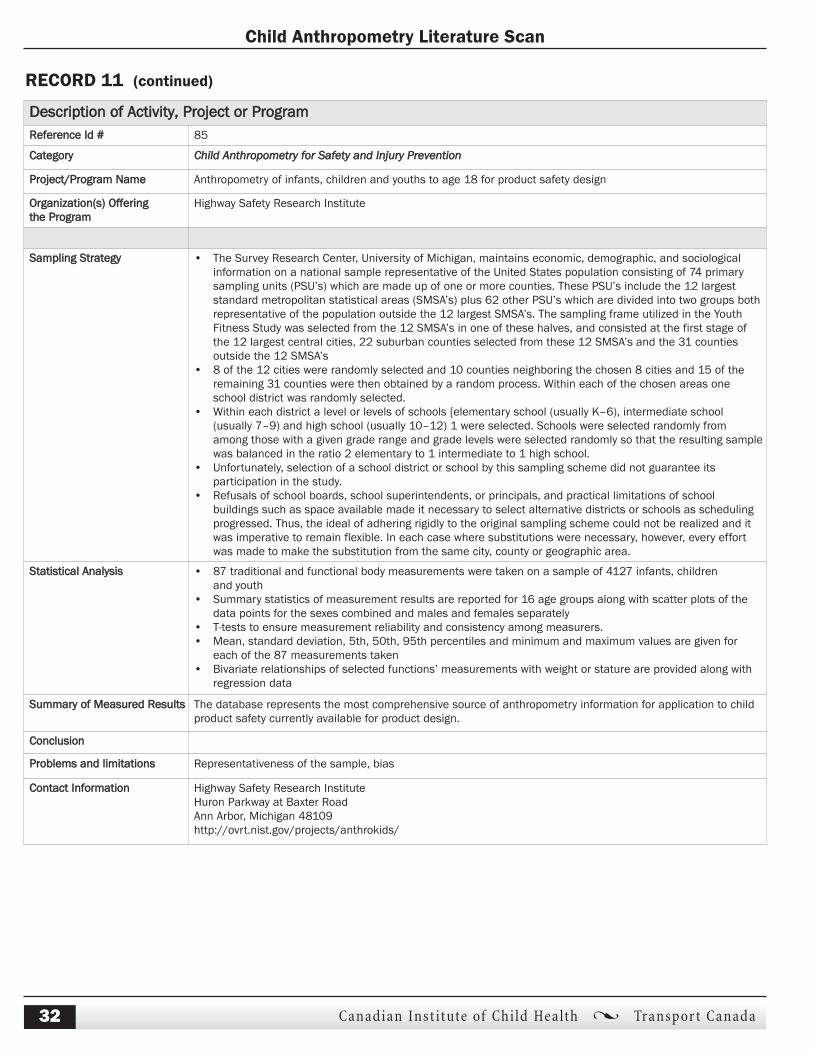
Child Anthropometry Literature Scan
Canadian Inst itute of Chi ld Health � Transpor t Canada 32
Description of Activity, Project or ProgramReference Id # 85
Category Child Anthropometry for Safety and Injury Prevention
Project/Program Name Anthropometry of infants, children and youths to age 18 for product safety design
Organization(s) Offeringthe Program
Highway Safety Research Institute
Sampling Strategy • The Survey Research Center, University of Michigan, maintains economic, demographic, and sociologicalinformation on a national sample representative of the United States population consisting of 74 primarysampling units (PSU’s) which are made up of one or more counties. These PSU’s include the 12 largeststandard metropolitan statistical areas (SMSA’s) plus 62 other PSU’s which are divided into two groups bothrepresentative of the population outside the 12 largest SMSA’s. The sampling frame utilized in the YouthFitness Study was selected from the 12 SMSA’s in one of these halves, and consisted at the first stage ofthe 12 largest central cities, 22 suburban counties selected from these 12 SMSA’s and the 31 countiesoutside the 12 SMSA’s
• 8 of the 12 cities were randomly selected and 10 counties neighboring the chosen 8 cities and 15 of theremaining 31 counties were then obtained by a random process. Within each of the chosen areas oneschool district was randomly selected.
• Within each district a level or levels of schools [elementary school (usually K–6), intermediate school(usually 7–9) and high school (usually 10–12) 1 were selected. Schools were selected randomly fromamong those with a given grade range and grade levels were selected randomly so that the resulting samplewas balanced in the ratio 2 elementary to 1 intermediate to 1 high school.
• Unfortunately, selection of a school district or school by this sampling scheme did not guarantee itsparticipation in the study.
• Refusals of school boards, school superintendents, or principals, and practical limitations of schoolbuildings such as space available made it necessary to select alternative districts or schools as schedulingprogressed. Thus, the ideal of adhering rigidly to the original sampling scheme could not be realized and itwas imperative to remain flexible. In each case where substitutions were necessary, however, every effortwas made to make the substitution from the same city, county or geographic area.
Statistical Analysis • 87 traditional and functional body measurements were taken on a sample of 4127 infants, childrenand youth
• Summary statistics of measurement results are reported for 16 age groups along with scatter plots of thedata points for the sexes combined and males and females separately
• T-tests to ensure measurement reliability and consistency among measurers.• Mean, standard deviation, 5th, 50th, 95th percentiles and minimum and maximum values are given for
each of the 87 measurements taken• Bivariate relationships of selected functions’ measurements with weight or stature are provided along with
regression data
Summary of Measured Results The database represents the most comprehensive source of anthropometry information for application to childproduct safety currently available for product design.
Conclusion
Problems and limitations Representativeness of the sample, bias
Contact Information Highway Safety Research InstituteHuron Parkway at Baxter RoadAnn Arbor, Michigan 48109http://ovrt.nist.gov/projects/anthrokids/
RECORD 11 (continued)
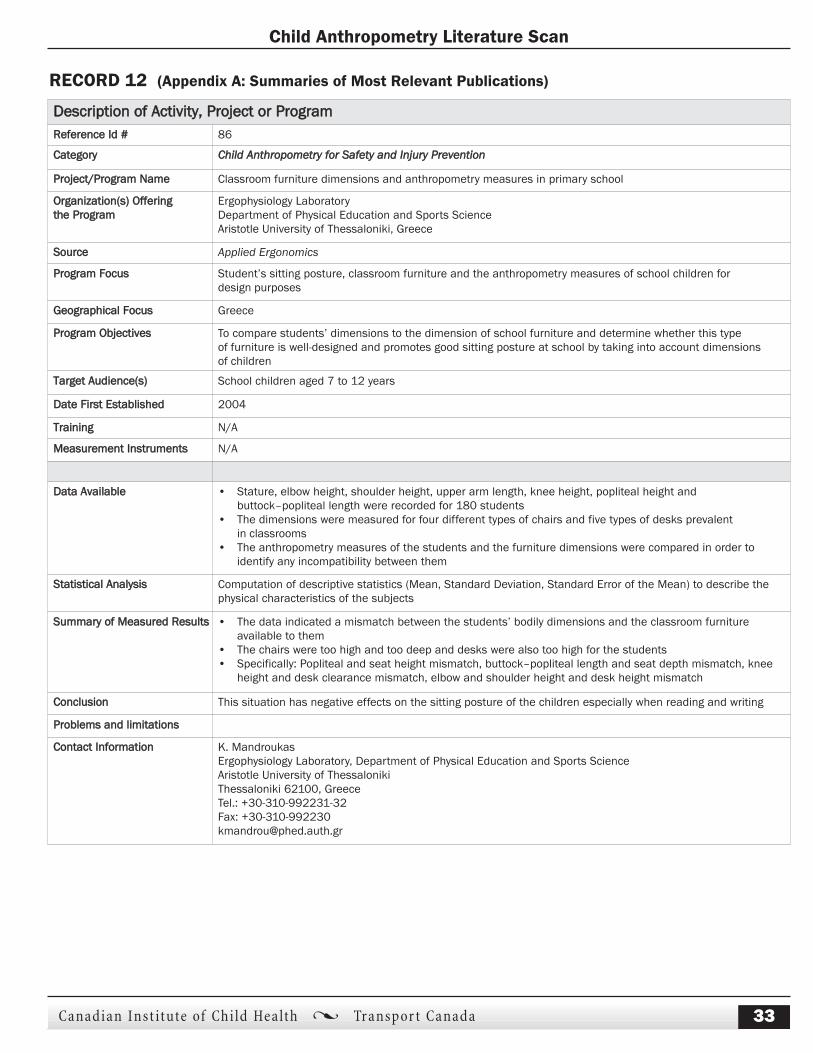
Child Anthropometry Literature Scan
Canadian Inst itute of Chi ld Health � Transpor t Canada 33
Description of Activity, Project or ProgramReference Id # 86
Category Child Anthropometry for Safety and Injury Prevention
Project/Program Name Classroom furniture dimensions and anthropometry measures in primary school
Organization(s) Offeringthe Program
Ergophysiology LaboratoryDepartment of Physical Education and Sports ScienceAristotle University of Thessaloniki, Greece
Source Applied Ergonomics
Program Focus Student’s sitting posture, classroom furniture and the anthropometry measures of school children fordesign purposes
Geographical Focus Greece
Program Objectives To compare students’ dimensions to the dimension of school furniture and determine whether this typeof furniture is well-designed and promotes good sitting posture at school by taking into account dimensionsof children
Target Audience(s) School children aged 7 to 12 years
Date First Established 2004
Training N/A
Measurement Instruments N/A
Data Available • Stature, elbow height, shoulder height, upper arm length, knee height, popliteal height andbuttock–popliteal length were recorded for 180 students
• The dimensions were measured for four different types of chairs and five types of desks prevalentin classrooms
• The anthropometry measures of the students and the furniture dimensions were compared in order toidentify any incompatibility between them
Statistical Analysis Computation of descriptive statistics (Mean, Standard Deviation, Standard Error of the Mean) to describe thephysical characteristics of the subjects
Summary of Measured Results • The data indicated a mismatch between the students’ bodily dimensions and the classroom furnitureavailable to them
• The chairs were too high and too deep and desks were also too high for the students• Specifically: Popliteal and seat height mismatch, buttock–popliteal length and seat depth mismatch, knee
height and desk clearance mismatch, elbow and shoulder height and desk height mismatch
Conclusion This situation has negative effects on the sitting posture of the children especially when reading and writing
Problems and limitations
Contact Information K. MandroukasErgophysiology Laboratory, Department of Physical Education and Sports ScienceAristotle University of ThessalonikiThessaloniki 62100, GreeceTel.: +30-310-992231-32Fax: [email protected]
RECORD 12 (Appendix A: Summaries of Most Relevant Publications)

Child Anthropometry Literature Scan
Canadian Inst itute of Chi ld Health � Transpor t Canada 34
Description of Activity, Project or ProgramReference Id # 25
Category Training
Project/Program Name Influence of knowledge, training and experience of observers on the reliability of anthropometry measurementsin children
Organization(s) Offeringthe Program
Catharina HospitalDepartment of PaediatricsEindhoven, Netherlands
Source Annals of Human Biology
Program Focus Growth studies and the use of detailed anthropometry standardization protocols to train people to acquire betterinsight
Geographical Focus Netherlands
Program Objectives To elucidate the impact of the observer’s level of technical knowledge, training and experience with measuringheight and triceps skinfold thickness on the reliability of these measurements in children.
Target Audience(s) Children aged 2–7
Date First Established 2003
Training 12 observers with different backgrounds and levels of experience, protocol knowledge and protocol trainingwere employed
Measurement Instruments N/A
Data The main outcome measures, precision and accuracy, were expressed as technical error of measurement andaverage bias in comparison with an expert anthropometrist
Statistical Analysis Ranking analysis and multiple regressions showed that precision and accuracy in measuring height and tricepsskinfold thickness are mainly predicted by all round knowledge of the measurement protocol (p< 0.05) and theyears of experience (p< 0.05)
Summary of Measured Results • As expected, the best educated and most experienced observers scored the best precision and accuracy• A practical training course of only a few hours does not seem to improve reliability significantly
Conclusion To get a more reliable insight in growth of a child it is important to be aware of the influence on measurementoutcome values of protocol knowledge and years of experience
Problems and limitations
Contact Information [email protected]
RECORD 13 (Appendix A: Summaries of Most Relevant Publications)

Child Anthropometry Literature Scan
Canadian Inst itute of Chi ld Health � Transpor t Canada 35
Description of Activity, Project or ProgramReference Id # 11
Category Training
Project/Program Name Measurement and standardization protocols for anthropometry used in the construction of a new internationalgrowth reference
Organization(s) Offeringthe Program
World Health Organization (WHO)
Source Food and Nutrition Bulletin
Program Focus The WHO Multicentre Growth Reference Study (MGRS) was undertaken to generate new growth curves forassessing the growth and development of infants and young children from around the world.Appropriate training and continued standardization, adherence to specified methods and procedures, andmonitoring of data quality are essential to reduce measurement error and minimize bias in multi-site studies.
Geographical Focus Brazil, Ghana, India, Norway, Oman and the USA
Program Objectives To describe the measurement protocols and routine standardization sessions that were used in the MGRS. Thestudy protocols and quality control procedures can be applied in research settings without substantiallyincreasing costs or complicating logistics.
Target Audience(s) Infants and children from Brazil, Ghana, India, Norway, Oman and the USA
Date First Established 2004
Training • All candidates received standardized training, and only those who met the MGRS performance criteria wereretained for the study. The measurement procedures and training guidelines were prepared by the MGRSCoordinating Centre at WHO in Geneva, based on best practices recommended in anthropometry manualsand in the literature.
• The initial training of anthropometrists at each site was carried out by an experienced anthropometristfollowing the procedures detailed in the MGRS protocol. All anthropometrists were trained to interviewmothers, complete the study questionnaires, measure children as described in the protocol, avoid digitpreference or transposition of numbers, record measurement values immediately after reading them, andwrite legibly to reduce mistakes during data transfer. Strict adherence to the measuring techniques andrecording procedures was emphasized.
Measurement Instruments • All study sites used the same measuring equipment.• Length was measured with the Harpenden Infantometer• A self-retracting, 0.7-cm-wide, flat metal tape with blank lead-in strip was used to measure circumferences. Metal
tapes were chosen because they are more robust and accurate and stay in a single plane around the head.• Holtain/Tanner-Whitehouse Skinfold Caliper was used to measure skinfolds• To measure weight, portable electronic scales were used that have taring capability and are calibrated to
0.1 kg (UNICEF Electronic Scale 890 or Uniscale). Ideally, newborns should be measured with a scale ofhigher precision (within 10 g).
• The equipment was calibrated regularly, usually daily before the home or hospital visits.
Data Technical Error of Measurement (TEM) and coefficient of reliabilityStatistical Analysis
Statistical Analysis Precision parameters were measured by using the TEM and the coefficient of reliabilityAnthropometry standardization sessions conducted throughout the data collection period with the aim ofidentifying and correcting measurement problems
Summary of Measured Results Rigorous anthropometry protocol was described and tested to ensure high data quality
Conclusion The rigorous anthropometry protocols described in this paper were set in place to ensure high data quality.These MGRS procedures serve as a model for research settings. The methods and procedures reviewed will beapplicable to multi- and single-site studies. It will not be possible to be as rigorous in non-research settings,such as child clinics. At the very least, the procedures should be carefully documented in training manuals, staffmembers collecting anthropometry data should be trained and refresher sessions should be held periodically,weighing scales and any other instruments used should be maintained in good order and calibrated before use,and fieldworkers should be supervised.
(continued next page)
RECORD 14 (Appendix A: Summaries of Most Relevant Publications)

Child Anthropometry Literature Scan
Canadian Inst itute of Chi ld Health � Transpor t Canada 36
Description of Activity, Project or ProgramReference Id # 11
Category Training
Project/Program Name Measurement and standardization protocols for anthropometry used in the construction of a new internationalgrowth reference
Organization(s) Offeringthe Program
World Health Organization (WHO)
Problems and limitations • Factors that affected measurement accuracy and precision included the identification of landmark featureswhen measuring soft tissues (arm circumference and skinfolds).
• In some sites, the teams experienced difficulties in taking measurements because they did not mark theupper-arm midpoint or the subscapular point. In this respect, the Coordinating Center’s ongoing monitoringof anthropometry data and the regular participation of the WHO lead anthropometrists in sitestandardization sessions were extremely important for detecting and correcting problems.
Contact Information Dr. Mercedes de Onis Coordinator Growth Assessment and SurveillanceNutrition for Health and Development (NHD)World Health Organization1211 Geneva, Switzerland 27Fax: (41 22) 791 4156
RECORD 14 (continued)

Reference List by SubjectAbstracts and source information of all the studies reviewed forthis literature scan are presented below. The abstracts areorganized into six specific categories: nutritional status and thebody sizes of children; restraint system design; safety andinjury prevention; training; relevant child anthropometrymeasurements; and, statistics and sampling strategies.
Nutritional Status and the Body Sizesof Children1. Ref ID: 28
Bicego, J. T., Sommerfelt, A. E., and Bicego, G. T. Childanthropometry in cross-sectional surveys in develop-ing countries: an assessment of the survivor bias.American Journal of Epidemiology 135[4], 438–449. 1992.Abstract: In cross-sectional surveys, the sample of chil-dren with anthropometry measurements is not representa-tive of all children in a birth cohort, since only childrensurviving to the survey date are measured. This survivorbias may have implications for studies of trends and differ-entials in anthropometry indicators. In this paper, theeffects of the survivor bias on the estimates of childanthropometry indicators are assessed by 1) reviewing evi-dence from longitudinal studies on the prevalence of mal-nutrition among deceased children and among survivingchildren and by 2) analyzing retrospective data on childmortality and cross-sectional data on child anthropometryin 17 national surveys that are part of the Demographicand Health Surveys Program. It is concluded that compar-isons of anthropometry data across geographic units, pop-ulation subgroups, and calendar time are marginallyaffected by the survivor bias, unless mortality differencesbetween the birth cohorts are very large (e.g., well over50 per 1,000 births).The effects of survivor bias in cross-sectional surveys ofanthropometry measurements of children, that is overesti-mates due to omission of children that died before the sur-vey date, were estimated by reviewing longitudinal studiesfor prevalence of malnutrition in deceased and survivingchildren, and analyzing retrospective data on child mortali-
ty and cross-sectional data on child anthropometry. Datawere taken from 17 Demographic and Health Surveys, col-lected from 1986–1989. The odds ratio of the prevalence ofmalnutrition in deceased to that of living children wascomputed to assess how much worse the nutritional statusof deceased children is to surviving children. In mostcountries 50% of the dead children were malnourished.The ratios were higher if malnutrition was more severe,specifically if the differences were pronounced for weightfor age, and weight for height, or for severe stunting, below-3 SD from the median height for age. The proportion deadamong children 3–36 months ranged from 2.5% in SriLanka to 15% in Mali, and was higher in older children.The largest bias was seen in weight for age: e.g., in Mali,where mortality is highest, the proportion of underweightincreased by 4.6%, and of severely underweight by 2.7%.There was a relationship between level of malnutrition andchild mortality at the country level, with considerable vari-ation between countries, and a few outstanding outliers,countries whose malnutrition was much higher thanexpected from mortality rates. The effects of mother’s edu-cation and of length of preceding birth interval were com-puted, and the odds ratio rose only from 1.8 to 2.2. It wasconcluded that comparisons of anthropometry data acrosscountries and time are only marginally affected by survivorbias, unless the mortality differences between birth cohortsare very large, over 50/1000 births.
2. Ref ID: 7Daniel, M., Gamble, D., Henderson, J., and Burgess, S.Diabetes Prevalence, Behavioural and AnthropometryRisk Factors, and Psychosocial Constructs in ThreeAboriginal Communities in Central British Columbia.Chronic Diseases in Canada 16[4]. 1995.Abstract: To counter non-insulin-dependent diabetes mellitus (NIDDM) among aboriginal populations in theOkanagan region of British Columbia, a diabetes preven-tion and control project was initiated in 1994. This reportpresents the results of baseline diagnostic and risk factorscreening among high-risk samples in three communities(n = 189). Persons with established diabetes and those at
Child Anthropometry Literature Scan
Canadian Inst itute of Chi ld Health � Transpor t Canada 37
Appendix B: Reference List by Category and Abstracts

familial risk for NIDDM were measured for physiological,anthropometry and behavioural risk factors, as well as psy-chosocial constructs. Persons at risk underwent oral glu-cose tolerance tests. For adults 18 years and older, cruderegional prevalence rates for diabetes and impaired glucosetolerance were 36.1 per 1000 and 7.8 per 1000, respectively.Proportions of individuals above the 70th percentile valuesfrom the Canada Fitness Survey for body mass index andwaist-to-hip ratio were 60% and 73%, respectively. Of allpersons sampled, cases of hypercholesterolemia (50%),hypertriglyceridemia (38%) and hyperinsulinemia (12%)were highly prevalent. Individuals with diabetes were char-acterized by poor control.
3. Ref ID: 68Demirjian, A. Anthropometry Report-height, weightand body dimensions: a report from Nutrition Canada.1980. Ottawa, Health and Welfare Canada.Abstract: The anthropometry data described in this reportform part of the Nutrition Canada National Survey ofnutritional status carried out during 1970–1972. Thesedata provide the only nationally representative data for theCanadian population since the first national survey ofheight and weight carried out over 25 years ago. The reporttherefore forms a valuable data base against which pastand future trends can be compared. The focus of thisreport is national but includes data on First Nations andInuit. In addition comparisons, where appropriate, are madewith data from other countries. This report deals primarilywith height, weight and selected body measurements. Thesecond volume of this series will report the data on skin-fold measurements and deal with the assessment of obesityin the Canadian population.
4. Ref ID: 3Haque F, de la Rocha AG, Horbul BA, Desroches P, andOrrell C. Prevalence of childhood obesity in northeast-ern Ontario: a cross-sectional study. Canadian Journal ofDietetic Practice and Research 67[3], 143–147. 2006.Abstract: In Canada, the incidence of childhood obesityhas tripled within the past 20 years. The prevalence ofobesity in the Timmins, Ontario, student population wasstudied to gain knowledge for program planning andresource allocation, and to compare Centers for Disease
Control and Prevention (CDC) criteria with Cole’s interna-tional criteria for childhood obesity. Anthropometry meas-urements of 801 students were taken. Students were chosenfrom randomly selected schools for each grade. Data wereanalyzed according to age, gender, and ethnicity. Data werealso compared with other studies. Intragroup comparisonswere performed using hypothesis testing for significancewith the z table and chi-square test. Overweight and obesityprevalence was 28% according to CDC criteria. No statisticaldifference was found between genders or among ethnicgroups, or between this study and other Canadian studies.In comparison with the CDC criteria, Cole’s internationalcriteria indicated less obesity and increased overweightprevalence. These differences were not statistically signifi-cant. The findings suggest that in the northern Ontariocommunity of Timmins, the prevalence of childhoodobesity is of epidemic proportions. When the findings areshared with different agencies, this study will help thehealth unit to take necessary public health measures tocurb the epidemic.
5. Ref ID: 103Torrance, G. M. Campbell Survey Results for Youth.[Fitness Development Unit], 1–23. 1991. Fitness Canada.Abstract: The Campbell Survey tells us about the partici-pation rates and the most popular activities amongCanadians. It also helps us to pinpoint the changes in theirpatterns of physical recreation and physical fitness between1981 and 1988. As hinted by the survey’s name, the advisorycommittee arrived at the design for the 1988 well-beingsurvey by expanding the content of the 1981 Canada FitnessSurvey to include more detailed information on suchaspects of well-being as nutritional habits, physical andmental health, and attitudes toward physical activity. Themajority of the results were collected from 4000 Canadiansby means of a questionnaire completed in select householdsby all members aged 10 and older. The anthropometry andfitness measurements were taken according to theCanadian Standardized Test of Fitness and collected byqualified fitness testers from household members between7 and 69 who successfully completed the PAR-Q and agreedto the testing.
Child Anthropometry Literature Scan
Canadian Inst itute of Chi ld Health � Transpor t Canada 38
6. Ref ID: 55Vonk, R., de Kleuver, M., Ie, E. H., and Voorhoeve, H. W.Growth of under five-year-old children in Kyeni, Kenya.Tropical and Geographical Medicine 45[4], 175–178. 1993.Abstract: During a three-months period a cross-sectionalstudy of the measurements of head circumference,mid-upper-arm circumference (MUAC) and weight wasperformed in 515 under five-year-old children in Kyeni,Kenya. Growth of Kyeni children seems to develop accord-ing to international standards for weight-for-age, MUAC-for-age and head circumference and for all parameters theaverage remains above minus 2 SD of the standard. Despitethe presence of anthropometry malnutrition and down-ward trend in weight-for-age, MUAC-for-age and to a lesserdegree the head circumference-for-age, the average growthof the Kyeni children in Kenya is within normal limits ofinternational references.A cross-sectional study was performed during a 3-monthperiod on 515 children 0–5 years old who attended thedaily maternal and child health clinic of Consolata Hospitalin Kyeni, Embu District, Kenya, to determine growth andnutritional status through weight-for-age, head circumfer-ence and mid-upper-arm circumference (MUAC). It wasfound that the average growth of these children developedaccording to international standards for the 3 parametersand remained above minus 2 standard deviations (SD).At age 4 months for females and 5 months for males, bothsexes showed a downward trend in weight-for-age. Withincreasing age, a larger proportion fell below minus 2 SD ofthe standard (2.2% of the 0–3 month age group, 16.6%between 6 months and 5 years). This criterion revealed thatan average 10.3% of the children were malnourished.However, since many of the children were stunted andweight-for-height was normal, the minus 2 SD is too high acriterion. The MUAC measurement, which reflects weigh-for-height, gives a more accurate figure of malnutrition.Using the Blankhart classification for this criterion, 3.7% ofthese children were malnourished and 16.0% were border-line for a total of 19.7% insufficiently nourished children.These estimates may also be too high and may result in toomany children being classified as borderline, however,since they assume a constant MUAC from 6–60 months,
which is not the case. Cross-tabulation of the data above age6 months results in the presumably more realistic figure of2.2% anthropometry malnutrition, 24.7% borderline, and73.1% well nourished. It is recommended that MUAC beincluded in routine clinical measurements. In conclusion,despite the presence of anthropometry malnutrition andthe age-related downward trend in indicators, the childrenexhibited average growth in terms of international standards.
7. Ref ID: 84Banerjee, S., Morgan, R. J. H., Rees, S. A., and Latif, A. H. A.Height screening at school: ineffective without highstandards and adequate resources. Archives of Disease inChildhood 88, 477–481. 2003.Abstract: The Coventry Consensus in 1998 recommendeda single height measurement of all children at school entryor around the age of 5 years and prompt referral of chil-dren with height <0.4th centile for further assessment, inorder to identify undetected and treatable asymptomaticgrowth disorders. The aim was to determine adherence andpracticalities of following the Coventry Consensus recom-mendations in a community setting and the cost implica-tions. Anthropometry data of all children born betweenSeptember 1992 and August 1993 in the Rhondda andTaff Ely area and measured in school year September 1998to August 1999 were obtained from the National ChildHealth System (NCHS) and analyzed in July 2000. Only1592 (67.6%) of 2354 eligible children had their heightmeasured. The NCHS could only flag up height data <2ndcentile. Only five of the 15 children with height <0.4th cen-tile were referred initially. Height measurements were nottranscribed onto centiles in 75% of the case notes reviewed.When initially recalled, six of the 15 eligible children failedto attend the referral clinic. No new growth disorder wasidentified in any of these children. A conservative estimateof the cost to the health authority was £14 550 (US$23 300;€20 500) per annum.The study shows poor coverage and compliance togetherwith a lack of parental awareness that short stature couldbe a potential health problem even in asymptomatic chil-dren. For a low yield programme to be successful and costeffective at the national level, a near 100% coverage isrequired. Further training of professionals in growth meas-
Child Anthropometry Literature Scan
Canadian Inst itute of Chi ld Health � Transpor t Canada 39
urement and interpretation along with a campaign to raiseboth public and professional awareness is needed.
8. Ref ID: 22Buyken, A. E., Hahn, S., and Kroke, A. Differences betweenrecumbent length and stature measurement in groupsof 2- and 3-y-old children and its relevance for the useof European body mass index references. InternationalJournal of Obesity (London) 29[1], 24–28. 2005. ResearchInstitute of Child Nutrition, Dortmund, Germany.Abstract: The objective was to compare length and staturemeasurements of young children and to examine the rele-vance of any difference for comparison with body massindex (BMI) references designed for use from birth toadulthood. A total of 426 2-y-old and 525 3-y-old childrenincluded in the Dortmund Nutritional and AnthropometryalLongitudinally Designed (DONALD) Study. Length andstature were measured to the nearest millimeter using astadiometer. Agreement between both measurements at age2 and 3 y, respectively, was determined by mean differencesand by comparison with the German BMI reference. Theaverage length of 2-y-old girls and boys was 88.3 (3.1) and89.9 (3.2) cm, mean differences (stature minus length)were -0.47 (0.65) and -0.45 (0.64) cm. The correspondingBMI values were 16.18 (1.3) and 16.46 (1.2) kg/m2, withmean differences of +0.17 (0.24) and +0.16 (0.23).According to stature, 9.4% of the girls and 10.8% of theboys were overweight (>90th percentile), while length clas-sified 7.1 and 9.4% as overweight. Similar mean differencesbetween length and stature were observed at age 3 y:-0.53 (0.62) and -0.47 (0.65) cm in height and +0.17 (0.20)and +0.14 (0.20) kg/m2 in the BMI of girls and boys,respectively. According to stature, 7.6 and 7.3% were over-weight as opposed to 5.4 and 4.8% using length. Theobserved differences increased with higher BMI levels.Changing measurements from length to stature results inan upward shift of BMI, not reflected in current EuropeanBMI references. This small but systematic error may resultin misinterpretation of individual BMI levels or trendobservations.
9. Ref ID: 8Cogill, B. Anthropometry Indicators MeasurementGuide. US Agency for International Development [Foodand Nutrition Technical Assistance Project FANTA].2003. Washington, D.C., Academy for EducationalDevelopment.Abstract: This guide provides information on theAnthropometry Impact Indicators and the AnnualMonitoring Indicators for Maternal and Child Health/ChildSurvival and income related Title II activities. The impactindicators are: decreased percent of stunted children,decreased percent of underweight children, increasedpercent of eligible children in growth monitoring/ promo-tion, increased percent of children in growth promotionprogram gaining weight in past 3 months. The reportfocuses on children in developing countries under the ageof 5 years.
10. Ref ID: 59Cole, T. J. and Hall, D. M. B. What use is the BMI? Archivesof Disease in Childhood 91, 283–286. 2006.Abstract: The House of Commons Select Committee onobesity, and two expert groups in the USA, recommendthat the body mass index (BMI) of every school childshould be measured each year and the result sent home tothe parents. The BMI correlates sufficiently well with directmeasures of total body fat to support its use, on an anony-mous basis, as a public health tool for monitoring progressin dealing with the obesity epidemic. However, the BMI isan imperfect proxy for obesity because there is much indi-vidual variability in the relationship between BMI andbody fat, cardiovascular risk factors, and long term healthoutcomes. Whatever BMI cut offs are selected for deter-mining the advice to parents, a high BMI calls for furtherevaluation and interpretation and the policy proposed bythe Select Committee, to send BMI results to parents, istherefore in effect a screening programme.
Child Anthropometry Literature Scan
Canadian Inst itute of Chi ld Health � Transpor t Canada 40

11. Ref ID: 87Dieticians of Canada, The College of Family Physicians ofCanada, and Community Health Care Nurse Association ofCanada. The Use of Growth Charts for Assessing andMonitoring Growth in Canadian Infants and Children.Canadian Journal of Dietetic Practice and Research 65[1],22–32. 2004.Abstract: Because no geographically diverse growth chartexisted, in 1978 the World Health Organization (WHO)adopted the reference curves of the American NationalCentre for Health Statistics (NCHS) for international use.Until recently, these reference charts were the most widelyused in Canada secular changes in growth, availability ofimproved statistical methods for smoothing growth curves,and concerns related to limitations of the existing infantgrowth charts led to revisions of these charts and therelease in May 2000 of 16 new growth charts from theCDC. They consist of charts for infants from birth to agethree for weight, recumbent length, head circumference,and weight-for-recumbent length, and a set for childrenand adolescents from ages two to 20 for weight, height, andbody mass index. Weight-for-stature charts, which are onlyapplicable for weights and heights covering ages two toapproximately five, were also continued, in order to smooththe transition to using the BMI charts. The charts are avail-able in two forms. Individual charts include only one set ofpercentile curves per page (e.g., weight-for-age) and havethe grid scaled with English units (pounds, inches).Clinical charts include two sets of curves per page (e.g.,weight-for-age and height-for-age), have the grid scaled tometric units with English units in a secondary scale, andcontain a data entry box to record individual patient meas-urements and parental heights. The clinical charts weredesigned for use by health care providers.In adults, BMIhas been the most widely investigated and commonlyaccepted index for classifying adiposity, as well as the mostuseful indicator for identifying health risk associated withoverweight. International recommendations for the use ofBMI as a first indicator in assessing fatness in children andadolescents are relatively new. Because adiposity varieswith age and gender during childhood and adolescence,BMI is age and gender specific; consequently, BMI is plot-
ted according to age, using sex-specific charts. BMI-for-ageprovides a reference of overweight for older children andadolescents that was previously not available. It is consis-tent with adult BMI, so it can be used continuously fromage two to adulthood, and can therefore track body sizethroughout the lifecycle. In addition, BMI-for-age is also apredictor of health risks and future risk of being over-weight. It is strongly associated with clinical risk factors forthe diseases associated with overweight. BMI is significant-ly correlated with direct measures of body fat, as well assubcutaneous measures. BMI is now recommended forscreening overweight in children (over age two) and ado-lescents, rather than weight-for-stature. BMI values at agesbelow two have not been associated with adolescent oradult obesity; use of BMI before 24 months of age is there-fore not recommended. Weight-for-stature and BMI-for-ageare not interchangeable and do not produce equivalentresults. Weight-for-stature percentiles tend to be lower thanBMI-for-age centiles.
12. Ref ID: 27Gorstein, J. and Akre, J. The use of anthropometry toassess nutritional status. World Health StatisticsQuarterly 41[2], 48–58. 1988.Abstract: Anthropometry (the use of body measurementsto assess nutritional status) is a practical and immediatelyapplicable technique for assessing children’s developmentpatterns during the first years of life. An evaluation of theirgrowth also provides useful insights into the nutrition andhealth situation of entire population groups.Anthropometry indicators are less accurate than clinicaland biochemical techniques when it comes to assessingindividual nutritional status. In many field situationswhere resources are severely limited, however, anthropome-try can be used as a screening device to identify individu-als at risk of undernutrition, followed by a more elaborateinvestigation using other techniques. Similarly, growthmonitoring permits the detection of individuals with fal-tering growth, who can then be appropriately referred tospecialized care. Thanks to the standardization that hastaken place in recent years, changes in trends over timewith respect to the nutritional situation can be evaluated incountries where national food and nutrition surveillance
Child Anthropometry Literature Scan
Canadian Inst itute of Chi ld Health � Transpor t Canada 41
systems have been developed, or where nationally repre-sentative cross-sectional surveys have been conductedsome years apart using identical, or nearly identical,methodologies. Although data that can be used to evaluatetrends are limited, some insight can be gained into thenutritional situation and changes occurring over time in anumber of countries. Prevalence figures for underweight(low weight-for-age) have been prepared using standardmethods of data collection, analysis and presentation, forseveral countries in Africa, the Americas and Asia. As such,they fail to differentiate between wasting and stunting, orto evaluate differences between age groups. Also, they donot necessarily reflect trends in other countries in the sameor other regions. Still, it is interesting, if not statisticallysignificant, that there has been a general improvement inthe nutritional status of preschool children. Inter-countrytrend comparisons are difficult for two main reasons.Firstly, the time between surveys is occasionally differentand, secondly, despite efforts to standardize data analysisand presentation, different cut-off points have been used tocalculate prevalence figures and estimate the extent ofundernutrition. However, the use of identical cut-off pointsis not essential for making inter-country trend analysessince it is the general trends in growth deficit and nutri-tional status over time which is being evaluated. Over thepast 20 years, there has been substantial progress in thestandardization of anthropometry, which is the use of bodymeasurements to asses the nutritional status of individualsand groups. This brief examination of use of anthropome-try to assess nutritional status has tried to highlight itspossibilities for exploring nutritional status trends overtime. Although other methods have been employed for thispurpose, including clinical and biochemical techniques,none is as immediately applicable in purely practical termsas anthropometry. Children’s development patterns duringthe 1st years of life, when growth is the most rapid, providemuch information about their nutritional history, bothimmediate and cumulative. An evaluation of this growthprovides useful insights into the nutrition and health situa-tion not only of individuals but also of entire populationgroups. An admitted drawback in the present analysis isthe limited availability of data despite the wealth of coun-
try information that is known to have been collectednationally and regionally. It nevertheless demonstrates howsuch data, when used judiciously, can permit the identifica-tion of risk groups, contribute to the development ofappropriate food and nutrition policies, and serve as abaseline against which change over time can be realisticallyevaluated. It is hoped that with increased cooperationamong those responsible, nationally and internationally, forgrowth assessment and nutritional epidemiology, both thequantity and quality, and the successful management andapplication of this information will increase.
13. Ref ID: 79Hsiao, H., Long, D., and Snyder, K. Anthropometry differ-ences among occupational groups. Ergonomics 45[2],136–152. 2002.Abstract: In a pilot study, 33 anthropometric variableswere measured on 633 children aged 0–5.5 years. The vari-ables were chosen on the basis of international standardsand on the results of preliminary analysis of collisions.Methodical aspects of this pilot study are presented in thispaper, followed by two applications: anthropometricaspects of current regulations for cribs, playpens and toys;anthropometric aspects in the selection of wheelchairs forchildren. The paper concludes with a discussion on how topresent anthropometric data for non-special users.
14. Ref ID: 41Kaplowitz, H. J., Cronk, C. E., Martorell, R., and Rivera, J.Longitudinal principal components analysis of patternsand predictors of growth in Guatemalan children.American Journal of Human Biology 3[2], 169–180. 1991.Abstract: Longitudinal principal components (LPC) analy-sis was used to assess growth patterns in children from ruralGuatemala in order to determine if this methodology couldprovide additional information regarding correlates ofgrowth compared to more traditionally used methods basedon attained size and increments. LPC analysis reduces meas-ures at many points in time into a few parameters. However,LPC analysis requires complete data, and many cases maybe lost due to missing values. Thus the potentially greatersensitivity of LPC analysis should be weighed against thereduced power resulting from smaller sample sizes.Component indices representing centile level and centile
Child Anthropometry Literature Scan
Canadian Inst itute of Chi ld Health � Transpor t Canada 42

shift, attained size, and 3 to 36 month increments ofgrowth in length and weight were used as the dependentvariables in multiple regression models in order to exam-ine the effects of environmental variables, such as homedietary intake, supplementation, and prevalence of diar-rhea on growth. Regardless of which growth index, i.e.,attained size, incremental change, or principal component,was used, regression results were similar; higher nutrition-al intakes were generally associated with greater and morerapid growth from birth to age 3 years. The possible advan-tages of LPC analysis over more traditional methods werenot great; therefore, LPC analysis is not recommended asthe method of choice in this population.
15. Ref ID: 63Kuczmarski, R. J., Ogden, C. L., Grummer-Strawn, L. M.,Flegal, K. M., Guo, S. S., Wei, R., Mei, Z., Curtin, L. R., Roche,A. F., and Johnson, C. L. CDC growth charts: UnitedStates. Advanced Data 8[314], 1–27. 2000.Abstract: This report presents the revised growth chartsfor the United States. It summarizes the history of the 1977National Center for Health Statistics (NCHS) growth charts,reasons for the revision, data sources and statistical proce-dures used, and major features of the revised charts. Datafrom five national health examination surveys collectedfrom 1963 to 1994 and five supplementary data sourceswere combined to establish an analytic growth chart dataset. A variety of statistical procedures were used to producesmoothed percentile curves for infants (from birth to36 months) and older children (from 2 to 20 years), using atwo-stage approach. Initial curve smoothing for selectedmajor percentiles was accomplished with various paramet-ric and nonparametric procedures. In the second stage, anormalization procedure was used to generate z-scores thatclosely match the smoothed percentile curves. The 14 NCHSgrowth charts were revised and new body mass index-for-age (BMI-for-age) charts were created for boys and girls(http://www.cdc.gov/growthcharts). The growth percentilecurves for infants and children are based primarily onnational survey data. Use of national data ensures a smoothtransition from the charts for infants to those for olderchildren. These data better represent the racial/ethnicdiversity and the size and growth patterns of combined
breast- and formula-fed infants in the United States. Newfeatures include addition of the 3rd and 97th percentilesfor all charts and extension of all charts for children andadolescents to age 20 years. Created with improved dataand statistical curve smoothing procedures, the UnitedStates growth charts represent an enhanced instrument toevaluate the size and growth of infants and children.
16. Ref ID: 40Lampl, M. and Johnson, M. L. Identifying saltatorygrowth patterns in infancy: A comparison of resultsbased on measurement protocol. American Journal ofHuman Biology 9[3], 343–355. 1997.Abstract: The present analyses address the question ofhow frequently time-intensive growth measurements needto be taken in order to provide sufficient data for the statis-tical identification of pulsatile saltatory growth patternsduring infancy. The daily serial growth measurements ofthree infants during 4 months are analyzed in seven sub-sets, which include progressively fewer data points fromdaily to weekly intervals. Saltatory growth pulse identifica-tion and growth pattern analyses are compared betweenthe temporally distinctive data sets by the saltatory algo-rithm and continuous curvilinear models. Statistically sig-nificant pulse identification and saltatory growth patternresolution decrease with time intervals > 2–5 days in thesedata sets. These results suggest that the convenience of aMonday, Wednesday, Friday protocol may not be sufficientto characterize saltatory growth in individual infants, andthe dependability factor is a significant source of error thatmay contribute to growth pattern misperception in datacollected by infrequent protocols.
17. Ref ID: 88Lin, Y. C., Wang, M. J. J., and Wang, E. M. The comparisonsof anthropometry characteristics among four peoplesin East Asia. Applied Ergonomics 35, 173–178. 2004.Abstract: This study presents comparisons of ethnic difference in anthropometry characteristics among fourpeoples, i.e., Chinese, Japanese, Korean, and Taiwanese, inEast Asia. Anthropometry data from the four East Asiancountries were compared. The means of 33 body dimen-sions and 31 bodily proportions are presented. Also, 15 seg-mental proportions are illustrated. The results of statistical
Child Anthropometry Literature Scan
Canadian Inst itute of Chi ld Health � Transpor t Canada 43
analyses showed that there is a significant morphologicaldifference among these peoples in the same region. TheMainland Chinese body shape has a narrower body withmid-range limbs. The Japanese body shape is wider withshorter limbs. The Korean body shape is mid-range amongthe four peoples, but the upper limbs are longer. TheTaiwanese body shape has wide shoulder and narrow hipwith large hands and long legs. The ethnic diversity in bod-ily proportions should be considered as well as the meandimensions.
18. Ref ID: 46Mascarenhas, M. R., Zemel, B., and Stallings, V. A.Nutritional assessment in pediatrics. Nutrition 14[1],105–115. 1998.Abstract: Nutritional status affects every pediatricpatient’s response to illness. Good nutrition is importantfor achieving normal growth and development. Nutritionalassessment therefore should be an integral part of the carefor every pediatric patient. Routine screening measures forabnormalities of growth should be performed on all pedi-atric patients. Those patients with chronic illness and thoseat risk for malnutrition should have detailed nutritionalassessments done. Components of a complete nutritionalassessment include a medical history, nutritional historyincluding dietary intake, physical examination, anthropom-etrys (weight, length or stature, head circumference,midarm circumference, and triceps skinfold thickness),pubertal staging, skeletal maturity staging, and biochemi-cal tests of nutritional status. Alternative measures for lin-ear growth assessment (e.g., lower leg and upper armmeasures) can be performed on patients unable to stand orwho have musculoskeletal deformities. Bone densitometrycan be used to assess bone mineralization and the risk offracture. Nutritionally at risk patients may benefit fromdetermination of resting energy expenditure by indirectcalorimetry. The use of age, gender, and disease-specificgrowth charts is essential in assessing nutritional statusand monitoring nutrition interventions. The importance ofaccurate measurements using trained personnel andappropriate equipment cannot be overemphasized.
19. Ref ID: 42Meaney, F. J., Farrer, L. A., Opitz, J. M., and Reynolds, J. F.Clinical anthropometry and medical genetics: A com-pilation of body measurements in genetic and congeni-tal disorders. American Journal of Medical Genetics 25[2],343–359. 1986.Abstract: Anthropometry has become an important tool inthe study of genetic conditions, particularly as a diagnosticaid for the clinical geneticist. However, many practicingphysicians do not do anthropometry of patients for severalreasons, such as: appropriate measurements in a given situa-tion are unknown; normative reference data are unavailable;or analysis and interpretation of the data are confusing. Inthis review we present an annotated compilation ofinformative measurements for hereditary and congenitaldisorders and a guide to normative anthropometry data ofuse in evaluation and diagnosis of such disorders. Furtherdevelopment of multivariate approaches will enhance theapplication of anthropometry as a means of identifyingand classifying a syndrome and documenting the naturalhistory of many disorders. Continued cooperation amongphysicians, geneticists, and anthropologists for the collec-tion and assessment of patient and normative data isessential if these goals are to be realized.
20. Ref ID: 54Myatt, M., Khara, T., and Collins, S. A review of methodsto detect cases of severely malnourished children inthe community for their admission into community-based therapeutic care programs. Food and NutritionBulletin 27[3], 7–23. 2006.Abstract: The complexity and cost of measuring weight-for-height make it unsuitable for use by community-basedvolunteers. This has led community therapeutic care pro-grams to adopt a two-stage screening and admission pro-cedure in which mid-upper-arm circumference (MUAC) isused for referral and weight-for-height is used for admis-sion. Such a procedure results in many individuals beingreferred for care on the basis of MUAC but subsequentlybeing refused treatment because they do not meet theweight-for-height admission criterion. This “problem ofrejected referrals” has proved to be a major barrier to pro-gram uptake. The objective was to systematically review
Child Anthropometry Literature Scan
Canadian Inst itute of Chi ld Health � Transpor t Canada 44
methods to detect cases of severely malnourished childrenin the community for their admission into community-based therapeutic care programs. Clinical and anthropome-try methods for case detection of severely malnourishedchildren in the community were reviewed with regard totheir ability to reflect both mortality risk and nutritionalstatus. MUAC, with the addition of the presence of bipedaledema, was found to be the indicator best suited to screen-ing and case detection of malnutrition in the community.The case definition “MUAC < 110 mm OR the presence ofbipedal edema,” with MUAC measured by a color-bandedstrap, is suitable for screening and case detection ofmalnutrition in the community for children aged between6 and 59 months. Monitoring and discharge criteria werealso reviewed. There is no compelling evidence to supporta move away from using weight in combination with clini-cal criteria for monitoring and discharge.
21. Ref ID: 69Nash, A., Corey, M., Sherwood, K., Secker, D., Saab, J., andO’Connor, D. L. Growth assessment in infants and tod-dlers using three different reference charts. Journal ofPaediatric Gastroenterology and Nutrition 40[3], 283–288.2005.Abstract: The objective was to determine if the proportionof children < or =24 months old in a tertiary care facilitydefined as at risk of undernutrition or overnutrition differsaccording to different references used for assessment: theCenters for Disease Control and Prevention (CDC), NationalCenter for Health Statistics (NCHS) or Tanner-Whitehouse(Tanner) growth charts for weight-for-age and length-for-age. Lengths and weights were measured on infants(207 female, 341 male) aged < or =24 months admittedfrom or attending clinics in the General Pediatric orRespiratory Medicine Programs at The Hospital for SickChildren, Toronto. Weight-for-age and length-for-age per-centiles and percent ideal body weight were electronicallycomputed. The proportion of all children whose weight-for-age was <3rd percentile (at risk of undernutrition) wasgreatest using the CDC growth charts (22.5%) comparedwith the NCHS (15.9%) or Tanner (19.2%) growth charts.Likewise, the proportion of all infants/toddlers with per-cent ideal body weight <90 (at risk of undernutrition) was
greatest using the CDC (32.3%) compared with the NCHS(22.1%) or Tanner (25.9%) growth charts. In contrast, thepercentage of children whose percent ideal body weightwas > or =110% (at risk of overnutrition) was least usingthe CDC (18.1%) compared with the NCHS (26.1%) orTanner (22.4%) growth charts. More children aged < or=24 months will be defined as at risk of undernutritionand fewer at risk of overnutrition when using weight-for-age or percent ideal body weight and the CDC growthcharts compared with the NCHS or Tanner growth charts.As a result, requests for a more detailed nutritional assess-ment for undernutrition will likely follow implementationof the CDC growth charts in a tertiary care setting. As theCDC, NCHS and Tanner growth charts are growth “refer-ences” rather than “standards,” other than for screeningpurposes, they should not be used in isolation whenassessing growth and nutritional status.
22. Ref ID: 70Ogden, C. L., Kuczmarski, R. J., Flegal, K. M., Mei, Z., Guo, S.,Wei, R., Grummer-Strawn, L. M., Curtin, L. R., Roche, A. F.,and Johnson, C. L. Centers for Disease Control andPrevention 2000 growth charts for the United States:improvements to the 1977 National Center for HealthStatistics version. Paediatrics 109[1], 45–60. 2002.Abstract: The objective was to present a clinical version ofthe 2000 Centers for Disease Control and Prevention (CDC)growth charts and to compare them with the previous ver-sion, the 1977 National Center for Health Statistics (NCHS)growth charts. The 2000 CDC percentile curves were devel-oped in 2 stages. In the first stage, the empirical percentileswere smoothed by a variety of parametric and nonpara-metric procedures. To obtain corresponding percentilesand z scores, we approximated the smoothed percentilesusing a modified LMS estimation procedure in the secondstage. The charts include of a set of curves for infants, birthto 36 months of age, and a set for children and adolescents,2 to 20 years of age. The charts represent a cross-section ofchildren who live in the United States; breastfed infants arerepresented on the basis of their distribution in the U.S.population. The 2000 CDC growth charts more closelymatch the national distribution of birth weights than didthe 1977 NCHS growth charts, and the disjunction between
Child Anthropometry Literature Scan
Canadian Inst itute of Chi ld Health � Transpor t Canada 45

weight-for-length and weight-for-stature or length-for-ageand stature-for-age found in the 1977 charts has been cor-rected. Moreover, the 2000 CDC growth charts can be usedto obtain both percentiles and z scores. Finally, body massindex-for-age charts are available for children and adoles-cents 2 to 20 years of age. The 2000 CDC growth charts arerecommended for use in the United States. Pediatric clinicsshould make the transition from the 1977 NCHS to the2000 CDC charts for routine monitoring of growth ininfants, children, and adolescents.
23. Ref ID: 39Ramirez, M. E., Brauer, G. W., Prior, A. M., and Ward, R. H.Biological variability in a migrating isolate, the TokelauIslands: Child growth in different environments.American Journal of Human Biology 3[2], 189–201. 1991.Abstract: The magnitude and rates of growth have beencompared among two cross-sectional samples of Tokelauchildren on the basis of 26 anthropometry dimensions.One of the samples consisted of children living on theTokelau Islands. The migrant sample consisted of childrenof Tokelau descent who were living in New Zealand.The comparison between samples suggest significant dif-ferences in the rate of linear growth at the younger ages.However, most differences were not significant among17 year olds. The results support the hypothesis that evenwhen the original environment is favorable, qualitativechanges in the environment may affect the general patternof growth. The effects of an accelerated growth patterncannot be determined at this time.
24. Ref ID: 73Reyes, M. E., Tan, S. K., and Malina, R. M. Urban-ruralcontrasts in the growth status of school children inOaxaca, Mexico. Annals of Human Biology 30[6], 693–713.2003.Abstract: The growth status of school children resident inan urban colonia and in a rural indigenous community inOaxaca, southern Mexico, was considered in the context oftwo objectives, current status and the magnitude of urban-rural differences over a span of about 30 years. Both communities were initially surveyed in 1968 and 1972.Height, body mass, segment lengths, skeletal breadths, limbcircumferences, and subcutaneous fatness were taken on
361 rural (177 boys, 184 girls) and 339 urban (173 boys,166 girls) school children, aged 6–13 years. Additional vari-ables were derived. Height and body mass were significantlygreater in urban compared with rural children. Sittingheight, estimated leg length and skeletal breadths on thetrunk were also larger in urban than in rural school chil-dren, but only the difference in skeletal breadths was sig-nificant after age and body size were statisticallycontrolled. Urban and rural children did not consistentlydiffer in skeletal breadths on the extremities and limbcircumferences. Subcutaneous fatness was more variable.After controlling for age and body size, rural girls hadthicker skinfolds. The magnitude of the urban-rural differ-ence in boys in 2000 was greater for body mass, BMI andtriceps skinfold, and reduced for height, sitting height, leglength, and arm and estimated arm muscle circumferencescompared with 1970. The magnitude of the urban-ruraldifference in girls was greater in 2000 than 30 years earlierfor body mass, height, sitting height, leg length and BMI.Urban-rural differences for arm and arm muscle circum-ferences and the triceps skinfold were slightly smaller overthe interval. Children resident in an urban colonia weretaller and heavier than children resident in a rural indige-nous community. After controlling for age and body size,urban-rural differences in skeletal breadths and limb cir-cumferences were reduced or eliminated, but skinfoldthicknesses were greater in rural girls. The magnitude ofurban-rural differences in body size has decreased overapproximately 30 years in boys, but has increased in girls.
25. Ref ID: 53Schlenker, J. and Ward, R. Development and Applicationof a Paediatric Anthropometry Evaluation System.Canadian Journal of Dietetic Practice and Research 60[1],20–26. 1999.Abstract: Children with developmental disabilities are atincreased nutritional risk because of feeding problems,abnormal levels of physical activity, and altered weight andgrowth patterns. Children with physical disabilities areoften more difficult to measure because of muscular con-tractures, spasms, scoliosis, and the presence of splints,braces, or wheelchair accessories. In addition, body weightsmay be difficult to obtain for heavier children with limited
Child Anthropometry Literature Scan
Canadian Inst itute of Chi ld Health � Transpor t Canada 46

access to wheelchair scales. The purpose of this project wasto produce a package of anthropometry measurements eas-ier to use in children with physical disabilities but stillapplicable to able-bodied children, and computer softwareto generate growth charts. The project included the devel-opment of growth charts for each anthropometry measure-ment, using data from the Coquitlam Growth Study (921children aged six to 18) and the Sunny Hill Growth Study(567 children aged one to 5.9). The custom computer soft-ware allows serial plotting of a child’s measurements ongrowth charts, permitting comparative assessment ofgrowth and muscle and adipose tissue development. Theresultant Sunny Hill Anthropometry Pediatric EvaluationSystem (SHAPES) provides a tool for nutritional assess-ment and monitoring after intervention. The use ofSHAPES is illustrated with a case study of a child who rep-resented a challenge to traditional nutritional evaluation.
26. Ref ID: 74Shepard, J., Lavallee, H., Lariviere, G., Rajic, M., Brisson, G.R., Beaucage, C, Jequier, J. C., and La Barre, R. Physicalcapacity of Canadian children: a comparison amongFrench-Canadian, English-Canadian, and Eskimo children. II. Anthropometry and pulmonary volume.Union Medical du Canada 104, 259–269. 1975.
27. Ref ID: 80Smith, S. A. and Norris, B. J. Changes in the body sizes ofUK and US children over the past three decades.Ergonomics 47[11], 1195–1207. 2004.Abstract: The major sources of published anthropometrydata on children are now over two decades old. Due toconcern being expressed regarding the continued validityof such data, changes in the body sizes of the U.K. childpopulation over the past three decades have been consid-ered. Comparisons were also made between the size of thecurrent U.K. child population to the current U.S. child pop-ulation, and to the most comprehensive source of meas-ured data on U.S. children (but which are now over 20 yearsold). The growth of children in the U.K. and U.S. over thepast three decades was assessed for an indication of secu-lar growth trends. Stature increases were found to havegenerally been less than body weight increases (as a per-centage) at 5th percentile, mean and 95th percentile levels
for U.K. children, and U.K. children were found to be closerin size to U.S. children now than they were 30 years ago.
28. Ref ID: 35van’t Hof, M. A. and Haschke, F. The Euro-Growth Study:why, who, and how. Journal of Paediatric Gastroenterologyand Nutrition 31[Supplement 1], 3–13. 2000.Abstract: Assessment of growth is important in healthmanagement of infants and children. Evaluation of growthperformance requires anthropometry measurements, withproper interpretation depending on the use of appropriatereferences. Europe-specific growth references have notbeen available. The purpose of the present study was togenerate such references for infants and children frombirth to 3 years of age. The study was further intended toassess the influence of nutrition and lifestyle factors ongrowth. The Euro-Growth Study was designed as a multi-center longitudinal cohort study. This report describes thestudy design, the sample (cohort), and the methods used.Quality control measures included standardized measure-ment techniques with ongoing cross-sectional and longitu-dinal consistency checks. Selectivity in participation anddiscontinuation and reproducibility of data over time wereevaluated. Of 2,245 infants who were enrolled in the studyat 22 study sites in 11 countries, 1,746 (78%) provided lon-gitudinal data until 12 months of age, 1,205 (57%) until24 months of age, and 1071 (48%) until 36 months of age.Anthropometry measurements were performed on21,773 occasions. As a result of cross-sectional and longi-tudinal data checks, 209 data points (0.09% of all datapoints) were rejected. Comparison of participant’s demo-graphic data with those of nonparticipating local subjectsindicated that the cohort was selective in maternal age(higher), maternal education level (higher), householdlocation, and family structure. The withdrawal rate duringthe study was low (24%), and withdrawals occurred atrandom. Analysis of reproducibility over time resulted inthe elimination of the data from one study site. The Euro-Growth Study provided longitudinal growth data from alarge cohort of normal European children. Because of thechosen sampling method, the study cohort ws somewhatselective relative to the local background population.Internal validity was satisfactory in that the reproducibility
Child Anthropometry Literature Scan
Canadian Inst itute of Chi ld Health � Transpor t Canada 47

of anthropometry measurements was high in 21 sites andthe withdrawal rate was low and random.
29. Ref ID: 45Zemel, B. S., Riley, E. M., and Stallings, V. A. Evaluation ofmethodology for nutritional assessment in children:anthropometry, body composition, and energy expen-diture. Annual Review in Nutrition 17, 211–235. 1997.Abstract: Nutritional status in children is an indicator ofhealth and well-being at both the individual and the popula-tion level. Screening for malnutrition should be an integralpart of pediatric care universally. Nutritional interventionrequires repeated measurement of nutritional status toassess severity and to track progress over time.Methodological issues in the assessment of nutritional sta-tus are reviewed with emphasis on anthropometry meas-urement, body composition, and energy expenditure ofchildren at risk for malnutrition. Use of reference data,measurement error, maturational effects, and hereditaryfactors are among the issues reviewed and serve as guide-lines in the interpretation of measurement of nutritionalstatus.
30. Ref ID: 76Monthly growth status from a longitudinal study ofCanadian infants. Canadian Journal of Public Health81[3], 215–221. 1990.Abstract: Reference data for weight, recumbent length andhead circumference at 1-month intervals from 1 through18 months have been developed from measurements of351 healthy infants born at term in Montreal or Toronto.Each infant was measured serially from 1 to 18 months.A 3-parameter mathematical model was fitted to the serialdata for each infant. The model fitted the serial data wellfor almost all the infants as evaluated by the residual meansquare errors. Subsequently, values were estimated for eachmonth of age from 1 through 18 months for each infant.These estimated values allowed the development of refer-ence data that have been presented in tables and in graphs.
31. Ref ID: 106The National Longitudinal Survey of Children andYouth. 1996. Human Resources Development Canada andStatistics Canada.Abstract: The National Longitudinal Survey of Childrenand Youth (NLSCY), developed jointly by Human ResourcesDevelopment Canada and Statistics Canada, is a compre-hensive survey which follows the development of childrenin Canada and paints a picture of their lives. The surveymonitors children’s development and measures the inci-dence of various factors that influence their development,both positively and negatively. The second cycle, carriedout in 1996 and 1997, interviewed parents of the same chil-dren as Cycle 1 and provides unique insights into the evo-lution of children and their family environments over atwo-year period. The NLSCY will continue to collect infor-mation on these same children every two years as theymove into youth and adulthood.
32. Ref ID: 102CDC. National Health and Nutrition ExaminationSurvey III: Body Measurements (Anthropometry).National Center for Health Statistics. 1–57. 1988. USCenters for Disease Control and Prevention.Abstract: Introduction to anthropometry, equipment,examination protocol, logs and records and quality controlsection are presented in this report on how the NationalHealth and Nutrition Examination Survey III: BodyMeasurements was conducted.
33. Ref ID: 107Mirwald, R. L. 1964–1973 Saskatchewan Growth andDevelopment Study. Ostyn, M. Beunen G. Simons J.International Series on Sport Sciences. 9. 1978. Baltimore,MA, University Park Press.
34. Ref ID: 101National Center for Health Statistics. Change in thePhysical Dimensions of Children in the United States:Results from the National Health and NutritionExamination Surveys from the National Center forHealth Statistics. 1–67. 1998.Abstract: This report presents data analyses on bodydimensions of U.S. children (up to and including 18 yearsold) using data from nationally representative surveys con-
Child Anthropometry Literature Scan
Canadian Inst itute of Chi ld Health � Transpor t Canada 48
ducted ,by the National Center for Health Statistics (NCHS)over the last thirty years. In particular, we compare meanvalues from a baseline period in the mid 1970s with recentresults for the Third National Health and NutritionExamination Survey (NHANES III) conducted between1988 and 1994. We find a significant increase in size overall age ranges and both genders for the following fivemeasurements: weight, height, head circumference, wristbreadth, and biacromial breadth. For these measurements,we found a statistically significant increase in 65% of theage categories assessed. Of the six measures investigatedfor this report, the only measurement that did not followthe pattern of increased size was sitting height, whichshowed a statistically significant decrease for young chil-dren (up to age 7 years) and no increase for older children.Possible explanations for this change include demographicchanges in the population and measurement bias. We feelthat the change is more likely due to differences in surveyprocedures over time.
35. Ref ID: 72Shephard, R. J. and Rode, A. Growth patterns ofCanadian Inuit children. A longitudinal study. ArcticMedical Research 54[2], 60–68. 1995.Abstract: A longitudinal study has examined the growth ofheight, sitting height, body mass and triceps skinfolds in asample of Inuit (281 boys and 266 girls) attending theIgloolik School between the years 1981 and 1989. Heightswere around the 10th percentile of U.S. norms for 1970.A peak height velocity of 9.2 +/- 2.3 cm/year was reachedby girls at 11.3 +/- 0.7 years, and in boys the peak rate of8.6 +/- 3.7 cm/year was seen at 13.5 +/- 0.8 years. Sittingheights were also low relative to urban norms. Body massapproached the 50th percentile of U.S. norms, giving alarge mass for height ratio at all ages. Triceps thicknessesfor the girls were around the 10th percentile of urbannorms, and in the boys began around the 25th percentile,but dropped steadily to the 5–10th percentile. No signifi-cant differences of growth patterns were seen betweencohorts formed from students born in the years 1970/72,1973/74 and 1975/76. However, comparison with earliercross-sectional surveys in the same community showed asecular trend to greater stature and greater skinfold read-
ings as the community had become acculturated to suchfeatures of modern living as mechanized transport and tel-evision. There were no systematic differences of growthrates between the summer and the winter seasons, andnutrition was good throughout. We thus conclude that theshort stature has an inherited basis. Attention is drawn tothe problem of interpreting curves of growth and weightfor height in populations with an unusual body build.
36. Ref ID: 13Araújo, C. L., Albernaz, E., Tomasi, E., Victora, C. G., andWHO Multicentre Growth Reference Study Group.Implementation of the WHO Multicentre GrowthReference Study in Brazil. Food and Nutrition Bulletin25[Supplement 1], 53–59.Abstract: The World Health Organization (WHO)Multicentre Growth Reference Study (MGRS) SouthAmerican site was Pelotas, Brazil. The sample for the longi-tudinal component was drawn from three hospitals thataccount for approximately 90% of the city’s deliveries.The cross-sectional sample was drawn from a communitysurvey based on households that participated in the longi-tudinal sample. One of the criteria for site selection was theavailability of a large, community based sample of childrenwhose growth was unconstrained by socioeconomic condi-tions. Local work done in 1993 demonstrated that childrenof families with incomes at least six times the minimumwage had a stunting rate of 2.5%. Special public relationsand implementation activities were designed to promotethe acceptance of the study by the community and itssuccessful completion. Among the major challenges of thesite were serving as the MGRS pilot site, low baselinebreastfeeding initiation and maintenance rates, and reluctance among pediatricians to acknowledge the relevance of current infant feeding recommendations tohigher socioeconomic groups.
37. Ref ID: 16Baerug, A., Bjoerneboe, G. E. A., Tufte, E., Norum, K. R., andWHO Multicentre Growth Reference Study Group.Implementation of the WHO Multicentre GrowthReference Study in Norway. Food and Nutrition Bulletin25[Supplement 1], 72–77. 2004.
Child Anthropometry Literature Scan
Canadian Inst itute of Chi ld Health � Transpor t Canada 49

Abstract: The World Health Organization (WHO)Multicentre Growth Reference Study (MRGS) European sitewas Oslo, Norway. Oslo has a high breastfeeding rate.Ninety-nine percent of mothers initiate breastfeeding soonafter delivery, and 80% continue for at least six months.There is no evidence that socioeconomic conditions con-strain growth. As in other sites, the study had two compo-nents, longitudinal and cross-sectional. Recruitment forthe longitudinal component was conducted in three hospi-tals that account for most births in Oslo. Approximately850 subjects were screened in one year by using a system-atic allocation scheme to recruit a sample of about 300.Recruitment for the cross-sectional component was basedon a systematic interval sampling scheme prepared by theNational Registry. More than 4,000 subjects were screenedto achieve the required sample size. One of the major chal-lenges of the study was to achieve an acceptable participa-tion rate; great efforts were made to motivate pregnantwomen via the health care system and the media.
38. Ref ID: 15Bhandari, N., Taneja, S., Rongsen, T., Chetia, J., Sharma, P.,Bahl, R., Kumar Kashyap, D., Bhan, M. K., and WHOMulticentre Growth Reference Study Group.Implementation of the WHO Multicentre GrowthReference Study in India. Food and Nutrition Bulletin25[Supplement 1], 66–71. 2004.
Abstract: The World Health Organization (WHO)Multicentre Growth Reference Study (MGRS) Asian sitewas New Delhi, India. Its sample was drawn from 58 afflu-ent neighborhoods in South Delhi. This community wasselected to facilitate the recruitment of children who had atleast one parent with 17 or more years of education, a keyfactor associated with unconstrained child growth in thissetting. A door-to-door survey was conducted to identifypregnant women whose newborns were subsequentlyscreened for eligibility for the longitudinal study, and chil-dren aged 18 to 71 months for the cross-sectional compo-nent of the study. A total of 111,084 households werevisited over an 18-month period. Newborns were screenedat birth at 73 sites. The large number of birth in facilitiesused by this community, the geographically extensive studyarea, and difficulties in securing support of pediatricians
and obstetricians for the feeding recommendations of thestudy were among the unique challenges faced by theimplementation of the MGRS protocol at this site.
39. Ref ID: 18Dewey, K. G., Cohen, R. J., Nommsen-Rivers, L. A., Heinig,M. J., and WHO Multicentre Growth Reference StudyGroup. Implementation of the WHO MulticentreGrowth Reference Study in the United States. Food andNutrition Bulletin 25[Supplement 1], 84–89. 2006.Abstract: The World Health Organization (WHO)Multicentre Growth Reference Study (MRGS) NorthAmerican site was Davis, California. For the longitudinalcohort (0–24 months), 208 infants were enrolled betweenJanuary and December 1999 from five area hospitals atwhich nearly all Davis women give birth. The target samplesize was lower in the United States than in the other sites,because recruitment in the United States was restricted tomothers who were willing to exclusively breastfeed for atleast 4 months and continue breastfeeding for at least12 months. For the cross-sectional component, a mixed-longitudinal design was used, which required approximately500 subjects. The subjects were recruited by going door-to-door, with the sampling scheme based on the distributionof the subjects of the longitudinal study within the city. Thecross-sectional sample was recruited between January andJuly 2001. Major challenges during implementation weremaintaining daily communication with hospital personneland scheduling home visits.
40. Ref ID: 14Lartey, A., Owusu, W. B., Sagoe-Moses, I., Gomez, V., Sagoe-Moses, C., and WHO Multicentre Growth Reference StudyGroup. Implementation of the WHO MulticentreGrowth Reference Study in Ghana. Food and NutritionBulletin 25[Supplement 1], 60–65. 2004.Abstract: The World Health Organization (WHO)Multicentre Growth Reference Study (MGRS) African sitewas Accra, Ghana. Its sample was drawn from 10 affluentresidential areas where earlier research had demonstratedthe presence of a child subpopulation with unconstrainedgrowth. This subpopulation could be identified on the basisof the father’s education and household income. The sub-jects for the longitudinal study were enrolled from 25 hos-
Child Anthropometry Literature Scan
Canadian Inst itute of Chi ld Health � Transpor t Canada 50

pitals and delivery facilities that accounted for 80% of thestudy area’s births. The cross-sectional sample was recruit-ed at 117 day-care centers used by more than 80% of thetargeted subpopulation. Public relations efforts weremounted to promote the study in the community. The largenumber of facilities involved in the longitudinal and cross-sectional components, the relatively large geographic areacovered by the study, and the difficulties of working in adensely populated urban area presented special challenges.Conversely, the high rates of breastfeeding and generalsupport for this practice greatly facilitated the implementa-tion of the MGRS protocol.
41. Ref ID: 12Onyango, A. W., Pinol, A. J., de Onis, M., and WHOMulticentre Growth Reference Study Group. Managingdata for a multicountry longitudinal study: experiencefrom the WHO Multicentre Growth Reference Study.Food Nutrition Bulletin 25[Supplement 1], 46–52. 2004.Abstract: The World Health Organization (WHO)Multicentre Growth Reference (MGRS) data managementprotocol was designed to create and manage a large databank of information collected from multiple sites over aperiod of several years. Data collection and processinginstruments were prepared centrally and used in a stan-dardized fashion across sites. The data management sys-tem contained internal validation features for timelydetection of data errors, and its standard operating proce-dures stipulated a method of master file updating and cor-rection that maintained a clear trail for data auditingpurposes. Each site was responsible for collecting, entering,verifying, and validating data, and for creating site-levelmaster files. Data from the sites were sent to the MGRSCoordinating Centre every month for master file consolida-tion and more extensive quality control checking. All errorsidentified at the Coordinating Centre were communicatedto the site for correction at source. The protocol imposedtransparency on the sites’ data management activities butalso ensured access to technical help with operation andmaintenance of the system. Through the rigorous imple-mentation of what has been a highly demanding protocol,the MGRS has accumulated a large body of very high-qual-ity data.
42. Ref ID: 17Prakash, N. S., Mabry, R. M., Mohamed, A. J., Alasfoor, D.,and WHO Multicentre Reference Study Group.Implementation of the WHO Multicentre GrowthReference Study in Oman. Food and Nutrition Bulletin25[Supplement 1], 78–83. 2004.Abstract: The World Health Organization (WHO)Multicentre Growth Study (MGRS) Middle East site wasMuscat, Oman. A survey in Muscat found that children inhouseholds with monthly incomes of at least 800 OmaniRials and at least four years of maternal education experi-enced unconstrained growth. The longitudinal study sam-ple was recruited from two hospitals that account for over90% of the city’s births; the cross-sectional sample wasdrawn from the national Child Health Register. Residents ofall districts in Muscat within the catchment area of the twohospitals were included except Quriyat, a remote district ofthe governorate. Among the particular challenges of thesite were relatively high refusal rates, difficulty in securingadherence to the protocol’s feeding recommendations,locating children selected for the cross-sectional compo-nent of the study, and securing the cooperation of the chil-dren’s fathers. These and other challenges were overcomethrough specific team building and public relations activi-ties that permitted the successful implementation of theMGRS protocol.
Obesity1. Ref ID: 110
Canning, P. M., Courage, M. L., and Frizzell, L. M.Prevalence of overweight and obesity in a provincialpopulation of Newfoundland children. CanadianMedical Association Journal 171, 240–242. 2004.Abstract: More and more school-aged children in Canadaand elsewhere are becoming overweight or obese. Manycountries are now reporting a similar trend among pre-school children. However, little information is available onthe prevalence of overweight and obesity among preschoolchildren in Canada. In addition, available data are based onreported rather than measured heights and weights. Weconducted this study to determine the prevalence of over-weight and obesity, using measured heights and weights, inthe 1997 cohort of children aged 3–5 years born in
Child Anthropometry Literature Scan
Canadian Inst itute of Chi ld Health � Transpor t Canada 51

Newfoundland and Labrador. We calculated the body massindices (BMIs) using heights and weights measured bypublic health nurses during the province-wide PreschoolHealth Check Program conducted between October 2000and January 2003. Descriptive data on the children’s BMIsand prevalence estimates were generated and analyzed bysex and age with the use of the classification system rec-ommended by the International Obesity Task Force. Datawere available for 4161 of the 5428 children born in 1997;boys and girls were equally represented (50.1% and 49.9%respectively). Overall, 25.6% of the preschool children inthe cohort were overweight or obese. The rates did not dif-fer significantly by sex or age group. These results indicatethat a high proportion of children aged 3–5 years inNewfoundland and Labrador are overweight or obese.It appears that prevention measures should begin beforethe age of 3 years.
2. Ref ID: 108Charbonneau-Roberts, G., Saudny-Unterberger, H.,Egeland, G. M., and Kuhnlein, H. V. Body mass index mayoverestimate the prevalence of overweight and obesityamong the Inuit. International Journal of CircumpolarHealth 64[2], 163–169. 2005.Abstract: Body mass index (BMI) is a widely used bodyweight classification system but has known limitations, andmay need to be adjusted for sitting height in order to beuseful as an indicator of health risks in special popula-tions. Data confirm that Inuit and Far East Asians haveshorter legs and relatively higher sitting heights comparedwith all other populations. Using standing height alone tocalculate the BMI may overestimate the number of individ-uals that are overweight and obese, and at risk for type 2diabetes mellitus and cardiovascular disease among theInuit. Measuring sitting height allows for the calculation ofa sitting height-to-standing height ratio (SH/S) which canbe used to correct the observed BMI. Incorporating sittingheight measurements into health research could help for-mulate Inuit-specific screening guidelines.
3. Ref ID: 75de Onis, M. The use of anthropometry in the preventionof childhood overweight and obesity. 28. InternationalJournal of Obesity and Related Metabolic Disorders[Supplement 3], 81–85. 2004.Abstract: The objective is to review concepts and proposemeasures related to the use of anthropometry for earlyidentification of excessive weight gain in children. Reviewof results from national and international studies focusingon the assessment of childhood growth, and evaluation ofthe weight-for-height z-scores of individual children usingthe 1977 National Center for Health Statistics and the2000 Centers for Disease Control and Prevention growthcharts. At present, few countries (23%) use indicatorsbased on weight and height measurements to classify childbody weight status. Less than one-third of growth monitor-ing programmes assess the growth of children beyond 6 yof age. Growth charts based on descriptive samples of pop-ulations undergoing increasing trends of childhood over-weight and obesity result in substantial underestimation oftrue rates of these conditions. Early recognition of exces-sive weight gain relative to linear growth should becomestandard clinical practice by the following: (a) the routinecollection of height measurements to enable monitoringweight-for-height and body mass index (BMI); (b) theexpansion of existing monitoring programmes to includethe assessment of all children up to 18 y at least once ayear; (c) the interpretation of weight-for-height and BMIindices based on prescriptive reference data; and (d) theearly intervention after an increase in weight-for-height orBMI percentiles has been observed.
4. Ref ID: 61Despres, J. P., Macdonald, S. M., Reeder, B. A., and Chen, Y.Obesity in Canada: a descriptive analysis. CanadianMedical Association Journal 157[1], 3. 1997.Abstract: The objective is to describe the distribution ofbody fat, prevalence of obesity, and knowledge of cardio-vascular disease in Canadian adults. Design: Population-based, cross-sectional surveys. Setting: Ten Canadianprovinces between 1986 and 1992. Participants: A probabilitysample of 29 855 men and women aged 18 to 74 years wasselected using health insurance registration files in each
Child Anthropometry Literature Scan
Canadian Inst itute of Chi ld Health � Transpor t Canada 52

province. Anthropometry was performed on 19 841 (66%)of these adults. Outcome measures: Body mass index(BMI); waist circumference; ratio of waist to hip circumfer-ence; knowledge of causes of heart disease. Results: Theoverall prevalence of obesity (BMI >/= 27 kg/cm)increased with age and was greater in men (35%) than inwomen (27%). Abdominal obesity was also higher in menand increased with both age and BMI. Canadians withlower levels of education had a higher prevalence of obesi-ty, which appeared at a young age. Canadians in AtlanticCanada mentioned lack of exercise, poor diet and smokingas causes of heart disease less frequently than those livingin central or western Canada. Conclusions: Obesity contin-ues to be common among Canadian adults. Policy and pro-grams to promote healthy body weights must be intensifiedand directed at specific sociodemographic groups. Duringthe last 20 years, obesity in Canadians has drawn the atten-tion of clinicians, the private sector and government. Therecognition of obesity as a health issue by the federal gov-ernment led to the development of Canadian Guidelines forHealthy Weights, the Task Force on the Treatment ofObesity and Canada’s Food Guide to Healthy Eating, as wellas other documents promoting healthy weights and healthyeating. Complementing these initiatives, national projectssuch as Participation and Active Living have promotedphysical activity to Canadians over the last two decades.The adverse effects of being overweight are being reportedwith increasing frequency. Diabetes, hypertension, cardio-vascular disease and some cancers are associated with obe-sity. Various measures of body fat distribution, includingbody mass index (BMI), waist circumference (WC) and theratio of waist to hip circumference (WHR) have beendeveloped and related to cardiovascular risk. Economiccosts have also been identified. A range of anthropometrydata on Canadians were collected in the 1978 CanadaHealth Survey, the 1981 Canada Fitness Survey and the1988 Campbell’s Survey on Well-Being in Canada, whichwas a longitudinal follow-up of the 1981 survey. In 1985and 1990, the Health Promotion Survey collected self-reported data on height and weight. The General SocialSurveys, which focused on health in 1985 and 1991, alsoestimated obesity in Canadians based on self-reported
data. In the 1978 Canada Health Survey of Canadians aged20–69 years, 31% of participants had a BMI over 27 kg/cm”(34% of men and 29% of women). For the same agegroups, the 1981 Canada Fitness Survey showed that 29%of men and 19% of women had a BMI greater than27 kg/cm, with an overall rate of 24%. These two surveysalso demonstrated an uneven distribution of BMI acrossCanada, obesity being more prevalent in the easternprovinces than the western. The 1988 Campbell’s Survey,based on BMI, amount of subcutaneous fat or location offat revealed that 50% of men and 41% of women aged15–65 years were at health risk due to obesity. More recent-ly the General Social Surveys reported that the prevalenceof overweight (BMI >/= 27 kg/cm among men aged25–64 years, increased from 20% in 1985 to 30% in 1991.In women, the age-standardized prevalence of overweightincreased from 14% to 20% in the same period. Using sim-ilar methods, the Health Promotion Survey showed that,between 1985 and 1990, the prevalence of overweight rosefrom 19% to 27% in men and 14% to 18% in women, aged18 years and over. Comparisons suggest a lower prevalenceof obesity. in Europe than in North America. In GreatBritain, the prevalence of obesity. (BMI > 30 kg/cm) doubled between 1980 and 1991. A BMI over 30 kg/cm wasfound in approximately 10% of people in the majority ofthe populations within the WHO MONICA project. Anupward trend in obesity within the last two decades isreported in the Netherlands, the United States, the CzechRepublic, Finland and Sweden. As part of the Canadianheart health initiative, population-based surveys of theprevalence of cardiovascular risk factors, attitudes andknowledge were undertaken in all 10 provinces. This pro-vides a unique opportunity to examine the distribution ofbody weight and its correlation to risk factors for cardio-vascular disease and various physiologic measures.
5. Ref ID: 60Despres, J. P., Lambert, J., and Reeder, B. A. Correlationbetween cardiovascular disease risk factors and simpleanthropometry measures. Canadian Medical AssociationJournal 157[1], 46. 2006.Abstract: The objective is to assess simple anthropometrymeasures as indicators of the concurrent presence of high
Child Anthropometry Literature Scan
Canadian Inst itute of Chi ld Health � Transpor t Canada 53

blood pressure, dyslipidemia and diabetes mellitus inadults. Design: Population-based, cross-sectional surveys.Setting: Five Canadian provinces between 1990 and 1992.Participants: A probability sample of 16 007 men andwomen aged 18 to 74 years was selected using health insur-ance registration files in each province. This study is basedon the 9826 adults (61%) for whom anthropometry meas-urements were obtained. Outcome measures: Step-wisemultiple logistic regression analysis was used to model theassociation between demographic, anthropometry and riskvariables and the presence of high systolic and diastolic(DBP) blood pressure, elevated levels of total (TC), high-density lipoprotein (HDL) and low-density lipoproteincholesterol, C/HDL ratio, triglyceride levels (TRIG) andself-reported diabetes mellitus. Age group and sex arestrongly associated with all three conditions. Sedentarylifestyle is significantly associated with high DBP, depressedHDL and elevated TC/HDL and TRIG. Anthropometrymeasures are moderately associated with all conditions.The measures of body fat (body mass index) as well asabdominal fat distribution (waist circumference and ratioof waist to hip circumference) play an approximately equalrole. Patients’ age, sex, level of physical activity, body fatand abdominal fat distribution can be used as indicators ofthe probability of high blood pressure, dyslipidemia anddiabetes mellitus. The 1988 Canadian report on healthyweights concluded that distribution of adipose tissue maybe a better indicator of the presence of risk factors for car-diovascular disease and diabetes than weight-to-heightindices. Until recently, the ratio of waist to hip circumfer-ence (WHR) has been suggested as a useful measurementof body fat distribution, and many studies have been con-ducted on the association between WHR and cardiovas-cular risks. Abdominal fat has been associated withhypertension. Studies have also shown that the relative riskof cardiovascular disease, myocardial infarction, ischemicheart disease and stroke increases by 2 to 11-fold, depend-ing on the end point, between the first and fifth quintiles ofWHR distribution. An increase in risk was also observedwith WHR values over specific cut-off points, independentof the degree of obesity. Cross-sectional as well as cohortstudies showed that WHR was also better associated with
risk of cardiovascular disease in women than in men.Abdominal fat accumulation, as estimated by WHR, hasbeen associated with increases in levels of plasma triglyc-erides and glucose, elevated systolic and diastolic bloodpressure and resistance to insulin. Furthermore, if we add ameasure of obesity or excess weight, the indicative capacityof WHR is improved in women and in men. An optimal orhealthy range has been identified for body mass index(BMI) but, due to lack of sufficient epidemiologic data, notfor waist circumference (WC) or WHR. It has been suggest-ed that the risk of developing health problems increaseslinearly beyond specific cut-off points; however, the exactrelation between obesity and fat distribution and cardio-vascular risk factors is unclear. The objective of this studywas to examine the indicative capacity of WHR and WC atdifferent levels of BMI, for the presence of high blood pres-sure, abnormal lipid levels and diabetes. Methods Non-institutionalized Canadian men and women, between theages of 18 and 74 years, participated in sample surveysconducted between 1986 and 1992 in all 10 provinces.Details of the survey methods have been described earlier.In brief, a probability sample of 29 977 people was selectedusing the health insurance registration files of eachprovince and invited to participate. Height and weight weremeasured in all provinces, whereas WC and hip circumfer-ence (HC) were measured only in Alberta, Manitoba,Ontario, Quebec and Saskatchewan. In these 5 provinces,16 007 people were invited to participate. A sample of 9826people, for whom all 4 anthropometry measurements(weight, height, WC and HC) and at least 1 metabolic vari-able were available, was studied for this paper. Participantsin the study sample were significantly older (mean age38 years) than those not included because full data werenot available (mean age 43 years, p < 0.001). However,there was no significant difference between the two groupswith respect to sex or the prevalence of high blood pressureor diabetes. Anthropometry measurements were per-formed in the morning on fasting (12 h) participantsdressed in indoor clothing without shoes. Height wasmeasured to the nearest centimeter, with participantsstanding on a hard surface against a wall, using a squareand tape measure fixed to the wall.
Child Anthropometry Literature Scan
Canadian Inst itute of Chi ld Health � Transpor t Canada 54

6. Ref ID: 51Flynn, M. A., Hall, K., Noack, A., Clovechok, S., Enns, E.,Pivnick, J., Naimish, A., Wouts, P., Best, M., and Pryce, C.Promotion of healthy weights at preschool publichealth vaccination clinics in Calgary: an obesity surveillance program. Canadian Journal of Public Health96[6], 421–426. 2005.Abstract: The objective is to evaluate the acceptability andfeasibility of a surveillance program of overweight andobesity in preschool children in Calgary, and to provideadvice for families to promote healthy weights. Children(mean age 4.9+/-0.6 years) attending pilot-site clinics inSeptember 2002 and all clinics in Calgary betweenFebruary 2003–December 2003 (n=7048). The growthassessment protocol and resources supported a three-pronged approach to promote healthy weights (healthy eat-ing, active living and positive body image). Public healthnurses were trained in standardized measurement tech-niques and information resources. Links with physicianswere made to facilitate continuity of care. Children’s weightand height measurements were plotted on the Weight-for-Stature growth chart and used to identify children as obese(> or =95th percentile), healthy weight (> or =5th, <95th)or underweight (<5th). Subsequent analysis calculated theBody Mass Index (BMI)-for-Age to identify overweightchildren (> or =85th, <95th percentile). The protocol waspilot tested and subsequently implemented in all Calgarypublic health clinics. The majority (98%) of parents wereeither very happy or happy with information received dur-ing the visit. Public health nurse counseling confidence sig-nificantly improved after the pilot (p<0.001). Dataindicated that 9% of children were obese, 15% were over-weight and 3% were underweight. This approach to identi-fying children’s weight status appeared satisfactory tostakeholders, maximized use of existing resources to estab-lish a surveillance program for Calgary, and provided anopportunity to give parents health-promoting advice onhealthy weights.
7. Ref ID: 50Flynn, M. A., McNeil, D. A., Maloff, B., Mutasingwa, D., Ford,C., and Tough, S. C. Reducing obesity and related chron-ic disease risk in children and youth: a synthesis of evi-dence with ‘best practice’ recommendations. Obesityreviews: an official journal of the International Associationfor the Study of Obesity 7[Supplement 1], 7–66. 2006.Abstract: Childhood obesity is a global epidemic and ris-ing trends in overweight and obesity are apparent in bothdeveloped and developing countries. Available estimates forthe period between the 1980s and 1990s show the preva-lence of overweight and obesity in children increased by amagnitude of two to five times in developed countries (e.g.,from 11% to over 30% in boys in Canada), and up toalmost four times in developing countries (e.g., from 4% to14% in Brazil). The goal of this synthesis research studywas to develop best practice recommendations based on asystematic approach to finding, selecting and criticallyappraising programmes addressing prevention and treat-ment of childhood obesity and related risk of chronic dis-eases. An international panel of experts in areas ofrelevance to obesity provided guidance for the study. Thissynthesis research encompassed a comprehensive search ofmedical/academic and grey literature and the Internet covering the years 1982–2003. The appraisal approachdeveloped to identify best practice was unique, in that itconsidered not only methodological rigour, but also popula-tion health, immigrant health and programme develop-ment/evaluation perspectives in the assessment. Scoreswere generated based on pre-determined criteria with pro-grammes scoring in the top tertile of the scoring range inany one of the four appraisal categories included for furtherexamination. The synthesis process included identificationof gaps and an analysis and summary of programmedevelopment and programme effectiveness to enable con-clusions to be drawn and recommendations to be made.The results from the library database searches (13,158hits), the Internet search and key informant surveys werereduced to a review of 982 reports of which 500 wereselected for critical appraisal. In total 158 articles, represent-ing 147 programmes, were included for further analysis. Themajority of reports were included based on high appraisal
Child Anthropometry Literature Scan
Canadian Inst itute of Chi ld Health � Transpor t Canada 55

scores in programme development and evaluation withlimited numbers eligible based on scores in other categoriesof appraisal. While no single programme emerged as amodel of best practice, synthesis of included programmesprovided rich information on elements that represent inno-vative rather than best practice under particular circum-stances that are dynamic (changing according to populationsubgroups, age, ethnicity, setting, leadership, etc.). Thus thefindings of this synthesis review identifies areas for action,opportunities for programme development and researchpriorities to inform the development of best practice rec-ommendations that will reduce obesity and chronic diseaserisk in children and youth. A lack of programming toaddress the particular needs of subgroups of children andyouth emerged in this review. Although immigrants new todeveloped countries may be more vulnerable to the obeso-genic environment, no programmes were identified thatspecifically targeted their potentially specialized needs(e.g., different food supply in a new country). Children0–6 years of age and males represented other populationsubgroups where obesity prevention programmes and evidence of effectiveness were limited. These gaps are ofconcern because (i) the pre-school years may be a criticalperiod for obesity prevention as indicated by the associa-tion of the adiposity rebound and obesity in later years;and (ii) although the growing prevalence of obesity affectsmales and females equally; males may be more vulnerableto associated health risks such as cardiovascular disease.Other gaps in knowledge identified during synthesisinclude a limited number of interventions in home andcommunity settings and a lack of upstream population-based interventions. The shortage of programmes in com-munity and home settings limits our understanding of theeffectiveness of interventions in these environments, whilethe lack of upstream investment indicates an opportunityto develop more upstream and population-focused inter-ventions to balance and extend the current emphasis onindividual-based programmes. The evidence reviewedindicates that current programmes lead to short-termimprovements in outcomes relating to obesity and chronicdisease prevention with no adverse effects noted. This sup-ports the continuation and further development of pro-
grammes currently directed at children and youth, as fur-ther evidence for best practice accumulates. In this synthe-sis, schools were found to be a critical setting forprogramming where health status indicators, such as bodycomposition, chronic disease risk factors and fitness, canall be positively impacted. Engagement in physical activityemerged as a critical intervention in obesity preventionand reduction programmes. While many programmes inthe review had the potential to integrate chronic diseaseprevention, few did; therefore efforts could be directedtowards better integration of chronic disease preventionprogrammes to minimize duplication and optimizeresources. Programmes require sustained long-termresources to facilitate comprehensive evaluation that willascertain if long-term impact such as sustained normalweight is maintained. Furthermore, involving stakeholdersin programme design, implementation and evaluationcould be crucial to the success of interventions, helping toensure that needs are met. A number of methodologicalissues related to the assessment of obesity intervention andprevention programmes were identified and offer insightinto how research protocols can be enhanced to strengthenevidence for obesity interventions. Further research isrequired to understand the merits of the various forms inwhich interventions (singly and in combination) are deliv-ered and in which circumstances they are effective. There isa critical need for the development of consistent indicatorsto ensure that comparisons of programme outcomes canbe made to better inform best practice.
8. Ref ID: 6Hanley, A. J. G., Harris, S. B., Barnie, A., Gittelsohn, J.,Wolever, T. M. S., Logan, A., and Zinman, B. The SandyLake Health and Diabetes Project: Design, Methodsand Lessons Learned. Chronic Diseases in Canada 16[4],149–156. 1995. Public Health Agency of Canada.Abstract: This paper presents the methodology used in aprevalence study of non-insulin-dependent diabetes mellitus(NIDDM) among native Canadians living in an isolatednorthwestern Ontario community. Volunteers aged 10 andolder were screened using a 75-g oral glucose tolerance testin accordance with the World Health Organization’s criteria.Interviewer-administered questionnaires were used to col-
Child Anthropometry Literature Scan
Canadian Inst itute of Chi ld Health � Transpor t Canada 56

lect information on demographics, current and historicalphysical activity, diet, family history of diabetes and healthknowledge. Anthropometry measurements included bodymass index, waist-to-hip ratio and percent body fat frombioelectrical impedance analysis. Fitness level was assessedusing a three-stage step test. Participation and communityresponse were excellent, and this can be attributed in largepart to the partnership that was established between theresearchers and the community, and the employment oflocal people as recruiters and interviewers. The many valu-able lessons learned during the process are discussed.
9. Ref ID: 3Haque F, de la Rocha AG, Horbul BA, Desroches P, andOrrell C. Prevalence of childhood obesity in northeast-ern Ontario: a cross-sectional study. Canadian Journal ofDietetic Practice and Research 67[3], 143–147. 2006.Abstract: In Canada, the incidence of childhood obesity hastripled within the past 20 years. The prevalence of obesity inthe Timmins, Ontario, student population was studied togain knowledge for program planning and resource alloca-tion, and to compare Centers for Disease Control andPrevention (CDC) criteria with Cole’s international criteriafor childhood obesity. Anthropometry measurements of801 students were taken. Students were chosen from ran-domly selected schools for each grade. Data were analyzedaccording to age, gender, and ethnicity. Data were alsocompared with other studies. Intragroup comparisons wereperformed using hypothesis testing for significance withthe z table and chi-square test. Overweight and obesityprevalence was 28% according to CDC criteria. No statisti-cal difference was found between genders or among ethnicgroups, or between this study and other Canadian studies.In comparison with the CDC criteria, Cole’s internationalcriteria indicated less obesity and increased overweightprevalence. These differences were not statistically signifi-cant. The findings suggest that in the northern Ontariocommunity of Timmins, the prevalence of childhood obe-sity is of epidemic proportions. When the findings areshared with different agencies, this study will help thehealth unit to take necessary public health measures tocurb the epidemic.
10. Ref ID: 2He, M and Beynon, C. Prevalence of overweight and obe-sity in school-aged children. Canadian Journal of DieteticPractice and Research 67[3], 125–129. 2006.Abstract: Childhood obesity is a public health concern inCanada. Few published anthropometry data are available toindicate obesity prevalence in Canadian children. Obesityprevalence is reported for school-aged children in 11London, Ontario, schools. Data on body weight and heightwere obtained using standardized procedures. UnitedStates Centers for Disease Control and Prevention (CDC)body mass index (BMI)-for-age references and Cole’s inter-national BMI reference were used to classify the children’sweight categories. The study included 1,570 pupils aged sixto 13. The CDC BMI references categorized 16.6% and11.8% of children as overweight and obese, respectively. Incomparison, when the Cole BMI reference and cut-offpoints were used, 17.5% and 7.6% of children were classi-fied as overweight and obese, respectively. Overweight isprevalent in the study population. Public health interven-tions are warranted to curb the obesity epidemic in school-aged children.
11. Ref ID: 112He, M. and Sutton, J. Using routine growth monitoringdata in tracking overweight prevalence in young chil-dren. Canadian Journal of Public Health 95, 419–423. 2004.No abstract available.
12. Ref ID: 109Janssen, I., Katzmarzyk, P. T., Boyce, W. F., King, M. A., andPickett, W. Overweight and obesity in Canadian adoles-cents and their associations with dietary habits andphysical activity patterns. Journal of Adolescent Health35[5], 360–367. 2004.Abstract: To present recent overweight and obesity preva-lence rates for 11–16-year-old Canadian youth and toexamine associations between overweight and obesity withdietary habits and leisure-time physical activities.Nationally representative sample of 11–16-year-old adoles-cents (n = 5890) from the Canadian component of the2001/02 World Health Organization Health Behaviour inSchool-Aged Children Survey were used. Height, weight,dietary habits, and leisure-time activities were determined
Child Anthropometry Literature Scan
Canadian Inst itute of Chi ld Health � Transpor t Canada 57

from self-report. Age- and gender-specific prevalence ratesof overweight and obesity were calculated based on inter-national body mass index cut-points. Logistic regressionwas employed to examine the association among measuresof overweight, obesity, and lifestyle habits. Fifteen percentof 11–16-year-old Canadian youth were overweight (pre-obese) and 4.6% were obese in 2002. These prevalencerates were greater in boys than girls (p < .001), but did notvary according to age. There were no clear associationsobserved between dietary habits and measures of over-weight and obesity. However, physical activity levels werelower (p < or = .05) and television viewing times werehigher (p < .01) in overweight and obese boys and girlsthan normal-weight youth. The prevalence rates of over-weight and obesity in Canadian youth are high. The resultssuggest that physical inactivity and sedentary behaviorsare strongly related to obesity in Canadian adolescents.
13. Ref ID: 52Patterson, L., Jarvis, P.,Verma,A., Harrison, R., and Buchan, I.Measuring children and monitoring obesity: surveys ofEnglish Primary Care Trusts 2004–2006. Journal ofPublic Health, in print. 2006.Abstract: Child obesity has unclear determinants and con-sequences. A precautionary approach requires best-guessinterventions and large-scale surveillance. This study wasto determine the current measurement activities and theinformation systems required for child obesity surveil-lance. Design: Questionnaire-based surveys. Setting:Primary Care Trusts (PCTs) in United Kingdom.Participants: Two hundred and forty-seven (82%) PCTs in2004 and 240 (79%) in 2006. Main measures: Children’sages at which height and weight are routinely measured,the type of personnel taking the measurements, arrange-ments for recording data, information systems and uses ofthe data. PCTs measure height/length and weight mostcommonly at 6 weeks (74%) and 5 years (74%) — also at6–12 months (58%), 1.5–2.5 years (50%), 2.5–4 years(40%), 11 years (18%) and 7 years (11%). Seventy-sevenper cent of PCTs transferred the measurements to a data-base — 26 different information systems were named. Sixper cent of PCTs in 2004, rising to 34% in 2006, used thedata to produce public health reports. Body mass index
(BMI) surveillance requires new arrangements in 25% ofPCTs at school entry and 80% at transfer to senior school.Important aspects of child obesity surveillance not yetaddressed are pre-school measurement, longitudinalassessment and the public health requirements of (child)electronic health records.
14. Ref ID: 65Power, C., Lake, J. K., and Cole, T. J. Measurement andlong-term health risks of child and adolescent fatness.International Journal of Obesity and Related MetabolicDisorders 21[7], 507–526. 1997.Abstract: This paper reviews child and adolescent adiposi-ty measures and associated long-term health risks. Thefirst section argues that anthropometry measures are prac-tical for large scale epidemiological studies, particularly thebody mass index. Limitations of this and other measuresare presented. The second section summarizes the evidenceon the relationship between child and adolescent and adultadiposity. This is based on a search for relevant literature inthe following computerized databases: Medline (1985–96),BIDS (EMBASE and Science Citation Index 1985–96). Theliterature search revealed that the child to adult adiposityrelationship is now well-documented, although method-ological differences hinder comparisons. Nonetheless, con-sistently elevated risks of adult obesity are evident forfatter children, although the prediction of adult obesityfrom child and adolescent adiposity measures is only mod-erate. Fewer studies could be identified in relation to long-term health risks of child and adolescent adiposity. It istherefore difficult to specify categories of risk associatedwith childhood adiposity without more information fromlong-term studies. Further evidence is also required to con-firm the suggestion from some studies that adult diseaserisks are associated with a change in adiposity from nor-mal weight in childhood to obesity in adulthood. However,on the basis of the evidence available, it is argued that pop-ulation-based approaches to the prevention of obesity arelikely to be more effective than approaches targeted as fatchildren. Population-based approaches are desirable, firstbecause of the poor prediction of adult obesity from childand adolescent measures, and second, because of risks of
Child Anthropometry Literature Scan
Canadian Inst itute of Chi ld Health � Transpor t Canada 58

adult mortality and morbidity may be elevated for individ-uals who become overweight after adolescence.
15. Ref ID: 58Rudolf, M. C. J., Levine, R., Feltbower, R., Connor, A., andRobinson M. The TRENDS Project: development of amethodology to reliably monitor the obesity epidemicin childhood. Archives of Disease in Childhood 91,309–311. 2006.Abstract: The government has set a target to halt the risein childhood obesity in those aged under 11 years by 2010,but no system is in place to ascertain if this has beenachieved. We aimed to develop a simple and reproduciblemethodology to monitor trends in childhood obesity.A purposive sample of 10 primary schools and three sec-ondary schools was selected. Children were measured withparental ‘opt out’ consent in reception class; year 4 and year8 (aged 5, 9 and 13 years old respectively). Measurementswere compared with those obtained locally in 1996–2001.Calculations were then performed to ascertain the samplesize required to confidently identify a halt in the rise inobesity using three growth measures. A total of 999 chil-dren were measured with ascertainment of 95% in primaryand 85% in secondary schools. The proportion of over-weight and obese children aged 9 and 13 years old hadincreased since 1996–2001, although only 9-year-oldsshowed a significant rise. A general trend of an increase inobesity was observed with increasing age. Calculationsshowed that 1900–2400 children per age group are neededto detect a halt in the rise in obesity based on mean bodymass index (BMI) standard deviation scores (SDS) by 2010with 90% power, whereas 4200–10 500 children are neededfor other measures. We have developed a simple, cost-effec-tive methodology for accurately measuring the epidemicand recommend the use of mean BMI SDS for demonstrat-ing if a halt has been achieved.
16. Ref ID: 5Saksvig, B. I., Gittelsohn, J., Harris, S. B., Hanley, A. J. G.,Valente, T. W., and Zinman, B. A Pilot School-BasedHealthy Eating and Physical Activity InterventionImproves Diet, Food Knowledge, and Self-Efficacy forNative Canadian Children. Journal of Nutrition 135,2392–2398. 2005.
Abstract: The Sandy Lake school-based diabetes preven-tion program is a culturally appropriate intervention forOjibway-Cree students in the 3rd, 4th, and 5th grades. Thispaper reports the results of the program in changingdietary intake behaviors and related psychosocial factors.Physical activity results are not included. The study was apretest/post-test, single-sample design conducted duringthe 1998–1999 school year. A total of 122 students complet-ed all 4 measurements (anthropometry, 24-h dietary recall,and 2 questionnaires), at baseline and follow-up. There weresignificant increases (P < 0.0001) in dietary intention,dietary preference, knowledge, and dietary self-efficacy,and in the curriculum knowledge scale between baselineand follow-up. Intervention exposure was significantlyassociated with being in the highest category for knowl-edge about foods that were low in dietary fat [MediumExposure odds ratio (OR): 3.4; P < 0.05; High ExposureOR: 6.4; P < 0.05], being in the highest category for dietaryself-efficacy (Medium Exposure OR: 3.7; P < 0.05; HighExposure OR: 3.9; P < 0.1), being in the highest categoryfor knowledge about curriculum concepts (MediumExposure OR: 3.4; P < 0.05; High Exposure OR: 9.4: P <0.01), and for having met the age + 5 g dietary fiberintake/d (Medium Exposure OR: 2.9; P < 0.1; HighExposure OR: 11.0; P < 0.01). Exposure to the interventionwas not associated with dietary intent or the percentage ofenergy from dietary fat. This program was associated withimproved knowledge and the psychosocial factors relatedto healthy eating and dietary fiber intake of students in aremote First Nations community.
17. Ref ID: 83Sarría, A., Moreno, L. A., García-Llop, L., Fleta, J., Morellón,M. P., and Bueno, M. Body mass index, triceps skinfoldand waist circumference in screening for adiposity inmale children and adolescents. Acta Paediatrica 90[4],387–392. 2001.Abstract: Simple anthropometry measurements andindices are the most commonly used tools for assessingbody composition. Only a few papers have examined thesensitivity and specificity of the body mass index (BMI)against total body fat percentage (TBF%) from underwaterweighing in children and adolescents. The objective of the
Child Anthropometry Literature Scan
Canadian Inst itute of Chi ld Health � Transpor t Canada 59

study was to evaluate the screening performance of BMI,triceps skinfold thickness and waist circumference forexcess TBF%. A total of 175 healthy volunteer males, aged7.0-16.9 y, participated in the study. TBF% was measuredusing underwater weighing as the reference method.Receiver operating characteristic (ROC) curves were con-structed to assess the value of the three anthropometrymeasurements as a screening measure for total adiposity.Sensitivity and specificity were calculated at several per-centile cut-offs for BMI, triceps skinfold and waist circum-ference. The areas under the ROC curves were alsocalculated, and were 0.86 for BMI, 0.90 for triceps skinfoldand 0.88 for waist circumference. The point on the ROCcurve closest to 1 corresponded to the 70th percentile forBMI, to the 75th percentile for triceps skinfold, and to the70th percentile for waist circumference.
18. Ref ID: 105Torrance, G. M., Hooper, M. D., and Reeder, B. A. Trends inoverweight and obesity among adults in Canada(1970–1992): evidence from national surveys usingmeasured height and weight. International Journal ofObesity and Related Metabolic Disorders 26[6], 797–804.2002.Abstract: To examine secular trends in obesity and over-weight among Canadian adults between 1970 and 1992.The impact of education level and smoking on weighttrends is explored. Adults aged 20–69 participating in threenational health surveys which obtained measured heightand weight: the Nutrition Canada Survey conductedbetween 1970 and 1972 (analysis sample n=5963); theCanada Health Survey of 1978–1979 (analysis samplen=3622); and the Canadian Heart Health Surveys conduct-ed between 1986 and 1992 (analysis sample n=17 699).Comparison of percentage overweight (age-standardizedbody mass index (BMI) 25.0-29.9) and obese (age-stan-dardized BMI > or = 30.0) by sex, education level andsmoking status across the three surveys. Among men, theproportion overweight and obese increased steadily from1970–1972 to 1986–1992. Among women, there was a sub-stantial increase in the proportion overweight and obesebetween 1970–1972 and 1978–1979, then an increase inproportion obese, but not overweight, between 1978–1979
and 1986–1992. Although the prevalence of obesityincreased in all education levels, the sub-groups with thegreatest relative increase are men in the primary educationcategory, and women in the secondary and post-secondarybetween 1970–1972 and 1986–1992. An increase in theprevalence of obesity was greatest among current smokersand, to a lesser extent, among former smokers. Whileexcess weight has become an increasing public healthproblem among Canadian adults, the rate of increase inprevalence of obesity since 1970 varied with sex, educationlevel and smoking status. There is a need for new data onmeasured heights and weights of Canadian adults and chil-dren and youth to update trends.
19. Ref ID: 62Tremblay, M. S. and Willms, J. D. Secular trends in thebody mass index of Canadian children. CanadianMedical Association Journal 163[11], 1429–1433. 2000.Abstract: Various changes in society have created theopportunity for more sedentary behaviour and the con-sumption of food that is high in kilojoules, which may leadto a progressive increase in body mass over time. The pur-pose of this study was to examine secular changes in thebody mass index (BMI) of Canadian children between1981 and 1996. Nationally representative data from the1981 Canada Fitness Survey, the 1988 Campbell’s Survey onthe Well-being of Canadians and the 1996 NationalLongitudinal Survey of Children and Youth were used inthe analysis. Regression analyses were used to assess popu-lation changes in BMI from 1981 to 1996 for children aged7–13 years. Changes in the distribution of BMI results wereevaluated by plotting the residuals from regression analy-ses of BMI on age, assessed separately by sex, using the1981 data as baseline. The proportions of children exceed-ing the 85th and 95th age- and sex-specific percentilesfrom the 1981 (baseline) data were also calculated. Since1981, BMI has increased at the rate of nearly 0.1 kg/m2 peryear for both sexes at most ages, indicating a clear seculartrend toward an increase in BMI of Canadian children. Theprevalence of overweight among boys increased from 15%in 1981 to 28.8% in 1996 and among girls from 15% to23.6%. The prevalence of obesity in children more thandoubled over that period, from 5% to 13.5% for boys and
Child Anthropometry Literature Scan
Canadian Inst itute of Chi ld Health � Transpor t Canada 60

11.8% for girls. Secular trends indicate that Canadian chil-dren aged 7–13 years are becoming progressively over-weight and obese.
20. Ref ID: 104Veugelers, P. J. and Fitzgerald, A. L. Prevalence of and riskfactors for childhood overweight and obesity. CanadianMedical Association Journal 173, 607–613. 2005.Abstract: Increases in childhood overweight and obesityhave become an important public health problem in indus-trialized nations. Preventive public health action isrequired, but more research of risk factors is requiredbefore evidence-based initiatives can be developed and tar-geted effectively. We investigated the association betweenchildhood overweight and obesity and risk factors relatingto dietary habits, activities, parents and schools. In 2003 wesurveyed grade 5 students and their parents and schoolprincipals in Nova Scotia. We measured height and weightand assessed dietary habits (using Harvard’s Youth/Adolescent Food Frequency Questionnaire), physical andsedentary activities, and parental and school-based riskfactors. We estimated neighbourhood income by averaging,per school, the postal-code level means of householdincome of residential addresses of children attending thatschool. We used multilevel logistic regression to evaluatethe significance of these risk factors for overweight andobesity. On the basis of measurements taken of 4298 grade5 students, we estimated the provincial prevalence of over-weight to be 32.9% and of obesity to be 9.9%. Childrenwho bought lunch at school were at increased risk of over-weight (fully adjusted odds ratio [OR] 1.39, 95% confidenceinterval [CI] 1.16-1.67), whereas those who ate suppertogether with their family 3 or more times a week were atdecreased risk (OR 0.68, 95% CI 0.52-0.88). Physical edu-cation classes 2 or more times a week at school were asso-ciated with a decreased risk of overweight (OR 0.61, 95%CI 0.43–0.87) and obesity (OR 0.54, 95% CI 0.33–0.88).Children in high-income neighbourhoods were half as like-ly to be obese as their peers living in low-income neigh-bourhoods (OR 0.50, 95% CI 0.36–0.70). Parents andschools provide important opportunities for public healthinitiatives for reducing childhood overweight and obesity.Children and schools in low-income neighbourhoods
should receive priority in public health initiatives to reducefuture socioeconomic inequalities in health.
21. Ref ID: 71Willms, J. D., Tremblay, M. S., and Katzmarzyk, P. T.Geographic and demographic variation in the preva-lence of overweight Canadian children. Obesity Research11[5], 668–673. 2003.Abstract: To examine the geographic and demographicvariation in the prevalence of overweight Canadian children.Using BMI data from the 1981 Canada Fitness Survey andthe 1996 National Longitudinal Survey of Children andYouth, this study assessed: 1). the prevalence of overweightand obesity among Canadian boys and girls ages 7 to13 years; 2). secular trends in the prevalence of overweightfrom 1981 to 1996, by province and adjusted for age andsex; and 3). provincial variation in the prevalence of over-weight, before and after adjusting for socioeconomic anddemographic characteristics. The prevalence of boys andgirls classified as overweight in 1996 was 33% and 26%,respectively. The corresponding figures for obesity were10% for boys and 9% for girls. Provincial variation wasobserved with a trend of increasing risk of being overweightfrom west to east. Socioeconomic status was inversely relat-ed to the prevalence of overweight regardless of geographicregion. The risk of being overweight was more related togeography (province) than demographic variables (incomeand family background); however, the effect of seculartrends (1981 to 1996) exceeded the effect of geographic ordemographic variables. The prevalence of childhood over-weight and obesity is increasing in all areas of Canada andcan be explained only partially by geographic or demo-graphic characteristics.
22. Ref ID: 111Willms, J. D. Early childhood obesity: a call for earlysurveillance and preventive measures. 171[3], 243–244.2004.
Child Anthropometry Literature Scan
Canadian Inst itute of Chi ld Health � Transpor t Canada 61
Restraint System Design1. Ref ID: 94
Burdi AR, Huelke DF, Snyder RG, and Lowrey GH. Infantsand children in the adult world of automobile safetydesign: pediatric and anatomical considerations fordesign of child restraints. Journal of Biomechanics 2[3],267–280. 1969.Abstract: The infant and child differ structurally from theadult in a number of ways which are critical to the designfor protection against impact forces and for adequate occu-pant restraint systems. The purpose of this paper is tobring together a profile of the anatomy, anthropometry,growth and development of the infant and child. Age differ-ences related to the proper design of child restraint systemsare emphasized. Problems discussed include child-adultstructural differences, center of gravity of the body, thehead mass in relation to the neck and general body propor-tions, positions of key organs and biomechanical proper-ties of tissues.
2. Ref ID: 116Cameron, L., Segedin, E., Nuthall, G., and Thompson, J. Saferestraint of the child passenger. Journal of Paediatricsand Child Health 42, 752–757. 2006.Abstract: The aim of this study was to understand theneed for, and use of, booster seats in the 4–12 years agegroup and to identify risk factors for booster seat-non-use.A cross-sectional sample of 1101 children aged 4–12 yearstraveling in 663 privately owned vehicles was taken fromthe Auckland region. Auckland is New Zealand’s largestpopulation centre, with a population of over 1.5 million.Information was gathered using a short questionnaire fol-lowed by direct inspection to identify those children usingbooster seats. The SafetyBeltSafe USA ‘5-step rule’ was usedto look at those children not using a booster seat to deter-mine whether one was still required. While booster seat usehas improved significantly in younger children since a sim-ilar study in 1992, only 40% of sampled children requiringa booster seat were using one. Booster seat use by childrenrequiring them declined sharply as age increased. While93% of 5- to 8- year-olds required a booster, only 30% wereusing one. The requirement for booster seats fell dramati-cally to 34% of 9- to 12-year-olds, but only 3% were using
one. The high rate of need for booster seats and the lack ofuse of booster seats in children aged 5–8 years is a strongargument for legislation and education programmes tar-geting this age group. While the proportion of 9- to 12-year-olds needing a booster drops sharply, there wouldlikely be benefits from educating parents on the ‘5-steprule’ or similar method to help identify the 30% of theseolder children that would continue to benefit from a boost-er seat. Rear seating should be promoted alongside boosterseat use in the age group 4–12 years.
3. Ref ID: 114Chamouard, F., Tarriere, C, and Boudrit, P. Protection ofchildren on board vehicles: Influence of pelvis designand thigh and abdomen stiffness on the submariningrisk for dummies installed on a booster. Proceedings ofthe 15th International Conference on Enhanced Safety ofVehicles. 1063–1075. 1996. Washington, D.C., NationalHighway Traffic and Safety Administration.
4. Ref ID: 119Evans, W. A., Courtney, A. J., and Fok, K. F. The design ofschool furniture of Hong Kong school children ananthropometry case study. Applied Ergonomics 19[2],122–134. 1988.Abstract: Anthropometry data of Hong Kong schoolchild-ren have been collected and analyzed in order to developrecommendations for the design of chairs and tables foruse in Hong Kong Government co-educational schools. Theanthropometry data for Hong Kong have been comparedwith data from a Western population (United Kingdom)and another Asian population (Japan). Five sizes of chairand table combinations have been proposed to accommo-date six primary and seven secondary forms (pupils agedfrom 6 to 18 years). The recommended design dimensions,based on the anthropometry characteristics of the HongKong target populations, are discussed in relation to rec-ommendations from previous research in this area.
Child Anthropometry Literature Scan
Canadian Inst itute of Chi ld Health � Transpor t Canada 62

5. Ref ID: 120Knight, G. and Noyes, J. Children’s behaviour and thedesign of school furniture. Ergonomics 42[5], 747–760.1999.Abstract: Children spend a large part of their school daysin the classroom, and yet the effect of the design of schoolfurniture on their behaviour and health has received com-paratively little attention in the UK. An experimental studyis reported that compares the effects on children’s behav-iour and sitting position of traditional classroom furniturewith a recently designed chair known as ‘Chair 2000’ andassociated tables. It was found that children showed amodest but significant improvement in on-task behaviourand a marked change in sitting positions following theintroduction of the newly-designed furniture. However,these benefits need to be considered in the light of polar-ized opinion for and against the new furniture, and a highlevel of reported incidence of back pain significantly relat-ed to the frequency of non-standard sitting. In the absenceof radically redesigned furniture, it is suggested that chil-dren should be given more choice in their seating, and bet-ter guidance should be given to individuals involved ineducation in order to inform their decision-making aboutclassroom furniture and the postural, anthropometry andorthopaedic aspects of sitting and related activities.
6. Ref ID: 81Kolich, M. Automobile seat comfort: occupant prefer-ences vs. anthropometry accommodation. AppliedErgonomics 34, 177–184. 2003.Abstract: Automobile seat design specifications cannot beestablished without considering the comfort expectationsof the target population. This contention is supported bythe published literature, which suggests that ergonomicscriteria, particularly those related to physiology, do not sat-isfy consumer comfort. The objective of this paper is tochallenge ergonomics criteria related to anthropometry inthe same way. In this context, 12 subjects, representing abroad range of body sizes, evaluated five different compactcar seats during a short-term seating session. Portions of areliable and valid survey were used for this purpose. Thecontour and geometry characteristics of the five seats werequantified and compared to the survey information.
Discrepancies were discovered between published anthro-pometry accommodation criteria and subject-preferredlumbar height, seatback width, cushion length and cushionwidth. Based on this finding, it was concluded that automo-bile seat comfort is a unique science. Ergonomics criteria,while serving as the basis for this science, cannot beapplied blindly for they do not ensure comfortable automo-bile seats.
7. Ref ID: 121Linton, S. J., Hellsing, A. L., Halme, T., and Akerstedt, K.The effects of ergonomically designed school furnitureon pupils’ attitudes, symptoms and behaviour. AppliedErgonomics 25[5], 299–304. 1994.Abstract: We tested the effects of implementing ergonomi-cally designed school furniture on measures of comfort,sitting posture and symptoms. Three classes of fourthgraders (10 years old) were randomly assigned either to acontrol group using traditional furniture or to an experi-mental group which received the ergonomically designedfurniture. In both groups questionnaires were completedand sitting behaviour was observed twice before and afterthe intervention as well as at a five-month follow-up peri-od. Although the experimental groups rated their furnitureas being significantly more comfortable, differences inactual sitting behaviour were small. The experimental classexperienced a reduction in musculoskeletal symptomsrelative to the control group after implementing theergonomically designed furniture. Since pupils did notautomatically sit ‘properly’ in the ergonomic furniture,these results demonstrate the need for proper instructionsand adjustment. Increased comfort and decreased symptoms may be used to motivate pupils to sit correctly.Our results suggest that furniture design is one aspect of amultidimensional problem.
8. Ref ID: 86Panagiotopoulou, G., Christoulas, K., Papanckolaou, A., andMandroukas, K. Classroom furniture dimensions andanthropometry measures in primary school. AppliedErgonomics 35[2], 121–128. 2004.Abstract: The purpose of this study was to compare stu-dents’ dimensions to the dimension of school furniture, inprimary school, and determine whether this type of furniture
Child Anthropometry Literature Scan
Canadian Inst itute of Chi ld Health � Transpor t Canada 63
is well-designed and promotes good sitting posture at schoolby taking into account the dimensions of the children.A total of 180 (90 male and 90 female) students, from threeprimary schools in Thessaloniki, Greece, participated inthe study. Their ages ranged from 7 to 12 years. The follow-ing human body dimensions were measured: stature, elbowheight, shoulder height, upper arm length, knee height,popliteal height and buttock–popliteal length. In addition,the dimensions were measured for four different types ofchairs and five types of desks prevalent in classrooms.Finally, the anthropometry measures of the students andthe furniture dimensions were compared in order to identifyany incompatibility between them.The data indicate a mismatch between the students’ bodilydimensions and the classroom furniture available to them.The chairs are too high and too deep and desks are also toohigh for the pupils. This situation has negative effects onthe sitting posture of the children especially when readingand writing.
9. Ref ID: 4Reed, M. P., Ebert-Hamilton, S. M., Manary, M. A., Klinich,K. D., and Schneider, L. W. A New Database of ChildAnthropometry and Seated Posture for AutomotiveSafety Applications. SAE Technical Papers Series, 1–16.2005. 400 Commonwealth Drive, Warrendale, PA 15096-0001 U.S.A. Tel: (724) 776-4841 Fax: (724) 776-5760,www.sae.org.Abstract: This paper presents a laboratory study of bodydimensions, seated posture, and seatbelt fit for childrenweighing from 40 to 100 lb (18 to 45 kg). Sixty-two boysand girls were measured in three vehicle seats with andwithout each of three belt-positioning boosters. In additionto standard anthropometry measurements, three-dimen-sional body landmark locations were recorded with a coor-dinate digitizer in sitter-selected and standardizedpostures. This new database quantifies the vehicle-seatedpostures of children and provides quantitative evidence ofthe effects of belt-positioning boosters on belt fit. The datawill provide guidance for child restraint design, crashdummy development, and crash dummy positioning procedures.
10. Ref ID: 113Saul, R. A., Pritz, H. P., McFadden, J., Backaitis, S. H.,Hallenbeck, H., and Rhule, D. Description andPerformance of the Hybrid III 3 year-old, 6 year-oldand small female test dummies in restrain system andout-of-position air bag environments. Paper Number:98-S7-O-01, 1-20. 1997. National Highway Traffic SafetyAdministration and Transportation Research Center Inc.
11. Ref ID: 117Snyder R.G., Spencer, M. L., Owings, C. L., andSchneider, L.W. Physical characteristics of children asrelated to death and injury for consumer productdesign and use. 1–54. 1975. Ann Arbor, MI, HighwaySafety Research Institute.
12. Ref ID: 85Snyder, R. G., Schneider, L. W., Owings, C. L., Reynolds, H. M.,Golomb, D. H., and Schork, M. A. Anthropometry ofinfants, children and youths to age 18 for product safe-ty design. Highway Safety Research Institute Report No.UM-HSRI-77-17. 1977. Ann Arbor, MI.
13. Ref ID: 78Steenbekkers, L. P. and Moenbroek, J. F. Anthropometrydata of children for non-specialist users. Ergonomics33[4], 421–429. 1990.Abstract: In a pilot study, 33 anthropometry variables weremeasured on 633 children aged 0-5.5 years. The variableswere chosen on the basis of international standards and onthe results of preliminary analysis of accidents. Methodicalaspects of this pilot study are presented in this paper, fol-lowed by two applications: anthropometry aspects of cur-rent regulations for cribs, playpens and toys;anthropometry aspects in the selection of wheelchairs forchildren. The paper concludes with a discussion on how topresent anthropometry data for non-special users.
14. Ref ID: 92Vezin, P. and Verriest, J. P. Development of a set of numer-ical human models for safety. 2006.Abstract: The objective of the EC funded HUMOS2 projectis to develop Finite Element (FE) human models represent-ing a large range of the European population and allowingan accurate injury risk prediction for victims involved in
Child Anthropometry Literature Scan
Canadian Inst itute of Chi ld Health � Transpor t Canada 64

road accidents. A human model of a male in a driving posi-tion close to the 50th percentile — HUMOS model —resulting of the previous HUMOS project was presented(Robin [1]) at the ESV conference in 2001. The presentpaper focuses on the new developments that have beenmade in the still running HUMOS2 project. Firstly, methodsallowing the personalization (anthropometry, geometryand position) of human numerical models have beendeveloped. They include a scaling tool enabling to deriveany individual model from the original one through meshcontrol points and statistical relationships between externaland internal dimensions. These were established fromgeometric data collected on standing and sitting humanvolunteers with a low dose bi-plane X ray system but alsodirectly measured on isolated bone parts. A positioningtool has also been developed, based on a set of referencepostures including seated car occupant, out of positions(OOPs) and pedestrian postures, in order to adjust and testthe models for different sitting and standing postures.Secondly, experimental work has been conducted onhuman volunteers in order to identify the influence ofmuscular tensing on body response to moderate impacts.A data base of biomechanical test results, appropriate formodel validation, has been set up. It includes new biomate-rial laws for ligament and skeletal muscles, as well as exist-ing cadaver tests results coming from former EC projectsand Heidelberg University. It and will be further completedby specific tests performed by consortium members. On-going work includes injury prediction rules introduction inthe models then, extensive testing of the model in variousconditions defined for validation.
15. Ref ID: 89Weber, K., Lehman, R. J., and Schneider, L. W. Childanthropometry for restraint system design. TechnicalReport No. UMTRI-85-23. 1985. Ann Arbor, MI, Universityof Michigan Transportation Research Institute.Abstract: The purpose of this report is to present, inEnglish units, a compilation of the child anthropometrydata from all three UM studies that are considered usefulfor child restraint design. Because measurement proce-dures were as consistent as possible among the studies, rawdata for the same measures have been combined and are
displayed as single data sets. In addition, dimensionsunique to one study are presented along with measurementtaken in more than one study. Thus all available measure-ments that are likely to be of interest to the restrainsdesigner will be found in this single source, given in unitsmore familiar to the US designer.
Safety and Injury Prevention1. Ref ID: 93
Arbogast, K. B., Mong, D. A., Marigowda, S., Kent, R. W.,Stacey, S., Mattice, J., Tanji, H., Higuchi, K., and Rouhana, S.W.Evaluating Abdominal Paediatric Injuries. 2006.Abstract: Abdominal injuries, along with lumbar spinefractures, are part of a constellation of injuries referred toas “seat belt syndrome”. Geometrical characteristics of thepelvis and abdomen of younger children place them athigher risk for these injuries. Efforts to design restraintsthat mitigate these injuries are limited as no current pediatricanthropomorphic dummy (ATD) can accurately quantifythe abdominal response to belt loading. This paperdescribes progress on a four-phase project to address thisgap involving pediatric anthropometrys, real-worldabdominal injury risk, abdominal biomechanical structuralresponse and injury tolerance from a porcine model, anddevelopment of an abdominal insert for the 6-year-old ATDbased on these data. Internal anthropometry measuresconsisted of radiological assessment of abdominal depth,height, and circumference at multiple horizontal planes.External measures consisted of distances, determined bydigital photography, taken between skeletal markers whilethe child was seated on a vehicle seating apparatus withand without a booster seat. Field investigation identifiedthree unique kinematic patterns resulting in abdominalinjury: presubmarining where the belt is initially out ofposition, classic submarining where the belt starts in posi-tion and the pelvis moves under the belt with the torsoreclined, and submarining/jackknifing where the pelvisslides under the belt, and the torso flexes forward. The bio-mechanical studies developed age- and size-based correla-tions between pediatric swine and humans. Biomechanicaltests performed using the most appropriately sized porcinemodel will be used to define the structural and injury
Child Anthropometry Literature Scan
Canadian Inst itute of Chi ld Health � Transpor t Canada 65

response of the pediatric abdomen to realistic loadingconditions.
2. Ref ID: 118Balague, F., Dutoit, G., and Waldburger, M. Low back painin school children. Lancet 361[9367], 1403–1404. 2003.No abstract available.
3. Ref ID: 115Cyr, C., Lemoine, C., and Santschi, M. Canadian PaediatricSurveillance Report 2005: Lap Belt Syndrome Report.38–39. 2005. Ottawa, Ontario, Canadian Paediatric Society.Abstract: The study confirmed 28 cases of lap-belt syn-drome with high prevalence of spinal fracture (43%) andpermanent spinal cord lesion (25%). Although 12 childrenwere less than eight years old, only one was restrained in abooster seat (wearing only a lap belt). Seat belts save lives;however, if worn incorrectly they can cause importantabdominal and lumbar spine injuries. There is an urgentneed for aggressive education efforts to ensure adequatechild restraint use in motor vehicles.
4. Ref ID: 91Durbin, D. R., Chen, I., Smith, R., Elliott, M. R., andWinston, F. K. Effects of seating position and appropri-ate restraint use on the risk of injury to children inmotor vehicle crashes. Paediatrics 115[3], e305–e309.2005.Abstract: Currently, many states are upgrading their childrestraint laws to include provisions for the use of age-appropriate restraints through 6 to 8 years of age, withsome also requiring rear seating for children, enabling thelaws to be in closer alignment with best-practice recom-mendations. To evaluate the relationships of seating posi-tion and restraint status to the risk of injury amongchildren in passenger vehicle crashes. This was a cross-sec-tional study of children <16 years of age who were involvedin crashes of insured vehicles in 15 states, with data col-lected via insurance claims records and a telephone survey.A probability sample of 17980 children in 11506 crashes,representing 229106 children in 146613 crashes, was col-lected between December 1, 1998, and November 30, 2002.Parent reports were used to define restraint status, seatingposition, and occurrence of clinically significant injuries,with the use of a previously validated instrument.
Approximately 62% of the children used seat belts, 35%used child restraints, and 3% used no restraint. Nearly 4 of5 children sat in the rear seat, with one half of all childrenbeing restrained appropriately for their age in the rear,although this varied according to the age of the child.Overall, 1.6% of children suffered serious injuries, 13.5%had minor injuries, and 84.9% did not have any injury.Unrestrained children in the front were at the highest riskof injury and appropriately restrained children in the rearwere at the lowest risk, for all age groups. Inappropriatelyrestrained children were at nearly twice the risk of injury,compared with appropriately restrained children (oddsratio [OR]: 1.8; 95% confidence interval [CI]: 1.4–2.3),whereas unrestrained children were at >3 times the risk(OR: 3.2; 95% CI: 2.5–4.1). The effect of seating row wassmaller than the effect of restraint status; children in thefront seat were at 40% greater risk of injury, compared withchildren in the rear seat (OR: 1.4; 95% CI: 1.2–1.7). Had allchildren in the study population been appropriatelyrestrained in the rear seat, 1014 serious injuries (95% CI:675–1353 injuries) would have been prevented (with theassumption that restraint effectiveness does not depend ona variety of other driver-related, child-related, crash-related,vehicle-related, and environmental factors). Age-appropriaterestraint confers relatively more safety benefit than rearseating, but the 2 work synergistically to provide the bestprotection for children in crashes. These results supportthe current focus on age-appropriate restraint in recentlyupgraded state child restraint laws. However, it is importantto note that considerable added benefit would be realizedwith additional requirements for rear seating.
5. Ref ID: 90Nance, M. L., Lutz, N., Arbogast, K. B., Cornejo, R. A.,Kallan, M. J., Winston, F. K., and Durbin, D. R. Optimalrestraint reduces the risk of abdominal injury in children involved in motor vehicle crashes. Annals ofSurgery 239[1], 127–131. 2004.
Abstract: The American Academy of Pediatrics has estab-lished guidelines for optimal, age-appropriate child occu-pant restraint. While optimal restraint has been shown toreduce the risk of injuries overall, its effect on specifictypes of injuries, in particular abdominal injuries, has not
Child Anthropometry Literature Scan
Canadian Inst itute of Chi ld Health � Transpor t Canada 66
been demonstrated. Cross-sectional study of children agedyounger than 16 years in crashes of insured vehicles in15 states, with data collected via insurance claims recordsand a telephone survey. A probability sample of 10927crashes involving 17132 restrained children, representing210926 children in 136734 crashes was collected betweenDecember 1, 1998 and May 31, 2002. Restraint use was cat-egorized as optimal or suboptimal based on currentAmerican Academy of Pediatrics guidelines. The outcomeof interest, abdominal injury, was defined as any reportedinjury to an intra-abdominal organ of Abbreviated InjuryScale >or=2 severity. Among all restrained children, opti-mal was noted in 59% (n = 120473) and suboptimal in41% (n = 83555). An associated abdominal organ injurywas noted in 0.05% (n = 62) of the optimal restrainedgroup and 0.17% (n = 140) of the suboptimal group.After adjusting for age and seating position (front vs. rear),optimally restrained children were more than 3 times lesslikely [odds ratio 3.51 (95% confidence interval, 1.87–6.60,P < 0.001)] as sub-optimally restrained children to sufferan abdominal injury. Of note, there were no abdominalinjuries reported among optimally restrained 4- to 8-year-olds. Optimally restrained children are at a significantlylower risk of abdominal injury than children sub-optimallyrestrained for age. This disparity emphasizes the need foraggressive education efforts aimed not only at getting chil-dren into restraint systems, but also the importance ofoptimal, age-appropriate restraint.
6. Ref ID: 97Weber, K. Crash Protection for Child Passengers: Areview of best practices. UMTRI Research Review 31[3],1–28. 2000. Ann Arbor, Michigan, Research Informationand Publications Center of the University of MichiganTransportation Research Institute.Abstract: Child restraint systems provide specialized pro-tection for small occupants whose body structures are stillimmature and growing. There is a wide variety of systemsfrom which to choose, and different types of restraints areappropriate for children of different ages and sizes. Evenwith the most appropriate child restraint (CR), however, theway in which it is installed and used can have an effect onits performance. This review describes the theory behind
the design of occupant restraint systems and applies theseprinciples to the special needs of children. A distinction ismade between child restraints, which themselves providethe restraint structure, and positioning devices, such asboosters, which help the vehicle belt fit the child.Throughout each section, current concepts of best practiceare given, including the changes brought on by passengerairbags, and future directions are indicated.
TrainingRef ID: 95
Guimarey, L. M., Piedrabuena, A. E., and Barros Filho Ade, A.Training and standardization of personnel for per-forming an anthropometry study in school children.Archivos Latinoamericanos de Nutricion 31[2], 303–313.1981.Abstract: In order to avoid ponderable errors among theanthropometrists working in a project of school health, atraining model was developed. Four subjects were trained(A, B, C and D). Significant and highly significant differ-ences in the reading of skinfold (F = 5.15) and height (F =8.17) were observed only with subject C. These differenceswere not present in the last reading, which means thatthere was an improvement in the determinations.Analyzing all subjects, it was possible to verify that subjectD presented significant and highly significant differenceswith the other subjects (skin fold delta 5% - 6.16 and delta1% = 8.08, arm circumference delta 5% = 0.50 and delta1% = 0.67, height delta 5% = 0.27). This subject, however,had the lowest variability in the readings, which means thatthis systematic error was personal. The method that wasapplied is useful in the training and standardization ofanthropometrists, and for the detection of those subjectswho present systematic errors.
Ref ID: 37Harrison, G. G., Galal, O. M., Ritenbaugh, C. X., Shaheen, F. M.,Abdel-Azim Wahba, S., Kirksey, A., and Jerome, N. W.Dependability and precision of anthropometry meas-ures in a longitudinal field study in an Egyptian village.American Journal of Human Biology 3[5], 479–487. 1991.Abstract: Reliability and its components, precision anddependability, are analyzed for a complex dataset involving
Child Anthropometry Literature Scan
Canadian Inst itute of Chi ld Health � Transpor t Canada 67
longitudinal anthropometry measurements on subjects ofvarying ages in an Egyptian village setting. Results arecompared with other published datasets. Technical error ofmeasurement is similar to or compares favorably withother datasets for both adults and children. Overall reliabil-ity is strongly influenced by dependability coefficients,which are calculated in this analysis over relatively longertime periods (2 weeks for young children and longer forolder individuals) than in other comparable datasets. It isevident that some components of the theoretical constructof imprecision, i.e., measurement error derived from varia-tion over longer periods of time in factors contributing toaccuracy, are actually captured in the analytical componentof variance called undependability.
Ref ID: 38Himes, J. H. Reliability of anthropometry methods andreplicate measurements. American Journal of PhysicalAnthropology 79[1], 77–80. 1989.Abstract: The Spearman-Brown Prophesy formula, derivedfrom psychometrics, may be used in anthropometry studiesto describe the relationship between the intraclass reliabilitycoefficient for a single measurement and the reliabilityresulting from the mean of replicate measurements. Thistheory may be applied to determine expected reliabilities ofanthropometry protocols using replicate measurements andto determine the numbers of replicate measurements neces-sary to achieve desired levels of reliability.
Ref ID: 21Himes, J. H. Minimum time intervals for serial measure-ments of growth in recumbent length or stature of indi-vidual children. Acta Paediatrica 88[2], 120–125. 1999.Abstract: A method is presented to estimate minimumtime intervals for meaningful measurements of growth inrecumbent length or stature on individual children. Theseintervals are based on the statistical features of growth,and consider the reliability of measurement, expected ratesof growth, and variation in attained length or stature.Because of the assumptions used, the intervals should beconsidered as minima, except in some predictable cases.During the prepubescent period there are no differences inminimum intervals calculated for boys and girls. The inter-vals are shortest during the rapid growth attending infancy,
and increase to 0.39 y (4.7 mo) at 8 y of age in boys andgirls, and to 0.43 y (5.2 mo) at 10 y of age in boys. A refer-ence curve of minimum intervals for length and statureduring the prepubescent period is presented with an equa-tion for more precise estimation of measurement intervals.To accommodate the pubescent growth spurt and its normalvariation in timing, 0.5 y is recommended as the minimuminterval during pubescence when the maturational timingof the child is unknown. These minimum measurementintervals should be appropriate for almost all individualchildren when growth in recumbent length or stature ismeasured serially.
Ref ID: 99Johnson, T. S., Engstrom, J. L., Haney, S. L., and Mulcrone, S. L.Reliability of three length measurement techniques interm infants. Pediatric Nursing 25[1], 13–17. 1999.Abstract: To describe and compare the intra- and inter-examiner reliability of three length measurement techniquesand to determine if the three measurement techniquesyield significantly different measurements. Two experienced,mother-baby nurses each obtained length measurementsusing the supine, paper barrier, and Auto-length measure-ment techniques twice each from 48 healthy term infants.The nurses were blind to their own and to each other’smeasurements. The order of the nurses and the order of themeasurement techniques were randomized. For intra-exam-iner reliability, RN-1 had smaller mean absolute differencesfor the Auto-length measurements. RN-2 had similar meanabsolute differences for all three measurement techniques.The percentage of differences < or = 1 cm were smallest forthe supine measurements for RN-1 and not remarkablydifferent between the measurement techniques for RN-2.For inter-examiner reliability, the mean absolute differencesbetween the pairs of measurements were smallest for theAuto-length measurements for Set-1 and for the paper-bar-rier measurements for Set-2. The percentage of differences< or = 1 cm between the pairs of measurements for Set-1were not remarkably different and were lowest for thesupine measurements for Set-2. The mean measurementsobtained by the supine, paper-barrier, and the Auto-lengthmeasurements were respectively: 50.88, 50.33, and 49.67 cm.The differences between the means were statistically signif-
Child Anthropometry Literature Scan
Canadian Inst itute of Chi ld Health � Transpor t Canada 68
icant (X2 = 56.56, p = .0000). The differences betweenlength measurements by individual examiners and pairs ofexaminers are relatively large. Clinicians should be aware ofthe magnitude of error in length measurements and shouldinterpret length measurements with caution. These findingsalso demonstrate that all clinicians in any setting shoulduse the same technique to obtain length measurements.
Ref ID: 30Klipstein-Grobusch, K., Georg, T., and Boeing, H.Interviewer variability in anthropometry measure-ments and estimates of body composition. InternationalJournal of Epidemiology 26[Supplement 1], 174–180. 1997.Abstract: The extent of intra- and inter-interviewer variabil-ity both in anthropometry measurements and in estimatesof body composition was assessed and the possibility ofsystematic variation due to interviewer differences investi-gated. Seventeen interviewers trained in the anthropometrymeasurement technique and 10 healthy volunteers (4 men,6 women) participated in the study on measurement vari-ability. To ensure participation of all interviewers the studywas carried out on three different days. On each of thesedays interviewers got randomly allocated to the subjectsbeing present. Each interviewer took 12 measurements —body weight, body height, sitting height, circumferences ofwaist, hip, and midarm, skinfolds (biceps, triceps, sub-scapular, and suprailiac), chest breath and depth — persubject on two occasions. From these measurements, bodymass index, waist-to-hip ratio, percentage of body fat, fatmass, fat free mass and metric index were determined. Forall anthropometry variables variance components, reliabili-ty coefficients (R) and coefficients of variation (CV) wereestimated and systematic differences of measurementsbetween interviewers were assessed. Measurement reliabilityin basic anthropometry measures expressed as variancecomponents, reliability coefficients and coefficients of vari-ation was influenced to a greater extent by inter-interviewervariability (R: 0.858–0.999; CV: 0.1–20.9) than intra-interviewer variability (R: 0.979–0.999; CV: 0.0–6.4). Therespective estimates of body composition exhibited com-paratively higher reliability (Rinter: 0.975–0.999; Rintra:0.995–0.999). Measurements more prone to subjectivity,e.g., skinfolds showed lower reliability (CVinter: 9.3–20.9;
CVintra: 3.6–6.4). Although the absolute variation in meas-ures due to interviewers was small, systematic differencesamong interviewers were clearly evident in all measure-ments and estimates except sitting height in this group ofsubjects. Anthropometry measures and estimates of bodycomposition obtained in the current study show the feasi-bility of detailed anthropometry data collection by multipleinterviewers in large-scale epidemiological studies.
Ref ID: 20Lampl, M., Birch, L., Picciano, M. F., Johnson, M. L., andFrongillo, E. A. Jr. Child factor in measurement depend-ability. American Journal of Human Biology 13[4],548–557. 2001.Abstract: A primary consideration in longitudinal growthstudies is the identification of growth from error compo-nents. While previous research has considered matters ofmeasurement accuracy and reproducibility in detail, fewreports have investigated the errors of measurement due toaspects of the physiology and cooperation of the child. Thepresent study directly assesses this source of measurementundependability for the first time. Investigation of totalmeasurement error variance in 925 recumbent lengthreplicates taken over stasis intervals in growth identifiesthat between 60% and 70% of total measurement unrelia-bility is due to child factor undependability. Individual dif-ferences are significant and longitudinal growth analysesshould consider two to three times the technical error ofmeasurement statistic as a reasonable estimate of the totalunreliability for any single measurement of an infant’srecumbent length. These results raise issues regarding ana-lytic methods as applied to serial growth data.
Ref ID: 29Marks, G. C., Habicht, J. P., and Mueller, W. H. Reliability,dependability, and precision of anthropometry meas-urements. The Second National Health and NutritionExamination Survey 1976–1980. American Journal ofEpidemiology 130[3], 578–587. 1989.Abstract: The components of reliability for eight anthro-pometry measures were studied in 95 male and 134 femalesubjects from the Second National Health and NutritionExamination Survey (NHANES II). The contributions tounreliability variance (Sr2) that occur as a result of measur-
Child Anthropometry Literature Scan
Canadian Inst itute of Chi ld Health � Transpor t Canada 69

ing errors (Sp2, imprecision variance) and of intrasubjectfluctuations in a measurement due to physiologic factors(Sd2, undependability) were estimated (Sr2 = Sp2 + Sd2).Unreliability was then related to the between-subject vari-ance (S2) to estimate the reliability (R = 1 – (Sr2/S2)) ofthe measurement. Four of the anthropometry measure-ments (weight, height, sitting height, and arm circumfer-ence) had reliabilities in excess of R = 0.97. In the firstthree of these, measurement imprecision made up twothirds or less of unreliability, and undependability (Sd2)was stable by two weeks. Lesser but still acceptable reliabil-ities were obtained for triceps and subscapular skinfolds,bitrochanteric breadth, and elbow breadth (R = 0.81-0.95).For these variables imprecision (Sp2) was the major sourceof error. Furthermore, the unreliability (Sr2) betweenobservers was twice as high or more than the unreliabilitywithin observers for these variables, evidence that impreci-sion (Sp2) is the single most important source of unrelia-bility in these anthropometry measurements. Unreliabilitystandard deviations of skinfolds increased in a linear man-ner with skinfold thickness corresponding to an unreliabil-ity coefficient of variation of 13–19 per cent. None of theother measurements showed such scale effects. Analyses ofthe kind suggested will help epidemiologists decidewhether reliability can be increased by improving precision,and whether there is a need to improve reliability in thefirst place. Reliability appears to be adequate for all anthro-pometry in the NHANES II.
Ref ID: 19Martorell, R., Habicht, J. P., Yarbrough, C., Guzmán, G., andRobert E. The identification and evaluation of measure-ment variability in the anthropometry of preschoolchildren. American Journal of Physical Anthropology 43[3],347–352. 1975. National Institute of Child Health andHuman Development, National Institutes of Health,Bethesda, Maryland, Klein Division of Human Development,Institute of Nutrition of Central America and Panama(INCAP), Guatemala City, Guatemala, C. A.Abstract: Measurement variability estimates for 18 differ-ent anthropometry dimensions were collected within thecontext of an ongoing longitudinal investigation of preschoolGuatemalan children. Estimates of total measurement vari-
ance, intra-observer variance, and short-term intra-subjectvariance are presented for each variable. A simple proce-dure for the evaluation of measurement variance in cross-sectional and longitudinal investigations is described inwhich the total measurement variance is expressed as apercentage of the appropriate inter-subject variance. Thisstatistic serves as an index of the relative reproducibility ofanthropometry variables.
Ref ID: 82Meunier, P. and Yin, S. Performance of a 2D image-basedanthropometry measurement and clothing sizing sys-tem. Applied Ergonomics 31, 445–451. 2000.Abstract: Two-dimensional, image based anthropometrymeasurement systems offer an interesting alternative totraditional and three dimensional methods in applicationssuch as clothing sizing. These automated systems areattractive because of their low cost and the speed withwhich they can measure size and determine the best-fittinggarment. Although these systems have appeal in this typeof application, not much is known about the accuracy andprecision of the measurements they take. In this paper, theperformance of one such system is assessed. The accuracyof the system was analyzed using a database of 349 subjects(male and female) who were also measured with traditionalanthropometry tools and techniques, and the precision wasestimated through repeated measurements of both a plas-tic mannequin and a human subject. The results of the sys-tem were compared with those of trained anthropometrists,and put in perspective relative to clothing sizing require-ments and short-term body changes. It was concluded thatimage-based systems are capable of providing anthropom-etry measurements that are quite comparable to traditionalmeasurement methods (performed by skilled measurers),both in terms of accuracy and repeatability.
Ref ID: 43Moreno, L. A., Joyanes, M., Mesana, M. I., González-Gross,M., Gil, C. M., Sarría, A., Gutierrez, A., Garaulet, M., Perez-Prieto, R., Bueno, M., and Ascensión, M. Harmonization ofanthropometry measurements for a multicenter nutri-tion survey in Spanish adolescents. Nutrition 19[6],481–486. 2003.
Child Anthropometry Literature Scan
Canadian Inst itute of Chi ld Health � Transpor t Canada 70

Abstract: Although the need for accurate anthropometrymeasurement has been repeatedly stressed, reports ongrowth and physical measurements in human populationsrarely include estimates of measurement error. We describethe standardization process and reliability of anthropometrymeasurements carried out in a pilot study. For the intraob-server assessment of anthropometry measurements, westudied 101 adolescents (58 boys and 43 girls) from fivecities. For interobserver assessment, we studied 10 adoles-cents from thesame class in Zaragoza and different fromthose in the intraobserver sample. For skinfold thickness,intraobserver technical errors of measurement (TEMs) ingeneral were smaller than 1 mm; for circumferences, TEMsin general were smaller than 1 cm. Intraobserver reliabilityfor skinfold thickness was greater than 95% for almost allcases; for circumferences, intraobserver reliability generallywas greater than 95%. Interobserver TEMs ranged from 1 to2 mm for the six skinfold thicknesses measured; for circum-ferences, TEMs were smaller than 1 cm for the arm, biceps,and waist and between 1 and 2 cm for the hip and thigh.Interobserver reliabilities for skinfold thickness and cir-cumference were always greater than 90%, except for bicepsskinfold. Our results are in agreement with those recom-mended in the literature. Therefore, these anthropometrymeasures seem to be adequate to assess body compositionin a multicenter survey in adolescents.
Ref ID: 36Pelletier, D. L., Low, J. W., and Msukwa, L. A. H. Sources ofmeasurement variation in child anthropometry in theMalawi maternal and child nutrition study. AmericanJournal of Human Biology 3[3], 227–237. 1991.Abstract: An examination of intra- and inter-observererror in child anthropometry and variation between twoskinfold calipers was conducted as part of a large prospec-tive study of maternal and child nutrition in Malawi,Central Africa. Measurements include length, weight, headand arm circumferences, triceps and subscapular skin-folds, and estimated cross-sectional arm fat and arm mus-cle areas. Total observer error, expressed as a percentage oftotal variance in each trait, is 3.2% for length, weight, andhead circumference; 7% for arm circumference; 10% forarm fat area; and 16-20% for skinfolds and arm muscle
area. When total observer error is divided into the twoadditive components studied, intraobserver error repre-sents approximately 50% or more of total observer errorfor most traits. An exception is the subscapular skinfold forwhich intra-observer represents 38% of total observererror. Errors of this magnitude will cause an attenuation ofapproximately 10% in the correlation coefficients betweenanthropometry and other variables, and a loss of power inattempting to detect associations between anthropometryvariables and either their determinants or outcomes.However, the effects of errors of this magnitude are minorcompared to those encountered in studies correlatingnutrient intake with other variables. This study also findsthat the SlimGuide caliper systematically overestimatesskinfolds at low readings and underestimates skinfolds athigh readingss relative to the Lange caliper.
Ref ID: 32Skinner, A. M., Cieslak, Z., MacWilliam, L., Solimano, A.,and Kitson, H. F. The measurement of knee-heel lengthin newborn infants using a simple vernier calipers.86[5], 512–517. 1997.Abstract: To assess the usefulness of a simple verniercalipers for measuring knee-heel length in neonates. Usinga simple vernier calipers, knee-heel length was measuredfive times by 2 observers in 50 babies (29M, 21F; meanbirthweight 1597 g; median gestational age at birth 29weeks) at a median postnatal age of 11 days. A subgroup of20 babies had knee-heel length measured similarly atweekly intervals for 3 weeks. Corrected gestational age andweight were simultaneously recorded. One observer wasexperienced in using the vernier calipers. The precision ofthe calipers was established using 4 steel gauge blocks ofvarying length (7.62–10.17 cm). The calipers were veryprecise when measuring steel gauge blocks. In babies, therewas a downward trend across the first 2 measurements forboth observers, the measurements stabilizing over the lastthree. Using the final three measurements per baby (n = 50),the experienced observer had a mean standard deviation of0.023 cm and mean coefficient of variation 0.23% whenmeasuring an average knee-heel length of 9.99 cm. Theinexperienced observer had a mean standard deviation of0.057 cm and a mean coefficient of variation of 0.56%,
Child Anthropometry Literature Scan
Canadian Inst itute of Chi ld Health � Transpor t Canada 71

when measuring an average knee-heel length of 10.14 cm.The inter-observer reliability, measured by the intra-classcorrelation coefficient, was 0.99. The agreement betweenobservers was such that one observer measured knee-heellength consistently less (0.15 cm, SD 0.18 cm) than theother. The reliability for knee-heel length velocity waslower (R = 0.85), but agreement between observers washigh with an average difference of 0.016 cm/week. Knee-heel length was significantly correlated (p < 0.001) withcorrected gestational age (r = 0.85) and with weight (r = 0.96). There was a weaker but significant correlation (r = 0.47, p < 0.001) between knee-heel length velocityand rate of weight gain (g/day), indicating that weight gainmay not always be accompanied by an increase in lineargrowth. The measurement of knee-heel length by a simplevernier calipers is an accurate, reproducible and non-inva-sive method of assessing short-term linear growth inneonates. However, it is recommended that measurementsof knee-heel length in a individual baby should be made bya single experienced observer.
Ref ID: 100Sutter, K., Engstrom, J. L., Johnson, T. S., Kavanaugh, K., andIfft, D. L. Reliability of head circumference measure-ments in preterm infants. Pediatric Nursing 23[5],485–490. 1997.
Abstract: To describe and compare the intra- and interex-aminer reliability of head circumference measurementsobtained with paper and cloth tape measures. Two experi-enced neonatal nurses each obtained head circumferencemeasurements using both paper and cloth tape measurestwice each, from 49 clinically stable, preterm infants. Thenurses were blind to their own and to each other’s meas-urements. The order in which the measurements wereobtained was randomized. The differences within andbetween examiners for cloth and paper tape measurementswere described using mean absolute differences, standarddeviation of net differences, technical error of measurement,minimal and maximal differences, percentage of differ-ences 0.25 and 0.5 cm, and percentage of error. Wilcoxonmatched-pairs, signed-ranks tests demonstrated signifi-cantly greater intraexaminer reliability for measurementsobtained with the paper tape for both of the nurses.
Wilcoxon matched-pairs, signed-ranks tests also demon-strated significantly greater interexaminer reliability formeasurements obtained with the paper tape for both thefirst and second measurement sets. Intra- and interexam-iner differences were consistently smaller when the exam-iners used paper tape measures.
Ref ID: 26Ulijaszek, S. J. and Kerr, D. A. Anthropometry measure-ment error and the assessment of nutritional status.British Journal of Nutrition 82[3], 165–177. 1999.
Ref ID: 64US Department of Health and Human Services. AccuratelyWeighing and Measuring Technique. 2006.http://www.depts.washington.edu/growth/index.htmAbstract: With the availability of the 2000 CDC GrowthCharts, this is an opportune time for all pediatric healthcare providers to re-evaluate the tools they use and theapproach they have in their clinical setting for measure-ment, plotting and interpretation of growth charts.This module reviews techniques for measuring and record-ing infant length, weight, and head circumference andreviews the technique for obtaining and recording weightand stature for children and adolescents. The informationin this module is intended for the measurement of typical-ly developing children. Another module provides informa-tion on the measurement techniques to be used whenchildren have special physical considerations and the tech-niques described here are not feasible.
Ref ID: 25Vegelin, A. L., Brukx, L. J., Waelkens, J. J., and Van denBroeck, J. Influence of knowledge, training and experi-ence of observers on the reliability of anthropometrymeasurements in children. Annals of Human Biology30[1], 65–79. 2003.Abstract: To elucidate the impact of the observer’s level oftechnical knowledge, training and experience with measur-ing height and triceps skinfold thickness on the reliabilityof these measurements in children. Despite of instructionsand encouraging careful measurements, these factors maysignificantly affect measurements and lead to interpretationdifficulties, especially of short term growth data. A cross-sectional study was designed in which 18 children, aged
Child Anthropometry Literature Scan
Canadian Inst itute of Chi ld Health � Transpor t Canada 72
2–7 years, were measured in duplicate by 12 observers withdifferent backgrounds and levels of experience, protocolknowledge and protocol training. The main outcome meas-ures, precision and accuracy, were expressed as technicalerror of measurement (TEM) and average bias (AB) incomparison with an expert anthropometrist. As expected,the best educated and most experienced observers scoredthe best precision and accuracy. By ranking analysis andmultiple regressions we learned that precision and accura-cy in measuring height and triceps skinfold thickness aremainly predicted by allround knowledge of the measure-ment protocol (p< 0.05) and the years of experience (p< 0.05). A practical training course of only a few hoursdoes not seem to improve reliability significantly. To get amore reliable insight in growth of a child it is important tobe aware of the influence on measurement outcome valuesof protocol knowledge and years of experience. Growthstudies should use detailed anthropometry standardizationprotocols and train people to acquire better insight intothese protocols.
Ref ID: 23Voss, L. D., Bailey, B. J., Cumming, K., Wilkin, T. J., andBetts, P. R. The reliability of height measurement (theWessex Growth Study). Archives of Disease in Childhood65[12], 1340–1344. 1990.Abstract: The two major components of reliability areaccuracy and reproducibility. Three studies of the reliabilityof height measurement in children are reported. In thefirst, a standard meter rod was used to spot check the accu-racy of installation of 230 measuring instruments in onehealth district in Wessex, UK. The readings obtainedranged from 90.0 to 108.5 cm and showed the urgent needfor the positioning of instruments to be regularly checked.In a second study, to examine the reproducibility of heightmeasurement, two experienced observers measured10 young children (106.0 to 152.0 cm), three times on fiveinstruments of different design. The observations wereblind and in random order. The estimated standard devia-tion for a single height measurement was generally in therange 0.2–0.3 cm. Over 95% of the variance was attributa-ble to the child, very little to the instrument or observer.Finally, the conditions of the second study were modified
to examine the effect on reproducibility of non-blind andnon-randomized measurements, as usually occurs in theclinic. A lower but inevitably false estimate of the error wasobtained. It is recommended that the error of height meas-urement, appropriately established and expressed in simpleterms, be stated in every published growth study.
Ref ID: 24Voss, L. D. and Bailey, B. J. Equipping the community tomeasure children’s height: the reliability of portableinstruments. Archives of Disease in Childhood 70[6],469–471. 1994.Abstract: To compare (1) the reliability of two expensiveand two inexpensive measuring instruments, suitable foruse in the community and (2) the reliability of experiencedcompared with inexperienced observers. 1) Ten childrenaged 5–12 years were each measured three times blindly,and in random order, by two experienced observers usingfour different portable instruments. (2) Four groups of fourchildren aged 5–11 years were each measured three timesblindly, and in random order by four experienced and oneinexperienced measurer, using two different portableinstruments. The precision of height measurements madeby different observers using different instruments,expressed in each case as the standard deviation of a singleheight measurement (SDshm). (1) No significant differencein precision was found between instruments, SDshm rang-ing from 0.22–0.34 cm. The two observers using apparentlythe same technique, did however record significantly dif-ferent absolute heights. (2) No significant difference in pre-cision was found between experienced and inexperiencedobservers. Inexpensive height measuring equipment, onceaccurately installed, is no less reliable than the most expen-sive. Inexperienced observers can, with care, measure asreliably as those with long experience. Every effort shouldbe made, however, to ensure that the progress of individualchildren is monitored not only by the same observer, buton a long term basis.
Child Anthropometry Literature Scan
Canadian Inst itute of Chi ld Health � Transpor t Canada 73

Types of Child AnthropometryMeasurements (Software and Technology)1. Ref ID: 1
de Onis, M. and WHO Multicentre Growth Reference StudyGroup. Physical status: the use and interpretation ofanthropometry. Report of a WHO Expert Committee.World Health Organization, 1–452. 1995.
2. Ref ID: 57de Onis, M., Yip, R., and Mei, Z. The development ofMUAC-for-age reference data recommended by a WHOExpert Committee. Bulletin of the World HealthOrganization 75[1], 11–18. 1997.Abstract: Low mid-upper-arm circumference (MUAC),determined on the basis of a fixed cut-off value, has com-monly been used as a proxy for low weight-for-height(wasting). The use of a fixed cut-off value was based on theobservation that MUAC showed small age- and sex-specificdifferences. However, in 1993, a WHO Expert Committeeconcluded that age independence is not reflected in thetrue pattern of mid-upper arm growth, recommended theuse of MUAC-for-age, and presented age- and sex-specificMUAC reference data developed with observationsobtained from a representative sample of children in theUSA aged 6–59 months. In this article, we explain themethodology for the development of these data, presentage- and sex-specific growth curves and tables and discussthe applications and limitations of MUAC as a nutritionalindicator. To develop the reference data, estimates were firstobtained for the mean and standard deviation of MUAC foreach month of age using 7-month segmental regressionequations; a 5th-degree and a 3rd-degree polynomial in agewas then used to describe the mean and standard deviation,respectively, of MUAC-for age. These curves show impor-tant age-specific differences and significant sex-specificdifferences for boys and girls < 24 months of age. Correctinterpretation of MUAC with regard to nutritional statusrequires the use of MUAC-for-age reference data such asthose presented here.
3. Ref ID: 10de Onis, M., Garza, C., Victora, C. G., Onyango, A. W.,Frongillo, E. A., Martines, J., and WHO Multicentre GrowthReference Study Group. The WHO Multicentre Growth
Reference Study: Planning, study design, and method-ology. Food Nutrition Bulletin 25[Supplement 1], 15–26.2004.Abstract: The World Health Organization (WHO)Multicentre Growth Reference Study (MGRS) is a commu-nity-based, multicountry project to develop new growthreferences for infants and young children. The design com-bines a longitudinal study from birth to 24 months with across-sectional study of children aged 18 to 71 months. Thepooled sample from the six participating countries (Brazil,Ghana, India, Norway, Oman, and the United States) con-sists of about 8,500 children. The study subpopulations hadsocioeconomic conditions favorable to growth, and lowmobility, with at least 20% of mothers following feedingrecommendations and having access to breastfeeding sup-port. The individual inclusion criteria were absence ofhealth or environmental constraints on growth, adherenceto MGRS feeding recommendations, absence of maternalsmoking, single term birth, and absence of significantmorbidity. In the longitudinal study, mothers and new-borns were screened and enrolled at birth and visited athome 21 times: at weeks 1, 2, 4, and 6; monthly from 2 to12 months; and every 2 months in their second year. Inaddition to the data collected on anthropometry and motordevelopment, information was gathered on socioeconomic,demographic, and environmental characteristics, perinatalfactors, morbidity,and feeding practices. The prescriptiveapproach taken is expected to provide a single internationalreference that represents the best description of physiologi-cal growth for all children under five years of age and toestablish the breastfed infant as the normative model forgrowth and development.
4. Ref ID: 11de Onis, M., Onyango, A. W., Van den Broeck, J., Chumlea,W. C., Martorell, R., and WHO Multicentre GrowthReference Study Group. Measurement and standardiza-tion protocols for anthropometry used in the construc-tion of a new international growth reference. FoodNutrition Bulletin 25[Supplement 1], 27–36. 2004.Abstract: Thorough training, continuous standardization,and close monitoring of the adherence to measurementprocedures during data collection are essential for mini-
Child Anthropometry Literature Scan
Canadian Inst itute of Chi ld Health � Transpor t Canada 74

mizing random error and bias in multicenter studies.Rigorous anthropometry and data collection protocolswere used in the WHO Multicentre Growth Reference Studyto ensure high data quality. After the initial training andstandardization, study teams participated in standardizationsessions every two months for a continuous assessment ofthe precision and accuracy of their measurements. Once ayear the teams were restandardized against the WHO leadanthropometrist, who observed their measurement tech-niques and retrained any deviating observers. Robust andprecise equipment was selected and adapted for field use.The anthropometrists worked in pairs, taking measure-ments independently, and repeating measurements thatexceeded preset maximum allowable differences. Ongoingcentral and local monitoring identified anthropometristsdeviating from standard procedures, and immediate cor-rective action was taken. The procedures described in thispaper are a model for research settings.
5. Ref ID: 9de Onis, M. and WHO Multicentre Growth Reference StudyGroup. Reliability of anthropometry measurements inthe WHO Multicentre Growth Reference Study. ActaPaediatrica 95[Supplement 450], 27–37. 2006. Taylor andFrancis.Abstract: To describe how reliability assessment data inthe WHO Multicentre Growth Reference Study (MGRS)were collected and analysed, and to present the resultsthereof. There were two sources of anthropometry data(length, head and arm circumferences, triceps and sub-scapular skinfolds, and height) for these analyses. Data forconstructing the WHO Child Growth Standards, collectedin duplicate by observer pairs, were used to calculate inter-observer technical error of measurement (TEM) and thecoefficient of reliability. The second source was the anthro-pometry standardization sessions conducted throughoutthe data collection period with the aim of identifying andcorrecting measurement problems. An anthropometryexpert visited each site annually to participate in standard-ization sessions and provide remedial training as required.Inter- and intra-observer TEM, and average bias relative tothe expert, were calculated for the standardization data.TEM estimates for teams compared well with the anthro-
pometry expert. Overall, average bias was within accept-able limits of deviation from the expert, with head circum-ference having both lowest bias and lowest TEM. Teamstended to underestimate length, height and arm circumfer-ence, and to overestimate skinfold measurements. This waslikely due to difficulties associated with keeping childrenfully stretched out and still for length/height measure-ments and in manipulating soft tissues for the other meas-urements. Intra- and inter-observer TEMs werecomparable, and newborns, infants and older children weremeasured with equal reliability. The coefficient of reliabilitywas above 95% for all measurements except skinfoldswhose R coefficient was 75–93%. Reliability of the MGRSteams compared well with the study’s anthropometryexpert and published reliability statistics.
6. Ref ID: 44de Onis, M. and WHO Multicentre Growth Reference StudyGroup. WHO Child Growth Standards based onlength/height, weight and age. 95[Supplement 450],76–85. 2006.Abstract: To describe the methods used to construct theWHO Child Growth Standards based on length/height,weight and age, and to present resulting growth charts. TheWHO Child Growth Standards were derived from an inter-national sample of healthy breastfed infants and youngchildren raised in environments that do not constraingrowth. Rigorous methods of data collection and standard-ized procedures across study sites yielded very high-qualitydata. The generation of the standards followed methodical,state-of-the-art statistical methodologies. The Box-Coxpower exponential (BCPE) method, with curve smoothingby cubic splines, was used to construct the curves. TheBCPE accommodates various kinds of distributions, fromnormal to skewed or kurtotic, as necessary. A set of diag-nostic tools was used to detect possible biases in estimatedpercentiles or z-score curves. There was wide variability inthe degrees of freedom required for the cubic splines toachieve the best model. Except for length/height-for-age,which followed a normal distribution, all other standardsneeded to model skewness but not kurtosis. Length-for-ageand height-for-age standards were constructed by fitting aunique model that reflected the 0.7-cm average difference
Child Anthropometry Literature Scan
Canadian Inst itute of Chi ld Health � Transpor t Canada 75

between these two measurements. The concordance betweensmoothed percentile curves and empirical percentiles wasexcellent and free of bias. Percentiles and z-score curves forboys and girls aged 0–60 mo were generated for weight-for-age, length/height-for-age, weight-for-length/height(45 to 110 cm and 65 to 120 cm, respectively) and bodymass index-for-age.
7. Ref ID: 96de Onis, M. and WHO Multicentre Growth Reference StudyGroup. Enrolment and baseline characteristics in theWHO Multicentre Growth Reference Study. ActaPaediatrica Supplement 450, 7–15. 2006.Abstract: To describe the WHO Multicentre GrowthReference Study (MGRS) sample with regard to screening,recruitment, compliance, sample retention and baselinecharacteristics. A multi-country community-based studycombining a longitudinal follow-up from birth to 24 mowith a cross-sectional survey of children aged 18 to 71 mo.Study subpopulations had to have socio-economic conditionsfavourable to growth, low mobility and > or = 20% ofmothers practising breastfeeding. Individual inclusioncriteria were no known environmental constraints ongrowth, adherence to MGRS feeding recommendations, nomaternal smoking, single term birth and no significantmorbidity. For the longitudinal sample, mothers and new-borns were screened and enrolled at birth and visited 21times at home until age 24 mo. About 83% of 13 741 sub-jects screened for the longitudinal component were ineligi-ble and 5% refused to participate. Low socioeconomicstatus was the predominant reason for ineligibility inBrazil, Ghana, India and Oman, while parental refusal wasthe main reason for non-participation in Norway and USA.Overall, 88.5% of enrolled subjects completed the 24-mofollow-up, and 51% (888) complied with the MGRS feedingand no-smoking criteria. For the cross-sectional compo-nent, 69% of 21 510 subjects screened were excluded forsimilar reasons as for the longitudinal component.Although low birthweight was not an exclusion criterion,its prevalence was low (2.1% and 3.2% in the longitudinaland cross-sectional samples, respectively). Parental educa-tion was high, between 14 and 15 y of education on average.The MGRS criteria were effective in selecting healthy chil-
dren with comparable affluent backgrounds across sitesand similar characteristics between longitudinal and cross-sectional samples within sites.
8. Ref ID: 98Brooke-Wavell, K., Jones, P. R., and West, G. M. Reliabilityand repeatability of 3-D body scanner (LASS) meas-urements compared to anthropometry. Annals ofHuman Biology 21[6], 571–577. 1994.Abstract: The Loughborough Anthropometry ShadowScanner (LASS) digitizes the body, to give size and shape inthree dimensions. After some manipulation of data, bodymeasurements can be taken from the computerized scan.This paper compares LASS measurements with anthro-pometry measurements, and examines intra- and inter-observer differences of both techniques. LASS andanthropometry measurements were generally similar.Although there were small but significant (p < 0.05) differences at some sites, these differences were explainedby difficulties in making horizontal tape measurements,and by differences in site location on LASS scans due toimperfect site markers. Standard errors of measurementdue to intra-observer differences were generally smaller byLASS (1.1–5.3 mm) than anthropometry (2.0–7.2 mm);however, inter-observer differences were similar by bothtechniques (3.0–13.1 mm for anthropometry compared to1.3–8.3 mm for LASS). Repeatability of 3-D measurementstaken from computerized whole-body scans was no betterthan that from traditional anthropometry measurements;however, the scan data have a far greater utilization, forthey provide information on body shapes, segmental vol-umes and surface areas as well as size.
9. Ref ID: 33Davies, H. A., Pickering, M., and Wales, J. K. A portableknemometer: a technique for assessment of short-termgrowth. Annals of Human Biology 23[2], 149–157. 1996.Abstract: Knemometry is the technique of choice forshort-term growth studies, as it is the only anthropometrytechnique available that allows sufficiently accurate meas-urement of the lower leg (in anatomical terms, the leg) toenable changes in leg length to be detected over as short aninterval as a week or less. The portable knemometer, likethe Valk knemometer, essentially consists of two main
Child Anthropometry Literature Scan
Canadian Inst itute of Chi ld Health � Transpor t Canada 76

parts: a rigid metal frame holding the footplate, measuringruler and plateau and a moveable chair that moves on fric-tionless rollers on a track on the base of the frame. Unlikethe Valk knemometer there is a standardized seat positionfor all subjects, making it easier and quicker to use.Assessment of technical error was done using mean coeffi-cient of variation (CV) of lower leg length measurementsdone on the portable knemometer. Comparison of meas-urements made by two different observers was made byusing percentage reliability. A small PR implies consistencybetween the two methods or observers being compared.Measurements from 164 visits were used to calculate themachine precision. Mean CV using all four measurementswas 0.13% and using only three, having discarded the first,was 0.11%. Given a mean lower leg length of 246.3 mm forthe children studied this translates to a machine precisionof 0.32 mm if all four measurements are used and 0.27mm if the last three measurements in the set are used. Themean difference in lower leg length between observers was0.11 mm. Percentage reliability between the two observersfor the portable knemometer was 0.03%. For comparison,PR for standing height and sitting height are 0.37% and0.86% respectively. PR between the Valk and the portableknemometer was 0.04%.
10. Ref ID: 56Mei, Z., Grummer-Strawn, L. M., de Onis, M., and Yip, R.The development of a MUAC-for-height reference,including a comparison to other nutritional statusscreening indicators. Bulletin of the World HealthOrganization 75[4], 333–341. 1997.Abstract: Mid-upper-arm circumference (MUAC) basedon a single cut-off value for all the children less than5 years of age has been used for many years as an alterna-tive nutritional status index for children during famines orrefugee crises, and as an additional screening tool in non-emergencies. However, it has recently been questionedwhether MUAC is age- and sex-independent. After reviewingthe scientific evidence underlying the use and interpreta-tion of MUAC, a WHO Expert Committee recommended anew MUAC-for-age reference for under-5-year-olds. Insome settings, however, it is difficult to assess a child’s ageand in such circumstances MUAC-for-height may be a
good alternative. The height-based QUAC stick is a simplemeans of adjusting MUAC cut-offs according to height, andthe MUAC-for-height reference and the construction anduse of the QUAC stick are described in this article.Described also is the use of the receiver operating charac-teristic (ROC) curve method to evaluate the performance ofMUAC, MUAC-for-age, and MUAC-for-height in screeningmalnourished children. It is often difficult to collect childheight and weight measurements among refugee andfamine-stricken populations. Mid-upper-arm circumfer-ence (MUAC) based upon a single cut-off value for all chil-dren younger than age 5 years has therefore been used formany years as a proxy nutritional status index for childrenin such situations, and as an additional screening tool innon-emergencies. It has recently been questioned whetherMUAC is age- and sex-independent. After reviewing thescientific evidence on the use and interpretation of MUAC,a World Health Organization Expert Committee recom-mended a new MUAC-for-age reference for children underage 5 years. It is, however, sometimes difficult to assess achild’s age. MUAC-for-height could be used in such circum-stances. The height-based Quaker Arm Circumference(QUAC) measuring stick is a simple way of adjustingMUAC cut-offs according to height. The QUAC methodmeasures the arm circumference at the mid-upper leveland compares that value with the child’s height. A standardQUAC stick is proposed which facilitates the comparison ofdata between countries. The MUAC-for-height reference andthe construction and use of the QUAC stick are described.Also described is the use of the receiver operating charac-teristic (ROC) curve method to evaluate the performance ofMUAC, MUAC-for-age, and MUAC-for-height in screeningmalnourished children.
11. Ref ID: 67Murphy, C. A., Carstens, K., and Villamayor, P. Electronicgrowth charts: watching our patients grow. AMIAAnnual Symposium Proceedings, 1058. 2005.Abstract: Pediatric Growth Charts have been used in thepediatric community since 1977. The first growth chartswere developed by the National Center for Health Statisticsas a clinical tool for health care professionals. The growthcharts, revised in 2000, by the Center for Disease Control
Child Anthropometry Literature Scan
Canadian Inst itute of Chi ld Health � Transpor t Canada 77
consists of a series of percentile curves for selected bodymeasurements in children. Capitalizing on the benefits ofour Electronic Medical Record (EMR), and as a byproductof nursing electronic documentation of routine heights,weights, and frontal occipital circumferences, our systemplots the routine measurements without additional inter-vention by the staff. Clinicians can view the graphs onlineor generate printed reports as needed during routineexamination for outpatient or hospitalized care. Thisabstract outlines the background, design process, program-ming rules utilized to plot growth curves, and the evalua-tion of the electronic CDC growth charts in ourorganization.
12. Ref ID: 31Schreiner, P. J., Pitkaniemi, J., Pekkanen, J., and Salomaa, V.V.Reliability of near-infrared interactance body fatassessment relative to standard anthropometry tech-niques. Journal of Clinical Epidemiology 48[11],1361–1367. 1995.Abstract: We examined the repeatability of near-infraredinteractance (NIR) body fat determination as comparedwith that of body mass index (BMI), waist-to-hip ratio(WHR), and waist girth. Thirty-nine volunteers (16 men,23 women) had percent body fat (%BF) measurementsmade with a portable NIR device as well as the standardanthropometry indices of height, weight, waist girth, andhip circumference. Frame size and physical activity levelswere also determined. For each participant, three inde-pendent measurements of each index were made by twotrained readers during a 2-week period. The two readersvaried significantly in their measurement of %BF and hipcircumference. The variability in %BF was largely due todifferences between the first and the second measure-ments, and only for one of the readers. Second and thirdmeasurements were not statistically significantly differentfor either reader, suggestive of a training effect. Variancecomponent calculations revealed that the reliability of NIRis 95.3%, compared with 99.9% for BMI; 93.4% for waistgirth; and 82.4% for WHR, with the majority of theremaining variance accounted for by the method itself. Weconclude that the NIR method has good repeatability, withlow intra- and inter-observer variability, provided that
readers are carefully trained. However, the NIR deviceoffers little advantage in reliability over conventional meas-ures of adiposity such as waist girth or BMI, and requiresadditional input of weight, height, frame size, physicalactivity level, age, and gender data to calculate % BF.Associations of NIR and other anthropometry indices withcardiovascular risk factors in this population will provideadditional insight into the merit of NIR body fat assess-ment.
13. Ref ID: 48Wang, M. J., Wang, E. M., and Lin, Y. C. The anthropome-try database for children and young adults in Taiwan.Applied Ergonomics 33[6], 583–585. 2002.Abstract: A large-scale anthropometry survey project wasrecently completed in Taiwan. This database contains theanthropometry data for worker and student (children andyoung adult) populations with ages ranging from 6 to 65.The worker population database has ages ranging from18 to 65. Some of the commonly applied anthropometrydata were previously reported in Wang et al. (1999). Theanthropometry data for the student population are present-ed in this report. The ages of the student population rangesfrom 6 to 18 and includes 1254 senior high school students(632 males and 622 females), 3293 junior high school stu-dents (1682 males and 1611 females), and 3505 elementaryschool students (1818 males and 1687 females). The stu-dent subjects were recruited from four geographical areasin Taiwan: north, central, south and east. The sample sizein each area was determined based on the student popula-tion distribution reported by the Ministry of Education inTaiwan. Two hundred and sixty-six measurements weretaken from each of the high school students and 245 meas-urements were taken from each of the elementary schoolstudents.
14. Ref ID: 34Watt, V., Pickering, M., and Wales, J. K. A comparison ofultrasonic and mechanical stadiometry. Archives ofDisease in Childhood 78[3], 269–270. 1998.Abstract: To compare an ultrasonic height measuringdevice (Gulliver) with mechanical stadiometry and theclassical “book and tape measure” method. Blinded dupli-cate measurements of height were made on each of 14 chil-
Child Anthropometry Literature Scan
Canadian Inst itute of Chi ld Health � Transpor t Canada 78

dren by a pair of observers using a stadiometer (H) andGulliver (G). Height was measured on a further 18 childrenby parents and an auxologist using Gulliver and the bookand tape method (TM), and the results were comparedwith those obtained with a single stadiometry measure-ment. Finally, measurement of a rigid metal box was madeon 10 occasions by the three methods. In the group of14 children, the mean difference (range) in height (Hminus G) was +2.8 cm (+0.5 to +4.55 cm), with H giving asystematically higher value in 276 of 280 individual meas-urements. In the group of 18 children, height by H wasgreater than by G or TM in 47 of 52 individual measure-ments. The mean (SD) height of the box by H (61.60 (0.07)cm) was greater than by G (60.96 (0.15) cm; p < 0.001) butnot TM (61.4 (0.16) cm; p > 0.05). G and TM producedthree times less reliable estimations of height than H, butwith a large difference in cost, and there was evidence ofsystematic underrecording of height by 0.5 cm with G.Stadiometry is precise and reproducible, and can detecttrue changes in height over one month periods in mid-childhood, and should remain the standard way of observ-ing growth. The book and tape method can produceclinically acceptable quarterly estimations of height thatcan be performed in the home.
15. Ref ID: 77Young JT, Carter K, Marion MS, and Greendale GA. A sim-ple method of computing hip axis length using fan-beam densitometry and anthropometry measurements.Journal of Clinical Densitometry 3[4], 325–331. 2000.Abstract: Hip axis length (HAL), a simple measureobtained from dual X-ray absorptiometry (DXA) scans ofthe proximal femur, predicts hip fracture, independent ofbone mineral density and age. Owing to a magnificationerror associated with newer fan-beam DXA, automatic cal-culation of HAL, which is available in pencil-beam DXA, isinaccurate. The purpose of this study was to model HAL,measured from a pencil-beam DXA, as a function of HALfrom a fan-beam DXA combined with other anthropome-try measures. Proximal femur scans were performed usingpencil- and fan-beam DXA in 21 women (ages 24–60).Height, weight, hip circumference, subject thickness, heightof the greater trochanter and anterior superior iliac spine
from the scanning table, and HAL as measured by a rulerfrom the scan printouts were recorded. Anthropometrymeasurements were taken by two researchers; all but thegreater trochanter were reproducible (r > or = 0.92). Asimple linear model using the manual measurement ofHAL from the fan-beam scan, height, weight, body massindex, and hip circumference was able to predict HALmeasured using the pencil-beam DXA with a high degreeof accuracy (R(2) > or = 0.96). The fan-beam-acquiredvalues of HAL using our model are nonbiased and accurateestimates of the “gold standard” pencil-beam method. Thismodel may provide researchers and clinicians with a sim-ple method of calculating HAL using fan-beam DXA.
16. Ref ID: 49Zankl, A. and Molinari, L. ABase-a tool for the rapidassessment of anthropometry measurements on hand-held computers. American Journal of Medical GeneticsPart A 121[2], 146–150. 2003.Abstract: Anthropometry is widely recognized as animportant method in the evaluation of dysmorphic children.Nevertheless, it has never gained widespread clinical use. Webelieve that this has mainly practical reasons: appropriategrowth charts are not readily available at the bedside or inclinic and taking multiple measurements and plotting theminto corresponding growth charts is a time-consuming task.Here we describe a computer program that overcomes bothproblems: ABase compares entered anthropometry meas-urements to a database of age- and sex-matched referencevalues, calculates the centile rank and displays the resulteither as text or as a digitized growth chart. The programruns on small handheld computers that can easily be carriedaround in a shirt pocket.
Child Anthropometry Literature Scan
Canadian Inst itute of Chi ld Health � Transpor t Canada 79