transport emissions and solutions
TRANSCRIPT

CHAPTER 6
TRANSPORT EMISSIONS AND SOLUTIONS
Changes in urban and transport infrastructure to reduce the need formotorised transport and shift demand to less energy intensive transportmodes, may be among the most important elements of a long term strategyfor greenhouse gas mitigation in the transport sector… .1
Introduction - Transport Emissions and Trends
6.1 In 1998, transport energy accounted for 15.9 per cent of Australia’s totalemissions (72.6 Mt CO2-e). This was an 18 per cent (11.1 Mt) increase over the 1990level of 61.5 Mt. Transport is the third largest emissions sector after stationary energyand agriculture, and is showing the second fastest rate of growth. The 1998 NationalGreenhouse Gas Inventory (NGGI) states that ‘emissions from passenger vehicles,trucks and light commercial vehicles accounted for most of the increase’.2
6.2 89.3 per cent (64.8 Mt) of the 1998 total was from road transportation, withfar smaller amounts for civil aviation (4.4 Mt) and rail (1.6 Mt). Road transportemissions increased 18.2 per cent between 1990 and 1998 and car emissions by 16.6per cent during the same period. While aviation is a small total it is the mostgreenhouse-intensive per passenger for intercity travel. With increased competitionand cheaper fares its share could potentially increase.3
6.3 The Australasian Railways Association (ARA) told the Committee that, dueto ‘Australia’s excessive reliance on road transport’, Australia has the third highesttransport emissions per capita in the world. 92 per cent of urban passenger transport isundertaken by private motor vehicle.4 These statistics are the end-result of strongtrends towards motor vehicle use and against rail and public transport use. Carkilometres travelled in Australia doubled between 1975 and 1995, and during the
1 Australian Greenhouse Office, The National Greenhouse Strategy: Strategic Framework for AdvancingAustralia’s Greenhouse Response, 1998, p 56.
2 Australian Greenhouse Office, National Greenhouse Gas Inventory 1998, p A-5; and AustralianGreenhouse Office, National Greenhouse Gas Inventory: Analysis of Trends and Greenhouse Indicators1990-1998, p vii. It should be noted that these figures do not incorporate estimates for the land-usechange and forestry subsector, which currently present major uncertainties and are listed in the NGGI ina separate volume. Subject to this uncertainty, the 1998 NGGI estimates national emissions at net 39.5Mt CO2-e, which would make it the fourth largest emissions sector. See Australian Greenhouse Office,National Greenhouse Gas Inventory: Land Use Change and Forestry Sector, 1990-1998, p A-3.
3 Australian Greenhouse Office, National Greenhouse Gas Inventory 1998, p A-12.
4 Australasian Railways Association, Submission 181, p 1894.
216
same period the urban road freight task (in tonne kilometres) doubled, and theinterurban articulated truck freight task quadrupled.5
6.4 Australia also has a very high level of fuel use per capita - 20 per cent higherthan the OECD urban average - and one of the highest levels of road freight per capita(measured in tonne kilometres per head). This is the case not merely because of thelarge distances in Australia, but ‘in part because road transport undertakes significantinterstate and bulk freight tasks’.6
6.5 The Committee heard a range of concerns about Australia’s emissions from(and policies in regard to) transport. They included:
• that more data was needed about Australia’s patterns of transport use, theirtrends, and about the potential to shift tasks between different transport modes(‘intermodal shift’) and about the greenhouse savings that could result;
• that Australia’s reliance on motor vehicle transport, both in passengers andfreight, was far too high;
• that the tax system encourages the use of private motor vehicles for travel towork, and discriminates against those who wish to use public transport;
• that public investment in road infrastructure has dwarfed levels of investment inrail, which has led to a severe deterioration in rail infrastructure and services andcontributed to the increase in transport emissions;
• that current government initiatives, while worthwhile in themselves, will beineffective in stimulating major abatement action in the transport sector;
• that policy, particularly in relation to taxation and new infrastructure, has failedto incorporate health and environmental costs and was increasing the over-reliance on motor vehicle transport;
• that Australia’s fuel costs and taxes are low by comparison with most othercountries and passenger car vehicles are larger and less fuel-efficient; and
• that Australia’s passenger and freight vehicle fleet is comparatively old and thereare no mandated requirements for regular maintenance or in-service emissionstesting.
6.6 There are also more traditional reasons why Australia needs to reduce itstransport emissions and its reliance on oil for transport. If current growth trends indemand for oil continue, Australia will face a much higher import bill for oil whichwill dramatically worsen Australia’s balance of payments and reduce its internationalcompetitiveness. Currently only 40 per cent of Australia’s oil consumption is sourcedfrom local oilfields, and it is estimated that by 2010 Australia will be producing less
5 Associate Professor Philip Laird, Submission 101, p 826.
6 Associate Professor, Philip Laird, Submission 101, p 826.

217
than a quarter of the current production of 420,000 barrels per day. The Bass Straitfields could be exhausted within a few years: 87 per cent of the known oil reserveshave already been pumped and 47 of the known gas reserves, and there is little chanceof substantial new finds in Australia or elsewhere. Oil imports could add $4 billion toAustralia’s current account deficit by 2010.7 This underlines the need, not only to findfuel efficiencies, but to reduce outright the levels of oil consumption in Australia.Reducing greenhouse emissions from transport is very much part of a ‘triple bottomline’ solution for Australia’s energy future.
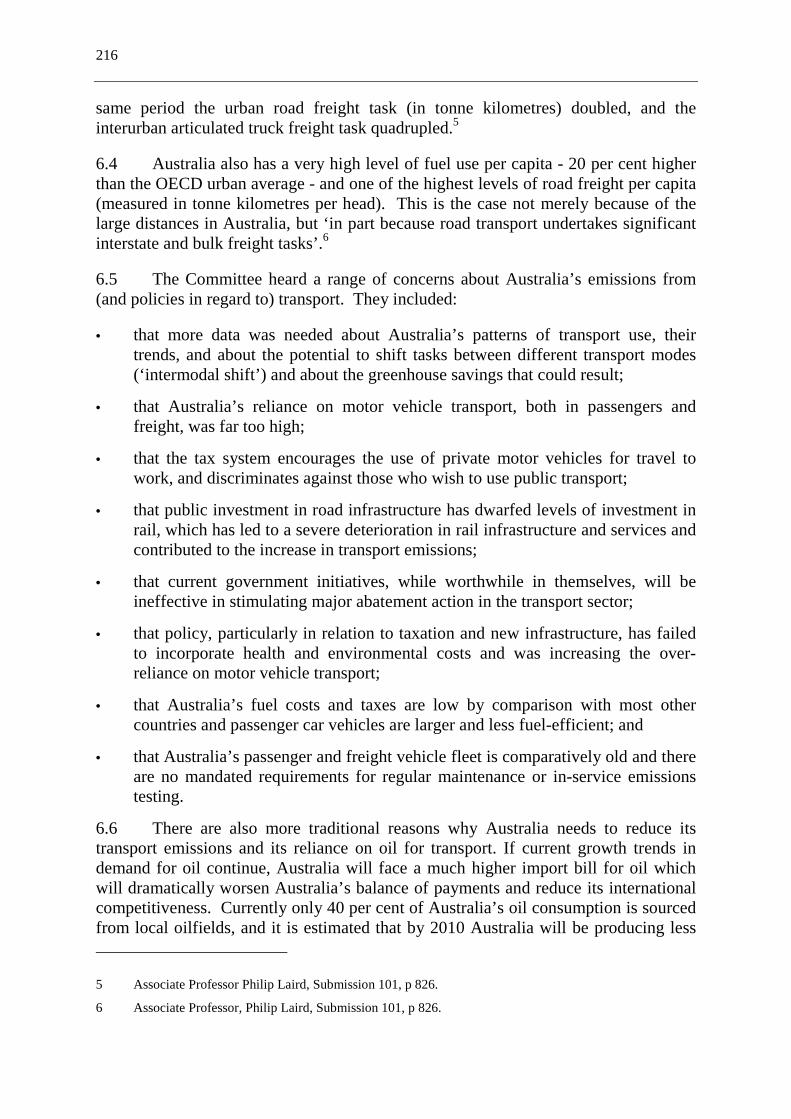
6.7 In their submission, the Bicycle Federation of Australia (BFA) suggestedsome targets for major urban areas to reduce CO2 emissions by 60 per cent:
• no increase in per capita passenger car kilometres travelled;
• increase the seat occupancy of commuter cars from 1.11 to 1.26;
• decrease the average fuel consumption of the car fleet by 8 per cent per year;
• reduce the sales of less energy-efficient cars by 10 per cent per year;
• increase walking trips from 14 per cent of trips to 20 per cent of trips;
• quadruple bicycle (only) trips from around 2 per cent of all trips to 12 per cent ofall trips;
• double per capita public transport journeys from 100 to 200 per year (50 per centof the increased trips would be bike/rail trips); and
• introduce land use and development and telecommunications policies thatvirtually prohibit or make unnecessary the construction of car dependentdevelopments, for example, no more hyper markets set in massive car parks.
Figure 6.1Source: Bicycle Federation of Australia
7 Ian Howarth, ‘Bass Strait’s last fling before the party ends’, The Australian Financial Review, 18September 2000; Claire Miller, ‘Coming soon: The day of reckoning’, The Sunday Age, 22 October2000; Andrew Clark, ‘The oil apocalypse’, The Sunday Age, 22 October 2000.

218
Current Government Programs
6.8 The National Greenhouse Strategy (NGS) lists ‘efficient transport andsustainable urban planning’ as a major priority, and seeks to promote an integrated,best practice approach to urban land use and transport planning and investment. This,says the Government, draws on a 1996 IPCC Report which argued that:
Changes in urban and transport infrastructure to reduce the need formotorised transport and shift demand to less energy-intensive transportmodes, may be among the most important elements of a long term strategyfor greenhouse gas mitigation in the transport sector… the resulting trafficreductions can result in greenhouse gas reductions of 10 per cent or more by2020 while obtaining broad social and environmental benefits.8
6.9 Current government measures to reduce transport emissions are said to befocused on the following areas:
• the integration of land use and transport planning to make the use of publictransport more viable;
• reducing the demand for travel and smoothing traffic flows;
• encouraging the greater use of public transport, walking and cycling. Publictransport initiatives include integrated transport plans to improve existingservices, and a national forum to investigate new public transport modes andtechnologies and best practice options for Australian conditions;
• Australia Cycling - The National Strategy 1999 - 2004 was launched in February1999 with the stated intention of providing a national framework for action byFederal, state, territory and local government, industry and the community topromote increased and safe cycling;
• efforts to improve vehicle fuel efficiency and fuel technologies, including: theDiesel and Alternative Fuels Grant Scheme (which maintains relativitiesbetween diesel and alternative fuels such as Compressed Natural Gas (CNG) andLiquid Petroleum Gas (LPG) and ethanol); fuel grants for buses operating onalternative fuels in metropolitan areas; the $35 million Alternative FuelsConversion Program (which provides rebates for the conversion of engines over3.5 tonnes to alternative fuels); the removal of diesel excise for rail; a tighteningof vehicle emissions and fuel standards; and a funding program ($7.6 million) toestablish a number of CNG fuelling stations;
• Environmental Strategy for the Motor Vehicle Industry, which includesmeasures such as mandatory fuel consumption labelling, a fuel consumption
8 Australian Greenhouse Office, The National Greenhouse Strategy: Strategic Framework for AdvancingAustralia’s Greenhouse Response, 1998, p 56.

219
guide, a harmonisation of domestic and international noxious emissionsstandards by 2006, a 15 per cent fuel efficiency improvement target by 2010over business-as-usual (through negotiation with auto companies), and bringingforward the phase-out of leaded petrol, taking equity considerations intoaccount;9 and
• rail and shipping reforms to reduce the role of government and increase privatesector involvement, which it is hoped will increase rail’s share of freight.Additional measures include an investigation by the states and territories and theCommonwealth of potential ways to reduce emissions from road freight,including a shift from road to rail.
6.10 The Queensland Conservation Council (QCC) was very sceptical of the abilityof current government policies to influence Australian transport emissions trends:
It should be said that, if effectively implemented, all of these strategies, inQCC’s opinion, would fail to stem the growth in transport emissions andcertainly would fail in turning those trends around. What is not said ingreenhouse air quality and transport strategies at local, state and FederalGovernment levels is probably more significant than what is said.10
6.11 The QCC argued that transport strategies were being undermined by poorplanning decisions on major projects:
An example that we feel illustrates this particularly well is that, while theregional transport plan for south-east Queensland set modal targets thatwould moderate a 100 per cent increase in vehicle kilometres travelled overa 15-year period down to a 50 per cent increase, the regional transport plandid not include construction of a major inner city freeway at a cost of aquarter of a billion dollars, which has subsequently been approved byBrisbane Metropolitan Government and the State Government. If such astark divergence from an agreed regional transport plan is possible andincurs no penalties whatsoever, we would suggest that the cautious one stepat a time transport and air quality greenhouse strategies that have beendeveloped are of very little significance.11
6.12 The BFA welcomed the National Bicycle Strategy (NBS) and thecommitment of the Commonwealth to fund a secretariat to implement it but said itwould not greatly increase the use of bicycles for transport:
To provide adequate bicycle infrastructure it is necessary to have $100million from the Commonwealth each year to supplement state funds andthat is not being provided. Why is this so when the health benefits of
9 http://www.greenhouse.gov.au/ago/safeguarding.html (17/07/00), p 6.
10 Mr James Whelan, Proof Committee Hansard, Brisbane, 26 May 2000, p 673.
11 Mr James Whelan, Proof Committee Hansard, Brisbane, 26 May 2000, p 673.

220
cycling could be measured in $billions if 12% of all trips were made bybicycle?12
6.13 The BFA also challenges the Federal Government’s claim that its NBS will‘double bicycle use by 2004’ and says the data does not exist to establish a 1999benchmark and there is no commitment to funding a study to establish this data:
All levels of government, because of the absence of sound data formonitoring how much walking and cycling is done and how safe it is, do notknow what is happening. The only reliable national data for cycling andwalking road deaths per 100,000 kms travelled is for 1985. Whereas innorthern Europe reducing greenhouse gases is a serious business so nationalgovernments ensure there is good cycling and walking data for planners towork with.13
6.14 The Committee congratulates the Western Australian Government for itsefforts in limiting the growth of car travel. Their ‘South Perth Travel Smart Trial’ in1997 resulted in the 400 participants reducing their number of car trips by 10 per centafter being made more aware of other transport options available to them such aswalking, cycling and public transport. No significant improvements were made toinfrastructure or services to achieve these results. Subsequent programs involving2,500 people were equally successful and the Western Australia State Governmentextended the concept in August 2000 with - Travel Smart 2010 - a 10 year plan for theCity of Perth.14
6.15 The Committee believes that the transport strategies outlined in the NGS areworthwhile, but are likely to be extremely limited in their impact. Transport isarguably one of the weakest areas in the NGS. There are no commitments to improveAustralia’s public transport or cycling systems, nor to fund and improve rail servicesand infrastructure. The NGS fails to take account of the way in which other policies,such as taxation and road funding, will undermine and frustrate existing efforts toreduce transport emissions.
Why are Australia’s Transport Emissions so High?
6.16 The rapid increases in Australia’s transport emissions, and the low utilisationof rail and public transport in relation to other countries, suggest to the Committee thatcurrent policies are failing to make a substantial impact. This section explores whythis is the case.
12 Bicycle Federation of Australia, Submission 38, p 206.
13 Bicycle Federation of Australia, Submission 38, p 207.
14 Bicycle Federation of Australia, Submission 38, p 207.
221
Rail infrastructure and services have been allowed to deteriorate
6.17 The Brisbane-based Public Transport Alliance argues that part of the problemis that current policies are too focused on fuel efficiency rather than on changingbehaviour and use patterns.15 In this regard, the ARA suggested that current policieshad failed to place enough emphasis on the potential of rail and on the far greater fuelefficiencies (and thus greenhouse abatement) that it offered:
Railways are the most energy-efficient form of motorised land transport. Asteel wheel on a steel rail has just one seventh the friction of a rubber tyre ona road.
Rail transport uses less than one third of the amount of fuel than roadtransport per tonne of freight hauled. Passenger rail services use less thanhalf the amount of fuel than cars or buses per passenger carried.
No matter what improvements in fuel efficiency and reductions ingreenhouse gas emissions occur in road transport, it will never be as energy-efficient as rail and will always produce more greenhouse gas emissions pertonne of freight hauled or per passenger carried.16
6.18 Despite these obvious advantages, rail services and infrastructure have beenallowed to deteriorate while roads have received many times higher levels of publicfunding. The deterioration in the rail network was underlined by a report by theLondon-based Economist Intelligence Unit in 1997, which ranked Australia a lowly 2out of 5 for the extensiveness and quality of its rail network.17
6.19 The ARA told the Committee that over the past 25 years the Commonwealthhas spent $37.5 billion on roads, more than 20 times the amount spent on railinfrastructure over the same period. They cited an Allen Consulting Report whichsaid that ‘for every $1 spent on rail, $21 has been spent on roads. This chronicunderfunding of rail has led to greater road freight traffic than would otherwise be thecase’. Nationally, say the ARA, government at all levels spend $7 billion per year onroads compared with $400 million on rail. Present Commonwealth rail funding of$250 million over four years on interstate mainline rail infrastructure is just 4 per centthe level of road funding over the same period. However, the Government has failedto spend even this amount, with $125 million of the funds allocated to the dedicatedfreight corridor still unused.18
6.20 However, the ARA say that the rail reforms proposed as a solution under theNGS will be inadequate:
15 Public Transport Alliance, Submission 111, p 952.
16 Australasian Railways Association, Submission 181, p 1894.
17 Australasian Railways Association, Submission 181, p 1899.
18 Australasian Railways Association, Submission 181, p 1899.

222
Rail reform alone will not solve the problems caused by inadequateinfrastructure. Jack Smorgon, Chairman of the Federal Government’s RailProjects Taskforce commented that: ‘The widespread perception thatgovernment investment and taxation practices favour road transport anddisadvantage rail is seen as the most significant barrier to private sectorinvolvement’.19
6.21 The Railway Technical Society of Australasia listed some of the problemswith rail infrastructure, which hampered its efficiency and competitiveness:
Much of the nation’s interstate mainline network is in an unsatisfactorystate. For example, the network has numerous speed-weight restrictions dueto:
• old wooden sleepers in Victoria;
• light weight rail on the Melbourne to Albury standard gauge track;
• a curve for every kilometre plus steep ruling grades from Albury toSydney;
• poor alignment from Sydney to Brisbane; and
• some 575 km or 40 per cent of the mainline interstate track in NSW failsto meet basic fast freight train standards of no grade steeper than 1 in 66and no curve radius tighter than 800 metres. (Between Melbourne andPerth the failure figure is only 4 per cent).20
6.22 The RTSA also argue that the downsizing of the rail industry has led to adearth of training and skills, especially of tradespeople and engineers. These arealready creating shortages, which may become worse as an ageing workforce retires.They also cite an Institute of Engineers study which indicated a looming shortage ofengineers.21
The taxation system is biased towards roads and motor vehicle use
6.23 A number of submitters, including the Rail Technical Society, the Universityof Wollongong’s Professor Philip Laird, the ARA, and the University of NSWTransport Program, argued that the tax system contained distortions which encourageroad construction and motor vehicle use over public transport and rail.
6.24 Professor Ian Lowe, from Griffith University in Brisbane, argued that theCommonwealth subsidies of diesel may also be having a negative greenhouse impact,a situation the new tax system may make worse:
The effective exemption of diesel fuel from the price increases which willotherwise hit almost everything the community uses appears almost as a
19 Australasian Railways Association, Submission 181, p 1900.
20 Railway Technical Society of Australasia, Submission 37, p 193.
21 Railway Technical Society of Australasia, Submission 37, p 193.

223
policy designed to encourage increased use of diesel fuel. We already havea range of policies that effectively amount to an annual subsidy that the roadresearch board has calculated at about $30,000 per large road freightvehicle, which is effectively encouraging the transfer of freight from rail andcoastal shipping to road, at considerable cost to the community in lives lostand noise and pollution, as well as cost to the community through thistaxpayer generated subsidy. The holding down of the price of diesel willeffectively increase this subsidy.22
6.25 While he does not advocate a rapid removal of the diesel subsidies, due to theeconomic disruption it could cause, Professor Lowe does advocate that they begradually phased out:
I believe that a rational strategy would be to phase out the subsidy over aperiod of years to avoid disruption because I think it is reasonable thatpeople who have made investment decisions based on the current system oftaxes and charges are not disrupted. But a rational approach would be to saynow that we will over a period of five years or longer phase out the subsidyon road freight and we will systematically increase the price of fuels byemploying a graduated carbon tax that steadily increases over time.23
6.26 The QCC also argued for the review of diesel subsidies:
We support very strongly the review and reduction of fossil fuel subsides,particularly the diesel rebate scheme, linking that to our optimism that theenergy credit scheme, which is due for introduction on 1 July 2002 toreplace the existing diesel fuel credit scheme, will aim for an overallreduction in greenhouse emissions from the transport sector. All talk, andthere has not been a lot to date, of the potential energy credit schemesuggests that this will be rearranging current arrangements withoutdiminishing to any sector the overall level of subsidy.24
6.27 A number of witnesses raised the system of Fringe Benefits Tax (FBT)deductions as a problem. The ARA pointed out a discrepancy between the FBTapplied to business motor vehicles versus public transport. They assert that whilecompany and government cars represent 16.5 per cent of vehicle sales, they cause 40per cent of peak hour traffic and 20 per cent of all traffic:
The FBT applying to motor cars as a proportion of salary packages isapproximately 10 per cent of the vehicles purchase price. The FBTapplying to a public transport ticket is approximately 95 per cent of theticket price. This policy creates a significant disincentive for companies toinclude public transport fares in salary packages and encourages greater useof company cars for commuter use. In contrast, in the USA employers are
22 Proof Committee Hansard, Brisbane, 26 May 2000, p 636.
23 Proof Committee Hansard, Brisbane, 26 May 2000, p 636.
24 Mr James Whelan, Proof Committee Hansard, Brisbane, 26 May 2000, p 673.

224
encouraged to provide public transport tickets worth A$100 per month, taxfree.25
6.28 The University of NSW Transport Program (UNSWTP) pointed out that‘while an employee is unable to claim, as a tax deduction, for travel to and from work,nonetheless economic benefits for cars are available to employees offered a salarypackage’:
Under certain circumstances, employees are able to improve their financialposition by leasing a vehicle and reducing their taxable income (hencesalary sacrificing). The fringe benefit tax (current rate being 48.5 per cent)subsequently paid is based on a concessional rate depending on kilometrestravelled per year… the statutory formula used to calculate the percentage todiscount a car’s value has a distorting effect. No additional cost is imposedon users as distance travelled increases - the taxable value and FBT payableactually falls the longer distance travelled - ranging from 26 per cent forunder 15,000 km (the average distance travelled by a household car peryear) to 7 per cent for over 40,000km. We have now verified anecdotesfrom people, who as beneficiaries of the FBT concessions, remark that theiremployers remind staff with novated leases to clock up more kilometres toreach the threshold before the end of the FBT year, 31st March each year -in practice, typically, cars are lent to friends to take long weekend trips.26
6.29 The UNSWTP suggest that not only do FBT concessions on business vehiclescost the Commonwealth needed revenue (an estimated $740 m in 1996-97), but thatthe concessions directly cut across the Commonwealth’s declared policy of traveldemand management, as contained in Module 5 of the NGS. They also argued thatsuch FBT deductions led to a growth in cars used to travel to work (with up to 50 percent of cars travelling to the Sydney CBD receiving some form of FBT deduction) andhas caused an increase in the number of cars per household.27
6.30 In evidence, the ARA recommended that government introduce ‘salarypackaging arrangements that are neutral with respect to employee choice of transport’,and argued that economic policy, including tax policy, needed to be consistent withnational fiscal and environmental policy.28
6.31 Such trends are exacerbated by the large proportion of company cars inAustralia’s fleet. Up to 60 per cent of new car purchases are for ‘company cars’, andbecause the drivers of these cars often do not pay for their own fuel there is littleincentive to look for fuel efficiencies either in engine size or usage. This is of someconcern to the Committee, given that these purchases to a large extent determine theprofile of Australia’s car fleet as they are handed down.
25 Australasian Railways Association, Submission 181, p 1903.
26 University of NSW Transport Program, Submission 171, p 1718.
27 University of NSW Transport Program, Submission 171, p 1720.
28 Mr John Kirk, Proof Committee Hansard, Melbourne, 20 March 2000, p 151.
225
6.32 The Committee notes that many other countries have innovative andgreenhouse friendly taxation arrangements for motor vehicles. The BFA point outthat since the 1970s there had been steadily increasing levels of ‘motorisation’ and acollective decline of all the more sustainable forms of transport. They compareAustralian trends with data from the Netherlands which has a similar population toAustralia. The Netherlands National Environment Policy Plans (NEPP) have aimed toconstrain motor vehicle dependence since 1989.
Without the NEPP it was expected that car kms would increase by 72 percent over the period 1986 to 2010. With the NEPP this increase will belowered to 48 per cent, a positive step towards ESD. Bicycle trips havesubstituted for short car trips and 28 per cent of all trips are made bybicycle.
The performance of the Dutch car fleet is far better. At present only 23 percent of the Dutch car fleet is older than 10 years compared to 43 per cent ofthe Australian car fleet and Dutch cars are on average smaller. Anotherfactor is the 41 per cent of passenger cars powered by LPG which produces14 per cent less GHG and significantly less air pollution.29
6.33 The Netherlands charge a purchase tax on passenger cars and motorcycles.They are about to lower this and introduce a surcharge calculated on the CO2 emittedper kilometre so the outcome is revenue neutral but provides incentives for fuelefficiency. Deductions will be made for built-in feedback instruments such aseconometers and dashboard computers, cruise control, etc. which can lead to 5 to 10per cent reductions in fuel use.30
6.34 The BFA was critical of the Commonwealth’s failure to reverse the currenttrends or even constrain the growth of motorisation restructuring the tax system,pointing out that the NGS states:
‘Economic policy instruments (both incentives and disincentives) will beexamined to ensure they are consistent with fiscal, economic andenvironmental policy, including greenhouse objective… to be completed in1999/2000’, p. 56.
The Dutch experience shows that the NGS needs to be backed up by eco-taxes to replace current tax incentive to overuse cars if sustainable trends areto be reversed.31
6.35 The BFA lists 13 measures needed to supplement the NGS and NationalBicycle Strategy:
29 Bicycle Federation of Australia, Submission 38, p 207.
30 The Netherlands’ Climate Policy Implementation Plan, June 1999.
31 Bicycle Federation of Australia, Submission 38, p 207.

226
• an annual petrol and diesel tax increase to encourage fuel conservation andefficiency;
• increased GST on energy wasteful vehicles and upgraded emissions standards toEuropean levels by 2002;
• more government support for the gaseous fuels industry through exciseexemptions for CNG and LPG and grants for conversions; also more funding forbiofuels and ethanol/methanol;
• new design rules which stipulate that all new car and LCV engines be easilyconvertible to CNG;
• tax and policy measures to encourage an increasing proportion of CNG-fuelledvehicles in government and private fleets;
• salary packaging to encourage cycling and public transport, or Commonwealthrules to ensure salary packaged cars are CNG-fuelled;
• environmentally responsible taxation of workplace parking spaces;
• research funds for an analysis of the provision and pricing of parking spaces;
• GST exemptions for public transport, and greater accessibility to parking andpublic transport for bicycles;
• encouragement to employers to provide reimbursement for cycling on workbusiness rather than driving;
• greater harmonisation of business developments with public transport facilities;
• urban planning regulations that include car-free housing; and
• $200 million in Commonwealth funds in 2000 for Travelsmart and bicyclestrategy plans.32
6.36 In their discussion paper Key Greenhouse Response Strategy in Energy andTransport for Australia, the Institute for Sustainable Futures, University ofTechnology, Sydney, argues that Australia should:
As a matter of urgency, remove tax benefits for the purchase and use ofcompany cars and government cars, and increase the rate of import duty on4-wheel drives to parity with that of ordinary passenger cars. … . Allowonly a fixed flat-rate income tax deduction for personal vehicle use, set atthe marginal cost per km of use of a fuel-efficient car, not the total cost perkm. Likewise, permit business to claim only fuel costs based on 8litres/100km or some similar benchmark (ratcheting down over time).
32 Bicycle Federation of Australia, Submission 38, p 207.
227
Standard fuel consumption data could be used to apply an adjustment to theproportion of fuel cost claimed.33
6.37 The paper suggests that state governments should:
• remove road agencies’ planning powers and guaranteed funding, and strengthenpowers and funding of Departments of Transport and/or Urban Planning;
• increase taxes on car parking (from zero in some states) in city centres and sub-centres that are well served by public transport, and hypothecate the revenue tolocal governments for the purpose of providing facilities for cyclists andpedestrians;
• create and enforce an extensive network of transit lanes in cities;
• work with the Commonwealth to implement a national system of mass anddistance charges for heavy trucks, as in New Zealand, for Australia’s populouszone only;
• develop and implement integrated ticketing and fares for public transport withincities, so that passengers are charged according to distance travelled (except inthe central regions of cities where a flat fare is appropriate) and are not chargedextra for transfers between modes or between publicly and privately operatedservices. For example, in Sydney this could involve extensions to the existingtravel pass system;
• set up statutory Public Transport Advisory Committees in every localgovernment area with membership comprising representatives from state andlocal government, public transport providers (including private bus companieswhere relevant), and members of the public. These committees would have theaim of improving local public transport services and use, and recommendinginter alia on proposals for Cities for Climate ProtectionTM (CCP) funding and onenvironmental levies by local government;
• from part of the economic savings achieved by other measures, create asubstantial fund for cycleways (both arterial and feeders for key localdestinations) and bicycle parking at key local destinations (key local destinationsinclude railway stations, schools, and shopping centres). The local part of thebicycle plan would be implemented by local government; and
• create incentives for ownership and use of low-speed electric motor-assistedvehicles, such as scooters and buggies, with power outputs of motors up to 250watts. This would include legalising their use in all states and territories,
33 Mark Diesendorf, Key Greenhouse Response Strategy in Energy and Transport for Australia: ADiscussion Paper, Institute for Sustainable Futures, University of Technology Sydney, September 2000.

228
allowing them to use bicycle paths (subject to speed and size limits) andconducting familiarisation programs in schools.34
6.38 Some witnesses also suggested that the new tax system would have a negativeimpact on efforts to reduce greenhouse emissions from transport. The ARA assertedthat the imposition of GST on public transport fares would see them rise by between5-10 per cent, at the same time as new car prices fall by at least 6 per cent. Whilesome of these purchases may replace older stock, they asserted that many will be newadditions to the vehicles already travelling Australia’s roads:
These price effects combined with businesses being able to claim a 7 cents alitre tax credit on petrol used for business purposes are regressive measuresthat will discourage public transport use and increase car use in urban areas.Taxation reform will further skew the system in favour of motorists. Incontrast, most European countries either zero rate public transport or apply areduced rate.35
6.39 The UNSWTP recommended that public transport travel passes be taxexempt, and claimed that ‘depending on conditions, we know from experience in othercountries (and the TravelSmart Program in Perth) that a 10-30 per cent mode shiftfrom car commuting to public transport can be achieved by offering tax exempt travelpasses’.36
6.40 The UNSWTP has proposed a number of recommendations for tax reform inrelation to transport:
• licence fees levied on parking bays, levied differentially according to the level oflocal congestion and the availability of public transport. Where public transportalternatives were not readily available, the fee would be zero or very low.Licence fees could then be applied to investments in public transport;
• amendments to FBT legislation to ensure that no financial advantage can begained by travelling more kilometres in a vehicle under a novated lease;
• amendments to FBT legislation to provide exemption for employers who providesubsidised public transport fares or passes to their staff; and
• the introduction of road pricing in large cities ‘where congestion costs andenvironmental impacts from road transport are the greatest. This would reflectthe true social costs from motoring and put public transport in a morecompetitive situation in the urban transport market’.37
34 Mark Diesendorf, Key Greenhouse Response Strategy in Energy and Transport for Australia: ADiscussion Paper, Institute for Sustainable Futures, University of Technology Sydney, September 2000.
35 Australasian Railways Association, Submission 181, p 1903.
36 University of NSW Transport Program, Submission 171, p 1718.
37 Urban Transport Taxation Subcommittee, Issues with the current concessional taxation treatment of carsand parking compared to public transport, August 1999.

229
6.41 The NGS does contain a measure under which the impact of taxation policieson transport emissions may be considered. Measure 5.1 to ‘examine economic policyinstruments relating to transport to ensure they are consistent with fiscal, economicand environmental policy, including greenhouse objectives’. The AGO informed theCommittee that this task was being undertaken by the Bureau of Transport Economics(BTE) at the request of the Australian Transport Council. The BTE’s final report is tobe considered by Commonwealth, state and territory transport ministers at a meetingin November 2000.38
Recommendation 45
The Committee recommends that the Bureau of Transport Economics’ report onthe economic policy instruments relating to transport be made publicimmediately. The Committee recommends that the planned meeting of transportministers to consider the report be broadened to include the respectiveenvironment ministers and/or ministers responsible for greenhouse issues.
Recommendation 46
The Committee recommends that the Commonwealth work with the states toconsider the following measures proposed by the Institute for SustainableFutures University of Technology, Sydney:
• strengthen the role of Departments of Transport and/or Urban Planning inintegrated transport solutions;
• increase taxes on car parking in centres that are well served by publictransport;
• create and enforce an extensive network of transit lanes in cities;
• a national system of mass and distance charges for heavy trucks travellingin Australia’s populous zone;
• integrated ticketing and fares for public transport within cities;
• local consultative committees in local government areas with the aim ofimproving local public transport services and use;
• improve funding for cycleways and bicycle parking at key localdestinations; and
• create incentives for ownership and use of low-emission vehicles, includinglow-speed electric motor-assisted vehicles (such as scooters and buggies).
38 Australian Greenhouse Office, Response to Questions on Notice from Senator Bob Brown, 8 September2000, p 13.

230
Recommendation 47
The Committee recommends that the Government carry out a review of FringeBenefits Tax legislation to remove the incentive for employers to include motorvehicles for private use in salary packages, to remove financial rewards fortravelling more kilometres in a vehicle under a novated lease, and to generallyremove barriers to employees using alternatives to single occupancy of cars incommuting.
Recommendation 48
The Committee recommends that the Government introduce Fringe Benefits Taxdeductions for the inclusion of public transport and cycling commuting expensesin salary packages.
Recommendation 49
The Committee recommends that public transport fares be considered forexemption from (or zero rated for) GST.
Recommendation 50
The Committee recommends that the proposed new Energy Credit Scheme beused to gradually phase out diesel fuel rebates and credits. The Committeesupports the use of other greenhouse-neutral compensatory measures to ensurethat such a phase-out does not lead to greater hardship in rural and remoteareas.
Alternative Fuels
6.42 World-wide, some 50 million cars are added to the roads every year and by2030 there could be 1 billion cars globally. For this reason many in the car industrybelieve the era of the ‘clean car’ is about to begin with fuel cell engines, hybrid drivesand advanced battery systems getting closer to commercialisation.39
6.43 Gaseous fuels and hybrid electric and petrol and hydrogen fuel cell vehiclesoffer opportunities for reducing greenhouse emissions by 15 to 50 per cent overcurrent petrol and diesel fuels. Ultra low sulphur diesel and petrol can also achievelower emissions.
6.44 Whilst the uptake of liquid petroleum gas (LPG) has been significant inpassenger vehicles, particularly taxis (30,000 megalitres in 1989 rising to 130,000megalitres in 1999) the number of alternative fuel vehicles on Australian roads is stillextremely low. It is too early to assess the success of government measures discussedabove but to date around 440 gas buses have taken up the grants.
39 Tomorrow magazine, September/October 2000.
231
6.45 Ford in Australia manufactures dedicated LPG Falcon sedans and utilities.The extra cost of these vehicles is around $800 - a sum which would be recouped infuel savings by average motorists in less than a year. No other Australian carmanufacturer yet markets vehicles run on gas fuels, off their production line, althoughsome make CNG vehicles available for fleets. Volvo is expected to release a CNGmodel soon but it will be fully imported.
6.46 In 1995, the California Air Resources Board Certification Branchdemonstrated that a light van converted from petrol to CNG would produce 24 percent less CO2 emissions, 76 per cent less CO, 83 per cent less NOX (oxides ofnitrolgen), 88 per cent less non-methane hydrocarbons, 99 per cent less benzene andalmost no sulphur.
6.47 A major impediment to the take-up of CNG vehicles in Australia is the lack offuelling stations. The Commonwealth fund of $7.6 million is being used to fund up to50 per cent of the cost of purchasing and installing equipment for a limited number ofpublicly accessible refuelling outlets. The aim is to establish up to 20 additional sitesaround Australia by 2002. To date there are only 12 CNG refuelling sites in Australiacompared with 3,300 LPG outlets.40
6.48 Apart from the greenhouse advantages of using CNG, it is an indigenous fuel.Australia has a substantial and growing network of CNG pipeline infrastructure intomany regions, the Commonwealth has a fixed 5 year rolling moratorium on theintroduction of an excise and CNG is not linked with the world crude oil parity pricingsystem.
6.49 Although still a fossil fuel, natural gas is regarded by the Committee as animportant transitional fuel for some time to come.
6.50 The UK Cleaner Vehicles Taskforce offers the view that consumers may bereluctant to pay the additional costs associated with alternative fuels and technologiesand suggests that on-going market incentives will be significant in determining themarket introduction of alternative fuels and vehicle technologies. The Taskforceclaims that the market will be strongly influenced by one or more of the following:
• consumers’ and operators’ perception of costs which may be different to ‘actualcosts’;
• predicted cost benefits to the customer/operator, such as improved fuel economyand reduced fuel costs;
• customer/operator beneficial performance features, such as drive quietness andsmoothness;
40 The Australian Greenhouse Office, Fact Sheet: Compressed Natural Gas Infrastructure Program,http://www.greenhouse.gov.au/transport/cng.html.

232
• other savings in vehicle cost/complexity to the manufacturer, especially in theareas of emissions control equipment and exhaust after-treatment;
• possible vehicle access restrictions to city centres for all but low-emissionvehicles; and
• increasingly stringent European legislation which may favour alternative fuelsand technologies.
Hybrid Electric Vehicles
6.51 A number of car manufacturers have produced prototypes of hybrid electricand petrol vehicles which have the potential to reduce fuel consumption by up to 50per cent. They utilise a simple and highly tuned internal combustion engine to operatean alternator to produce electricity that in turn drives hub mounted motors to powerthe wheels. Power from vehicle braking may be recaptured and stored in batteries.None of these prototypes hybrids is likely to be made available in Australia for theforeseeable future:
• Holden joined forces with CSIRO in Australia to produce the Eco-mmodorewhich uses a small four cylinder engine and an electric motor to drive the frontwheels. These power sources work in tandem to attain performance levelscomparable to those of the current Commodore with reductions in fuelconsumption of around 50 per cent. Holden has no plans to go into productionin Australia;
• CSIRO were also part of a consortium of 100 Australian companies which hasdeveloped the hybrid aXcessaustralia concept car which would produce 10 percent of the emissions of an average family car while reducing fuel consumptionby half. The car is on tour looking for interest amongst car makers;
• Toyota’s Prius is powered by an electric motor, power for which is supplied by a288 volt battery pack and a fuel-efficient twin cam multi-valve petrol motor anduses half the petrol of an equivalent sized petrol vehicle and emits only half thecarbon dioxide on a typical city drive cycle. Seven production models of Priushave been brought to Australia for evaluation and the vehicle is expected to belaunched commercially in Europe during 2000 but there are no plans to producethem here;
• Ford recently brought to Australia its THINK City zero emission, two seatervehicle powered by a liquid cooled, three-phase, alternating current inductionmotor which can be recharged in any standard 220 volt 16 or 10 amp outlet.This vehicle is on sale in Norway and will be available in the US within the nexttwo years, but not in Australia; and
• Honda Insight is an ultra-light 1.0 litre lean-burn engine that works in tandemwith a brushless DC electric motor. It achieved world-low consumption figuresof 3.85 litres per 100 km and a highway rating of 3.36 litres per 100 km. Thisvehicle is on sale in US, Europe and Japan and can be imported into Australia.

233
Hydrogen Fuel Cell Vehicles
6.52 The Committee notes the development of the hydrogen fuel cell in Europe,Japan and the US and the views expressed that the longer term future of transport is inthis technology. California recently passed legislation requiring at least 10 per cent ofnew cars to produce zero or near-zero pollution by 2003.41
6.53 DaimlerChrysler recently completed its NECAR 4 - the latest in a line ofdevelopmental fuel cell vehicles - which can reach a top speed of 145km/hr and has arange comparable with conventional petrol vehicles. It has also improved efficiencyand up to 80 per cent of the chemical energy in the hydrogen fuel is transformed intoelectrical energy in the fuel cell.
6.54 In its final report of the Cleaner Vehicle Task Force, June 2000, the UKDepartment of Environment, Transport and the Regions says:
Fuel cell vehicles have the potential to be very clean and efficient vehicles.There are a number of different potential fuels, but if pure hydrogen wasused the only tailpipe emission from a fuel cell vehicle would be water. Ifother fuels such as methanol or petrol are used then the vehicle will produceCO2 emissions and may produce small amounts of local air pollutants at thepoint of use, depending on the fuel used. However, fuel cell vehicles mayinitially be very expensive, and would need to be much cheaper than currentpredictions suggest to be used to reduce emissions of local and globalpollutants in a value-for-money way.42
6.55 The UK provides financial assistance for pre-commercial fuel cell electricdemonstration projects through its Powershift Program and encourages vehiclemanufacturers to make fuel cell vehicles available in the UK as soon as possible.43
6.56 The UK have identified three main barriers which affect the introduction ofhydrogen internal combustion engines (ICEs) and fuel cell electric vehicles (FCVs)as:
• the current cost of fuel cell electric vehicles, which is much higher thanconventional ICE vehicles. This is largely because of the high developmentcosts and because they are not made in large volumes. This situation maychange in 2003/4 when several major motor manufacturers plan to commerciallylaunch fuel cell vehicles;
• the high degree of uncertainty concerning the optimum system design for fuelcell electric vehicles; and
41 Tomorrow Magazine, Sept/October 2000.
42 Report of the UK Alternative Fuels Group of the Cleaner Vehicles Task Force, 2000.
43 Report of the UK Alternative Fuels Group of the Cleaner Vehicles Task Force, 2000.

234
• the high uncertainty regarding the best fuel infrastructure for supplyinghydrogen. The main contenders include pure hydrogen and reforming naturalgas, methanol and synthesised low sulphur petrol.44
6.57 The Committee also visited CSIRO’s Energy Technology DivisionLaboratory at Lucas Heights, where hydrogen is being produced using solar energyand natural gas, a process which is able to effectively capture 20 per cent of the solarenergy this way.
6.58 The Committee also notes the proposal by the Western Australia StateGovernment Transport Department to introduce three of the 30 fuel cell buses beingtrialed by BP/Mercedes world-wide.
Recommendation 51
The Committee recommends that a national strategy be developed with vehiclemanufacturers to increase the availability of alternative fuel vehicles.
Recommendation 52
The Committee recommends that agencies be encouraged to purchase alternativefuel and hybrid electric petrol vehicles as they replace their fleet and as onemechanism to achieve efficiency targets.
Recommendation 53
The Committee recommends that the Commonwealth Government facilitatesjoint purchasing arrangements for Commonwealth agencies to exercisemaximum leverage over Australian manufacturers in providing fuel-efficientcars.
Recommendation 54
The Committee recommends that the Government, in consultation with thestates, develop a communications strategy to educate consumers about:
• the benefits of using public transport, walking and cycling;
• the benefits of cleaner, quieter, more fuel-efficient vehicles;
• the whole-life environmental impacts of second hand vehicles; and
• the benefits of better vehicle maintenance and ‘greener’ driving.
44 Report of the UK Alternative Fuels Group of the Cleaner Vehicles Task Force, 2000.

235
Vehicle Maintenance and Better Driving
6.59 Poor vehicle maintenance can increase pollution and reduce fuel efficiency.A well-maintained 10 year old car can use up to 30 per cent less fuel than a badlymaintained car of the same age. Similarly, driving in a safer and more fuel-efficientway can cut fuel use by between 10 and 30 per cent, depending on the type of trip.
Recommendation 55
The Committee recommends that a review be conducted to identify opportunitiesto improve environmental outcomes in vehicle maintenance, particularly inrelation to frequency, service standards and personnel training.
Cycling
6.60 The BFA provided the following charts which show the growth of the humanand car population, the growth of driving to work and the collective decline of all themore sustainable transport modes.
Figure 6.2
Source: Bicycle Federation of Australia
236
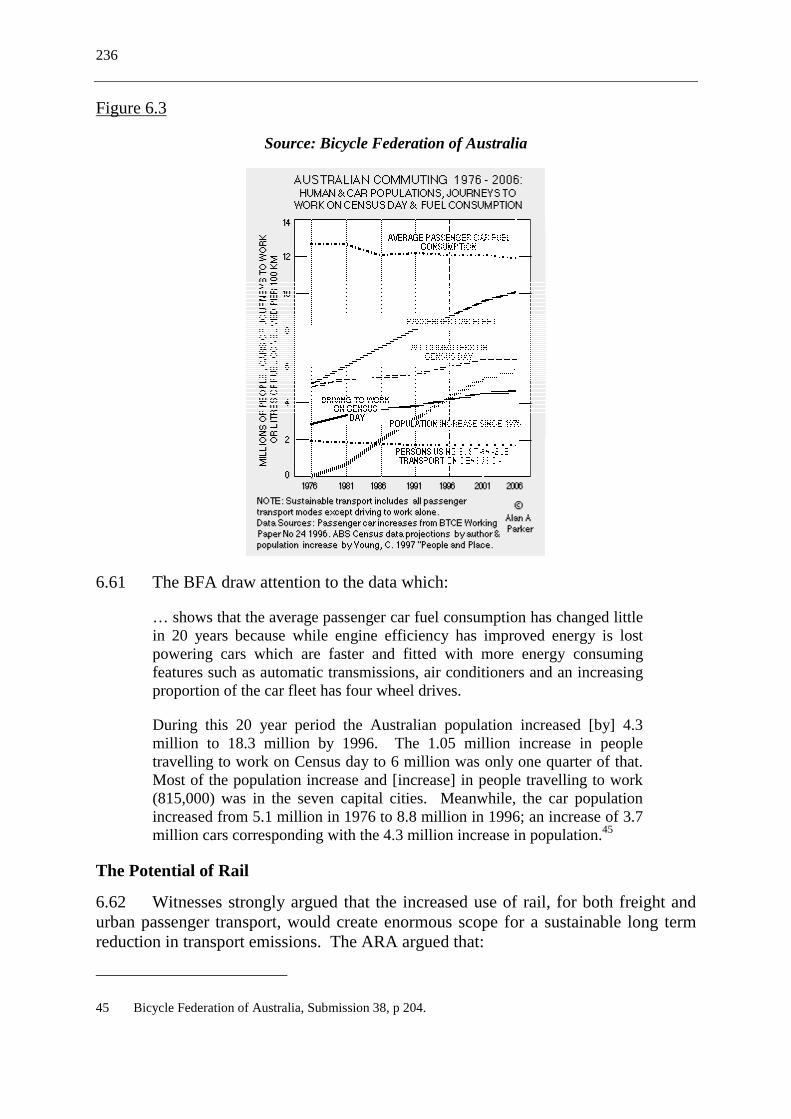
Figure 6.3
Source: Bicycle Federation of Australia
6.61 The BFA draw attention to the data which:
… shows that the average passenger car fuel consumption has changed littlein 20 years because while engine efficiency has improved energy is lostpowering cars which are faster and fitted with more energy consumingfeatures such as automatic transmissions, air conditioners and an increasingproportion of the car fleet has four wheel drives.
During this 20 year period the Australian population increased [by] 4.3million to 18.3 million by 1996. The 1.05 million increase in peopletravelling to work on Census day to 6 million was only one quarter of that.Most of the population increase and [increase] in people travelling to work(815,000) was in the seven capital cities. Meanwhile, the car populationincreased from 5.1 million in 1976 to 8.8 million in 1996; an increase of 3.7million cars corresponding with the 4.3 million increase in population.45
The Potential of Rail
6.62 Witnesses strongly argued that the increased use of rail, for both freight andurban passenger transport, would create enormous scope for a sustainable long termreduction in transport emissions. The ARA argued that:
45 Bicycle Federation of Australia, Submission 38, p 204.

237
Australia’s railways, both freight and passenger, can play a major role inreducing greenhouse gas emissions, particularly in our cities. For Australiato be serious about reducing greenhouse gas emissions, it must enhance therole of rail in the nation’s transport system. Increased investment in rail toreduce greenhouse gas emissions is strongly supported by the Australiancommunity. In our 1999 and 1998 Newspoll surveys, we found that 86 percent of voters believe that freight by rail is better for the environment thanusing large and heavy trucks.46
6.63 The ARA stated that just one train operating between Sydney and Melbournecould replace 150 semi-trailers, saving 45,000 litres of fuel and 130 tonnes ofemissions. They estimated that every train carrying 1,000 people replaced 800 carjourneys, and that Australia’s urban rail services, which carry 580 million passengersa year, replace approximately 470 million car journeys and save 2.5 Mt of emissions.They claim that rail freight is three times more fuel-efficient than road, and producesless than one third the emissions per tonne kilometre:
The Bureau of Transport Economics estimates that upgrading intercapitalmainline infrastructure could result in a 40 per cent shift of intercapitalfreight from road to rail and generate net social benefits of $3,400 millionby 2015.
Transferring this amount of freight from road to rail in the Melbourne-Sydney-Brisbane corridor would save 200 million litres of fuel and 580,000tonnes of greenhouse gases per year on the existing freight task.47
6.64 The ARA told the Committee that there was latent demand for rail, and thatnew infrastructure is rapidly patronised:
Where governments have invested in urban rail projects we have seenimproved patronage of rail services, particularly the electrification programsin Brisbane and Perth. Major investments have seen a modal shift in favourof rail. Certainly, the projects that are going ahead in Sydney are going tobe desperately needed by that city. The policies that are being promotedhere in Victoria to expand the network here also give us some considerablehope for the future. The situation in Adelaide is a little different. Adelaideis still very heavily car-based and we are seeing patronage of rail inAdelaide go against the trend and decline, whereas in every other city theuse of rail services is actually increasing.48
6.65 The ARA’s submissions added to this argument, saying that ‘the currentemphasis in Australian cities on urban freeways is out of step with overseas trends’:
46 Mr John Kirk, Proof Committee Hansard, Melbourne, 20 March 2000, p 152.
47 Australasian Railways Association, Submission 181, p 1896.
48 Mr John Kirk, Proof Committee Hansard, Melbourne, 20 March 2000, p 153.

238
Cities around the world are expanding and upgrading their urban rail andlight rail networks and this is reflected in patronage use. In 1997/98, theLondon underground had an 8 per cent patronage increase while patronageon light rail service increased by 7 per cent. In the US, heavy rail serviceshad a 5.5 per cent patronage increase, light rail patronage increased 6.3 percent and outer-urban commuter rail patronage increased 5.4 per cent.49
6.66 The Committee notes that road infrastructure has received almost 20 times thefunds applied to rail over the past 20 years. Moving passengers and freight to rail hasthe potential to achieve significant greenhouse emissions reductions and will be animportant component in meeting current and future Kyoto targets.
6.67 The disparity in Federal funding for road and rail underlines the need for theCommonwealth to become more involved in national strategies for the developmentand funding of new rail lines and services. The ARA argued that:
One of the problems we have in this country is that there is no real Federalinvolvement in urban rail. For example, if state governments want to buildroads then they can quite happily tap into tied road grants, but if they wantto build urban railways they have to be state loans. Consequently, thenorthern suburbs railway in Perth, for example, is a state loan, whereas theparallel Mitchell Freeway and other road projects were built primarily withFederal funds. If you look at the Intermodal Surface Transportation EquityAct of 1998 in the USA, that provides $42 billion in Federal funds over thefive years to 2003 for urban transit projects. So if we are going to capitaliseon redevelopment of our cities and revitalisation of urban rail there needs tobe a greater commitment from government, particularly from the FederalGovernment, to urban rail so that those projects are not state loans but comeout of an overall transport fund that can used for road or rail projects,depending on what has been determined to be the best allocation of thatmoney.50
6.68 A discussion paper - Key Greenhouse Response Strategy in Energy andTransport for Australia - by the Institute for Sustainable Futures, University ofTechnology, Sydney suggests that Australia:
End the existing bias towards funding the construction of major roads, byadopting legislation similar to the USA’s Intermodal Surface TransportationEfficiency Act (ISTEA), now known as the Transportation Equity Act(TEA), which requires roads to compete with rail, and includesenvironmental impacts in the assessments of funding proposals, which aredone by cities and local regions.51
49 Australasian Railways Association, Submission 181, p 1902.
50 Mr David Hill, Proof Committee Hansard, Melbourne, 20 March 2000, p 154.
51 Mark Diesendorf, Key Greenhouse Response Strategy in Energy and Transport for Australia: ADiscussion Paper, Institute for Sustainable Futures, University of Technology Sydney, September 2000.
239
6.69 There is a strong argument for the Commonwealth to develop a national railstrategy that is guided by a declared greenhouse emissions reduction objective, and bya desire to maximise the associated benefits to the nation in regards to healthimprovements, and reduction in congestion and smog.
6.70 The Commonwealth has an opportunity to become involved with thedevelopment of strategies for urban rail and the funding of projects which haveoverall greenhouse and other health and environmental benefits. The Committeeurges the Commonwealth Government to cooperate with the states in developing wideranging proposals for new and improved urban rail infrastructure and services.Costings should include quantified greenhouse reductions (and other health andpollution mitigation) benefits, along with benefits of reduced congestion, reduceddegrading of existing road infrastructure, and the deferral of road spending throughreduced demand.
6.71 The Commonwealth should also cooperate with the states and territories inassessing needs and priorities for the improvement of interstate mainline railinfrastructure, with a view to improving rail competitiveness and efficiency in thecarriage of both passengers and freight. The assessment should consider neededimprovements in track speeds and weight thresholds, in access to ports, industrial sitesand population centres, training and expertise, and ownership and organisationalstructures.
6.72 A range of funding options would be available: GST revenues, fuel excises, amuch larger proportion of existing road funds, and auction revenues from anemissions trading system. The Committee believes that the improvement ofAustralia’s rail infrastructure and services - both urban and interstate - should be amajor national priority, and thus consideration should be given to the dedication ofincreased budget funds over the long term. An improvement in Australia’s nationalrail infrastructure and services has the potential to provide many decades of benefits tothe community.
6.73 The Committee also notes that national rail services were the subject of amajor inquiry in 1998 by the House of Representatives Standing Committee onCommunications, Transport and Microeconomic Reform (The Neville Committee).Its report, Tracking Australia, recommended that the Commonwealth invest $750million to fix the worst deficiencies in the national track over the three years to July2001, and an additional $2 billion over the 10 years from 2001, with the national trackas a priority.52
6.74 It also recommended the declaration of a ‘national track’ on the standardgauge line between Brisbane and Perth including Melbourne and Broken Hill, andimportantly for greenhouse, recommended a ‘more equitable treatment of rail and road
52 House of Representatives Standing Committee on Communications, Transport and MicroeconomicReform, Tracking Australia: An inquiry into the role of rail in the national transport network, July 1998,pp xix-xxxi.

240
by governments in terms of investment, taxes and charges, and regulatoryrequirements’. It emphasised that ‘externalities - environment, congestion, accidents,air and noise pollution, gas emissions and greenhouse effects - should be consideredwhen assessing the efficiency of the transport industry’. It argued for a newregulatory framework to be developed between the Commonwealth, states andterritories to ‘help the Australian rail industry attain international best practice’ whichwould see the Commonwealth ‘encourage rail initiatives’.53
6.75 The Commonwealth Government has only committed $250 million in railupgrade funds and has failed to commit the extra funds which the Neville Committeeargued were needed over both the short and long term. It failed to respond effectivelyto the Neville Committee’s recommendation for more equitable treatment of road andrail, or to the need to incorporate externalities such as greenhouse into policy andregulatory actions. Government responses to already identified problems with railinfrastructure, funding and policy bias remain piecemeal and ineffective.54
Recommendation 56
The Committee recommends that the Commonwealth Government cooperatewith the states in developing proposals for new and improved rail infrastructureand services. Costings should include quantified greenhouse reductions andother health and pollution mitigation benefits.
Recommendation 57
The Committee recommends that the Commonwealth Government commit toprovide substantial funding for new urban as well as regional rail infrastructureand improvements to existing infrastructure as part of a cooperative strategywith the states.
Recommendation 58
The Committee recommends that the Commonwealth Government cooperatewith the states and territories in assessing priorities for the improvement ofinterstate mainline rail infrastructure, with a view to improving railcompetitiveness and efficiency in the carriage of both passengers and freight.The assessment should consider needed improvements in track speeds andweight thresholds, improvements in access to ports, industrial sites andpopulation centres, improvements in training and expertise, and ownership andorganisational structures.
53 House of Representatives Standing Committee on Communications, Transport and MicroeconomicReform, Tracking Australia: An inquiry into the role of rail in the national transport network, July 1998,pp xix-xxxi.
54 The Hon. John Anderson, Minister for Transport and Regional Services, Response of the FederalGovernment to Reports of the House of Representatives Standing Committee on Communications,Transport and Microeconomic Reform, Tracking Australia, April 2000.

241
A Long Term Strategy for Public Transport
6.76 In the Committee’s view, the increasing funding, development and utilisationof public transport must be central to a national effort to reduce emissions fromtransport. The statistics cited at the beginning of this chapter - that 92 per cent ofurban passenger transport is undertaken by private motor vehicle, that 89 per cent ofAustralia’s total transport emissions are from trucks and cars, and that car emissionsincreased 16.6 per cent between 1990 and 1998 - are not only alarming statistics inthemselves; they also point to the enormous potential for emissions reduction if muchof that usage can be shifted to public transport.
6.77 The Committee notes that the NGS contains public transport initiatives;however these are limited to the National Bicycle Strategy, marginal improvements toefficiency, and the establishment of a state-Commonwealth ‘forum’ by July 1999 ‘toinvestigate new public transport modes and technologies and evaluate best practiceoptions applicable to various urban conditions’. The NGS contains no timeline for theforum to report, and no clear directions as to its outcomes or influence on futuregovernment action. It appears that the forum has not made any substantive progress todate. The AGO informed the Committee that:
The Commonwealth Department of Transport and Regional Services hasundertaken consultations with state and territory agencies and interestedacademic and community groups. The aim of these consultations has beento further define the objectives and methodology of the project. A report onthe forum will be provided to the Australian Transport Council at itsmeeting of November 2000.55
6.78 It is unclear from this response exactly what progress has been made. Asvaluable as the initiatives in the NGS might be, they are piecemeal and contain nofirm timetables or commitments to action. Indeed, it is arguable that they appear moreas an effort to defer meaningful action. In the Committee’s view, what is required inthis area is vision, leadership, funding and long term commitment.
6.79 The ARA was critical of a lack of Commonwealth support for publictransport, saying that: ‘Neither Environment Australia nor the Federal Department ofTransport and Regional Services has a policy to promote public transport in the majorcities of Australia. They emphatically deny any responsibility for tackling one of thebiggest causes of greenhouse gas emissions in our cities. It is simply not theirproblem; it is a matter for the states to determine’.56
55 Australian Greenhouse Office, Response to Questions on Notice from Senator Bob Brown, 8 September2000, p 16.
56 Mr John Kirk, Proof Committee Hansard, Melbourne, 20 March 2000, p 151.
242
6.80 The ARA argued that funds devoted to public transport will provide far morecost-effective greenhouse emissions reductions than improvements to roads. Theycompared Melbourne’s CityLink freeway project, which cost $3 billion and isexpected to achieve some greenhouse reductions, with the potential investments inpublic transport which could have been made with the same (or less) expenditure.These potential improvements included: faster rail links with regional centres andrural areas; an airport rail link; faster and more frequent urban rail services; anextension of the suburban rail system to outer suburbs; a rail line east to Doncaster;more effective integration of bus and rail services; expanded car parking at railwaystations; and improved passenger safety.57
6.81 Professor Lowe argued that there were benefits to be gained by a betterintegration of public transport modes:
It has been a historic problem in Brisbane, for example, that the trains arerun by the state government and the buses by the city council. Forgenerations, they did not even meet to argue about it. They simply did theirown thing - operating in parallel universes. There was no integration oftimetables; no integration of fare structures. We are making some progresson that. But any realistic consideration of a city like Brisbane shows thatvery few journeys can be met by one trip on one transport mode. So if weare going to encourage more people to use public transport, we have todevelop some form of integration.58
6.82 He also argued for a commitment to funding and investing in public transport:
We also have to have a realistic investment in public transport. I think PeterNewman recently said that, in the last 30 years, we have spent about $1billion of public money on all forms of public transport and $43 billion ofpublic money on roads, which is exactly what you would do if you wantedto encourage people to use cars rather than public transport. It seems to methat, if we are serious about public transport, we have to regard it as ameasure that deserves public investment on at least the level of the roadbudget.59
6.83 While arguing for a range of approaches which would increase the energyefficiency of motor vehicles, the Australian Automobile Association also arguedstrongly for a renewed commitment to public transport:
Car dependency in Australia, and for that matter most other industrialisedcountries, is growing due to the failure of governments and publicauthorities to maintain the levels of investment in public transportinfrastructure needed to facilitate a shift from personal transport modes topublic transport modes. Transport policy must be geared towards
57 Australasian Railways Association, Submission 181, p 1902.
58 Proof Committee Hansard, Brisbane, 26 May 2000, p 639.
59 Proof Committee Hansard, Brisbane, 26 May 2000, p 639.

243
facilitating a reduction in such car dependency and specifically first targetedat those journeys most easily changed from cars to other public transportalternatives.60
Recommendation 59
The Committee recommends that the Commonwealth Government work withstate and local governments to urgently assess needs for new and improvedpublic transport infrastructure and services as an additional measure to the‘forum’ set up under the National Greenhouse Strategy and to be completedwithin 3 years.
Recommendation 60
The Committee recommends that the Commonwealth Government work withstate and local governments to scope and develop new public transport proposals(including quantified projections for savings in greenhouse emissions) anddevelop cooperative long term funding models with the aim to achieve firmcommitments to realise major new projects in the short-to medium-term.
Transport - Better Policy Directions
6.84 The South Australian Government acknowledged that transport ‘is a majorcontributor to greenhouse, making success in this sector a necessary part of meetingAustralia’s international commitments’. Its contribution to that State’s emissions iscurrently 19 per cent, with a 20 per cent growth between 1985-1995 and furthergrowth of 42 per cent over 1990 levels by 2012.61
6.85 However, while acknowledging its importance, the South AustralianGovernment argued that ‘the transport and urban planning sector is unique in anumber of ways making the management of greenhouse emissions from this sectorvery challenging’:
There are no available broad technical fixes to greenhouse gas emissionsfrom the transport sector. As a result, [a] package approach is requiredwhich address[es] the large number and diversity of emissions sources.62
6.86 The Committee believes that this is an important point. The evidencepresented during this inquiry demonstrates that transport emissions are a problembecause of a diverse range of factors: biases in the taxation system; poor urbanplanning; outdated transport policymaking models; the imbalance betweengovernment funding for roads and rail, cycling infrastructure and public transport; the
60 Australian Automobile Association, Submission 122, p 1161.
61 South Australian Government, Submission 199, p 2120.
62 South Australian Government, Submission 199, p 2120.
244
nature of freight markets; and the absence of environmental signals in the markets forvehicles and fuels. Each of these areas needs to be addressed in a coordinated andcommitted fashion.
6.87 Other witnesses also argued that effective policy was hampered by a lack ofanalysis and statistics which could alert policymakers to negative trends. Dr PhilipLaird argued that:
We have to get better data on what is happening out there. We just do notknow what is happening in transport which is a major energy-intensivesector of our community. In the last two months the ABS released its 2000year book. It did not even have the rail freight in tonne kilometres. It is toohard to count with the part privatisation that has occurred, so they havegiven up. Their survey of motor vehicle usage - would you believe - had theroad freight output in billion tonne kilometres falling throughout the 1990s.We need better data and we need it quickly.63
6.88 The Queensland Conservation Council (QCC) recommended two majorpolicy models which government should consider. One was the US Government’stransport legislation, the Intermodal Surface Transportation Act (TEA-21):
The TEA-21 legislation in the states has achieved phenomenal success inincreasing public transport usage, seeing the modal split rise 20 per cent. Toput that into context, in our region public transport, as a modal split of alltrips, represents approximately six per cent of all trips now, represented inthe 1960s some 40 per cent of all trips being made in Brisbane, and hasrecently been reported to be declining at 2.6 per cent per annum.64
6.89 The QCC’s Mr James Whelan argued that the US legislation was underpinnedby a new mentality in relation to national transport needs:
The Conservation Council has helped organise a national speaking tour byDon Chen of the surface transportation policy project, a Washington-basednon-government organisation in the US representing a coalition of some 250organisations across the United States which brought about the adoption ofthis new legislation in the US, which has turned transport funding in theUnited States on its head. Don Chen spoke very convincingly across thecountry of the death of the ‘predict and provide’ model for transport - thatyou cannot build your way out of congestion, that new roads generate newtraffic and the benefits that are anticipated from new road construction arevery rarely realised, certainly in terms of relieving congestion.65
6.90 Mr Whelan urged the Committee to consider a different way of allocatingCommonwealth funds for transport:
63 Proof Committee Hansard, Sydney, 22 March 2000, p 378.
64 Mr James Whelan, Proof Committee Hansard, Brisbane, 26 May 2000, p 673.
65 Proof Committee Hansard, Brisbane, 26 May 2000, p 674.
245
We would urge very strongly the Senate to look at models of transportfunding that would see the billions of dollars of Commonwealth transportfunding prioritise preferred modes. In the south-east Queensland region, forinstance, in order, we consider, for the State and local governments to obtainany transport funding from the Commonwealth, the regional and localgovernment would need to demonstrate successful implementation of atransport plan. Currently, the State government is able to come to theCommonwealth to ask for assistance in implementing the regional transportplan which is currently failing and is delivering a major increase each yearin greenhouse and other air pollutant emissions. There is no success controland no conditions for the receipt of Commonwealth funding.66
6.91 The Australian Automobile Association (AAA) argued for a combination ofapproaches. These included: the promotion of new vehicle technologies and fuelefficiencies; the promotion of alternative fuels; improved public transport and land useplanning; intelligent transport systems; the education of drivers and consumers; andfiscal policies which rewards fuel efficiency and reduced emissions.67
6.92 However, they acknowledged that energy efficiencies and technologicalinnovations in motor vehicles would not be enough. If the price of carbon were to beincreased in an effort to achieve meaningful reduction in motor vehicle emissions,transport alternatives had to be available:
Improving the fuel efficiency of vehicles is insufficient on its own to ensurea reduction in greenhouse gas emissions from passenger vehicles. Higherfuel duties and other so-called green taxes are being applied to motorists inan attempt to discourage car use. This strategy, however, will totally fail asmotorists find that there are fewer safe, comfortable, convenient andaffordable alternative forms of transport available.68
6.93 BP Amoco made a similar argument in relation to the potential for fuel pricesto increase as the result of emissions trading. They argued that it would notnecessarily cause a reduction in motor vehicle use unless public transport alternativesare available:
But, again, for the ultimate consumer, the car driver, I do not thinkemissions trading in my view works in that small, small market. Again, alevy also only really works if they have options. If you put a levy on fueland they do not have public transport, a cleaner fuel to go to or something,all you are actually doing is knocking up the cost of that family’s budget.69
6.94 The AAA is cautious about the use of taxes to provide a disincentive to caruse, opposing the ‘imposition of any further increase in so-called environmental taxes
66 Mr James Whelan, Proof Committee Hansard, Brisbane, 26 May 2000, p 673.
67 Australian Automobile Association, Submission 122, pp 1157-66.
68 Australian Automobile Association, Submission 122, p 1161.
69 Mr Merton Smith, Proof Committee Hansard, Sydney, 22 March 2000, p 320.
246
on motorists’. While the Committee is unaware of any taxes currently applying tomotorists having been imposed for environmental reasons, this indicates an in-principle opposition to such a policy. However, the AAA argues that, if taxes wereimposed for environmental reasons, revenues must be used to address environmentalproblems and be related to levels of use. The Committee supports a principle in whichroad user levies imposed for environmental reasons should be put to environmentalpurposes. The Committee suggests that such a principle would be embodied in anemissions trading system in which auction revenues were recycled back into theeconomy with environmental solutions and further abatement a priority.
Recommendation 61
The Committee recommends that the Commonwealth adopts integratedtransport planning so that all transport funding proposals include an assessmentof environmental impacts and alternative transport solutions. Fundingallocation decisions should be based on clear and accepted principles, and besubject to the highest standards of transparency and accountability.
Recommendation 62
The Committee recommends that the consideration of bikeways and pedestrianaccess be required for all new Commonwealth-funded road construction.
Australian Democrats Recommendation 7
The Australian Democrats recommend that the Commonwealth Governmentreview the current road and transport funding model, with a view toincorporating road funds into a common transport fund. This common fundshould be drawn on for a whole range of investments and projects: urban andinterstate rail, public transport, major roads and cycling infrastructure.Greenhouse abatement, and the development of new rail and public transportinfrastructure, should be priorities in the allocation of monies from such a fund.Allocation decisions should be based on clear and accepted principles, and besubject to the highest standards of transparency and accountability.
Recommendation 63
The Committee recommends that greenhouse abatement and otherenvironmental goals be incorporated into transport policies, and taxation andplanning policies which affect transport, as fundamental and governingpriorities.
Recommendation 64
The Committee recommends that Commonwealth, state and local governmentshould adopt challenging quantitative emissions reduction targets for their fleetswithin 2 years and that business be encouraged to do likewise.
247
Recommendation 65
The Committee recommends that work be undertaken to ensure the regular andcomprehensive reporting of transport statistics such as passenger motor vehicleand public transport usage, walking and cycling patterns, safety, rail and roadfreight, etc.

248