transport issues and the environment in latin america · transport issues and the environment in...
TRANSCRIPT
Transport Issues and the Environment in Latin
America
Ralph GakenheimerProfessor of Urban Planning, MIT
-- Oct. 21, 2010-
• --
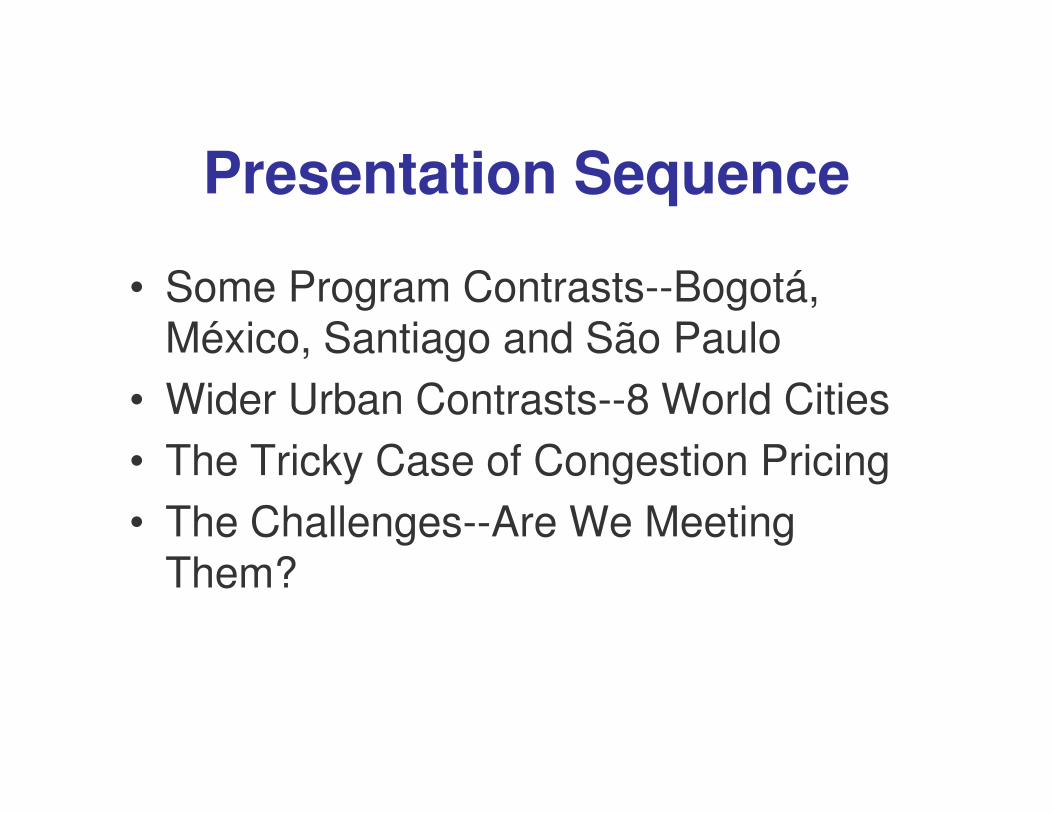
Presentation Sequence
• Some Program Contrasts--Bogotá,México, Santiago and São Paulo
• Wider Urban Contrasts--8 World Cities 8 World CitiesWider Urban Contrasts
• The Tricky Case of Congestion Pricing
• The Challenges--Are We Meeting Them?
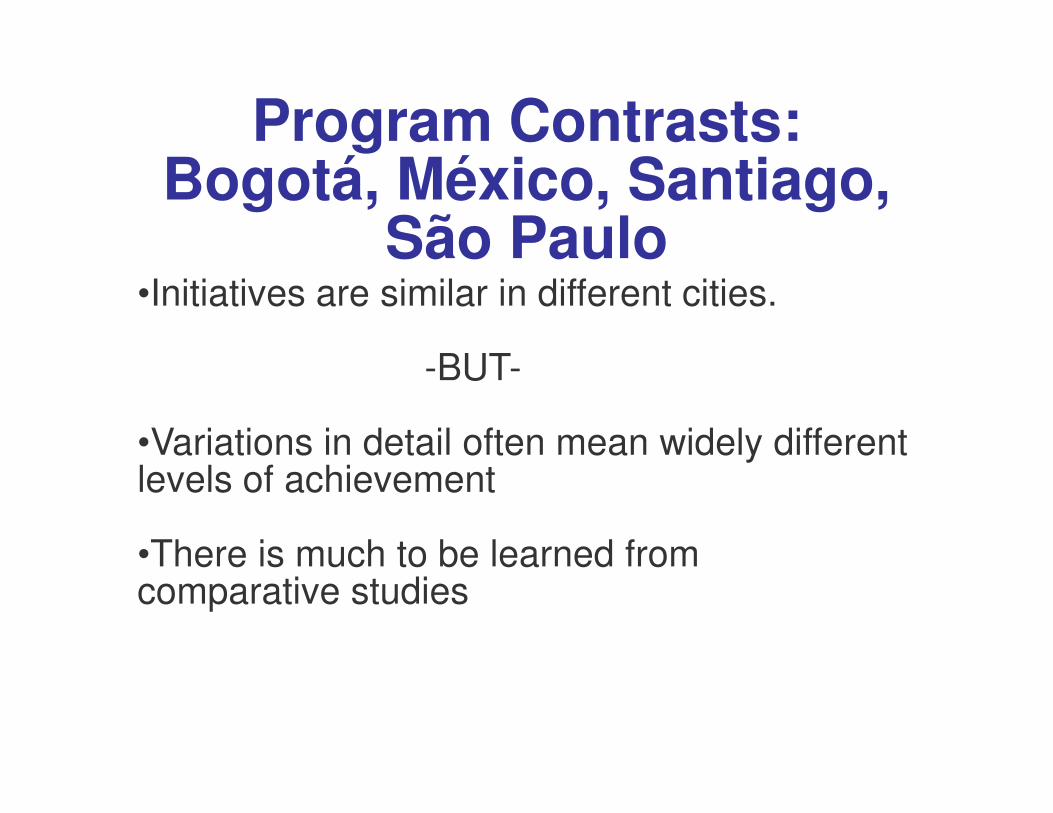
Program Contrasts:Bogotá, México, Santiago,
São Paulo•Initiatives are similar in different cities.
-BUT
•Variations in detail often mean widely different levels of achievement
•There is much to be learned from comparative studies
.
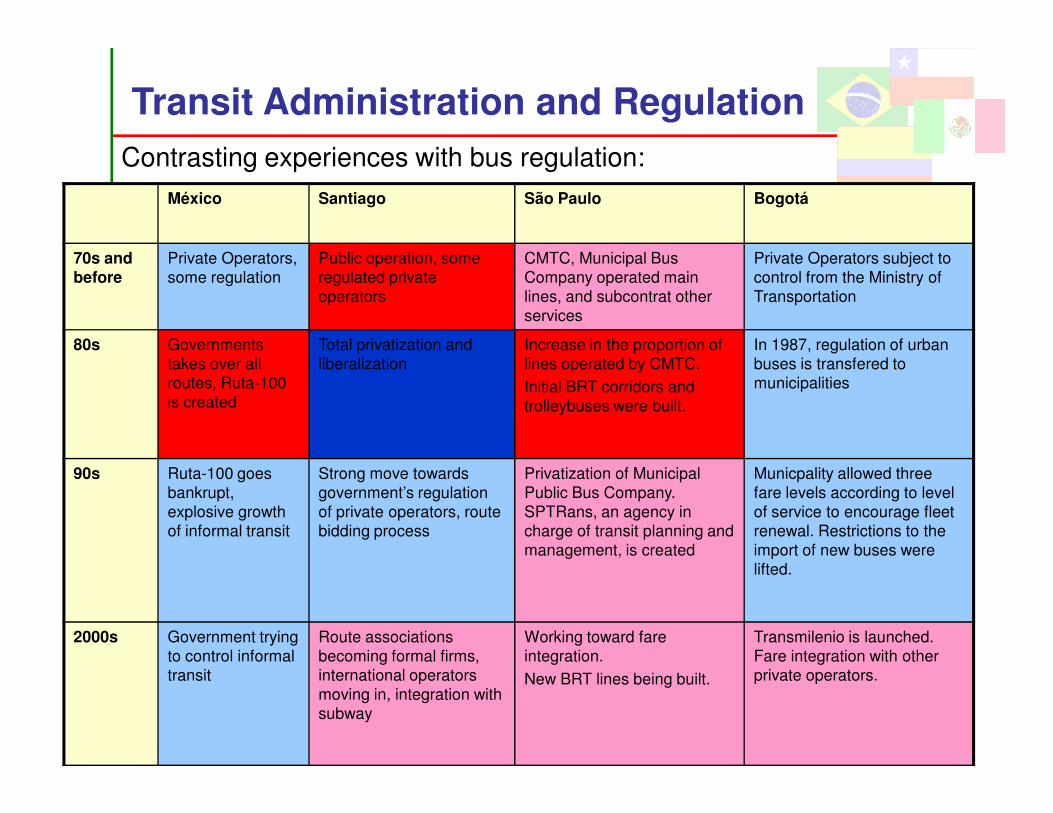
Transit Administration and Regulation
Contrasting experiences with bus regulation:
México Santiago São Paulo Bogotá
70s and before
Private Operators,
some regulation
Public operation, some
regulated private
operators
CMTC, Municipal Bus
Company operated main
lines, and subcontrat other
services
Private Operators subject to
control from the Ministry of
Transportation
80s Governments
takes over all
routes, Ruta-100
is created
Total privatization and
liberalization
Increase in the proportion of
lines operated by CMTC.
Initial BRT corridors and
trolleybuses were built
In 1987, regulation of urban
buses is transfered to
municipalities
is created trolleybuses were built.
90s Ruta-100 goes
bankrupt,
explosive growth
of informal transit
Strong move towards
government’s regulation
of private operators, route
bidding process
Privatization of Municipal
Public Bus Company.
SPTRans, an agency in
charge of transit planning and
management, is created
Municpality allowed three
fare levels according to level
of service to encourage fleet
renewal. Restrictions to the
import of new buses were
lifted.
2000s Government trying
to control informal
transit
Route associations
becoming formal firms,
international operators
moving in, integration with
subway
Working toward fare
integration.
New BRT lines being built.
Transmilenio is launched.
Fare integration with other
private operators.
, .
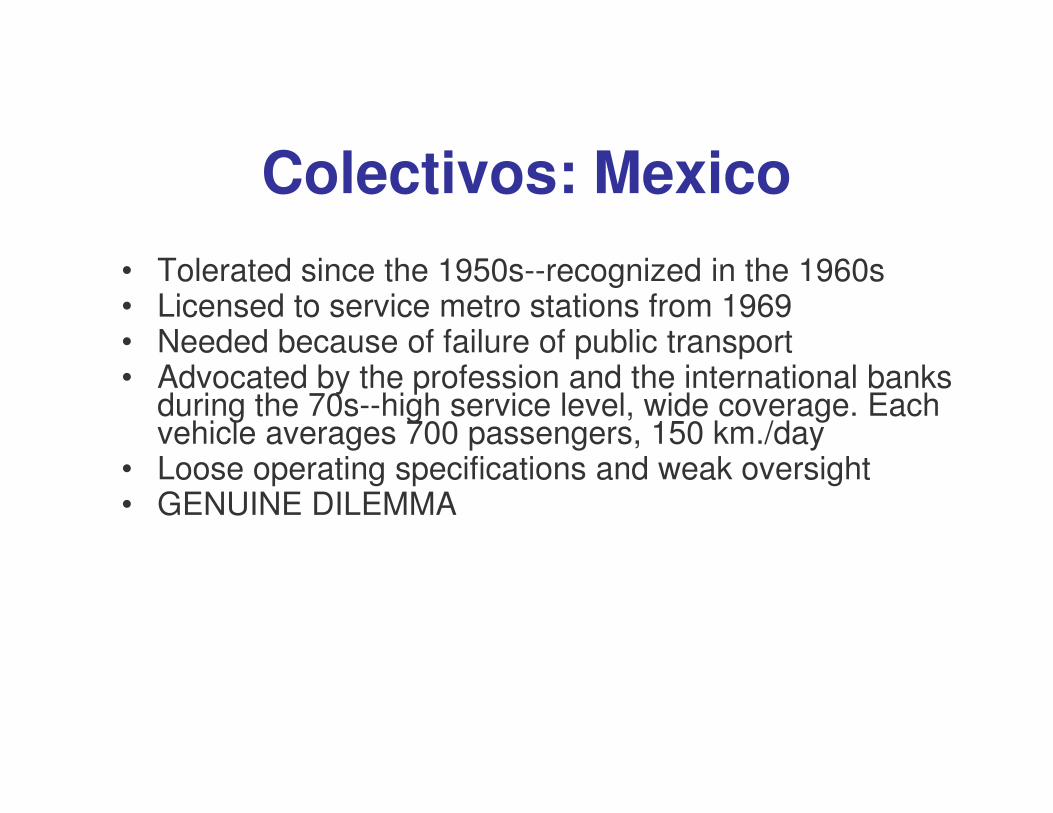
Colectivos: Mexico
• Tolerated since the 1950s--recognized in the 1960s • Licensed to service metro stations from 1969 • Needed because of failure of public transport • Advocated by the profession and the international banks
during the 70s--high service level wide coverage Each during the 70s--high service level, wide coverage. Each vehicle averages 700 passengers, 150 km./day
• Loose operating specifications and weak oversight • GENUINE DILEMMA
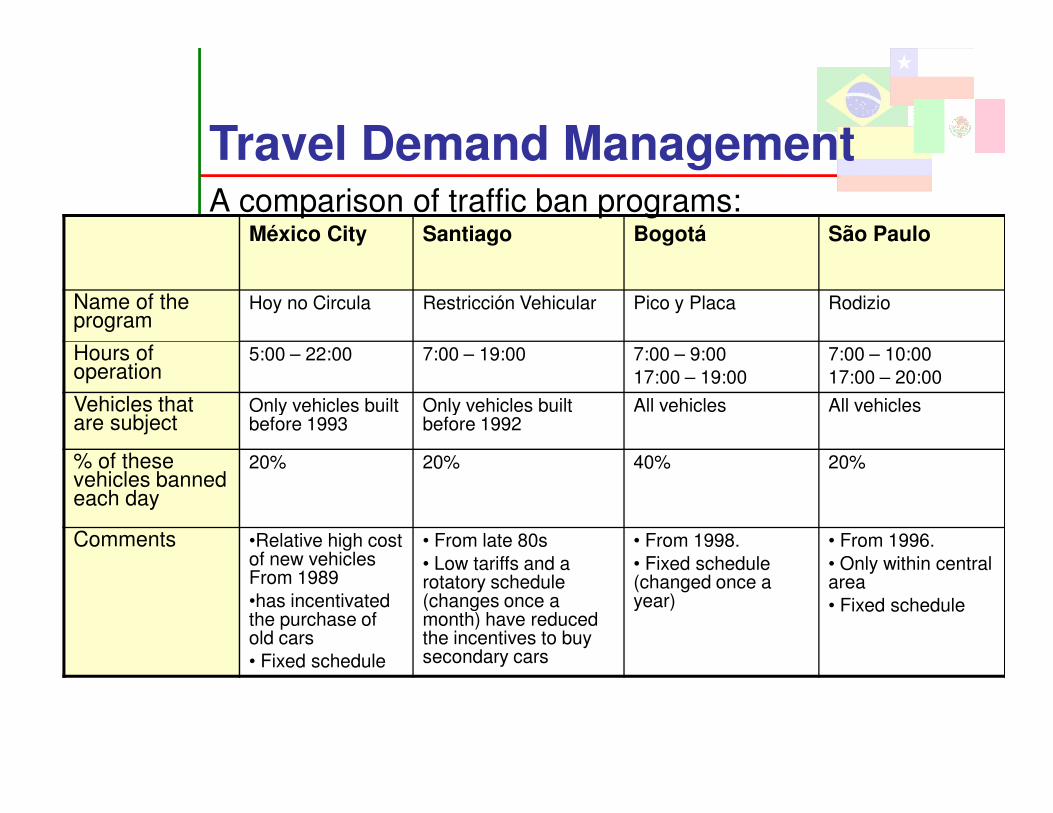
Travel Demand Management
México City Santiago Bogotá São Paulo
Name of the program
Hoy no Circula Restricción Vehicular Pico y Placa Rodizio
Hours of operation
5:00 – 22:00 7:00 – 19:00 7:00 – 9:00
17:00 – 19:00
7:00 – 10:00
17:00 – 20:00
Vehicles that Only vehicles built Only vehicles built All vehicles All vehicles
A comparison of traffic ban programs:
Vehicles that are subject
Only vehicles built before 1993
Only vehicles built before 1992
All vehicles All vehicles
% of these vehicles banned each day
20% 20% 40% 20%
Comments •Relative high cost of new vehicles From 1989
•has incentivated the purchase of old cars
• Fixed schedule
• From late 80s
• Low tariffs and a rotatory schedule (changes once a month) have reduced the incentives to buy secondary cars
• From 1998.
• Fixed schedule (changed once a year)
• From 1996.
• Only within central area
• Fixed schedule
to net importer.• México oes from net ex orter of used cars
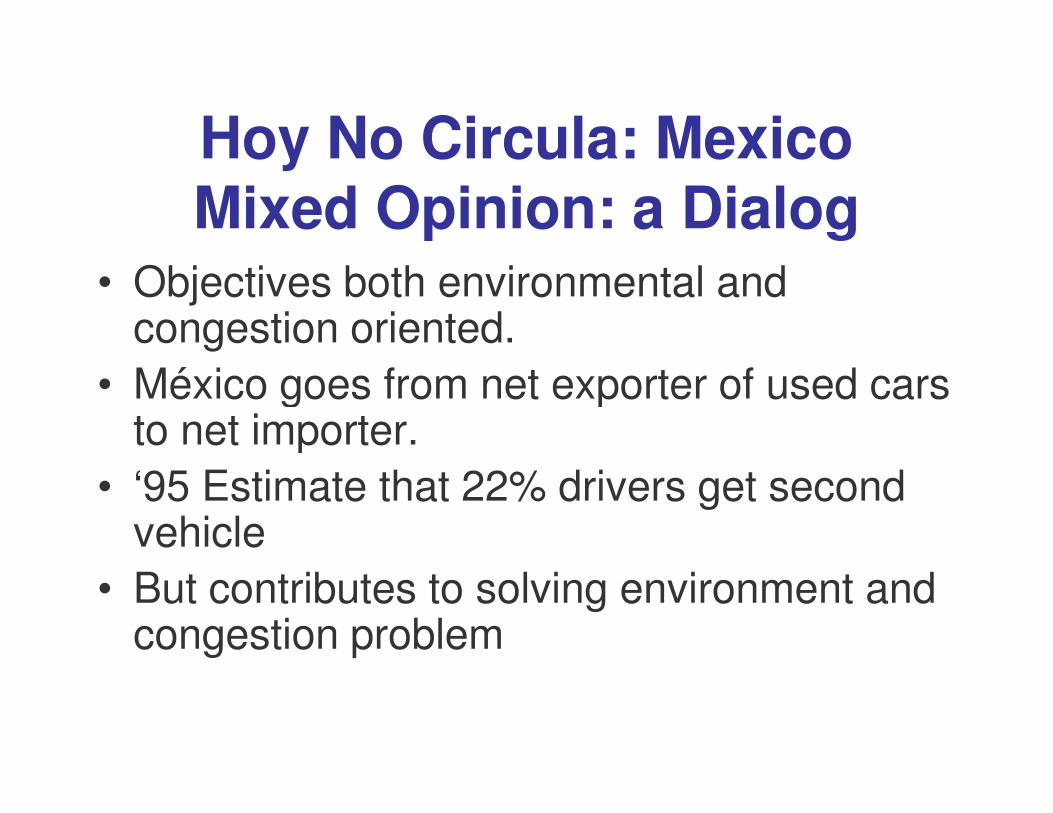
Hoy No Circula: MexicoMixed Opinion: a Dialog
• Objectives both environmental and congestion oriented.
• México goes from net exporter of used carspgto net importer.
• ‘95 Estimate that 22% drivers get second vehicle
• But contributes to solving environment and congestion problem
km
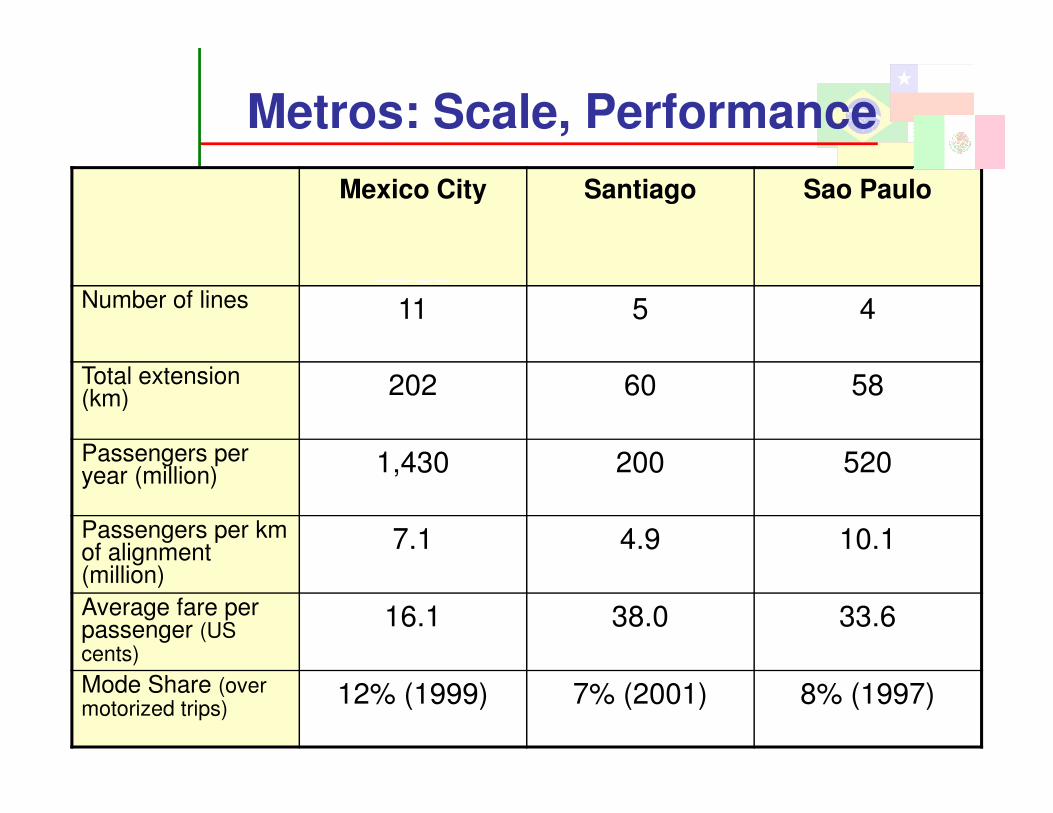
Metros: Scale, Performance
Mexico City Santiago Sao Paulo
Number of lines 11 5 4
Total extension (km) 202 60 58 ( )
Passengers per year (million) 1,430 200 520
Passengers per km of alignment (million)
7.1 4.9 10.1
Average fare per passenger (US cents)
16.1 38.0 33.6
Mode Share (over motorized trips)
12% (1999) 7% (2001) 8% (1997)
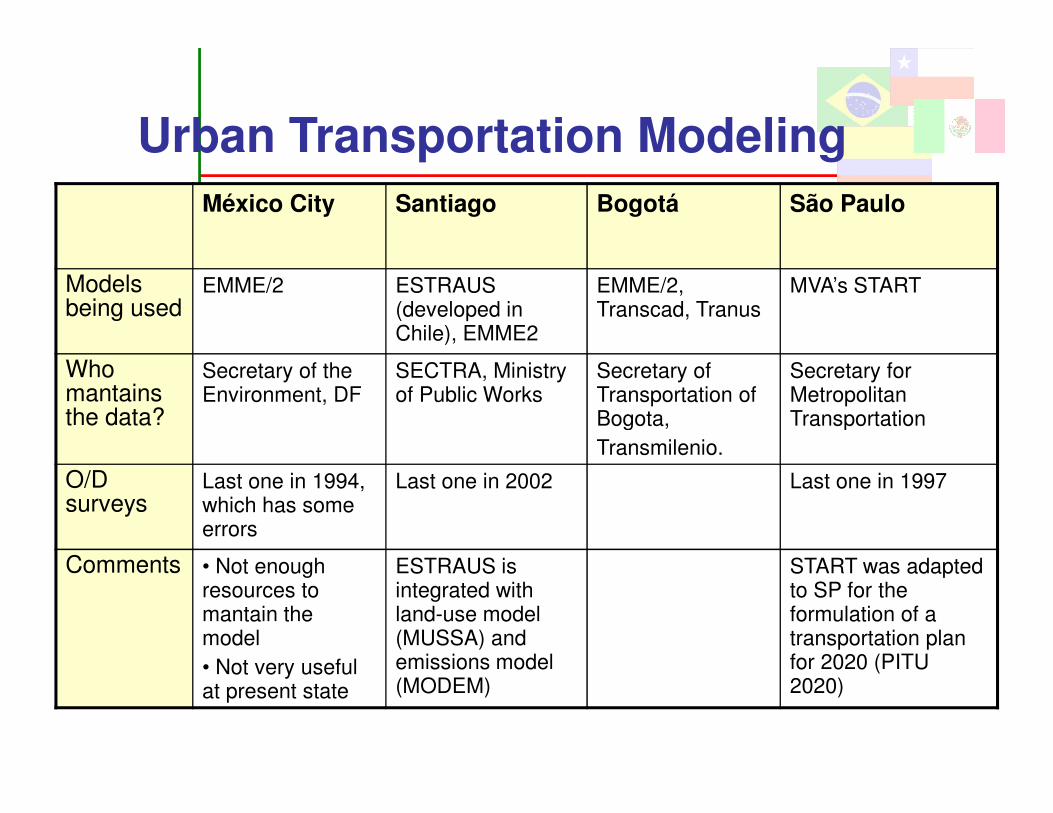
Urban Transportation Modeling
México City Santiago Bogotá São Paulo
Models being used
EMME/2 ESTRAUS (developed in Chile), EMME2
EMME/2, Transcad, Tranus
MVA’s START
Who mantains the data?
Secretary of the Environment, DF
SECTRA, Ministry of Public Works
Secretary of Transportation of Bogota,
Secretary for Metropolitan Transportationthe data? Bogota,
Transmilenio.
Transportation
O/D surveys
Last one in 1994, which has some errors
Last one in 2002 Last one in 1997
Comments • Not enough resources to mantain the model
• Not very useful at present state
ESTRAUS is integrated with land-use model (MUSSA) and emissions model (MODEM)
START was adapted to SP for the formulation of a transportation plan for 2020 (PITU 2020)
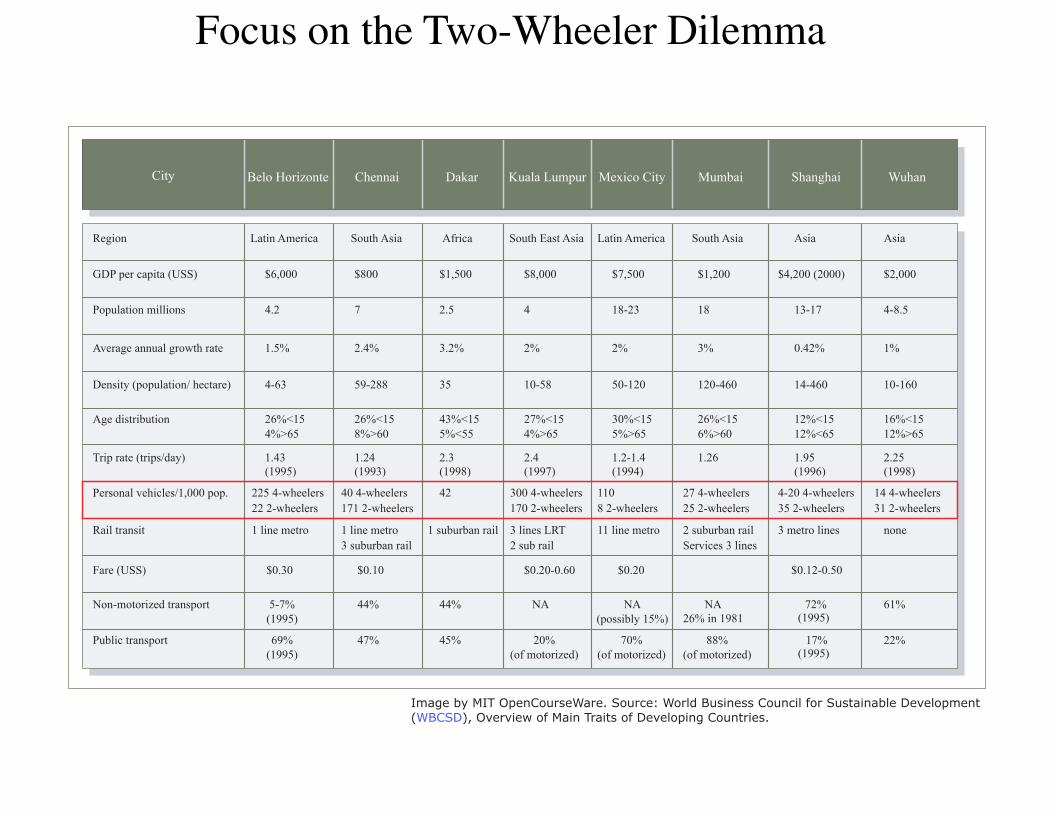
Focus on the Two-Wheeler Dilemma
City
Region
GDP per capita (USS)
Population millions
Average annual growth rate
Density (population/ hectare)
Age distribution
Trip rate (trips/day)
Personal vehicles/1,000 pop.
Rail transit
Fare (USS)
Non-motorized transport
Public transport
Belo Horizonte
Latin America
$6,000
4.2
1.5%
4-63
26%<154%>65
1.43(1995)
225 4-wheelers22 2-wheelers
1 line metro
$0.30
5-7%(1995)
69%(1995)
Chennai
South Asia
$800
7
2.4%
59-288
26%<158%>60
1.24(1993)
40 4-wheelers171 2-wheelers
1 line metro3 suburban rail
$0.10
44%
47%
Dakar
Africa
$1,500
2.5
3.2%
35
43%<155%<55
2.3(1998)
42
1 suburban rail
44%
45%
Kuala Lumpur
South East Asia
$8,000
4
2%
10-58
27%<154%>65
2.4(1997)
300 4-wheelers170 2-wheelers
3 lines LRT2 sub rail
$0.20-0.60
NA
20%(of motorized)
Mexico City
Latin America
$7,500
18-23
2%
50-120
30%<155%>65
1.2-1.4(1994)
1108 2-wheelers
11 line metro
$0.20
NA(possibly 15%)
70%(of motorized)
Mumbai
South Asia
$1,200
18
3%
120-460
26%<156%>60
1.26
27 4-wheelers25 2-wheelers
2 suburban railServices 3 lines
NA26% in 1981
88%(of motorized)
Shanghai
Asia
$4,200 (2000)
13-17
0.42%
14-460
12%<1512%<65
1.95(1996)
4-20 4-wheelers35 2-wheelers
3 metro lines
$0.12-0.50
72%(1995)
17%(1995)
Wuhan
Asia
$2,000
4-8.5
1%
10-160
16%<1512%>65
2.25(1998)
14 4-wheelers31 2-wheelers
none
61%
22%
Image by MIT OpenCourseWare. Source: World Business Council for Sustainable Development (WBCSD), Overview of Main Traits of Developing Countries.
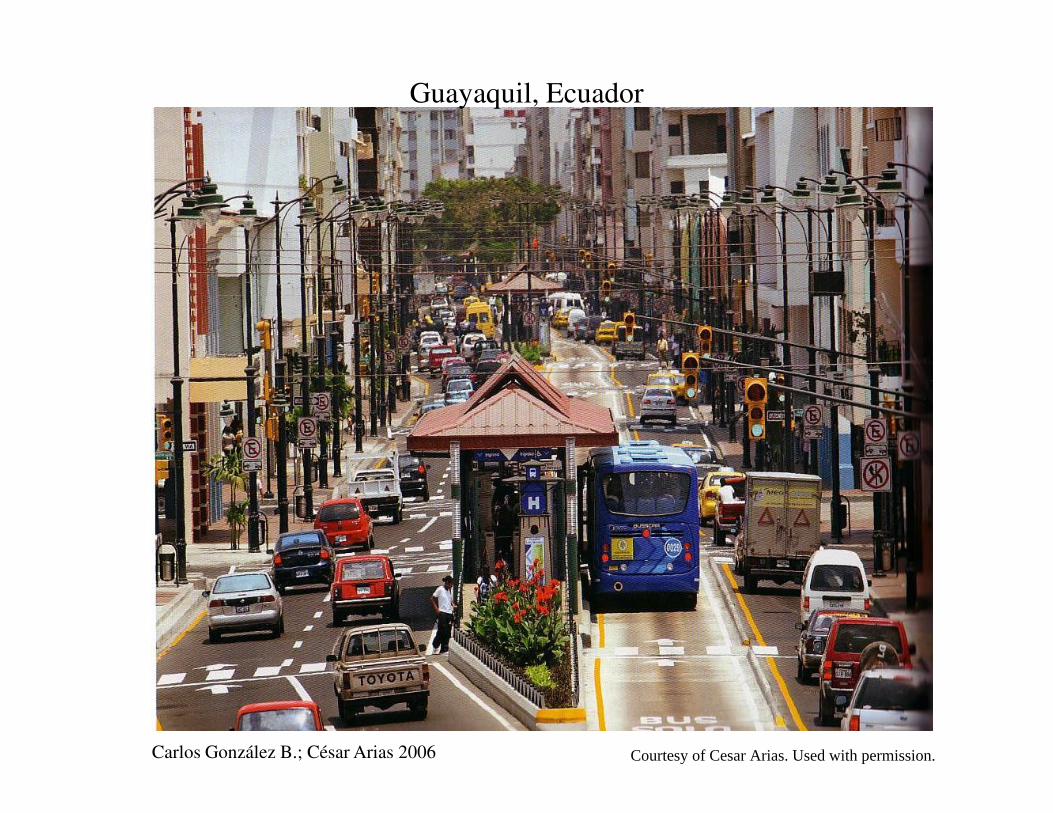
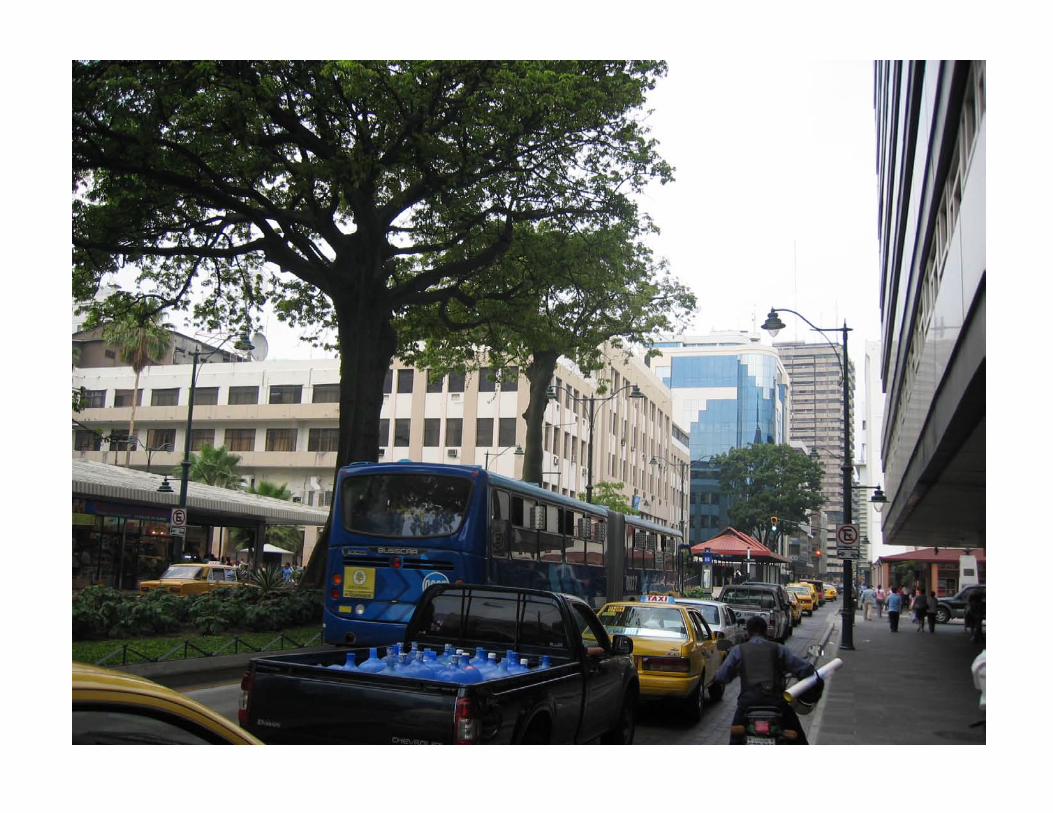
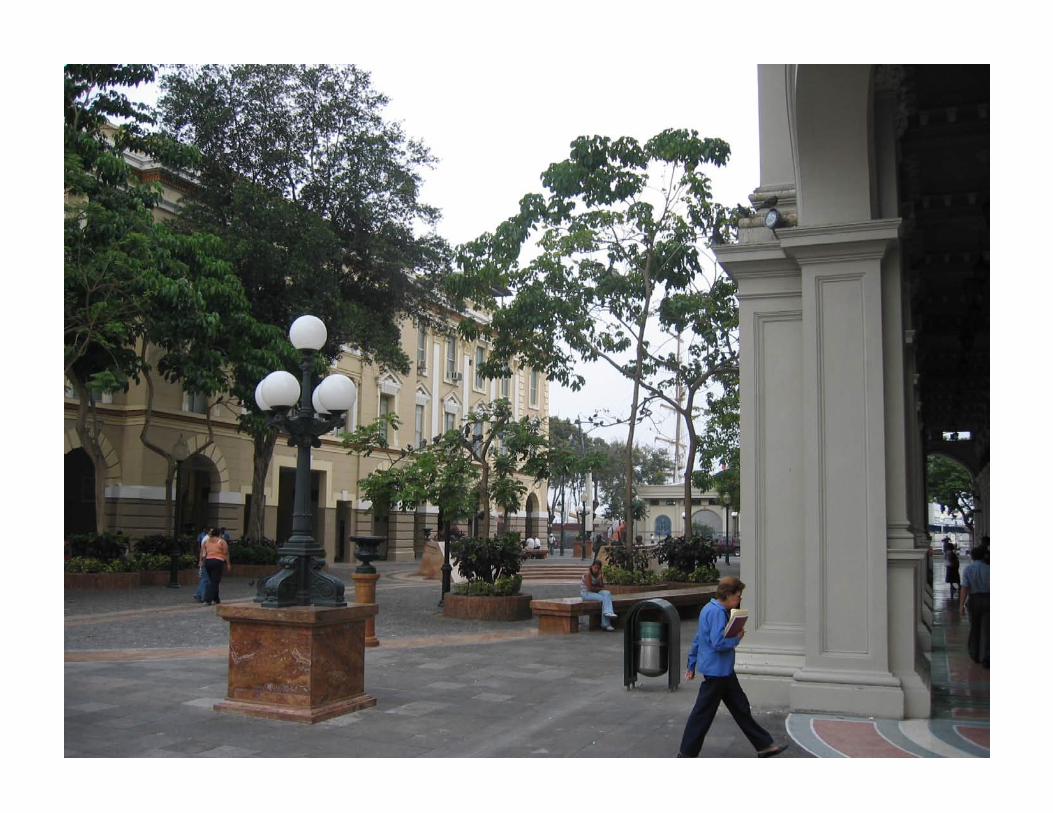
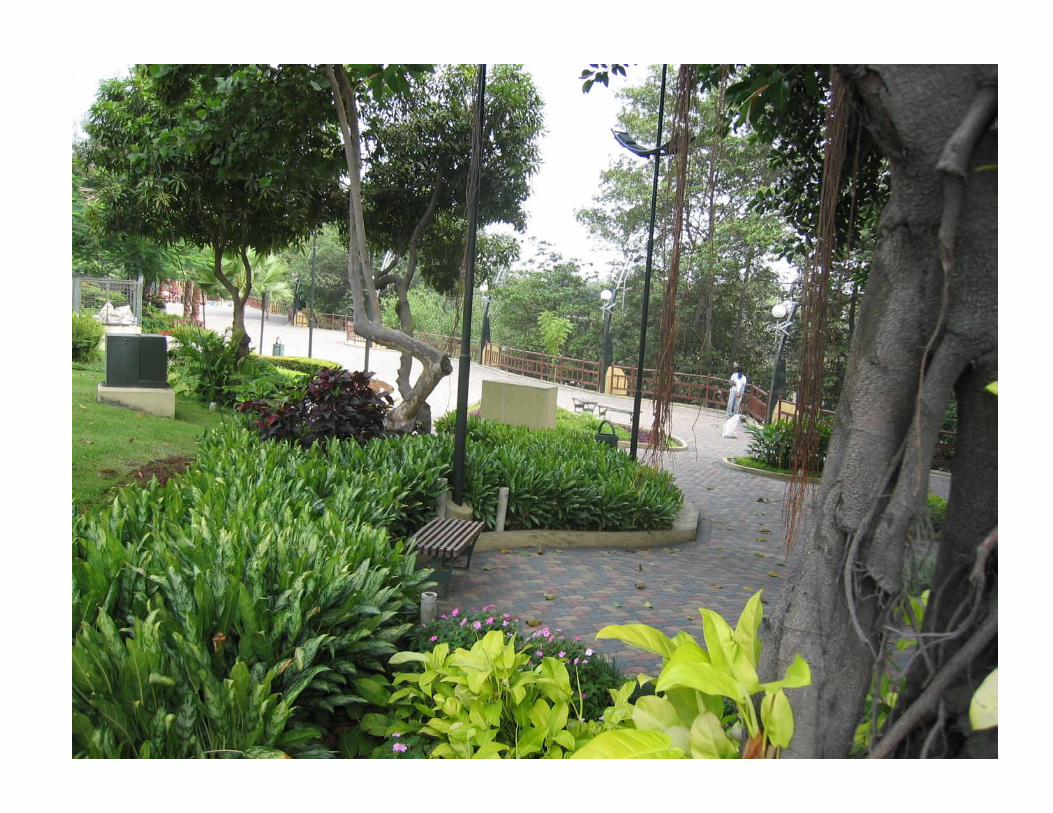
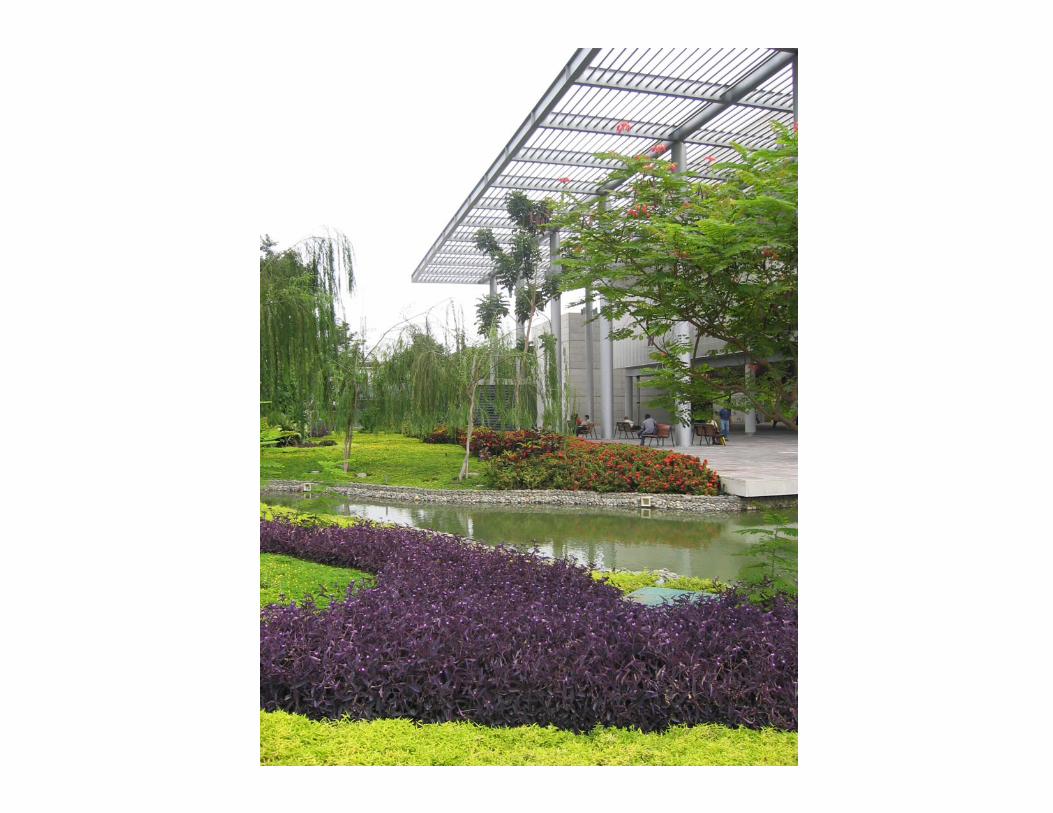
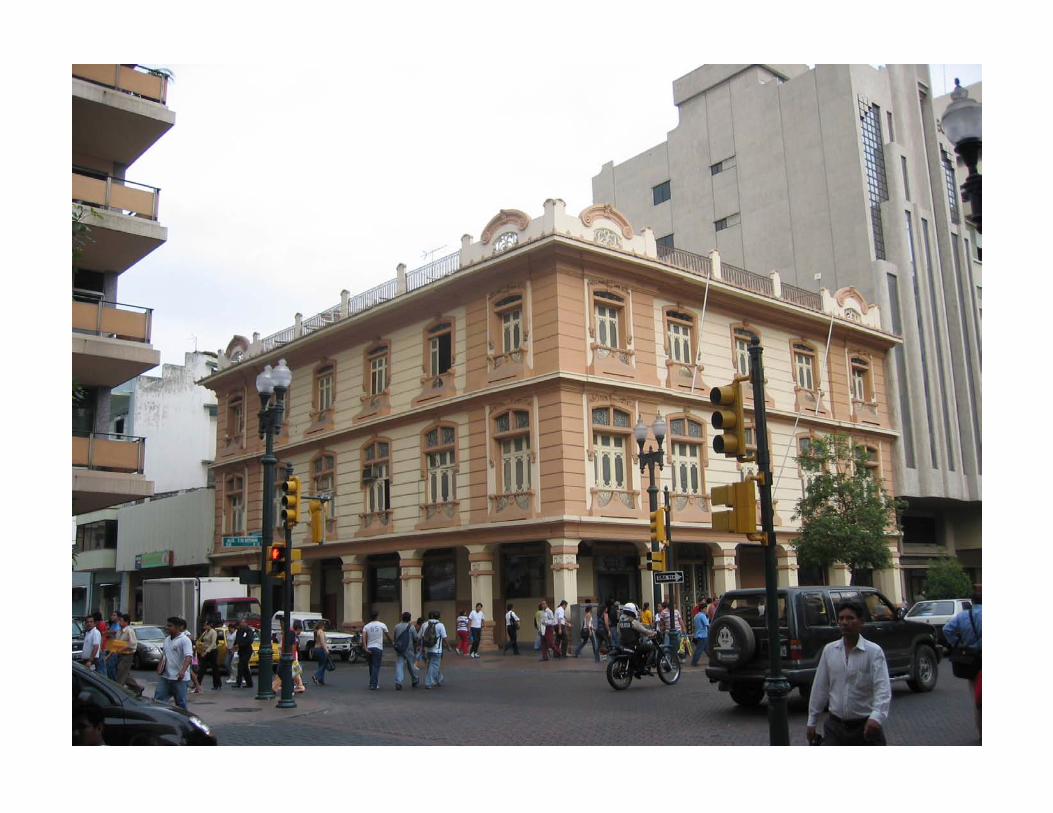
Guayaquil, Ecuador
Carlos González B.; César Arias 2006 Courtesy of Cesar Arias. Used with permission.
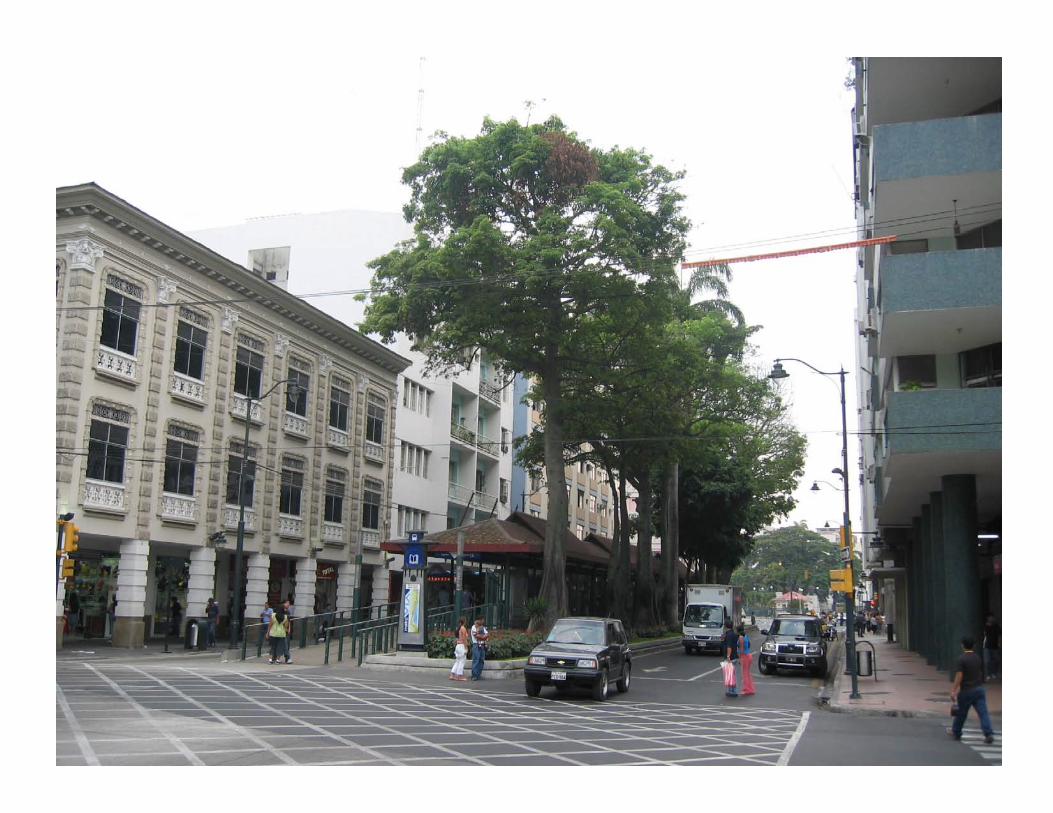
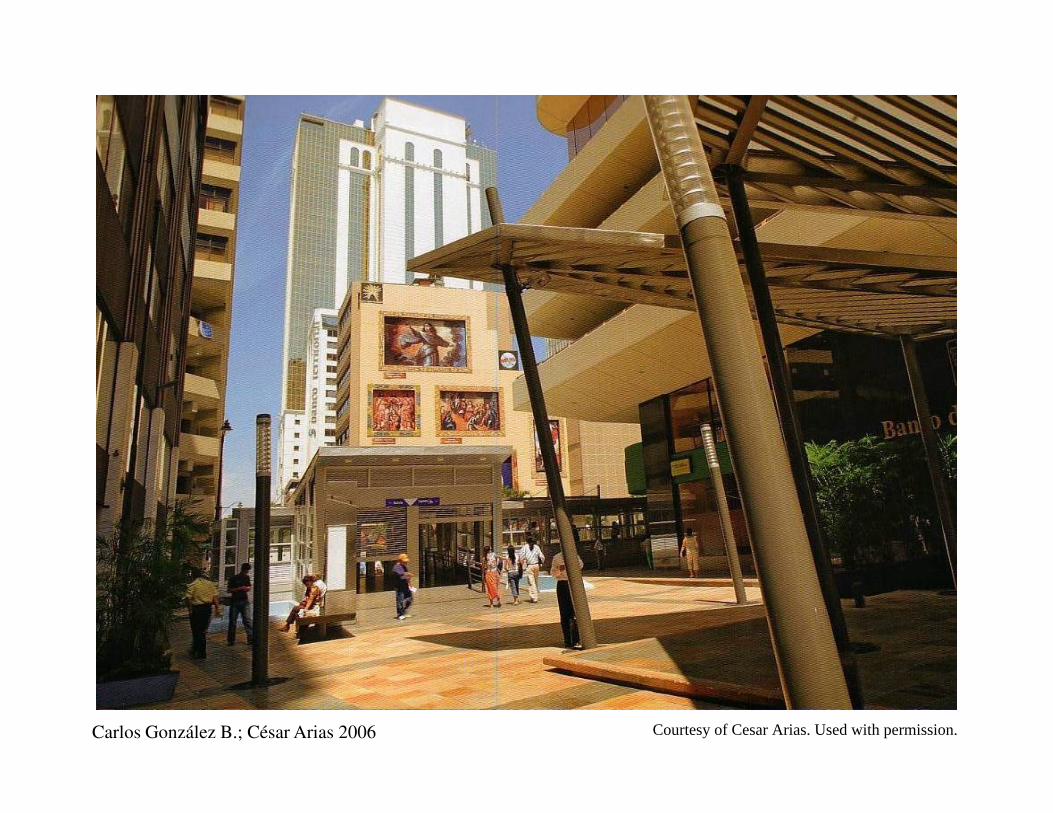
Carlos González B.; César Arias 2006 Courtesy of Cesar Arias. Used with permission.
many transfersInade uate s stem com letion and buses,
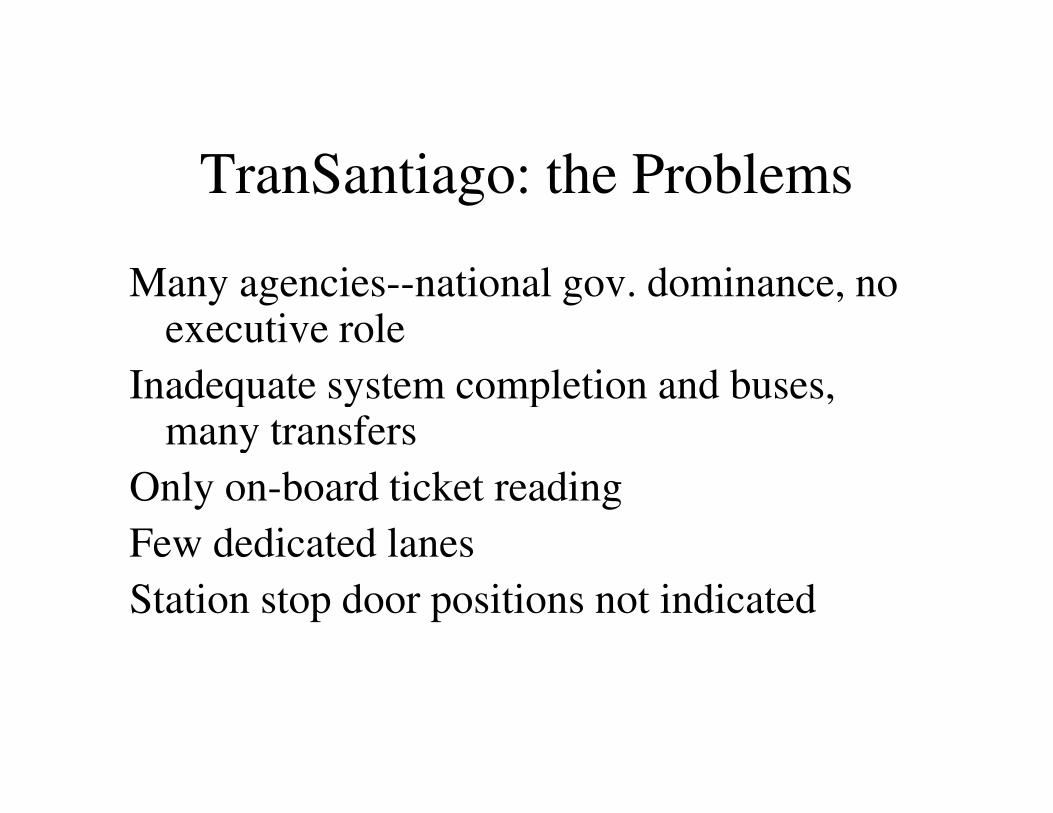
TranSantiago: the Problems
Many agencies--national gov. dominance, no executive role
Inadequate system completion and buses,q y p many transfers
Only on-board ticket reading
Few dedicated lanes
Station stop door positions not indicated

CONGESTION PRICING DEFINITION
A charge on vehicle use levied atA charge on vehicle use levied at
points of congestion for the purpose of
reducing the number of vehicles below
congestion level ....... and collecting
revenue.
•Lar e Perimeter Scheme as in cities of Norwa .g ( y)
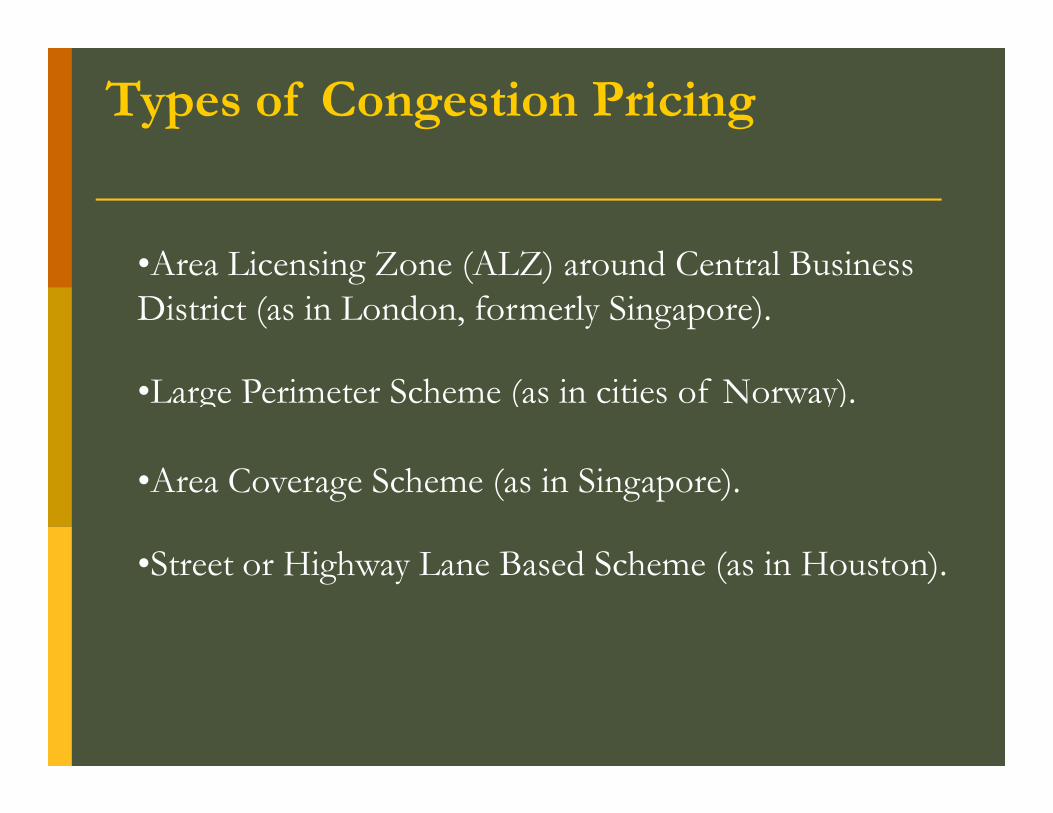
Types of Congestion Pricing
•Area Licensing Zone (ALZ) around Central Business District (as in London, formerly Singapore).
•Large Perimeter Scheme (as in cities of Norway).
•Area Coverage Scheme (as in Singapore).
•Street or Highway Lane Based Scheme (as in Houston).
•Purchase Taxes on Vehicles
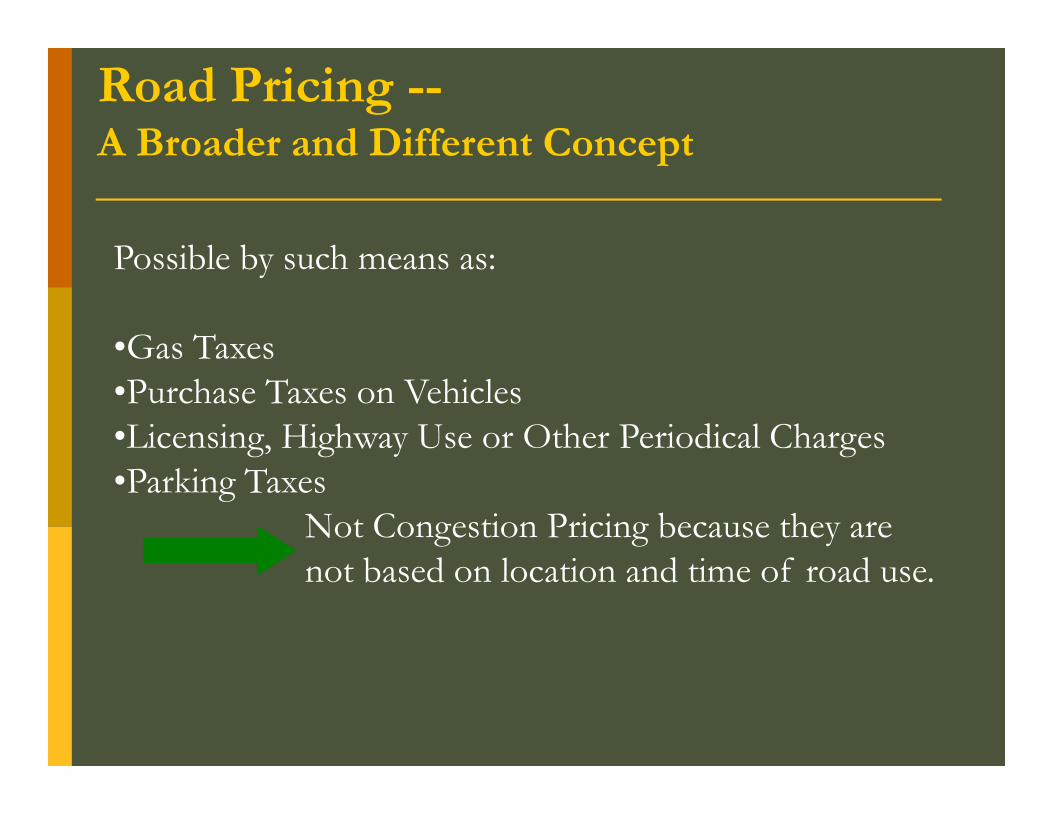
Road Pricing A Broader and Different Concept
Possible by such means as:
•Gas Taxes •Purchase Taxes on Vehicles •Licensing, Highway Use or Other Periodical Charges •Parking Taxes
Not Congestion Pricing because they are not based on location and time of road use.
• Trip makers unaffected by the initiative
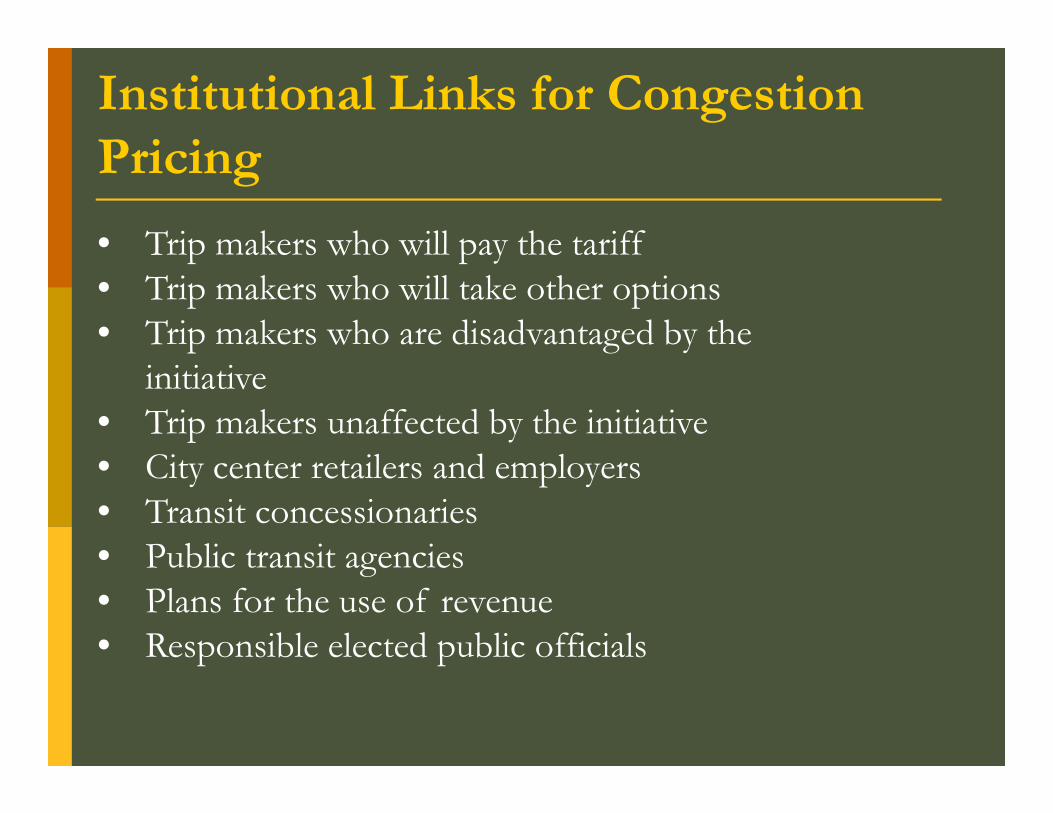
Institutional Links for Congestion Pricing
• Trip makers who will pay the tariff • Trip makers who will take other options • Trip makers who are disadvantaged by the initiative
• Trip makers unaffected by the initiative • City center retailers and employers • Transit concessionaries • Public transit agencies • Plans for the use of revenue • Responsible elected public officials
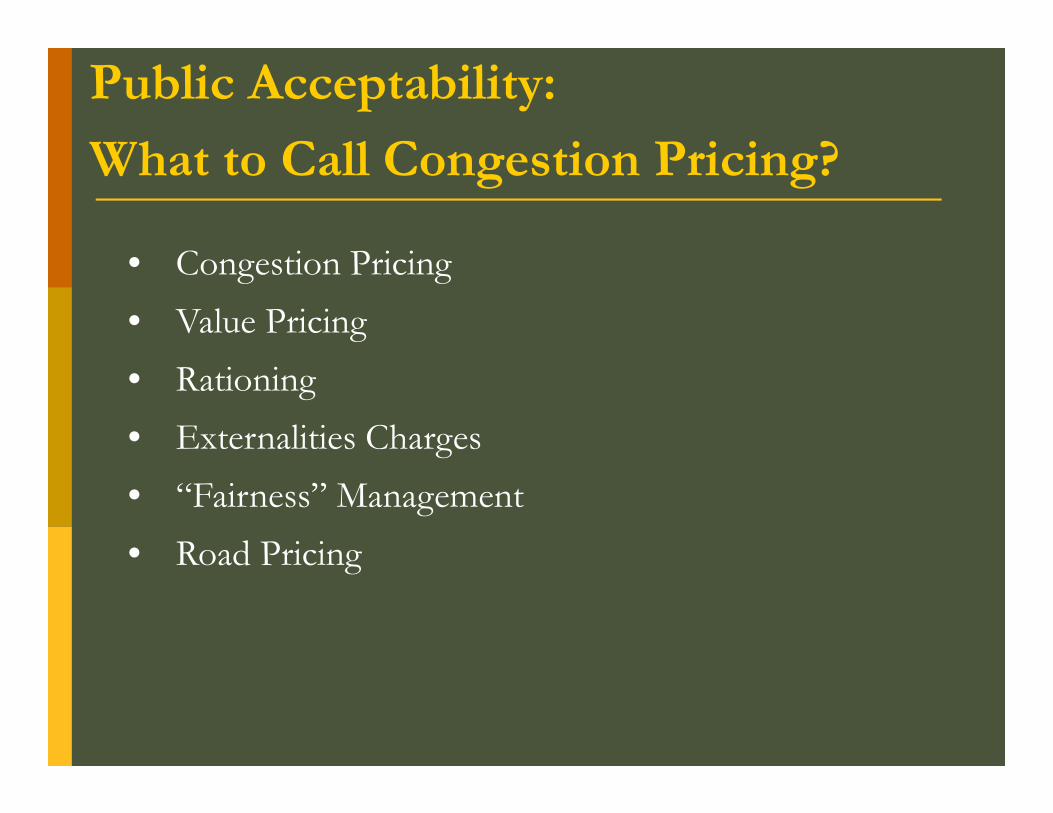
Public Acceptability:
What to Call Congestion Pricing?
• Congestion Pricing
• Value Pricing
• Rationing
• Externalities Charges
• “Fairness” Management
• Road Pricing
need for lar e investments such as Se undo Piso
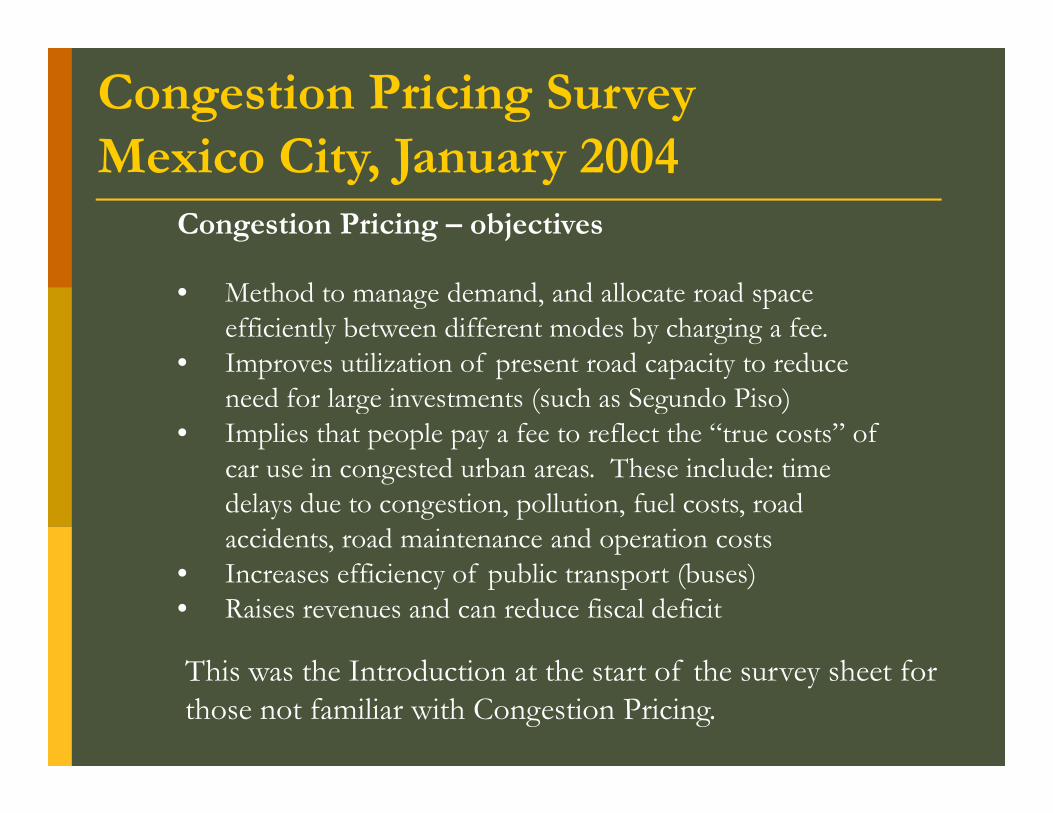
Congestion Pricing SurveyMexico City, January 2004
Congestion Pricing – objectives
• Method to manage demand, and allocate road space efficiently between different modes by charging a fee.
• Improves utilization of present road capacity to reduceneed for large investments (such as Segundo Piso) ( g )g
• Implies that people pay a fee to reflect the “true costs” of car use in congested urban areas. These include: time delays due to congestion, pollution, fuel costs, road accidents, road maintenance and operation costs
• Increases efficiency of public transport (buses) • Raises revenues and can reduce fiscal deficit
This was the Introduction at the start of the survey sheet for those not familiar with Congestion Pricing.
Survey Questions and Responses
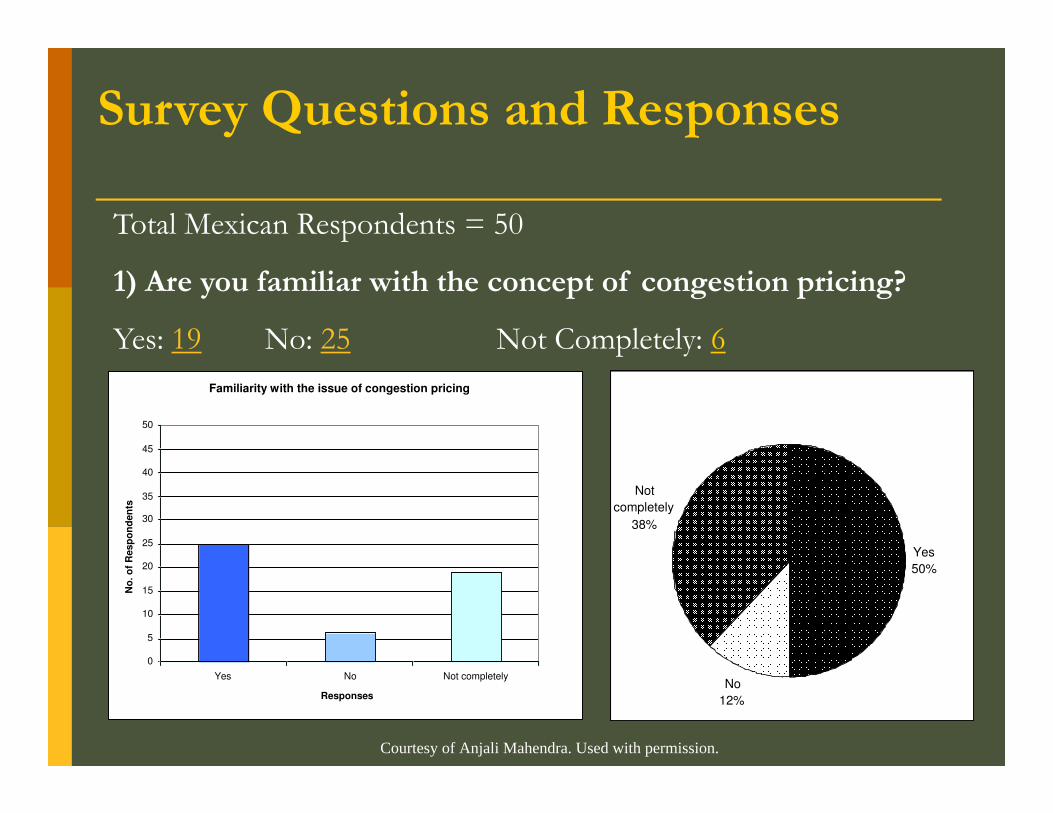
Total Mexican Respondents = 50
1) Are you familiar with the concept of congestion pricing?
Yes: 19 No: 25 Not Completely: 6 Familiarity with the issue of congestion pricing
0
5
10
15
20
25
30
35
40
45
50
Yes No Not completely
Responses
No
. o
f R
esp
on
den
ts
Yes
50%
No
12%
Not
completely
38%
Courtesy of Anjali Mahendra. Used with permission.
Survey Questions and Responses
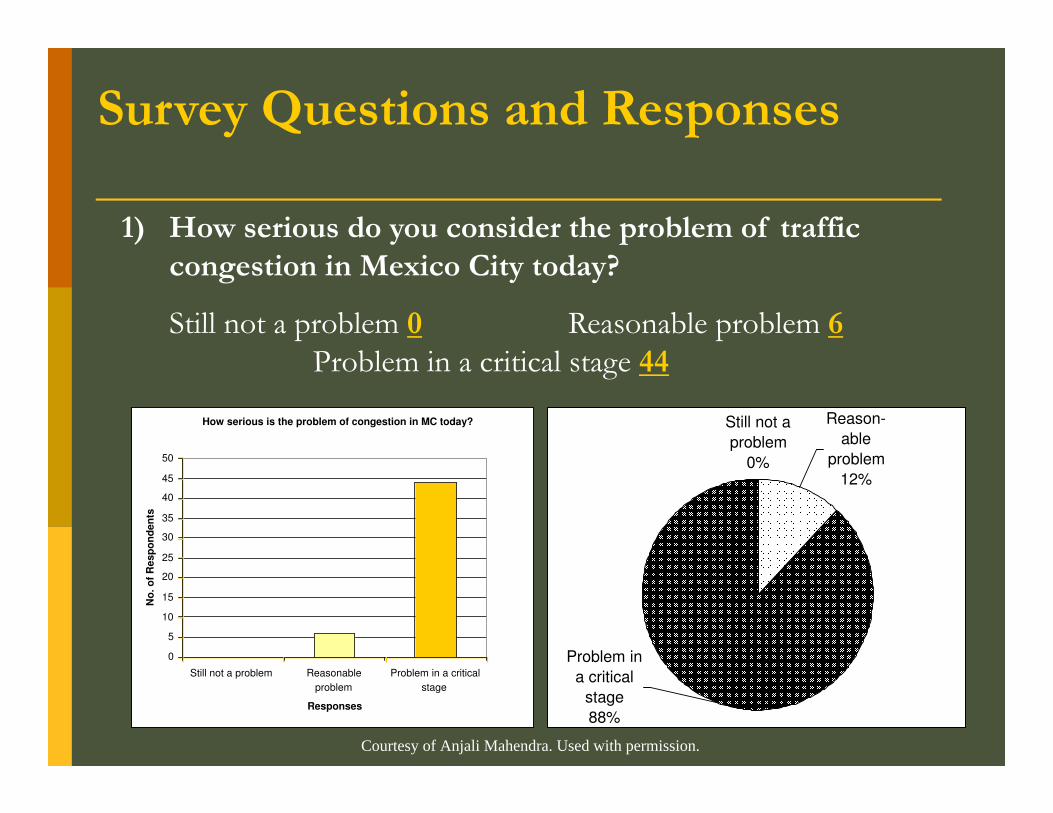
1) How serious do you consider the problem of traffic congestion in Mexico City today?
Still not a problem 0 Reasonable problem 6 Problem in a critical stage 44
How serious is the problem of congestion in MC today?
0
5
10
15
20
25
30
35
40
45
50
Still not a problem Reasonable
problem
Problem in a critical
stage
Responses
No
. o
f R
es
po
nd
en
ts
Still not a
problem
0%
Reason
able
problem
12%
Problem in
a critical
stage
88%
Courtesy of Anjali Mahendra. Used with permission.
Nu
mb
er
of
res
po
nd
en
s
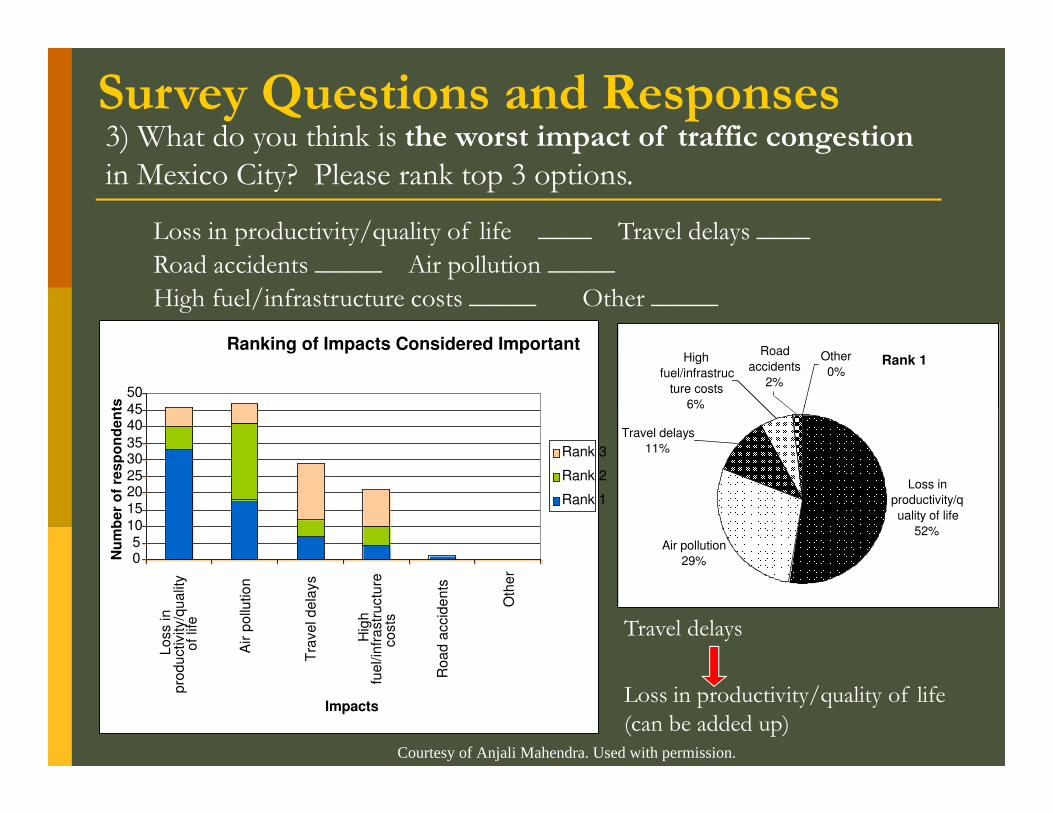
3) What do you think is the worst impact of traffic congestion in Mexico City? Please rank top 3 options.
Loss in productivity/quality of life ____ Travel delays ____ Road accidents _____ Air pollution _____ High fuel/infrastructure costs _____ Other _____
Ranking of Impacts Considered Important
45 50
ts
Rank 1 Road
accidents
2%
High
fuel/infrastruc
ture costs
6%
Other
0%
Survey Questions and Responses
0 5
10 15 20 25 30 35
40 45
Lo
ss in
pro
du
ctivity/q
ua
lity
of
life
Air
po
llutio
n
Tra
ve
l d
ela
ys
Hig
hfu
el/in
fra
str
uctu
reco
sts
Ro
ad
accid
en
ts
Oth
er
Impacts
Nu
mb
er
of
res
po
nd
en
t
Rank 3
Rank 2
Rank 1 Loss in
productivity/q
uality of life
52% Air pollution
29%
6%
Travel delays
11%
Travel delays
Loss in productivity/quality of life (can be added up)
Courtesy of Anjali Mahendra. Used with permission.
No
.o
fe
sp
on
de
nts
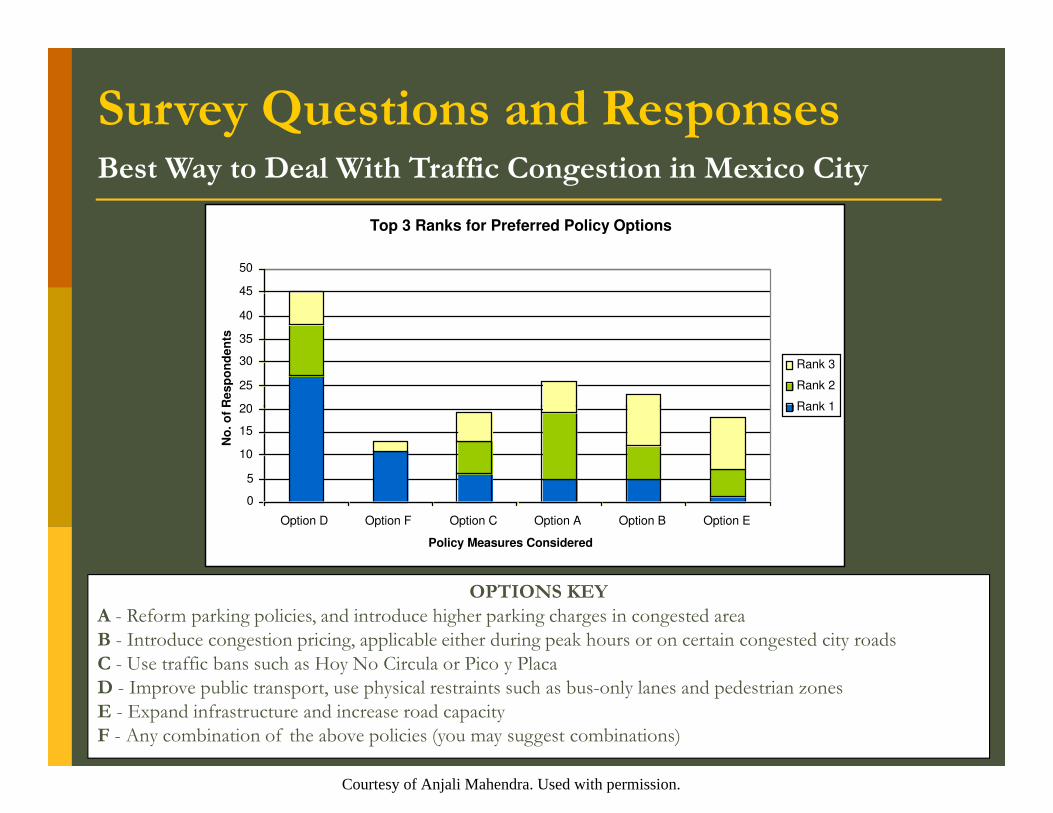
Best Way to Deal With Traffic Congestion in Mexico City
Top 3 Ranks for Preferred Policy Options
20
25
30
35
40
45
50
Re
sp
on
de
nts
Rank 3
Rank 2
Rank 1
Survey Questions and Responses
0
5
10
15
20
Option D Option F Option C Option A Option B Option E
Policy Measures Considered
No
. o
f R Rank 1
OPTIONS KEY A Reform parking policies, and introduce higher parking charges in congested area B Introduce congestion pricing, applicable either during peak hours or on certain congested city roads C Use traffic bans such as Hoy No Circula or Pico y Placa D Improve public transport, use physical restraints such as busonly lanes and pedestrian zones E Expand infrastructure and increase road capacity F Any combination of the above policies (you may suggest combinations)
Courtesy of Anjali Mahendra. Used with permission.
No
.o
fR
es
p 44%
nd
en
ts
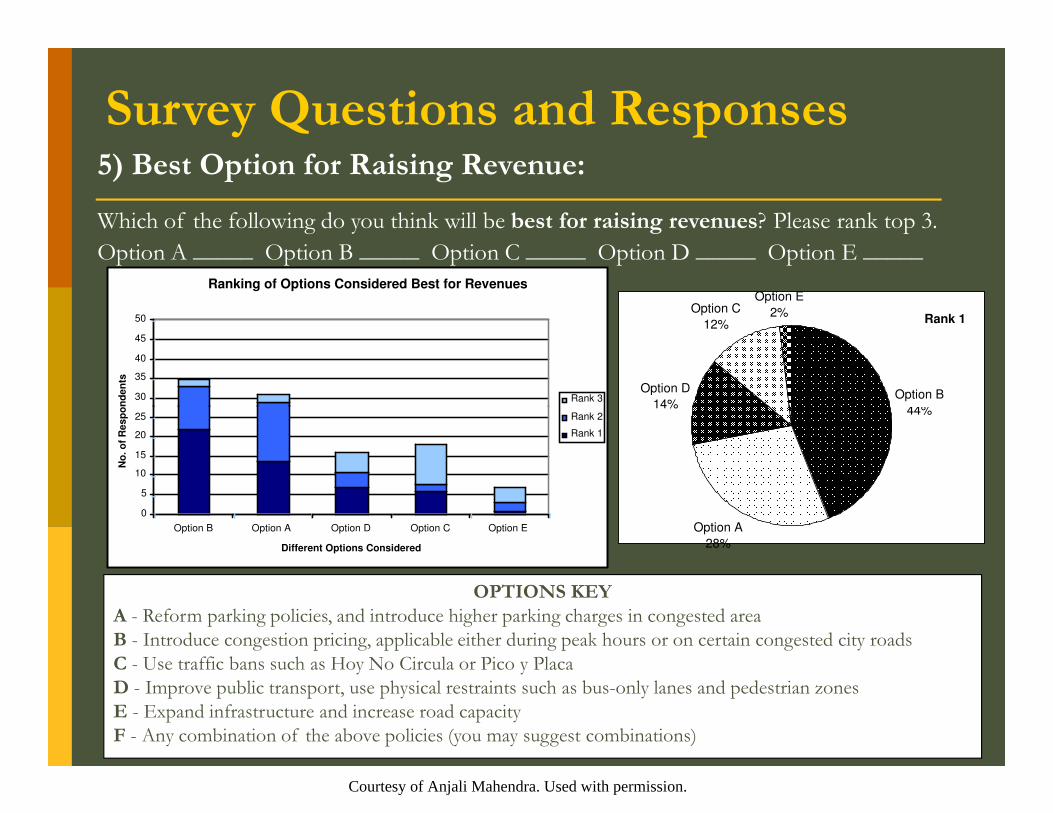
5) Best Option for Raising Revenue:
Which of the following do you think will be best for raising revenues? Please rank top 3. Option A _____ Option B _____ Option C _____ Option D _____ Option E _____
Ranking of Options Considered Best for Revenues
30
35
40
45
50
on
de
nts
Rank 3
Rank 1
Option B Option D
14%
Option C
12%
Option E
2%
Survey Questions and Responses
0
5
10
15
20
25
Option B Option A Option D Option C Option E
Different Options Considered
No
. o
f R
es
po
Rank 2
Rank 1
44%
Option A
28%
14%
OPTIONS KEY A Reform parking policies, and introduce higher parking charges in congested area B Introduce congestion pricing, applicable either during peak hours or on certain congested city roads C Use traffic bans such as Hoy No Circula or Pico y Placa D Improve public transport, use physical restraints such as busonly lanes and pedestrian zones E Expand infrastructure and increase road capacity F Any combination of the above policies (you may suggest combinations)
Courtesy of Anjali Mahendra. Used with permission.
No
.o
fR
esp
on
en
ts
16%
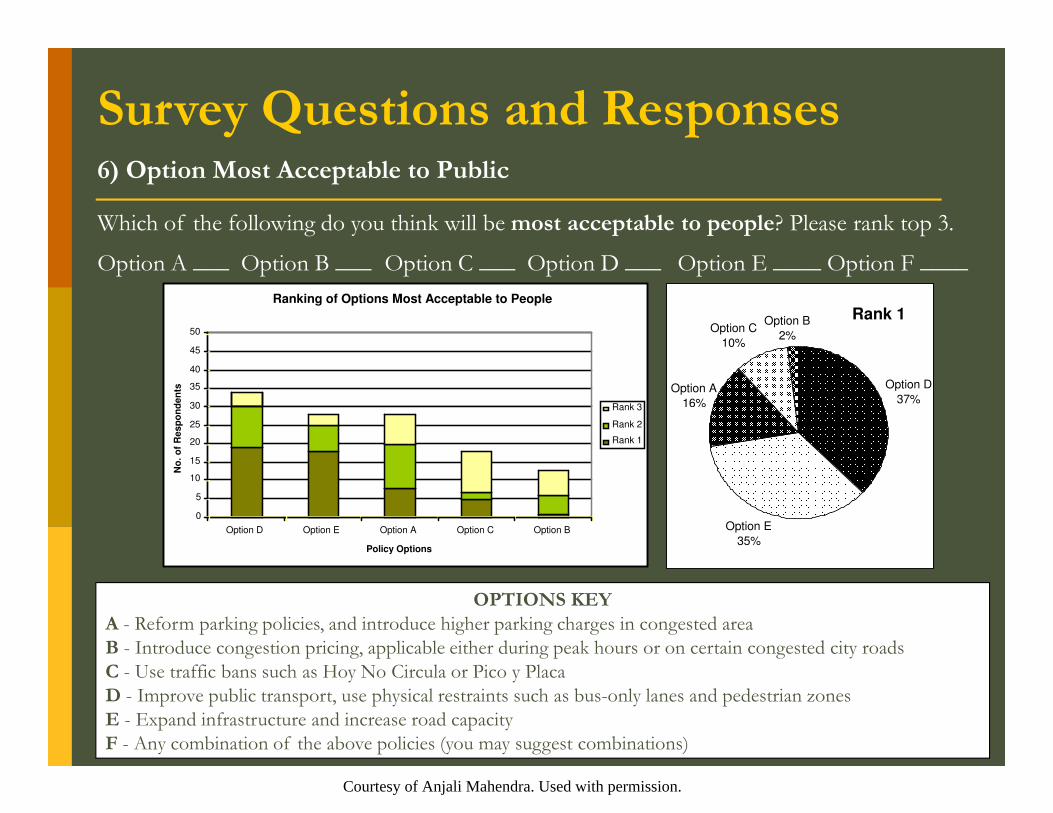
6) Option Most Acceptable to Public
Which of the following do you think will be most acceptable to people? Please rank top 3.
Option A ___ Option B ___ Option C ___ Option D ___ Option E ____ Option F ____ Ranking of Options Most Acceptable to People
30
35
40
45
50
den
ts
Rank 3
Rank 1
Option D
37%
Option C
10%
Option B
2%
Option A
16%
Survey Questions and Responses
OPTIONS KEY A Reform parking policies, and introduce higher parking charges in congested area B Introduce congestion pricing, applicable either during peak hours or on certain congested city roads C Use traffic bans such as Hoy No Circula or Pico y Placa D Improve public transport, use physical restraints such as busonly lanes and pedestrian zones E Expand infrastructure and increase road capacity F Any combination of the above policies (you may suggest combinations)
0
5
10
15
20
25
30
Option D Option E Option A Option C Option B
Policy Options
No
. o
f R
esp
on
d Rank 3
Rank 2
Rank 1
Option E
35%
Courtesy of Anjali Mahendra. Used with permission.
ing
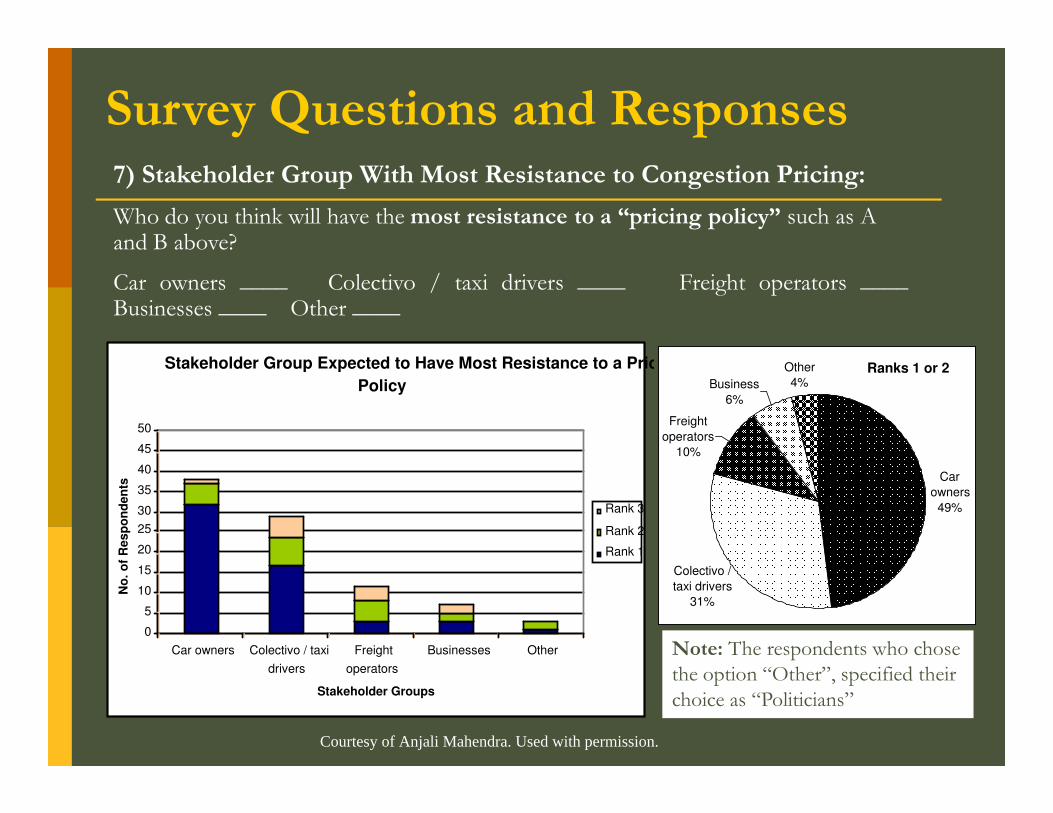
7) Stakeholder Group With Most Resistance to Congestion Pricing:
Who do you think will have the most resistance to a “pricing policy” such as A and B above?
Car owners ____ Colectivo / taxi drivers ____ Freight operators ____ Businesses ____ Other ____
Stakeholder Group Expected to Have Most Resistance to a Pric
Policy Ranks 1 or 2 Other
4% Business
6%
Survey Questions and Responses
0
5
10
15
20
25
30
35
40
45
50
Car owners Colectivo / taxi
drivers
Freight
operators
Businesses Other
Stakeholder Groups
No
. o
f R
esp
on
den
ts
Rank 3
Rank 2
Rank 1
Car
owners
49%
Freight
operators
10%
Colectivo /
taxi drivers
31%
Note: The respondents who chose the option “Other”, specified their choice as “Politicians”
Courtesy of Anjali Mahendra. Used with permission.
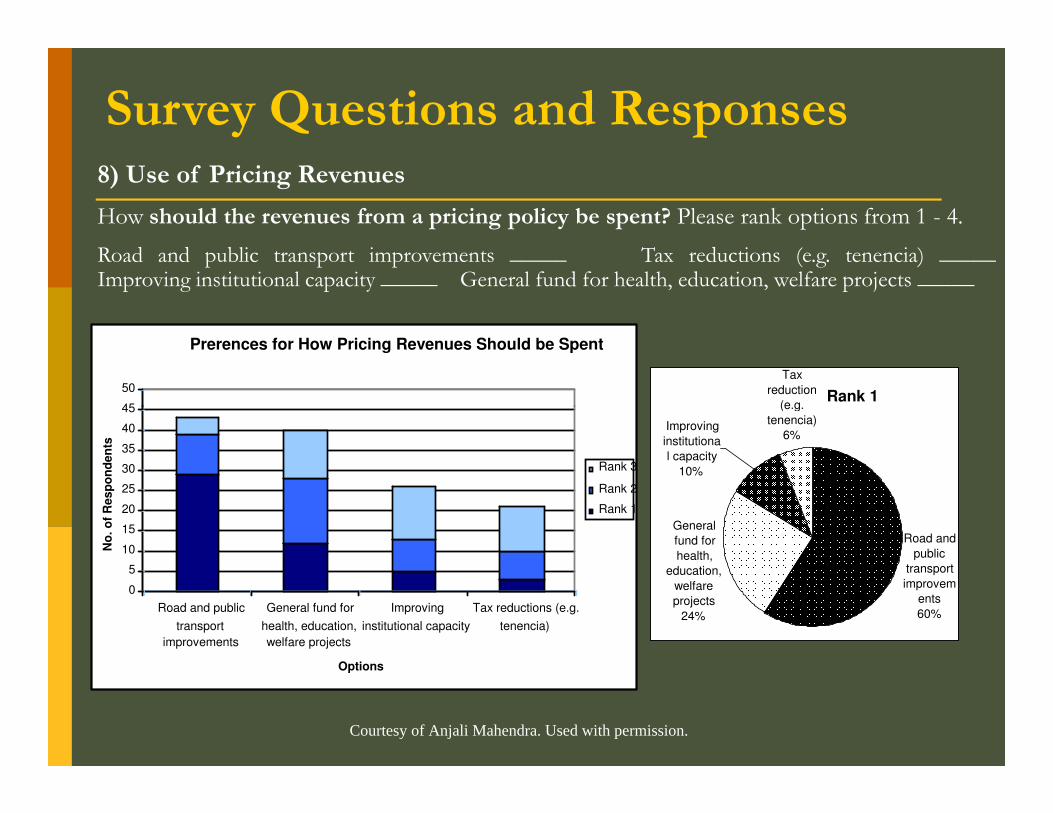
8) Use of Pricing Revenues
How should the revenues from a pricing policy be spent? Please rank options from 1 4.
Road and public transport improvements _____ Tax reductions (e.g. tenencia) _____ Improving institutional capacity _____ General fund for health, education, welfare projects _____
Prerences for How Pricing Revenues Should be Spent
45
50 Rank 1
Tax
reduction
(e.g.
Survey Questions and Responses
0
5
10
15
20
25
30
35
40
45
Road and public
transport
improvements
General fund for
health, education,
welfare projects
Improving
institutional capacity
Tax reductions (e.g.
tenencia)
Options
No
. o
f R
esp
on
den
ts
Rank 3
Rank 2
Rank 1
General
fund for
health,
education,
welfare
projects
24%
Road and
public
transport
improvem
ents
60%
Improving
institutiona
l capacity
10%
(e.g.
tenencia)
6%
Courtesy of Anjali Mahendra. Used with permission.
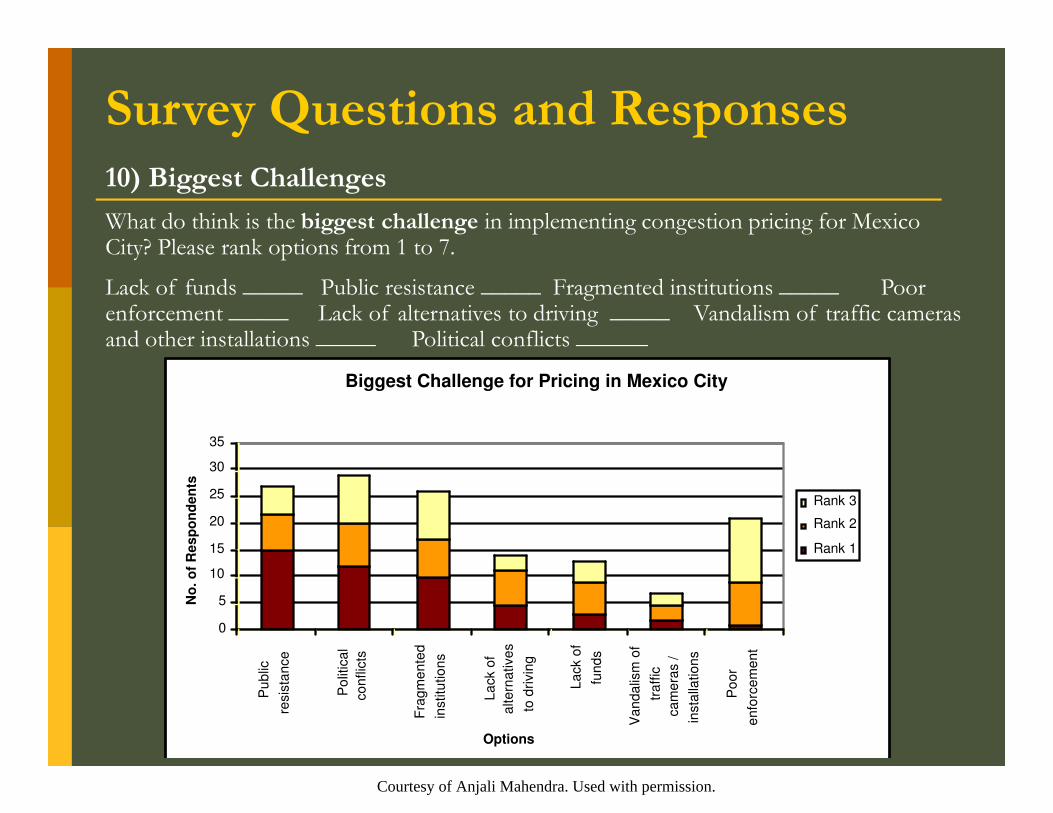
10) Biggest Challenges
What do think is the biggest challenge in implementing congestion pricing for Mexico City? Please rank options from 1 to 7.
Lack of funds _____ Public resistance _____ Fragmented institutions _____ Poor enforcement _____ Lack of alternatives to driving _____ Vandalism of traffic cameras and other installations _____ Political conflicts ______
Biggest Challenge for Pricing in Mexico City
Survey Questions and Responses
0
5
10
15
20
25
30
35
Pu
blic
resis
tan
ce
Po
litic
al
co
nflic
ts
Fra
gm
en
ted
institu
tio
ns
La
ck o
f
alte
rna
tive
s
to d
rivin
g
La
ck o
f
fun
ds
Va
nd
alis
m o
f
tra
ffic
ca
me
ras /
insta
llatio
ns
Po
or
en
forc
em
en
t Options
No
. o
f R
es
po
nd
en
ts
Rank 3
Rank 2
Rank 1
Courtesy of Anjali Mahendra. Used with permission.
SUMMARY:The Challenges
• Congestion
• Inadequate Public Transit Services
• Urban Structure Problems--Urban Form vs. travel needs
• Economic Development--Need to Favor Freight, Mobilize the Labor Force

• Con estion Mana ement demand
SUMMARY:Solution Modes
• Public Infrastructure Expansion (including by public-private concession agreements)
• Congestion Management/demandg /gmanagement/congestion pricing
• Managing Formal and Informal Public Transport--system integration
• Land Use Planning for Urban Transport Efficiency
17 KM HR IN KUALA LUMPUR AND SAO PAULO
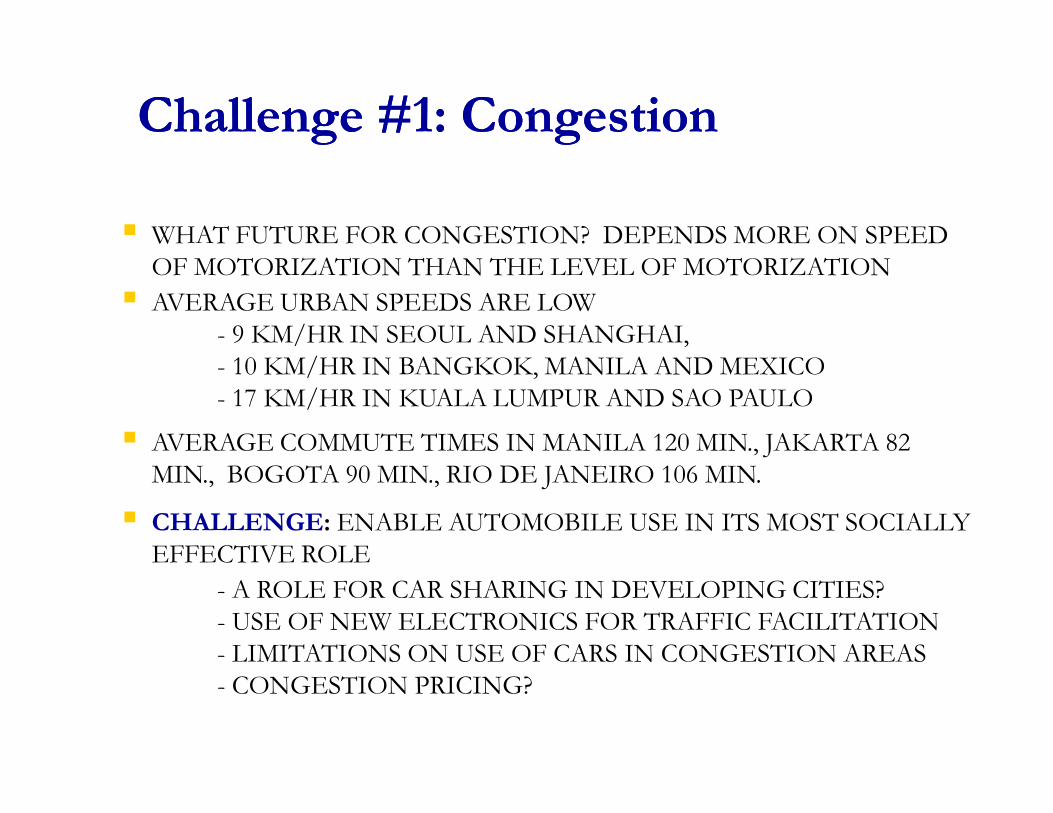
CChhaalllleennggee ##1:1: CCoonnggeessttiioonn
� WHAT FUTURE FOR CONGESTION? DEPENDS MORE ON SPEEDOF MOTORIZATION THAN THE LEVEL OF MOTORIZATION
� AVERAGE URBAN SPEEDS ARE LOW 9 KM/HR IN SEOUL AND SHANGHAI, 10 KM/HR IN BANGKOK, MANILA AND MEXICO 17 KM/HR IN KUALA LUMPUR AND SAO PAULO/
� AVERAGE COMMUTE TIMES IN MANILA 120 MIN., JAKARTA 82 MIN., BOGOTA 90 MIN., RIO DE JANEIRO 106 MIN.
� CHALLENGE: ENABLE AUTOMOBILE USE IN ITS MOST SOCIALLYEFFECTIVE ROLE
A ROLE FOR CAR SHARING IN DEVELOPING CITIES? USE OF NEW ELECTRONICS FOR TRAFFIC FACILITATION LIMITATIONS ON USE OF CARS IN CONGESTION AREAS CONGESTION PRICING?
50% in Dakar and Taipei, 40% in Caracas, 65% in Manila, 11% to
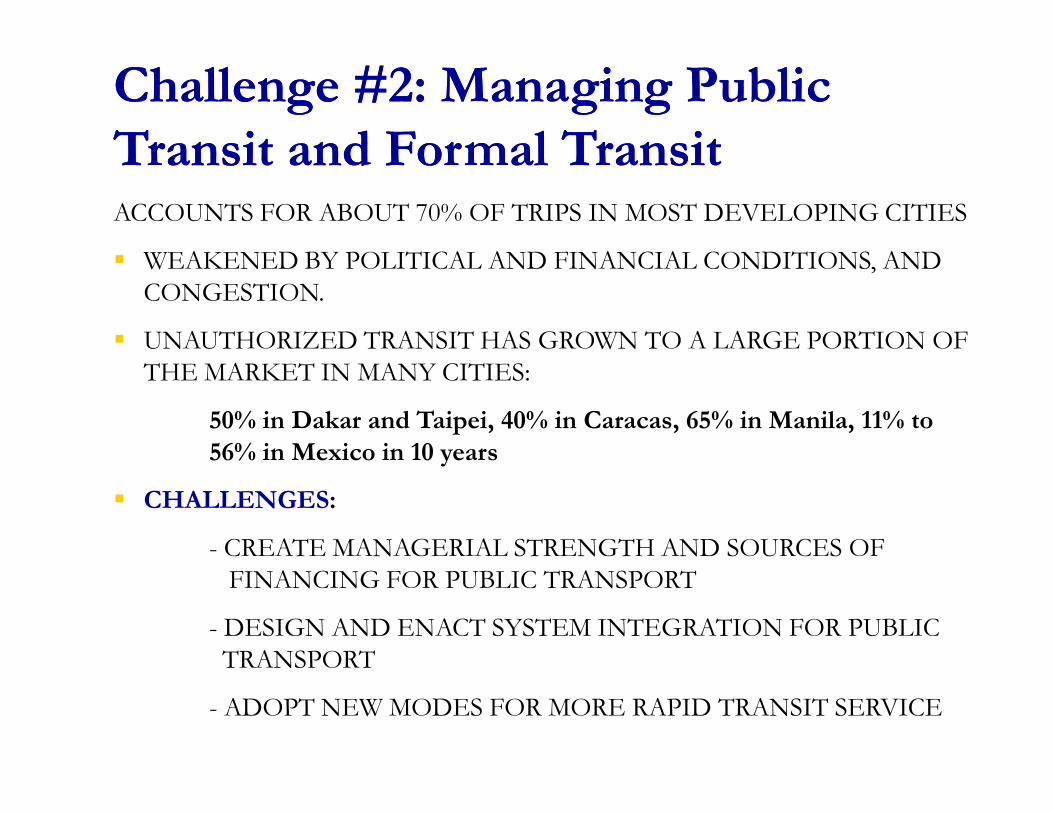
CChhaalllleennggee ##2:2: MMaannaaggiingng PPuubblliiccTTrraannssiitt aandnd FFoorrmmaall TTrraannssiittACCOUNTS FOR ABOUT 70% OF TRIPS IN MOST DEVELOPING CITIES
� WEAKENED BY POLITICAL AND FINANCIAL CONDITIONS, AND CONGESTION.
� UNAUTHORIZED TRANSIT HAS GROWN TO A LARGE PORTION OF THE MARKET IN MANY CITIES:
50% in Dakar and Taipei, 40% in Caracas, 65% in Manila, 11% to 56% in Mexico in 10 years
� CHALLENGES:
CREATE MANAGERIAL STRENGTH AND SOURCES OF FINANCING FOR PUBLIC TRANSPORT
DESIGN AND ENACT SYSTEM INTEGRATION FOR PUBLIC TRANSPORT
ADOPT NEW MODES FOR MORE RAPID TRANSIT SERVICE
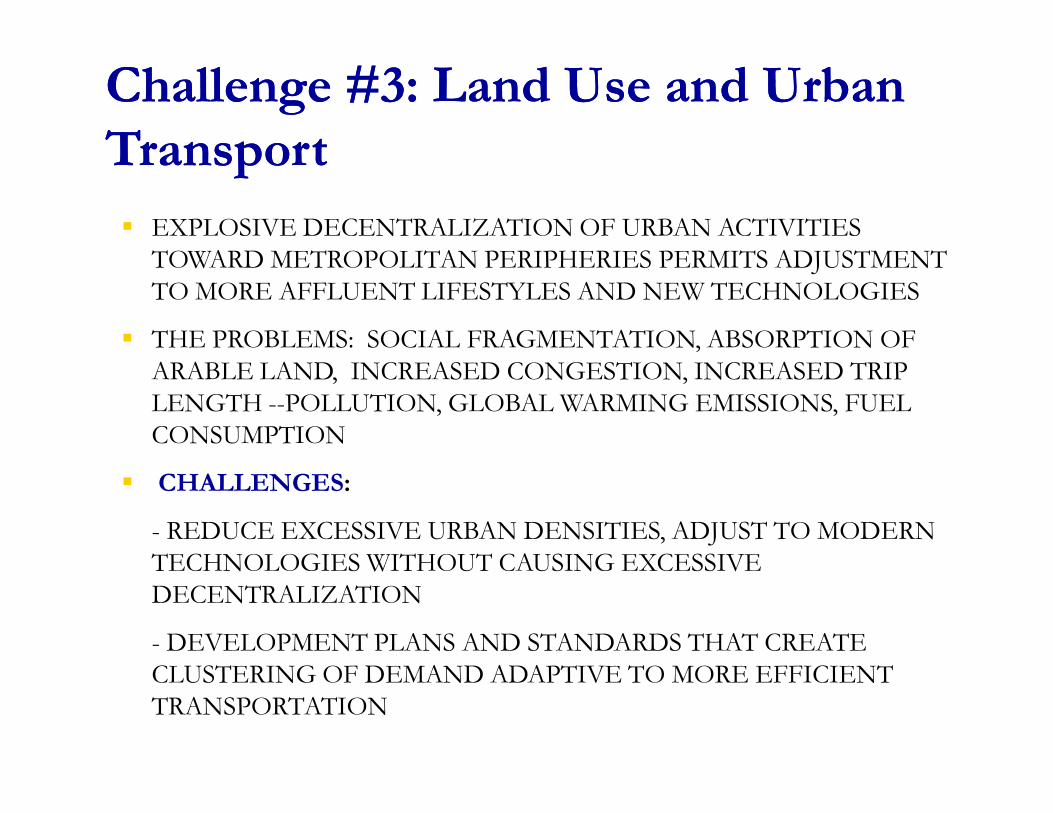
CChhaalllleennggee ##3:3: LLaanndd UUssee aandnd UUrrbbaannTTrraannssppoorrtt
� EXPLOSIVE DECENTRALIZATION OF URBAN ACTIVITIES TOWARD METROPOLITAN PERIPHERIES PERMITS ADJUSTMENT TO MORE AFFLUENT LIFESTYLES AND NEW TECHNOLOGIES
� THE PROBLEMS: SOCIAL FRAGMENTATION, ABSORPTION OF ARABLE LAND, INCREASED CONGESTION, INCREASED TRIP LENGTH POLLUTION, GLOBAL WARMING EMISSIONS, FUELLENGTH POLLUTION, GLOBAL WARMING EMISSIONS, FUEL CONSUMPTION
� CHALLENGES:
REDUCE EXCESSIVE URBAN DENSITIES, ADJUST TO MODERN TECHNOLOGIES WITHOUT CAUSING EXCESSIVE DECENTRALIZATION
DEVELOPMENT PLANS AND STANDARDS THAT CREATE CLUSTERING OF DEMAND ADAPTIVE TO MORE EFFICIENT TRANSPORTATION
THE LAST 25 YEARS.
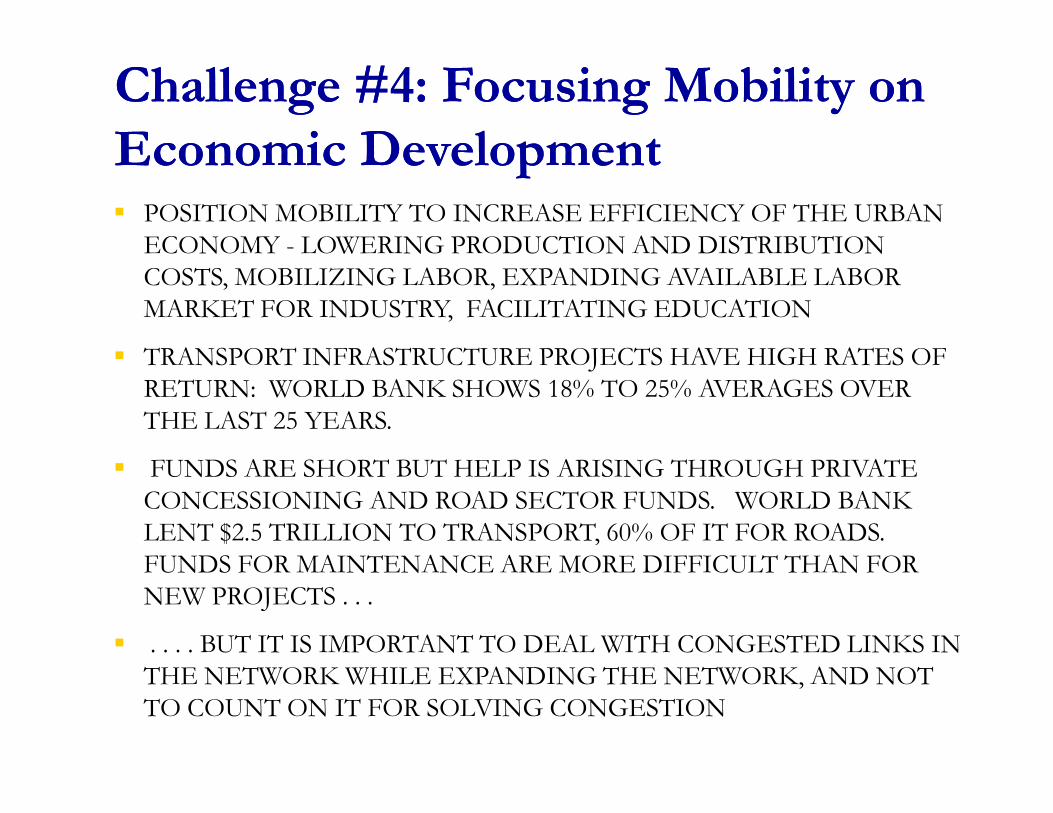
CChhaalllleennggee ##4:4: FFooccuussiinngg MMoobbiilliittyy oonnEEccoonnoommiicc DDeevveellooppmmeenntt� POSITION MOBILITY TO INCREASE EFFICIENCY OF THE URBAN ECONOMY LOWERING PRODUCTION AND DISTRIBUTION COSTS, MOBILIZING LABOR, EXPANDING AVAILABLE LABOR MARKET FOR INDUSTRY, FACILITATING EDUCATION
� TRANSPORT INFRASTRUCTURE PROJECTS HAVE HIGH RATES OF RETURN: WORLD BANK SHOWS 18% TO 25% AVERAGES OVER THE LAST 25 YEARS.
� FUNDS ARE SHORT BUT HELP IS ARISING THROUGH PRIVATE CONCESSIONING AND ROAD SECTOR FUNDS. WORLD BANK LENT $2.5 TRILLION TO TRANSPORT, 60% OF IT FOR ROADS. FUNDS FOR MAINTENANCE ARE MORE DIFFICULT THAN FOR NEW PROJECTS . . .
� . . . . BUT IT IS IMPORTANT TO DEAL WITH CONGESTED LINKS IN THE NETWORK WHILE EXPANDING THE NETWORK, AND NOT TO COUNT ON IT FOR SOLVING CONGESTION
� ENSURE COMPETITIVE BIDDING
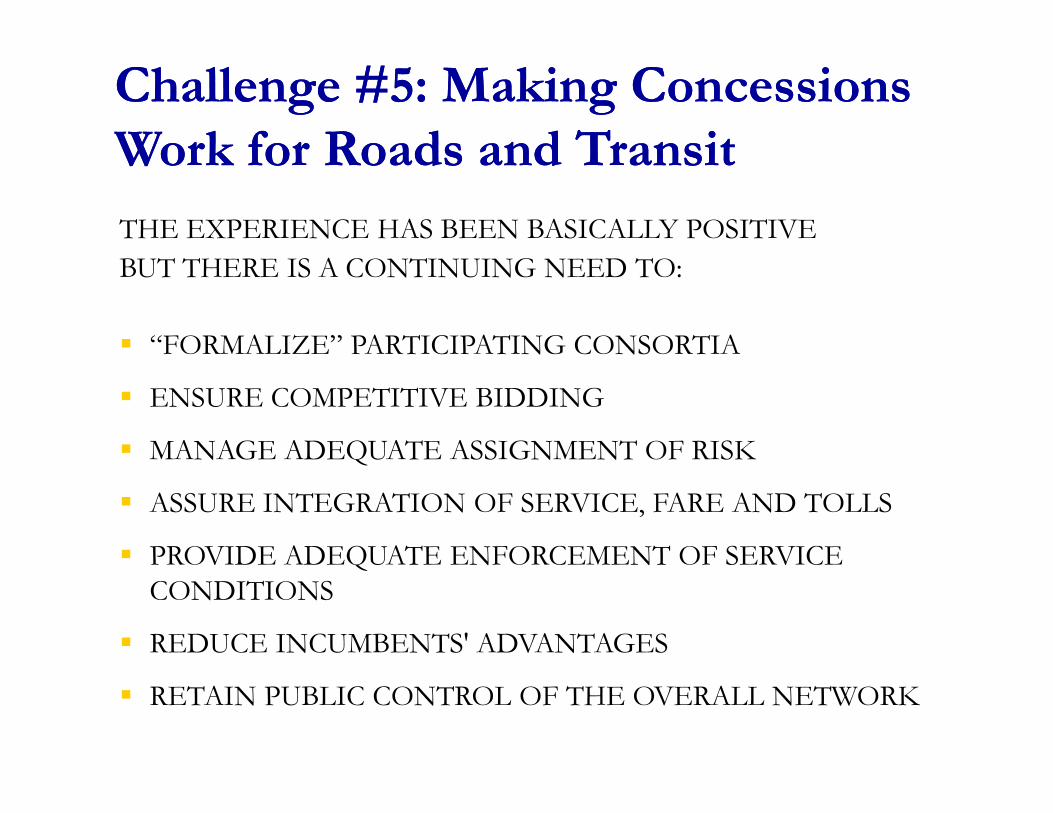
CChhaalllleennggee ##5:5: MMaakkiinngg CCoonncceessssiioonnssWWoorrkk ffoorr RRooaadsds aandnd TTrraannssiittTHE EXPERIENCE HAS BEEN BASICALLY POSITIVE BUT THERE IS A CONTINUING NEED TO:
� “FORMALIZE” PARTICIPATING CONSORTIA
� ENSURE COMPETITIVE BIDDING
� MANAGE ADEQUATE ASSIGNMENT OF RISK
� ASSURE INTEGRATION OF SERVICE, FARE AND TOLLS
� PROVIDE ADEQUATE ENFORCEMENT OF SERVICE CONDITIONS
� REDUCE INCUMBENTS' ADVANTAGES
� RETAIN PUBLIC CONTROL OF THE OVERALL NETWORK

THANKS FOR
WATCHING…….AND
LISTENING…..and now,
COMMENTING!COMMENTING!
MIT OpenCourseWare http://ocw.mit.edu
22.081J / 2.650J / 10.291J / 1.818J / 2.65J / 10.391J / 11.371J / 22.811J / ESD.166J Introduction to Sustainable Energy Fall 2010
For information about citing these materials or our Terms of Use, visit: http://ocw.mit.edu/terms.