transport temperatures observed during the commercial ...control and expert system (traces, the...
TRANSCRIPT
Veterinaria Italiana, 2012, 48 (1), 15‐29
© Istituto G. Caporale 2012 www.izs.it/vet_italiana Vol. 48 (1), Vet Ital 15
Transport temperatures observed during the
commercial transportation of animals
Gianluca Fiore, Johann Hofherr, Fabrizio Natale, Sergio Mainetti & Espedito Ruotolo
Summary
Current temperature standards and those
proposed by the European Food Safety
Authority (EFSA) were compared with the
actual practices of commercial transport in the
European Union. Temperature and humidity
records recorded for a year on 21 vehicles over
905 journeys were analysed. Differences in
temperature and humidity recorded by sensors
at four different positions in the vehicles
exceeded 10°C between the highest and lowest
temperatures in nearly 7% of cases. The
number and position of temperature sensors
are important to ensure the correct represent‐
ation of temperature conditions in the different
parts of a vehicle. For all journeys and all
animal categories, a relatively high percentage
of beyond threshold temperatures can be
observed in relation to the temperature limits
of 30°C and 5°C. Most recorded temperature
values lie within the accepted tolerance of ±5°C
stipulated in European Community Regulation
(EC) 1/2005. The temperature thresholds
proposed by EFSA would result in a higher
percentage of non‐compliant conditions which
are more pronounced at the lower threshold,
compared to the thresholds laid down in
Regulation (EC) 1/2005. With respect to the
different animal categories, the non‐compliant
temperature occurrences were more frequent
in pigs and sheep, in particular with regard to
the thresholds proposed by EFSA.
Keywords
Animal, European Union, Humidity, Livestock,
Regulation, Temperature, Temperature humidity
index, Threshold, Transport.
Temperature di trasporto
osservate durante viaggi
commerciali di animali
Riassunto
Gli attuali standard adottati dall’UE riguardanti le
temperature di trasporto degli animali e quelli
proposti dalle opinioni scientifiche dell’EFSA
(Autorità Europea per la Sicurezza Alimentare)
sono stati confrontati con le reali condizioni di
trasporto commerciale nell’Unione Europea. Lo
studio ha analizzato le informazioni di temperatura
ed umidità provenienti da oltre un anno di trasporti
animali, eseguiti da 21 veicoli e relative a 905 viaggi.
Le differenze in temperatura ed umidità registrate
da sensori posizionati in 4 punti diversi dei veicoli
hanno oltrepassato 10°C tra temperatura minima e
massima in quasi il 7% dei casi. Il numero ed il
posizionamento dei sensori sono aspetti importanti
per rappresentare correttamente le condizioni
termiche nelle differenti parti del veicolo. In linea
generale, in tutti i viaggi ed in tutte le categorie
animali oggetto dello studio è stata osservata una
percentuale relativamente alta di valori eccedenti i
limiti di 30 e 5 gradi. Molte delle temperature
registrate ricadono all’interno della tolleranza di
±5°C prevista dal Regolamento (EC) 1/2005. I
limiti di temperature proposti da EFSA determi‐
nerebbero in generale una più ampia percentuale di
non conformità se confrontata ai limiti previsti dal
Regolamento (EC) 1/2005, più pronunciata relativa‐
mente al limite inferiore. Per quanto riguarda le
diverse categorie di animali trasportati le non
conformità sono state osservate più frequentemente
nel trasporto di suini ed in quello di pecore, soprat‐
tutto se si applicano gli standard proposti da EFSA.
Institute for the Protection and Security of the Citizen (IPSC) of the Joint Research Centre (JRC) of the European Commission, Via E. Fermi 2749, 21027 Ispra (VA), Italy [email protected]

Transport temperatures observed during the commercial Gianluca Fiore, Johann Hofherr, Fabrizio Natale,
transportation of animals Sergio Mainetti & Espedito Ruotolo
16 Vol. 48 (1), Vet Ital www.izs.it/vet_italiana © Istituto G. Caporale 2012
Parole chiave
Animali, Bestiame, Indice, Umidità,
Regolamento, Temperatura, Unione Europea.
Introduction
Temperature standards have been applied in
the European Union (EU) to the long‐distance
transportation of horses, cattle, pigs, sheep and
goats since 1998 and the same temperature
range of 5°C to 30°C with a ± 5°C tolerance is
still currently applicable (6, 9).
Two scientific opinions from the European
Food Safety Authority (EFSA) on temperature
standards for the transport of animals propose
different temperature ranges in regard to
different categories of animals (7, 8). In
response to the EFSA proposals, studies have
examined the effects of ventilation in vehicles
to ensure acceptable temperature ranges,
measured stress parameters in animals during
transport and attempts have been made to
understand the factors that influence body
temperature during transport (1, 2, 3, 11, 12,
13, 14, 16, 17, 18).
Temperatures during transport are influenced
by a complex interaction of external factors,
such as seasonality, time of day, meteorological
and geographic conditions which make it
difficult to give a comprehensive picture of all
possible transport conditions along the animal
transport routes within the EU. The present
study provides a broad picture of the
temperatures that occur in routine commercial
transportation of pigs, cattle, sheep, goats and
slaughter horses along the principal trade
routes in Europe and it also evaluates the level
of non‐compliance in respect of the thresholds
given in the current legislation (6, 9) and
proposed by EFSA on standards for the micro‐
climate within animal transport road vehicles
(7, 8).
According to this information: 60% of all pigs
in intra‐EU trade were transported from
Denmark and the Netherlands to Germany,
Spain, Italy and Poland and 36% of all cattle in
intra‐EU trade were transported from France
and Poland to Italy and Spain. According to
the Food and Veterinary Office (FVO) of the
European Commission, an important flow of
cattle was also reported from the EU (mainly
from France and Germany) to countries east of
Europe (mainly Russia). The most significant
transportation of sheep was seen from
Hungary (18%) and Romania (22%) to Italy
and Spain and from Spain (4%) to Italy,
whereas approximately 75% of all goats were
moved from the Netherlands to France and
Spain. Regarding slaughter horses, most of the
animals (52%) came from Poland, Romania
and Bulgaria to Italy. In 2006, the EU trade
control and expert system (TRACES, the
information exchange system referred to in
Article 20 of Directive 90/425/EEC) recorded
the transportation, for 2006, of over
270 000 animals (55% cattle, 33% pigs, 7%
horses, 5% sheep, <1% goats) with over
31 million animals (68% pigs, 19% cattle, 12%
sheep, 1% horses and goats).
Materials and methods
On the basis of data for 2006 from TRACES
and information from the FVO, the principal
trade flows of pigs, cattle, sheep, goats and
slaughter horses in imports into and exports
from the EU were identified.
As different trade patterns occur for different
categories of livestock, the species included in
the study were broken down into the
following categories:
pigs up to 30 kg live weight
pigs over 30 kg cattle up to 6 months of age
cattle above 6 months
sheep up to six months of age
sheep over 6 months
horses and goats.
To obtain a broad picture of the commercial
transportation of these animal categories,
transporters operating regularly along the
trade routes identified were invited to
participate for approximately 12 months with
one vehicle for each of the most frequented
trade flows and for each of the above animal
categories. Ten companies from 5 member
states volunteered with 21 transport units
(9 trucks with trailers and 12 semi‐trailers), on
the basis of the most frequent transportation
along the principal trade routes.
Gianluca Fiore, Johann Hofherr, Fabrizio Natale, Transport temperatures observed during the commercial
Sergio Mainetti & Espedito Ruotolo transportation of animals
© Istituto G. Caporale 2012 www.izs.it/vet_italiana Vol. 48 (1), Vet Ital 17
With the exception of goats and slaughter
horses, each participating vehicle travelled a
number of different trade routes. Therefore, for
each animal category, the most frequented
trade flows were covered by more than one
vehicle.
The fleet of participating vehicles that
represented seven major brands of animal
transport vehicle manufacturers in Europe,
were built between 1993 and 2007, and all were
equipped with mechanical ventilation, a light‐
coloured roof and, with the exception of
3 semi‐trailers, all had an insulated roof and
none had a misting system.
All trucks and semi‐trailers were equipped
with data loggers with integrated temperature
and humidity sensors (HOBO Pro v2 U23‐001)
set to record temperatures and humidity at 15‐
min intervals over the entire data collection
period from February 2008 until March 2009,
irrespective of the presence or absence of
animals in the vehicles. The calibrated
temperature sensors had a resolution of 0.02°C,
an accuracy of 0.2°C over 0°C‐50°C and the
humidity sensors a resolution of 0.03% and an
accuracy rate of ±2.5%. Regarding the location
of the data loggers/sensors, the following
scheme was applied as shown in Figures 1 and
2:
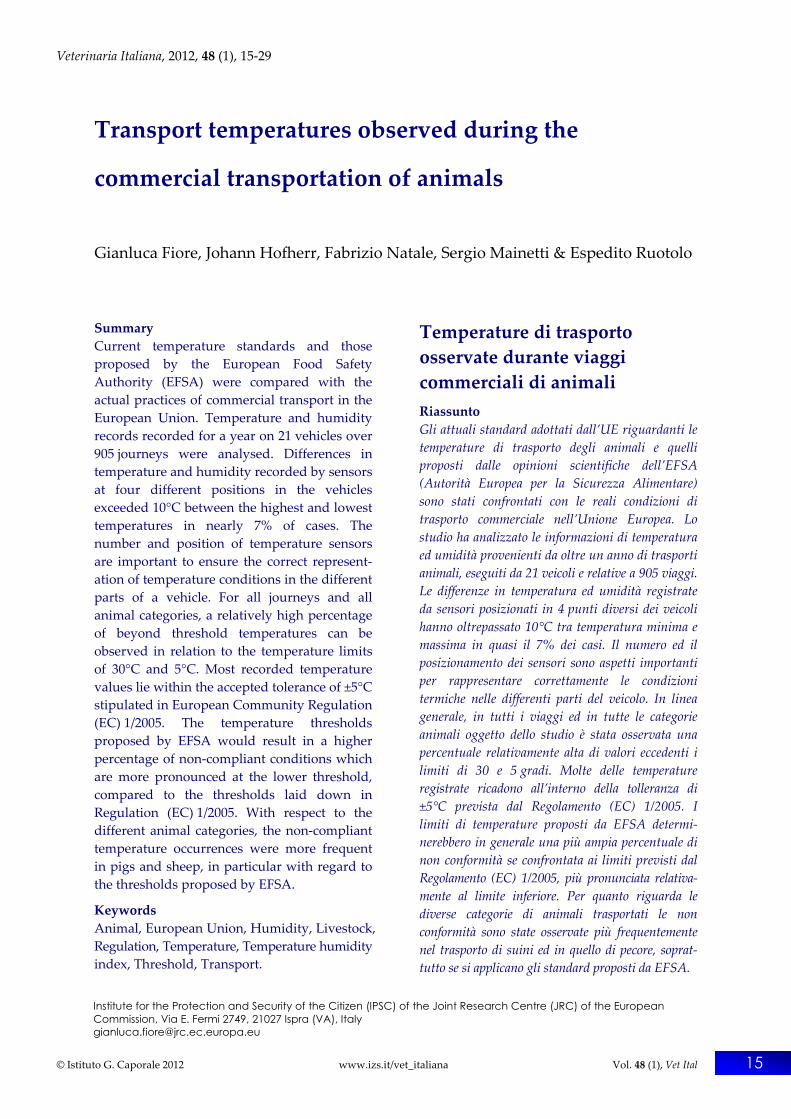
in vehicles with one floor (mono‐volume),
1 median was placed in the front and
1 lateral in the back, both situated
approximately 1 m above the floor, 1 median
was placed in the front and 1 lateral in the
back, both close to or beneath the roof
in multi‐tier vehicles, 1 median was placed in
the front and 1 lateral in the back, both on
the ceiling of the lowest tier, 1 median was
placed in the front and 1 lateral in the back,
both close to or beneath the roof
one data logger was placed under the vehicle
and was protected from direct sunlight and
the motor of the towing vehicle.
Figure 1 Installation of sensors in a semi-trailer and in a truck and trailer Outside sensor in light grey and inside sensor in dark grey Inside sensors were placed under the ceiling of the lowest tier and under the roof, in front in the middle and in the back, close to the side wall opposite the mechanical ventilation
In addition, in two trailers that transported
pigs, data loggers were installed in the above‐
listed locations. No sensor inside the vehicles
was located directly in the flow of a
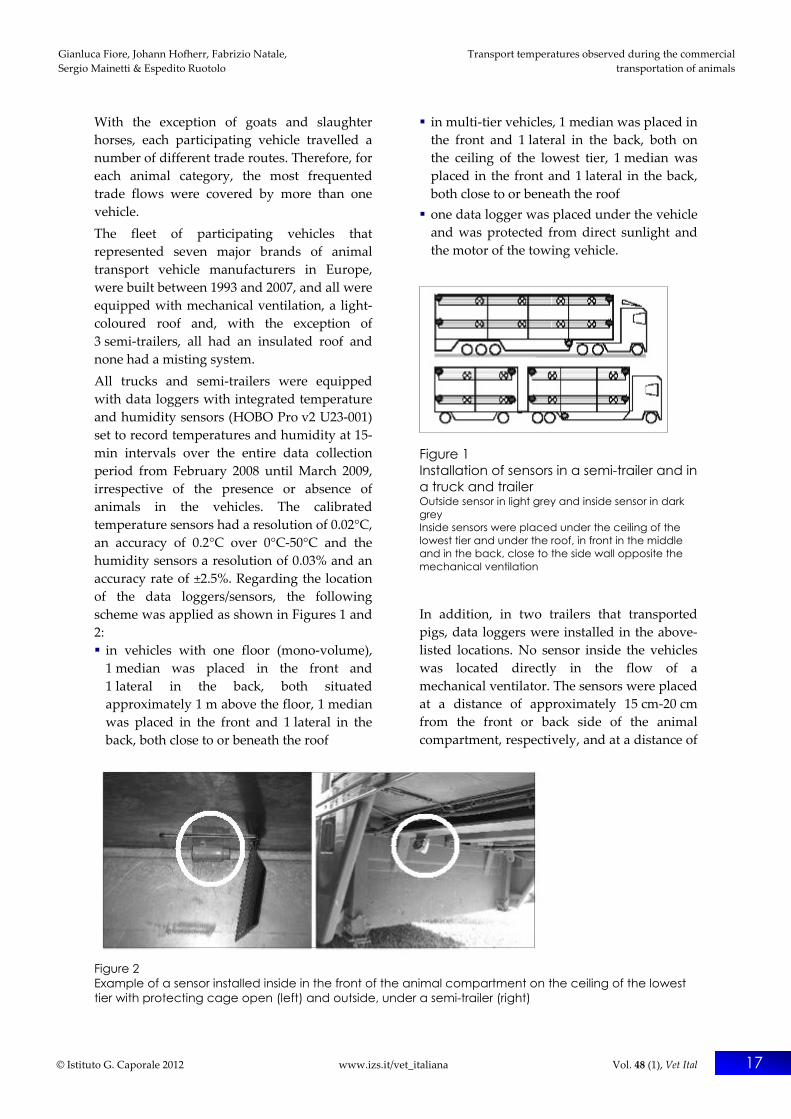
mechanical ventilator. The sensors were placed
at a distance of approximately 15 cm‐20 cm
from the front or back side of the animal
compartment, respectively, and at a distance of
Figure 2 Example of a sensor installed inside in the front of the animal compartment on the ceiling of the lowest tier with protecting cage open (left) and outside, under a semi-trailer (right)
Transport temperatures observed during the commercial Gianluca Fiore, Johann Hofherr, Fabrizio Natale,
transportation of animals Sergio Mainetti & Espedito Ruotolo
18 Vol. 48 (1), Vet Ital www.izs.it/vet_italiana © Istituto G. Caporale 2012
approximately 3 cm to the underlying metal
wall.
Of the 113 devices initially installed, 13 had to
be replaced during the study, five due to
recording failure, five due to low battery
charge after the winter, one damaged by
animals and two were lost when the vehicle
chassis was replaced. Three of the vehicles that
participated originally were replaced by other
vehicles and two vehicles only participated
until mid‐October 2008.
To identify the periods in which animals were
on board during each individual journey, the
category and number of animals loaded, starts,
rests and completion of journey were extracted
from the completed journey log which has to
be filled in by the transporter for each journey
that exceeds 8 h. For the purposes of the study,
a journey is considered to be the entire
transport operation with animals on board
from the place of departure to the place of
destination, including any rest that might
occur at stops along the way.
The number of animals loaded was obtained
for each journey. However, without having
more specific information on how the load was
distributed within the vehicles, a correlation
between loading density and temperatures
measured in the different parts of the vehicle
could not be established.
Statistical analysis of the data was performed
using the statistical software R© (The
R Foundation for Statistical Computing in
Vienna). Correlations were calculated using
the Pearson product‐moment correlation
coefficient. Scatter plots with frequency
distributions were obtained using the Using R©
package (John Verzani, 2001‐2002).
Results
Data downloaded from the vehicles provided
a total of 3 861 606 records of temperature and
humidity, registered at 15 min intervals by the
4 sensors inside and the one outside the
vehicle.
According to the journey logs, of the data
downloaded, 512 629 records pertained to
905 journeys with a total of nearly
325 000 animals. Table I gives the distribution
of journeys and the number of animals
transported by category of animals and by
month.
Table I Animal journeys recorded for participating vehicles by animal category and month
2008 2009 Species
Feb
Mar
Apr
May
Jun
Jul
Aug
Sep
Oct
Nov
Dec
Jan
Feb
Mar
Total No. of
animals (1 000)
Bovines ≤6 m 2 8 9 9 5 4 5 6 4 3 6 5 3 6 75 10.6
Bovines >6 m 11 7 18 10 9 13 8 21 32 19 15 15 16 13 207 7.9
Goats 2 1 1 3 7 4.9
Horses 6 3 4 4 4 7 6 8 10 7 4 8 6 4 81 1.4
Other* 1 1 0.0
Pigs ≤30 kg 16 12 22 28 13 28 22 28 25 19 18 23 21 10 285 214.7
Pigs >30 kg 21 18 4 15 18 15 10 11 7 14 17 16 7 4 177 39.0
Sheep ≤6 m 3 9 3 4 3 3 2 5 6 14 3 2 57 39.6
Sheep 6 m 3 1 4 2 1 2 1 1 15 6.6
Total 62 57 64 70 50 74 56 78 83 70 74 71 59 37 905 324.7
* one shipment of 31 alpacas m months
Gianluca Fiore, Johann Hofherr, Fabrizio Natale, Transport temperatures observed during the commercial
Sergio Mainetti & Espedito Ruotolo transportation of animals
© Istituto G. Caporale 2012 www.izs.it/vet_italiana Vol. 48 (1), Vet Ital 19
Of the 905 journeys:
approximately 70% of the journeys recorded
involved the transportation of pigs along the
main routes from Denmark and the
Netherlands to Germany, Italy, Spain and
Poland
70% of the recorded cattle journeys followed
the routes from France, Germany and Poland
to Italy, Spain and to countries in Eastern
Europe and beyond
70% of the sheep transports recorded were
along the routes from Hungary, Romania to
Italy and Spain, or from Spain to Italy
63% of the horse transports recorded covered the main routes from Poland, Romania and
Bulgaria to Italy.
A total of 25 of the 905 journeys included ferry
transport, e.g. transports to Greece or from the
United Kingdom to continental Europe.
In regard to the duration of the journeys, 8%
lasted for over 3 days, 31% from 1 to 3 days,
47% between 8 h and 24 h and 14% less than
8 h.
Temperature and humidity variations
The temperature recorded by the different
sensors on each vehicle showed variations
which may not only be determined by daily
and seasonal cycles but also by different
climatic conditions encountered during the
journeys, by the presence of the animals, by
the circulation of air induced by the movement
of the vehicle and by the possible use of
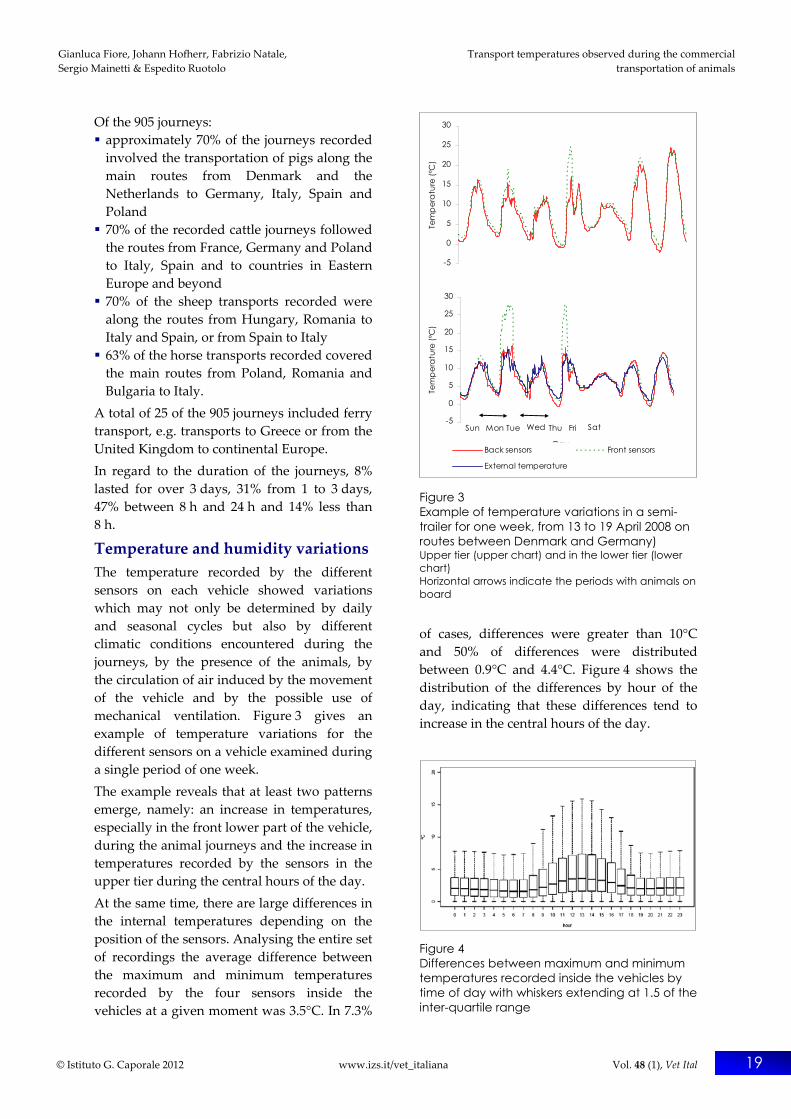
mechanical ventilation. Figure 3 gives an
example of temperature variations for the
different sensors on a vehicle examined during
a single period of one week.
The example reveals that at least two patterns
emerge, namely: an increase in temperatures,
especially in the front lower part of the vehicle,
during the animal journeys and the increase in
temperatures recorded by the sensors in the
upper tier during the central hours of the day.
At the same time, there are large differences in
the internal temperatures depending on the
position of the sensors. Analysing the entire set
of recordings the average difference between
the maximum and minimum temperatures
recorded by the four sensors inside the
vehicles at a given moment was 3.5°C. In 7.3%
-5
0
5
10
15
20
25
30
Tem
per
atu
re (°
C)
-5
0
5
10
15
20
25
30
DayTe
mp
era
ture
(°C
)
Back sensors Front sensors
External temperature
Sun Mon Tue Wed Thu Fri Sat
Figure 3 Example of temperature variations in a semi-trailer for one week, from 13 to 19 April 2008 on routes between Denmark and Germany) Upper tier (upper chart) and in the lower tier (lower chart) Horizontal arrows indicate the periods with animals on board
of cases, differences were greater than 10°C
and 50% of differences were distributed
between 0.9°C and 4.4°C. Figure 4 shows the
distribution of the differences by hour of the
day, indicating that these differences tend to
increase in the central hours of the day.
Figure 4 Differences between maximum and minimum temperatures recorded inside the vehicles by time of day with whiskers extending at 1.5 of the inter-quartile range
Transport temperatures observed during the commercial Gianluca Fiore, Johann Hofherr, Fabrizio Natale,
transportation of animals Sergio Mainetti & Espedito Ruotolo
20 Vol. 48 (1), Vet Ital www.izs.it/vet_italiana © Istituto G. Caporale 2012
Correlations among temperature records in the
different positions of each vehicle are given in
Table II which shows that temperatures in the
front and back of the same tier showed a
similar stronger correlation, whereas weaker
correlations were found between the front
lower and back upper tiers, and between the
front lower and front upper tiers. Correlations
tended to be stronger in mono‐volume
vehicles, such as those used for transporting
horses, rather than in multi‐tier vehicles.
Table II Correlation coefficients between temperatures recorded at different positions of the sensors in multi-tier semi-trailers during animal journeys
Sensor position
Back down
Back up
Front down
Front up
Back down 1.00
Back up 0.92 1.00
Front down 0.95 0.87 1.00
Front up 0.93 0.99 0.89 1.00
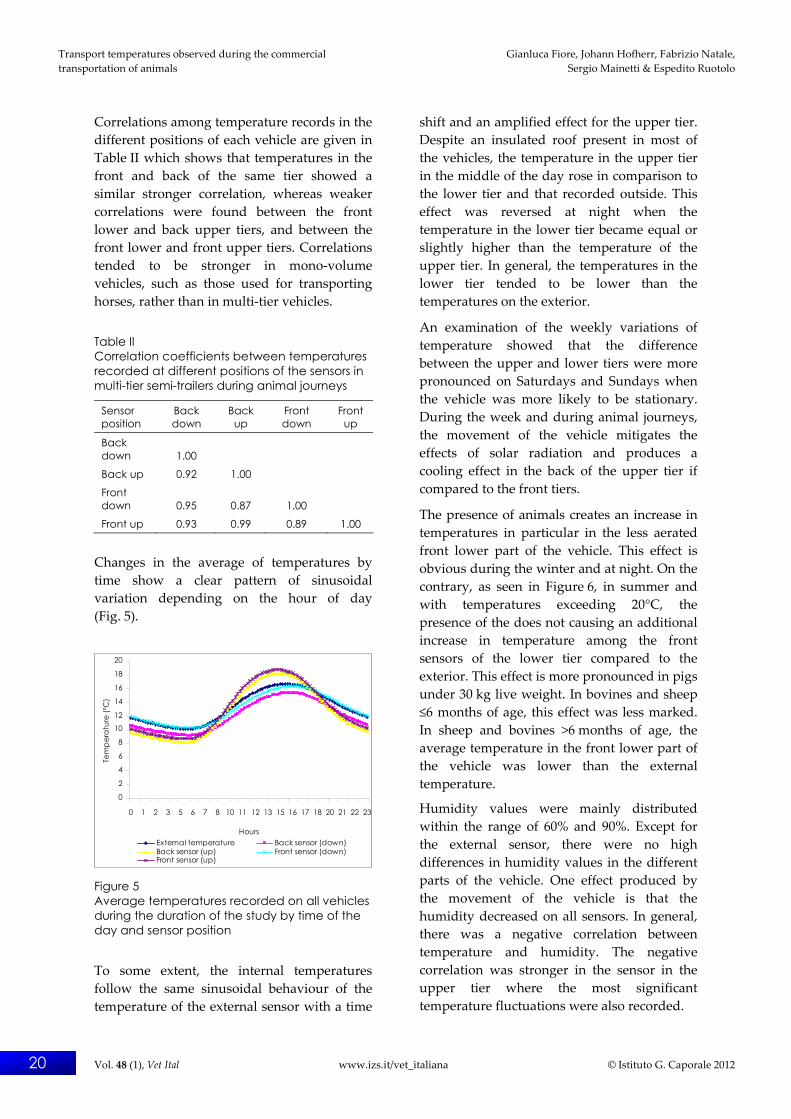
Changes in the average of temperatures by
time show a clear pattern of sinusoidal
variation depending on the hour of day
(Fig. 5).
0
2
4
6
8
10
12
14
16
18
20
0 1 2 3 5 6 7 8 10 11 12 13 15 16 17 18 20 21 22 23
Hours
Tem
per
atu
re (º
C)
External temperature Back sensor (down)Back sensor (up) Front sensor (down)Front sensor (up)
Figure 5 Average temperatures recorded on all vehicles during the duration of the study by time of the day and sensor position
To some extent, the internal temperatures
follow the same sinusoidal behaviour of the
temperature of the external sensor with a time
shift and an amplified effect for the upper tier.
Despite an insulated roof present in most of
the vehicles, the temperature in the upper tier
in the middle of the day rose in comparison to
the lower tier and that recorded outside. This
effect was reversed at night when the
temperature in the lower tier became equal or
slightly higher than the temperature of the
upper tier. In general, the temperatures in the
lower tier tended to be lower than the
temperatures on the exterior.
An examination of the weekly variations of
temperature showed that the difference
between the upper and lower tiers were more
pronounced on Saturdays and Sundays when
the vehicle was more likely to be stationary.
During the week and during animal journeys,
the movement of the vehicle mitigates the
effects of solar radiation and produces a
cooling effect in the back of the upper tier if
compared to the front tiers.
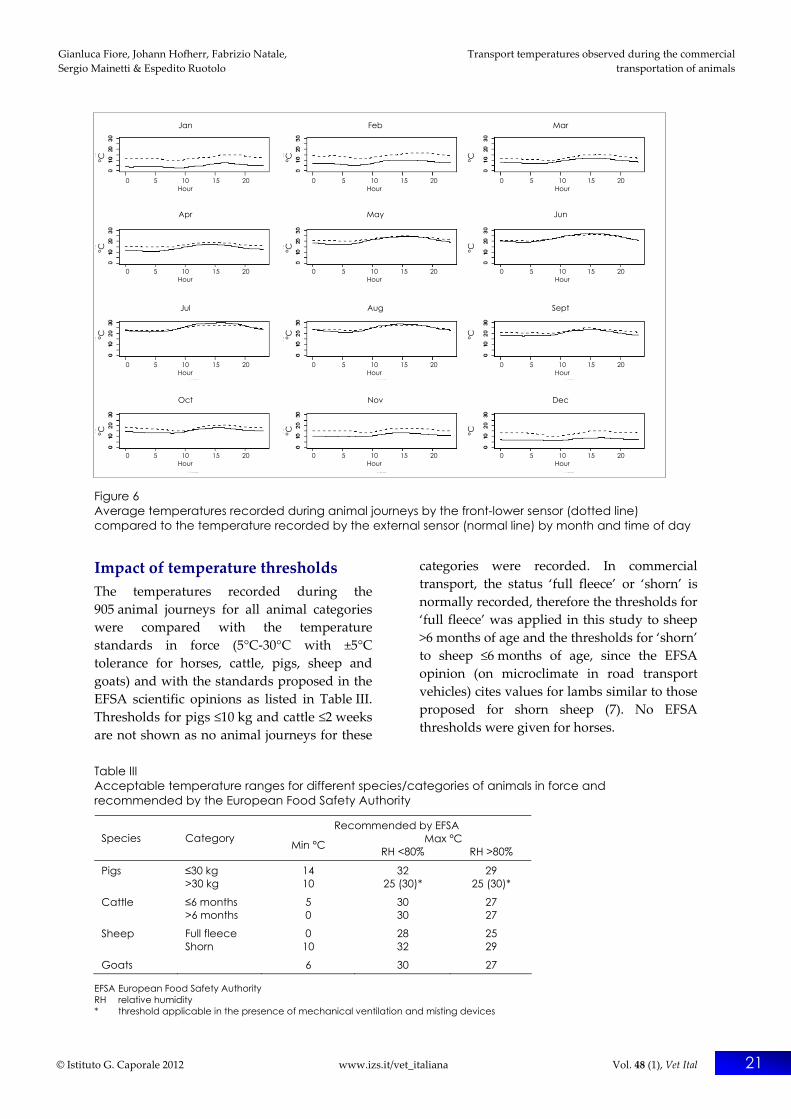
The presence of animals creates an increase in
temperatures in particular in the less aerated
front lower part of the vehicle. This effect is
obvious during the winter and at night. On the
contrary, as seen in Figure 6, in summer and
with temperatures exceeding 20°C, the
presence of the does not causing an additional
increase in temperature among the front
sensors of the lower tier compared to the
exterior. This effect is more pronounced in pigs
under 30 kg live weight. In bovines and sheep
≤6 months of age, this effect was less marked.
In sheep and bovines >6 months of age, the
average temperature in the front lower part of
the vehicle was lower than the external
temperature.
Humidity values were mainly distributed
within the range of 60% and 90%. Except for
the external sensor, there were no high
differences in humidity values in the different
parts of the vehicle. One effect produced by
the movement of the vehicle is that the
humidity decreased on all sensors. In general,
there was a negative correlation between
temperature and humidity. The negative
correlation was stronger in the sensor in the
upper tier where the most significant
temperature fluctuations were also recorded.
Gianluca Fiore, Johann Hofherr, Fabrizio Natale, Transport temperatures observed during the commercial
Sergio Mainetti & Espedito Ruotolo transportation of animals
© Istituto G. Caporale 2012 www.izs.it/vet_italiana Vol. 48 (1), Vet Ital 21
Figure 6 Average temperatures recorded during animal journeys by the front-lower sensor (dotted line) compared to the temperature recorded by the external sensor (normal line) by month and time of day
Impact of temperature thresholds
The temperatures recorded during the
905 animal journeys for all animal categories
were compared with the temperature
standards in force (5°C‐30°C with ±5°C
tolerance for horses, cattle, pigs, sheep and
goats) and with the standards proposed in the
EFSA scientific opinions as listed in Table III.
Thresholds for pigs ≤10 kg and cattle ≤2 weeks
are not shown as no animal journeys for these
categories were recorded. In commercial
transport, the status ‘full fleece’ or ‘shorn’ is
normally recorded, therefore the thresholds for
‘full fleece’ was applied in this study to sheep
>6 months of age and the thresholds for ‘shorn’
to sheep ≤6 months of age, since the EFSA
opinion (on microclimate in road transport
vehicles) cites values for lambs similar to those
proposed for shorn sheep (7). No EFSA
thresholds were given for horses.
Table III Acceptable temperature ranges for different species/categories of animals in force and recommended by the European Food Safety Authority
Recommended by EFSA Max °C Species Category Min °C RH <80% RH >80%
Pigs ≤30 kg >30 kg
14 10
32 25 (30)*
29 25 (30)*
Cattle ≤6 months >6 months
5 0
30 30
27 27
Sheep Full fleece Shorn
0 10
28 32
25 29
Goats 6 30 27
EFSA European Food Safety Authority RH relative humidity * threshold applicable in the presence of mechanical ventilation and misting devices
Jan Feb Mar
Jul Aug Sept
Apr May Jun
Oct Nov Dec
0 5 10 15 20 0 5 10 15 20 0 5 10 15 20 Hour Hour Hour
0 5 10 15 20 0 5 10 15 20 0 5 10 15 20 Hour Hour Hour
0 5 10 15 20 0 5 10 15 20 0 5 10 15 20 Hour Hour Hour
0 5 10 15 20 0 5 10 15 20 0 5 10 15 20 Hour Hour Hour
°C
°C
°C
°C
°C
°C
°C
°C
°C
°C
°C
°C
Transport temperatures observed during the commercial Gianluca Fiore, Johann Hofherr, Fabrizio Natale,
transportation of animals Sergio Mainetti & Espedito Ruotolo
22 Vol. 48 (1), Vet Ital www.izs.it/vet_italiana © Istituto G. Caporale 2012
After recording temperatures at 15 min‐
intervals, the data were analysed in terms of:
number of journeys with at least one non‐
compliant temperature measured at least at
one of the 4 internal sensors in the vehicle
number of 15‐min intervals non‐compliant
with the thresholds during a journey (non‐
compliant intervals not necessarily in
consecutive sequence)
duration of a journey during which the
temperature recorded by at least one of the
4 internal sensors of the vehicle was non‐
compliant with the temperature thresholds.
Table IV summarises, for all journeys and all
animal categories, the percentage of journeys
with at least one non‐compliant temperature
occurrence, the average number of non‐
compliant records during non‐compliant
journeys and the percentage of journey times
where the non‐compliant occurrence was
observed.
Impact of high temperature thresholds When considering a threshold of 35°C, 8% of
journeys had at least one non‐compliant event
and, on average, each non‐compliant journey
had 11 non‐compliant incidents. In 36% of the
journeys for all animal categories, there was at
least one occurrence of temperatures exceeding
the 30°C limit and, on average, each of those
journeys had 18 occurrences of temperatures
above the 30°C limit. In the case of the EFSA
limit (Table III), in 40% of journeys there was
at least one non‐compliant event and on
average each non‐compliant journey had
23 non‐compliant occurrences.
In regard to the non‐compliant journey times
during the 905 journeys, the maximum
temperatures within the vehicle exceeded the
limit of 35°C in 1% of the journey times, the
limit of 30°C was exceeded in 6% of journey
times and the limits proposed by EFSA were
exceed in 8% of journey times (7% of cases
where humidity was below 80% and 1% with
humidity above 80%). These percentages were
calculated as the sum of records when the
temperature from at least one of the internal
sensors exceeded the threshold, divided by the
total number of records during animal
journeys in the entire observation period
(102 128 intervals of 15 min).
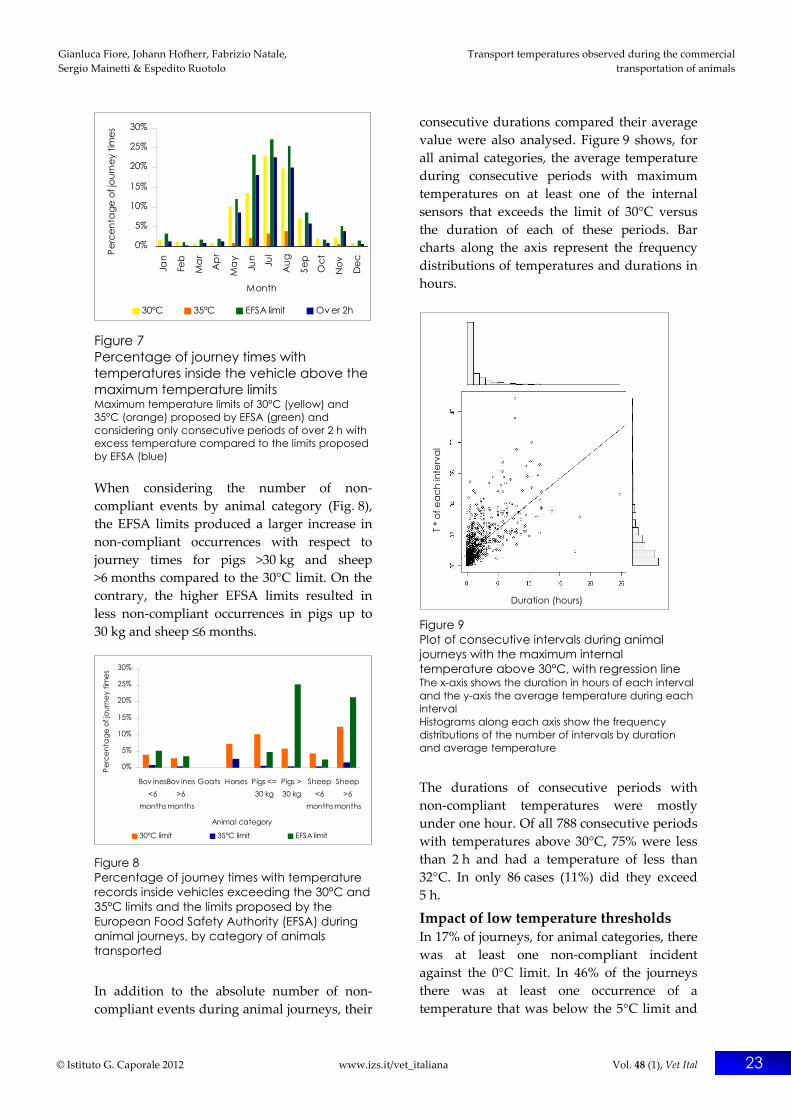
As shown in Figure 7 which covers all animal
categories, most non‐compliant occurrences
were recorded between May and September.
In July, the level reached 23% of journey time
for the 30°C limit and 27% for the EFSA limits.
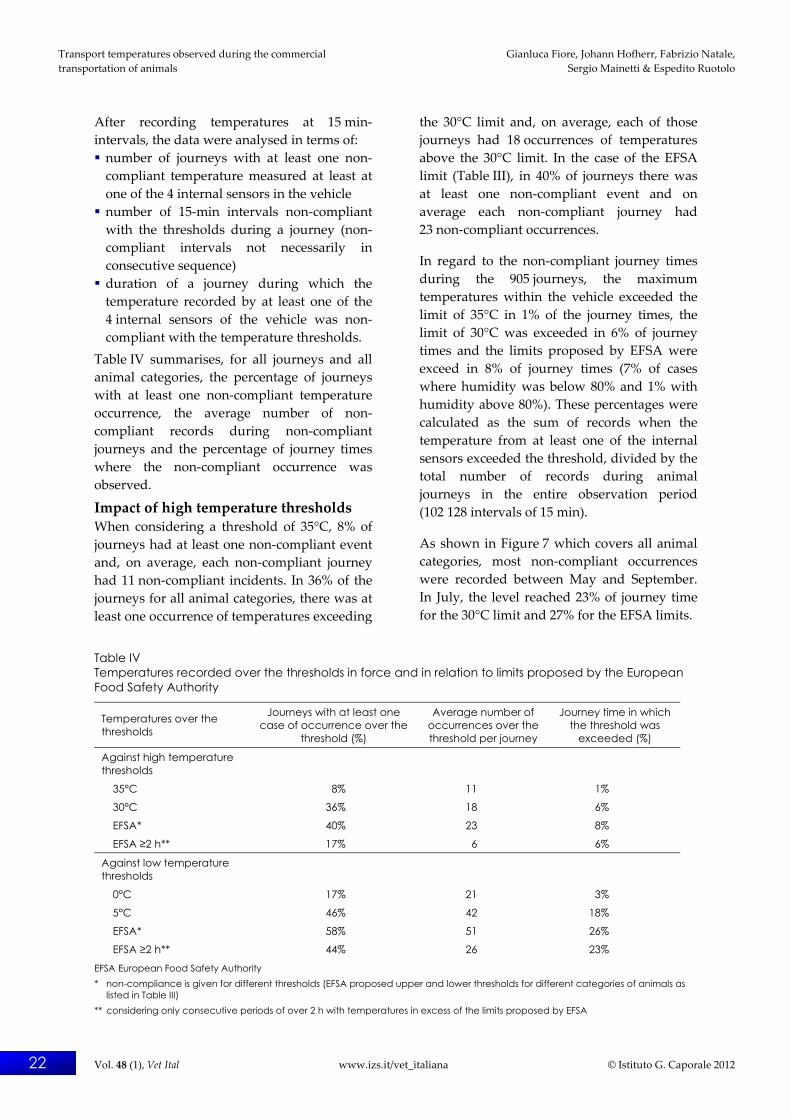
Table IV Temperatures recorded over the thresholds in force and in relation to limits proposed by the European Food Safety Authority
Temperatures over the thresholds
Journeys with at least one case of occurrence over the
threshold (%)
Average number of occurrences over the threshold per journey
Journey time in which the threshold was
exceeded (%)
Against high temperature thresholds
35°C 8% 11 1%
30°C 36% 18 6%
EFSA* 40% 23 8%
EFSA ≥2 h** 17% 6 6%
Against low temperature thresholds
0°C 17% 21 3%
5°C 46% 42 18%
EFSA* 58% 51 26%
EFSA ≥2 h** 44% 26 23%
EFSA European Food Safety Authority * non-compliance is given for different thresholds (EFSA proposed upper and lower thresholds for different categories of animals as
listed in Table III) ** considering only consecutive periods of over 2 h with temperatures in excess of the limits proposed by EFSA
Gianluca Fiore, Johann Hofherr, Fabrizio Natale, Transport temperatures observed during the commercial
Sergio Mainetti & Espedito Ruotolo transportation of animals
© Istituto G. Caporale 2012 www.izs.it/vet_italiana Vol. 48 (1), Vet Ital 23
0%
5%
10%
15%
20%
25%
30%
Jan
Feb
Ma
r
Ap
r
Ma
y
Jun Jul
Aug
Sep
Oct
Nov Dec
Month
Perc
enta
ge o
f jou
rney
tim
es
30°C 35°C EFSA limit Ov er 2h
Figure 7 Percentage of journey times with temperatures inside the vehicle above the maximum temperature limits Maximum temperature limits of 30°C (yellow) and 35°C (orange) proposed by EFSA (green) and considering only consecutive periods of over 2 h with excess temperature compared to the limits proposed by EFSA (blue)
When considering the number of non‐
compliant events by animal category (Fig. 8),
the EFSA limits produced a larger increase in
non‐compliant occurrences with respect to
journey times for pigs >30 kg and sheep
>6 months compared to the 30°C limit. On the
contrary, the higher EFSA limits resulted in
less non‐compliant occurrences in pigs up to
30 kg and sheep ≤6 months.
0%
5%
10%
15%
20%
25%
30%
Bov ines<6
months
Bov ines>6
months
Goats Horses Pigs <=30 kg
Pigs >30 kg
Sheep<6
months
Sheep>6
months
Animal category
Perc
enta
ge o
f jou
rney
tim
es
30°C limit 35°C limit EFSA limit
Figure 8 Percentage of journey times with temperature records inside vehicles exceeding the 30°C and 35°C limits and the limits proposed by the European Food Safety Authority (EFSA) during animal journeys, by category of animals transported
In addition to the absolute number of non‐
compliant events during animal journeys, their
consecutive durations compared their average
value were also analysed. Figure 9 shows, for
all animal categories, the average temperature
during consecutive periods with maximum
temperatures on at least one of the internal
sensors that exceeds the limit of 30°C versus
the duration of each of these periods. Bar
charts along the axis represent the frequency
distributions of temperatures and durations in
hours.
Figure 9 Plot of consecutive intervals during animal journeys with the maximum internal temperature above 30°C, with regression line The x-axis shows the duration in hours of each interval and the y-axis the average temperature during each interval Histograms along each axis show the frequency distributions of the number of intervals by duration and average temperature
The durations of consecutive periods with
non‐compliant temperatures were mostly
under one hour. Of all 788 consecutive periods
with temperatures above 30°C, 75% were less
than 2 h and had a temperature of less than
32°C. In only 86 cases (11%) did they exceed
5 h.
Impact of low temperature thresholds In 17% of journeys, for animal categories, there
was at least one non‐compliant incident
against the 0°C limit. In 46% of the journeys
there was at least one occurrence of a
temperature that was below the 5°C limit and
Duration (hours)
T ° o
f eac
h in
terv
al
Transport temperatures observed during the commercial Gianluca Fiore, Johann Hofherr, Fabrizio Natale,
transportation of animals Sergio Mainetti & Espedito Ruotolo
24 Vol. 48 (1), Vet Ital www.izs.it/vet_italiana © Istituto G. Caporale 2012
in 58% cases below the proposed EFSA limits.
The average numbers of occurrences outside
the limits per journey were 21, 42 and 51,
respectively.
During the journeys, again for all animal
categories, the minimum temperatures inside
the vehicles were below the limit of 0°C in 3%
of the journey times, below 5°C in 18% and
below the limits proposed by EFSA in 26%
(calculated, as for the upper threshold). As
shown in Figure 10, most non‐compliant
occurrences with respect to the journey times
for low temperatures were recorded between
November and March. In January,
temperatures below the 5°C and the EFSA
limits were recorded in 60% and 70% of the
journey times, respectively.
0%
10%
20%
30%
40%
50%
60%
70%
80%
Jan Feb Mar Apr May Jun Jul Aug Sep Oct Nov Dec
Month
Perc
enta
ge o
f jou
rney
tim
es
0°C 5°C EFSA limit Ov er 2 h
Figure 10 Percentage of journey times showing temperatures inside the vehicles below the minimum temperature limit of 0°C, 5°C, that proposed by the European Food Safety Authority (EFSA) and considering only consecutive periods of over 2 h with temperatures in excess of the limits proposed by EFSA
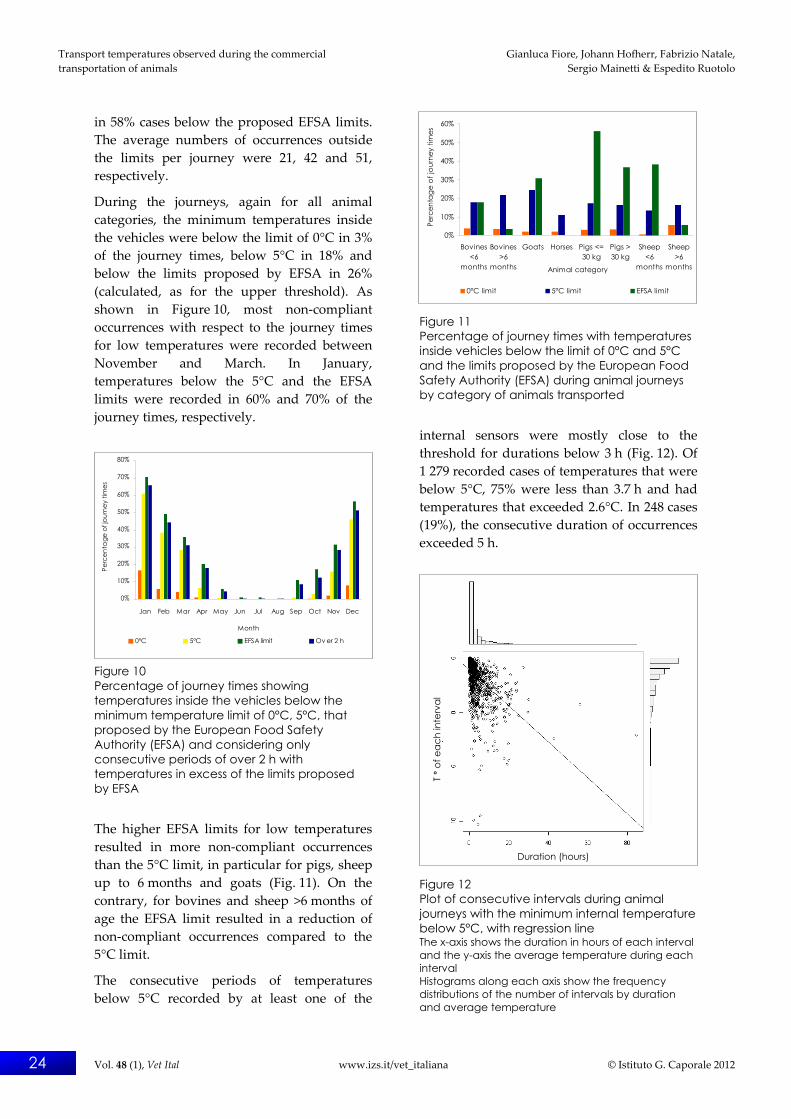
The higher EFSA limits for low temperatures
resulted in more non‐compliant occurrences
than the 5°C limit, in particular for pigs, sheep
up to 6 months and goats (Fig. 11). On the
contrary, for bovines and sheep >6 months of
age the EFSA limit resulted in a reduction of
non‐compliant occurrences compared to the
5°C limit.
The consecutive periods of temperatures
below 5°C recorded by at least one of the
0%
10%
20%
30%
40%
50%
60%
Bovines<6
months
Bovines>6
months
Goats Horses Pigs <=30 kg
Pigs >30 kg
Sheep<6
months
Sheep>6
monthsAnimal category
Perc
enta
ge
of j
our
ney
times
0°C limit 5°C limit EFSA limit
Figure 11 Percentage of journey times with temperatures inside vehicles below the limit of 0°C and 5°C and the limits proposed by the European Food Safety Authority (EFSA) during animal journeys by category of animals transported
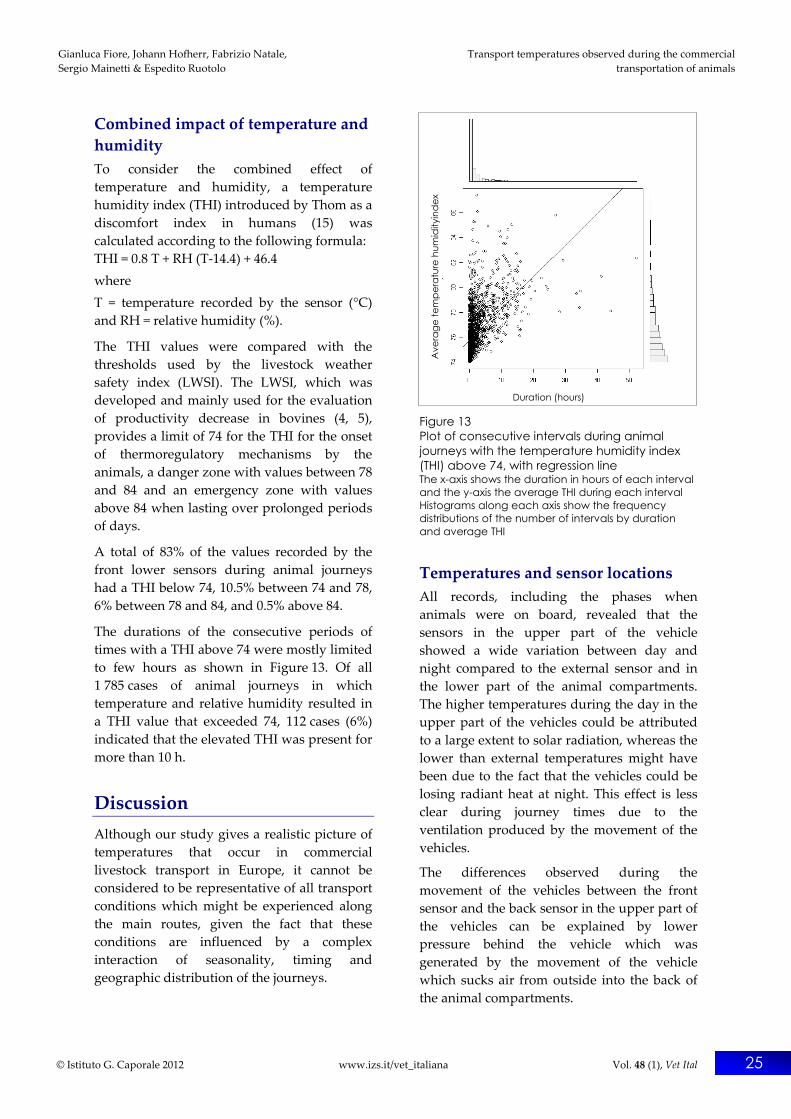
internal sensors were mostly close to the
threshold for durations below 3 h (Fig. 12). Of
1 279 recorded cases of temperatures that were
below 5°C, 75% were less than 3.7 h and had
temperatures that exceeded 2.6°C. In 248 cases
(19%), the consecutive duration of occurrences
exceeded 5 h.
Figure 12 Plot of consecutive intervals during animal journeys with the minimum internal temperature below 5°C, with regression line The x-axis shows the duration in hours of each interval and the y-axis the average temperature during each interval Histograms along each axis show the frequency distributions of the number of intervals by duration and average temperature
Duration (hours)
T ° o
f eac
h in
terv
al
Gianluca Fiore, Johann Hofherr, Fabrizio Natale, Transport temperatures observed during the commercial
Sergio Mainetti & Espedito Ruotolo transportation of animals
© Istituto G. Caporale 2012 www.izs.it/vet_italiana Vol. 48 (1), Vet Ital 25
Combined impact of temperature and
humidity
To consider the combined effect of
temperature and humidity, a temperature
humidity index (THI) introduced by Thom as a
discomfort index in humans (15) was
calculated according to the following formula:
THI = 0.8 T + RH (T‐14.4) + 46.4
where
T = temperature recorded by the sensor (°C)
and RH = relative humidity (%).
The THI values were compared with the
thresholds used by the livestock weather
safety index (LWSI). The LWSI, which was
developed and mainly used for the evaluation
of productivity decrease in bovines (4, 5),
provides a limit of 74 for the THI for the onset
of thermoregulatory mechanisms by the
animals, a danger zone with values between 78
and 84 and an emergency zone with values
above 84 when lasting over prolonged periods
of days.
A total of 83% of the values recorded by the
front lower sensors during animal journeys
had a THI below 74, 10.5% between 74 and 78,
6% between 78 and 84, and 0.5% above 84.
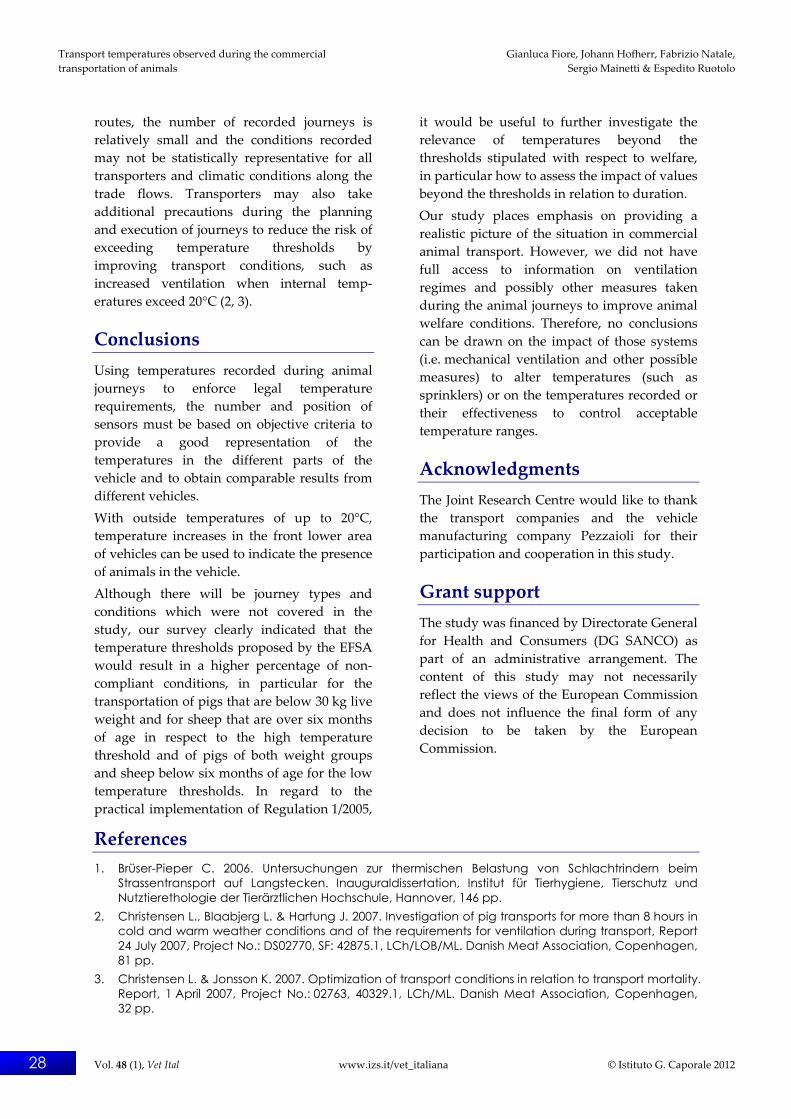
The durations of the consecutive periods of
times with a THI above 74 were mostly limited
to few hours as shown in Figure 13. Of all
1 785 cases of animal journeys in which
temperature and relative humidity resulted in
a THI value that exceeded 74, 112 cases (6%)
indicated that the elevated THI was present for
more than 10 h.
Discussion
Although our study gives a realistic picture of
temperatures that occur in commercial
livestock transport in Europe, it cannot be
considered to be representative of all transport
conditions which might be experienced along
the main routes, given the fact that these
conditions are influenced by a complex
interaction of seasonality, timing and
geographic distribution of the journeys.
Figure 13 Plot of consecutive intervals during animal journeys with the temperature humidity index (THI) above 74, with regression line The x-axis shows the duration in hours of each interval and the y-axis the average THI during each interval Histograms along each axis show the frequency distributions of the number of intervals by duration and average THI
Temperatures and sensor locations
All records, including the phases when
animals were on board, revealed that the
sensors in the upper part of the vehicle
showed a wide variation between day and
night compared to the external sensor and in
the lower part of the animal compartments.
The higher temperatures during the day in the
upper part of the vehicles could be attributed
to a large extent to solar radiation, whereas the
lower than external temperatures might have
been due to the fact that the vehicles could be
losing radiant heat at night. This effect is less
clear during journey times due to the
ventilation produced by the movement of the
vehicles.
The differences observed during the
movement of the vehicles between the front
sensor and the back sensor in the upper part of
the vehicles can be explained by lower
pressure behind the vehicle which was
generated by the movement of the vehicle
which sucks air from outside into the back of
the animal compartments.
Duration (hours)
Ave
rage
tem
pera
ture
hum
idity
ind
ex

Transport temperatures observed during the commercial Gianluca Fiore, Johann Hofherr, Fabrizio Natale,
transportation of animals Sergio Mainetti & Espedito Ruotolo
26 Vol. 48 (1), Vet Ital www.izs.it/vet_italiana © Istituto G. Caporale 2012
The fact that on average the lower part of the
compartments has temperatures that are below
those recorded outside indicates an effect of
insulation of the vehicle against higher
external temperatures.
The effects described on the inside
temperatures indicate that the location of the
worst climatic conditions within the animal
compartment change due to a number of
factors (e.g. if low or high temperatures are
considered, time of the day, external
temperature, presence of the animals).
In general, there is a strong correlation
between the four sensors in a mono‐volume
vehicle with only one tier as used for example
in the transportation of horses. In multi‐tier
vehicles, a strong correlation is observed
between the sensors on the same tier, but
much less is seen between sensors in the upper
and lower tiers. Correlation of temperatures in
a truck and its trailer was weaker than within
the semi‐trailer. These findings indicate the
importance of the position of temperature
sensors. Only with a positioning of sensors
based on objective criteria would it be possible
to have a good representation of the
temperature conditions which are present in
the different parts of the vehicle and to
compare the data from different vehicles.
Presence of animals
The increased temperatures in the front lower
part of vehicles, linked to the presence of
animals, could be caused by lower ventilation
in that area compared to the back and upper
parts.
The finding that the animals were not
contributing much to the internal temperature
when external temperatures exceeded 20°C
may be due to the fact that in warm conditions,
animals have more problems to transfer heat to
their surrounding. The highest increase in
temperature observed in the front lower part
of the vehicles with pigs up to 30 kg body
weight may be explained by the higher loading
density and/or higher caloric transmission of
the piglets to their surroundings.
With regard to the number of animals loaded,
information was obtained for each journey.
However, without more precise information
on how the load was distributed within the
vehicles, a correlation between loading density
and temperatures measured in the different
parts of the vehicle could not be established.
Variation of relative humidity
The negative correlation between temperature
and humidity shows that under climatic
conditions in which the journeys were made,
there were only few cases with high
temperature and high relative humidity and
that these few cases were limited in duration.
The decrease in humidity observed during
animal journeys can be explained by higher
ventilation during movement of the vehicle.
Temperatures recorded in relation to
thresholds
The overall picture regarding temperatures
recorded above the upper and below the lower
threshold shows a large number of animal
journeys with at least one non‐compliant
temperature record. The temperature
thresholds proposed in the EFSA opinion
would result in a higher percentage of non‐
compliant conditions, which was more
prominent at the lower temperature threshold.
When analysing the temperature data for all
animal journeys in regard to the consecutive
duration and the out‐of‐range values, it can be
shown for both the upper and lower
thresholds that the vast majority of non‐
compliant temperatures recorded against the
thresholds in Regulation (EC) 1/2005 last less
than 2 h during the journey with average
temperatures of just 1°C‐2°C over the threshold.
According to our findings, we believe that it is
not fully appropriate to take into account the
temperature values only, but this must be
considered with the duration of the out‐of‐
range values (for instance, non‐compliant
temperature values lasting for 2 h or 3 h, rather
than single events) and the THI values.
When non‐compliant events for a consecutive
period of less than 2 h are excluded, the
percentage of non‐compliant journeys against
EFSA thresholds would decrease from 40% to
17% for the upper limits and from 58% to 44%
for the lower limits.

Gianluca Fiore, Johann Hofherr, Fabrizio Natale, Transport temperatures observed during the commercial
Sergio Mainetti & Espedito Ruotolo transportation of animals
© Istituto G. Caporale 2012 www.izs.it/vet_italiana Vol. 48 (1), Vet Ital 27
With respect to the 30°C threshold, the out‐of‐
range temperatures were more frequent in pigs
weighing up to 30 kg and in sheep >6 months
of age and could be linked to a higher loading
density and/or higher heat transmission of the
piglets to their surroundings and to the fact
that most sheep journeys were recorded
during the summer.
Setting the upper thresholds at a lower level as
proposed by EFSA would cause a sharp
increase in non‐compliant journey times for
pigs >30 kg body weight from approximately
6% to 25% and in sheep >6 months of age from
13% to 21% when compared with 30°C. For
cattle, the thresholds proposed by EFSA would
be different only at a humidity level that
exceeded 80%; this did not occur frequently in
the period recorded. Indeed, the percentage of
non‐compliance would not change much
compared to the 30°C threshold.
With the higher temperatures proposed for the
lower threshold by EFSA, the times of out‐of‐
range temperatures would increase
substantially for pigs weighing up to and
above 30 kg and in sheep aged ≤6 months. In
pigs ≤30 kg the non‐compliant times would
increase from below 20% to over 55%, in pigs
>30 kg from approximately 18% to 36%, in
sheep ≤6 months from 12% to nearly 40% when
compared with 5°C. Changing the lower
threshold from 5°C to 0°C in cattle over
6 months of age, out‐of range temperatures
would fall from approximately 10% to
approximately 2% (Figs 8 and 11).
The values of non‐compliance in goats with
respect to the lower threshold should be read
with caution due to the very few journeys
recorded for this species.
Temperature humidity index
When analysing THI values exceeding 74 in
regard to their consecutive duration, it can be
observed that only in few cases did a high THI
last for more than 10 h. In cattle, for values
exceeding 75, stress‐limiting measures, such as
increased ventilation, should be considered.
Values exceeding 79 are considered to be
dangerous for cattle if exposed to these values
over days with insufficient adaptation time (5,
10). While thresholds for the THI have been
established for cattle, very little information is
available for other species in respect to
acceptable THI values and duration.
Impact on the trade flows
Given the main flows of livestock between
northern and eastern areas of Europe on the
one hand and middle and southern Europe on
the other, both the upper and the lower
temperature limits are of concern for trade.
Regarding seasonal distribution, April, May,
September and October showed less than 10%
of non‐compliant journeys against the
thresholds of 5°C and 30°C. When applying a
tolerance of ±5°C to the thresholds in August
and December, approximately 5% and in
January approximately 18% of journey times
were not compliant. During the rest of the
year, less than 5% of journey times were not
compliant.
Applying the limits proposed by EFSA, 20% or
less of journey times would be non‐compliant
under the present transport conditions in
April, May, September and October.
Applying the limits proposed by EFSA, pigs
≤30 kg, sheep ≤6 months of age and pigs >30 kg
showed the highest levels of non‐compliance
in journey times in respect to the lower
thresholds (between 35% and 55% of non‐
compliant journey times). For the upper EFSA
thresholds, between 20% and 25% of journey
times for sheep >6 months of age and pigs
>30 kg would be non‐compliant.
As a consequence, under the proposed EFSA
thresholds, the transportation of pigs >30 kg
could result in a high rate of non‐compliant
journeys throughout the year in present
transport conditions. The study indicates that
for pigs ≤30 kg, sheep ≤6 months of age and
probably goats, journeys between April and
October showed a reduced risk of high non‐
compliance rates against EFSA thresholds. In
contrast, for sheep >6 months of age, journeys
could result in a high non‐compliance rate
between May and September. For cattle, the
EFSA limits would increase non‐compliant
occurrences less significantly.
The impact of the EFSA limits on trade along
specific routes cannot be specified. When
studying each category of animals on selected
Transport temperatures observed during the commercial Gianluca Fiore, Johann Hofherr, Fabrizio Natale,
transportation of animals Sergio Mainetti & Espedito Ruotolo
28 Vol. 48 (1), Vet Ital www.izs.it/vet_italiana © Istituto G. Caporale 2012
routes, the number of recorded journeys is
relatively small and the conditions recorded
may not be statistically representative for all
transporters and climatic conditions along the
trade flows. Transporters may also take
additional precautions during the planning
and execution of journeys to reduce the risk of
exceeding temperature thresholds by
improving transport conditions, such as
increased ventilation when internal temp‐
eratures exceed 20°C (2, 3).
Conclusions
Using temperatures recorded during animal
journeys to enforce legal temperature
requirements, the number and position of
sensors must be based on objective criteria to
provide a good representation of the
temperatures in the different parts of the
vehicle and to obtain comparable results from
different vehicles.
With outside temperatures of up to 20°C,
temperature increases in the front lower area
of vehicles can be used to indicate the presence
of animals in the vehicle.
Although there will be journey types and
conditions which were not covered in the
study, our survey clearly indicated that the
temperature thresholds proposed by the EFSA
would result in a higher percentage of non‐
compliant conditions, in particular for the
transportation of pigs that are below 30 kg live
weight and for sheep that are over six months
of age in respect to the high temperature
threshold and of pigs of both weight groups
and sheep below six months of age for the low
temperature thresholds. In regard to the
practical implementation of Regulation 1/2005,
it would be useful to further investigate the
relevance of temperatures beyond the
thresholds stipulated with respect to welfare,
in particular how to assess the impact of values
beyond the thresholds in relation to duration.
Our study places emphasis on providing a
realistic picture of the situation in commercial
animal transport. However, we did not have
full access to information on ventilation
regimes and possibly other measures taken
during the animal journeys to improve animal
welfare conditions. Therefore, no conclusions
can be drawn on the impact of those systems
(i.e. mechanical ventilation and other possible
measures) to alter temperatures (such as
sprinklers) or on the temperatures recorded or
their effectiveness to control acceptable
temperature ranges.
Acknowledgments
The Joint Research Centre would like to thank
the transport companies and the vehicle
manufacturing company Pezzaioli for their
participation and cooperation in this study.
Grant support
The study was financed by Directorate General
for Health and Consumers (DG SANCO) as
part of an administrative arrangement. The
content of this study may not necessarily
reflect the views of the European Commission
and does not influence the final form of any
decision to be taken by the European
Commission.
References
1. Brüser-Pieper C. 2006. Untersuchungen zur thermischen Belastung von Schlachtrindern beim Strassentransport auf Langstecken. Inauguraldissertation, Institut für Tierhygiene, Tierschutz und Nutztierethologie der Tierärztlichen Hochschule, Hannover, 146 pp.
2. Christensen L., Blaabjerg L. & Hartung J. 2007. Investigation of pig transports for more than 8 hours in cold and warm weather conditions and of the requirements for ventilation during transport, Report 24 July 2007, Project No.: DS02770, SF: 42875.1, LCh/LOB/ML. Danish Meat Association, Copenhagen, 81 pp.
3. Christensen L. & Jonsson K. 2007. Optimization of transport conditions in relation to transport mortality. Report, 1 April 2007, Project No.: 02763, 40329.1, LCh/ML. Danish Meat Association, Copenhagen, 32 pp.
Gianluca Fiore, Johann Hofherr, Fabrizio Natale, Transport temperatures observed during the commercial
Sergio Mainetti & Espedito Ruotolo transportation of animals
© Istituto G. Caporale 2012 www.izs.it/vet_italiana Vol. 48 (1), Vet Ital 29
4. Dalla Villa P., Iannetti L., Di Francesco C., Di Pasquale A., Fiore G. & Caporale V. 2008. Quality management for the road transportation of livestock. Vet Ital, 44 (1), 187-200.
5. Esmay M.L. & Dixon J.E. 1986. Environmental control of agricultural buildings. The AVI Publishing Company, Inc., Westport, Connecticut, 287 pp.
6. European Council 2005. Council Regulation (EC) No. 1/2005 of 22 December 2004 on the protection of animals during transport and related operations and amending Directives 64/432/EEC and 93/119/EC and Regulation (EC) No. 1255/97. Off J, L 003, 05.01.2005, 1-37 (eur-lex.europa.eu/ LexUriServ/LexUriServ.do?uri=celex:32005r0001:en:html accessed on 14 February 2012).
7. European Food Safety Authority (EFSA) 1999. Standards for the microclimate inside animal transport road vehicles, Report of the Scientific Committee on Animal Health and Animal Welfare. Adopted 8 December 1999. Health and Consumer Protection Directorate-General, European Commission, Brussels, 33 pp.
8. European Food Safety Authority (EFSA) 2004. Standards for the microclimate inside animal road transport vehicles. EFSA J, 122, 1-25.
9. Gavinelli A., Ferrara M. & Simonin D. 2008. Formulating policies for the welfare of animals during long distance transportation. Vet Ital, 44 (1), 71-86.
10. Hahn G.L. 1999. Dynamic response of cattle to thermal heat loads. J Anim Sci, 77, 10-20. 11. Kettlewell P., Mitchell M., Harper E., Villarroel M. & Levrino G.M. 2005. Thermal environments within
transport vehicles, Sweden. In Proc. Nordic Association of Agricultural Scientists Seminar No. 361, 21-22 November, Alnarp. Nordic Association of Agricultural Scientists, Alnarp, 24-33.
12. Krafft J. 2005. Climate in animal transport vehicles with fattening pigs during summer – a comparison between natural and mechanical ventilation. PhD thesis, No. 18, Swedish University of Agricultural Sciences, Department of Agricultural Biosystems and Technology, Alnarp, 76 pp.
13. Ministry of Agriculture, Fisheries and Food (MAFF) of the United Kingdom 2002. Long distance road transport of farm animals – Final Project Report, CSG 15. MAFF project code AW0808. Department for Environment, Food and Rural Affairs (DEFRA), London, 74 pp. (randd.defra.gov.uk/Document. aspx?Document=AW0808_3118_FRP.pdf accessed on 13 February 2012).
14. Saellvik K., Krafft J., Svendsen J., Jeppsson K-H., Gustafsson G. & Rantzer D. 2005. Experiences from studies of pig transport during summer in Sweden. In Proc. Nordic Association of Agricultural Scientists Seminar No. 361, 21-22 November, Alnarp. Nordic Association of Agricultural Scientists, Alnarp, 75-83.
15. Thom E.C. 1959. The discomfort index. Weatherwise, 12, 57-59. 16. Villarroel M. 2006. Behavior of pigs and lambs during 8 hour journeys in hot climates. In Proc. Animal
Air Transportation Association (AATA) conference, 23-26 April, Amsterdam. AATA, Amsterdam, 20 pp (www.animaltransportationassociation.org/conference/2006Amsterdam/AMS2006_proceedings7.htm accessed on 14 February 2012).
17. Warriss P.D., Brown S.N., Knowles T.G., Wilkins L.J., Pope S.J., Chadd S.A., Kettlewell P.J. & Green N.R. 2006. Comparison of the effects of fan-assisted and natural ventilation of vehicles on the welfare of pigs being transported to slaughter. Vet Rec, 158 (17), 585-588.
18. Wikner I., Gebresenbet G. & Nilsson C. 2003. Assessment of air quality in a commercial cattle transport in Swedish summer and winter conditions. Dtsch Tierarztl Wochenschr, 110 (3), 100-104.