transportation accountability commission · thomas g. jewell, president and owner ... m. siddique...
TRANSCRIPT
Final Report of the
Transportation Accountability Commission
TO THE GOVERNOR AND THE GENERAL ASSEMBLY OF VIRGINIA
OCTOBER 2007

i
Commission Members
James Squires (Chairman), Executive Vice President of Finance, Norfolk Southern Corporation; Young Ho Chang (Vice Chairman and Chairman of the Outcome Measures Subcommittee),
Senior Vice President of ATCS, PLC; Mark B. Goodwin (Chairman of the Performance Standards Subcommittee), Senior Vice
President of UPS Freight; The Honorable Charles C. Allen, Vice Mayor of the City of Newport News; Georjeane L. Blumling, Vice President of Marketing and Public Affairs for AAA Tidewater
Virginia; The Honorable Henry L. Connors Jr., member of the Spotsylvania County Board of
Supervisors and Vice President of Government and Public Affairs for CIT; Mortimer L. Downey III, Chairman of PB Consult, Inc.; Kimberly A. C. Enochs, SPHR, Senior Vice President of Rutherfoord; Douglas R. Fahl, Executive Vice President of Dewberry & Davis, LLC; Gary W. Fenchuk, President of East West Partners of Virginia, Inc.; Geraldine Holmes, State Coordinator for Advocacy, AARP Virginia, State Office; Thomas G. Jewell, President and Owner of Carter Braxton Real Estate; John M. Lewis Jr., Chief Executive Officer of the GRTC Transit System; Mark R. Merhige, President of Shockoe Properties, Inc.; Hugh E. Montgomery Jr., Executive Director of the Institute for Defense and Homeland
Security; Dr. Rosemarie A. Pelletier, President and founder of Public Private Solutions, Inc.; M. Siddique Sheikh, Owner of the Alexandria Service Center, Inc.; The Honorable Sally H. Thomas, Member of the Albemarle County Board of Supervisors; The Honorable Hunter R. Watson, First Vice President, Davenport Company LLC and former
member of the Prince Edward County Board of Supervisors; James C. Wheat III, Managing Partner of Colonade Capital, LLC; Blair Williamson, President of S.L. Williamson Company, Inc.
Commission Staff
Ralph M. Davis, Deputy Secretary of Transportation Dr. Mary Lynn Tischer, Director of Multimodal Transportation Planning Office Katherine A. Graham, Multimodal Transportation Planning Office Michael L. Garrett , Virginia Department of Transportation Keith R. Wandtke, Virginia Department of Transportation

ii
Acknowledgements The Transportation Accountability Commission (TAC) is grateful to those transportation executives who were able to personally present information about their respective agencies along with their insights on transportation performance management and accountability. The Commission thanks Director Randall Burdette of the Department of Aviation, Deputy Commissioner Karen Chappell of the Department of Motor Vehicles (DMV), Deputy Commissioner David Mitchell of DMV, Deputy Executive Director Jeff Keever of the Virginia Port Authority, Director Matthew Tucker of the Department of Rail and Public Transportation (DRPT) and Corey W. Hill, DRPT’s Director of Administration and Capital Projects, Commissioner David Ekern of the Virginia Department of Transportation (VDOT) and Connie Sorrell, VDOT’s Chief of Systems Operations. The Commission would also like to thank Lance Neumann, President of Cambridge Systematics for his insight on national trends and best practices in transportation performance management. Irene Rico of the Federal Highway Administration provided a much appreciated insight into federal performance management practice. The Commission thanks Cristy King of the Virginia Department of Planning and Budget and Tim Bass of the Office of the Governor for their discussions of recent performance management initiatives established during Governor Kaine’s administration. The land use discussion proved to be very challenging and the Commission was aided greatly by reports and discussions from Larry Marcus of ATCS, PLC, Robert Griffiths of the Metropolitan Washington Council of Governments, Oliver A. "Trip" Pollard of the Southern Environmental Law Center and Dr. John Miller of the Virginia Transportation Research Council. The TAC would also like to acknowledge Dr. Miller for his work on measuring the impacts on the community of transportation projects.

iii
TABLE OF CONTENTS
Page
Executive Summary 1 I. Introduction 12 II. Recent Successes and Accomplishments 14 III. Recommendations for System-Wide, Overarching Goals and Performance Measures 15 IV. Recommendations for Agency Key Objectives and Performance Measures 27 V. Assessing Community Impacts 30 VI. Other Findings and Recommendations 32 VII. Next Steps 34
Appendices 36 Appendix I. Performance Measures Mandated in Law 37 Appendix II. The Transportation Accountability Commission Interim Report

Transportation Accountability Commission
1
Executive Summary
In October 2006, Governor Timothy M. Kaine issued Executive Order 37, creating Virginia’s Transportation Accountability Commission (Commission). The Commission’s primary responsibilities are to: (i) review existing methods used to measure transportation system performance and agency performance and accountability, (ii) recommend improvements to ensure that the transportation system delivers the maximum value to taxpayers, and that transportation agencies are held accountable for their performance, and (iii) investigate quantifiable measures of the impact on communities of transportation projects. The Commission forwarded an interim report to the Governor and the General Assembly on May 30, 2007. For continuity and ease of use, key findings and all recommendations from the Interim Report have been integrated into this Final Report. The full interim report can be found in Appendix II. Recent Successes and Accomplishments The Commission investigated the operations and management of Virginia’s modal agencies, including the main duties of the three transportation policy boards. They also reviewed and evaluated existing methods to measure performance and accountability, and the state of the practice in other states and the U.S. Department of Transportation (USDOT). The Commission found numerous examples of actions already taken in the Commonwealth at the state and agency levels to enhance transparency and accountability in transportation. Several recent accomplishments are highlighted in this Final Report, including the use of system-wide, overarching goals in the development of the FY2008-2013 Six-Year Improvement Program. System-Wide, Overarching Goals and Performance Measures The identification of overarching goals for the transportation system consistent with broader policy goals for the Commonwealth represents a critical step towards greater transportation accountability for Virginia. At the outset of its investigation, the Commission found that performance measures without goals are meaningless and accordingly is recommending the adoption of system-wide, overarching goals as a prerequisite to the establishment of performance measures. The Commission’s recommendations are grounded in and build upon the transportation goals presented in the Commonwealth’s most recent long-range transportation plan, known as VTrans2025. They provide a basis to align agency actions with broader transportation goals. The goals and associated performance measures reflect characteristics the Commission considers critical to a high-performing transportation system that delivers not only high quality projects and programs but the right projects and programs. Those characteristics mirror the transportation priorities of the Commonwealth, succinctly stated in the transportation mission, which is:
To ensure that Virginia has a transportation system that is safe, enables easy movement of people and goods, enhances the economy and improves our quality of life.

Transportation Accountability Commission
2
The Commission also recognized the importance of the performance measures recommended in the Code of Virginia and has included these among its recommended system-wide performance measures. The Commission’s final recommendations, highlighted below, include seven system-wide, overarching goals and 34 performance measures. In the table below, those measures required by law are italicized. The arrows indicate the desired trend for each measure. Details on the system-wide, overarching goals and measures are in Chapter III.
Table 1. System-Wide, Overarching Goals and Performance Measures
Goal # 1: Safety and Security - To provide a safe and secure transportation system.
Performance Measure Desired Trend
Number and Rate of Fatalities by Mode Number and Rate of Injuries by Mode Compliance with the Maritime Transportation Security Act Percentage of Updated Emergency, Security, and/or Continuity of Operations Plans Goal # 2: System Maintenance and Preservation - To preserve and maintain the condition
of the existing transportation system.
Performance Measure Desired Trend
Percentage of Interstate and Primary Road Pavement in Need of Repair Percentage of Bridges in Need of Repair or Rehabilitation Percentage of Transit Vehicles that Exceed Replacement Age
Transportation Accountability Commission
3
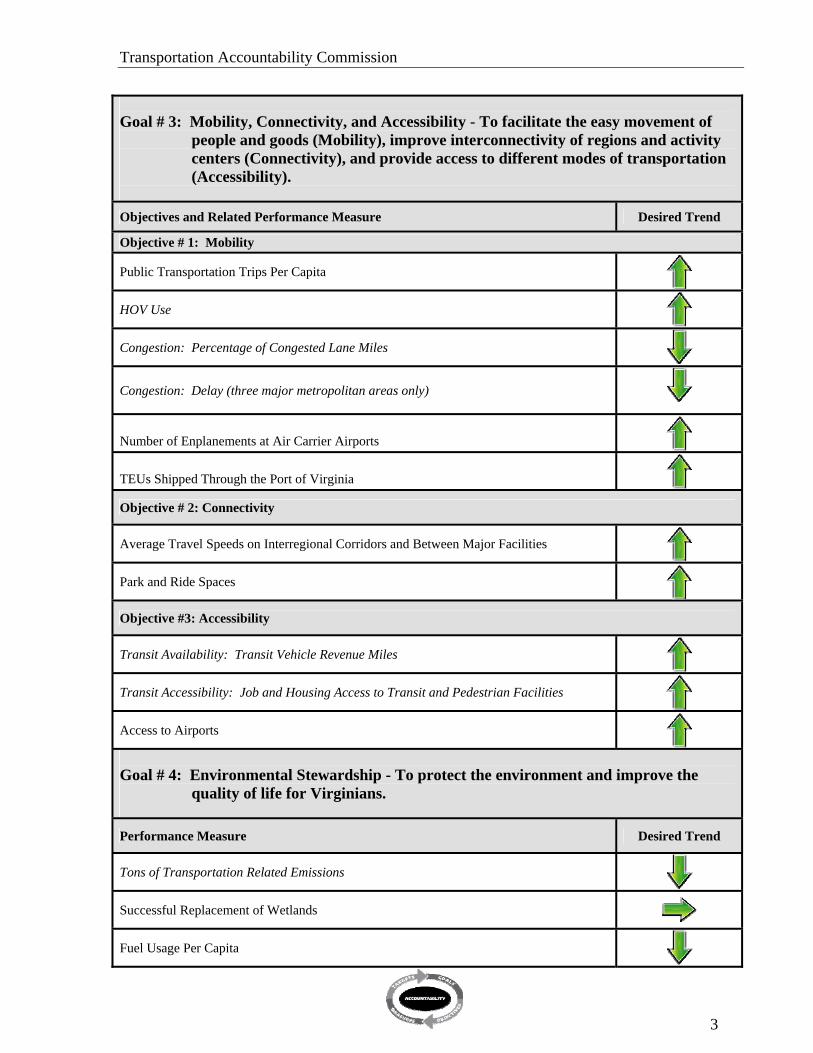
Goal # 3: Mobility, Connectivity, and Accessibility - To facilitate the easy movement of
people and goods (Mobility), improve interconnectivity of regions and activity centers (Connectivity), and provide access to different modes of transportation (Accessibility).
Objectives and Related Performance Measure Desired Trend
Objective # 1: Mobility
Public Transportation Trips Per Capita
HOV Use
Congestion: Percentage of Congested Lane Miles
Congestion: Delay (three major metropolitan areas only)
Number of Enplanements at Air Carrier Airports TEUs Shipped Through the Port of Virginia
Objective # 2: Connectivity
Average Travel Speeds on Interregional Corridors and Between Major Facilities
Park and Ride Spaces
Objective #3: Accessibility
Transit Availability: Transit Vehicle Revenue Miles
Transit Accessibility: Job and Housing Access to Transit and Pedestrian Facilities
Access to Airports
Goal # 4: Environmental Stewardship - To protect the environment and improve the
quality of life for Virginians.
Performance Measure Desired Trend
Tons of Transportation Related Emissions
Successful Replacement of Wetlands
Fuel Usage Per Capita

Transportation Accountability Commission
4
Goal # 5: Economic Vitality - To provide a transportation system that supports economic
prosperity.
Performance Measure Desired Trend
Jobs Created by Transportation Investment
Percent of Transportation Expenditures on Small, Women, and Minority Owned Businesses (SWAM)
Freight Tonnage Originating or Terminating in Virginia
Goal # 6: Program Delivery - To achieve excellence in the execution of programs and delivery of services.
Performance Measure Desired Trend
Customer Service Delivery: DMV Wait Times
On-time / On-budget
Customer Satisfaction with the Transportation System
Goal # 7: Coordination of Transportation and Land Use - To facilitate the effective coordination of transportation and land use plans and decisions to promote livable communities.
Objectives and Related Performance Measure Desired Trend
Objective # 1: Create or Sustain Livable Communities by Increased Use of Transportation Options
Vehicle Miles Traveled by those over Age 16 or per Licensed Drivers
Satisfaction with Transportation Options (Alternatives to Driving)
Objective #2: Preservation and Management of Transportation Corridors
Miles of Limited Access Facilities Relative to Total Miles
Adoption of Access Management Plans by Localities
Objective # 3: Promote Community Development Patterns
Population Density in Urban Development/Metropolitan Areas
Acres of Land Developed Outside of Urban Development/Metropolitan Areas
Regional Jobs/Housing Balance
Transportation Accountability Commission
5
The Commission recommends that Virginia’s transportation policy boards and agencies fully embrace the system-wide, overarching goals and utilize them in making policy decisions. The Commission also recommends that the policy boards or agencies, as appropriate, develop targets for the performance measures, the final element that closes the loop between goals, performance measures and accountability.
Recommendation 1 - The Transportation Boards and Agencies should embrace the overarching goals and performance measures and develop targets as well as strategies to meet those targets.
Recommendation 2 - The Transportation Policy Boards should institutionalize the overarching goals and measures by establishing a process to monitor performance and reevaluate and address requisite changes in goals, measures, targets and strategies.
The Executive Order specifically addressed the relationship between land use and transportation. Attempts to formulate measures to encourage the coordination of land use plans and transportation plans presented challenges and the first five findings summarize the key conclusions from the Commission’s deliberations in this area. Finding 1 - There are no easy measures for coordination of land use and transportation. No standard measures are being used by other states. That is partly due to the local nature of land use decision-making and partly to the difficulty in defining and measuring desirable outcomes. The Commission concluded that good coordination should focus on four objectives or outcomes: 1) Increased Use of Transportation Options, 2) the Promotion of Community Development Patterns, 3) the Preservation and Management of Transportation Corridors, and 4) Consistency of Plans. Finding 2 - There are measures that can be used to estimate progress towards the first three objectives. However, it is difficult to measure consistency of plans. The Commission concluded that consistency should be eliminated as a formal objective mainly because of the difficulty in deriving measures that are effective across the distinct areas in which consistency is important. Finding 3 - Many land use performance measures need to be estimated at regional or local levels. The Commission realizes that there is no clear standard for what constitutes good coordination; it will vary by region. Regional and community differences are extremely important and what would be acceptable or desirable in one location may not be in another. Additionally, some measures, such as jobs-housing balance, are not meaningful at a state level. Agency Key Objectives and Performance Measures System-wide, overarching goals and performance measures provide taxpayers and other transportation stakeholders with a means to assess the performance of the transportation system but do not directly address the performance of an individual agency or the accountability of an

Transportation Accountability Commission
6
agency’s chief executive. Agency-specific key objectives and performance measures address the latter issue - although system-wide performance goals and measures and agency goals and measures overlap (e.g. safety is a system and agency goal). Agency key objectives represent the desired outcomes for the agency’s major programs, reflect the principles inherent in the agency’s mission and provide the vehicle to drive results throughout the agency. Table 2 presents the Commission recommendation for Agency key objectives and performance measures. The Commission’s deliberations on agency key objectives and performance measures resulted in the following findings and recommendations: Finding 4 - To maximize their effectiveness, several of the current performance measures require the joint effort of multiple agency heads (for example, reducing the number of fatalities).
Recommendation 3 - Develop shared objectives and performance measures among multiple agency heads when a performance measure is beyond the span of control of an individual agency head.
Finding 5 - Performance measurement targets have been established for many of Virginia’s key measures, but they are typically set for 2010. Effective targets will have both short-term and long-term milestones. Without incremental milestones against which progress can be measured, long-term targets may never be met. Commission members further indicated that stretch targets/goals should be created without punishment for failure of full achievement.
Recommendation 4 - Develop stretch targets for agency heads and set interim performance targets.
Finding 6 - The process used to evaluate the performance of agency executives captures agency operations and outcomes but does not directly address agency heads’ leadership abilities in driving their agency toward desired outcomes.
Recommendation 5 - Include a qualitative leadership component in the agency head performance review process. Leadership includes but is not limited to:
• Championing the Governor’s priorities; understanding the importance of goals and relationships
• Communicating the agency’s mission, vision and shared values • Leading by example • Acting in a professional and ethical manner within and outside the agency • Managing shifting priorities; making tough calls; delivering on promises • Interacting effectively with diverse constituency groups, including General
Assembly members, boards and public and government officials • Promoting client/customer service
Finding 7 - Executive pay incentives should be given greater consideration as a performance management tool. The Commission acknowledged that government agency heads are motivated by the desire to provide public service and support the Governor. There was also

Transportation Accountability Commission
7
recognition, based on their collective experiences, that bonus pay might also play an important role.
Table 2. Agency Key Objectives and Performance Measures
Agency Key Objectives Measures Desired Trend
Decrease Number of Traffic Fatalities Number of Fatalities
Provide Reasonable Customer Service Wait-time Wait-time for Majority of Customers
DMV
Reduce Number of Interactions Between Citizen and DMV
Average Number of Interactions to Complete a Single Transaction
Number of Enplanements Increase Aviation Utilization
Economic Activity Generated
DOAV
Provide Financial Assistance for Airport Development Ratio of Grants Executed to Allocation
Public Transportation Trips Per Capita Manage Congestion
Percentage of Freight Shipped by Rail
Deliver Economic Benefits
Number of Jobs Created and Maintained through Transit and Rail Initiatives
DRPT
Deliver Social Benefits Transit Ridership by Elderly, Disabled and Low Income Citizens
Decrease the Number of Traffic Fatalities Number of Fatalities
Condition Pavement/Bridge Condition
Performance Annual Hours of Delay (congestion)
VDOT
Management Projects On-Time/On-Budget
Enhance Port-Related Business Number of Port-Generated Jobs
Increase Goods and Services Shipped through Port
Number of Containers (TEUs)
VPA
Enhance Cargo Handling Efficiency Containers Per Acre/Per Year

Transportation Accountability Commission
8
Recommendation 6 - Utilize or amend provisions currently available in the Appropriation Act to provide opportunity for additional compensation and incentives when executive performance expectations are exceeded.
Finding 8 - Whether pertaining to executive or agency performance goals, lessons learned frequently are not carried forward because of the one-term gubernatorial system in Virginia.
Recommendation 7 - Develop legislative or administrative plans to foster longevity in performance measurement processes and lessons learned. Institutionalizing lessons learned will create staying power from one administration to another.
Assessing Community Impacts Executive Order 37 directs the Commission to determine whether there are quantifiable ways to measure the impacts of transportation projects on the community. The answer is yes, transportation professionals have been evaluating the effects and potential effects of projects on the economic, environmental and social systems for decades. Planning studies focus on the identification of transportation problems and potential solutions and include some analysis of community issues. In the project development phase, both potential positive and negative effects of projects are examined in more detail. For large, federally funded projects, environmental impact statements (EIS) are prepared containing detailed estimates of potential change to the human or ecological environment. In addition to ecological effects (water, wetlands, air quality), impacts on the human environment are also assessed. EIS’s are prepared for projects that are usually large, expensive and/or controversial. Typically, the EIS and state environmental work occur during the preliminary engineering stage of a project. By identifying these issues earlier in the planning phase, the process can be streamlined and deliberations more informed. The main disadvantage to pursuing a strategy of estimating impacts earlier in the planning stage is the possible lack of information to make good estimates. The Commission’s investigation into this area led to the following findings and recommendations. Finding 9 - Typically, considerable emphasis is placed on negative community impacts, especially early in project development.
Recommendation 8 - More effort should be placed on balanced reporting of positive and negative community impacts.
Finding 10 - The Commission believes that key stakeholders and the community, as a whole, would benefit if potential impacts were known earlier.
Recommendation 9 - Evaluate impacts at an earlier stage in the project development process.
Transportation Accountability Commission
9
Finding 11 - Community impacts can only be evaluated at the community or local level. Thus, it is important to coordinate the estimation of impacts with local officials and the surrounding community.
Recommendation 10 - The Commonwealth should partner with local governments to identify community impacts.
Finding 12 - The application of Context Sensitive Solutions (CSS) is growing among state and federal transportation entities.
Recommendation 11 - Encourage the continued development and use of Context Sensitive Solutions.
Other Findings and Recommendations Several ancillary issues arose during deliberations that the Commission determined to be related to the development of a comprehensive performance management process and a high performing transportation system. These issues include the project selection process, public awareness, the level of transportation investment and the need to address senior mobility. Project Selection The system-wide goals represent characteristics that the Commission considers critical to delivering a high performing transportation system. To maximize the value of the Commonwealth’s transportation investments, it is not only important to complete projects on time and within budget but to also choose projects that support system goals. The Commission also concluded that the application of an objective methodology to the project selection process would provide information to ensure that the most needed projects receive funding. Finding 13 - Goals and outcome performance measures are essential elements for accountability. However, the mix of projects selected and implemented is critical to the success of the overall transportation program.
Recommendation 12 - Use an objective methodology based on a set of overarching goals as a tool to assist in project selection.
Public Awareness The Commission believes that transportation agencies could improve their efforts to enhance public awareness. Improved public awareness increases accountability and could influence the public’s view of transportation agencies and the resources needed for transportation. The Commission believes that transportation agencies can enhance efforts to educate the public and better coordinate with stakeholders regarding agency activities. Finding 14 - Transportation agencies have not done an adequate job of communicating with and educating the public.
Transportation Accountability Commission
10
Recommendation 13 - Develop new strategies for informing the public and provide better communication between transportation agencies and their stakeholders.
Transportation Investment The Commission believes that the adequacy of transportation funding will remain an ongoing issue for the Commonwealth. One way to provide enhanced justification for requested transportation resources is to identify the level of performance that could be achieved given different levels of funding. In this way, resources are linked to performance. This approach could provide for a more effective rationale for requesting additional transportation funds and could help to better inform transportation planning efforts. Finding 15 - The 2007 transportation initiative (HB 3202) represents an important step forward in addressing transportation needs. However, the adequacy of transportation investments will be an ongoing issue, and resources should be linked to performance in future planning and funding initiatives.
Recommendation 14 - Develop and incorporate methods of linking requirements and resources to performance and the benefits achieved in future planning and funding initiatives.
Senior Mobility The rapidly increasing senior citizen population in Virginia represents a transportation challenge for the Commonwealth. In particular, senior citizens will face increased difficulty moving from place to place due to aging and health concerns. The Commission does not believe that Virginia’s transportation system is currently equipped to deal with this growing problem. Finding 16 - The Commonwealth’s transportation program does not adequately address the mobility needs of the rapidly growing senior population.
Recommendation 15 - Utilize the social benefits key objective and performance measure developed by the Department of Rail and Public Transportation to serve as a basis for allocation of funds to address the needs in this area.
Next Steps The above findings and recommendations complete the mandate to the Commission as described in Executive Order 37. The Commission offers the following “next steps” as suggestions of how the recommendations might be implemented and transportation performance and accountability enhanced further in the Commonwealth:
• Implementing the Commission’s Recommendations - The Office of Intermodal Planning and Investment may be the appropriate entity to monitor and report the progress in implementing the recommendations in this report. The Office has a mandate to coordinate multimodal planning solutions for the Six-Year Improvement Plan and to provide solutions that link existing systems.
Transportation Accountability Commission
11
• Fold the Commission’s goals and outcome performance measures into the next update to the Transportation Performance Report - In 2007 the Office of Intermodal Planning and Investment released Virginia’s first Transportation Performance Report. Virginia Code requires the annual production of this report, which is designed to monitor the performance and condition of Virginia’s transportation system. The report is organized around the system-wide goals and measures developed in VTrans2025, and should be updated with the goals and measures developed by the Commission.
• Develop regional goals and performance measures that are comparable to those
developed for the state - The Commission’s research and deliberations led to the conclusion that there are many instances where regional differences are important when establishing targets.
• Institutionalize an ongoing process of review and update of indicators • Develop a consumer-centric website to communicate with the public
– VaPerforms could be used as model – Could take the name, MY-VDOT – Citizen input essential
The Commission found that the performance management initiatives, including those herein, address the needs of policy makers. To aid in making these recommendations more useful to the general public, the Commission offers for further exploration the MY-VDOT concept. MY-VDOT would address the informational needs of the traveling public. MY-VDOT would provide a user-designed link to each transportation agency website and to sites such as Virginia Performs. The site should also allow citizens to request information specific to the region in which they live. The user should have access to real time local traffic information. Those are examples of the type of information that may be included, but it is important to get input from the public to ensure that the website contains information that is important to them.
Transportation Accountability Commission
12
I. Introduction
In October 2006 Governor Timothy E. Kaine issued Executive Order 37 establishing the Transportation Accountability Commission (the Commission). The primary responsibilities of the Commission were to:
1. Review Virginia’s existing methods of promoting accountability and performance in transportation.
2. Identify and recommend national best practices in accountability and performance for transportation.
3. Recommend quantifiable outcome measures for the major elements of the state’s transportation program, including measures that incorporate effective land-use and transportation coordination.
4. Recommend performance standards for state transportation executives and agencies.
Executive Order 37 also asked the Commission to address whether there were quantifiable ways to measure a transportation project’s positive and negative impacts on the community. In May 2007 the Commission published its Interim Report, summarizing the Commission’s deliberations and findings on performance management principles and best practices. The Interim Report also provided a series of recommendations related to accountability practices for Virginia’s transportation executive leadership. Key findings and all of the recommendations from the Interim Report have been integrated into this report. The full Interim Report can be found in Appendix II. This report reflects the final deliberations and recommendations of the Commission. It focuses on system-wide, overarching goals, objectives and performance measures. The Commission strongly recommends that the overarching goals and performance measures serve as the strategic focal point for the transportation system and be utilized to inform project selection. By so doing, not only are quality programs and projects delivered, but the right programs and projects are selected. Institutionalizing the performance management process will further ensure a high-performing transportation system and transportation executive and agency accountability. In addition the Commission prepared recommendations on several topics related to transportation performance management that are not outlined in the Executive Order. Organization of Report Chapter II presents a brief summary of recent accomplishments and successes. Chapter III presents the Commission’s recommendation for system-wide goals, objectives and performance measures. Recommendations on measuring executive performance, agency key objectives and performance measures are presented in Chapter IV. Chapter V summarizes the Commission’s findings regarding measures for quantifying community impacts of transportation projects. The Commission’s research and deliberations produced several recommendations that are related to transportation performance management but were not outlined in the Executive Order. Chapter VI presents those additional findings and recommendations. Closing observations and

Transportation Accountability Commission
13
the Commission’s views on steps to be taken next are presented in Chapter VII. Appendix I presents a table of all performance measures currently required by law. A second appendix contains the Commission’s May 2007 Interim Report.
Transportation Accountability Commission
14
II. Recent Successes and Accomplishments
In recent years Virginia established several initiatives to hold state agencies responsible for their performance and to increase the transparency of government. In 2006, the Council on Virginia’s Future launched Virginia Performs, which is a website that identifies a vision for Virginia’s future and tracks long-term goals across the main sectors (including transportation) affecting the quality of life and performance of government in the Commonwealth. Virginia Performs’ transportation goal has been adopted as the mission for the Secretary of Transportation and Virginia Department of Transportation (VDOT), and the transportation performance measures reported on Virginia Performs are key measures for VDOT. Legislation enacted in 2007 requires the Commonwealth Transportation Board, the Hampton Roads and the Northern Virginia Regions to adopt transportation performance measures. The Commission reviewed and incorporated the mandated measures into its final recommendations. In 2002 the General Assembly established an Intermodal Office, the purpose of which is to improve multi-modal planning and coordination. Among its accomplishments was the publication of the first Virginia Transportation Performance Report. This report describes the condition and performance of the Commonwealth’s transportation system and will be updated annually. Transparency and accountability are also advanced by programs such as the Dashboard, a web-based tool designed to track the daily progress of individual road projects. Originally designed to track and report on VDOT maintained projects, the Dashboard now includes localities, at their option. Recent enhancements also involve the reporting of VDOT planned versus actual expenses and safety measures such as Virginia’s crash rates. DRPT provides DRPT Connections, which tracks performance of projects. VDOT also publishes the Quarterly Report Card. This report is accessible to the public through VDOT’s public website. Print copies of the report are routinely distributed to members of the General Assembly and local government administrators. It provides a snapshot of how well current projects are meeting their schedules and budgets. In 2002 Virginia’s General Assembly passed legislation that resulted in the development and implementation of the multimodal long range transportation plan, VTrans2025, which included the adoption of the transportation system mission, goals, objectives and measures. The Commission found that linking project selection to overarching goals was a key characteristic of high-performing transportation agencies, and a recent milestone was the use of the VTrans2025 system-wide goals in the development of the FY2008-2013 Six-Year Improvement Program. For the first time a number of projects were chosen, based on their scores relative to the system-wide goals. These goals were also the foundation for the Commission’s deliberations and recommendations for system-wide goals and measures presented in Chapter III.
Transportation Accountability Commission
15
III. Recommendations for System-Wide, Overarching Goals and Performance
Measures
The identification of system-wide, overarching goals for the transportation system represents a critical step towards greater transportation accountability in Virginia. In order for goals to be considered useful, they should be clearly linked to specific performance measures, which can be employed to determine progress towards stated objectives. Once performance measures have been articulated, transportation agencies need to develop specific strategies designed to improve performance for each identified measure. This strategy development is an agency’s responsibility and provides a roadmap to meet the goals. The aim of performance measurement is to introduce accountability into the system and to ensure that expectations are understood and shared. It is a tool to enable assessments of programs. As is discussed later, the Commission has recommended that executives identify “stretch” targets that the agencies strive to meet. Not meeting the target should not necessarily be construed as a failure, but may be a warning that the strategies an agency head has developed are not working optimally and should be revisited. The utility of performance measurement is to alert the agency and the public regarding the success of the strategies in meeting the goals and to provide information to revise strategies when necessary. The Commission has identified seven overarching goals for the transportation system in Virginia and 34 specific performance measures associated with those goals. The goals and associated performance measures reflect characteristics the Commission considers critical to a high-performing transportation system that delivers not only high quality projects and programs but the right projects and programs. Those characteristics mirror the transportation priorities of the Commonwealth, succinctly stated in the transportation mission, which is:
To ensure that Virginia has a transportation system that is safe, enables easy movement of people and goods, enhances the economy and improves our quality of life
The remainder of this chapter presents each goal, followed by a table showing the performance measures associated with that goal. The arrows in the table reflect the desired direction for these measures. An upward pointing arrow means that the desired trend is a continuing increase; if the arrow points downward, the desired trend is for decreasing movement. When the arrow is pointing sideways, the desired result is maintenance of the status quo. The Commission recognized the importance of the performance measures required by law and have included those among its recommended system-wide performance measures. In the tables below, those measures required by law are italicized. All of the measures required by law are presented in a single table in Appendix A. The Executive Order specifically addressed the relationship between land use and transportation. Attempts to formulate measures to encourage the coordination of land use plans and transportation plans presented challenges, which, along with related objectives and measures, are discussed in greater detail below.

Transportation Accountability Commission
16
Goal # 1: Safety and Security - To provide a safe and secure transportation system. There is no more fundamental responsibility of transportation agencies and officials than to provide for the safety and security of the traveling public. A lack of transportation safety and/or security can result in severe negative consequences, including accidents, fatalities, injuries, and property damage. Transportation agencies can help to protect citizens from such dangers. This goal aims to ensure that the transportation system provides the safest roads, buses, trains and airports, and that travelers and commuters are safe and secure while using the system. Goal # 1: Safety and Security Performance Measure Desired Trend Number and Rate of Fatalities by Mode Number and Rate of Injuries by Mode
Compliance with the Maritime Transportation Security Act
Percentage of Updated Emergency, Security, and/or Continuity of Operations Plans
Number and Rate of Fatalities by Mode / Number and Rate of Injuries by Mode The number and rate of fatalities on Virginia’s highways are currently published by the Department of Motor Vehicles (DMV). Although the fatality rate had been declining for a number of years, the number of fatalities has continued to increase. Clearly, it is desirable to develop strategies that will lead to a continuing decline in the fatality and injury rates. The Commission recommends tracking these measures by mode of transportation. Compliance with the Maritime Transportation Security Act The Maritime Transportation Security Act, which identifies requirements for ensuring port security, was signed into law in 2002 to protect the nation’s ports and waterways. “Compliance with the Maritime Transportation Security Act” would measure the extent to which the requirements of the Act have been met. The Virginia Port Authority (VPA) collects this information currently. Continued compliance with the Maritime Transportation Security Act is the desired result. Percentage of Updated Safety, Security, and/or Continuity of Operations Plans This measure involves updates for three sets of security and emergency plans:
1. Virginia requires state transportation agencies to maintain updated Emergency, Disaster, and Evacuation plans. Additionally, the Federal Transit Administration identifies updated security and emergency management plans on its list of “Top 20 Security Program Action Items for Transit Agencies.”
Transportation Accountability Commission
17
2. The Voluntary Security Certification Program identifies a set of minimum security measures for general aviation airports.
3. Virginia executive branch agencies are required to update Continuity of Operations Plans
annually. The plans should conform to the template created by the Virginia Department of Emergency Management.
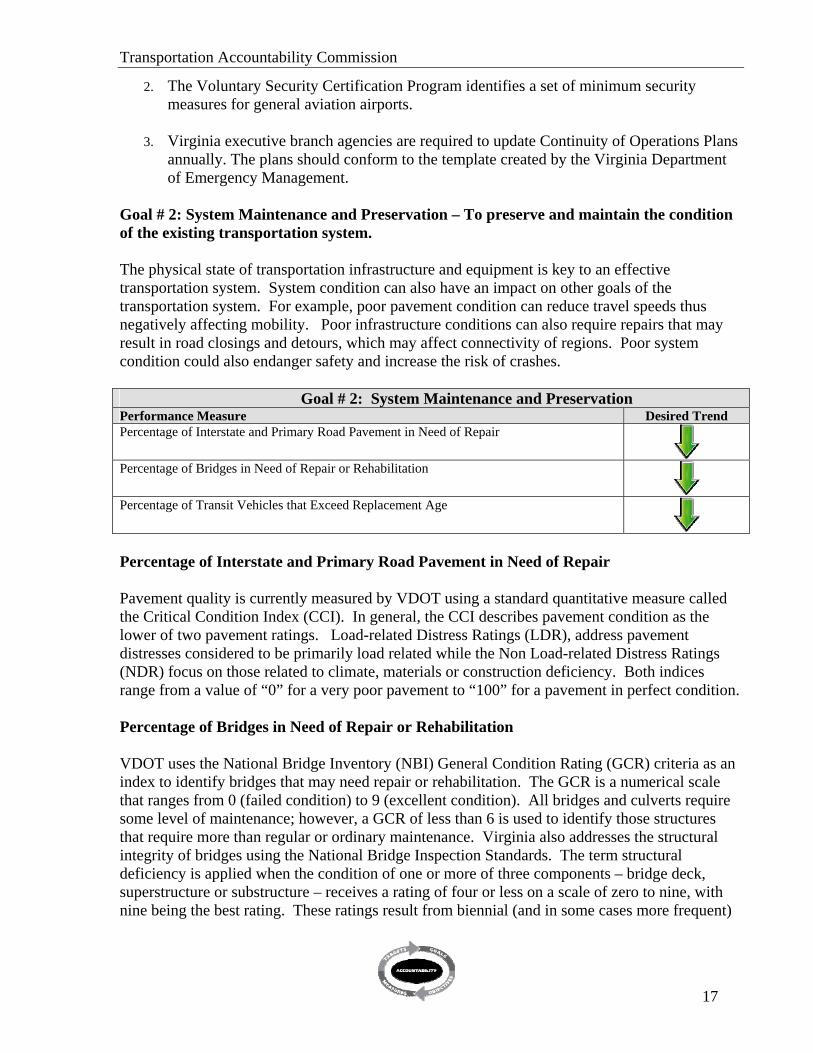
Goal # 2: System Maintenance and Preservation – To preserve and maintain the condition of the existing transportation system. The physical state of transportation infrastructure and equipment is key to an effective transportation system. System condition can also have an impact on other goals of the transportation system. For example, poor pavement condition can reduce travel speeds thus negatively affecting mobility. Poor infrastructure conditions can also require repairs that may result in road closings and detours, which may affect connectivity of regions. Poor system condition could also endanger safety and increase the risk of crashes.
Goal # 2: System Maintenance and Preservation Performance Measure Desired Trend Percentage of Interstate and Primary Road Pavement in Need of Repair
Percentage of Bridges in Need of Repair or Rehabilitation
Percentage of Transit Vehicles that Exceed Replacement Age
Percentage of Interstate and Primary Road Pavement in Need of Repair Pavement quality is currently measured by VDOT using a standard quantitative measure called the Critical Condition Index (CCI). In general, the CCI describes pavement condition as the lower of two pavement ratings. Load-related Distress Ratings (LDR), address pavement distresses considered to be primarily load related while the Non Load-related Distress Ratings (NDR) focus on those related to climate, materials or construction deficiency. Both indices range from a value of “0” for a very poor pavement to “100” for a pavement in perfect condition. Percentage of Bridges in Need of Repair or Rehabilitation VDOT uses the National Bridge Inventory (NBI) General Condition Rating (GCR) criteria as an index to identify bridges that may need repair or rehabilitation. The GCR is a numerical scale that ranges from 0 (failed condition) to 9 (excellent condition). All bridges and culverts require some level of maintenance; however, a GCR of less than 6 is used to identify those structures that require more than regular or ordinary maintenance. Virginia also addresses the structural integrity of bridges using the National Bridge Inspection Standards. The term structural deficiency is applied when the condition of one or more of three components – bridge deck, superstructure or substructure – receives a rating of four or less on a scale of zero to nine, with nine being the best rating. These ratings result from biennial (and in some cases more frequent)
Transportation Accountability Commission
18
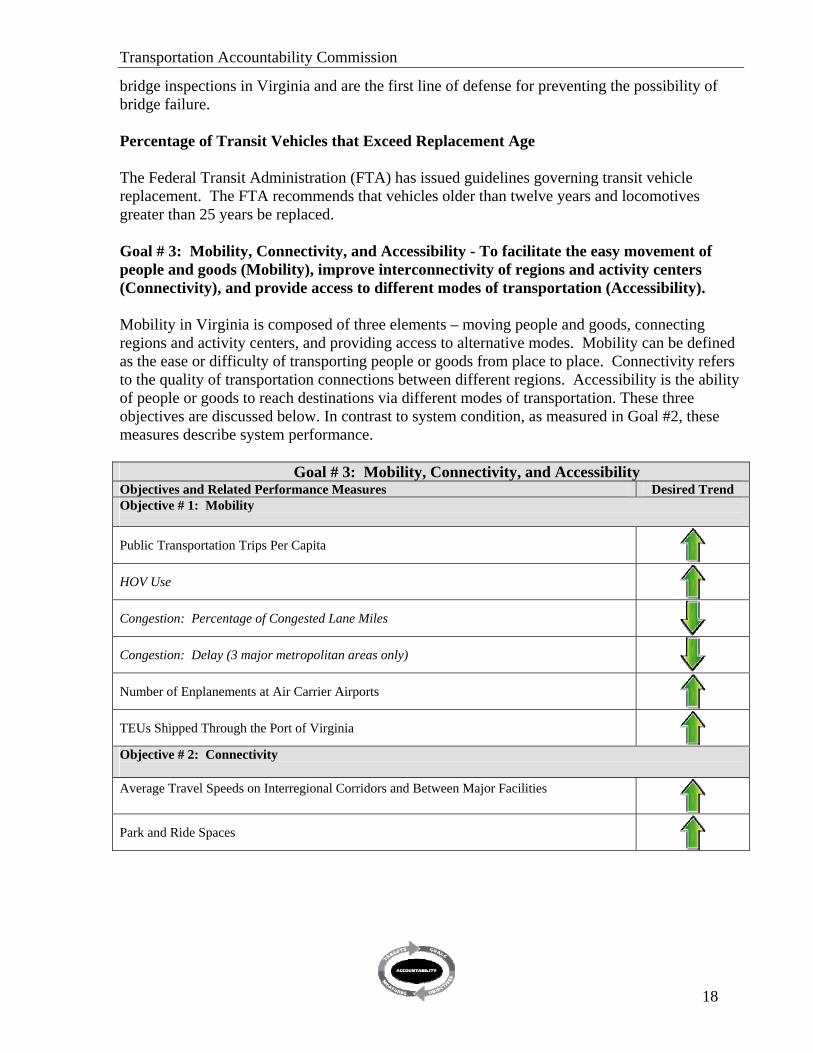
bridge inspections in Virginia and are the first line of defense for preventing the possibility of bridge failure. Percentage of Transit Vehicles that Exceed Replacement Age The Federal Transit Administration (FTA) has issued guidelines governing transit vehicle replacement. The FTA recommends that vehicles older than twelve years and locomotives greater than 25 years be replaced. Goal # 3: Mobility, Connectivity, and Accessibility - To facilitate the easy movement of people and goods (Mobility), improve interconnectivity of regions and activity centers (Connectivity), and provide access to different modes of transportation (Accessibility). Mobility in Virginia is composed of three elements – moving people and goods, connecting regions and activity centers, and providing access to alternative modes. Mobility can be defined as the ease or difficulty of transporting people or goods from place to place. Connectivity refers to the quality of transportation connections between different regions. Accessibility is the ability of people or goods to reach destinations via different modes of transportation. These three objectives are discussed below. In contrast to system condition, as measured in Goal #2, these measures describe system performance.
Goal # 3: Mobility, Connectivity, and Accessibility Objectives and Related Performance Measures Desired Trend Objective # 1: Mobility
Public Transportation Trips Per Capita
HOV Use
Congestion: Percentage of Congested Lane Miles
Congestion: Delay (3 major metropolitan areas only)
Number of Enplanements at Air Carrier Airports
TEUs Shipped Through the Port of Virginia
Objective # 2: Connectivity Average Travel Speeds on Interregional Corridors and Between Major Facilities
Park and Ride Spaces

Transportation Accountability Commission
19
Objective # 3: Accessibility
Transit Availability: Transit Vehicle Revenue Miles
Transit Accessibility: Job and Housing Access to Transit and Pedestrian Facilities
Access to Airports
Objective # 1: Mobility Public Transportation Trips Per Capita “Public Transportation Trips Per Capita” measures the number of commuter rail and bus trips taken per person – one indication of mobility. It also reflects the use of alternatives to personal passenger vehicle use that can result in reduced congestion and fuel consumption and improved air quality. HOV Use HOV facilities move more people and allow users to travel faster, thus increasing the overall capacity of the system. Congestion: Percentage of Congested Lane Miles The percent of lane miles that are overcrowded is one measure of the level of congestion on the system. The percentage of congested lane miles is an output of the Statewide Planning System, which provides an objective planning-level analysis of system conditions. Congestion: Delay (3 major metropolitan areas only) Delay is another measure of congestion and can be defined as the extra travel time needed to reach a destination during the peak hour compared with the time it normally takes under free flowing traffic conditions. This measure would apply to the following three metropolitan areas only: Northern Virginia, Richmond, and Hampton Roads. Number of Enplanements at Air Carrier Airports This measure is defined as the number of enplanements that occur at Virginia’s commercial airports. TEUs Shipped Through the Port of Virginia One aspect of mobility is the ability to move freight in and out of the ports. The traditional measure of port activity is “Twenty-foot equivalent units” (TEUs).

Transportation Accountability Commission
20
Objective # 2: Connectivity Average Travel Speeds on Interregional Corridors and Between Major Facilities This measure tracks the average travel speeds along transportation corridors that connect different regions and major facilities such as the Port of Virginia or Washington Dulles International Airport. Examples of interregional corridors are Interstate routes such as I-95 connecting Washington D.C. with Richmond, as well as primary routes such as US Route 1 from Alexandria to Fredericksburg. The Commission recognizes that transportation agencies will need to identify the corridors of statewide significance. Park and Ride Spaces Park and ride spaces are parking spaces that enable travelers to park their vehicles at a central location and then ride transit or carpool to their destination. This measure tracks the number of such spaces.
Objective # 3: Accessibility Transit Vehicle Revenue Miles Transit Vehicle Revenue Miles are the miles traveled when a transit vehicle is in revenue service and an increase in miles means greater access. This improved access can occur in one of two ways: increased transit coverage or vehicles running more often.
Job and Housing Access to Transit and Pedestrian Facilities This measure identifies the percentage of jobs and houses within a threshold travel distance (e.g., within one-quarter of a mile) of a transit facility and whether sidewalks are available. Access to Airports Access to Airports measures the proximity of citizens to airports in Virginia and will be defined as the percentage of the population within a threshold travel time of an airport.
Goal # 4: Environmental Stewardship - To protect the environment and improve the quality of life for Virginians. A major challenge for any transportation system is to determine how to implement improvements to the transportation system without compromising the quality of the environment. The development and enhancement of transportation infrastructure should not result in the degradation of natural, cultural or historic resources. Designing and operating the transportation system in a manner that enhances communities and protects Virginia’s natural resources is the aim of environmental stewardship.

Transportation Accountability Commission
21
Goal # 4: Environmental Stewardship
Performance Measure Desired Trend
Tons of Transportation Related Emissions
Successful Replacement of Wetlands
Fuel Usage Per Capita
Tons of Transportation-Related Emissions Transportation related emissions are characterized as volatile organic compounds, oxides of nitrogen oxygen, and carbon monoxide. Successful Replacement of Wetlands This measure identifies the number of wetlands that have been successfully replaced due to transportation projects that affected pre-existing wetlands. Fuel Usage Per Capita (Individuals Over Age 16 or Licensed Drivers may serve as basis for the “per capita” estimate) This measure identifies the gallons of fuel consumed per person. A decrease in this measure should be associated with improved air quality and more efficient use of resources. Goal # 5: Economic Vitality - To provide a transportation system that supports economic prosperity. Virginia’s transportation system is one of the most important factors influencing the level of economic activity in the Commonwealth. Transportation system enhancements reduce the cost of moving people and goods. Good roads, transit, rail, ports and airports attract businesses and people; provide greater access to suppliers, markets and services; reduce the cost of doing business; and, increase individual and business productivity. Determining the estimated impacts of transportation investments on the economy should be part of the planning process and the results should be communicated to the public.
Goal # 5: Economic Vitality Performance Measure Desired Trend
Jobs Created by Transportation Investment
Percent of Transportation Expenditures on Small, Women, and Minority Owned Businesses (SWAM)
Freight Tonnage Originating or Terminating in Virginia

Transportation Accountability Commission
22
Jobs Created by Transportation Investment This measure identifies the number of jobs created as a result of investment in the transportation system. Percent of Transportation Expenditures to SWAM Businesses As a second measure of economic vitality, the Commission recommends measuring the percent of all transportation expenditures that go to Small, Women, and Minority Owned (SWAM) businesses with the expectation that the percent will continue to increase over time and meet or exceed the 40% target established by Executive Order 33 (2006). Freight Tonnage Originating or Terminating in Virginia One measure of business success is the amount of freight originating or terminating in Virginia. Goal # 6: Program Delivery - To achieve excellence in the execution of programs and delivery of services. This goal focuses on the quality of the experience for the transportation user and highlights the importance of efficient utilization of resources entrusted to Virginia’s transportation professionals. The measures that the Commission recommends for program delivery focus primarily on providing services to citizens, completing projects in a timely and cost-effective manner, and determining how citizens view the transportation system.
Goal # 6: Program Deliver Performance Measure Desired Trend
Customer Service Delivery: DMV Wait Times
On-time / On-budget
Customer Satisfaction with the Transportation System
Customer Service Delivery: DMV Wait Times This measure identifies the average number of minutes that people spend waiting for services at Department of Motor Vehicles Customer Service Centers. On-Time / On-Budget This measure identifies the percentage of VDOT construction and maintenance projects that are completed on-time and on-budget.
Transportation Accountability Commission
23
Customer Satisfaction with the Transportation System The Commission felt it was desirable to determine how the users of the transportation system assess it. Customer satisfaction could be measured through a statewide survey of Virginia citizens. Goal # 7: Coordination of Transportation and Land Use - To facilitate the effective coordination of transportation and land use plans and decisions to promote livable communities. This last goal addresses the coordination between land use and transportation planning. Because this goal was explicitly identified in Executive Order 37 and the Commonwealth does not now measure it, the Commission believed it warranted a more expansive summary of the Commission’s deliberations.
Background: Land Use and Transportation A number of factors such as development, traffic congestion, and the financial and ecological inability to keep up with transportation demand have fueled interest in the relationship between land use and transportation in Virginia. Decisions about land use and development determine the transportation needs of an area – in terms of the number of trips and the modes that can be used to make those trips. Thus, both land use decisions and transportation investments affect the level of mobility and accessibility in the region, the viability of each mode, and the overall efficiency of transportation facilities and services. Where land use and transportation decisions are made independently, a variety of problems can occur. Many argue that transportation system demand can be reduced by changing the land use; for example, by creating transit-oriented development and bringing housing and jobs closer together. Findings and Recommendations Based on a review of best practices in other states and Metropolitan Planning Organizations (MPOs) and discussions with experts, the following findings were developed by the Commission. Finding 1 - There are no easy measures for coordination of land use and transportation. No standard measures are being used by other states. That is partly due to the local nature of land use decision-making and partly to the difficulty in defining and measuring desirable outcomes. The Commission concluded that good coordination should focus on four objectives or outcomes: 1) Increased Use of Transportation Options, 2) the Promotion of Community Development Patterns, 3) the Preservation and Management of Transportation Corridors, and 4) Consistency of Plans. Finding 2 - There are measures that can be used to estimate the first three objectives. However, it is difficult to measure consistency of plans.
Transportation Accountability Commission
24
The Commission concluded that both transportation and land use are enhanced when there is: • Consistency Between Transportation and Land Use Plans • Consistency Among State, Regional, and Local Plans • Zoning Action Consistent with Comprehensive Plans
However, the Commission concluded that consistency should be eliminated as a formal objective mainly because of the difficulty in deriving measures that capture consistency. It was also decided that consistent land use and transportation plans would result in increased use of transportation options, the promotion of community development patterns and preservation and management of transportation corridors. Therefore, consistency of plans would be indirectly measured through the other objectives. Finding 3 - Many land use performance measures need to be estimated at regional or local levels. The Commission realized that there is no clear standard for what constitutes good coordination; it will vary by region. Regional and community differences are extremely important and what would be acceptable or desirable in one location may not be in another. Additionally, some measures, such as jobs-housing balance, are not meaningful at a state level. The Commission’s objectives and performance measures for coordination of transportation and land use are detailed below.
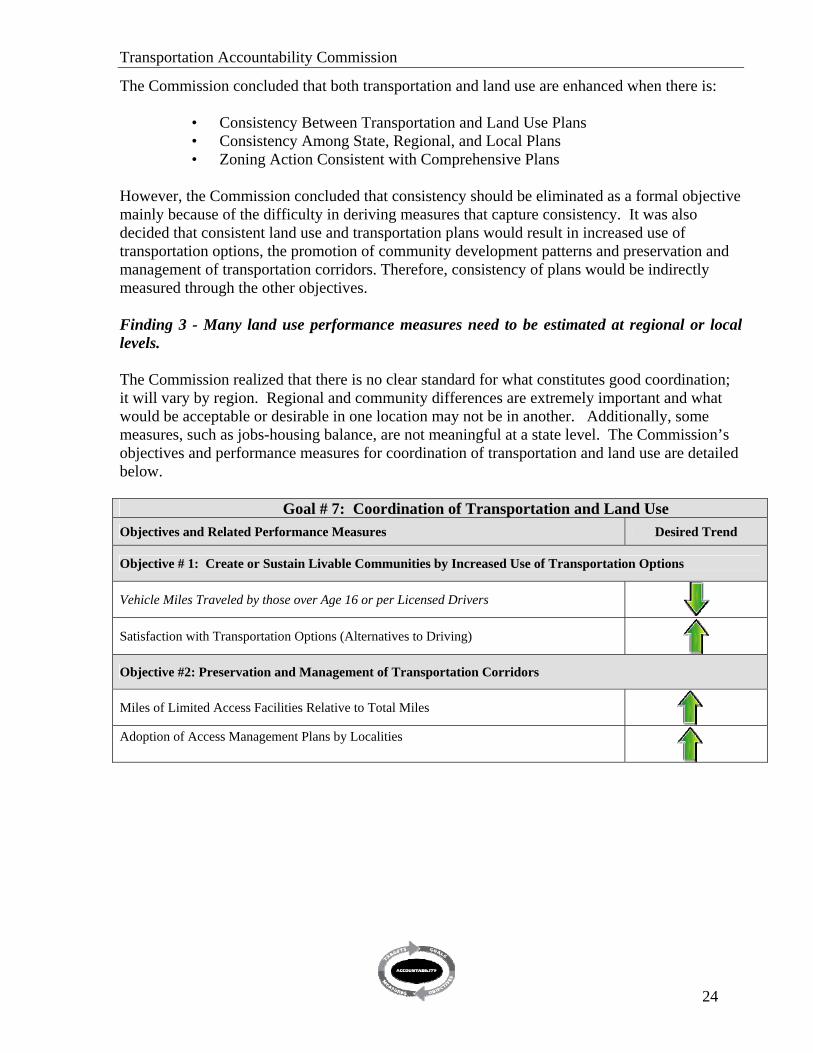
Goal # 7: Coordination of Transportation and Land Use
Objectives and Related Performance Measures Desired Trend
Objective # 1: Create or Sustain Livable Communities by Increased Use of Transportation Options
Vehicle Miles Traveled by those over Age 16 or per Licensed Drivers
Satisfaction with Transportation Options (Alternatives to Driving)
Objective #2: Preservation and Management of Transportation Corridors
Miles of Limited Access Facilities Relative to Total Miles
Adoption of Access Management Plans by Localities
Transportation Accountability Commission
25
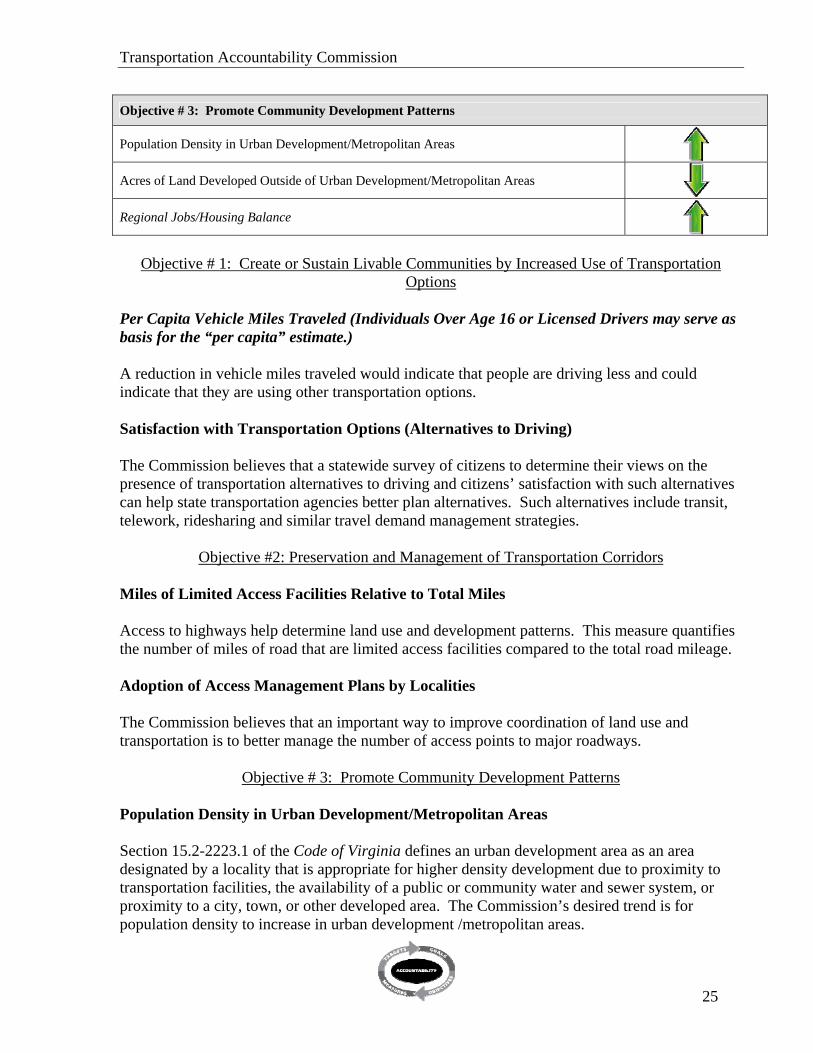
Objective # 3: Promote Community Development Patterns
Population Density in Urban Development/Metropolitan Areas
Acres of Land Developed Outside of Urban Development/Metropolitan Areas
Regional Jobs/Housing Balance
Objective # 1: Create or Sustain Livable Communities by Increased Use of Transportation
Options Per Capita Vehicle Miles Traveled (Individuals Over Age 16 or Licensed Drivers may serve as basis for the “per capita” estimate.) A reduction in vehicle miles traveled would indicate that people are driving less and could indicate that they are using other transportation options. Satisfaction with Transportation Options (Alternatives to Driving) The Commission believes that a statewide survey of citizens to determine their views on the presence of transportation alternatives to driving and citizens’ satisfaction with such alternatives can help state transportation agencies better plan alternatives. Such alternatives include transit, telework, ridesharing and similar travel demand management strategies.
Objective #2: Preservation and Management of Transportation Corridors Miles of Limited Access Facilities Relative to Total Miles Access to highways help determine land use and development patterns. This measure quantifies the number of miles of road that are limited access facilities compared to the total road mileage. Adoption of Access Management Plans by Localities The Commission believes that an important way to improve coordination of land use and transportation is to better manage the number of access points to major roadways.
Objective # 3: Promote Community Development Patterns Population Density in Urban Development/Metropolitan Areas Section 15.2-2223.1 of the Code of Virginia defines an urban development area as an area designated by a locality that is appropriate for higher density development due to proximity to transportation facilities, the availability of a public or community water and sewer system, or proximity to a city, town, or other developed area. The Commission’s desired trend is for population density to increase in urban development /metropolitan areas.
Transportation Accountability Commission
26
Acres of Land Developed Outside Urban Development/Metropolitan Areas This measure would identify the acreage of land developed outside the boundaries of urban development /metropolitan areas in order to determine the loss of open space that occurs with development. Ideally, there would be no increase in the amount of land developed outside of these areas. However, a meaningful reduction in the rate of increase of land developed outside of urban development /metropolitan areas would also be desirable. Regional Jobs/Housing Balance This measure can be defined as the ratio of jobs to housing in a given area. An imbalance indicates more people commuting to jobs that are not located proximate to where they live placing a strain on the transportation system. Achieving the proper balance between jobs and housing can help reduce congestion and commute times and improve air quality. The proper ratio will likely vary from region to region and, so, interregional comparisons are not appropriate. Comparison within a region over time should prove more useful.
Legislative Steps Toward Better Coordination Recently, legislative steps have been taken to aid in coordinating land and transportation uses; specifically, the recent enactment of Chapter 527 mandates the development of procedures by which localities submit to VDOT for review and comment land use and zoning proposals that will affect the state-controlled transportation network. Also, in 2007, legislation was passed mandating VDOT establish and implement access management standards, see § 33.1-198.1 Code of Virginia. These legislative initiatives should have a positive impact on the coordination of land and transportation uses. Nonetheless, land-use decisions remain within the purview of local officials. The legislation regarding access management standards states explicitly that, “Nothing in such standards shall preempt the authority of a local government to regulate the type or density of land uses abutting the state system of highways.” Recommendations The Commission recommends that Virginia’s transportation policy boards and agencies fully embrace the overarching system-wide goals and utilize them in making policy decisions. The Commission also recommends that the policy boards or agencies, as appropriate, develop targets for the performance measures, the final element that closes the loop between goals, performance measures and accountability.
Recommendation 1 - The Boards and Agencies should embrace the overarching goals and performance measures and develop targets as well as strategies to meet those targets.
Recommendation 2 - The Transportation Policy Boards should institutionalize the overarching goals and measures by establishing a process to monitor performance and reevaluate and address requisite changes in goals, measures, targets and strategies.

Transportation Accountability Commission
27
IV. Recommendations for Agency Key Objectives and Performance Measures
System-wide, overarching goals and performance measures provide taxpayers and other transportation stakeholders with a means to assess the performance of the transportation system but they do not directly address the performance of an individual agency or the accountability of an agency’s chief executive. Agency-specific key objectives and performance measures address the latter issue - although system-wide performance goals and measures and agency goals and measures overlap (e.g. safety is a system and agency goal). Agency key objectives represent the desired outcomes for the agency’s major programs, reflect the principles inherent in the agency’s mission and provide the vehicle to drive results throughout the agency. The Commission reviewed the key operating and management characteristics of Virginia’s main transportation agencies. This review included current performance management practices in each agency. The Commission noted that several currently existing mechanisms allow the public to review transportation executive and agency performance in Virginia. Those mechanisms provided a substantive foundation for the development of the Commission’s findings and recommendations in this area. Finding 4 - To maximize their effectiveness, several of the current performance measures require the joint effort of multiple agency heads (for example, number of fatalities).
Recommendation 3 - Develop shared objectives and performance measures among multiple agency heads when a performance measure is beyond the span of control of an individual agency head.
Finding 5 - Performance measurement targets have been established for many of Virginia’s key measures, but they are typically set for 2010. Effective targets will have both short-term and long-term milestones. Without incremental milestones against which progress can be measured, long-term targets may never be met. Commission members further indicated that stretch targets/goals should be created without punishment for failure of full achievement.
Recommendation 4 - Develop stretch targets for agency heads and set interim performance targets.
Finding 6 - The process used to evaluate the performance of agency executives captures agency operations and outcomes but does not directly address agency heads’ leadership abilities in driving their agency toward desired outcomes.
Recommendation 5 - Include a qualitative leadership component in the agency head performance review process. Leadership includes but is not limited to:
• Championing Governor’s priorities; understanding the importance of goals and relationships

Transportation Accountability Commission
28
• Communicating the agency’s mission, vision and shared values • Leading by example • Acting in a professional and ethical manner within and outside the agency • Managing shifting priorities; making tough calls; delivering on promises • Interacting effectively with diverse constituency groups, including General
Assembly members, boards and public and government officials • Promoting client/customer service
Finding 7 - Executive pay incentives should be given greater consideration as a performance management tool. The Commission acknowledged that government agency heads are motivated by the desire to provide public service and support the Governor. There was also recognition, based on their collective experiences, that bonus pay might also play an important role.
Recommendation 6 - Utilize or amend provisions currently available in the Appropriation Act to provide opportunity for additional compensation and incentives when executive performance expectations are exceeded.
Finding 8 - Whether pertaining to executive or agency performance goals, lessons learned frequently are not carried forward because of the one-term gubernatorial system in Virginia.
Recommendation 7 - Develop legislative or administrative plans to foster longevity in performance measurement processes and lessons learned. Institutionalizing lessons learned will create staying power from one administration to another.
The Commission’s recommendations for agency key objectives, performance measures and expected trend for the performance measures are listed in Table 3.

Transportation Accountability Commission
29
Table 3. Agency Key Objectives and Performance Measures
* The Commission discussed and recommends that a measure of port profitability be considered.
Agency Key Objectives Measures Desired Trend
Decrease Number of Traffic Fatalities Number of Fatalities
Provide Reasonable Customer Service Wait-time Wait-time for Majority of Customers
DMV
Reduce Number of Interactions Between Citizen and DMV
Average Number of Interactions to Complete a Single Transaction
Number of Enplanements Increase Aviation Utilization
Economic Activity Generated
DOAV
Provide Financial Assistance for Airport Development Ratio of Grants Executed to Allocation
Public Transportation Trips Per Capita Manage Congestion
Percentage of Freight Shipped by Rail
Deliver Economic Benefits
Number of Jobs Created and Maintained through Transit and Rail Initiatives
DRPT
Deliver Social Benefits Transit Ridership by Elderly, Disabled and Low Income Citizens
Decrease the Number of Traffic Fatalities Number of Fatalities
Condition Pavement/Bridge Condition
Performance Annual Hours of Delay (congestion)
VDOT
Management Projects On-Time/On-Budget
Enhance Port-Related Business Number of Port-Generated Jobs
Increase Goods and Services Shipped through Port
Number of Containers (TEUs)
VPA*
Enhance Cargo Handling Efficiency Containers Per Acre/Per Year
Transportation Accountability Commission
30
V. Assessing Community Impacts
Overview Executive Order 37 asks the Commission to determine whether there are quantifiable ways to measure the impacts of transportation projects on the community. The answer is yes, transportation professionals have been evaluating the effects and potential effects of projects on the economic, environmental and social systems for decades. Planning studies focus on the identification of transportation problems and potential solutions and include some analysis of community issues. In the project development phase, both potential positive and negative effects of projects are examined in more detail. For large, federally funded projects, environmental impact statements (EIS) are prepared containing detailed estimates of potential change to the human or ecological environment. In addition to ecological effects (water, wetlands, air quality), impacts on the human environment are also assessed. EIS’ are prepared for projects that are usually large, expensive and/or controversial. Typically, the EIS and state environmental work occur during the preliminary engineering stage. By identifying these issues earlier in the planning phase, the process can be streamlined and deliberations more informed. The main disadvantage to pursuing a strategy of estimating impacts earlier in the planning stage is the possible lack of information to make good estimates. The Commission’s investigation into this area led to the following findings and recommendations. Finding 9 - Typically, considerable emphasis is placed on negative community impacts, especially early in project development. The community impacts’ debate typically focuses on just the negative consequences of activities and not the entire spectrum of impacts. While the negative effects are felt directly and, often, immediately upon start of the project, it is quite common that most of the projects positive impacts are realized only after the project is completed. The Commission believes that placing more emphasis on the positive impacts earlier and throughout project development could serve to remind the public that projects are developed to meet specific positive goals.
Recommendation 8 - More effort should be placed on balanced reporting of positive and negative community impacts.
Finding 10 - Currently, VDOT develops the EIS during the preliminary engineering/project development phase of a project. However, the Commission believes that key stakeholders and the community as whole would benefit if potential impacts were known earlier. Estimating and informing the public of both positive and negative impacts earlier allows all of the affected parties to better understand the costs and benefits of a proposal and increases the

Transportation Accountability Commission
31
opportunity to take actions that may alleviate negative consequences. The main disadvantage in estimating impacts earlier in the project development process is the possible lack of information to make good estimates.
Recommendation 9 - Evaluate impacts at an earlier stage in the project development process.
Finding 11 - Community impacts can only be evaluated at the community or local level. Thus, it is important to coordinate the estimation of impacts with local officials and the surrounding community. Citizens want ample opportunity to review and discuss potential impacts. The Commission believes that there are several advantages to establishing a partnering relationship between the transportation agency and the local community. First, the agency will often have expertise and resources that can be of benefit to the local community when local officials discuss the project with the public. It should also facilitate greater success in coordinating local comprehensive planning and transportation planning. A third advantage is the potential to improve the accuracy of impact estimates.
Recommendation 10 - The Commonwealth should partner with local governments to identify community impacts.
Finding 12 - The application of Context Sensitive Solutions (CSS) is growing among state and federal transportation entities. CSS refers to a project development process that attempts to involve the public in the decision-making, takes all modes into consideration and attempts to balance impacts. The general tenets are as follows:
• Balance safety, mobility, community and environmental goals in all projects • Involve the public and stakeholders early and continuously throughout the planning and
project development process • Use an interdisciplinary team tailored to project needs • Address all modes of travel • Apply flexibility inherent in design standards • Incorporate aesthetics as an integral part of good design
CSS has recently been established by VDOT as a desired process for project design.
Recommendation 11 - Encourage the continued development and use of Context Sensitive Solutions.

Transportation Accountability Commission
32
VI. Other Findings and Recommendations
During the course of their deliberations the Commission members identified several issues related to transportation performance management and accountability that they considered of importance but were not directly related to the specific instructions in Executive Order 37. These issues include the project selection process, public awareness, the level of the transportation investment and the need to address senior mobility. This chapter conveys the Commission’s finding and recommendations for these issues. Project Selection The system-wide goals represent characteristics that the Commission considers critical to delivering a high performing transportation system. To maximize the value of the Commonwealth’s transportation investments, it is not only important to complete projects on time and within budget but to also choose projects that support system goals. The Commission also concluded that the application of an objective methodology to the project selection process provide information to ensure that the most needed projects receive funding. VDOT developed a highway prioritization process in 2005. Projects were identified for the Six-Year Improvement Program. They were not included in the Program due to funding constraints. However, projects identified by the process were considered for the 2007 Program. This prioritization process should be expanded to include more than highways using the goals and measures identified by this Commission. Finding 13 - Goals and outcome performance measures are essential elements for accountability. The mix of projects selected and implemented is critical to the success of the overall transportation program and should be related to the goals of the program.
Recommendation 12 - Use an objective methodology based on a set of overarching goals as a tool to assist in project selection.
Public Awareness The Commission believes that transportation agencies could improve their efforts to enhance public awareness. Improved public awareness increases accountability and could influence the public’s view of transportation agencies and the resources needed for transportation. The Commission believes that transportation agencies can enhance efforts to educate the public and better coordinate with stakeholders regarding agency activities. Finding 14 - Transportation agencies have not done an adequate job in communicating with and educating the public.
Recommendation 13 - Develop new strategies for informing the public and provide better communication between transportation agencies and their stakeholders.

Transportation Accountability Commission
33
Transportation Investment The Commission believes that the adequacy of transportation funding will remain an ongoing issue for the Commonwealth. One way to provide enhanced justification for requested transportation resources is to identify the level of performance that could be achieved given different levels of funding. In this way, resources are linked to performance. The Commission believes that this approach could provide for a more effective rationale for requesting additional transportation funds and could help to better inform transportation planning efforts. Finding 15 - The 2007 Transportation Initiative (HB 3202) represents an important step forward in addressing transportation needs. However, the adequacy of transportation investments will be an ongoing issue, and resources should be linked to performance in future planning and funding initiatives.
Recommendation 14 - Develop and incorporate methods of linking requirements and resources to performance and the benefits achieved in future planning and funding initiatives.
Senior Mobility The rapidly increasing senior citizen population in Virginia represents a transportation challenge for the Commonwealth. In particular, senior citizens will face increased difficulty moving from place to place due to aging and health concerns. The Commission does not believe that Virginia’s transportation system is currently equipped to deal with this growing problem. Findings 16 - The Commonwealth’s transportation program does not adequately address the mobility needs of the rapidly growing senior program.
Recommendation 15 - Utilize the limited mobility population objective and performance measure developed by the Department of Rail and Public Transportation to serve as a basis for allocation of funds to address the needs in this area.
Transportation Accountability Commission
34
VII. Next Steps
The above findings and recommendations complete the mandate to the Commission as described in Executive Order 37. The Commission offers the following “next steps” as suggestions of how the recommendations might be implemented and transportation performance and accountability enhanced further in the Commonwealth:
• Implement Commission’s recommendations - The Office of Intermodal Planning and Investment may be the appropriate entity to monitor and report the progress in implementing the recommendations in this report. The Intermodal Office has a mandate to coordinate multimodal planning solutions for the Six-Year Improvement Program and to provide solutions that link existing systems.
• Fold the Commission’s goals and outcome performance measures into the next
update to the Transportation Performance Report - In 2007 the Office of Intermodal Planning and Investment released Virginia’s first Transportation Performance Report. Virginia Code requires the annual production of this report, which is designed to monitor the performance and condition of Virginia’s transportation system. The report is organized around the system-wide goals and measures developed in VTrans2025, and should be updated with the goals and measures developed by the Commission.
• Develop regional goals and performance measures that are comparable to those
developed for the state - The Commission concluded that there are many instances where regional differences are important when establishing targets.
• Institutionalize an ongoing process of review and update of indicators. • Develop a consumer-centric website to communicate with the public
– VaPerforms could be used as model – Could take the name, MY-VDOT – Citizen input essential
The Commission has found that Virginia’s transportation agencies have already implemented several performance management initiatives. In addition, the Interim Report concludes that Virginia’s transportation agencies should devote more effort to increasing public awareness about agency successes and the public benefits derived from deployment of the financial resources entrusted to them by the public. The Commission found that the performance management initiatives, including those herein, address the needs of policy makers. To aid in making these recommendations more useful to the general public, the Commission offers for further exploration the MY-VDOT concept. MY-VDOT would address the informational needs of the traveling public. MY-VDOT would provide a user-designed link to each transportation agency website and to sites such as Virginia Performs. The site should also allow citizens to request information specific to the region in which they live. The user should have access to real time local traffic information.

Transportation Accountability Commission
35
A desirable feature would be an option for the user to personalize the information such as roads, intersections and weather that would initially be displayed when the site is accessed. For example, one could review traffic conditions on the route(s) that are typically used by that individual during his morning commute. Those are examples of the type of information that may be included, but it is important to get input from the public to ensure that the website contains the information important to them.
Transportation Accountability Commission
36
Appendices

Transportation Accountability Commission
37

Transportation Accountability Commission
38
Appendix I. Performance Measures Mandated in Law
Chapter 896 of the 2007 Acts of Assembly amends § 33.1-23.03 of the Code of Virginia by requiring the Statewide Transportation Plan (STP), as well as the long range plans for the Northern Virginia Transportation Authority and the Hampton Roads Transportation Authority, to include quantifiable performance measures related to: congestion reduction and safety, transit and high-occupancy vehicle facility use, job-to-housing ratios, job and housing access to transit and pedestrian facilities, air quality, and per capita vehicle miles traveled. The Commission, recognizing the importance the Virginia General Assembly has placed upon the performance measures has included those measures in its recommendations of system-wide performance measures. The following chart identifies the mandated performance measures as well as the relevant goals and measures recommended by the Commission. Chapter 896 Performance Measure Relevant Commission Goal and Measure Congestion Reduction and Safety GOAL: Mobility, Connectivity, and Accessibility
• Congestion o Percentage of Congested Lane Miles o Delay
GOAL: Safety and Security • Number and Rate of Fatalities by Mode • Number and Rate of Injuries by Mode • Percentage of Updated Emergency, Security, and/or
Continuity of Operations Plans
Transit and HOV Facility Use GOAL: Mobility, Connectivity, and Accessibility • Transit Availability
o Transit Vehicle Revenue Miles • HOV Use
Job-To-Housing Ratio GOAL: Coordination of Transportation and Land Use • Jobs/Housing Balance
Job and Housing Access to Transit and Pedestrian Facilities
GOAL: Mobility, Connectivity, and Accessibility • Transit Availability
o Job and Housing Access to Transit and Pedestrian Facilities
Air Quality GOAL: Environmental Stewardship
• Tons of Transportation-Related Emissions
Per Capita Vehicle Miles Traveled GOAL: Coordination of Transportation and Land Use • Vehicle Miles Traveled by those over age 16 or per Licensed
Driver

Transportation Accountability Commission
Transportation Accountability Commission
2
Appendix II.
Interim Report of the Transportation Accountability Commission
TO THE GOVERNOR AND THE GENERAL ASSEMBLY OF VIRGINIA May 2007

Transportation Accountability Commission

Transportation Accountability Commission
i
TABLE OF CONTENTS
Page
EXECUTIVE SUMMARY 1 I. INTRODUCTION 4 II. OVERVIEW OF THE TRANSPORTATION ORGANIZATION 6 III. OVERVIEW OF CURRENT ACCOUNTABILITY AND PERFORMANCE MANAGEMENT PROCESSES 9 TRANSPORTATION SYSTEM PERFORMANCE 9 TRANSPORTATION EXECUTIVE AND AGENCY ACCOUNTABILITY
AND PERFORMANCE 13 IV. BEST PRACTICES FOR ACCOUNTABILITY AND PERFORMANCE
MONITORING SYSTEMS 17 A REVIEW OF BEST PRACTICES IN THE USE OF PERFORMANCE MEASURES 17 STATE OF THE PRACTICE ACROSS THE NATION 17 THE FEDERAL PERFORMANCE AND ACCOUNTABILITY REPORT 20 V. THE NEXT STEPS FOR THE COMMISSION 22 APPENDIX A – EXECUTIVE ORDER 37 (2006) 23 APPENDIX B – SUMMARY OF TASKS ASSIGNED TO TAC SUBCOMMITTEES 25 APPENDIX C - REVIEW OF BEST PRACTICES IN SELECTED PEER STATES 26

Transportation Accountability Commission
EXECUTIVE SUMMARY
In recent years, Virginia has initiated several reforms designed to increase the accountability and transparency of state government. Most recently, Governor Timothy M. Kaine created the Transportation Accountability Commission to review and evaluate existing methods to measure transportation system performance, as well as the performance of the transportation agencies and their executives, and to make recommendations to increase performance and accountability. The Commission reviewed Virginia’s modal agencies, including the main duties of the three transportation policy boards, reviewed and evaluated existing methods used to measure performance and accountability, and discussed the state of the practice in other states and the U.S. Department of Transportation (USDOT). Transportation performance management in Virginia is governed by seven distinct but interrelated systems. Three address transportation system performance; four address agency and executive performance. The Commission’s interim findings and recommendations are as follows: Transportation System Performance Finding 1 - Transportation agencies and policy boards should adopt and embrace overarching goals. Finding 2 - Overarching goals should be established prior to identifying performance measures. Finding 3 - The goals identified in VTrans2025 and the Virginia Transportation Performance Report - 2006 are reasonable and sufficiently broad to be used as a starting point. Finding 4 - Virginia’s transportation agencies have already implemented several performance management initiatives. Finding 5 - In addition to presenting information based on existing resources, it is also important to indicate what could be achieved if more resources were made available. Transportation Executive and Agency Accountability and Performance Finding 6 - Several of the current performance measures are outside the “line-of-sight” or purview of an individual agency head (for example, number of fatalities).
Recommendation 1 - Develop shared objectives and performance measures among multiple agency heads when a performance measure is beyond the span of control of an individual agency head.
Finding 7 - Performance measurement targets have been established for many of Virginia’s key measures, but they are typically set for 2010. Effective targets will have both short-term and long-term milestones. Without incremental milestones against which progress can be

Transportation Accountability Commission
2
measured, long-term targets may never be met. Commission members further indicated that stretch targets/goals should be created without punishment for failure of full achievement.
Recommendation 2 – Develop stretch targets for agency heads and set interim performance targets.
Finding 8 - The process used to evaluate the performance of agency executives captures agency operations and outcomes but does not directly address agency heads’ leadership abilities.
Recommendation 3 - Include a qualitative leadership component in the agency head performance review process. Leadership includes but is not limited to:
• Champions Governor’s priorities; understands the importance of goals and relationships
• Communicates the agency’s mission, vision and shared values • Leads by example • Acts in a professional and ethical manner within and outside the agency • Manages shifting priorities; makes tough calls; delivers on promises • Interacts effectively with diverse constituency groups, including General
Assembly members, board(s) and public and government officials • Promotes client/customer service
Finding 9 - Executive pay incentives should be given greater consideration as a performance management tool. The Commission acknowledged that government agency heads are motivated by the desire to do well and to be reappointed. There was also recognition, based on their collective experiences, that bonus pay might also play an important role.
Recommendation 4 - Utilize or amend provisions currently available in the Appropriation Act to provide opportunity for additional compensation and incentives when executive performance expectations are exceeded.
Finding 10 - Whether pertaining to executive or agency performance goals, lessons learned frequently are not carried forward because of the one-term gubernatorial system in Virginia.
Recommendation 5 - Develop legislative or administrative plans to foster longevity in performance measurement processes and lessons learned. Institutionalizing lessons learned will create staying power from one administration to another.
Performance management is defined as “a way of monitoring progress toward a result or goal” and represents a tool for establishing and maintaining accountability and, therefore, credibility. It also provides opportunity to communicate to various stakeholders. Key features of best practices garnered from presentations and a survey of other states include the following: Key Feature/Best Practice 1 - Effective performance management links performance measures to specific policy goals and strategies to achieve those goals.

Transportation Accountability Commission
3
Key Feature/Best Practice 2 - Effective performance management will focus on a few key performance measures when reporting to the public and key stakeholders. More detailed measures can be used to support the higher-level measures. At a system level, the number of performance measures should be relatively small. Key Feature/Best Practice 3 - Effective performance management should distinguish between output measures and outcome measures. Agencies typically have more control over output measures. Key Feature/Best Practice 4 - Effective performance management will develop performance measures that are “realistic” in terms of the resources used and that are justified by their utility to managers and decision makers. Key Feature/Best Practice 5 - Begin with existing data and identify what should be collected in the future. The development of performance management will evolve over time, and experience may dictate different performance measures as time progresses. Waiting for perfect measures will delay the process. Key Feature/Best Practice 6 - Transportation agencies are encouraged to take advantage of and learn from benchmarking and peer comparisons.

Transportation Accountability Commission
4
I. INTRODUCTION In October 2006, Governor Timothy M. Kaine issued Executive Order 37 creating Virginia’s Transportation Accountability Commission. The primary responsibilities of the Commission as identified in Executive Order 37 are:
5. Reviewing Virginia’s existing methods of promoting accountability and performance in transportation.
6. Identifying and recommending national best practices in accountability and performance for transportation.
7. Recommending quantifiable outcome measures for the major elements of the state’s transportation program, including measures that incorporate effective land-use and transportation coordination.
8. Recommending performance standards for state transportation executives and agencies. A copy of Executive Order 37 is included in Appendix A to this report. During the past several years, Virginia has been a leader in advancing initiatives to reform government and increase the accountability of state government agencies and their executives. The Virginia Department of Transportation (VDOT) has significantly increased the number of projects that are completed on-time and on-budget. There has also been significant progress in improving the transparency of transportation agencies through the development of tools such as the nationally recognized Dashboard, which is a web-based system that presents detailed schedule information for every project.1 While acknowledging previous accomplishments, Governor Kaine identified the need for continuous reform and increased accountability for transportation agencies:
“We remain committed to a comprehensive strategy for transportation that includes a continued focus on reform and increased accountability for our transportation agencies. The members of this new Transportation Accountability Commission will recommend additional reform measures, and help us create a framework for the continuous evaluation of our transportation programs.” (Governor’s News Release, December 28, 2006)
Executive Order 37 addresses accountability in terms of the outcomes or results from the performance of the transportation system and agencies. While a more comprehensive definition of accountability could include financial accountability, the charge to the Commission was more narrowly defined since financial accountability is already assessed by several independent oversight agencies. The Auditor of Public Accounts (APA), for example, conducts financial and operational audits and is responsible for auditing agency financial statements. The Joint Legislative Audit and Review Commission (JLARC) performs agency operational reviews and 1 The Dashboard received first place in the 2006 Code Charge Studio Developer awards and the Center for Digital Government’s 2005 Best of the Web award. The Dashboard has been reviewed in multiple state and national publications including the article “Red Light, Green Light,” in the June 2003 issue of Government Technology magazine.
Transportation Accountability Commission
5
conducts agency and program efficiency studies. Finally, all agencies are required to prepare either Comprehensive Annual Financial Reports (CAFR) or supply financial reports for a statewide CAFR for review by the public. This interim report summarizes the Commission’s deliberations to date and establishes a framework for new transportation accountability and performance methods with emphasis on outcomes. The current practices are reviewed and gaps between the Commission’s expectations and current practice are identified throughout the report in “Findings” and/or “Recommendations.” The section that immediately follows this one presents an overview of the transportation organization. Section III presents various methods used to measure transportation system and agency executive performance in Virginia. A review of best practices in other states and the system used by USDOT are described in Section IV. The final section outlines the expectations for the final report. Details on the creation of the Commission and the state of the practice in transportation performance measurement are provided in the appendices.

Transportation Accountability Commission
6
II. OVERVIEW OF THE TRANSPORTATION ORGANIZATION Transportation Mission The mission for Virginia’s transportation system was adopted from the Council on Virginia’s Future and is prominently displayed on the Secretary of Transportation’s website. It is:
To ensure that Virginia has a transportation system that is safe, enables easy movement of people and goods, enhances the economy and improves our quality of life.
The mission indicates the importance of transportation in the Commonwealth and provides direction for the development of agency goals and performance measures. The mission statement also serves as the singular statement against which each transportation agency’s success is ultimately evaluated.
Office of the Secretary of Transportation Today, the Commonwealth’s transportation organization is a Cabinet-level function with five major transportation agencies reporting to the Secretary of Transportation. The agencies are: the Department of Aviation (DOAV), the Department of Motor Vehicles (DMV), the Department of Rail and Public Transportation (DRPT), the Department of Transportation (VDOT),) and the Virginia Port Authority (VPA). (Two other agencies, the Motor Vehicle Dealer Board and the Board for Towing and Recovery Operations, also report to the Secretary of Transportation but are not included in this report because they are small and narrowly focused.) These agencies employ over 12,000 people and operate with a combined budget of $4.9 billion. With the exception of DMV, each agency reports to a policy board. Transportation Agencies Department of Aviation DOAV has an authorized employment level of 33 and a FY07 budget of $37.1 million. The mission of the agency is to cultivate an advanced, market driven aviation system that is safe, secure and provides for economic development; promote aviation awareness and education; and provide executive flight services for the Commonwealth Leadership. DOAV’s vision is that the Virginia Aviation System will be the model Transportation Gateway, providing economic development opportunities for all communities throughout the Commonwealth; and that DOAV will be the standard of excellence among state aviation agencies. Department of Motor Vehicles DMV has an authorized employment level of 1,943 and a FY07 budget of $261.3 million. The agency’s mission is to promote security, safety, and service through the administration of motor vehicle and tax-related laws. DMV’s vision is peak performance – everyone, every time.
Transportation Accountability Commission
7
The agency’s core functions include:
• Issuing licenses and credentials • Providing transportation safety services • Informing Virginians about motor vehicle laws • Enforcing motoring and vehicle and fuel tax laws • Collecting transportation-related revenues
DMV faces a unique challenge with the passage of the unfunded federal Real ID Act, which is designed to provide additional security in the provision of licenses The Real ID Act is likely to significantly increase customer transaction times and DMV plans to initiate a massive information campaign to inform customers of this impending challenge and its impact on DMV transactions. Department of Rail and Public Transportation DRPT has an authorized employment level of 55 and a FY07 budget of $506 million. DRPT partners with over 130 public and private organizations including: 12 railroads, 56 public transportation agencies, 50 human service transportation agencies and 14 commuter assistance agencies. DRPT’s mission is to improve the mobility of people and goods while expanding transportation choices in the Commonwealth. To accomplish its mission, DRPT:
• Develops policies to improve mobility and transportation choices • Advocates for rail and public transportation • Develops plans and programs related to public transportation and rail and travel demand
management Department of Transportation VDOT currently has an employment level of approximately 8,800 and a FY07 budget of $3.8 billion. VDOT manages 58,000 miles of state maintained roads, 20,000 bridges/culverts, six tunnels, three ferry tolls, 41 safety rest areas, and 107 commuter parking lots. VDOT’s mission is to plan, develop, deliver, operate and maintain, on-time and on-budget, the best possible transportation system for the traveling public. VDOT envisions a transportation system that is safe, enabling efficient movement of people, goods and services, while enhancing the economy, and contributing to improvements in the quality of life for the citizens of the Commonwealth of Virginia. Virginia Port Authority VPA has an authorized employment level of 167 and a FY07 budget of $77.9 million. The agency owns four general cargo terminals - Norfolk International Terminals, Portsmouth Marine Terminal, Newport News Marine Terminal, and the Virginia Inland Port in Front Royal - which are operated by its affiliate, Virginia International Terminals, Inc. The Port is the second busiest on the East Coast and services more than 45 steamship lines. Throughput increased from 1.232 million units in 1997 to over 2.046 million units in FY06.

Transportation Accountability Commission
8
VPA’s mission is to foster and stimulate the commerce of the Ports of the Commonwealth, promote the shipment of goods and cargoes through the ports, secure necessary improvements of navigable tidal waters within the Commonwealth and, in general, perform any act or function which may be useful in developing, improving, or increasing the commerce, both foreign and domestic, of the Ports of the Commonwealth. Transportation Policy Boards Commonwealth Transportation Board The Commonwealth Transportation Board (CTB) is comprised of 17 members who are appointed by the Governor and approved by the General Assembly. The CTB is a policy board with duties including, but not limited to, determining location of highway routes, approving highway construction contracts, developing a statewide transportation program for highways, transit and rail, and approving maintenance contracts. The Secretary of Transportation serves as chairman and the VDOT Commissioner serves as vice-chairman. The DRPT Director also serves as a member of the Board. The CTB is required to adopt a Six-Year Improvement Program by July 1 of each year. Virginia Aviation Board The governing policy board for DOAV is the Virginia Aviation Board (VAB). The VAB is comprised of a chairman and seven members. Members of the VAB are appointed by the Governor to serve a four-year term. The VAB is responsible for allocating funds for planning, development, and promotion of the 67 public use airports. The VAB also promulgates regulations relating to airports, aircraft, airspace, aviation safety and operations. Additionally, the VAB advises the Governor, the Secretary of Transportation, and the DOAV Director on matters relating to aviation policies and programs. Virginia Port Authority Board of Commissioners A 12-member Board of Commissioners governs VPA. The Board consists of the State Treasurer and 11 other members who are appointed by the Governor. The Executive Director of the Virginia Port Authority, who is appointed by the Board of Commissioners, is responsible for the daily operations of VPA.

Transportation Accountability Commission
9
III. OVERVIEW OF CURRENT ACCOUNTABILITY AND PERFORMANCE MANAGEMENT PROCESSES
Transportation performance management in Virginia is governed by seven distinct but interrelated processes or elements. Three address transportation system performance and four address the performance of agencies and their executives. Figure 1, which is discussed in detail below, presents a schematic of the current processes and their interrelationships.
Figure 1. Performance Management Processes
Transportation System Performance Virginia Performs Virginia Performs is a website that was created by the Council on Virginia’s Future to identify the vision of Virginia’s future and track progress in meeting long-term goals across the main sectors affecting the quality of life and performance of government in the Commonwealth. The Council was established by the General Assembly in 2003 and is comprised of 18 members, including two cabinet secretaries, ten legislators and five citizens. It is chaired by the Governor.
VA Performs 1
Agency Key Objectives and Performance Measures 2
Agency Strategic Plans 2
Governor’s Management Scorecard 2
Agency Performance Reporting Systems 2
Long-Range Transportation Plan
(VTrans2025) 1
Virginia Transportation Performance Report - 2006 1
1. Measures transportation system performance. 2. Measures the performance of agencies and their executives.
Transportation Accountability Commission
10
The long-term overarching statewide goals established by the Council and monitored by Virginia Performs are as follows:
• To be recognized as the best managed state in the nation (Citizen and Government) • To be a national leader in the preservation and enhancement of the state’s economy
(Economy)
• To elevate the levels of educational preparedness and attainment of our citizens (Education)
• To inspire and support Virginians toward healthy lives and strong and resilient families
(Health and Family) • To protect the public's safety and security, ensuring a fair and effective system of
justice and providing a prepared response to emergencies and disasters of all kinds (Public Safety)
• To protect, conserve and wisely develop our natural, historic and cultural resources
(Natural Resources) • To ensure that Virginia has a transportation system that is safe, enables easy
movement of people and goods, enhances the economy and improves our quality of life (Transportation)
Outcome measures are also identified in order to assess progress towards accomplishment of the goals. The transportation outcome performance measures established by the Council are: traffic congestion, infrastructure condition and land use/transportation coordination. Virginia Performs is linked to other transportation performance and accountability processes in several ways. First, the transportation goal – “to ensure that Virginia has a transportation system that is safe, enables easy movement of people and goods, enhances the economy and improves our quality of life” a) is a product of the long-range transportation plan (VTrans2025), and b) has been adopted as the mission for the Secretary of Transportation and VDOT. Second, the transportation outcome performance measures reported on Virginia Performs are also key outcome measures for VDOT. Finally, Virginia Performs provides a one-stop link to two other state performance management processes: Key Outcome and Performance Measures and the Governor’s Management Scorecard. Long- Range Transportation Plan (VTrans2025) In 2002 Virginia’s General Assembly passed an amendment to § 33.1-23.03 of the Code of Virginia directing the Commonwealth Transportation Board (CTB) to develop a statewide multimodal long-range transportation plan which was later called VTrans2025. VTrans2025 sets a vision (Safe, Strategic and Seamless) and overarching goals for the Commonwealth’s transportation system. The goals are: a safe and secure system; preservation and management;

Transportation Accountability Commission
11
mobility, accessibility and connectivity; economic vitality; quality of life and environmental stewardship and fiscal responsibility. All of the major transportation agencies were involved in developing VTrans2025 and the VTrans2025 Final Report was approved and adopted by Virginia’s three transportation boards in November 2004. While the policy boards have adopted the report, the overarching goals have not been fully embraced and utilized to assist in making policy decisions. (Note: As this Interim Report is being finalized, plans are to include the VTrans2025 goals in the CTB’s 2008-2013 Highway Improvement Program Guidelines.) Finding 1 - Transportation agencies and policy boards should adopt and embrace overarching goals. Finding 2 - Overarching goals should be established prior to identifying performance measures. Virginia Transportation Performance Report – 2006 The overarching transportation goals established in the VTrans2025 Final Report are the basis for the recently published Virginia’s Transportation Performance Report – 2006. The goals and associated performance measures are provided in Table 1. The Transportation Performance Report is the first of its kind for Virginia and will serve as the basis for a more comprehensive accountability and performance report that will result from the work of the Transportation Accountability Commission. Each section of the report is devoted to an overarching goal and presents performance and condition data as well as strategies to achieve the goals. At the end of each section there is a performance summary indicating whether the measures are trending in the desired direction. Finding 3 - The goals identified in VTrans2025 and the Virginia Transportation Performance Report - 2006 are reasonable and sufficiently broad to be used as a starting point. Finding 4 - Virginia’s transportation agencies have already implemented several performance management initiatives. Finding 5 - In addition to presenting information based on existing resources, it is also important to indicate what could be achieved if more resources were made available. States such as Ohio and Washington have laid a foundation for additional funding by using the performance management process to show their effectiveness in managing resources. One approach used by several states was to display performance that could be achieved with available resources and then compare that performance with the potential performance given an increase in funding. A valuable byproduct of this exercise was the improved communication about various aspects of system performance.
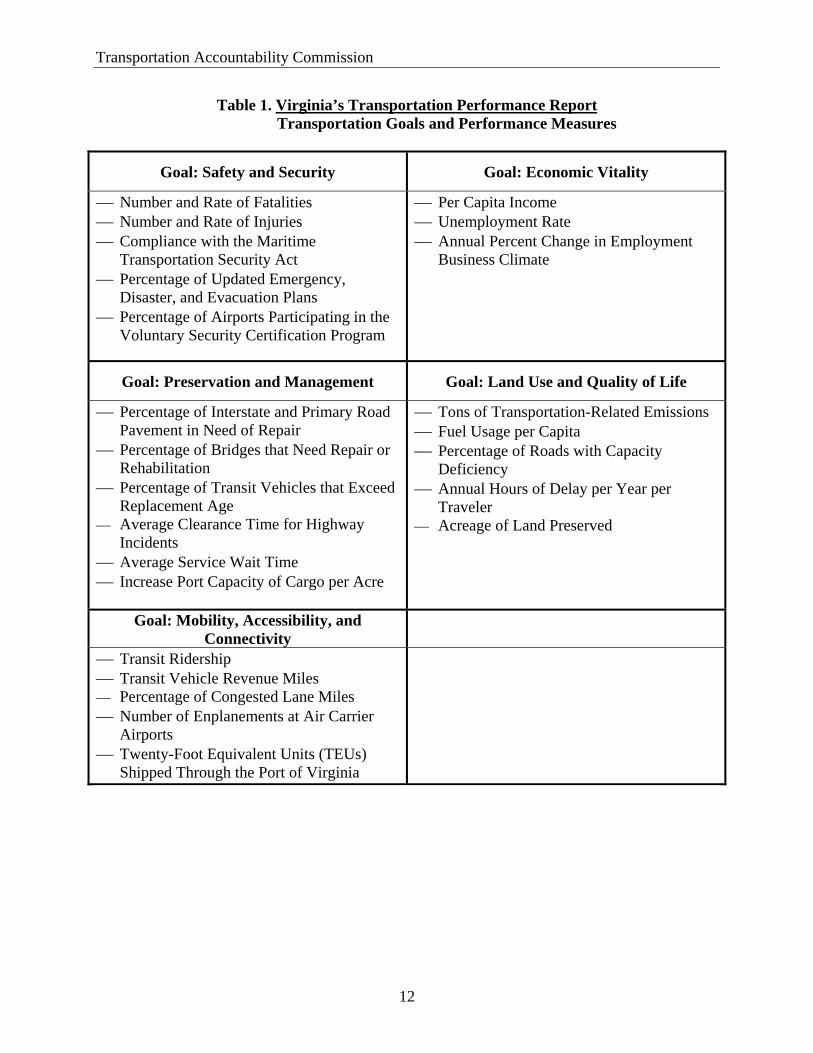
Transportation Accountability Commission
12
Table 1. Virginia’s Transportation Performance Report Transportation Goals and Performance Measures
Goal: Safety and Security Goal: Economic Vitality ⎯ Number and Rate of Fatalities ⎯ Number and Rate of Injuries ⎯ Compliance with the Maritime
Transportation Security Act ⎯ Percentage of Updated Emergency,
Disaster, and Evacuation Plans ⎯ Percentage of Airports Participating in the
Voluntary Security Certification Program
⎯ Per Capita Income ⎯ Unemployment Rate ⎯ Annual Percent Change in Employment
Business Climate
Goal: Preservation and Management Goal: Land Use and Quality of Life
⎯ Percentage of Interstate and Primary Road Pavement in Need of Repair
⎯ Percentage of Bridges that Need Repair or Rehabilitation
⎯ Percentage of Transit Vehicles that Exceed Replacement Age
⎯ Average Clearance Time for Highway Incidents
⎯ Average Service Wait Time ⎯ Increase Port Capacity of Cargo per Acre
⎯ Tons of Transportation-Related Emissions ⎯ Fuel Usage per Capita ⎯ Percentage of Roads with Capacity
Deficiency ⎯ Annual Hours of Delay per Year per
Traveler ⎯ Acreage of Land Preserved
Goal: Mobility, Accessibility, and Connectivity
⎯ Transit Ridership ⎯ Transit Vehicle Revenue Miles ⎯ Percentage of Congested Lane Miles ⎯ Number of Enplanements at Air Carrier
Airports ⎯ Twenty-Foot Equivalent Units (TEUs)
Shipped Through the Port of Virginia

Transportation Accountability Commission
13
Transportation Executive and Agency Accountability and Performance Agency Key Objectives and Performance Measures Agency Key Objectives and Performance Measures are one of four performance processes used to evaluate and measure the performance of all state agencies and their executives – including transportation agency heads. The key objectives and performance measures resulted from a review of the state’s performance management process by a panel of nationally recognized government management experts. The panel noted the measures in use at the time tended to address the operations of the agency and recommended that operations should continue to be measured but agency outcomes or results should be measured as well. In response, Governor Kaine required all state agencies to develop three to five key objectives and associated outcome measures. Key Objectives are the desired outcomes for the agency’s major programs or activities and Key Measures are indicators of how well an agency program is performing on the activities that reflect the agency’s primary mission. The measures were to be based on anticipated products/results of transportation system performance. They were also to be measurable. The agencies were to develop baselines for their measures and establish targets to improve agency performance. These measures are used by the Governor in budget decisions and the data summarizing each agency’s measures are reported on the Virginia Performs website. Performance targets and target dates (typically 2010) are set for each of the measures. The measures are updated quarterly or annually depending on the specific measure. The key objectives and performance measures currently used by each of Virginia’s transportation agencies are presented in Table 2.
Finding 6 - Several of the current performance measures are outside the “line-of-sight” or purview of an individual agency head (for example, the number of fatalities).
Recommendation 1 - Develop shared objectives and performance measures among multiple agency heads when a performance measure is beyond the span of control of an individual agency head.
Finding 7 - Performance measurement targets have been established for many of Virginia’s key measures, but they are typically set for 2010. Effective targets will have both short-term and long-term milestones. Without incremental milestones against which progress can be measured, long-term targets may never be met. Commission members further indicated that stretch targets/goals should be created without punishment for failure of full achievement.
Recommendation 2 - Develop stretch targets for agency heads and set interim performance targets.

Transportation Accountability Commission
14
Table 2. Agency Key Objectives and Performance Measures
Agency Objectives Measures
Improve Highway Safety Number of Fatalities Manage Congestion Annual Hours of Delay Improve Quality of Projects Construction Quality Index VDOT Complete Projects On-time and On-budget
% Projects Completed On-time and On-budget
Decrease Number of Traffic Fatalities Number of Fatalities
Provide Reasonable Customer Service Wait-time
Wait-time for Majority of Customers DMV
Reduce Number of Interactions Between Citizen and DMV
Average Number of Interactions to Complete a Single Transaction
Increase Aviation Utilization Number of Enplanements Economic Activity Generated Aviation
Provide Financial Assistance for Airport Development
Ratio of Grants Executed to Allocation
Manage Congestion Public Transportation Trips/Person
Retain, Improve, Develop Railways
% Rail Enhancement Projects On-time and On-Budget DRPT
Facilitate Dulles Metrorail Corridor Project Timely Execution of Phase 1
Enhance Port-Related Business Number of Port Related Jobs
Increase Business Through Port Number of Containers VPA
Enhance Cargo Handling Capability Cargo Per Acre/Per Year
Governor’s Management Scorecard The second performance process used to measure the performance of agencies and their executives is the Governor’s Management Scorecard. This performance management tool was implemented beginning in 2004 and provides performance information on the administrative operations of the agency. Performance is measured in six operational categories:
• Human Resource Management • Government Procurement • Financial Management • IT/Enterprise Architecture Initiatives

Transportation Accountability Commission
15
• Performance Management • Environmental & Historic Resource Stewardship
There are a total of 20 goals across the six categories and the rating for each goal is: Meets Expectations; Progress Towards; or, Below Expectations. The Governor’s Management Scorecard can be found on the Virginia Performs website. Finding 8 - The process used to evaluate the performance of agency executives captures agency operations and outcomes but does not directly address agency heads’ leadership abilities.
Recommendation 3 - Include a qualitative leadership component in the agency head performance review process. Leadership includes but is not limited to:
• Champions Governor’s priorities; understands the importance of goals and relationships
• Communicates the agency’s mission, vision and shared values • Leads by example • Acts in a professional and ethical manner within and outside the agency • Manages shifting priorities; makes tough calls; delivers on promises • Interacts effectively with diverse constituency groups, including General
Assembly members, board(s) and public and government officials • Promotes client/customer service
Finding 9 - Executive pay incentives should be given greater consideration as a performance management tool. The Commission acknowledged that government agency heads are motivated by the desire to do well and to be reappointed. There was also recognition, based on their collective experiences, that bonus pay might also play an important role.
Recommendation 4 - Utilize or amend provisions currently available in the Appropriation Act to provide opportunity for additional compensation and incentives when executive performance expectations are exceeded.
Finding 10 - Whether pertaining to executive or agency performance goals, lessons learned frequently are not carried forward because of the one-term gubernatorial system in Virginia.
Recommendation 5 - Develop legislative or administrative plans to foster longevity in performance measurement processes and lessons learned. Institutionalizing lessons learned will create staying power from one administration to another.
Agency Strategic and Service Area Plans Virginia’s efforts in performance management can be traced as far back as the 1980s with program budgeting. That program has evolved into Agency Strategic and Service Area Plans, launched in concurrence with development of the 2006-2008 Biennium Budget. Current law requires all executive level agencies to develop and publish strategic plans. Among other items,
Transportation Accountability Commission
16
the plans include each agency’s goals, key objectives and performance measures. Each of the goals is tied to the Virginia Performs key goals. The plans typically include the Agency Key Objectives and Performance Measures. Additionally, an aggregated version of the Governor’s Management Scorecard is included as a performance measure. Objectives and measures are developed for each of the agency’s program expenditure categories, called Service Areas. There are 98 measures for transportation. These are found on the Virginia Performs website. Agency Performance Reporting Systems The final processes used to measure the performance of agencies and their executives are the agency reporting systems which measure and report on programmatic, management and internal operations. VDOT’s Dashboard and Quarterly Report Card are examples. Both the Dashboard and the Quarterly Report Card are available to the public using VDOT’s public website. Both instruments are used to track and report VDOT’s performance on core business outcomes such as construction and maintenance contracts completed on time and on budget. DRPT provides DRPT Connections which tracks performance of projects. Similar types of performance reporting systems are utilized by the other transportation agencies.
Transportation Accountability Commission
17
IV. BEST PRACTICES FOR ACCOUNTABILITY AND PERFORMANCE MONITORING SYSTEMS
Several presentations were made to both the Outcome Measures and the Performance Standards Subcommittees on performance management trends and practices at the state and federal levels. A Review of Best Practices in the Use of Performance Measures Defined as “a way of monitoring progress toward a result or goal” (Cambridge Systematics, Inc., 2006, p. iii), performance measures are receiving increased attention in the literature and in transportation agencies. Over the years, transportation agencies have used various performance measures, but in recent years “performance management” has emerged as a practice that is both accepted and expected. Performance management is a key tool for establishing and maintaining accountability and, therefore, credibility. It also provides opportunity to communicate to various stakeholders. The focus for most performance measurement efforts has been in four areas:
1) Measuring system performance 2) Identifying agency performance 3) Providing accountability in delivering the program 4) Determining customer satisfaction
Performance measurement is used:
• as an aid in defining goals in long-range plans and programs and determining if they are met
• in real-time reporting of system conditions • in periodic performance reporting of the “state-of-the-state” or region • in guiding resource allocation and budgeting decisions • to drive results throughout an agency
State of the Practice across the Nation A 2004 scan of best practices2 identified Virginia as one of eleven states having notable applications of performance measures. Key features of the use of performance measures by six of those states – Arizona, Florida, Michigan, Minnesota, Oregon, and Washington - are summarized below. A summary of their key goals and performance measures can be found in Appendix C. Key Feature/Best Practice 1- Effective performance management links performance measures to specific policy goals and strategies to achieve those goals.
2 The Washington State Department of Transportation Strategic Assessment Office published a study on performance measures in 2006 titled “State of the Practice” Inventory March 2004—Learning From Others (Washington State Department of Transportation Strategic Assessment Office, Olympia, 2006, http://www.wsdot.wa.gov/accountability/library/State%20Inventory%20Handout.pdf.)
Transportation Accountability Commission
18
An essential feature of the effective use of performance measures is the linkage between performance measures and policy goals. Since what gets measured gets done, it is imperative to have measurements linked to key goals of the department or agency. Simply stated, it does not make sense to measure what is not important. Washington State uses a well-known “Gray Notebook” that contains performance measures associated with one of six strategic initiatives, their set of overarching transportation goals. One initiative is to “manage and operate state transportation facilities to improve the safety and reliability of state transportation systems for the benefit of travelers, shippers, and communities.” Washington State also has different policy goals established by or for different constituencies. The six strategic initiatives were established by the Governor, but the legislature has codified a series of nine transportation “benchmarks” and these also have specific performance measures associated with them. Key Feature/Best Practice 2 - Effective performance management will focus on a few key performance measures when reporting to the public and key stakeholders. More detailed measures can be used to support the higher-level measures. At a system level, the number of performance measures should be relatively small. This best practice indicates that there should be a relatively small number of goals. There are no rules for determining the appropriate number of performance measures although at a system level, the number of performance measures should be relatively small. One could start with a few and then add measures, incrementally. One weakness in Michigan’s process is the large number of goals and measures which the Michigan Department of Transportation itself reports as “too many.” Even though most states produce a relatively large number of measures, many use a much smaller number for reporting to the public at large. Typically, the smaller number of measures are indicators for the key goals and objectives defined for the agency or the system as a whole while there may be a myriad of measures used to manage operations, track production and efficiency, and to ensure transparency. Minnesota compares its system to a pyramid. System wide measures are the highest level of the pyramid and relate to the goals that guide the modal plans. The modal plans are supported by an even larger number of operational performance measures. These operational measures typically use a planning horizon of one year or less. The Oregon Department of Transportation has identified 28 “key” measures spanning the major impact areas that other states have also examined, such as safety, congestion, program delivery, environmental factors, and economic development, but another set of performance measures has been identified with a comparable level of detail in each impact area. Michigan DOT has identified 14 core performance measures that correspond with impact areas identified in many other states. The challenge for transportation professionals is to design a performance management system that is broad enough to ensure appropriate emphasis on all of the key areas. If the emphasis is too narrow, the agency could produce unexpected and undesirable outcomes.
Transportation Accountability Commission
19
Virginia currently uses five measures to report on its goal of safety and security and six measures to report on its goal of preserving and managing the existing transportation system. A discussion of Virginia’s system wide goals and measures is presented in Section III, under Transportation System Performance. Key Feature/Best Practice 3 - Effective performance management should distinguish between output measures and outcome measures. Agencies typically have more control over output measures. In the lexicon of performance management there is an important distinction between outcome measures and output measures. Generally, output measures are directly controlled by the state agency (e.g., number of lane miles repaired) and indicate the level of activity of an agency. Output measures are useful in tracking overall efficiency, at least in terms of the overall activity generated by a given budget level. The data are more readily accessible, and the measurement is simpler than outcome information. Outcome measures reflect the ultimate performance of the system (e.g., safety as measured by number of fatalities). They provide a better indication of the effectiveness of strategies developed to achieve particular goals, and they better communicate the success in meeting stated goals and objectives. Outcome measures will tend to be more meaningful to key stakeholders and the public but, in general, are more difficult to measure and will often be more difficult to link directly to actions of the agency. For example, safety is a good outcome performance measure but a transportation agency has less control over individual driving habits than it does over how many licenses it issues or miles it paves. Performance that is the easiest to achieve is the one over which the agency has direct control. This might indicate that output measures are the better performance measures, but the state of the practice involves both types of measures. Many states link their output measures to more understandable outcome measures for reporting to the public and key stakeholders. As an example, by linking the outcome of system preservation with number of bridges repaired, both measures become much more valuable as performance management tools. Minnesota, a state with substantial experience in the use of performance measures, is now beginning to emphasize output measures at lower levels of the organization. Those output measures are used to support the outcomes at higher levels. The Commission mainly focused on outcome measures currently in use to address the Commonwealth’s transportation system and the state of the practice in system performance management process. Key Feature/Best Practice 4 - Effective performance management will develop performance measures that are “realistic” in terms of the resources used and that are justified by their utility to managers and decision makers. When developing performance targets, it is important that they relate to the resources available. It is not helpful to project a future that cannot be achieved with existing funding although the

Transportation Accountability Commission
20
Commission members indicated they were interested in “stretch” targets without creating punishment for failure of full achievement. Key Feature/Best Practice 5 - Begin with existing data and identify what should be collected in the future. The development of performance management will evolve over time and experience may dictate different performance measures as time progresses. Waiting for perfect measures will delay the process. The literature suggests it is wise to take advantage of existing data sources. It is better to begin with what is available and identify improvements along the way. Some states created such large data collection exercises that the effort toppled from its own weight. Additionally, many states have found that they needed to revise their data collection strategies to support effective performance measurement. Key Feature/Best Practice 6 - Transportation agencies are encouraged to take advantage of and learn from benchmarking and peer comparisons. Historically, this has been a sensitive area. In the words of one presenter, “Every agency perceives that it is unique.” Nonetheless, peer comparisons are unavoidable and so the agency should seek to control the agenda; i.e., agencies should choose and provide peer comparisons using measures appropriate for the issues and challenges facing their transportation systems. The Federal Performance and Accountability Report The Commission was charged with reviewing both state and federal best practices and received a presentation from Irene Rico of the Federal Highway Administration’s (FHWA). Ms. Rico reviewed the Performance and Accountability Report that is produced by the USDOT. USDOT’s Performance and Accountability Report is a comprehensive national summary of performance and financial information that assists the Congress, the President, and the public to assess the performance of the Department relative to its mission. The Report provides a summary of the most important performance results and challenges for the fiscal year; a brief analysis of financial performance; a brief description of systems, controls, and legal compliance; and information on the Department's progress in implementing the President's Management Agenda. The Report also addresses the management challenges identified by the USDOT’s Inspector General and a summary of the Inspector General’s audit report. The report covers each Operating Agency in the Department. The performance section of the report provides discussion and performance measures in the following five key Department-wide strategic areas:
• Safety • Mobility • Global Connectivity • Environmental Stewardship • Security

Transportation Accountability Commission
21
The report provides at least four years of actual performance information focused on outcome orientations. For the report year, actual performance is compared with targets. Where performance goals were not achieved, explanation is provided. There is also a presentation of plans and schedules to meet future goals.

Transportation Accountability Commission
22
V. THE NEXT STEPS FOR THE COMMISSION
During the past four months, the Commission has reviewed existing methods for promoting accountability and performance in transportation and identified best practices used in other states and by the USDOT. The Commission also reviewed and made recommendations on the performance standards for transportation executives. As the Commission moves into the second half of its mission, several tasks outlined in Executive Order 37 remain to be completed. The final report due October 1, 2007, will contain:
• Recommendations for overarching transportation system goals and performance
measures • Recommendations for the agency outcome measures • Recommendations for quantifiable outcome measures for linking economic and land use
and transportation • A discussion as to whether there are quantifiable ways to measure a transportation
project’s positive or negative community impacts The Commission will also address several issues that were identified in Executive Order 37. House Bill 3202, which was enacted by the 2007 General Assembly and approved by the Governor as Chapter 896 of the 2007 Acts of the Assembly, requires certain quantifiable measures and achievable goals to be included in statewide and regional transportation plans. The Commission will address these measures and goals in its final recommendations. Additionally, other critical accountability and performance issues identified during the Commission’s deliberations will be discussed and recommendations made where appropriate. Finally, the Commission will solicit input from the Commonwealth Transportation Board, other transportation policy boards and the public prior to issuing a final report.

Transportation Accountability Commission
23
Appendix A.
Executive Order 37 (2006)
Executive Order 37 (2006)
Creating the Transportation Accountability Commission
Importance of the Issue
Virginians face a transportation crisis. Too many of our citizens spend too much of their time gridlocked in traffic, at the cost of time with their families and time at work. Our aging transportation infrastructure is increasingly expensive to maintain. Current development patterns increase demand for additional highways and roads and are not fiscally sustainable over the long-term. Public transportation options are not as widely available as needed for Virginia’s seniors, the disabled, and those who seek convenient alternatives to sitting in traffic. Throughout Virginia, our people are eager for improvements in transportation to increase mobility and safety. Such improvements require that transportation decisions be better linked with local land use planning. Collaboration between the state and local government in transportation planning needs to be a high priority.
Significant additional public and private investments are needed in the upgrading of Virginia’s transportation system. Prudence and accountability demand that these funds be used in the most efficient and effective manner possible. Great strides have been made during the past four and a half years in increasing the percentage of on-time and on-budget transportation projects. Tremendous progress has also been made in making transportation projects more transparent, through VDOT’s Dashboard Program and other means. The establishment of an Intermodal Office is improving multi-modal planning and coordination.
However, more remains to be done to ensure that Virginia has a transportation system that delivers the maximum value for the money paid by taxpayers, implements rigorous management standards, adheres to appropriate free market principles and promotes wise investments. We must ensure that all transportation dollars are spent wisely and that our transportation agencies are held accountable for their performance.
Accordingly I am calling together leaders from the Commonwealth to address this critical challenge.
Creation of the Commission
By the power vested in me by Article V of the Constitution of Virginia, and Section 2.2 of the Code of Virginia, and mindful of the critical importance of this issue, I hereby create the Transportation Accountability Commission (the Commission) and direct it to begin work immediately. The Commission will be composed of 15 members, including local government leaders, legislators, business leaders, and community leaders. Additional members may be appointed at the Governor’s discretion. In addition, the Secretaries of Transportation, Finance, and Natural Resources will serve as ex officio members of the Commission. The Governor shall designate a chair and vice chair of the Commission.
The Commission will have the following responsibilities:
1. Reviewing Virginia’s existing methods of promoting accountability and performance in transportation.
2. Identifying and recommending national best practices in accountability and performance for transportation.
3. Recommending quantifiable outcome measures for the major elements of the state’s transportation program, including measures that incorporate effective land-use and transportation coordination.
4. Recommending performance standards for state transportation executives and agencies.

Transportation Accountability Commission
24
In recommending outcome measures, the Commission will consider whether there are quantifiable ways to measure a transportation project’s positive or negative community impacts.
I direct the Commission to make an interim report to the Governor and General Assembly by May 30, 2007, and a final report by October 1, 2007. Staff support for the Commission will be provided by the Office of the Secretary of Transportation, the Office of the Governor, the Virginia Department of Transportation, the Virginia Department of Rail and Public Transportation, the Department of Planning and Budget, and other agencies as may be designated by the Governor. All executive branch agencies shall cooperate fully with the Commission and provide any assistance necessary, upon request of the Commission or its staff.
This commission shall be considered a gubernatorial advisory commission. Direct costs for the commission shall not exceed $10,000, exclusive of staff time.
Effective Date of the Order
This Executive Order shall become effective upon its signing and shall remain in full force and effect until October 1, 2007, unless amended or rescinded by further executive order. It is my intent to renew this commission, as provided for by law, at this time next year.
Given under my hand and under the Seal of the Commonwealth of Virginia this 10th day of October, 2006
/s/ Timothy M. Kaine, Governor
Attest:
/s/ Secretary of the Commonwealth
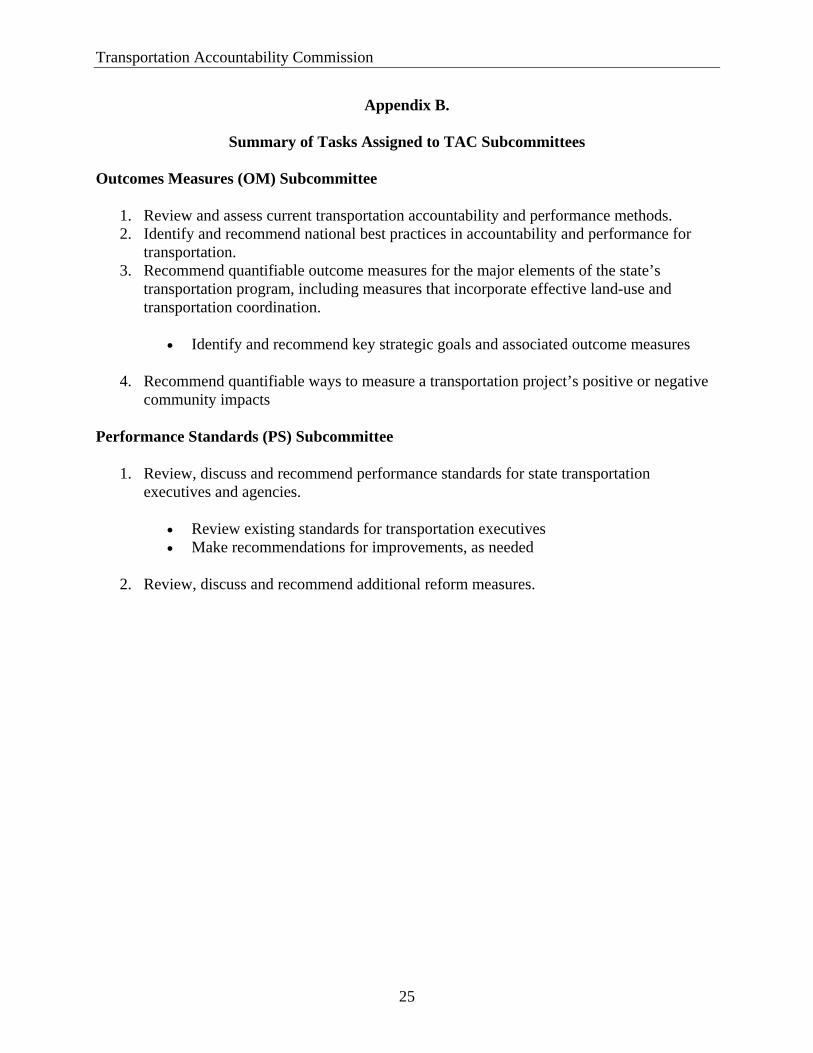
Transportation Accountability Commission
25
Appendix B.
Summary of Tasks Assigned to TAC Subcommittees Outcomes Measures (OM) Subcommittee
1. Review and assess current transportation accountability and performance methods. 2. Identify and recommend national best practices in accountability and performance for
transportation. 3. Recommend quantifiable outcome measures for the major elements of the state’s
transportation program, including measures that incorporate effective land-use and transportation coordination.
• Identify and recommend key strategic goals and associated outcome measures
4. Recommend quantifiable ways to measure a transportation project’s positive or negative community impacts
Performance Standards (PS) Subcommittee
1. Review, discuss and recommend performance standards for state transportation executives and agencies.
• Review existing standards for transportation executives • Make recommendations for improvements, as needed
2. Review, discuss and recommend additional reform measures.

Transportation Accountability Commission
26
Appendix C.
Review of Best Practices in Selected Peer States Arizona The mission of the Arizona Department of Transportation (ADOT) is to provide products and services for a safe, efficient, cost-effective transportation system that links Arizona to the global economy, promotes economic prosperity and demonstrates respect for Arizona’s environment and quality of life. ADOT has developed 8 specific goals. The table below lists ADOT’s performance measures grouped according to the relevant goal. Mobility and Economic Competitiveness are grouped together since performance measures for those factors apply to both of those goals: GOAL #1: Mobility GOAL #2: Economic Competitiveness • Percent of Person-Miles Traveled by Level of Service • Average Delay Per Trip GOAL #3: Connectivity • Passing Ability • Intercity Travel Time Connectivity GOAL #4: Preservation • Reconstruction Need • Pavement Condition • Vehicle Miles Traveled by Pavement Condition • Bridge Condition • Vehicle Trips by Bridge Condition GOAL #5: Reliability • Additional Unexpected Delay GOAL #6: Safety • Accidents Per 100 Million Vehicle Miles Traveled by Functional Class • Anticipated Change in Fatalities/Injuries GOAL #7: Accessibility • Park-and-Ride Spaces

Transportation Accountability Commission
27
• Bus Turnouts • Bike Suitability GOAL #8: Resource Conservation • Total Mobile Source Emissions • Percentage of Air Quality Improvement Projects Selected • Noise Exposure • Projects Listed in Regional Transportation Plans • Fuel Consumption

Transportation Accountability Commission
28
Florida The mission of the Florida Department of Transportation (FDOT) is to provide a safe transportation system that ensures the mobility of people and goods, enhances economic prosperity, and preserves the quality of Florida’s environment and communities. FDOT has developed 5 primary goals and associated outcome measures related to each of the goals. FDOT’s list of goals and the associated performance measures are listed below. GOAL #1: A Safer and More Secure Transportation System • Highway fatality rate per 100 million vehicle miles traveled • Bicyclist fatality and serious injury rate per 100,000 population • Pedestrian fatality and serious injury rate per 100,000 population • Motorcyclist fatality and serious injury rate per 1,000 registered motorcycles GOAL #2: Enriched Quality of Life and Responsible Environmental Stewardship* GOAL #3: Adequate and Cost-Efficient Maintenance and Preservation of Transportation Assets • Percent of pavement on the State Highway System meets Department standards • Percent of FDOT maintained bridges that meet Department standards • Percent of the acceptable maintenance standard on the State Highway System achieved GOAL #4: A Stronger Economy Through Enhanced Mobility for People and Freight • Average growth rate in person-hours of delay on the Florida Interstate Highway System • Percent of Florida’s counties that have entered into regional partnerships to compete for Transportation
Regional Incentive Program (TRIP) funds • Number of commercial vehicle crashes on the State Highway System per 100 million vehicle miles
traveled • Intelligent Transportation Systems technology deployed on critical state corridors • Transit ridership GOAL #5: Sustainable Transportation Investments for Florida’s Future • Percent of discretionary capacity funds programmed to the Strategic Intermodal System * Florida’s long term transportation plan did not include any measures for this specific goal.

Transportation Accountability Commission
29
Minnesota The mission of the Minnesota Department of Transportation (Mn/DOT) is to improve access to markets, jobs, goods, and services and improve mobility for Minnesotans by focusing on priority transportation improvements and investments that help Minnesotans travel safer, smarter, and more efficiently. Below is a table of 10 policies from the Mn/DOT long range transportation plan, including performance measures that Mn/DOT has established for each. POLICY #1: Preserve Essential Elements of Existing Transportation Systems • Customer Ride Quality (Highway Pavement): Lane-miles of highway pavement that have good and
poor ride quality as measured statewide by Present Serviceability Rating • Physical Condition (Airport Pavements) • Physical Condition (Highway Pavement) • Physical Condition (Bridges) • Physical Condition (Transit Fleet Life) POLICY #2: Support Land Use Decisions that Preserve Mobility and Enhance the Safety of Transportation Systems • Consistency of Local Plans and Ordinances with Access Management Guidelines (Highways) • Airspace or Land that is Protected (Airports): Percent of airports for which airspace or land have
been protected to meet safety, noise, and height clearance requirements and expansion plans as identified in Master Plans or Airport Layout Plans
• Right-of-Way that is Protected (Highways): Percent of Interregional Corridor and bottleneck
removal projects that have been identified in the 10-Year Work Plan for which rights-of-way have been protected, either through purchase, official mapping or zoning
• Right-of-Way that is Protected (Transit Infrastructure): Percent of Transit Advantages projects
that have been identified in the 10-year construction program for which rights-of-way have been protected, either through purchase, official mapping or zoning
POLICY #3: Effectively Manage the Operation of Existing Transportation Systems to Provide Maximum Service to Customers • Travel Time Reliability (Incident Clearance Time on Urban Freeways) • Travel Time Reliability (Ice and Snow Removal): Number of hours it takes to achieve bare lanes
after a weather event ends • Travel and Flow Management (Highways): Percent of Principal Arterial corridor-miles in Regional
Trade Centers 0 and 1 that are highly, moderately or minimally managed
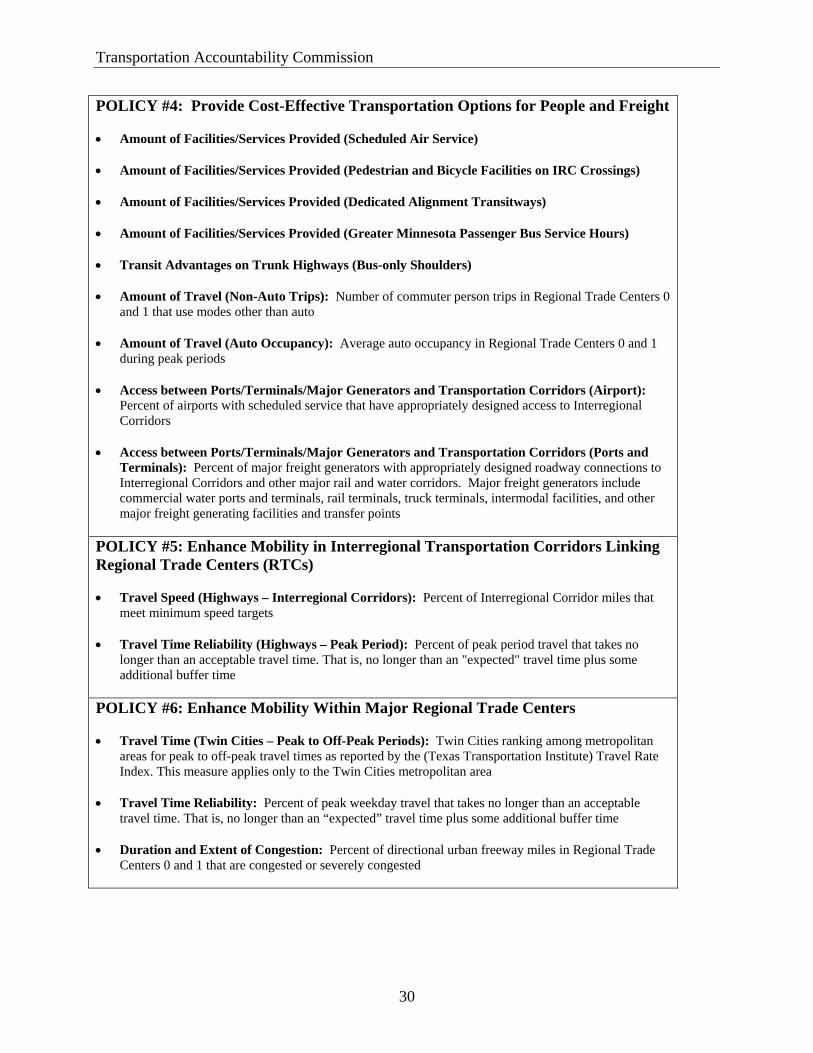
Transportation Accountability Commission
30
POLICY #4: Provide Cost-Effective Transportation Options for People and Freight • Amount of Facilities/Services Provided (Scheduled Air Service) • Amount of Facilities/Services Provided (Pedestrian and Bicycle Facilities on IRC Crossings) • Amount of Facilities/Services Provided (Dedicated Alignment Transitways) • Amount of Facilities/Services Provided (Greater Minnesota Passenger Bus Service Hours) • Transit Advantages on Trunk Highways (Bus-only Shoulders) • Amount of Travel (Non-Auto Trips): Number of commuter person trips in Regional Trade Centers 0
and 1 that use modes other than auto • Amount of Travel (Auto Occupancy): Average auto occupancy in Regional Trade Centers 0 and 1
during peak periods • Access between Ports/Terminals/Major Generators and Transportation Corridors (Airport):
Percent of airports with scheduled service that have appropriately designed access to Interregional Corridors
• Access between Ports/Terminals/Major Generators and Transportation Corridors (Ports and
Terminals): Percent of major freight generators with appropriately designed roadway connections to Interregional Corridors and other major rail and water corridors. Major freight generators include commercial water ports and terminals, rail terminals, truck terminals, intermodal facilities, and other major freight generating facilities and transfer points
POLICY #5: Enhance Mobility in Interregional Transportation Corridors Linking Regional Trade Centers (RTCs) • Travel Speed (Highways – Interregional Corridors): Percent of Interregional Corridor miles that
meet minimum speed targets • Travel Time Reliability (Highways – Peak Period): Percent of peak period travel that takes no
longer than an acceptable travel time. That is, no longer than an "expected" travel time plus some additional buffer time
POLICY #6: Enhance Mobility Within Major Regional Trade Centers • Travel Time (Twin Cities – Peak to Off-Peak Periods): Twin Cities ranking among metropolitan
areas for peak to off-peak travel times as reported by the (Texas Transportation Institute) Travel Rate Index. This measure applies only to the Twin Cities metropolitan area
• Travel Time Reliability: Percent of peak weekday travel that takes no longer than an acceptable
travel time. That is, no longer than an “expected” travel time plus some additional buffer time • Duration and Extent of Congestion: Percent of directional urban freeway miles in Regional Trade
Centers 0 and 1 that are congested or severely congested

Transportation Accountability Commission
31
POLICY #7: Increase the Safety and Security of Transportation Systems and Their Users • Crash Rate (Highways, Passenger Service and Freight): Annual crash rate on state trunk highways
using three-year averages • Total Crashes (General Aviation): Average total general aviation crashes (three-year average) as
reported to and defined by the Federal Aviation Administration (FAA) • Total Crashes (At-Grade Railroad Crossings): Average total crashes occurring at at-grade railroad
crossings as reported by the Department of Public Safety (three-year averages) • Total Fatalities (Highways, Passenger Service and Freight): Annual roadway-related fatalities
using three-year averages • Total Fatalities (General Aviation): Average annual general aviation fatalities as reported by the
FAA for Minnesota POLICY #8: Continually Improve Mn/DOT’s Internal Management and Program Delivery • Construction Project Timeliness: Percent of Mn/DOT projects in the first year of the State
Transportation Improvement Program that are let for construction in that same planned year • Construction Project Cost Deviation – Preconstruction: Percent variation in major projects’ cost
from estimates when projects first enter the State Transportation Improvement Program (STIP) to actual cost when let for construction
• Administrative Support Rate: General Administrative expenditures as a percent of total
expenditures POLICY #9: Inform, Involve and Educate All Potentially Affected Stakeholders in Transportation Plans and Investment Decision Processes • Perceived Reliability of Mn/DOT Information: Percent of customers satisfied with the reliability of
Mn/DOT’s communications

Transportation Accountability Commission
32
POLICY #10: Protect the Environment and Respect Community Values • Air Pollutants – Federal Compliance Standards: Outdoor levels of ozone, nitrogen dioxide, carbon
monoxide and particulate matter as a percent of the National Ambient Air Quality Standards (NAAQS) • Carbon Dioxide Emissions: Estimated carbon dioxide emissions from motor vehicles in Minnesota • Cleaner Fuels: Percent of Mn/DOT fuel consumption defined as cleaner fuels • Compliance with Erosion Control: Percent of National Pollution Discharge Elimination System
Mn/DOT permits that have violations • Wetlands Affected and Replaced • Wetland Success Criteria: Percent of replaced wetlands where wetland types are as planned • Land Acres Replanted with Native Species • Conversion of Undeveloped Land: Number of undeveloped acres converted to another land use • Streamlining of Environmental Process: Time to complete Environmental Impact Statement,
Environmental Assessment, Environmental Assessment Worksheet per project

Transportation Accountability Commission
33
Oregon
The Oregon Department of Transportation (ODOT) has developed 28 Key Performance Measures that were used during fiscal year 2005-2006. The 28 measures directly support ODOT goals. The measures affect all modes of transportation. The agency’s focus on customer service is highlighted, as are measures that affect Oregonians’ livability and the state’s environment. ODOT’s goals have been articulated in the agency’s Strategic Direction, drafted by senior management in 2000 and confirmed again in 2006. ODOT’s mission is to provide a safe, efficient transportation system that supports economic opportunity and livable communities for Oregonians. Below is a matrix of ODOT goals and the associated performance measures that ODOT has adopted for each goal.
GOAL #1: Improve Travel Safety in Oregon
• Traffic Fatalities • Traffic Injuries • Safe Drivers: Percent of drivers who avoided traffic violations and accidents for the prior three years • Impaired Driving-Related Traffic Fatalities • Use of Safety Belts • Large Truck At-Fault Crashes • Rail Crossing Incidents • Derailment Incidents • Travelers Feel Safe: Percent of public satisfied with transportation safety

Transportation Accountability Commission
34
GOAL #2: Move People and Goods Efficiently • Special Transit Rides: Average number of special transit rides per each elderly and disabled
Oregonian annually • Travel Delay: Hours of travel delay per capita per year in urban areas • Passenger Rail Ridership: Number of state-supported rail service passengers • Alternatives to One-Person Commuting: Percent of Oregonians who commute to work during peak
hours by means other than Single Occupancy Vehicle • Traffic Volume: Vehicle Miles Traveled per capita in Oregon metropolitan areas for local non-
commercial trips • Pavement Condition • Bridge Condition
GOAL #3: Provide a Transportation System that Supports Livability and Economic Prosperity • Fish Passage at State Culverts: Number of high priority ODOT culverts remaining to be retrofitted
or replaced to improve fish passage • Intercity Passenger Service: Percent of Oregon communities of 2,500 or more with intercity bus or
rail passenger service • Bike Lanes and Sidewalks: Percent of urban state highway miles with bike lanes and pedestrian
facilities in “fair” or better condition • Jobs from Construction Spending: Number of jobs sustained as a result of annual construction
expenditures • Timeliness of Projects Going to Construction Phase: Percent of projects going to construction
phase within 90 days of target date • Construction Project Completion Timeliness: Percent of projects with the construction phase
completed within 90 days of original contract completion date • Construction Projects On Budget: Percent of projects completed on or under projected preliminary
engineering, right-of-way and construction costs • Certified Businesses (Disadvantaged, Minority, Women, and Emerging Small Businesses):
Percent of ODOT contract dollars awarded to disadvantaged, minority, women, and emerging small businesses
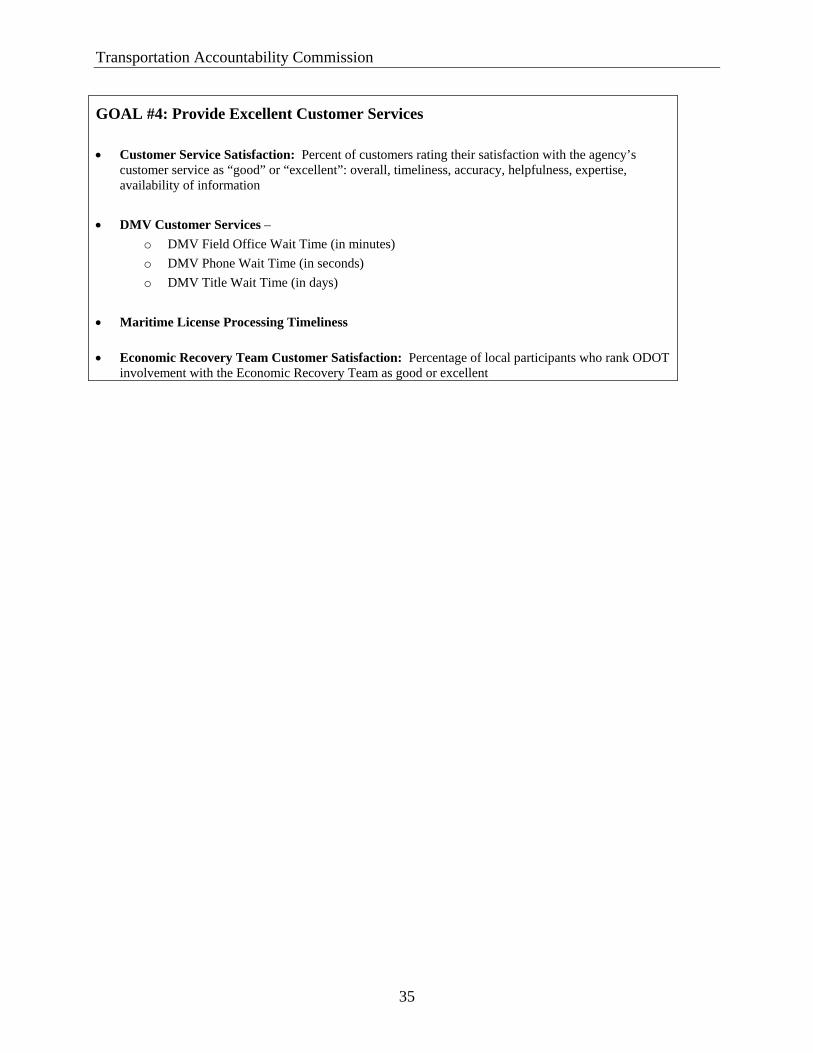
Transportation Accountability Commission
35
GOAL #4: Provide Excellent Customer Services • Customer Service Satisfaction: Percent of customers rating their satisfaction with the agency’s
customer service as “good” or “excellent”: overall, timeliness, accuracy, helpfulness, expertise, availability of information
• DMV Customer Services –
o DMV Field Office Wait Time (in minutes) o DMV Phone Wait Time (in seconds) o DMV Title Wait Time (in days)
• Maritime License Processing Timeliness • Economic Recovery Team Customer Satisfaction: Percentage of local participants who rank ODOT
involvement with the Economic Recovery Team as good or excellent
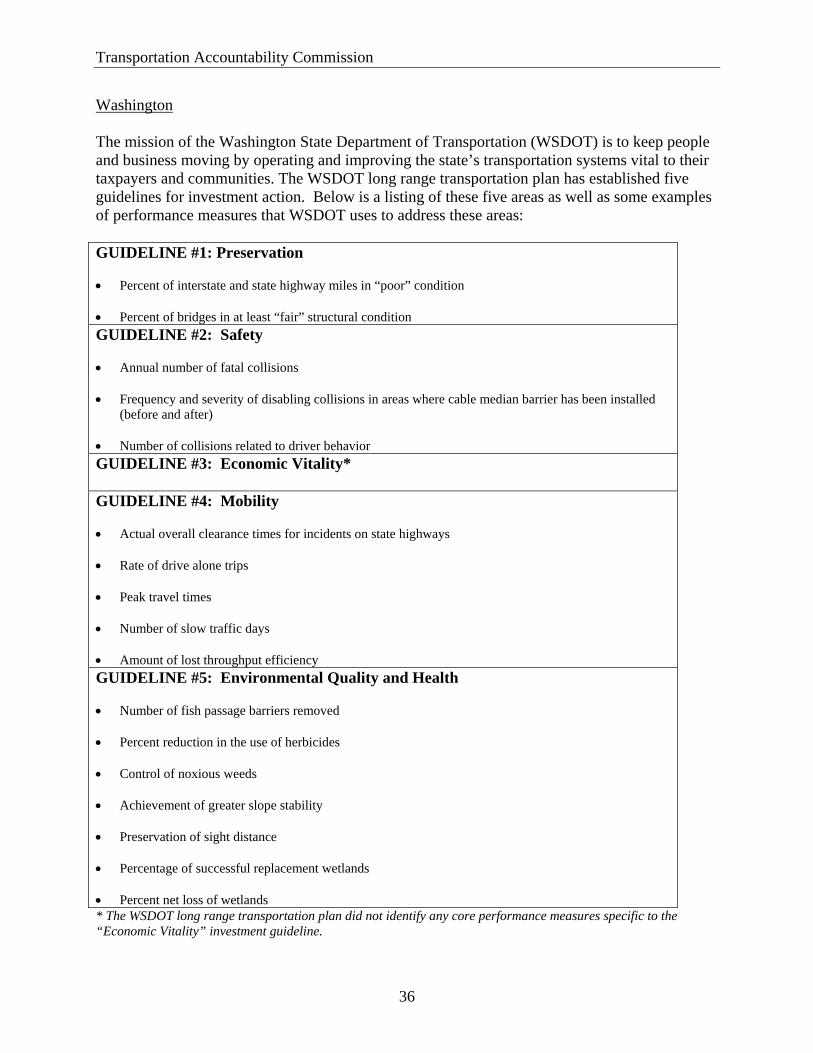
Transportation Accountability Commission
36
Washington The mission of the Washington State Department of Transportation (WSDOT) is to keep people and business moving by operating and improving the state’s transportation systems vital to their taxpayers and communities. The WSDOT long range transportation plan has established five guidelines for investment action. Below is a listing of these five areas as well as some examples of performance measures that WSDOT uses to address these areas: GUIDELINE #1: Preservation • Percent of interstate and state highway miles in “poor” condition • Percent of bridges in at least “fair” structural condition GUIDELINE #2: Safety • Annual number of fatal collisions • Frequency and severity of disabling collisions in areas where cable median barrier has been installed
(before and after) • Number of collisions related to driver behavior GUIDELINE #3: Economic Vitality* GUIDELINE #4: Mobility • Actual overall clearance times for incidents on state highways • Rate of drive alone trips • Peak travel times • Number of slow traffic days • Amount of lost throughput efficiency GUIDELINE #5: Environmental Quality and Health • Number of fish passage barriers removed • Percent reduction in the use of herbicides • Control of noxious weeds • Achievement of greater slope stability • Preservation of sight distance • Percentage of successful replacement wetlands • Percent net loss of wetlands * The WSDOT long range transportation plan did not identify any core performance measures specific to the “Economic Vitality” investment guideline.

Transportation Accountability Commission
37