transportation and sustainability best practices...
TRANSCRIPT
1
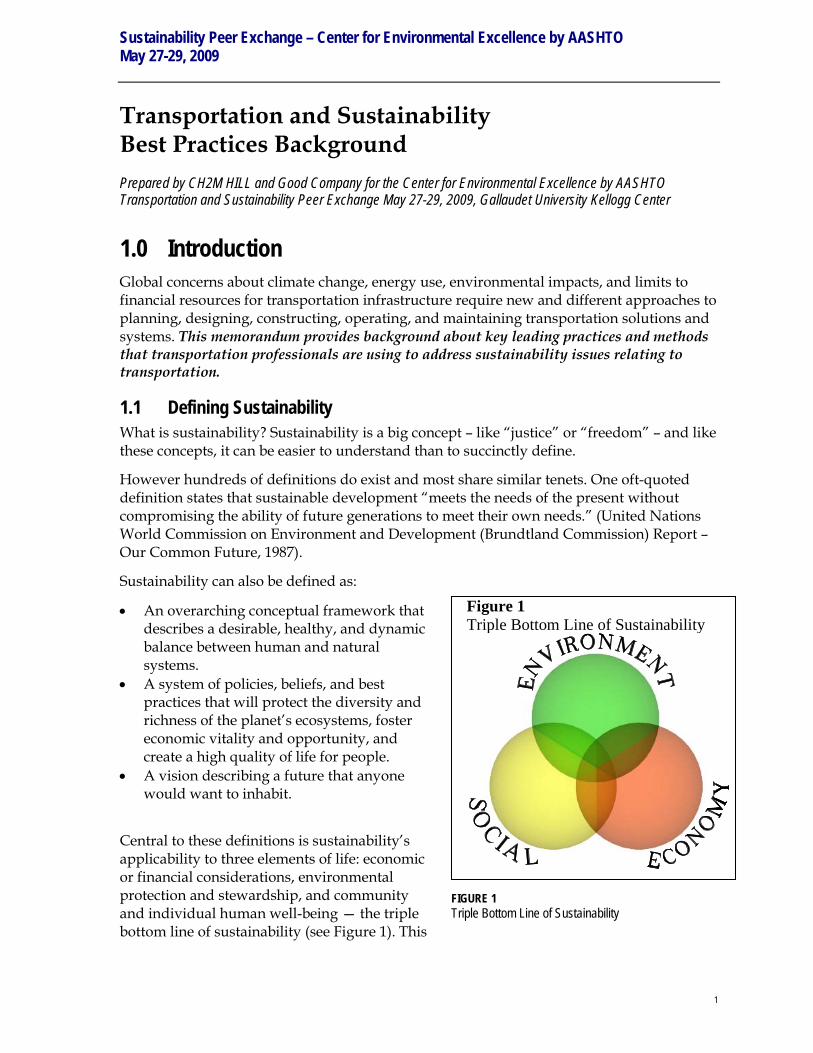
Figure 1 Triple Bottom Line of Sustainability
FIGURE 1 Triple Bottom Line of Sustainability
Sustainability Peer Exchange – Center for Environmental Excellence by AASHTO May 27-29, 2009
Transportation and Sustainability Best Practices Background
Prepared by CH2M HILL and Good Company for the Center for Environmental Excellence by AASHTO Transportation and Sustainability Peer Exchange May 27-29, 2009, Gallaudet University Kellogg Center
1.0 Introduction Global concerns about climate change, energy use, environmental impacts, and limits to financial resources for transportation infrastructure require new and different approaches to planning, designing, constructing, operating, and maintaining transportation solutions and systems. This memorandum provides background about key leading practices and methods that transportation professionals are using to address sustainability issues relating to transportation.
1.1 Defining Sustainability What is sustainability? Sustainability is a big concept – like “justice” or “freedom” – and like these concepts, it can be easier to understand than to succinctly define.
However hundreds of definitions do exist and most share similar tenets. One oft-quoted definition states that sustainable development “meets the needs of the present without compromising the ability of future generations to meet their own needs.” (United Nations World Commission on Environment and Development (Brundtland Commission) Report – Our Common Future, 1987).
Sustainability can also be defined as:
• An overarching conceptual framework that describes a desirable, healthy, and dynamic balance between human and natural systems.
• A system of policies, beliefs, and best practices that will protect the diversity and richness of the planet’s ecosystems, foster economic vitality and opportunity, and create a high quality of life for people.
• A vision describing a future that anyone would want to inhabit.
Central to these definitions is sustainability’s applicability to three elements of life: economic or financial considerations, environmental protection and stewardship, and community and individual human well-being — the triple bottom line of sustainability (see Figure 1). This
2
means improving the economic and social quality of life while limiting impacts on the environment to the carrying capacity of nature. In this framework, ideal solutions to any type of challenge will generate long-term benefits in all three areas.
Scientists, economists, governments and business acknowledge that current and predicted imbalances in natural systems (such as fresh water shortages, energy supply limits, global climate change, and population increases) will adversely affect economic systems and human quality of life if not addressed. Sustainability is a powerful approach for examining these issues; consequently, it is attracting serious attention by leaders of nations, industry and communities.
The number of sustainability-related trends—such as global water needs, changes in global climate, and energy demands—has created an uncertain business environment in which new issues, legislation, stakeholder expectations, and technologies must be considered.
1.2 Definition of Sustainable Transportation The University of Plymouth Centre for Sustainable Transport provides a widely accepted definition of a sustainable transportation system that states:
A sustainable transportation system is one that:
• allows the basic access needs of individuals and societies to be met safely and in a manner consistent with human and ecosystem health, and with equity within and between generations;
• is affordable, operates efficiently, offers choice of transport mode, and supports a vibrant economy;
• limits emissions and waste within the planet’s ability to absorb them, minimizes consumption of non-renewable resources to the sustainable yield level, reuses and recycles its components, and minimizes the use of land and the production of noise.
Such sustainability improvements around transportation may not be achieved quickly. However, using a Triple Bottom Line framework to guide planning, policy decisions, and implementation can provide steps toward developing a sustainable outcome. When thinking about delivering transportation solutions and infrastructure in a more sustainable manner, agencies and companies are considering each of the bottom line elements:
• Economy — Support economic vitality while developing infrastructure in a cost-efficient manner. Costs of infrastructure must be within a society’s ability and willingness to pay. User costs, including private costs, need to be within the ability of people and households to pay for success.
• Social — Meet social needs by making transportation accessible, safe, and secure; include provision of mobility choices for all people (including people with economic disadvantages); and develop infrastructure that is an asset to communities.
• Environment — Create solutions that are compatible with - and that can be an enhancement to - the natural environment, reduce emissions and pollution from the transportation system, and reduce the material resources required to support transportation.
3
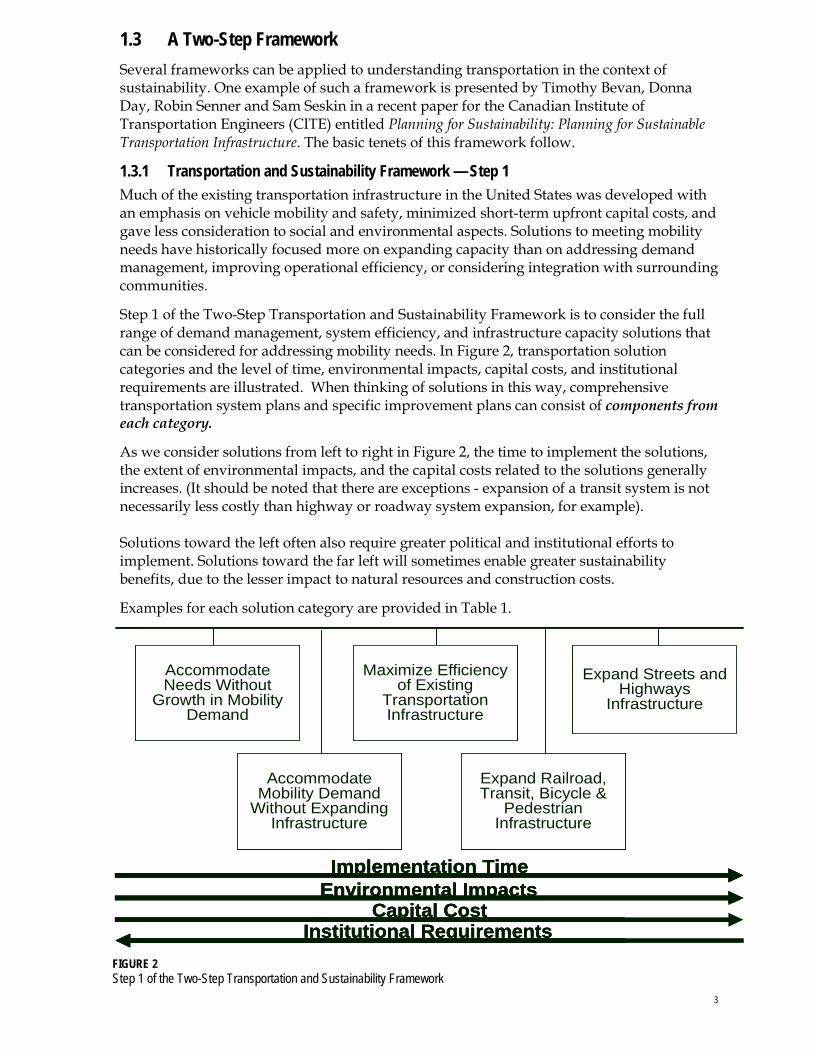
FIGURE 2 Step 1 of the Two-Step Transportation and Sustainability Framework
Accommodate Needs Without
Growth in Mobility Demand
Maximize Efficiency of Existing
Transportation Infrastructure
Expand Railroad, Transit, Bicycle &
Pedestrian Infrastructure
Accommodate Mobility Demand
Without Expanding Infrastructure
Expand Streets and Highways
Infrastructure
Implementation Time
Capital CostEnvironmental Impacts
Institutional Requirements
1.3 A Two-Step Framework Several frameworks can be applied to understanding transportation in the context of sustainability. One example of such a framework is presented by Timothy Bevan, Donna Day, Robin Senner and Sam Seskin in a recent paper for the Canadian Institute of Transportation Engineers (CITE) entitled Planning for Sustainability: Planning for Sustainable Transportation Infrastructure. The basic tenets of this framework follow.
1.3.1 Transportation and Sustainability Framework — Step 1 Much of the existing transportation infrastructure in the United States was developed with an emphasis on vehicle mobility and safety, minimized short-term upfront capital costs, and gave less consideration to social and environmental aspects. Solutions to meeting mobility needs have historically focused more on expanding capacity than on addressing demand management, improving operational efficiency, or considering integration with surrounding communities.
Step 1 of the Two-Step Transportation and Sustainability Framework is to consider the full range of demand management, system efficiency, and infrastructure capacity solutions that can be considered for addressing mobility needs. In Figure 2, transportation solution categories and the level of time, environmental impacts, capital costs, and institutional requirements are illustrated. When thinking of solutions in this way, comprehensive transportation system plans and specific improvement plans can consist of components from each category.
As we consider solutions from left to right in Figure 2, the time to implement the solutions, the extent of environmental impacts, and the capital costs related to the solutions generally increases. (It should be noted that there are exceptions - expansion of a transit system is not necessarily less costly than highway or roadway system expansion, for example). Solutions toward the left often also require greater political and institutional efforts to implement. Solutions toward the far left will sometimes enable greater sustainability benefits, due to the lesser impact to natural resources and construction costs.
Examples for each solution category are provided in Table 1.
4
TABLE 1 Examples of Solutions for Sustainable Mobility Categories for Step 1
Sustainable Mobility Categories Select Examples of Solutions
Accommodate Needs Without Growth in Mobility Demand
Jobs/housing balance in subareas
Affordable housing in employment centers
Promote telecommute programs
Pricing
Accommodate Mobility Demand Without Expanding Infrastructure
Ridesharing programs
Increased transit service levels
Bicycle sharing programs
Maximize Efficiency of Existing Transportation Infrastructure
Incident management and response
Intelligent Transportation Systems
Access Management
Operations and maintenance
Expand Railroad, Transit, Bicycle and Pedestrian Infrastructure
Bikeways and pathways
High Occupancy Vehicle lanes/Busways/Bus Rapid Transit
Light rail
Expand Streets and Highways Infrastructure
General purpose streets and roadways
Limited access highways/freeways
Highway grade separations
1.3.2 Transportation and Sustainability Framework — Step 2 Step 2 of the Two-Step Transportation and Sustainability Framework comes into play when a transportation agency decides that a transportation problem is best addressed through the construction of new infrastructure. When infrastructure solutions are selected to meet mobility needs, further opportunities to improve sustainability are available. Step 2 frames projects in more sustainable ways by aligning projects to five broad objectives: Reduce Energy Consumption, Reduce Consumption of Material Resources, Reduce Impacts to Environmental Resources, Support Vibrant Urban Communities, and Support Sustainability During Implementation (defined as construction and operations and maintenance). The objectives are described further below.
• Reduce Energy Consumption — includes options and project solutions that reduce energy consumption, support energy efficient movement of people and goods, and use resources with lower operations and maintenance requirements.
• Reduce Consumption of Material Resources — includes design solutions that reduce the consumption of virgin material resources, use recycled materials in construction, require less infrastructure in the solution, or increase durability and life of the design.
• Reduce Impacts to Environmental Resources —includes solutions that minimize impacts on surrounding ecosystems, encourage and support biodiversity, and reflect historical and cultural context.
5
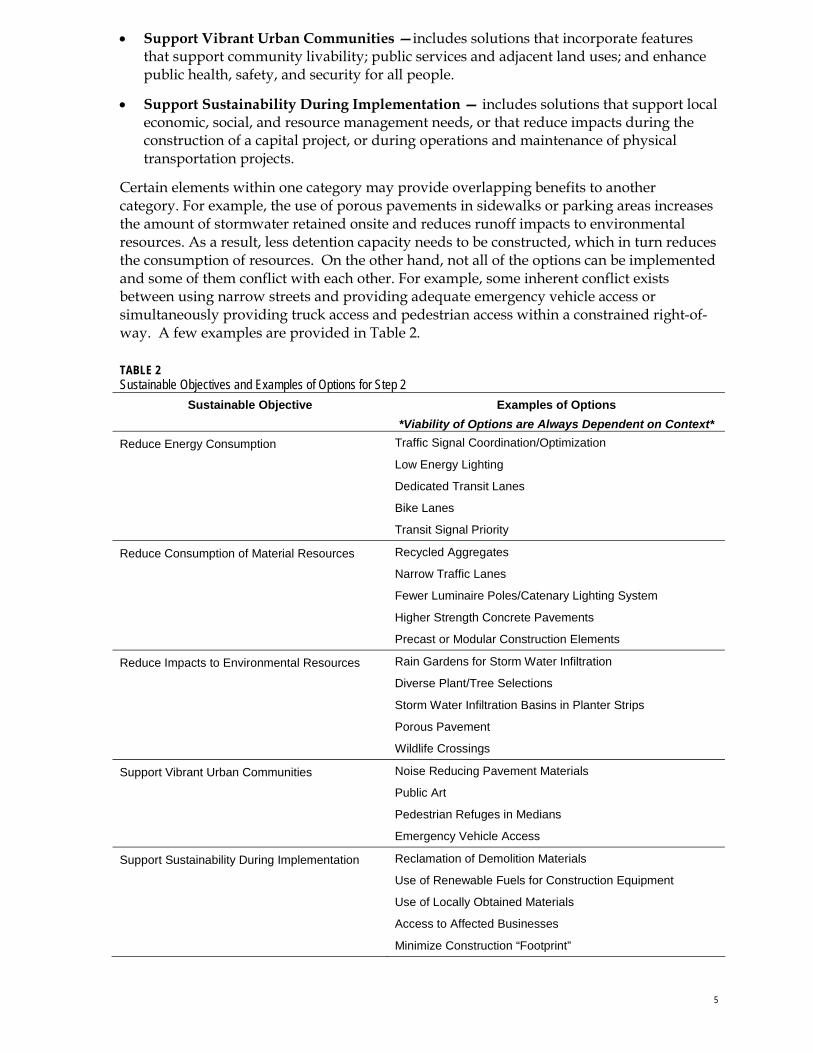
• Support Vibrant Urban Communities —includes solutions that incorporate features that support community livability; public services and adjacent land uses; and enhance public health, safety, and security for all people.
• Support Sustainability During Implementation — includes solutions that support local economic, social, and resource management needs, or that reduce impacts during the construction of a capital project, or during operations and maintenance of physical transportation projects.
Certain elements within one category may provide overlapping benefits to another category. For example, the use of porous pavements in sidewalks or parking areas increases the amount of stormwater retained onsite and reduces runoff impacts to environmental resources. As a result, less detention capacity needs to be constructed, which in turn reduces the consumption of resources. On the other hand, not all of the options can be implemented and some of them conflict with each other. For example, some inherent conflict exists between using narrow streets and providing adequate emergency vehicle access or simultaneously providing truck access and pedestrian access within a constrained right-of-way. A few examples are provided in Table 2.
TABLE 2 Sustainable Objectives and Examples of Options for Step 2
Sustainable Objective Examples of Options *Viability of Options are Always Dependent on Context*
Reduce Energy Consumption Traffic Signal Coordination/Optimization
Low Energy Lighting
Dedicated Transit Lanes
Bike Lanes
Transit Signal Priority
Reduce Consumption of Material Resources Recycled Aggregates
Narrow Traffic Lanes
Fewer Luminaire Poles/Catenary Lighting System
Higher Strength Concrete Pavements
Precast or Modular Construction Elements
Reduce Impacts to Environmental Resources Rain Gardens for Storm Water Infiltration
Diverse Plant/Tree Selections
Storm Water Infiltration Basins in Planter Strips
Porous Pavement
Wildlife Crossings
Support Vibrant Urban Communities Noise Reducing Pavement Materials
Public Art
Pedestrian Refuges in Medians
Emergency Vehicle Access
Support Sustainability During Implementation Reclamation of Demolition Materials
Use of Renewable Fuels for Construction Equipment
Use of Locally Obtained Materials
Access to Affected Businesses
Minimize Construction “Footprint”
6
1.4 The Role of DOTs in Sustainability AASHTO President Allen Biehler has outlined three critical areas of emphasis for the association in 2009: authorization, sustainability, and strategic freight planning. Biehler explained his emphasis areas as follows:
Transportation’s mission is no longer about just moving people and goods. It’s much broader. Transportation fundamentally allows us to achieve economic, social, and environmental sustainability. Transportation supports and enhances our quality of life. As state transportation professionals, we need to model the way toward achieving a sustainable future…Sustainable transportation requires innovative approaches and partnerships like never before. (2009 AASHTO Emphasis Areas).
Departments of Transportation (DOTs) must respond to multiple key drivers — the need to adapt to changing economics, natural resource supply, and carbon constraints (including regulation and potential federal policy related to climate change), and the need to mitigate these changes as part of a broader societal effort to address issues such as climate change, water availability and quality, security concerns and rising cost of energy. There is demand from the public and stakeholders to respond to such sustainability issues, which is reflected in many agency visions, missions and policies.
Examples of several specific sustainability elements tied to the transportation system include diminishing petroleum reserves (ultimately leading to increases in energy costs), global and local air quality impacts of the transportation system (according to Sightline Institute about 40% of the CO2 emissions from fossil fuels produced in North America is due to transportation), land and habitat impact, solid waste, numbers and rates of fatalities and injuries, increasing congestion, noise, equity and security.
Of the many sustainability elements, climate change has received much recent attention. Many states are developing overall goals or plans related to climate change – in multiple cases, this direction is coming from the Governor’s office, and state DOTs are one piece of the overall governmental process. It will be necessary for transportation departments to coordinate with other state agencies to address cross-cutting issues affecting climate change – such as land use, health, or multimodal systems.
Climate change is anticipated to affect all divisions of DOTs, and includes two general types of responses: adaptation and mitigation. Henry Schwartz’s recent (2008) Transportation Research Board paper – Climate Change Impacts on US Transportation – outlines several areas of adaptation to climate change that affect all DOT disciplines: (a) sea level rise (flooding and infrastructure impact, evacuation, infrastructure erosion); (b) increase in frequency of strong hurricanes (air service and evacuation, port and harbor impacts); (c) increase in heavy precipitation events (traffic disruptions and airline delays, flooding); and (d) increase in frequency of hot days (thermal expansion of roadway materials, construction productivity hours reduced and construction delays).
In addition to climate change adaptation, DOTs are looking at mitigation, i.e. the reduction of greenhouse gases that are generated by society. Mitigation for climate change is ultimately reflected in the standards and procedures of an agency – where policy plays out on the ground. For example, a DOT may require that an array of low-carbon materials be considered during construction. Or, project funding may be tied to sustainability (for example, the Washington State Transportation Improvement Board – the largest grant
7
funding entity in the state – last year introduced sustainability grant criteria for roadway projects).
While DOTs already have experience addressing environmental aspects of the triple bottom line, the economic and social aspects are also being considered. A commitment to the principles of sustainability may ask agencies to look differently at the value of transportation investments. Value refers both to current and future costs and benefits. Managing transportation demand may be more cost effective and a more appropriate solution in some cases than increasing the supply of transportation – and DOTs will play a role in determining best system solutions. And, some DOTs have already been incorporating an emerging paradigm for the social aspect of sustainability - context sensitive solutions (CSS). In fact, contextsensitivesolutions.org – a widely accepted online center for CSS – has announced a new sustainability section for its CSS clearinghouse link (May 2009).
DOTs are now looking at how sustainable products, processes and policies are integrated into decision-making, planning, design, construction, operations and maintenance – the subject of this memorandum.
2.0 Best Practices – Transportation and Sustainability A basic understanding of best practices is critical to facilitate both discipline-focused and interdisciplinary discussion of sustainability issues facing the nation’s transportation system. Following is a discussion of sustainability issues and illustrative best practice examples in: (1) Planning and System-wide Perspective, (2) Design and Construction, (3) Operations and Maintenance, and (4) Performance Measures.
2.1 Planning and System-wide Perspective Planning and system-wide practices feed into the work of multiple DOT divisions and can be organized into the following broad categories: Climate Change Policies, Pricing and Revenue Policies, Land Use Strategies, Freight Strategies and Sustainability Plans.
2.1.1 Climate Change Policies General Discussion
The challenge of climate change requires transportation agencies to respond on at least two distinct fronts. First, following the scientific consensus about the need for immediate and sustained greenhouse gas (GHG) emissions reductions, there must be an effort toward “de-carbonization” of transportation systems, from the vehicles and fuels that move people and goods to the processes that involve constructing and maintaining infrastructure. These strategies are generally captured by the label mitigation (or abatement) - that is, reducing GHG emissions. For DOTs, mitigation strategies are considered for operating a system as it currently exists as well as preparing to change the system to reduce its carbon footprint. Most GHG mitigation measures relate directly to fuel or other energy savings, which requires considering both sets of goals simultaneously.
Second, given scientists’ predicted range of uncertain but inevitable climatic changes in the near to mid-range future, new physical realities, from changes in sea level and new volumes of stormwater and streamflow to changes in the frequency and intensity of precipitation and extreme weather events must be prepared for. These strategies are generally captured under the label adaptation (that is, adapting to coming changes in physical realities under which the transportation system must continue to perform). In the recent Peer Workshop on
8
Adaptation to Climate Change Impacts (Federal Highway Administration, December 2008), adaptation was defined as “Actions by individuals or systems to avoid, withstand, or take advantage of current and projected climate changes and impacts. Adaptation decreases a system's vulnerability, or increases its resilience to impacts.”
These two sets of strategies are mostly independent, though it is important to understand the core challenges of each separately, and to assemble predictions, suites of strategies, a sense of costs and benefits, and action plans for each. In some cases, the strategies will overlap. Both carry considerable uncertainty, and both challenge current planning and management processes.
In many cases, there will be unrelated (that is, non-climate) rationale for strategies or policies. GHG mitigation, in particular, often has a life-cycle cost reason for reducing emissions. Other rationales include decreased reliance on energy imports, especially for petroleum but increasingly for natural gas as well, and air pollution concerns, which lend support to reducing the use of petroleum fuels and exploring new transportation fuel pathways (such as electrification).
Illustrative Best Practice Examples
For greenhouse gas (GHG) emissions mitigation, there is a list of options but little consensus about how to prioritize certain practices and strategies over others. Fuel/Energy efficiency - At the vehicle scale, vehicles must become more fuel- or energy-efficient. Federal standards for passenger and other vehicles are the main overarching impetus here, but proactive or cost-driven fleet acquisitions by public agencies, corporate purchasers and households are likely to spur rising fleet efficiency. Several DOTs are purchasing hybrids or otherwise reducing the emissions with their fleets. Lower-carbon transportation energy sources - This need is likely to be met over time in large part with electrification of transportation, but also with fuels with lower life-cycle emissions (hence the “low-carbon fuel standards” emerging in California, Oregon, other states and increasingly at the federal level). Alternative transportation modes and integration of land use and transportation – Urban buses, light rail, intercity rail, and intercity bus are understood to have generally lower GHG emissions per passenger mile than conventional options and are therefore considered important emissions reduction strategies. The link between higher intensity land use and transit as well as other land use/transportation patterns are important mitigation techniques often employed through metropolitan planning organizations. The Maryland State Highway Administration is working to reduce the transportation system’s contribution to GHG emissions through focus on non-motorized transportation safety, land preservation and use of wind power for DOT facilities. System efficiency/optimization – Optimizing the existing system – Techniques include technology – such as intelligent transportation system (ITS) technology, as well as policy regarding behavior – such as limits on vehicle, truck or ship idling, or encouragement of eco-driving (reducing carbon dioxide emissions through changing driver behavior or adjusting maintenance techniques). Such behavior changes include avoiding quick starts, planning trips (linking trips), avoiding idling, driving the speed limit, or using windows rather than air conditioning in low speed situations.
9
According to the 2008 FHWA Peer Workshop on Adaptation to Climate Change Impacts, approximately half of the states are involved with adaptation to climate change. Examples include: Infrastructure changes – Florida has established an Energy and Climate Change Action Team, and the state is coordinating with regional councils and metropolitan planning organizations on the issue. Due to its position as a gulf state, Florida is taking a proactive look at protecting its infrastructure and communities with policies and design/construction standards. Strategic planning – California – which has statewide policies on GHG emissions – is also looking at mitigation through directive from the Governor’s office. The state has established an expert panel to assess the state’s vulnerability to sea level rise, and develop climate change impact scenarios. Caltrans is creating a statewide information strategy to support this assessment, including maps of vulnerable areas. Caltrans is working to integrate adaptation strategies into complex transportation programming cycles, which require changes to agency planning and operation procedures.
Retrofit and redesign – Virginia DOT is redesigning selected transportation facilities to survive and operate in extreme weather events, including hurricane evacuation routes. VDOT is also identifying scour issues on key bridges.
Research – Some states are conducting adaptation research, including the mapping of sea level rise or critical infrastructure and evacuation routes in Rhode Island and Louisiana.
2.1.2 Pricing and Revenue Policies General Discussion
Increasing vehicle fuel efficiencies promise fewer green house gas emissions, but given many DOTs’ reliance on fuel tax revenues, increasing fuel efficiencies also represent a declining revenue stream. DOTs nation-wide are examining pricing and revenue policies, including congestion pricing and user-based fee systems. Pricing has also been demonstrated as clearly linked to transportation behavior patterns (e.g. cordon pricing in London significantly reduced congestion levels in the city core; City of Seattle models have shown that pricing of parking is a key determinant in whether people will drive single-occupancy vehicles into the downtown area or use other transportation options).
Illustrative Best Practice Examples
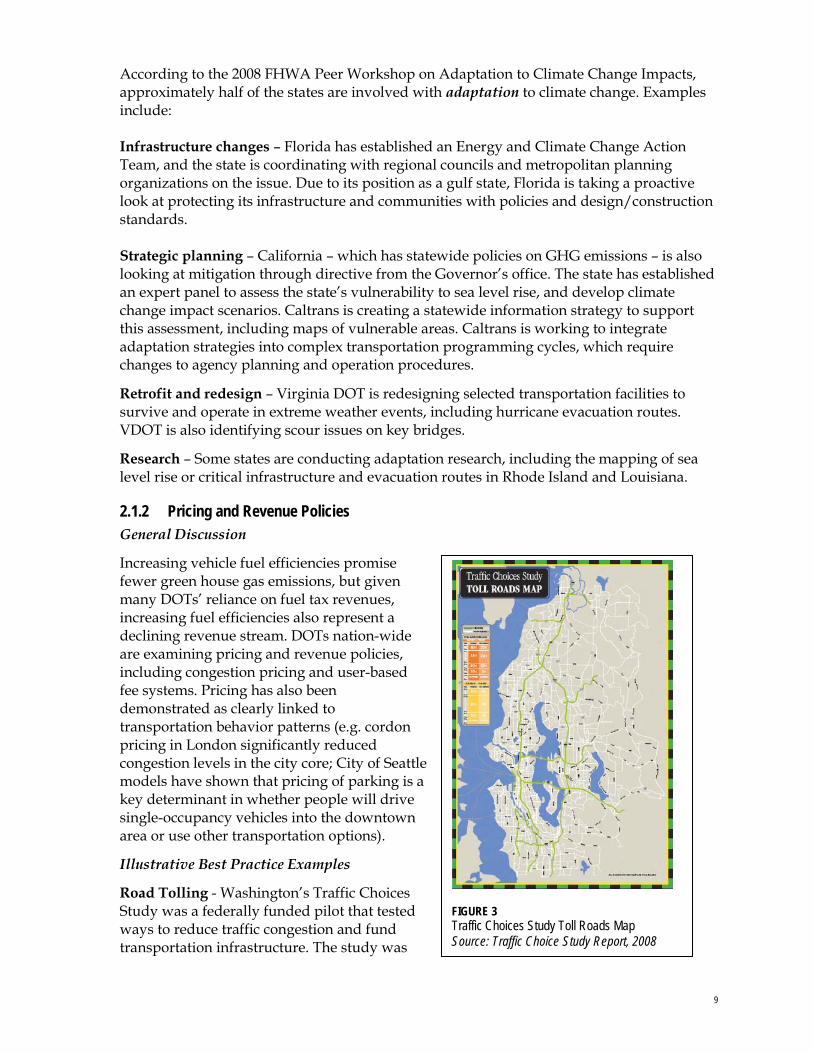
Road Tolling - Washington’s Traffic Choices Study was a federally funded pilot that tested ways to reduce traffic congestion and fund transportation infrastructure. The study was
FIGURE 3 Traffic Choices Study Toll Roads Map Source: Traffic Choice Study Report, 2008
10
funded by Federal Highway Administration and was led by the Puget Sound Regional Council in partnership with Washington DOT (WSDOT). A major driver for the Study was WSDOT’s recognition that new capacity is less effective and more expensive than it used to be, and funding to build that capacity has grown slower than the growth in traffic. This prompted policy makers to consider seriously the role that time-of-day variable road tolling can play in brining more balance to transportation supply and demand.
The Study placed Global Positioning Systems (GPS) tolling meters in vehicles, and participants were given a travel budget from which tolls were deducted. If their driving patterns remained unchanged over the experiment, they would “spend” their account balance by the time the experiment concluded. If they changed their driving patterns, they got to keep what the money they saved, providing a real monetary incentive. The Study observed participant’s driving patterns before and after experimental variable tolls were charged for the use of all major freeways and arterials in the Seattle metropolitan area.
Many participants characterized their travel changes as minor but the sum total of their individual choices were significant. Overall, participants reduced all tours of vehicle trips by 7 percent (per week), and reduced total miles traveled by 12 percent (per week).
High-occupancy toll (HOT) lanes have also been developed in Washington state.
Mileage-based Insurance - Mileage-based car insurance is another way to provide incentives to drivers to reduce their number of vehicle miles traveled. In 2002, the Texas Department of Insurance Commissioner approved rules to enable insurers to offer automobile insurance plans that allow consumers to purchase insurance coverage on a per-mile basis. Texas is the first state to approve such a plan for private passenger automobiles. The rules give drivers a choice of two plans: unlimited mileage or a cents-per-mile rate. If a consumer opts for the per-mile rate, he or she must purchase a minimum of 1,000 miles in advance. The amount of mileage purchased is added to the vehicle’s odometer reading and shown on the insurance card. Subsequent purchases during the policy year are made at times and in amounts needed, with the new limit displayed on a newly issued insurance card. If the car is driven beyond the amount of miles purchased, the car is uninsured. Odometers are inspected if there is a claim, when the contract is renewed or when the vehicle owner switches insurers. As with conventional vehicle insurance, a driver will get a refund or premium credit for any unused mileage.
2.1.3 Land Use Strategies General Discussion
Local jurisdictions govern land use decisions and DOTs often have little direct influence over land uses. Integrating land use planning with transportation infrastructure decisions — such as through partnership with local agencies — can help maintain the operational life of transportation investments. Land use patterns also work with the viability of a transportation system – urban transit systems are more successful (as measured in ridership) when the land uses around them are dense enough and include enough commercial land to spur usage.
This section presents three examples of current land use strategies: Minnesota’s I-394 MnPASS Phase II Planning study, Oregon’s Interchange Area Management Plan, and Pennsylvania and New Jersey Smart Transportation approaches.
11
Illustrative Best Practice Examples
MnPASS - The Minnesota Department of Transportation (MnDOT) and agency partners at the Metropolitan Council (the Twin Cities seven-county regional planning agency also serving as the Metropolitan Planning Organization) and the Federal Highway Administration (FHWA) have undertaken a planning process to develop a long-term vision for the I-394 MnPASS managed lanes project to help achieve optimal performance of the corridor for the next 30 years.
In 2005, I-394 high occupancy vehicle (HOV) lanes were converted to high occupancy toll (HOT) lanes and congestion in the entire corridor improved significantly. However, traffic forecasts for this corridor indicate that future demand may erode efficiencies gained through the toll lane system. In response to traffic and development forecasts for the I-394 travel shed, and with a desire to integrate planning efforts beyond the highway footprint, MnDOT undertook the I-394 MnPASS Phase II planning study. The I-394 MnPASS Phase II planning process was an integrated and collaborative approach that considered four strategic elements which integrated a robust outreach and education effort including the following items:
• Infrastructure design improvements
• Transit facility and operational enhancements
• Community design/land use
• Telecommuting
As project sponsors, MnDOT, the Metro Council, and FHWA envisioned a study to identify infrastructure enhancements, transit opportunities, and synergies with land use that might otherwise remain unidentified. The study produced a number of recommendations including facility design and telecommunications. The recommended facility design option is to implement a moveable barrier, which would operate with two HOV/HOT lanes eastbound in the morning and with two HOV/HOT lanes westbound and one lane eastbound in the afternoon with the moveable barrier positioned between the directional lanes.
Telecommuting recommendations include reaching out to large and mid-sized corporations along the I-394 corridor, and corridor commuters. The cost estimate for the telecommuting recommendations ranges from $150,000 for a 12-week awareness campaign $1.5 million for an awareness campaign and 3-year pilot program.
The corridor is ripe for redevelopment in many areas. Land use types and densities that support transit helps ensure long-term corridor preservation and performance. The planning study analysis demonstrated that enhanced off-peak service would capture more transit users. While resistant at first, the communities in the corridor have embraced the
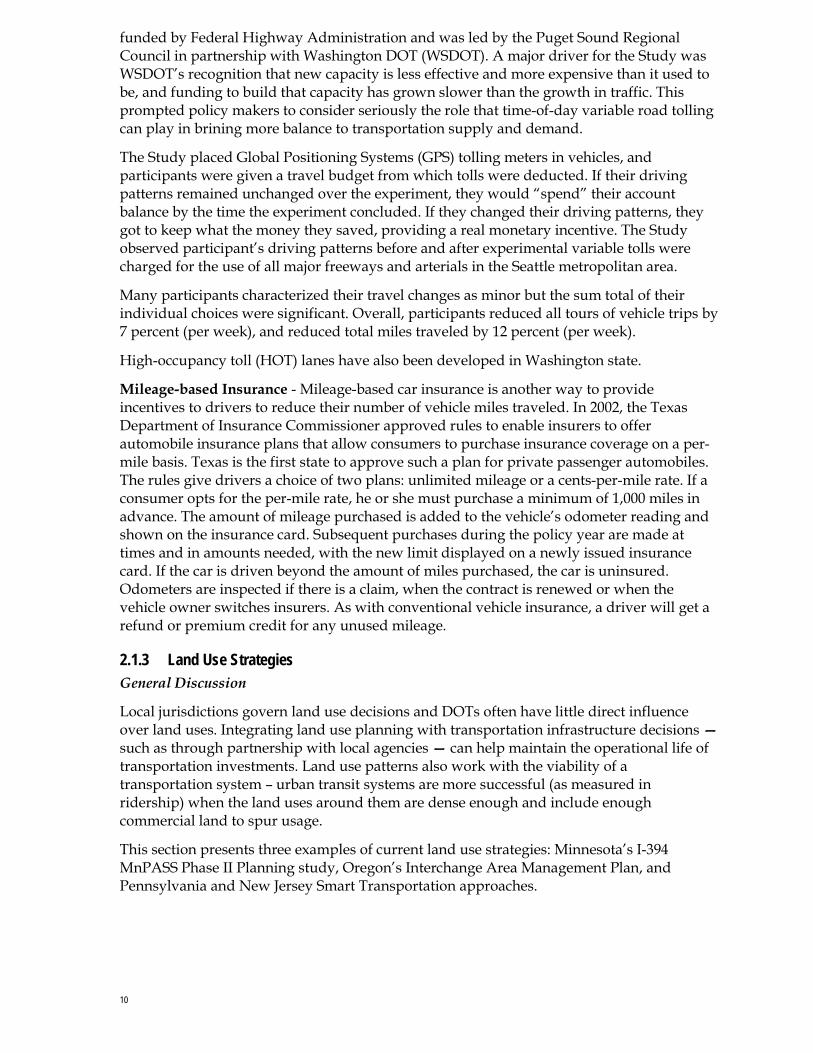
FIGURE 4 I-395 MnPASS Reader Board Source: mnpass.org
12
concepts for community design that were presented to them and will be adopting them in their comprehensive plans. Most notably, community designs are linking nodes in the corridor with a green network of trails, and redevelopment of a major shopping mall that may include a major transit hub and trail connections from the neighborhoods.
Interchange Area Management Plans and Trip Budgets - ODOT has developed a planning approach to the construction and improvement of highway interchanges aimed at protecting the long-term function of the interchange, highway, and local street system that goes beyond the traditional Interchange Justification Report (IJR) in terms of coordination with local agencies. The plans are called Interchange Area Management Plans (IAMPs). An IAMP is a joint ODOT and local government long-term (20+ years) transportation and land use plan to balance and manage transportation and land use decisions in interchange areas. It is an important tool in protecting the function of state highway interchanges and the supporting local street network. Key to the success of IAMP implementation is the inclusion of cities and counties up-front in the planning process.
IAMPs have resulted in local circulation improvements, adoption of land use changes, overlay zones, development policies, trip caps and trip budgets, and adoption of demand management strategies.
In the case of the I-5/Woodburn interchange, planning efforts concluded that reconstructing an interchange was necessary. In conjunction with interchange improvements, the IAMP identified off-highway circulation improvements that would preserve long-term interchange function. The plan also recommended an intergovernmental agreement for a trip budget. A trip budget is used to allocate the 20-year forecast of trips over time (rather than allowing one developer to use up the remaining capacity all at once). Local jurisdictions can allocate a finite number of trips over time. The result of an IAMP is to preserve the function of the highway, interchange, and local system by coordinating transportation improvements and land use decisions. In the case of Woodburn, the city uses a conditional use permit when approving development to allocate trips.
Smart Transportation Approaches – The Pennsylvania DOT and the New Jersey DOT developed the Smart Transportation Guidebook in March of 2008. The goal of the Guidebook is to integrate the planning and design of streets and highways in a manner that fosters development of sustainable and livable communities. Specifically, the guidebook provides guidance on the development of non-limited access roads as context sensitive roadways, with the goal of creating transportation facilities that work well for all users, are affordable, and support smart growth community planning goals. The guidebook emerged out of the recognition by both state DOTs that congestion cannot be solved by increasing capacity and building wider and faster state roadways. Rather, the Smart Transportation approach proposes to manage capacity by integrating land use and transportation decisions, providing local and regional mobility, offering access to homes and businesses, and supporting economic growth.
2.1.4 Freight Strategies General Discussion
DOTs facilitate the movement of both people and goods, a task often explicitly defined in a state DOT mission statement. Alternate modes to move freight are an important area of study, including using railway corridors for freight, technology to better route freight, and water systems. Innovations and efficiencies in freight movement are also key sustainability factors – particularly from both environmental and economic perspectives. Use of information technology is key for many shipping providers in terms of minimizing time of
13
goods transport, which often translates directly to environmental benefit with regard to GHG emissions. Many freight companies are looking at use of biofuels or hybrids in response to emissions standards and concerns. Several ports and cities have regulations regarding idling.
Illustrative Best Practice Examples
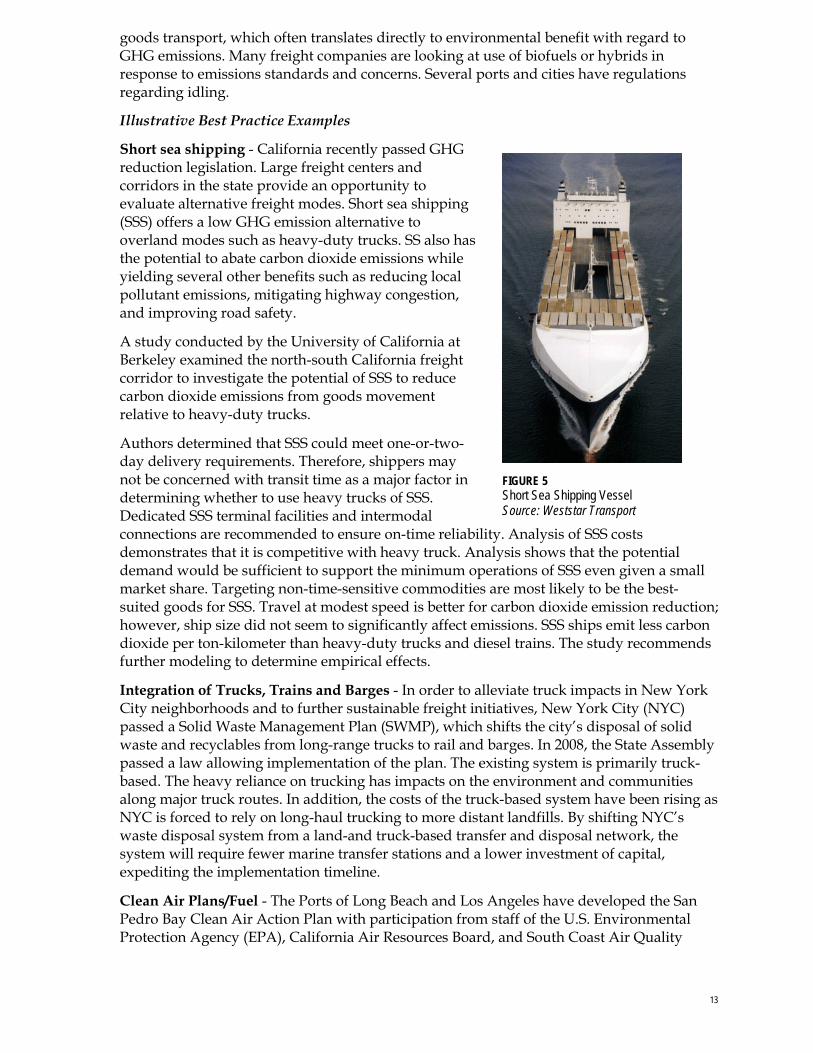
Short sea shipping - California recently passed GHG reduction legislation. Large freight centers and corridors in the state provide an opportunity to evaluate alternative freight modes. Short sea shipping (SSS) offers a low GHG emission alternative to overland modes such as heavy-duty trucks. SS also has the potential to abate carbon dioxide emissions while yielding several other benefits such as reducing local pollutant emissions, mitigating highway congestion, and improving road safety.
A study conducted by the University of California at Berkeley examined the north-south California freight corridor to investigate the potential of SSS to reduce carbon dioxide emissions from goods movement relative to heavy-duty trucks.
Authors determined that SSS could meet one-or-two-day delivery requirements. Therefore, shippers may not be concerned with transit time as a major factor in determining whether to use heavy trucks of SSS. Dedicated SSS terminal facilities and intermodal connections are recommended to ensure on-time reliability. Analysis of SSS costs demonstrates that it is competitive with heavy truck. Analysis shows that the potential demand would be sufficient to support the minimum operations of SSS even given a small market share. Targeting non-time-sensitive commodities are most likely to be the best-suited goods for SSS. Travel at modest speed is better for carbon dioxide emission reduction; however, ship size did not seem to significantly affect emissions. SSS ships emit less carbon dioxide per ton-kilometer than heavy-duty trucks and diesel trains. The study recommends further modeling to determine empirical effects.
Integration of Trucks, Trains and Barges - In order to alleviate truck impacts in New York City neighborhoods and to further sustainable freight initiatives, New York City (NYC) passed a Solid Waste Management Plan (SWMP), which shifts the city’s disposal of solid waste and recyclables from long-range trucks to rail and barges. In 2008, the State Assembly passed a law allowing implementation of the plan. The existing system is primarily truck-based. The heavy reliance on trucking has impacts on the environment and communities along major truck routes. In addition, the costs of the truck-based system have been rising as NYC is forced to rely on long-haul trucking to more distant landfills. By shifting NYC’s waste disposal system from a land-and truck-based transfer and disposal network, the system will require fewer marine transfer stations and a lower investment of capital, expediting the implementation timeline.
Clean Air Plans/Fuel - The Ports of Long Beach and Los Angeles have developed the San Pedro Bay Clean Air Action Plan with participation from staff of the U.S. Environmental Protection Agency (EPA), California Air Resources Board, and South Coast Air Quality
FIGURE 5 Short Sea Shipping Vessel Source: Weststar Transport
14
Management District. The plan is aimed at significantly reducing the health risks posed by air pollution from port-related ships, trains, trucks, terminal equipment and harbor craft over a period of five years. Trade related activities at the Port account for about 10 percent of the total emissions of diesel particulate matter (PM) and nitrogen oxides (NOx) in the South Coast Air Basin.
Thus far, the Port and its tenants have reduced emissions from terminal equipment by nearly 600 tons of NOx and more than 70 tons of diesel PM a year compared to 2002, which represent reductions of 24% and 50%, respectively. This has been accomplished through 1) the Diesel Emissions Reduction Program and 2) accelerated replacement (modernization) of the equipment fleets, and has occurred even while cargo tonnage has increased by 30%. In the emission reduction program, the Port, EPA and the California Air Resources Board spent more than $2 million to retrofit more than 600 pieces of cargo-handling equipment with diesel oxidation catalysts; half of those are using clean diesel fuel. Port diesel-powered maintenance vehicles have been retrofitted with diesel oxidation catalysts and a clean diesel fuel mixed with ethanol. The Port has also purchased three liquefied petroleum gas (propane)-fueled sweepers, and has begun replacement of the gasoline-powered fleet with compressed natural gas-powered and hybrid vehicles.
2.1.5 Sustainability Plans General Discussion
Sustainability plans for DOTs are an emerging tool for working toward better internal stewardship of resources (“walking the talk”) and more sustainable transportation system management and decision-making. Specific department plans are often created in response to Governor-level or leadership directives to meet certain sustainability goals. Many cities (Chicago, New York, Seattle, Portland, Olympia) have had sustainability plans in place since the 1990s, and have seen important community-level results from an integrated and comprehensive approach to sustainability. These results are not only important in terms of environmental benefit (e.g. amount of emissions reduced or avoided) but in terms of customer – i.e. public – satisfaction.
Illustrative Best Practice Examples
New York City DOT Strategic Plan for ‘Sustainable Streets’ - The New York City Department of Transportation was recently awarded the Institute for Transportation and Development Policy’s Sustainable Transport Award for adopting innovative transportation strategies, including the creation of 140 miles of bike lanes, creating pedestrian areas and public plazas, offering a select bus service, and introducing car-free Saturdays. These efforts have been part of the Sustainable Streets Strategic Plan for the New York City Department of Transportation. The plan aims to take a green approach to transportation that will ease congestion, address climate change, and improve the city's quality of life. The Sustainable Streets Strategic Plan provides a detailed map for the city to meet the transportation goals outlined in PlaNYC, the city’s comprehensive sustainability plan. Key initiatives include adopting a complete-street design template for reconstruction projects, doubling bicycle commuting by 2015, and developing more people-friendly boulevards along key corridors. Oregon DOT Sustainability Plan - The 2008 Oregon DOT Sustainability Plan includes strategies to manage both internal agency operations and the statewide transportation system towards sustainability. The plan contains strategies for achieving sustainability goals, indicators for tracking progress, and a description of implementation activities. The goals, indicators, strategies, and actions in the plan are divided into seven focus areas,
15
which include: 1) Health and Safety, 2) Social Responsibility/Workforce Well-Being and Development, 3) Environmental Stewardship, 4) Land Use and Infrastructure, 5) Energy/Fuel Use and Climate Change, 6) Material Resource Flows, and 7) Economic Health. Since 2004, the Oregon DOT has incorporated sustainability into the 2006 update of the Oregon Transportation Plan and the OTIA III State Bridge Repair Program, and begun the implementation of a comprehensive Sustainability Program. The Sustainability Program aims to institutionalize the concept of sustainability and create a structured framework in which the agency’s sustainability initiatives are carried out.
2.2 Design and Construction Perspective Design and construction practices are critical to the role of DOTs. DOTs are responsible for designing and constructing needed facility improvements, and redesigning and reconstructing infrastructure or facilities that are aging (for example, bridges, highways, or facilities).
2.2.1 Paving Innovations General Discussion
A variety of asphalt innovations encourage sustainability through methods that minimize energy consumption or encourage material recycling or through design that enhances stormwater management. DOTs across the country are using these innovations. Examples include Warm-Mix Asphalt, Asphalt Reuse/Recycling, Perpetual Pavement, Porous Asphalt, Pavement Aggregate Substitutes, and Use of Recycled Glass. These innovations are described in more depth below.
Illustrative Best Practice Examples
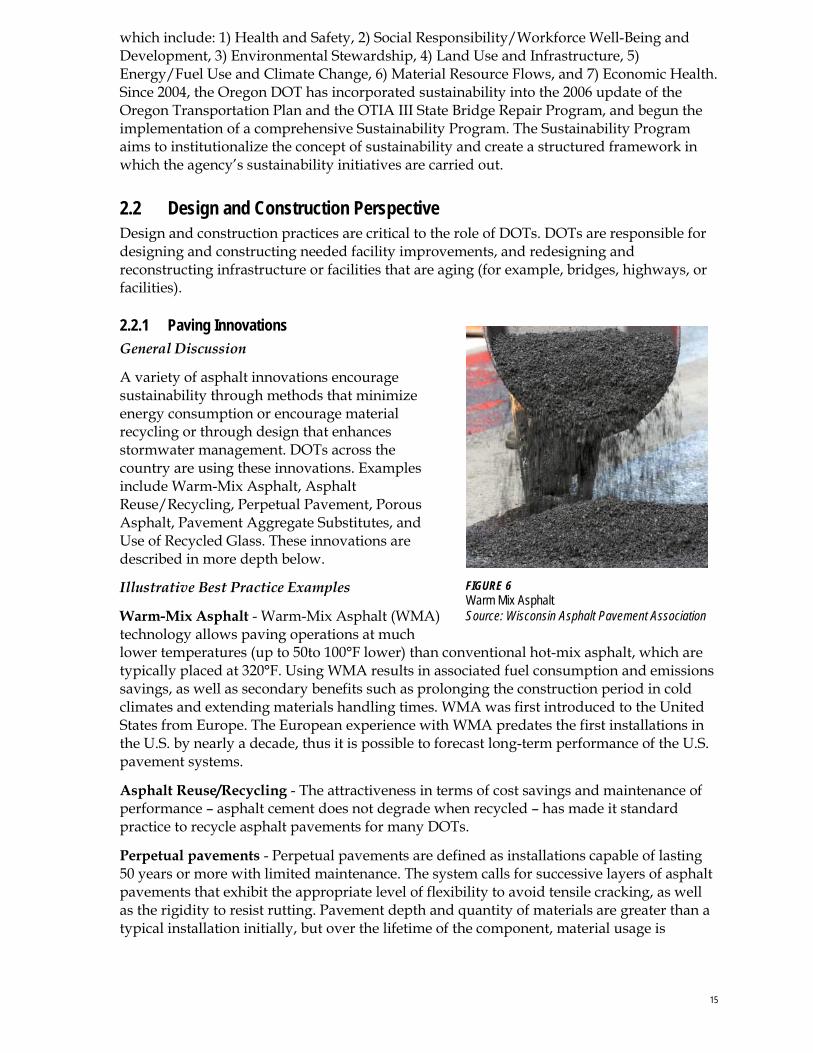
Warm-Mix Asphalt - Warm-Mix Asphalt (WMA) technology allows paving operations at much lower temperatures (up to 50to 100°F lower) than conventional hot-mix asphalt, which are typically placed at 320°F. Using WMA results in associated fuel consumption and emissions savings, as well as secondary benefits such as prolonging the construction period in cold climates and extending materials handling times. WMA was first introduced to the United States from Europe. The European experience with WMA predates the first installations in the U.S. by nearly a decade, thus it is possible to forecast long-term performance of the U.S. pavement systems.
Asphalt Reuse/Recycling - The attractiveness in terms of cost savings and maintenance of performance – asphalt cement does not degrade when recycled – has made it standard practice to recycle asphalt pavements for many DOTs.
Perpetual pavements - Perpetual pavements are defined as installations capable of lasting 50 years or more with limited maintenance. The system calls for successive layers of asphalt pavements that exhibit the appropriate level of flexibility to avoid tensile cracking, as well as the rigidity to resist rutting. Pavement depth and quantity of materials are greater than a typical installation initially, but over the lifetime of the component, material usage is
FIGURE 6 Warm Mix Asphalt Source: Wisconsin Asphalt Pavement Association
16
reduced. Perpetual pavements avoid the inconvenience and environmental impacts from frequent resurfacing.
Porous asphalt - Porous asphalt has applications that apply both to certain roadways and parking structures. Encouraging natural absorption and adsorption of water away from the surface improves traction, and may account for significant reductions in peak stormwater demands and water quality improvements.
Pavement aggregate substitutes - Pavement aggregate substitutes make more efficient use of recycled materials as aggregate sources. Byproducts from other industrial and manufacturing processes are often used, which have multiple benefits, including the following:
• diversion of waste from landfills
• reallocation of investments away from aggregate material extraction
• associated savings in energy/fuel consumption as well as improved air quality and GHG emissions reductions that come with decreased hauling demands
For example, Minnesota DOT is promoting the use of taconite byproducts from iron mining and processing as an aggregate substitute. Taconite coarse tailings are suitable as aggregate for bituminous and concrete pavements. Depending on the type of extraction and processing methods used, taconite materials could fit a variety of other transportation applications.
Use of recycled glass - Several state DOTs allow for a certain proportion of the aggregate mix to be composed of recycled glass. Current research at the University of Hawaii examines mitigation strategies to address the issue of alkali-silica reactivity of crushed, recycled glass sand in concrete mixes.
2.2.2 Integrated Landscape and Stormwater Management/Low Impact Development General Discussion
Landscape and stormwater management can be integrated through low impact development (LID). This approach seeks to replicate the predevelopment hydrologic regime by managing stormwater at the source before it can contribute to downstream problems. The key principles of the approach are to:
o Conserve natural site features
o Reduce disturbed area
o Minimize impervious area
o Disconnect impervious area
o Implement small distributed practices at the source
A common feature of most of these solutions is that they simultaneously satisfy the primary objective of managing peak runoff, while improving the quality of the reduced runoff and providing opportunities to encourage biodiversity. If used properly, LID can reduce stormwater runoff, increase rainwater infiltration and groundwater recharge, allow tree roots to breathe, and reduce the magnitude and frequency of flash flooding.
17
Illustrative Best Practice Examples
Porous asphalt policies - The Georgia Department of Transportation (GDOT) requires all interstates and state routes with daily traffic volumes more than 25,000 vehicles use porous asphalt as the final ride surface. This improves safety for drivers as well as providing environmental benefit. GDOT uses a type of porous asphalt known as open-graded friction course (OGFC). While OGFC has caused problems for state DOTs in the past, the addition of materials such as hydrated lime, stabilizing fibers, mineral fibers, and PMAC have improved its performance. According to the GDOT assistant state materials engineer, the use of OGFC reduces highway noise and increases surface drainage. In addition, the porosity of the pavement has resulted in reduced potential for hydroplaning, a reduction of splash and spray, improved friction, better nighttime visibility, and better visibility of traffic striping.
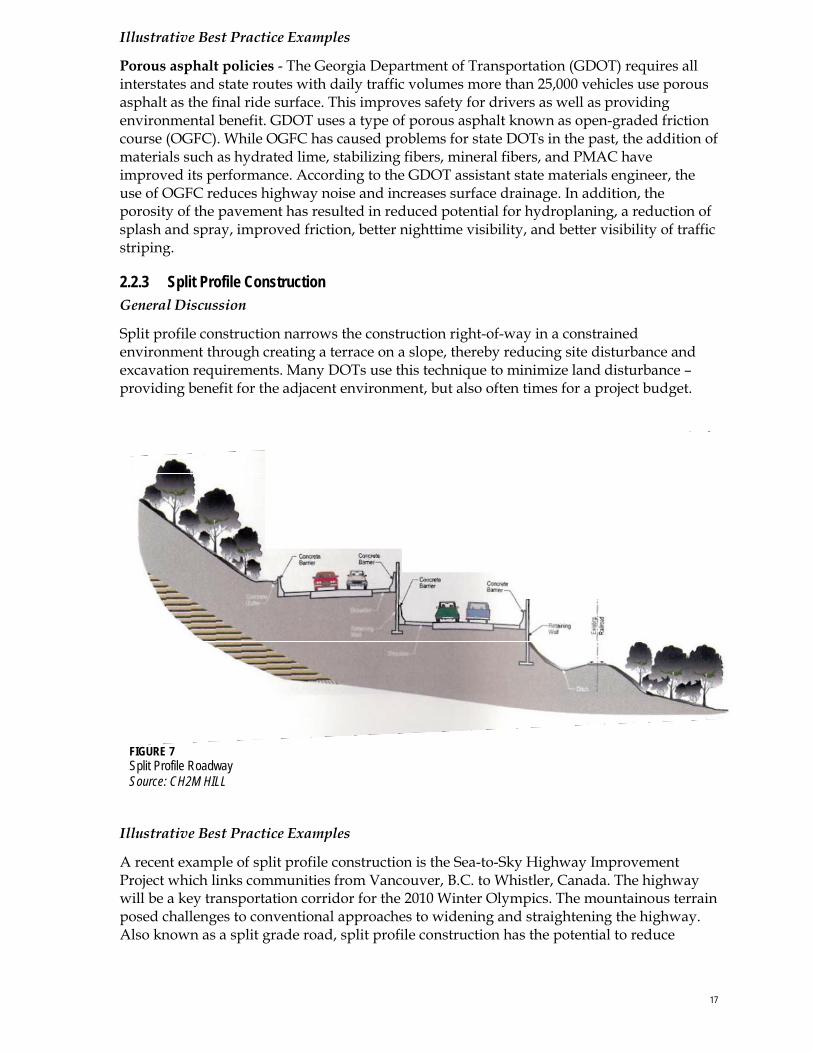
2.2.3 Split Profile Construction General Discussion
Split profile construction narrows the construction right-of-way in a constrained environment through creating a terrace on a slope, thereby reducing site disturbance and excavation requirements. Many DOTs use this technique to minimize land disturbance – providing benefit for the adjacent environment, but also often times for a project budget.
Illustrative Best Practice Examples
A recent example of split profile construction is the Sea-to-Sky Highway Improvement Project which links communities from Vancouver, B.C. to Whistler, Canada. The highway will be a key transportation corridor for the 2010 Winter Olympics. The mountainous terrain posed challenges to conventional approaches to widening and straightening the highway. Also known as a split grade road, split profile construction has the potential to reduce
FIGURE 7 Split Profile Roadway Source: CH2M HILL
18
materials usage and minimize habitat impacts by creating a terrace on a side slope. By constructing a retaining wall in between the two tiers of traffic, workers were able to narrow the construction right of way. Sea-to-Sky extensively used Mechanically Stabilized Earth (MSE) walls.
2.2.4 Reduced Footprint Staging General Discussion
Careful project staging make bridge and highway building less disruptive to the environment. Several state DOTs have implemented these strategies to decrease the duration and amount of in-site construction in environmentally sensitive areas. The environmental footprint of transportation projects can be minimized by undertaking the following set of measures:
• Preventing Sedimentation of Adjacent Waterways — A catalogue of erosion and sedimentation control techniques can be found at the California Stormwater Quality Association: http://www.cabmphandbooks.com/Documents/Construction/Section_3.pdf
• Capturing Vehicle Contaminants — Use spill pads to contain engine fluids and install truck wash stations to avoid tracking material onto access roads.
• Capturing Airborne Contaminants — Vacuum trucks can be used to target dusty areas.
• Treating Contaminants Onsite Prior to Release — Examples include treating tailings from drilling operations and bentonite slurry used to support excavations.
Illustrative Best Practice Examples
Prefabricated bridge elements - In North Carolina, the Linn Cove Viaduct was built in one direction almost entirely from the top down. This was done to avoid placing heavy equipment in environmentally sensitive areas along the Blue Ridge Parkway. In addition, bridge segments were precasted, allowing the bridge to be assembled quickly, with little impact to Grandfather Mountain. The Tennessee Department of Transportation also implemented prefabricated bridge elements when constructing the Wolf River Bridge, which crosses sensitive wetlands. TDOT designers selected and precast prestressed beams to facilitate construction and developed details for precasting bent caps in two pieces to suit staged construction. The project team was able to construct the 1,408-foot long, 46-foot wide bridge in eleven months without putting any equipment in the surrounding wetlands. Bubble curtain - In California, the Benecia-Martinez Bridge was constructed using footings and concrete segments constructed offsite and an innovative “bubble curtain” system to reduce impacts to native fish habitat. The California Department of Transportation commissioned the bubble curtain system, which contains sound waves generated by pile driving in bubbles of air. The substructure work required the construction of 12 water piers founded on concrete and steel piles, which were approximately eight feet in diameter and extended nearly 300 feet into the bedrock below. The bridge's 1,700-ton footings were constructed offsite, floated into place and supported on the piles.
19
2.2.5 Material Re-use General Discussion
Material re-use for construction purposes is becoming preferred procedure for many transportation agencies. Recycling of asphalt and pavement prevents the need to expend as much energy tapping natural resources as opposed to manufacturing new asphalt or pavement. Re-use not only minimizes production energy, but often, it reduces transport energy because not as many construction components need to be carried in to a construction site.
Illustrative Best Practice Examples
Full-depth reclamation - Full-Depth Reclamation (FDR) reduces emissions, price, and construction waste by using existing roadway materials to create a reclaimed road base. The process consists of identifying the cause of failure; taking samples of the asphalt surface, aggregate base, and subgrade soil for laboratory analysis; determining a suitable mix design including specifying the stabilization agent; and implementing the reclamation. Reclamation involves crushing the existing roadway into the subgrade material, adding the stabilizers, and compacting/grading the mix. Once a sealant has been applied and has cured, the reclaimed based is ready for resurfacing. FDR eliminates the need to import virgin materials.
Cold in-place recycling - Cold in-place recycling, which is essentially total reconstruction of a road, encounters few cost-prohibitive problems. Material costs are less because the existing material is recycled and reused. Though many times aggregate or asphalt must be added to create a proper base, this is much more cost-effective than removing the road bed. Additionally, the material is recycled “in-place,” meaning there is little need for excavation or hauling. In the end, cold in-place recycling costs anywhere from one-third to one-half of the total cost incurred for conventional reconstruction. Furthermore, when done properly cold in-place recycling can offer better results than conventional reconstruction. Reasons that CIR is not more common include the perception that it only involves the road’s top layer of asphalt; however, cold in-place recycling is total reconstruction of a road because the process goes down to the subgrade. In-place recycling has played a large role in pavement maintenance strategies in some states. In a shift to a more proactive road maintenance strategy, Nevada DOT (NDOT) is prioritizing projects based on how quickly roads are deteriorating or prediction models, not on the basis of their current condition. Prevention strategies are ranked by life-cycle cost, not initial cost. The program required initial larger expenditures on pavement preservation to reduce its backlog. NDOT deployed cold-in-place recycling based on a sophisticated lifecycle cost comparison; the state optimized its projects by assigning roads to five categories based on volume and environmental conditions. Cold-in-place recycling provided a pavement performance life comparable to that of overlays. Cold in-place recycling was adapted for harsher winter conditions in Nevada by adjusting the lime added to the mix. Other recycling techniques - In addition to pavement reuse and glass reuse in paving, other opportunities for reusing materials abound. Several cities are using recycled material in signs and bollards. In some cases, portions of bridge structures can be reused during a
20
bridge reconstruction. Reuse of topsoil and demolition debris is common practice for many DOTs.
2.2.6 Solar Highways General Discussion
Solar highway is a concept just gaining traction in the United States. In general, public right-of-way represents approximately 20 percent of the land in the United States. In light of rising concerns regarding energy and land use efficiency, solar highway addresses other ways in which to use right-of-way land to produce energy and off-set energy users.
Illustrative Best Practice Examples
Solar installation - Oregon DOT recently completed the first solar photovoltaic installation within a U.S. highway right-of-way. The project consists of 594 solar panels which generate 112,000 kilowatt hours (kWh) of electricity annually. Power from the solar array is used to light an interchange. The initiative was made possible in part through a partnership with a local utility agency. Ultimate plans call for a massive increase in capacity, up to 6.4 million kWh per year.
Interconnectivity with the power grid - Germany has a long history with locating solar panels in the highway right-of-way. Germany’s A3 Highway Tunnel, located near Aschaffenburg, was installed in February 2009 and when finished, the 2.8 megawatt solar installation will be one of Germany’s largest to be located on a public highway.
The installation occupies 2.7 kilometers of the A3 tunnel roof and, upon completion, will provide enough energy to power more than 600 average houses annually. German-based solar installer Ralos is overseeing the construction and working with Goldbach-Hoesbach, a German power provider. Goldbach-Hoesbach, which purchased the land from the German government, will oversee the projects inconnectivity to the power grid. The investment in the project is �11 million (approximately US$15 million), which will be paid back through cost savings over 16 years.
2.3 Operations and Maintenance Perspective Operations and maintenance are one of the key components of the DOT organization. Most DOT employees are in the field, and DOTs have a mission to maintain and operate the existing built systems. Different aspects of operations and maintenance are discussed below.
2.3.1 Low-Impact Maintenance General Discussion
Low-impact maintenance techniques avoid impacts to the surrounding environment – usually through mechanical technology. Maintenance divisions are one of the largest DOT division employers, and practices within the division are often how environmental policies play out on the ground.
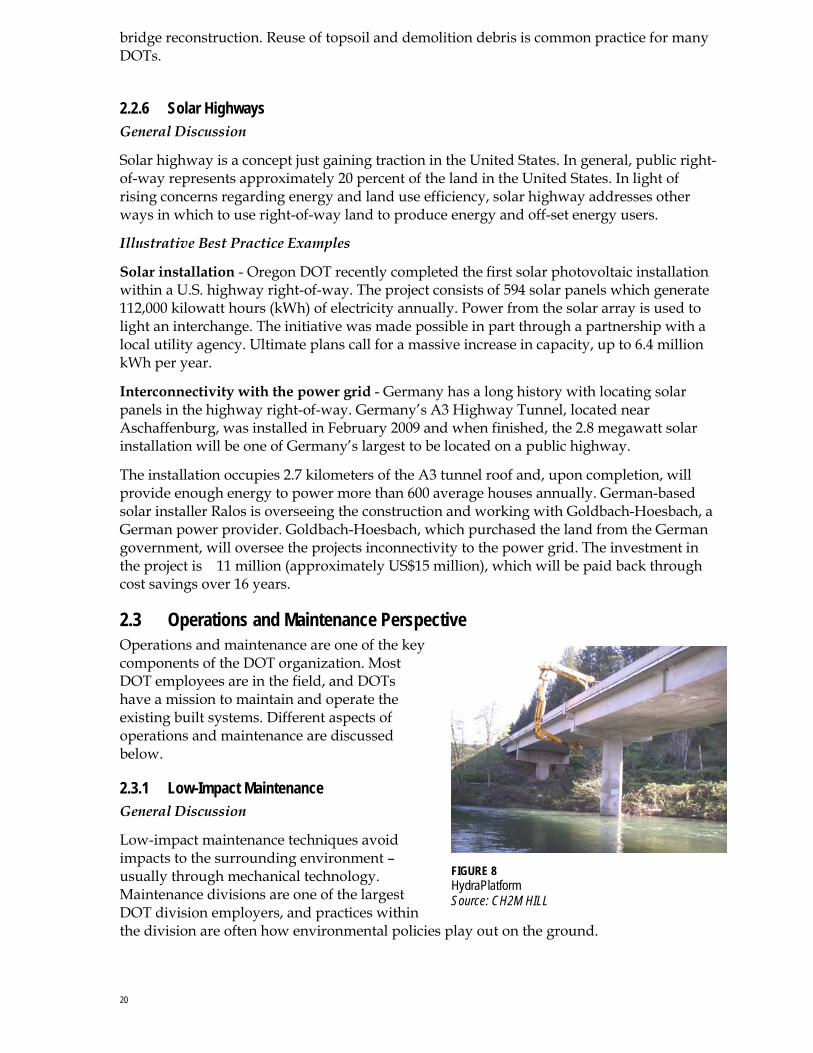
FIGURE 8 HydraPlatform Source: CH2M HILL
21
Illustrative Best Practice Examples
Under-bridge inspection platforms - Several DOTs are using under-bridge inspection platforms, known as hydra-platforms, to perform bridge maintenance while reducing environmental impacts to streams. Hydra-platforms protect water quality and habitat by reducing the need for scaffolding, aerial lifts, and ladders, and keeping formwork strippings from falling into the water below. The Minnesota Department of Transportation began a comprehensive Bridge Inspection Program in 2008 which involved the inspection of all state and local Fracture Critical Bridges and state highway bridges. The Bridge Inspection Program utilized the under-bridge inspection platforms to perform the work. Additional state DOTs that have made purchase arrangements for hydra-platforms include the Missouri Department of Transportation (MoDOT) and the New Mexico Department of Transportation (NMDOT). Best Management Practice manuals for maintenance - The Kentucky Transportation Cabinet (KYTC) developed a manual of Best Management Practices (BMPs) For Maintenance Activities In and Around Streams. The manual was developed to introduce the Army Corps of Engineer’s state programmatic general permit for highway maintenance, and to give engineers and maintenance personnel practical guidelines when performing activities in and around streams. The guidelines were endorsed not only by the Corps but by multiple state agency divisions and several KYTC maintenance districts. Though activities deemed detrimental to the environment or damaging to the general public interest may be revoked from coverage by the Corps’ District Engineer, the effort is clarifying expectations and improving performance on a programmatic level. The manual prohibits stream channelization or channel deepening as part of cleanup operations and avoids placement of equipment in-stream, whenever possible. Work is to be performed during low-flow conditions whenever possible and disturbance to existing stream bank vegetation is not to occur “unless absolutely necessary.” Removed material must not be placed on the streambanks or in the floodway, and disturbed areas must be seeded and mulched.
2.3.2 Snow/Ice Removal General Discussion
Every winter, substantial quantities of snow and ice control products are applied to highways, which raises questions about the environmental effects of these products and if less toxic alternatives exist. If less toxic alternatives exist, highway agencies need to know if they perform well enough to maintain traffic safety in winter conditions. A recent National Cooperative Highway Research Program Report (NCHRP Report 577) provides “Guidelines for the Selection of Snow and Ice Control Materials to Mitigate Environmental Impacts.” Areas of greatest environmental concern included water quality and aquatic life, air quality, and vegetation impacts. Atmospheric corrosive properties of snow and ice control products are also a concern, as they can enable and/or accelerate the corrosion of concrete reinforcing rebar and cement pavements. The NCHRP study provides guidelines for selection of snow and ice control materials based on their properties, together with common site-specific conditions near roadways on which these products would be used. The report provides a practical snow and ice control material selection process (decision tool) for highway agencies. Selected snow and ice control materials are chloride salts, acetates, organic products, and abrasives.
22
The topic of de-icing chemicals also manifests as an issue of concrete durability. Through mix-design and placement techniques, some DOTs ensure long-term durability and performance against:
o Corrosion — most prominent problem
o Alkali-Silica Reactivity (ASR)
o Delayed Ettringite Formation (DEF)
o Sulfate Attack
o Freeze — thaw damage
In the context of climate change, it is imperative that such a multi-disciplinary view be adopted. Jurisdictions may likely face unprecedented weather conditions, and need to respond quickly and effectively.
Illustrative Best Practice Examples
Snow and Ice Control Product - Montana Department of Transportation (MtDot) and Colorado Department of Transportation (CDOT) provide examples of environmental considerations in the selection of snow and ice control product application. CDOT makes use of their Maintenance Decision Support System (MDSS) that combines advance weather prediction, advanced road condition prediction and rules of practice for anti-icing and de-icing to generate road treatment recommendations on a route-by-route basis. CDOT completed a three-year study into the effects of liquid magnesium chloride on the roadside environment and has found that the product does not significantly harm aquatic of vegetative plant life. The study found that the sand/salt mixture used in the past can be more damaging to aquatic life as large amounts of silt are washed into streams. The product does not add air pollutants to the environment and improves air quality by offsetting usage of sanding material. The study found that liquid anti-icers and de-icers have less negative impact on highway bridge decks, trees, and vegetation, and water supply than any other method of winter road treatment.
Since increasing the use of liquid anti-icing and de-icing products, there has been a significant reduction in the number of days that state highways are closed due to inclement weather. MnDOT uses the same snow and ice control products. Washington, Oregon, Idaho, British Columbia and Montana joined together to develop standards for anti-icing products. The organization is called Pacific Northwest Snowfighters Association, and is committed to The mission of the PNS is to provide specifications for the highest quality products balancing quality of environment with providing the safest possible transportation system and maximum mobility for the traveling public during snow and ice conditions, within reasonable budgetary, product performance and environmental constraints.
2.3.3 Intelligent Transportation Systems (ITS) and Traffic Management General Discussion
Many DOTs are emphasizing the importance of maintaining traffic operations and safety while providing roadway operations and maintenance services. Many ITS strategies or active traffic management strategies seek to optimize the capacity of the transportation system through the use of various technologies that can adapt to changing traffic conditions. Traffic management techniques seek to balance demand with capacity by informing drivers about driving conditions, thus drivers can make informed decisions. These strategies include traffic signal timing and optimization, ramp metering, high
23
occupancy toll (HOT) lanes and variable speed facilities. Other ITS strategies utilize advanced traveler information systems to not only inform the public but provide the public with travel choices.
Illustrative Best Practice Examples
Adaptive Traffic Control Systems - Caltrans (California’s Department of Transportation) has recently implemented Adaptive Traffic Control Systems (ATCSs) in Los Angeles County. ATSSs have been installed on seven corridors on State Routes in Los Angeles County. Traffic signal systems that respond in real-time to changes in traffic patterns are known as “adaptive.” ATCSs belong to the latest generation of signalized intersection control. ATCSs continuously detect vehicular traffic volume, compute “optimal” signal timings based on this detected volume and simultaneously implement them. Reacting to these volume variations generally results in reduced delays, shorter queues and decreased travel times. ATCSs are designed to overcome the limitations of pre-timed control and respond to changes in traffic flow by adjusting signal timings in accordance with fluctuations in traffic demand. The purpose of Caltrans’ demonstration project is to deploy and evaluate the effectiveness of the future ATCS on the State arterial street network that experiences both everyday and unpredictable changes in traffic flow. The ATCS system was shown to reduce travel time by 12.7 percent, reduce average stops by 31 percent, and decrease average delays by 21.4 percent.
Variable speed facilities - As part of WSDOT and Sound Transit’s I-90 Two-Way Transit and High Occupancy Vehicle (HOV) Operations project, crews installed 14 electronic speed limit signs, which will allow varying speed limits to be displayed. WSDOT expects these signs will increase safety, decrease collisions and keep traffic moving during construction on westbound I-90 by alerting drivers to reduce their speed when backups or collisions are on the road ahead. WSDOT uses variable speed limit signs on US 2 at Steven Pass and on I-90 at Snoqualmie Pass to alert drivers to slow down during icy, snowy and congested driving conditions. Similar signs installed on European urban roadways increased safety and decrease congestion-related collisions by 30% or more. This new traffic technology is a key element of WSDOT’s congestion relief program called “Moving Washington”.
2.3.4 Workflow Technologies General Discussion
Transportation agencies are using Global Positioning Systems (GPS) and other technologies to be more efficient with operations and maintenance activities. This efficiency not only minimizes time and dollars spent on maintenance, but also often minimizes the amount of driving needed, resulting in minimized tailpipe emissions.
Illustrative Best Practice Examples
Pavement Management Systems - Hawaii DOT has implemented an electronic Pavement Management System. This allows maintenance workers to link trips and plan routes so that they save fuel (and money) by planning the shortest route. It also allows tracking so that utility and pavement overlay projects are linked; thereby minimizing maintenance cost and enhancing department image in the community.
Workforce management software - The City of Chicago DOT has installed workforce management software (TimeTrack) on mobile phones used by road crew foremen. This changed how the foremen received assignments and reported progress on assignments,
24
limiting paperwork and saving time. Time worked is recorded electronically, and job assignments are transmitted via cell phone.
2.4 Use of Performance Measures Performance measures or indicators are used to link DOT actions to their overall mission and goals. Sustainability performance measures can help DOTs monitor environmental, economic, and social performance – and can help communicate that performance to stakeholders (that is, elected officials and the public). Sustainability performance measures may be used to help prioritize and influence funding decisions (in balance with other measures).
In his 2008 Developing Indicators for Comprehensive and Sustainable Transport Planning, Todd Litman references many different performance measure frameworks, but acknowledges that “There are currently no standardized indicator sets for comprehensive and sustainable transport planning. Each jurisdiction or organization must develop its own set based on needs and abilities.” Litman goes on to state, “It would be useful for major planning and professional organizations to establish recommended sustainable transportation indicator sets, data collection standards, and evaluation best practices in order to improve sustainability planning and facilitate comparisons between jurisdictions, organizations and time periods.”
Litman references the following principles that should be applied when selecting transportation performance indicators (Hart, 1997; Marsden, Kelly and Snell, 2006):
• Comprehensive – Indicators should reflect various economic, social and environmental impacts, and various transport activities (such as both personal and freight transport). • Data quality – Data collection practices should reflect high standards to insure that information is accurate and consistent. • Comparable – Data collection should be standardized so the results are suitable for comparison between various jurisdictions, times and groups. Indicators should be clearly defined. For example, “Number of people with good access to food shopping” should specify ‘good access’ and ‘food shopping.’ • Easy to understand – Indicators must useful to decision-makers and understandable to the general public. The more information condensed into a single index the less meaning it has for specific policy targets (for example, Ecological Footprint analysis incorporates many factors) and the greater the likelihood of double counting. • Accessible and transparent – Indicators (and the raw data they are based on) and analysis details should be available to all stakeholders. • Cost effective – The suite of indicators should be cost effective to collect. The decision-making worth of the indicators must outweigh the cost of collecting them. • Net effects – Indicators should differentiate between net (total) impacts and shifts of impacts to different locations and times. • Performance targets – select indicators that are suitable for establishing usable performance targets.
Many DOT executives and other state leaders believe that what is not measured is not managed – so when sustainability is integral to a DOT’s mission, performance must be measured and tracked.
25
2.4.1 Rating systems General Discussion
Rating systems attempt to quantify performance of transportation decisions or projects. They are intended for use in benchmarking, in identifying areas of success, and in identifying areas of opportunity for improvement. Rating systems award credits for sustainable choices or practices, and often result in a certification.
Rating systems can be used in the following ways:
• Defining basic transportation sustainability attributes. A list of sustainable transportation attributes can be useful to those seeking to design/construct a more sustainable roadway.
• Garnering greater participation in transportation sustainability. The idea of rating systems is to present transportation and sustainability in a straightforward manner so that everyone can understand and participate in sustainability – particularly at a project level.
• Evaluating sustainability tradeoffs. Every project involves tradeoffs. Rating systems can compare two different items using a common point system to determine their relative impact.
• Providing a means for sustainability assessment. Rating systems can help track sustainability progress.
• Confer market recognition for sustainability efforts. Rating systems can help increase awareness of sustainability efforts and gives recognition to those who participated in the effort.
Illustrative Best Practice Examples
GreenLITES - New York State DOT (NYSDOT) has developed a program called GreenLITES (Leadership in Transportation and Environmental Sustainability), a self-certification program for New York State that awards transportation projects based on the extent to which they incorporate sustainable design choices. GreenLITES is an internal management program for NYSDOT to measure performance, recognize good practices, and identify improvements where needed.
The program allows transportation project designs with environmentally sustainable features to be eligible for green certification. GreenLITES distinguishes transportation projects based on the extent to which they incorporate sustainable design in the following categories: 1) Sustainable Sites, 2) Water Quality, 3) Materials and Resources, 4) Energy and Atmosphere, and 5) Innovation/Unlisted. Projects are scored according to their impact and contribution to advancing “the state of practice” in furthering sustainability. Other rating systems – Other rating systems exist for assessing the “sustainability quotient” of a transportation system. Benefits include the ability to link sustainability factors with decision-making, and promote more sustainable design and construction. Greenroads is a prototype rating system specifically for the sustainable design and construction of roadways jointly developed by CH2M HILL and the University of Washington. It is modeled after the Leadership in Energy and Environmental Design (LEED) green building rating system administered by the U.S. Green Building Council (USGBC).
26
The system outlines key prerequisites that a project must meet to qualify for Greenroads certification. It also carries a variety of optional credit categories under the following headings:
• Environment and Water
• Access and Equity
• Construction Activities
• Materials and Resources
• Pavement Technologies
• Exemplary Performance
One key benefit is that the credit categories lend themselves to quantifiable performance. While many of the data/metadata needed to inform these performance indicators are likely not part of current data collection regimen, they are quite specific to project improvements. This data collection could be tasked to contractors, with state DOT or transportation agencies providing oversight.
2.4.2 Environmental Management Systems General Discussion
Environmental management systems (EMSs) are designed to help an agency reduce its environmental impacts and manage a full range of environmental, public health, and safety issues.
The goal of an EMS is to continually improve environmental performance and provide benefits like reduced costs through energy and water conservation, reduced chemical usage, reduced risk of noncompliance, and so on.
One organization that provides certification for the implementation of an EMS is the International Organization for Standardization, or ISO. ISO standard 14001 is the specification for environmental management. ISO 14001 requires annual auditing, after initial certification, to ensure that processes are maintained to meet the standards for reliable water and wastewater services.
Illustrative Best Practice Examples
ISO 14001 - International Organization for Standardization (ISO) 14000 refers to a family of voluntary standards and guidance documents to help organizations address environmental issues. Included in the family are standards for EMS, environmental and EMS auditing, environmental labeling, performance evaluation, and life-cycle assessment. ISO 14001 is the foundation document of this group. Many DOTs have adopted EMS for their internal operations reporting.
Annual reporting – Several agencies and companies now do internal audits and reporting based on ISO 14001 indicators, which are published in annual or bi-annual reports. These reports not only help the agency determine its progress toward measures (e.g. paper use over time), but helps communicate successes with the public and stakeholders. Patagonia and other private companies have rigorous annual reporting processes that are conducted for reporting on internal environmental indicators, related to items such as office supplies, energy usage and facilities. Washington DOT reports on internal environmental indicators in a report as well.
27
2.4.3 Ongoing Research
General Discussion
The in-process National Cooperative Highway Research Program (NCHRP) 08-74 project “Sustainability Performance Measures for State Departments of Transportation and Other Transportation Agencies” is examining the appropriate performance measures for DOTs and other transportation agencies. Several agencies (for example, NYSDOT, Oregon DOT, and the City of Olympia, Washington) have specific indicators, metrics, and goals related to sustainability and transportation. The NCHRP report is examining best practices in this area, and ways for performance measures to be both helpful for decision-making and feasible to implement and track for agencies.
The Victoria Transport Policy Institute (VTPI) has written a number of papers on the subject of sustainable transportation indicators, including the following:
1. “Sustainable Transportation Indicators — A Recommended Research Program For Developing Sustainable Transportation Indicators and Data” http://www.vtpi.org/sustain/sti.pdf. Includes a semi-active listserve dedicated to indicators (for more information, see http://lists.cutr.usf.edu/read/?forum=sti).
2. “Well Measured — Developing Indicators for Comprehensive and Sustainable Transport Planning” http://www.vtpi.org/wellmeas.pdf
3. “Measuring Transportation —Traffic, Mobility and Accessibility” www.vtpi.org/measure.pdf
Best practices are forthcoming from this ongoing research.
3.0 Summary Global concerns about climate change, energy use, environmental impacts, and limits to financial resources for transportation infrastructure require new and different approaches to planning, designing, constructing, operating, and maintaining transportation solutions and systems. There are multiple best practices at the system-wide, planning, design, construction, operations and maintenance levels of transportation organizations. Many DOTs excel in certain areas with regard to sustainability, while others excel in other areas. DOTs across the country are concerned with the sustainability triple bottom line as well as the implications for mitigation and adaptation to climate change.
The sustainability and transportation peer exchange hosted by the Center for Environmental Excellence by AASHTO on May 27-29 at the Gallaudet University Kellogg Conference Hotel will provide a forum to discuss best practices presented in this memorandum, and in particular, other best practices utilized by participating DOTs
4.0 References and Resources Acott, Mike (National Asphalt Pavement Association President). 2009. Testimony before the
House Science and Technology Subcommittee on Technology and Innovation. Retrieved from: www.hotmix.org/images/stories/NAPA%20Testimony%20With%20References%20and%20Mike%20Bio%20FINAL.pdf. March 31, 2009.
28
Advances in Porous Pavement, March-April 2005. Stormwater: The Journal for Surface Water Quality Professionals. Retrieved from: http://www.stormh2o.com/march-april-2005/pavement-materials-watershed.aspx. May 18, 2009
American Association of State Highway and Transportation Officials (AASHTO) Center for Environmental Excellence. 2009a. “About Best Practices.” Retrieved from: www.environment.transportation.org/environmental_issues/construct_maint_prac/compendium/best_practices. March 2009.
American Association of State Highway and Transportation Officials (AASHTO) Center for Environmental Excellence. 2009b. “Environmental Management Systems.” Retrieved from: http://environment.transportation.org/environmental_issues/environ_mgmt_sys/#bookmarkEMSFundamentals. April 2009.
American Society of Civil Engineers. Deep Foundation Challenges at the New Benecia-Martinez Bridge. Retrieved from: http://cedb.asce.org/cgi/WWWdisplay.cgi?0409707. May 2009.
Asphalt: The Magazine of the Asphalt Institute. 2009. “Warm Mix Asphalt - Gaining Momentum.” Retrieved from: www.asphaltmagazine.com/singlenews.asp?item_ID=1679&comm=0&list_code_int=mag01-int. March 10, 2009.
Bennett, Steve. 2008. “Chicago DOT Finds Value in GPS System. “Government Fleet. Retrieved from: www.government-fleet.com/Article/Story/2008/05/Chicago-DOT-Finds-Value-in-GPS-System.aspx. May 2008.
Bevan, Timothy A., Donna L. Day, Robin Senner, and Sam Seskin. 2008. Planning for Sustainability: Planning for Sustainable Transportation Infrastructure. Canadian Institute of Transportation Engineers.
Buckeye, Kenneth and Lee W. Munnich Jr. 2009. I-394 MnPASS Phase II Planning Study: Linking Land Use, Transit, Telecommuting, and Congestion Pricing. Transportation Research Board 88th Annual Meeting.
Center for Environmental Excellence by the American Association of State Highway and Transportation Officials (AASHTO). Land Use Recent Developments Archive. Retrieved from: http://environment.transportation.org/environmental_issues/land_use_sg/recent_dev_archive.aspx#bookmarkNYSDOTLaunchesGreenCertificationforRoadBridgeDesigns. May 18, 2009.
Center for Environmental Excellence by the American Association of State Highway and
Transportation Officials (AASHTO). 2009. Sustainability Recent Developments. Retrieved from: http://environment.transportation.org/environmental_issues/sustainability/recent_dev.aspx#bookmarkNewYorkCityReceivesInternationalAwardforSustainableTransport. May 18, 2009.
Centre for Sustainable Transportation. 2002. “Definition and Vision of Sustainable
Transportation.” Retrieved from: http://cst.uwinnipeg.ca/documents/Definition_Vision_E.pdf. October 2002.
29
Colorado Department of Transportation. Winter Road Treatments. Retrieved from: http://www.dot.state.co.us/travelinfo/winterdriving/faqs.cfm. May 18, 2009.
Cong, Theresa and Ayman Salama. September, 2008. LA-107 Adaptive Traffic Control System-Observed Benefits, September, 2008.
Easterlin, Jared C. 2009. Full Depth Reclamation: A Cost-Effective and Environmentally-Friendly Alternative. Transportation Research Board 88th Annual Meeting.
Evergreen Solar. 2009. “Evergreen Solar Around the World.” Retrieved from: www.evergreensolar.com/app/en/installations/?page=1&location=&type=2. March 2009.
Federal Highway Administration. December 2008. Summary Report: Peer Workshop on Adaptation to Climate Change Impacts. Retrieved from: http://www.fhwa.dot.gov/planning/statewide/pwsacci.htm. May 18, 2009.
Federation of Canadian Municipalities. 2009. Sample Environmental Indicators and Measurement Approaches for Sustainable Transportation Projects. Retrieved from: www.sustainablecommunities.fcm.ca/files/Capacity_Building_Transportation/Transportation_indicators_en.pdf
Georgia Department of Transportation’s Progress in Open-Graded Friction Course Development, December 2007. Transportation Research Record 1616. Retrieved from: http://www.dot.state.ga.us/doingbusiness/research/Documents/reports/r-OGFC.pdf. May 18, 2009.
Greenroads. 2009. “The Greenroads Rating System.” Retrieved from: www.greenroads.us. March 2009.
Hart, Maureen. 1997. “Evaluating Indicators: A Checklist for Communities.” Johnson Foundation Retrieved from: www.johnsonfdn.org/spring97/indicators.html. May 18, 2009.
Intergovernmental Panel on Climate Change. 2007. WGI Fourth Assessment Report. Climate Change 2007: The Physical Science Basis: Summary for Policymakers. Retrieved from: http://www.ipcc.ch/ipccreports/ar4-wg1.htm. February 5th, 2007.
Krause, Tony, John Stansbury, Bruce Dvorak, David Admiraal, and Andrew Young. 2008. “Development of a Scouring System for Construction-Site BMP Assessment.” Retrieved from Stormwater: The Journal for Surface Water Quality Professionals: www.stormh2o.com/january-february-2008/bmp-assessment-construction-site.aspx. January 2008.
Low Impact Development Center, Inc. 2009. “Sustainable Design and Water Quality Research.” Retrieved from: http://www.lowimpactdevelopment.org/index.html. April 6, 2009.
Marsden, Greg, Kelly, Charlotte and Carolyn Snell. 2006. Selecting Indicators For Strategic Performance Management, Transportation Research Board. Retrieved from: www.mdt.mt.gov/research/docs/trb_cd/Files/06-0378.pdf. May 18, 2009.
Ministry of Transportation and Infrastructure, British Columbia. 2008. Sea-to-Sky Highway Improvement Project. Retrieved from: www.th.gov.bc.ca/seatosky/updates/2008/080617_STSbrochure.pdf. June 17, 2008.
30
Minnesota Department of Transportation. November 2008. Bridge Inspection House Transportation Finance. Retrieved from: http://www.dot.state.mn.us/i35wbridge/legislative/ppt/11-12-08-2legislative.ppt. May 18, 2009.
Montana Department of Transportation. Winter Maintenance. Retrieved from:
http://mdt.mt.gov/mdt/travinfo_faq.shtml. May 18, 2009.
National Asphalt Paving Association. 2009. “Warm Mix Asphalt.” Retrieved from: www.warmmixasphalt.com. May 2009.
National Cooperative Highway Research Program (NCHRP) Project 25-25 Final Report. Environmental Stewardship Practices, Procedures, and Policies for Highway Construction and Maintenance. September, 2004. Retrieved from: http://environment.transportation.org/environmental_issues/construct_maint_prac/compendium/manual/. May 2009.
National Cooperative Highway Research Program (NCHRP) Report 577: Guidelines for the Selection of Snow and Ice Control Materials to Mitigate Environmental Impacts. 2007. Transportation Research Board.
New York City Department of Sanitation. 2006. Comprehensive Solid Waste Management Plan, 2006. Retrieved from: http://www.nyc.gov/html/dsny/html/swmp/swmp-4oct.shtml, May 18, 2009.
New York City Department of Transportation. 2009. About DOT Sustainable Streets. Retrieved from: http://www.nyc.gov/html/dot/html/about/stratplan.shtml. May 18, 2009.
New York City Department of Transportation. 2009. Sustainable Streets Strategic Plan for
the New York City Department of Transportation. Retrieved from: http://www.nyc.gov/html/dot/downloads/pdf/stratplan_intro.pdf. May 18, 2009.
New York State Department of Transportation. 2008. GreenLITES Project Design
Certification Program. Retrieved from: https://www.nysdot.gov/programs/greenlites/repository/Green%20LITES%20Certification%20Program%20-%20Full%20Doc%20-%20Final.pdf. May 18, 2009.
Oregon Department of Transportation. 2009a. Interchange Area Management Plan Guidelines.
Retrieved from: www.oregon.gov/ODOT/TD/TP/docs/publications/iampGuidelines.pdf. April 30, 2009.
Oregon Department of Transportation. 2009b. Oregon Solar Highway. Retrieved from: www.oregon.gov/ODOT/HWY/OIPP/docs/OregonInspiration.pdf. March 17, 2009.
Oregon Department of Transportation Sustainability Plan, Volume 1. September 2008. Retrieved from: http://www.oregon.gov/ODOT/SUS/docs/Sustain_Plan_Volume1.pdf. May 18, 2009.
31
Pacific Northwest Snowfighters. About Us. Retrieved from: http://www.wsdot.wa.gov/partners/pns/about.htm. May 18, 2009.
Pennsylvania Department of Transportation. Smart Transportation. Retrieved from: http://www.smart-transportation.com/faqs.html. May 18, 2009.
Pennsylvania Department of Transportation and the New Jersey Department of
Transportation. 2009. The Smart Transportation Guidebook. Retrieved from: http://www.smart-transportation.com/assets/download/Smart%20Transportation%20Guidebook.pdf. May 18, 2009.
The Port of Long Beach. Air Quality. Retrieved from:
http://www.polb.com/environment/air_quality/default.asp. May 18, 2009.
Puget Sound Regional Council. 2008. “Traffic Choices Study.” Retrieved from: http://www.psrc.org/projects/trafficchoices/reports.htm. May 5, 2009.
Rajabipour, et. al. 2009. Recycling and Utilizing Waste Glass as Concrete Aggregate. Transportation Research Board 88th Annual Meeting.
Resource Systems Group, Inc. 2004. “Vermont Best Practices for Access Management.” Vermont Access Management, VTrans. Retrieved from: www.vtaccessmanagement.info/Documents/BestPractices.pdf. March 14, 2004.
Staples, James, Laura Gamradt, and Otto Stein. 2004. Recommendations for Winter Traction Materials Management on Roadways Adjacent to Bodies of Water. Montana Department of Transportation. Retrieved from: http://www.mdt.mt.gov/research/docs/research_proj/traction/final_report.pdf. December 2004.
Transportation Research Board. 2007. National Cooperative Highway Research Program (NCHRP) Report 577: Guidelines for the Selection of Snow and Ice Control Materials to Mitigate Environmental Impacts. Retrieved from: trb.org/news/blurb_detail.asp?id=7739. May 24, 2007.
Transportation Research Circular, Number E-C126. 2008. Surface Transportation Weather and Snow Removal and Ice Control Technology. Retrieved from: onlinepubs.trb.org/onlinepubs/circulars/ec126.pdf. June 16, 2008.
Tri-State Transportation Campaign. 2009. Green Freight. Retrieved from: http://www.tstc.org/issues/freight.html, May 18, 2009.
US Department of Transportation, Federal Highway Administration. 2008. Warm-Mix Asphalt: European Practice. Retrieved from: www.warmmixasphalt.com/submissions/68_20080223_FHWA-PL-08-007.pdf. February 2008.
Washington Department of Transportation. I-90 - Two-Way Transit and HOV Operations - Variable Speed Limit Signs. Retrieved from: http://www.wsdot.wa.gov/Projects/I90/TwoWayTransit/vsl.htm.
Wellar, Dr. Barry. 2008. Methodologies for Identifying and Ranking Sustainable Transport Practices in Urban Regions: Project Synopsis. Retrieved from: www.wellar.ca/wellarconsulting/TCProjectSynopsis.pdf. August 15, 2008.
32
Whitty, James. 2007. Oregon’s Mileage Fee Concept and Road User Fee Pilot Program: Final Report. Retrieved from: www.oregon.gov/ODOT/HWY/RUFPP/docs/RUFPP_finalreport.pdf. November 2007.
Whitty, James. 2009. Oregon’s Mileage Fee Concept and Pilot Program. Oregon Department of Transportation, presented April 2009.
Zanko, Lawrence M. 2009. Gray is Green: The Aggregate Potential of Minnesota Taconite Industry Byproducts. Transportation Research Board 88th Annual Meeting.
Zou, Bo, Megan Smirti, and Mark Hansen. 2009. Reducing Freight GHG Emissions in the California Corridor: The Potential for Short Sea Shipping. Transportation Research Board 88th Annual Meeting.