transportation cost index - portland state university · transportation cost index (tci)...
TRANSCRIPT
Transportation Cost Index: A New Comprehensive Performance Measure for Transportation and Land Use
Liming Wang, Portland State University
In Collaboration with Jenny Liu, Huajie Yang, Wei Shi (PSU)
Bud Reiff (Metro), Brian Gregor (Oregon System Analytics)
Outline
● Why we need yet another performance measure (YAPM)?
● Transportation Cost Index: the idea and implementations
● Demo applications ● Ongoing and future work
2
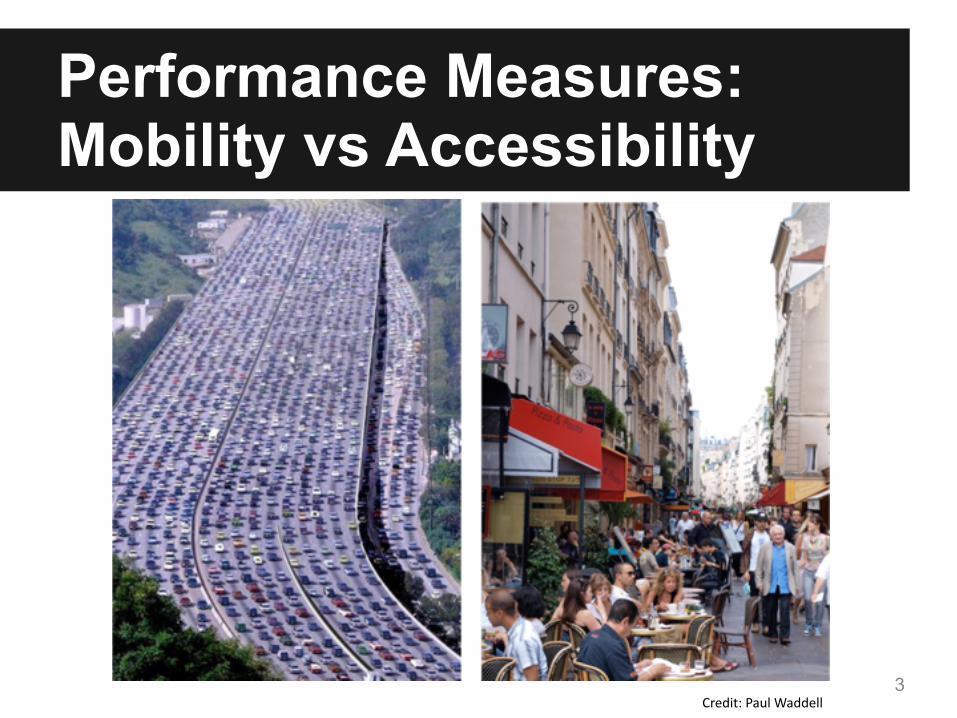
Performance Measures:Mobility vs Accessibility
Credit:PaulWaddell3
Need for Accessibility Measures● As a supplement/replacement of
traffic-centric measures: LOS, travel delays
● MAP-21 emphasizes use of performance measures in transportation planning & operation
● State legislations: Oregon Job and Transportation Act (OJTA)
4
Existing Accessibility Measures● Handy and Niemeier, 1997 ● Geurs and van Wee, 2004 ● NCHRP Report 446, 618, 694, 708 ...
5
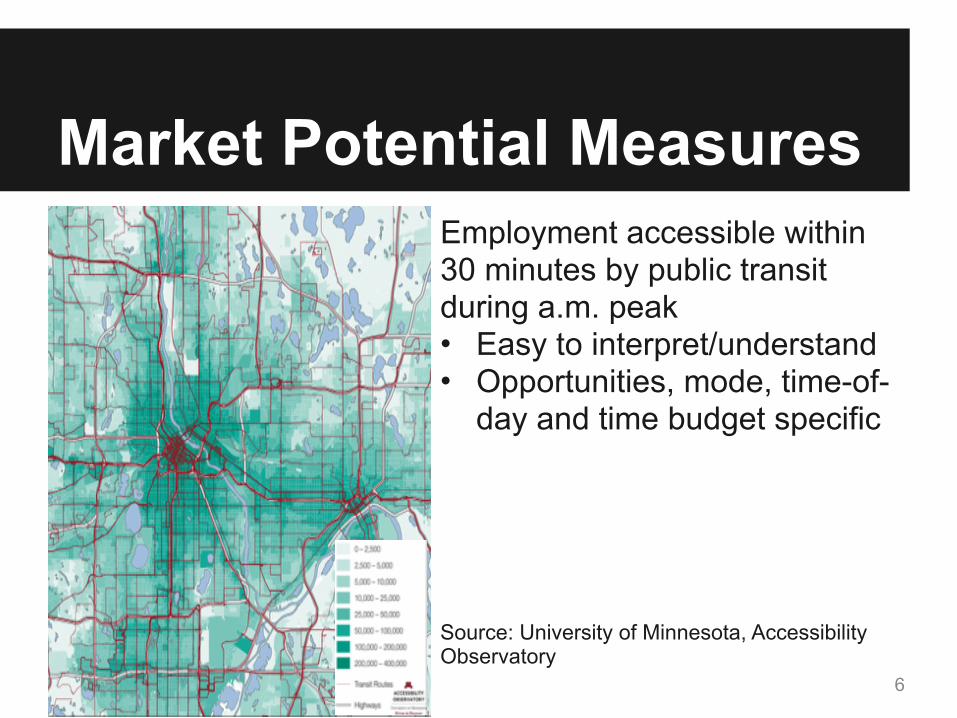
Market Potential MeasuresEmployment accessible within 30 minutes by public transit during a.m. peak • Easy to interpret/understand • Opportunities, mode, time-of-
day and time budget specific
Source: University of Minnesota, Accessibility Observatory
6
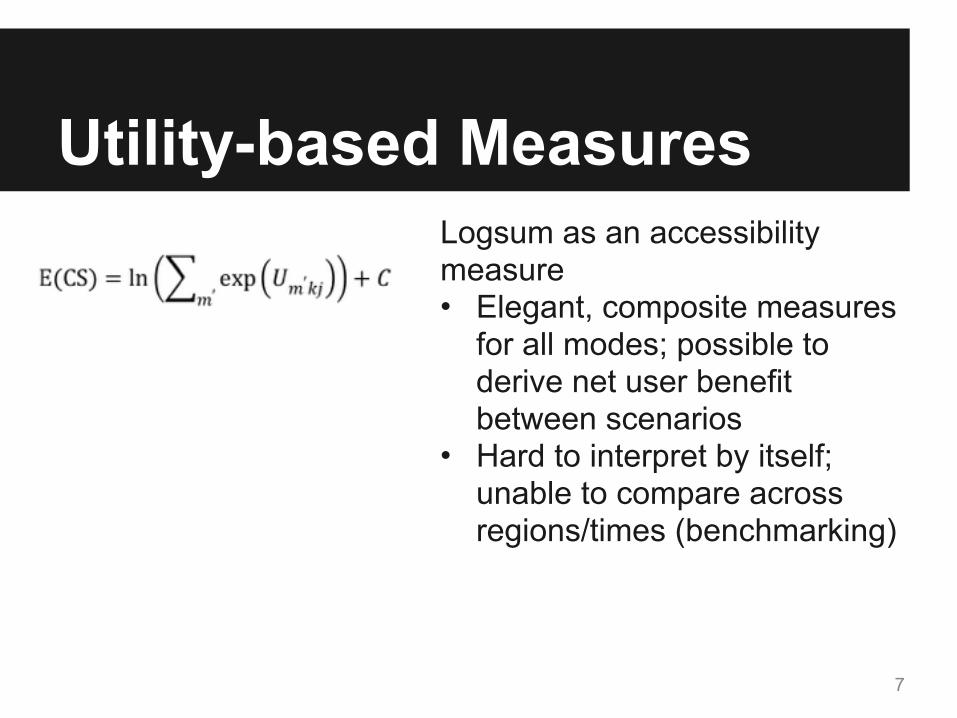
Utility-based MeasuresLogsum as an accessibility measure • Elegant, composite measures
for all modes; possible to derive net user benefit between scenarios
• Hard to interpret by itself; unable to compare across regions/times (benchmarking)
7
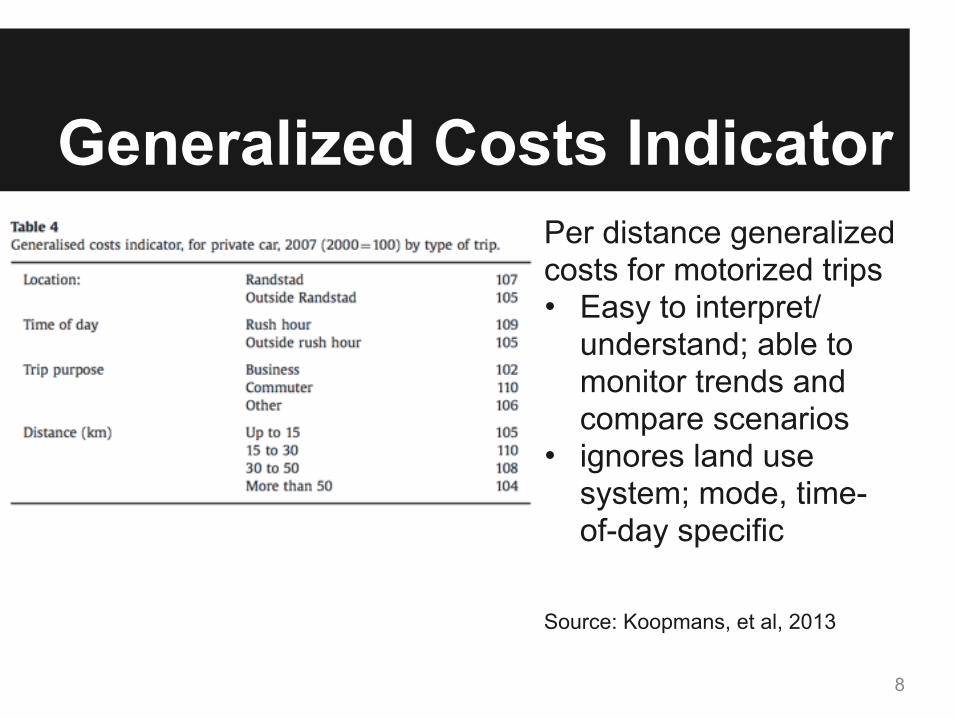
Generalized Costs IndicatorPer distance generalized costs for motorized trips • Easy to interpret/
understand; able to monitor trends and compare scenarios
• ignores land use system; mode, time-of-day specific
Source: Koopmans, et al, 2013
8
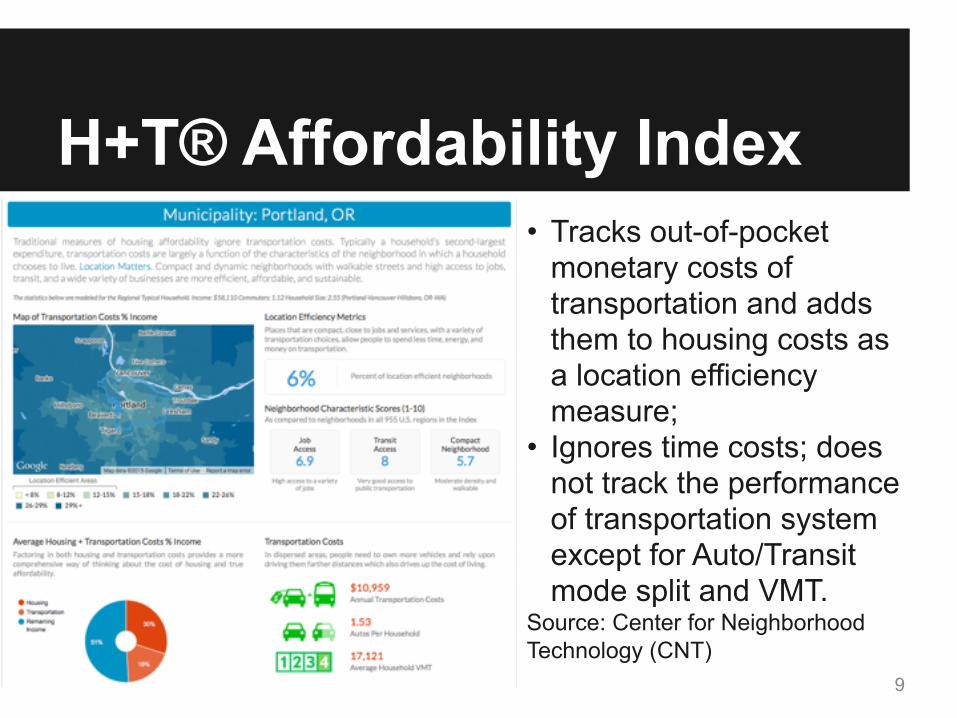
H+T® Affordability Index• Tracks out-of-pocket
monetary costs of transportation and adds them to housing costs as a location efficiency measure;
• Ignores time costs; does not track the performance of transportation system except for Auto/Transit mode split and VMT.
Source: Center for Neighborhood Technology (CNT)
9
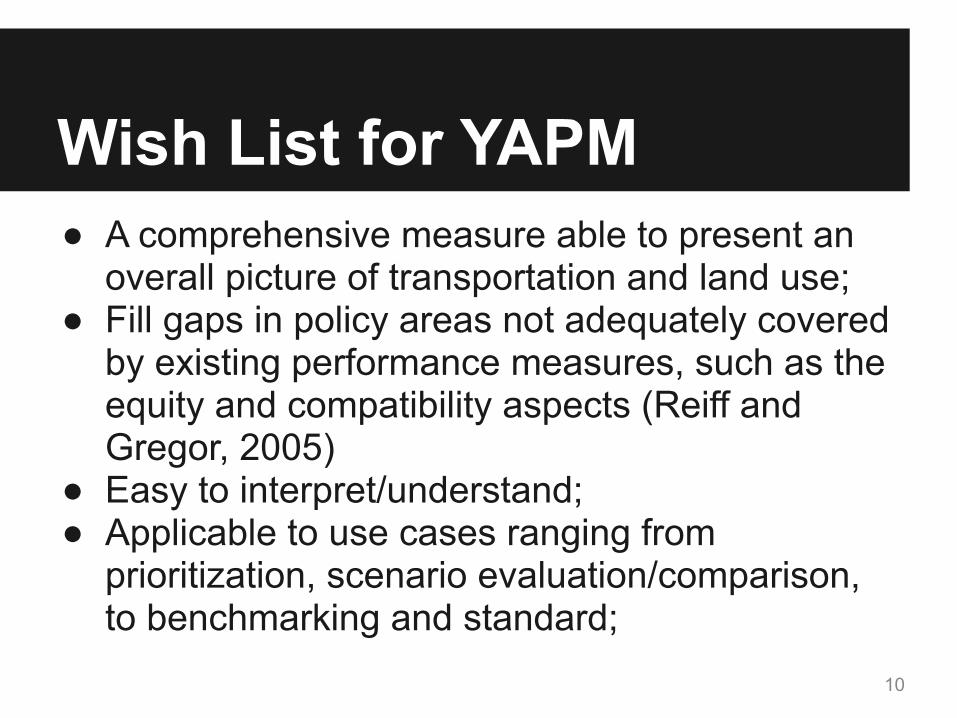
Wish List for YAPM● A comprehensive measure able to present an
overall picture of transportation and land use; ● Fill gaps in policy areas not adequately covered
by existing performance measures, such as the equity and compatibility aspects (Reiff and Gregor, 2005)
● Easy to interpret/understand; ● Applicable to use cases ranging from
prioritization, scenario evaluation/comparison, to benchmarking and standard;
10
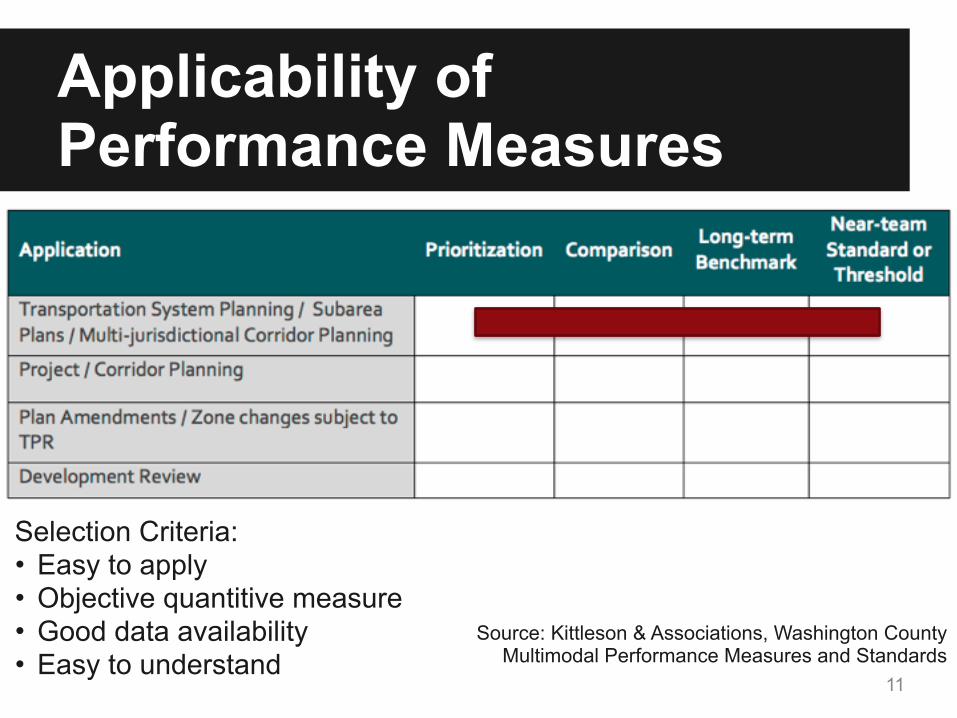
Applicability of Performance Measures
Selection Criteria: • Easy to apply • Objective quantitive measure • Good data availability • Easy to understand
11
Source: Kittleson & Associations, Washington County Multimodal Performance Measures and Standards
TCI: the idea and implementations
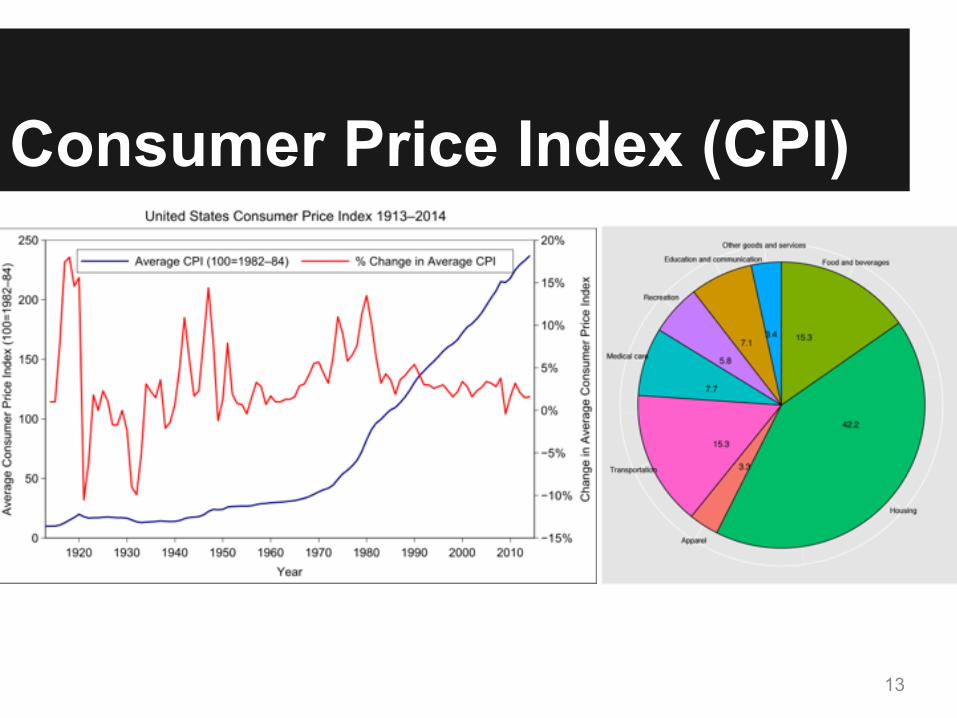
Consumer Price Index (CPI)
13
From CPI to Transportation Cost Index (TCI)Measure changes in the “price level” of a market basket of trips/destinations meeting households’ daily needs: 1. Identify a basket of trips/destinations
based on pre-defined groups (e.g. trip purpose categories);
2. Track the costs of accessing trips/destinations in the basket.
14
Transportation Cost Index (TCI)● Comprehensive measure of transportation
and land use; ● Able to serve as a performance measure for
policy areas including equity, transportation and land use compatibility and balance;
● Easy to interpret/understand; ● Based on widely available data sources,
possible for all uses, esp. benchmarking and scenario evaluation/comparison
15
Implementation A: Travel Survey-based MethodRelies primarily on input from household activity survey, e.g. Oregon Travel & Activity Survey (OTAS) 1. Construct travel baskets based on activity diaries
or a sample of trips/tours that are representative of regional travel pattern, potentially by trip purpose, household size, income group and geography;
2. Track the time and monetary costs of making these trips/tours.
Suitable for prioritization and benchmarking applications.
16
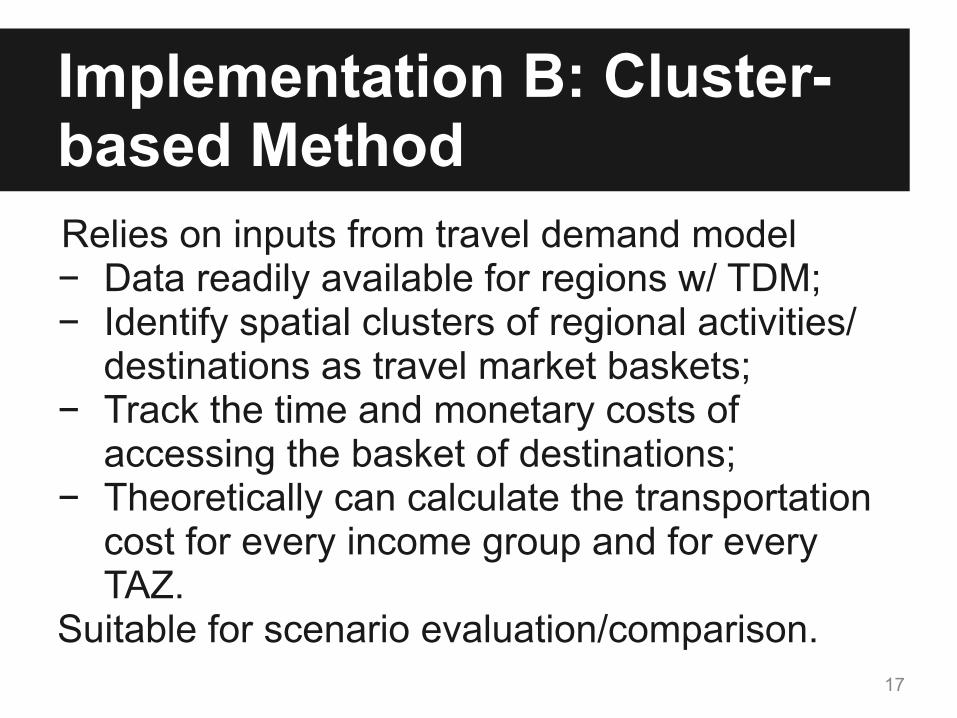
Implementation B: Cluster-based MethodRelies on inputs from travel demand model − Data readily available for regions w/ TDM; − Identify spatial clusters of regional activities/
destinations as travel market baskets; − Track the time and monetary costs of
accessing the basket of destinations; − Theoretically can calculate the transportation
cost for every income group and for every TAZ.
Suitable for scenario evaluation/comparison.17
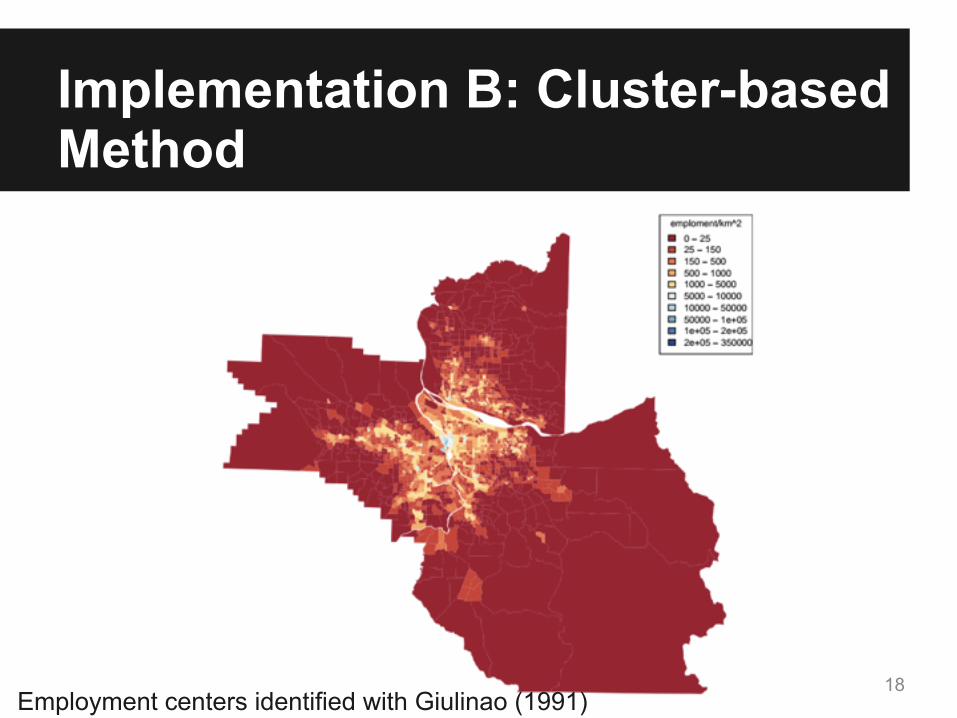
Implementation B: Cluster-based Method
18Employment centers identified with Giulinao (1991)
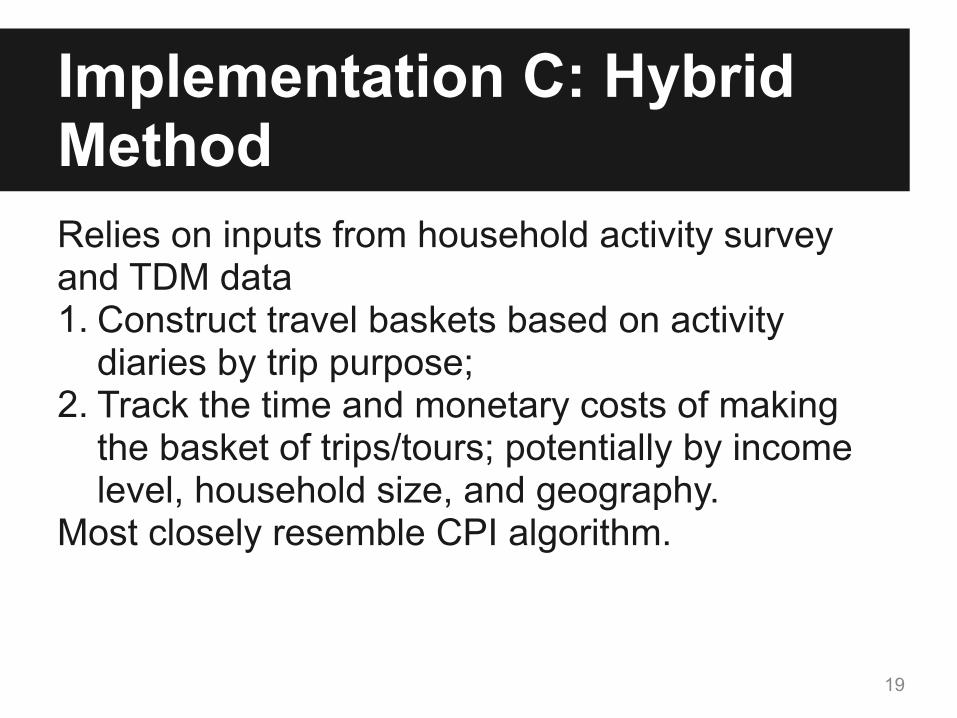
Implementation C: Hybrid MethodRelies on inputs from household activity survey and TDM data 1. Construct travel baskets based on activity
diaries by trip purpose; 2. Track the time and monetary costs of making
the basket of trips/tours; potentially by income level, household size, and geography.
Most closely resemble CPI algorithm.
19
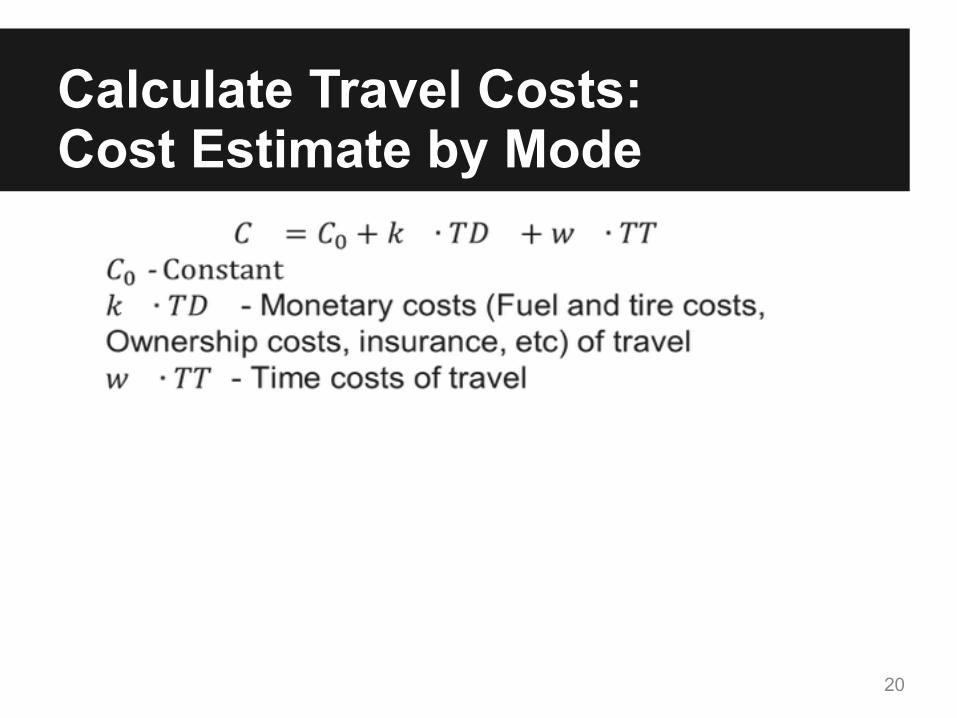
Calculate Travel Costs:Cost Estimate by Mode
20

Applications and Demonstration
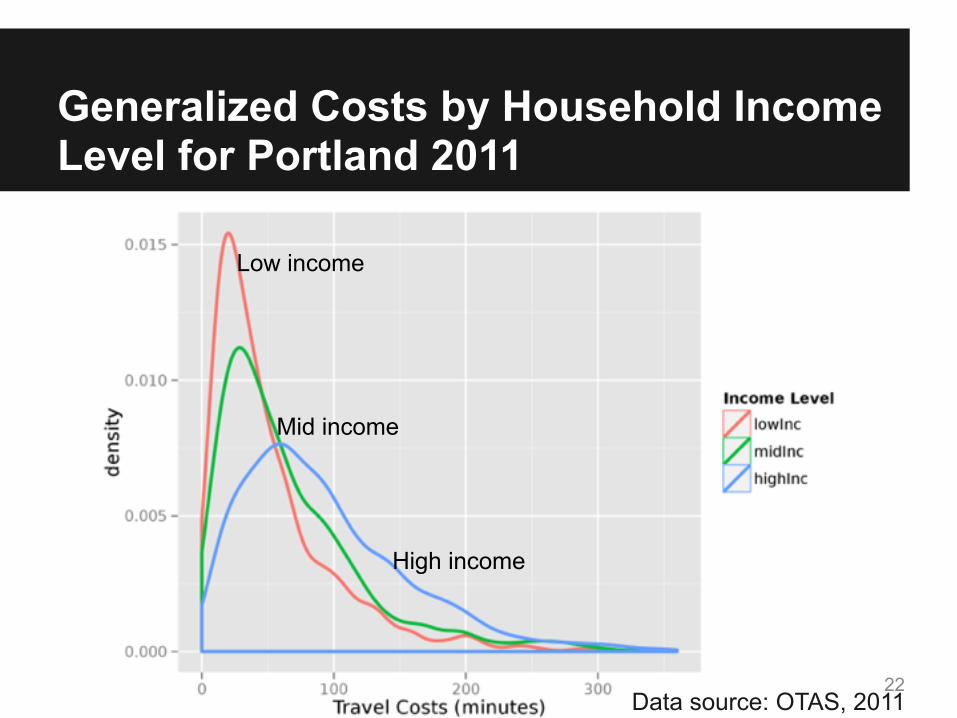
Generalized Costs by Household Income Level for Portland 2011
Low income
Mid income
High income
22Data source: OTAS, 2011
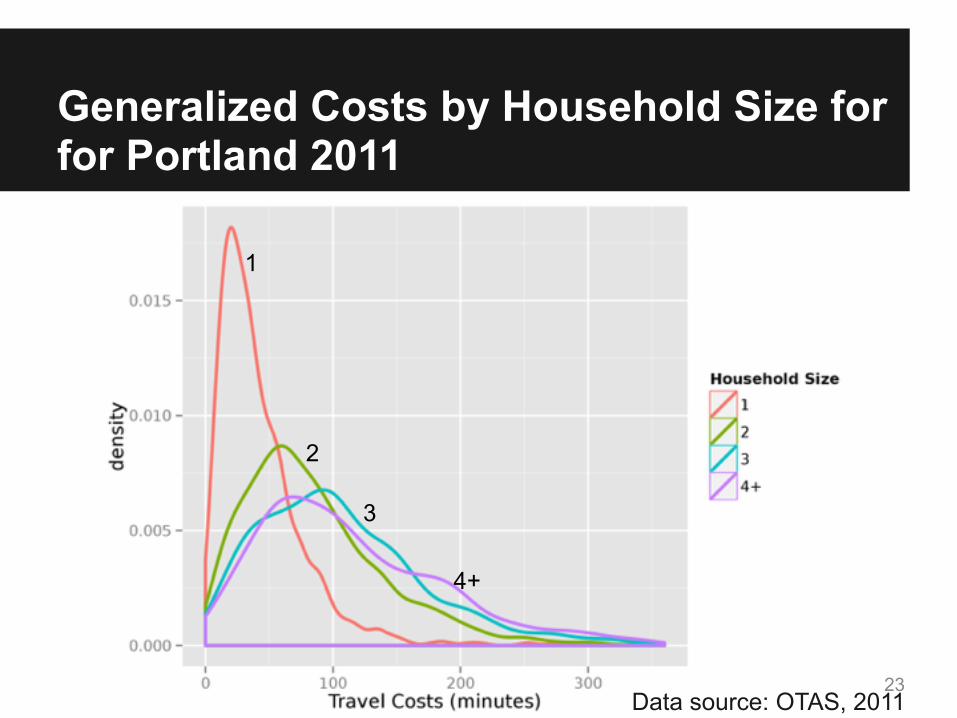
Generalized Costs by Household Size for for Portland 2011
1
2
4+
3
23Data source: OTAS, 2011
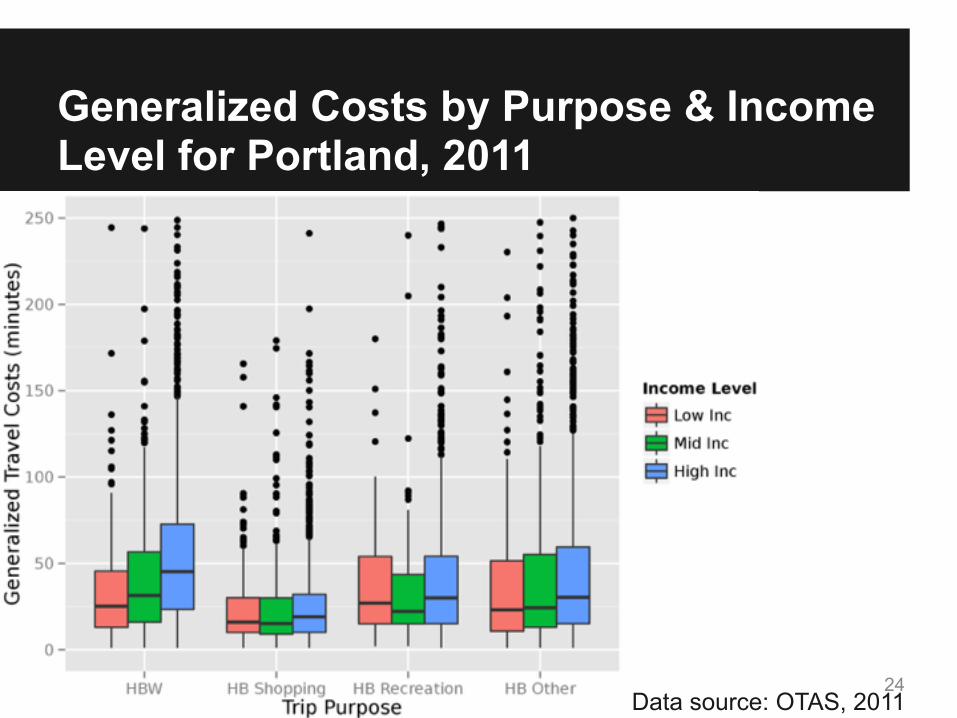
Generalized Costs by Purpose & Income Level for Portland, 2011
24Data source: OTAS, 2011
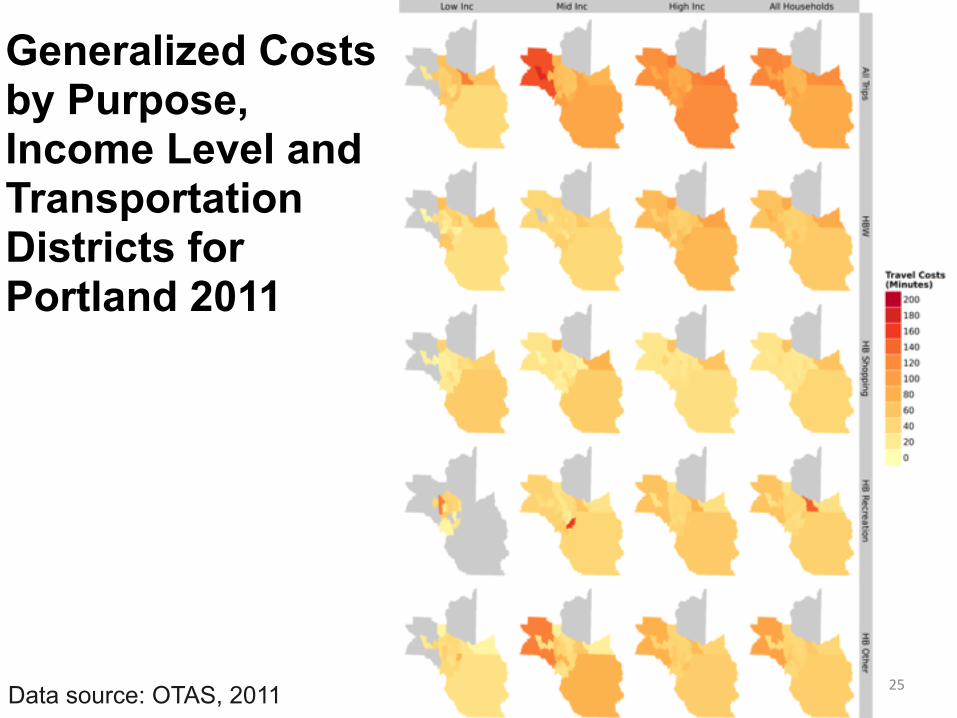
Generalized Costs by Purpose, Income Level and Transportation Districts for Portland 2011
25Data source: OTAS, 2011
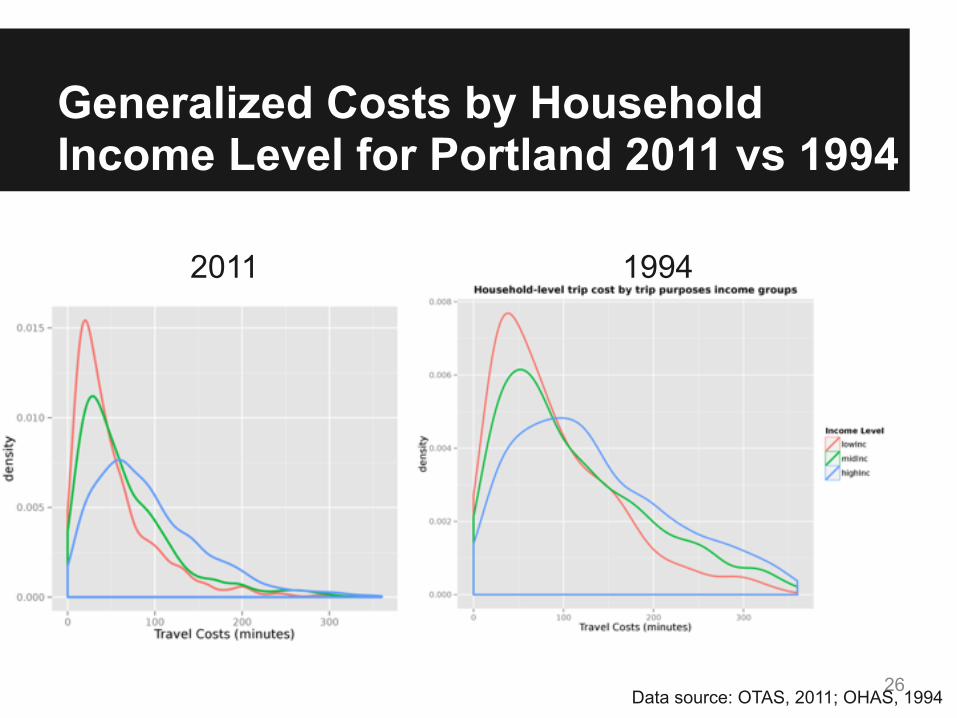
Generalized Costs by Household Income Level for Portland 2011 vs 1994
26
2011 1994
Data source: OTAS, 2011; OHAS, 1994
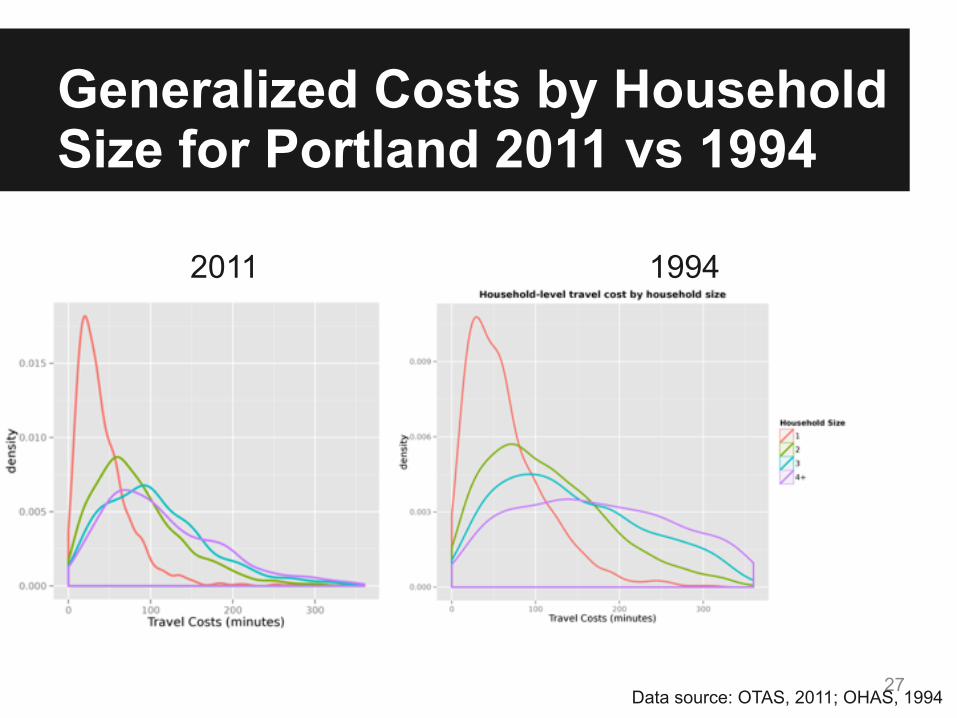
Generalized Costs by Household Size for Portland 2011 vs 1994
2011 1994
27Data source: OTAS, 2011; OHAS, 1994
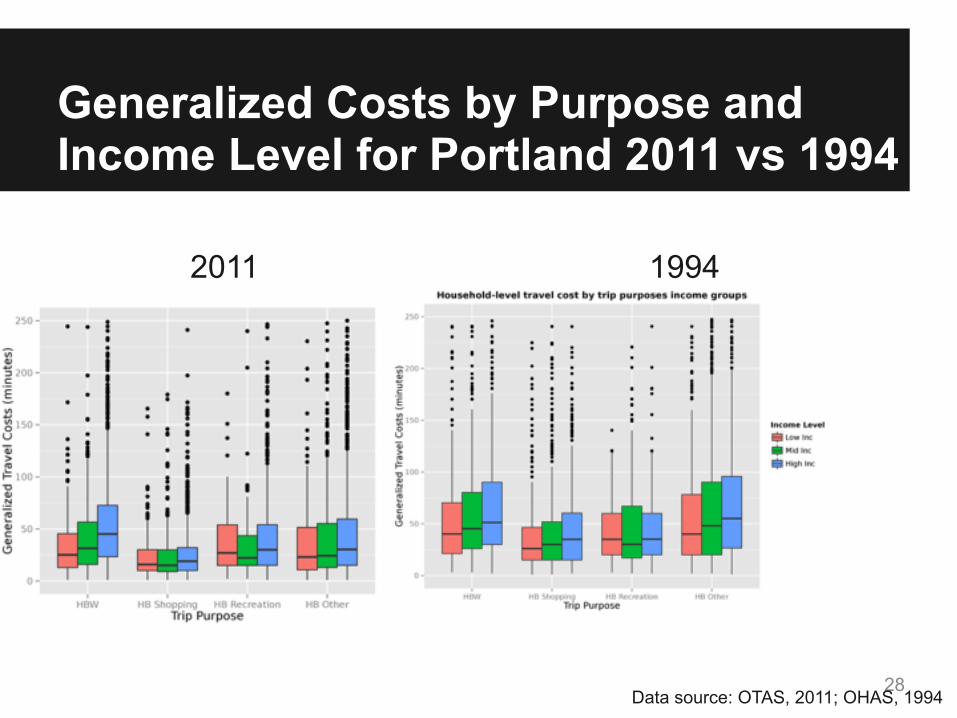
Generalized Costs by Purpose and Income Level for Portland 2011 vs 1994
2011 1994
28Data source: OTAS, 2011; OHAS, 1994
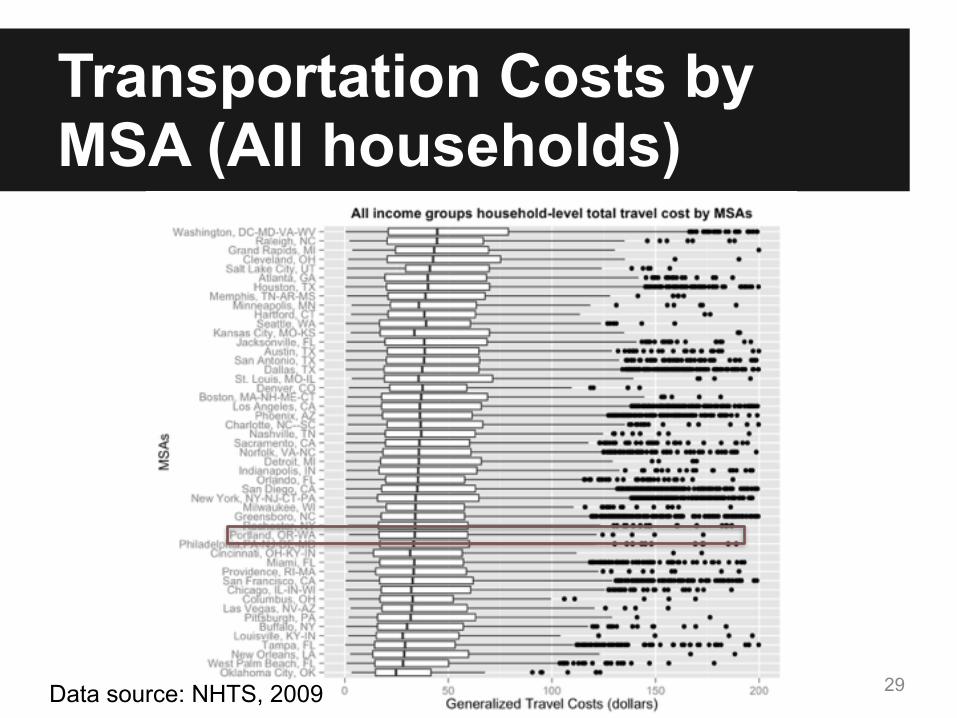
Transportation Costs by MSA (All households)
29Data source: NHTS, 2009
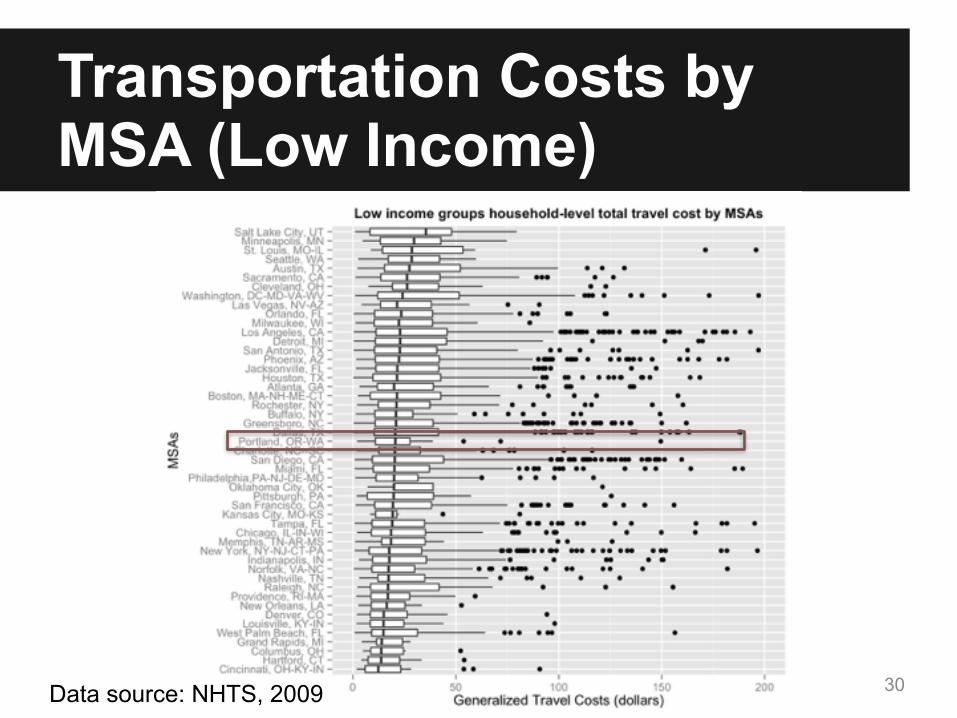
Transportation Costs by MSA (Low Income)
30Data source: NHTS, 2009
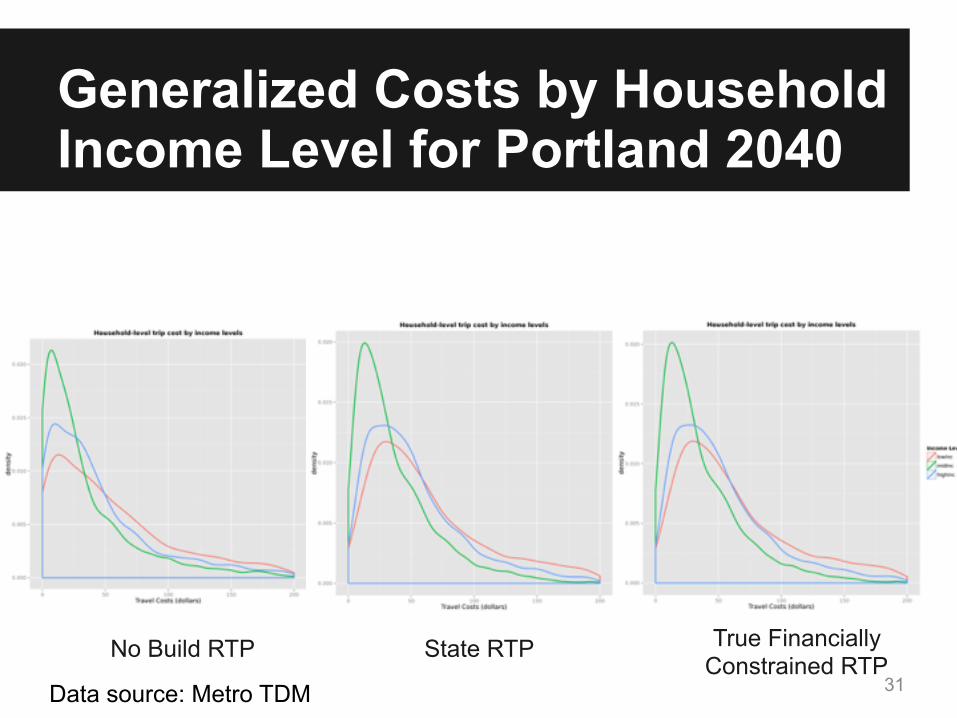
Generalized Costs by Household Income Level for Portland 2040
31
True Financially Constrained RTP
State RTPNo Build RTP
Data source: Metro TDM
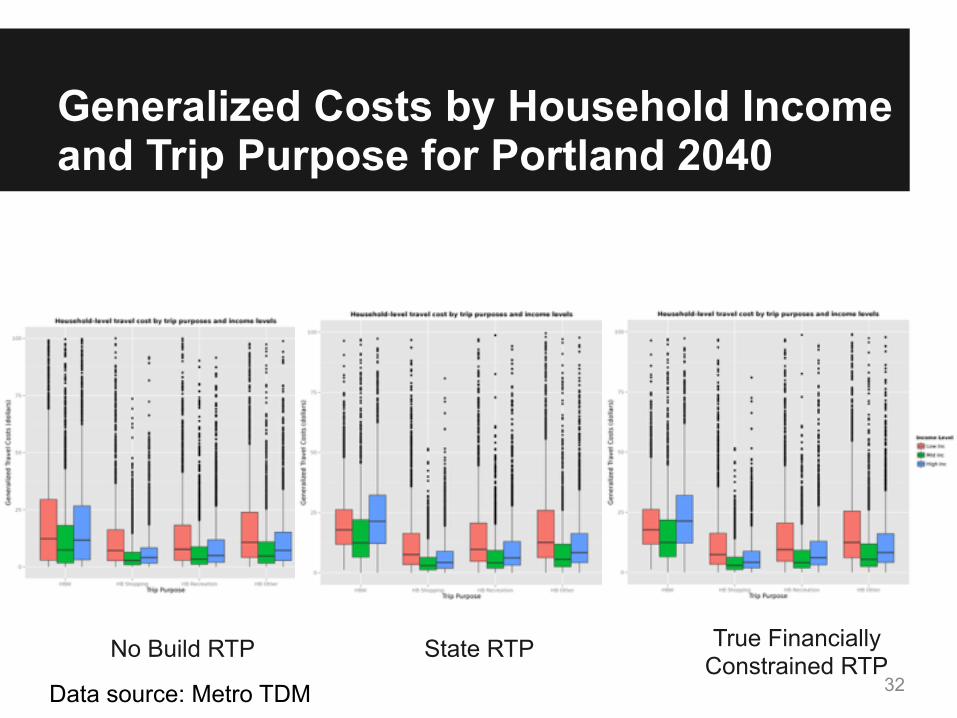
Generalized Costs by Household Income and Trip Purpose for Portland 2040
32
True Financially Constrained RTP
State RTPNo Build RTP
Data source: Metro TDM
Ongoing and Future Work● Adopted by the Oregon Mosaic project as
one of the indicators for Least Cost Planning mandated by Oregon Jobs and Transportation Act
33
Ongoing and Future Work● Test TCI usage in public engagement and
policy making process ● Reconcile TCIs from the two methods; ● Verify patterns of transportation costs with
information from alternative data sources, such as CES;
● Should external costs be included?
34
Code and Working Papers● Code (under active development/testing)
available at http://github.com/cities-lab/tci ● Working Papers: 1. Wang, Liming, Bud Reiff, Brian Gregor, Huajie Yang, and Jenny Liu,
2015. Transportation Cost Index: A Comprehensive Multimodal Performance Measure of Transportation and Land Use Systems, presented at the 94th Annual Meeting of Transportation Research Board, Washington, DC, January 11-15, 2015.
2. Wang, Liming, Huajie Yang and Jenny Liu, Transportation Cost Index as a Performance Measure for Transportation and Land Use Systems: New Approaches and Application in Portland, OR, to be presented at the 95th Annual Meeting of Transportation Research Board, Washington, DC, January 10-14, 2016.
35
Acknowledgements
National Institute for Transportation and Communities
Oregon DOT
36

Extra Slides
Income LevelsTo be consistent with the classification used in Metro’s TDM, household income levels are classified with this scale (1994 dollars): • < $25K: Low Income • $25-50K: Mid Income • > $50K: High Income
38
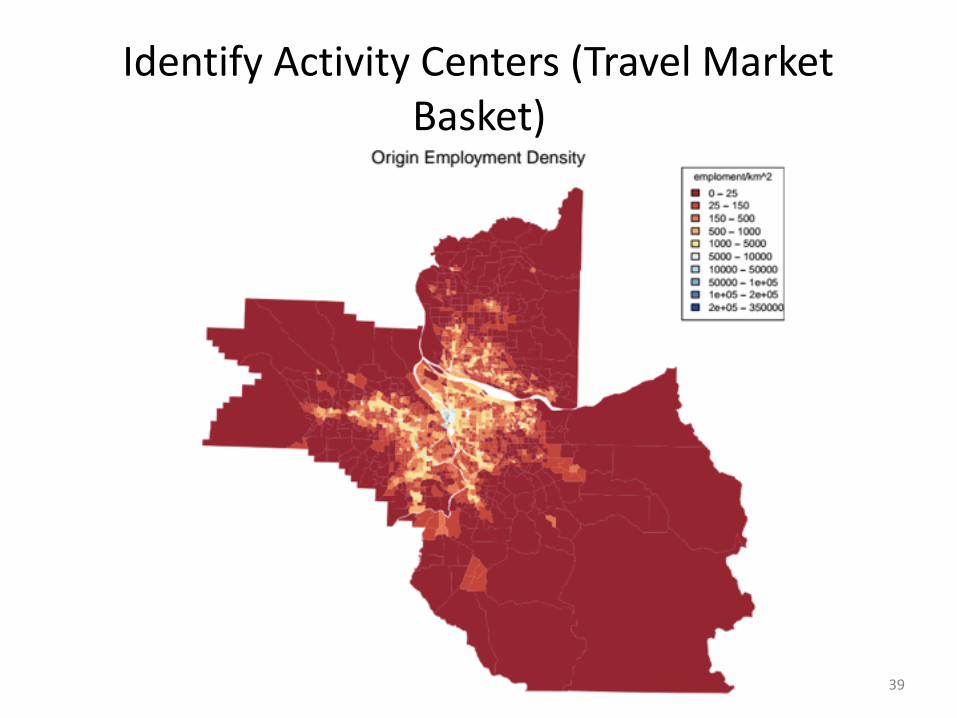
IdentifyActivityCenters(TravelMarketBasket)
39
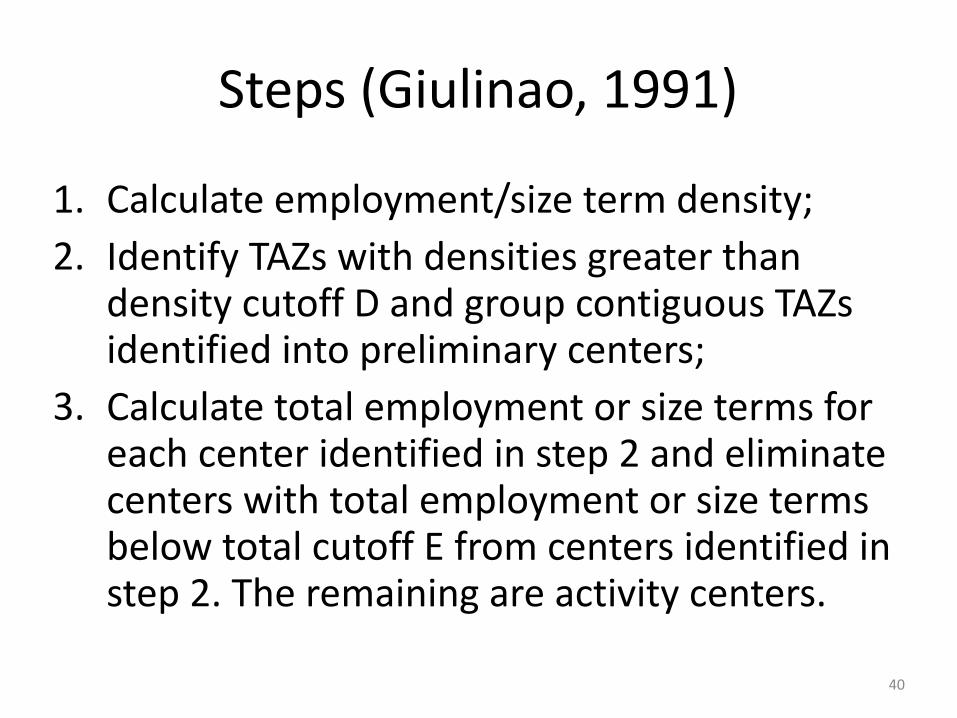
Steps(Giulinao,1991)
1. Calculateemployment/sizetermdensity;2. IdentifyTAZswithdensitiesgreaterthan
densitycutoffDandgroupcontiguousTAZsidentifiedintopreliminarycenters;
3. Calculatetotalemploymentorsizetermsforeachcenteridentifiedinstep2andeliminatecenterswithtotalemploymentorsizetermsbelowtotalcutoffEfromcentersidentifiedinstep2.Theremainingareactivitycenters.
40
DetermineCutoffs
• Giulinao(1991)providesnoguidanceinselectingdensitycutoff(D)ortotalcutoff(E).Theyreliedonexpertknowledge
• SensitivityTeststodeterminecutoffs
41
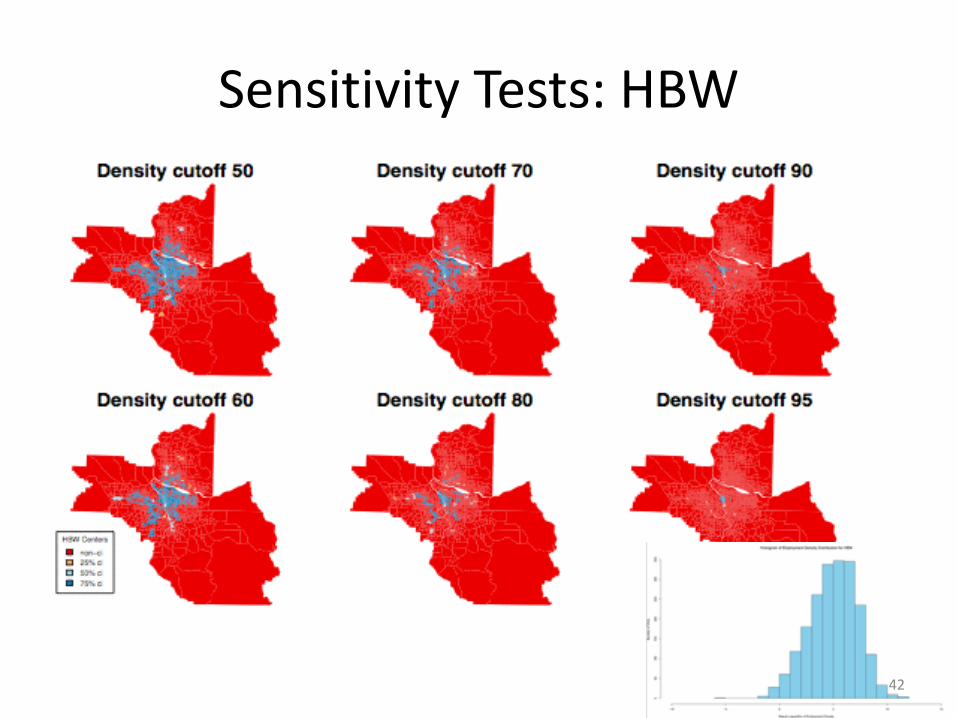
SensitivityTests:HBW
42
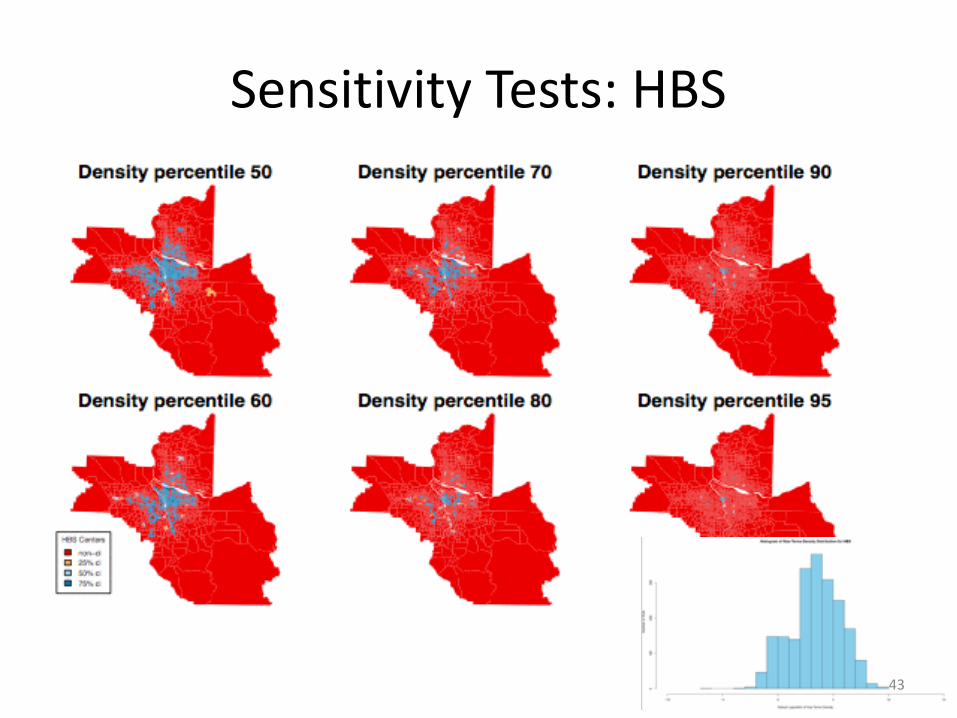
SensitivityTests:HBS
43
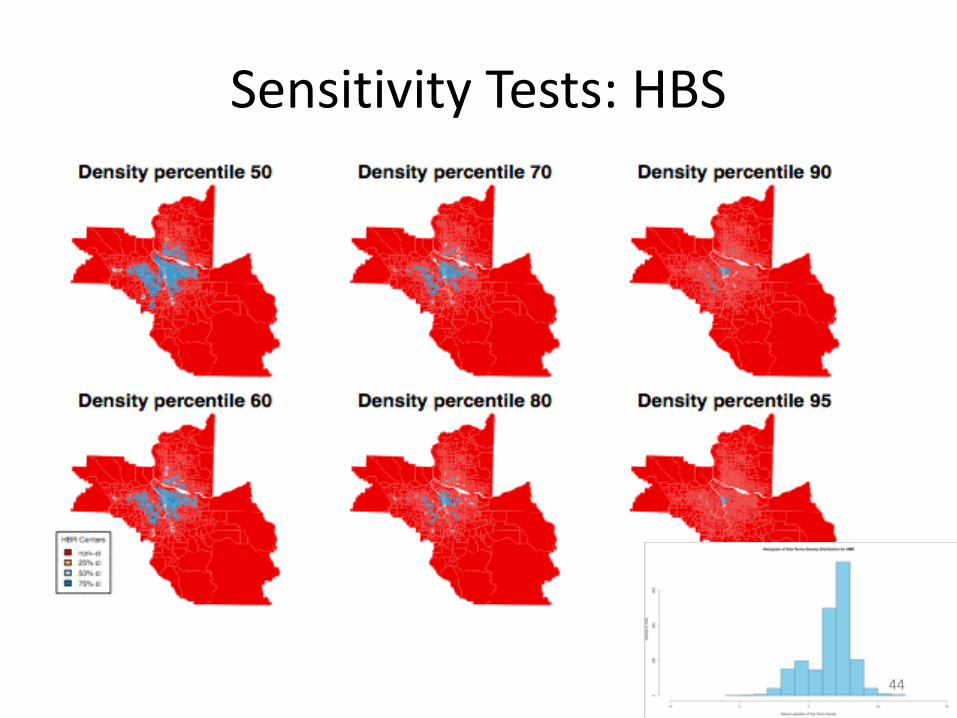
SensitivityTests:HBS
44
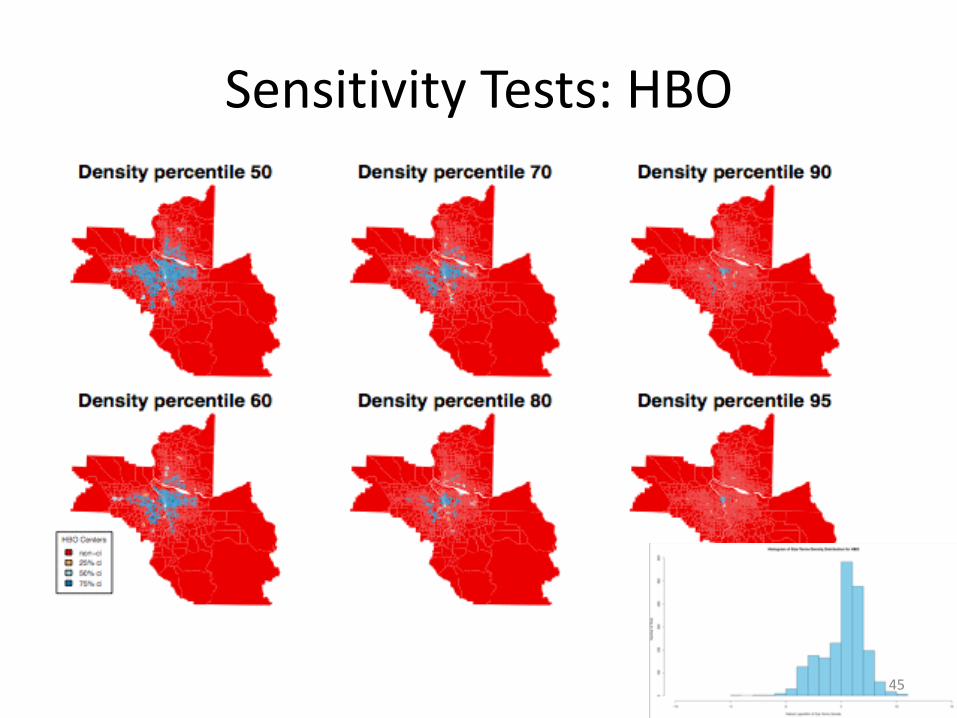
SensitivityTests:HBO
45
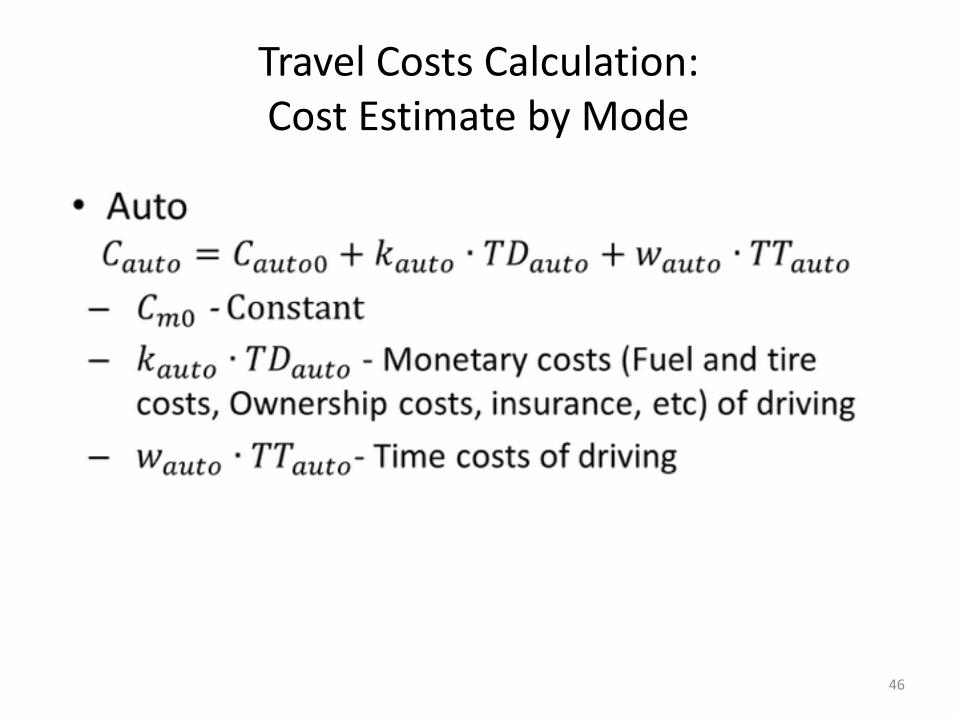
TravelCostsCalculation:CostEstimatebyMode
46
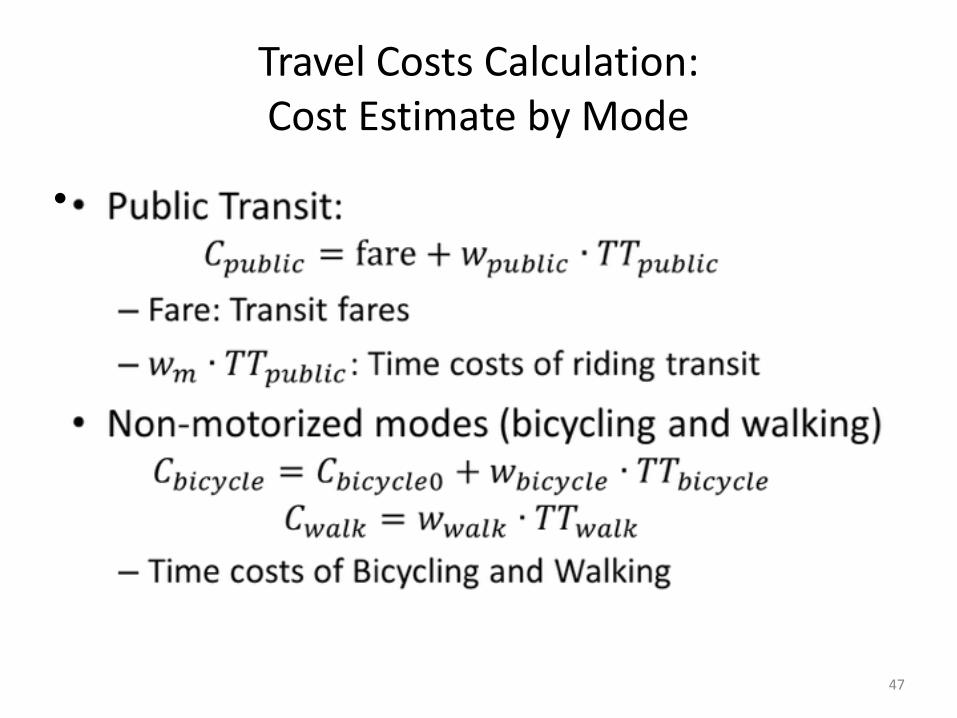
TravelCostsCalculation:CostEstimatebyMode
•
47
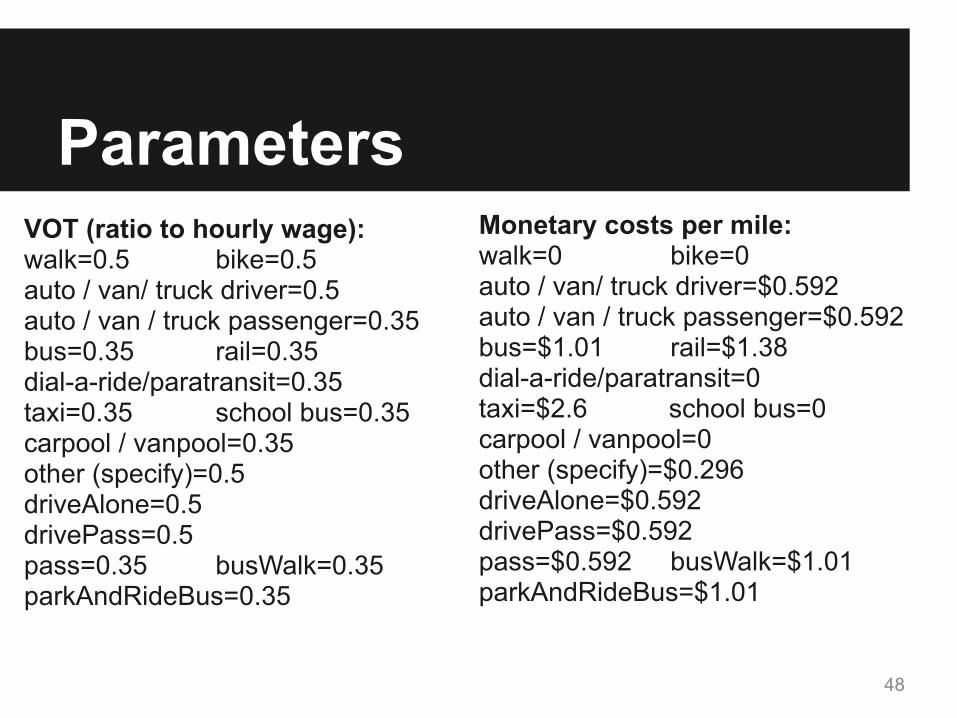
ParametersVOT (ratio to hourly wage): walk=0.5 bike=0.5 auto / van/ truck driver=0.5 auto / van / truck passenger=0.35 bus=0.35 rail=0.35 dial-a-ride/paratransit=0.35 taxi=0.35 school bus=0.35 carpool / vanpool=0.35 other (specify)=0.5 driveAlone=0.5 drivePass=0.5 pass=0.35 busWalk=0.35 parkAndRideBus=0.35
48
Monetary costs per mile: walk=0 bike=0 auto / van/ truck driver=$0.592 auto / van / truck passenger=$0.592 bus=$1.01 rail=$1.38 dial-a-ride/paratransit=0 taxi=$2.6 school bus=0 carpool / vanpool=0 other (specify)=$0.296 driveAlone=$0.592 drivePass=$0.592 pass=$0.592 busWalk=$1.01 parkAndRideBus=$1.01