transportation information management system
TRANSCRIPT

Transportation Service Indicators Report
2009‐2010
Transportation Information Management System

July 22, 2010
In recent years, North Carolina school districts have struggled with drastic swings in fuel prices that have made budgeting and planning increasingly difficult. Although fuel prices have dropped from recent highs, school transportation staffs continue to find their funding strained as a result of the national economic climate. With considerable shortfalls in state and local funding facing LEAs in the 2010‐2011 school year, fuel conservation and other efficiency measures are extremely important. Drivers’ salaries and fuel consume over half of a district’s transportation budget. While the need to provide a suitable level of service to students has not diminished, the difficulty of balancing that goal with efficiency has certainly increased.
North Carolina pupil transportation professionals respond daily to a large variety of circumstances and differing challenges in their operations. Some districts serve large areas, some relatively small ones. There are large and growing urban areas as well as very rural districts which continue to be sparsely populated. Such disparate conditions have a large impact on the ability of the State to provide a uniform level of transportation services. In addition to variations in geography, variations in local policy affect the every‐day experience of students in their trips to and from school. As an example, a policy that seeks to provide a high level of service by placing bus stops close together—often located at student residences—results in longer (and more costly) bus rides for most students.
One of the most important tools available to Local Education Agencies (LEAs) in our state is the Transportation Information Management System (TIMS). TIMS, a systems initiative of the North Carolina Department of Public Instruction (through a contract with Education Logistics, Inc.), provides an LEA with a digital, geographic planning tool for student transportation. It features important optimization tools that can be used to improve the efficiency of transportation services. Use of TIMS (or another approved system) is required of all LEAs by G.S. 115C‐240(d).
In addition to the benefit derived from the optimization tools, the uniform use of TIMS makes possible the production of LEA‐level and statewide data. In this document, operational data for all LEAs have been collected and summarized to provide school transportation planners and local policy makers with a self‐assessment tool. The data contained in this report reflect a combination of physical realities and policy decisions made by LEAs. In this, its fourth year, the report continues to provide detailed data on service and operations that are available from no other source. We trust that this information will be useful to LEAs in the transportation planning process.
We want to express appreciation to the TIMS coordinators and data managers statewide who continue to maintain and who provided this information as part of their annual data submissions. Further, the TIMS support staff at UNC Charlotte and ITRE are to be commended for their ongoing support and coordination in the compilation of these data.
_____________________ __________________________ Ben Matthews, Director Derek Graham, Section Chief School Support Division Transportation Services
SCHOOL SUPPORT DIVISION Benjamin J. Matthews, Ph. D., Director | [email protected]
6319 Mail Service Center, Raleigh, North Carolina 27699-6319 | (919) 807-3500 | Fax (919) 807-3502 AN EQUAL OPPORTUNITY/AFFIRMATIVE ACTION EMPLOYER

TIMS Service Indicators Table of Contents
Page Service Indicator State Average
2–3 Average Student Ride Time, AM (Minutes)
23
2–3 Average Distance to School, Riders (Miles)
4.37
2–3 Average Distance to School, All Students (Miles)
4.27
4–5 Average of Longest 5% of Student Ride Times (Minutes)
70
4–5 Average Distance to School for Longest 5% of Ride Times (Miles)
8.58
6–7 Average of Student‐to‐Stop Distances < 1 Mile (Feet)
470
6–7 % of Stop Distances > .5 & < 1 Mile 1.39
6–7 % of Stop Distances < 1 Mile = 0 29.04
8–9 Earliest Morning Pickup Time 5:52 AM*
10–11 Percent of Routes with Multiple Runs from the Same School
6.89
Operations Choices Affecting Service
12 Range of School Start Times (Minutes) 62
13 Average Number of Runs per Rte, PM 1.65
13 Percent of Routes with More than One Run, PM
47.01
14 Contacts —‐
8–9 Arrival Time for Earliest Morning Pickup 7:38 AM*
*State‐wide values are the median .
Notes on the 2009‐2010 Indicator Data AVERAGES FOR THE STATE Throughout the report, North Carolina Averages are calculated from base data rather than from LEA averages. ANNUAL CHANGE SYMBOLS These symbols are used in several instances to denote direction of change in an Indicator from the previous year.
• + Increase • ‐ Decrease • = No change
VARIATIONS IN CODING Data used in this report are gathered from the one hundred fifteen TIMS datasets maintained in school districts across North Carolina. Though all LEAs use the same software, data coding practices can vary considerably. In some instances, this is due to varying levels of expertise on the part of the data managers; in others, to varying levels of demand being placed upon the data in support of operations; in still others, simply to preference. BELL TIMES AND PROGRAMS The data are probably most affected by differences in the ways that TIMS data managers approach the use of multiple arrival and departure times at schools. Accommodations can involve the use of programs, incorrect school bell times, incorrect school arrival/departure windows, and secondary datasets devoted to transportation for exceptional programs. LEAs use of TIMS isn’t driven by the needs of this report and shouldn’t be, but one affect of varied approaches across LEAs is to make it difficult to avoid comparing apples with oranges—or even to tell an apple from an orange. The data items most affected by the use (or lack) of programs are those concerned with ‘Earliest Morning Pickup Time’, ‘Average School Bell Time Range’ and ‘Percentage of Buses Revisiting the Same School PM’. ELKIN AND MT. AIRY Until the 2009‐2010 school year, Elkin and Mt. Airy Cities’ data were kept in the same dataset as Surry County’s. Separate reports weren’t generated for them so values for them were not available for the report. That situation has been addressed and they stand alone in this year’s report. Year‐to‐year change symbols are absent from their entries. DATA USED/DATA EXCLUDED For ‘theoretical’ reasons—in an effort to make them more meaningful—not all Indicators reflect all the data. The set of data covered by an Indicator is noted in the section of the report devoted to it.
OMITTED VALUES Data can exhibit a number of problems that don’t prevent students from being transported but can make reported values unsuitable for individual examination or inclusion in a descriptive static. If you find that some values have been omitted, it is for this reason.
2009‐2010 TIMS Service Indicator Report 1

Average Student Ride Time, AM DEFINITIONS This Indicator represents the experience of students in EC and Regular datasets, all programs. Ride times and distances to school equal to 0 are excluded as errors in the data. Average Ride Time (Minutes): Average of all bus riders’ AM travel to school. Ride times and distances of 0 are excluded as errors.
Average Distance to School, Riders Only (Miles): TIMS calculates a student’s distance to school by finding the shortest path along the street network. This will not necessarily be the path the bus actually travels. Average distance from home to school for bus riders is shown to provide context for the average morning ride time.
Average Distance to School, All Students (Miles): The average distance for all students enrolled is shown for comparison to the distance for bus riders.
ABOUT SERVICE A child’s ride time should correspond roughly to the distance
STATE‐WIDE AVERAGES 2009‐10 2008‐09
Average Ride Time 23 24
Average Distance to School, Riders Only 4.37 4.36
Average Distance to School, All Students 4.27 4.23
from home to school. However, the expected correspondence is compromised by anything that alters the consistent progress of the bus (such as stopping for children) or causes the bus to depart from the shortest path used to calculate distance to school. LEA policies and site‐specific conditions that are beyond the LEA’s control impact student ride time. LEA policies that can result in longer ride times include the placement of programs for exceptional children and the use of fewer, larger buses. The frequency and location of school bus stops also has a significant impact. For instance, locating school bus stops in private subdivisions and routing buses on short dead‐end roads takes additional time and results in longer rides. Student population density, traffic congestion, and speed limit are site‐specific conditions over which an LEA has little control.
2 2009‐2010 TIMS Service Indicator Report

Symbols indicate change from last year: + ‐ later time or longer distance, (‐) ‐ earlier time or shorter distance, (=) ‐ no change, no symbol ‐ new data this year. Source: NC Local Education Agencies 2009‐2010 TIMS Data. Compiled at UNC Charlotte Urban Institute.
Average Distance to School
Average Distance to School
District Name
Avg. Ride Time
Riders Only
All Stu. District Name
Avg. Ride Time
Riders Only
All Stu. District Name
Avg. Ride Time
Riders Only
All Stu.
Alamance‐Burlington 21= 3.87‐ 3.61+ Edgecombe 28+ 5.42+ 4.81‐ Chapel Hill‐Carrboro 14+ 2.58‐ 2.34‐
Alexander 34= 5.23‐ 5.19+ W‐S/Forsyth 16‐ 3.64= 3.69+ Pamlico 41+ 7.91+ 7.17+
Alleghany 28‐ 5.02+ 5.08+ Franklin 36+ 5.86+ 5.77+ Pasquotank 28‐ 4.49+ 4.43+
Anson 33‐ 6.22+ 5.97+ Gaston 25‐ 2.90‐ 3.07+ Pender 25= 6.04‐ 5.71+
Ashe 56+ 9.31+ 8.91+ Gates 34= 7.29+ 7.11+ Perquimans 38= 7.11+ 6.67‐
Avery 43+ 5.82+ 3.73‐ Graham 23= 5.96‐ 5.66‐ Person 28‐ 5.28+ 5.36+
Beaufort 26‐ 6.44+ 6.17+ Granville 23+ 5.35+ 5.18+ Pitt 23+ 4.13‐ 3.64+
Bertie 33+ 9.18+ 8.70+ Greene 38‐ 7.53+ 7.25+ Polk 39= 6.38+ 5.97+
Bladen 31‐ 7.61‐ 7.39+ Guilford 22+ 3.80+ 3.58+ Randolph 34= 4.89+ 5.20+
Brunswick 38+ 7.05‐ 6.98‐ Halifax 24‐ 8.01+ 8.01+ Asheboro City 22‐ 2.24+ 2.30+
Buncombe 24‐ 3.96‐ 3.99+ Roanoke Rapids 12‐ 1.72‐ 1.29‐ Richmond 41+ 4.03‐ 3.33‐
Asheville City 15‐ 2.82= 2.90‐ Weldon City 15‐ 3.76‐ 3.75+ Robeson 22‐ 4.15‐ 4.08+
Burke 22+ 3.90+ 3.92‐ Harnett 27+ 5.11‐ 5.04‐ Rockingham 29= 4.87‐ 4.78+
Cabarrus 19‐ 3.64‐ 3.63‐ Haywood 36+ 4.42+ 4.55+ Rowan‐Salisbury 26‐ 4.06+ 3.93‐
Kannapolis City 19+ 2.00+ 1.84+ Henderson 30+ 4.20+ 4.04= Rutherford 28‐ 4.62‐ 4.60‐
Caldwell 22‐ 4.13‐ 4.24‐ Hertford 32= 6.64+ 6.31+ Sampson 31= 7.16‐ 7.08‐
Camden 40+ 8.86‐ 8.07+ Hoke 20‐ 5.71+ 5.32+ Clinton City 31+ 3.77+ 3.95+
Carteret 22+ 5.21‐ 5.06‐ Hyde 37+ 12.57+ 9.93‐ Scotland 26‐ 5.10+ 4.80‐
Caswell 41+ 9.27+ 8.98+ Iredell‐Statesville 24‐ 4.72+ 4.76+ Stanly 26= 3.75+ 3.69+
Catawba 20‐ 4.41+ 4.31+ Mooresville 17+ 2.78+ 2.65+ Stokes 39‐ 5.75+ 5.44+
Hickory City 18‐ 2.74+ 2.47+ Jackson 47‐ 5.61‐ 3.60‐ Surry 39+ 5.23+ 4.59+
Newton‐Conover 17‐ 2.63‐ 2.90+ Johnston 22+ 4.39+ 4.38+ Elkin City 15 2.75 2.35 Chatham 27‐ 4.96+ 5.06+ Jones 43+ 7.13‐ 7.48+ Mount Airy City 32 2.34 2.53
Cherokee 33‐ 5.24‐ 5.23‐ Lee 29+ 4.25‐ 4.32+ Swain 49+ 5.91+ 4.25‐
Edenton/Chowan 28‐ 8.67‐ 8.29+ Lenoir 30+ 4.86+ 4.93+ Transylvania 35‐ 5.04+ 4.86‐
Clay 30‐ 5.49‐ 4.27‐ Lincoln 30‐ 4.75+ 4.67‐ Tyrell 32+ 6.13‐ 5.17‐ Cleveland 36+ 4.79+ 4.62+ Macon 54+ 5.05+ 4.83+ Union 19= 3.74‐ 3.82‐
Columbus 34= 6.16+ 6.11+ Madison 47‐ 8.81+ 8.83+ Vance 25= 3.91‐ 4.09+
Whiteville City 33+ 4.53+ 4.37+ Martin 25+ 4.03‐ 4.01‐ Wake 17‐ 4.41+ 4.15‐ Craven 26= 5.42+ 5.15+ McDowell 35‐ 5.23‐ 4.37‐ Warren 53= 7.28+ 6.57‐
Cumberland 19‐ 3.30+ 3.25+ Charlotte‐Meck. 16‐ 3.51‐ 3.56‐ Washington 28+ 5.64‐ 5.27‐
Currituck 42‐ 7.32‐ 7.83+ Mitchell 32‐ 5.42+ 5.37+ Watauga 30+ 4.97‐ 5.29+ Dare 24‐ 4.95‐ 4.55‐ Montgomery 23‐ 4.66‐ 5.01‐ Wayne 31+ 4.19+ 4.42+ Davidson 28‐ 4.54‐ 4.54= Moore 35‐ 5.27+ 4.84= Wilkes 41= 4.80‐ 5.06+
Lexington City 19‐ 1.92‐ 2.25+ Nash‐ Rocky Mount 25= 5.34‐ 4.59‐ Wilson 24‐ 4.00= 3.62+
Thomasville City 17+ 1.80= 1.91+ New Hanover 21+ 3.32+ 3.13‐ Yadkin 37‐ 4.75+ 5.27+
Davie 23‐ 5.19‐ 5.26‐ Northampton 30+ 7.85+ 7.71+ Yancey 50+ 5.73‐ 5.40‐
Average Distance to School
Duplin 27‐ 5.81+ 5.72+ Onslow 20‐ 4.60+ 4.30+ Durham 20‐ 3.69+ 3.77+ Orange 26= 5.66‐ 5.53‐ State Average 23‐ 4.37+ 4.27+
TIMS 2009‐10 Service Indicators: Average Student Ride Time, AM
3 2009‐2010 TIMS Service Indicator Report
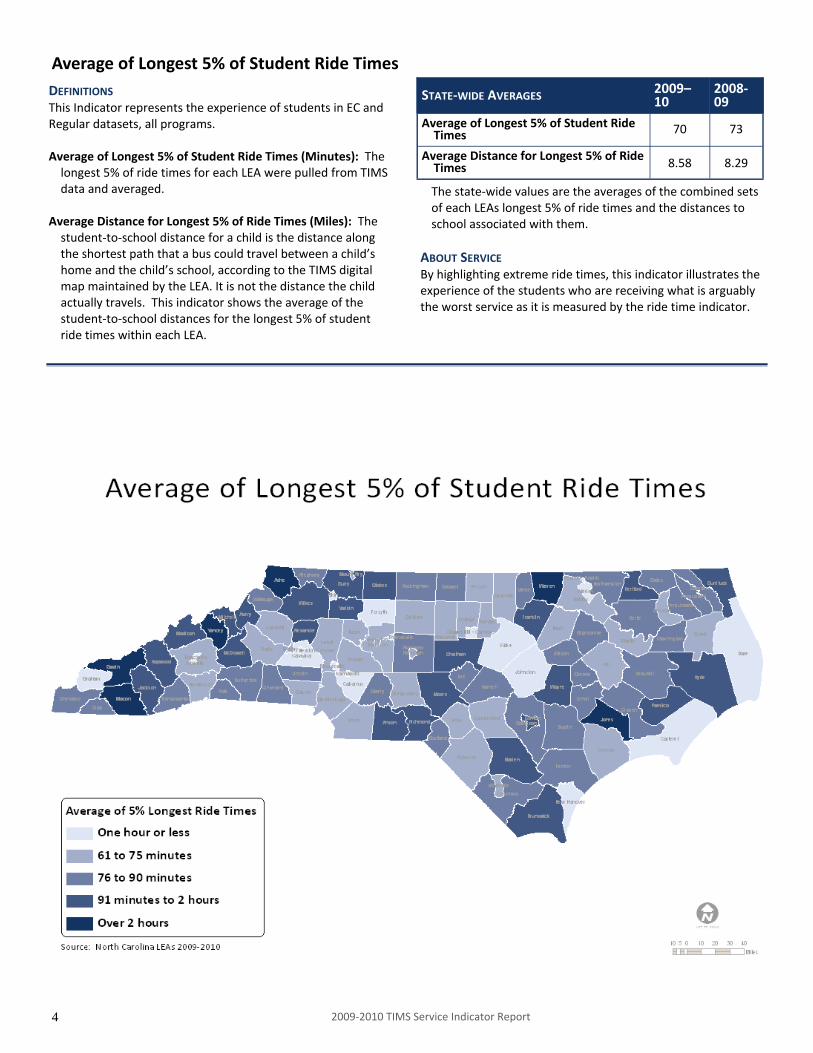
Average of Longest 5% of Student Ride Times DEFINITIONS This Indicator represents the experience of students in EC and Regular datasets, all programs. Average of Longest 5% of Student Ride Times (Minutes): The longest 5% of ride times for each LEA were pulled from TIMS data and averaged.
Average Distance for Longest 5% of Ride Times (Miles): The student‐to‐school distance for a child is the distance along the shortest path that a bus could travel between a child’s home and the child’s school, according to the TIMS digital map maintained by the LEA. It is not the distance the child actually travels. This indicator shows the average of the student‐to‐school distances for the longest 5% of student ride times within each LEA.
STATE‐WIDE AVERAGES 2009– 10
2008‐09
Average of Longest 5% of Student Ride Times 70 73
Average Distance for Longest 5% of Ride Times 8.58 8.29
The state‐wide values are the averages of the combined sets of each LEAs longest 5% of ride times and the distances to school associated with them.
ABOUT SERVICE By highlighting extreme ride times, this indicator illustrates the experience of the students who are receiving what is arguably the worst service as it is measured by the ride time indicator.
4 2009‐2010 TIMS Service Indicator Report

District Name
Average of Longest 5% Ride Times
Avg. Dist. for Longest 5% Ride Times District Name
Average of Longest 5% Ride Times
Avg. Dist. for Longest 5% Ride Times District Name
Average of Longest 5% Ride Times
Avg. Dist. for Longest 5% Ride Times
Alamance‐Burlington 65‐ 7.48‐ Edgecombe 85+ 10.15‐ Chapel Hill‐Carrboro 36+ 3.38‐
Alexander 95+ 6.91‐ W‐S/Forsyth 50‐ 7.55+ Pamlico 108+ 12.32‐
Alleghany 86‐ 10.80+ Franklin 98+ 8.38+ Pasquotank 79‐ 7.65‐
Anson 95‐ 11.43‐ Gaston 74‐ 4.67+ Pender 78= 12.87‐
Ashe 127+ 13.78+ Gates 82= 8.24+ Perquimans 89‐ 12.28+
Avery 109+ 11.38+ Graham 49+ 11.02+ Person 69‐ 11.52+
Beaufort 88+ 12.64+ Granville 66+ 10.21‐ Pitt 73+ 7.24‐
Bertie 84+ 16.02+ Greene 89‐ 9.71+ Polk 89‐ 8.48+
Bladen 95‐ 18.29+ Guilford 73‐ 8.00+ Randolph 82= 7.43‐
Brunswick 102+ 13.80+ Halifax 62‐ 13.37+ Asheboro City 62+ 2.17‐
Buncombe 70‐ 7.35+ Roanoke Rapids 30‐ 2.23‐ Richmond 106‐ 7.24‐
Asheville City 35‐ 3.18‐ Weldon City 53‐ 9.36+ Robeson 63‐ 6.03‐
Burke 69+ 7.11‐ Harnett 82+ 7.86+ Rockingham 81= 8.61‐
Cabarrus 50‐ 6.19= Haywood 97‐ 10.10‐ Rowan‐Salisbury 74‐ 7.03‐
Kannapolis City 49+ 2.71+ Henderson 75‐ 6.78+ Rutherford 83‐ 9.60+
Caldwell 65‐ 7.54‐ Hertford 92+ 12.50‐ Sampson 80‐ 11.4+
Camden 89+ 15.03+ Hoke 61= 11.54+ Clinton City 91+ 5.05+
Carteret 59‐ 13.39‐ Hyde 93+ 23.26+ Scotland 80‐ 11.75+
Caswell 90+ 13.99+ Iredell‐Statesville 64‐ 8.57+ Stanly 76= 6.37+
Catawba 59‐ 6.98+ Mooresville 42+ 3.96+ Stokes 102‐ 9.34‐
Hickory City 65= 5.32+ Jackson 109+ 12.16+ Surry 100+ 6.49+
Newton‐Conover 53‐ 7.03‐ Johnston 58+ 8.82+ Elkin City 48 6.14
Chatham 91+ 10.57+ Jones 135+ 10.69‐ Mount Airy City 74 1.49
Cherokee 83‐ 8.53+ Lee 84+ 5.84‐ Swain 134+ 11.15+
Edenton/Chowan 72‐ 13.24‐ Lenoir 87+ 10.00+ Transylvania 82‐ 7.73+
Clay 86‐ 9.59+ Lincoln 77+ 5.57‐ Tyrell 75+ 11.53+
Cleveland 88+ 6.31‐ Macon 148‐ 8.77+ Union 61‐ 9.29+
Columbus 83+ 12.78+ Madison 108‐ 15.15+ Vance 86‐ 6.86‐
Whiteville City 74+ 5.35+ Martin 73‐ 8.46‐ Wake 56‐ 9.97+
Craven 77‐ 12.44‐ McDowell 91‐ 7.88‐ Warren 136+ 12.01+
Cumberland 63‐ 6.00‐ Charlotte‐Meck. 63‐ 9.65+ Washington 76+ 7.13‐
Currituck 120‐ 16.06+ Mitchell 92‐ 11.53‐ Watauga 77‐ 10.77‐
Dare 60‐ 14.47+ Montgomery 71‐ 10.38‐ Wayne 95‐ 5.78‐
Davidson 73‐ 5.91‐ Moore 96‐ 8.08+ Wilkes 110+ 9.19+
Lexington City 66‐ 2.19+ Nash ‐ Rocky Mount 73+ 8.31‐ Wilson 77‐ 6.34+
Thomasville City 34+ 1.92‐ New Hanover 59‐ 5.75‐ Yadkin 107+ 7.16‐
Davie 67‐ 9.53= Northampton 77‐ 9.04‐ Yancey 131+ 7.85‐
Duplin 81‐ 10.39+ Onslow 68‐ 9.70+
Durham 65= 6.96+ Orange 73‐ 11.27+ State Average 70‐ 8.58+
TIMS 2009‐10 Service Indicators: Average of Longest 5% of Student Ride Times
Symbols indicate change from last year: + ‐ later time or longer distance, (‐) ‐ earlier time or shorter distance, (=) ‐ no change, no symbol ‐ new data this year. Source: NC Local Education Agencies 2009‐2010 TIMS Data. Compiled at UNC Charlotte Urban Institute.
5 2009‐2010 TIMS Service Indicator Report

DEFINITIONS This set of Indicators is concerned with the lengths of students’ walks from their homes to their stops. It represents the experience of students in EC and Regular datasets, all programs. Distances of 0 are included; negative distances are excluded. Under the assumption that no child in North Carolina walks a mile or more and since some students travel to their stops via private conveyance, distances of 1 mile and greater were removed from consideration. These account for 2.6% of riders statewide. Average of Student‐to‐Stop Distances < 1 Mile, AM: The average walk from home to stop for distances less than one mile. In feet.
% of Stop Distances > .5 & < 1 Mile: This small percentage of all riders represents those with the longest walks to stops and others who ride to a stop. A bus is not to deviate from its path for a distance of less than one half mile for fewer than ten students (except in the cases of unescorted pupils
in grades K‐3 or special education pupils) and no child can be required to walk more than 1 mile to a stop.
% of Stop Distances < 1 Mile = 0: Percent of students with stop distances less than one mile that are picked up immediately in front of their home.
ABOUT SERVICE The student‐to‐stop distance has two interpretations for service. Individuals typically see a very short distance to stop as positive for service. However, when a bus makes a greater number of stops in order to provide students with door service, the overall time students ride the bus increases.
Average of Student‐to‐Stop Distances < 1 Mile, AM
6
STATE‐WIDE AVERAGES 2009‐10 2009‐09
Average of Student‐to‐Stop Distances < 1 Mile, AM 470 445
% of Stop Distances > .5 & < 1 Mile 1.39 1.38
% of Stop Distances < 1 Mile = 0 29.04 30.51
2009‐2010 TIMS Service Indicator Report

TIMS 2009‐10 Service Indicators: Average of Student‐to‐Stop Distances < 1 Mile, AM
District Name
Average of Distances < 1 Mile
% of Stop Distances > .5 & < 1 Mile District Name
Average of Distances < 1 Mile
% of Stop Distances > .5 & < 1 Mile District Name
% of Stop Distances > .5 & < 1 Mile
Alamance‐Burlington 300‐ 1.02+ Edgecombe 313+ 0.31+
Chapel Hill‐Carrboro 1.46‐
Alexander 486‐ 1.57‐ W‐S/Forsyth 547+ 1.23+ Pamlico 1.02+ Alleghany 259‐ 1.50‐ Franklin 296‐ 0.96‐ Pasquotank 0.73+ Anson 198+ 0.95+ Gaston 311‐ 0.43‐ Pender 2.35+ Ashe 169‐ 1.11‐ Gates 66+ 0.41+ Perquimans 0.00= Avery 193‐ 2.62+ Graham 411+ 1.16‐ Person 0.07+ Beaufort 473+ 2.58+ Granville 412‐ 2.56‐ Pitt 1.73‐ Bertie 290+ 0.42+ Greene 310+ 0.69+ Polk 4.82‐ Bladen 372+ 1.14‐ Guilford 409‐ 1.63‐ Randolph 0.00= Brunswick 511‐ 1.86+ Halifax 166‐ 0.50‐ Asheboro 0.00= Buncombe 552‐ 3.13‐ Roanoke 481‐ 0.63‐ Richmond 8.49+ Asheville 760‐ 2.16‐ Weldon City 254+ 0.82+ Robeson 5.19‐ Burke 509+ 0.70+ Harnett 594‐ 3.50‐ Rockingham 1.14‐
Cabarrus 393‐ 0.48‐ Haywood 573+ 3.61+ Rowan‐Salisbury 1.78+
Kannapolis 292+ 0.93+ Henderson 609+ 3.21+ Rutherford 1.22‐ Caldwell 468+ 2.38‐ Hertford 108‐ 0.81‐ Sampson 1.04+ Camden 126+ 0.09+ Hoke 382+ 0.95+ Clinton City 0.60‐ Carteret 524‐ 3.33‐ Hyde 125‐ 0.48+ Scotland 4.33‐
Caswell 283‐ 1.65‐ Iredell‐Statesville 536+ 1.56+ Stanly 1.54‐
Catawba 453‐ 1.55‐ Mooresville 340+ 0.58+ Stokes 2.38‐ Hickory City 500‐ 1.92‐ Jackson 813+ 6.77+ Surry 8.37+ Newton‐ 324+ 1.55‐ Johnston 268+ 0.26‐ Elkin City 2.58
Chatham 589+ 3.87+ Jones 102‐ 0.24‐ Mount Airy City 2.15
Cherokee 404+ 3.06‐ Lee 405+ 2.20+ Swain 1.20+ Edenton/Chowan 131‐ 0.41+ Lenoir 257‐ 1.19+ Transylvania 6.70+
Clay 508‐ 3.60‐ Lincoln 437+ 1.93+ Tyrell 2.46+ Cleveland 251‐ 0.99‐ Macon 531+ 3.19+ Union 0.47‐ Columbus 183+ 0.38‐ Madison 290+ 1.25+ Vance 4.06‐ Whiteville 227+ 1.22+ Martin 272+ 1.81‐ Wake 1.08‐ Craven 351‐ 1.01‐ McDowell 654+ 2.59‐ Warren 2.24‐
Cumberland 478+ 0.33‐ Charlotte‐Meck. 591+ 0.44+ Washington 0.99‐
Currituck 316‐ 0.71‐ Mitchell 203‐ 0.99+ Watauga 2.23‐
Dare 592‐ 2.30‐ Montgomery 408+ 2.01‐ Wayne 0.46‐
Davidson 342‐ 1.20+ Moore 434+ 3.59+ Wilkes 0.74+
Lexington City 720‐ 3.69‐
Nash‐ Rocky Mount 433+ 0.20‐ Wilson 0.45‐
Thomasville 345+ 0.07‐ New Hanover 774+ 5.41+ Yadkin 2.65‐
Davie 588+ 2.38+ Northampton 238‐ 0.54‐ Yancey 7.29+
Duplin 315‐ 0.61‐ Onslow 398‐ 2.75+
Durham 407+ 0.27‐ Orange 262‐ 0.99‐ State 1.39+
Average of Distances < 1 Mile
569‐
162+ 165+ 457+ 41‐ 234‐ 459‐ 461‐ 262+ 230+ 789+ 680‐ 400‐
382+
224‐ 378+ 350+ 571‐
500+
327+ 959+ 741
530
647‐
758+
237+ 274+ 572‐ 633‐ 394+
217+
402‐
347+
270‐
384+
493‐
788+
470+
% of Stop Distances < 1 Mile = 0
20.94‐
75.86+ 69.85‐ 38.56‐ 86.50+ 39.68+ 21.58‐ 60.75+ 46.88‐ 28.64‐ 37.27‐ 25.17+ 35.75+
48.80‐
67.85+ 38.01‐ 34.00‐ 33.56‐
33.56‐
61.31‐ 14.72‐ 11.02
11.40
22.38+
28.70+
66.67‐ 34.56‐ 34.04+ 12.39+ 41.68‐
65.19+
50.76‐
29.32‐
54.17‐
30.08+
36.57+
28.44‐
29.04‐
% of Stop Distances < 1 Mile = 0
40.95‐
21.35‐ 52.02+ 39.05+ 76.73+ 51.60‐ 45.37‐ 47.47‐ 34.11‐ 59.98+ 12.44+ 45.33‐ 27.22+
34.92‐
28.04+ 79.27+ 27.06‐ 71.11+
24.41‐
16.48‐ 35.62‐ 41.64‐
77.18‐
47.11‐
55.39‐
38.80‐ 44.33‐ 68.24+ 62.16‐ 31.45‐
9.95‐
68.26+
40.24‐
51.89‐
21.84‐
22.95‐
48.28+
45.04+
65.99+
% of Stop Distances < 1 Mile = 0
44.55+
32.50+ 63.36‐ 70.90‐ 80.37+ 61.19+ 34.57+ 39.57+ 37.28‐ 30.54‐ 36.81+ 6.80+ 17.44‐
24.18+
39.71‐ 40.36‐ 67.47‐ 36.79‐
73.40+
31.20+ 22.99‐ 46.21‐
37.13‐
58.25‐
67.78+
45.40+ 55.36‐ 60.47‐ 53.97+ 32.29‐
12.97‐
47.39‐
22.00‐
48.56+
11.54+
25.90‐
27.95‐
42.72+
31.65‐ Symbols indicate change from last year: + ‐ later time or longer distance, (‐) ‐ earlier time or shorter distance, (=) ‐ no change, no symbol ‐ new data this year. Source: NC Local Education Agencies 2009‐2010 TIMS Data. Compiled at UNC Charlotte Urban Institute.
7 2009‐2010 TIMS Service Indicator Report
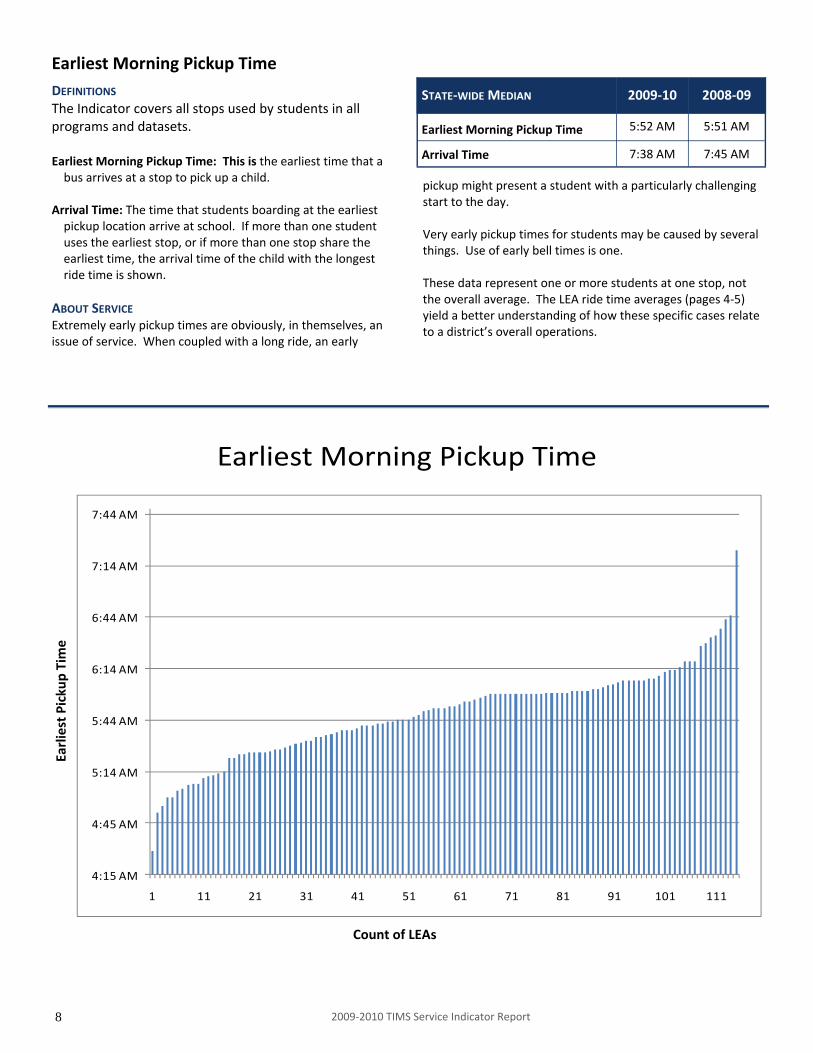
DEFINITIONS The Indicator covers all stops used by students in all programs and datasets. Earliest Morning Pickup Time: This is the earliest time that a bus arrives at a stop to pick up a child.
Arrival Time: The time that students boarding at the earliest pickup location arrive at school. If more than one student uses the earliest stop, or if more than one stop share the earliest time, the arrival time of the child with the longest ride time is shown.
ABOUT SERVICE Extremely early pickup times are obviously, in themselves, an issue of service. When coupled with a long ride, an early
pickup might present a student with a particularly challenging start to the day. Very early pickup times for students may be caused by several things. Use of early bell times is one. These data represent one or more students at one stop, not the overall average. The LEA ride time averages (pages 4‐5) yield a better understanding of how these specific cases relate to a district’s overall operations.
Earliest Morning Pickup Time
8
STATE‐WIDE MEDIAN 2009‐10 2008‐09
Earliest Morning Pickup Time 5:52 AM 5:51 AM
Arrival Time 7:38 AM 7:45 AM
2009‐2010 TIMS Service Indicator Report
Earliest Picku
p Time
Count of LEAs
Earliest Morning Pickup Time
4:15 AM
4:45 AM
5:14 AM
5:44 AM
6:14 AM
6:44 AM
7:14 AM
7:44 AM
1 11 21 31 41 51 61 71 81 91 101 111

District Name
Earliest Pickup AM
Arrival Time District Name
Earliest Pickup AM
Arrival Time District Name
Earliest Pickup AM
Arrival Time
Alamance‐Burlington 5:39 AM 7:20 AM Edgecombe 5:13 AM 7:24 AM Chapel Hill‐Carrboro 6:38 AM 7:25 AM
Alexander 6:00 AM 7:45 AM W‐S/Forsyth 5:45 AM 7:00 AM Pamlico 5:44 AM 7:52 AM
Alleghany 6:03 AM 7:50 AM Franklin 6:00 AM 8:09 AM Pasquotank 5:07 AM 7:52 AM
Anson 5:35 AM 7:30 AM Gaston 6:00 AM 8:10 AM Pender 6:00 AM 7:15 AM
Ashe 5:26 AM 7:50 AM Gates 6:19 AM 8:00 AM Perquimans 6:00 AM 7:50 AM
Avery 5:53 AM 8:01 AM Graham 6:34 AM 7:30 AM Person 6:28 AM 8:00 AM
Beaufort 6:11 AM 7:34 AM Granville 5:23 AM 7:15 AM Pitt 5:25 AM 7:25 AM
Bertie 6:00 AM 7:30 AM Greene 5:50 AM 8:05 AM Polk 6:13 AM 7:49 AM
Bladen 5:04 AM 7:50 AM Guilford 5:26 AM 7:20 AM Randolph 5:47 AM 7:50 AM
Brunswick 5:12 AM 7:39 AM Halifax 6:03 AM 7:10 AM Asheboro City 6:08 AM 7:17 AM
Buncombe 5:31 AM 7:38 AM Roanoke Rapids 6:46 AM 7:20 AM Richmond 6:01 AM 8:00 AM
Asheville City 6:44 AM 7:20 AM Weldon City 6:30 AM 7:32 AM Robeson 6:05 AM 7:30 AM
Burke 5:28 AM 7:45 AM Harnett 6:00 AM 8:05 AM Rockingham 5:54 AM 7:38 AM
Cabarrus 5:26 AM 7:00 AM Haywood 5:37 AM 7:58 AM Rowan‐Salisbury 5:08 AM 6:45 AM
Kannapolis City 6:08 AM 7:20 AM Henderson 6:01 AM 7:32 AM Rutherford 5:53 AM 7:46 AM
Caldwell 5:52 AM 7:16 AM Hertford 5:42 AM 7:55 AM Sampson 5:26 AM 7:48 AM
Camden 5:52 AM 8:00 AM Hoke 6:00 AM 7:15 AM Clinton City 5:30 AM 7:19 AM
Carteret 6:06 AM 7:27 AM Hyde 5:44 AM 7:30 AM Scotland 6:07 AM 7:24 AM
Caswell 5:42 AM 7:45 AM Iredell‐Statesville 6:01 AM 7:05 AM Stanly 5:45 AM 7:30 AM
Catawba 5:58 AM 8:45 AM Mooresville 6:19 AM 7:05 AM Stokes 5:32 AM 7:35 AM
Hickory City 5:39 AM 8:25 AM Jackson 5:57 AM 8:20 AM Surry 6:00 AM 8:05 AM
Newton‐Conover 6:08 AM 7:50 AM Johnston 5:36 AM 7:00 AM Elkin City 7:24 AM 8:15 AM
Chatham 5:27 AM 7:45 AM Jones 4:51 AM 7:40 AM Mount Airy City 6:08 AM 7:30 AM Cherokee 6:00 AM 7:35 AM Lee 5:15 AM 7:15 AM Swain 4:55 AM 7:40 AM
Edenton/Chowan 6:09 AM 7:45 AM Lenoir 5:11 AM 7:30 AM Transylvania 6:02 AM 7:36 AM
Clay 5:56 AM 7:55 AM Lincoln 5:29 AM 7:57 AM Tyrell 6:19 AM 7:45 AM
Cleveland 6:01 AM 7:55 AM Macon 6:00 AM 9:22 AM Union 5:51 AM 7:00 AM
Columbus 5:52 AM 7:45 AM Madison 5:43 AM 8:00 AM Vance 5:39 AM 8:00 AM
Whiteville City 6:04 AM 7:40 AM Martin 6:02 AM 7:32 AM Wake 5:42 AM 7:23 AM
Craven 5:38 AM 7:25 AM McDowell 6:14 AM 8:00 AM Warren 5:14 AM 7:45 AM
Cumberland 5:33 AM 7:55 AM Charlotte‐Meck. 5:00 AM 6:50 AM Washington 5:56 AM 7:30 AM
Currituck 5:00 AM 7:53 AM Mitchell 5:25 AM 7:25 AM Watauga 6:14 AM 8:01 AM
Dare 6:16 AM 7:30 AM Montgomery 5:48 AM 7:35 AM Wayne 5:59 AM 7:55 AM
Davidson 5:43 AM 6:50 AM Moore 5:23 AM 7:30 AM Wilkes 5:08 AM 7:35 AM
Lexington City 5:45 AM 7:50 AM Nash‐ Rocky Mount 5:35 AM 7:25 AM Wilson 6:01 AM 7:50 AM
Thomasville City 6:33 AM 7:02 AM New Hanover 6:02 AM 7:20 AM Yadkin 5:28 AM 8:05 AM
Davie 6:09 AM 7:40 AM Northampton 6:08 AM 7:40 AM Yancey 5:05 AM 7:34 AM
Duplin 5:40 AM 7:55 AM Onslow 4:29 AM 6:17 AM
Durham 5:33 AM 7:20 AM Orange 6:02 AM 6:04 AM State Median 5:52 AM 7:38 AM
TIMS 2009‐10 Service Indicators: Earliest Morning Pickup Time
Source: NC Local Education Agencies 2009‐2010 TIMS Data. Compiled at UNC Charlotte Urban Institute.
9 2009‐2010 TIMS Service Indicator Report

DEFINITIONS This Indicator includes only afternoon runs for the default program for Regular Transportation. The calculation counts each bus with multiple same‐school runs once whether it visits the school two, three or more times. ABOUT SERVICE Multiple runs from the same school require that a second and possibly third load of students wait at the school in the afternoon while the bus completes its prior run. This is often unproductive time for students and the staff members charged
STATE‐WIDE AVERAGES 2009‐10 2008‐09
Percent of Routes with Multiple Runs from the Same School
6.89 7.32
with their supervision. The use of multiple runs to the same school is an efficiency strategy used by districts that has direct impact on children ‘s waiting time.
Percent of Routes with Multiple Runs from the Same School
10 2009‐2010 TIMS Service Indicator Report
% W
ith Multiple Ru
ns
Count of LEAs
Percent of Routes with Multiple Runs from the Same School
0
5
10
15
20
25
30
35
40
1 5 9 13 17 21 25 29 33 37 41 45 49 53 57 61 65 69 73 77 81 85 89 93 97 101105109113

District Name
% of Routes with Multiple Runs from Same School District Name
% of Routes with Multiple Runs from Same School District Name
% of Routes with Multiple Runs from Same School
Alamance‐Burlington 24.09+ Edgecombe 0.00‐ Chapel Hill‐Carrboro 0.00=
Alexander 0.00= W‐S/Forsyth 4.04+ Pamlico 4.00+
Alleghany 0.00= Franklin 9.57+ Pasquotank 0.00‐
Anson 0.00‐ Gaston 21.33‐ Pender 5.43+
Ashe 0.00‐ Gates 0.00= Perquimans 0.00=
Avery 0.00‐ Graham 0.00= Person 1.37=
Beaufort 4.21+ Granville 2.86‐ Pitt 0.54‐
Bertie 0.00= Greene 0.00= Polk 0.00=
Bladen 0.00= Guilford 10.53+ Randolph 7.02‐
Brunswick 0.00= Halifax 0.00= Asheboro City 10.53‐
Buncombe 27.31‐ Roanoke Rapids 0.00‐ Richmond 25.27‐
Asheville City 10.34= Weldon City 13.33= Robeson 18.52‐
Burke 36.45+ Harnett 1.26‐ Rockingham 3.23+
Cabarrus 0.00‐ Haywood 16.22‐ Rowan‐Salisbury 1.78+
Kannapolis City 3.23= Henderson 31.82‐ Rutherford 0.00=
Caldwell 15.00‐ Hertford 5.56‐ Sampson 0.00=
Camden 4.00= Hoke 0.00= Clinton City 3.85‐
Carteret 3.00+ Hyde 0.00= Scotland 0.00‐
Caswell 0.00= Iredell‐Statesville 0.97+ Stanly 25.00‐
Catawba 5.08‐ Mooresville 0.00= Stokes 0.00=
Hickory City 17.39+ Jackson 0.00= Surry 0.00=
Newton‐Conover 40.00‐ Johnston 0.96‐ Elkin City 0.00
Chatham 7.87+ Jones 0.00= Mount Airy City 0.00
Cherokee 19.15+ Lee 2.13+ Swain 9.52+
Edenton/Chowan 0.00= Lenoir 1.64+ Transylvania 25.71‐
Clay 0.00= Lincoln 27.03‐ Tyrell 0.00=
Cleveland 4.07‐ Macon 15.38+ Union 1.86+
Columbus 0.00= Madison 0.00= Vance 23.86=
Whiteville City 0.67‐ Martin 0.00= Wake 11.32‐
Craven 20.39‐ McDowell 6.56+ Warren 0.00=
Cumberland 0.00= Charlotte‐Meck. 0.00‐ Washington 0.00=
Currituck 0.00= Mitchell 0.00‐ Watauga 0.00=
Dare 26.83+ Montgomery 10.34+ Wayne 21.15‐
Davidson 0.59‐ Moore 0.74+ Wilkes 21.59+
Lexington City 0.00= Nash‐ Rocky Mount 1.92‐ Wilson 35.34‐
Thomasville City 7.69+ New Hanover 0.54+ Yadkin 6.45+
Davie 19.18+ Northampton 0.00= Yancey 0.00=
Duplin 0.00= Onslow 3.79‐ Durham 2.62+ Orange 1.52+ State Average 6.89‐
TIMS 2009‐10 Service Indicators: Percent of Routes with Multiple Runs from the Same School
Symbols indicate change from last year: + ‐ later time or longer distance, (‐) ‐ earlier time or shorter distance, (=)‐ no change, no symbol ‐ new data this year. Source: NC Local Education Agencies 2009‐2010 TIMS Data. Compiled at UNC Charlotte Urban Institute.
11 2009‐2010 TIMS Service Indicator Report
School Start Times School Start Times
District Name First Last Range District Name First Last Range District Name First Last Range
Alamance‐Burlington 7:45 12:00 255= Edgecombe 7:40 9:00 80+ Chapel Hill‐Carrboro 7:50 8:45 55=
Alexander 7:45 8:15 30= W‐S/Forsyth 7:15 9:15 120= Pamlico 7:50 8:00 10=
Alleghany 7:55 8:10 15= Franklin 7:44 8:30 46= Pasquotank 7:50 8:40 50‐
Anson 7:15 8:20 65= Gaston 7:45 8:30 45+ Pender 7:30 8:45 75=
Ashe 7:55 8:00 5‐ Gates 8:00 8:05 5= Perquimans 8:00 8:10 10=
Avery 7:50 8:15 25+ Graham 7:50 8:00 10= Person 7:50 8:30 40=
Beaufort 7:50 9:00 70= Granville 7:25 8:45 80= Pitt 7:40 8:30 50‐
Bertie 7:35 8:20 45‐ Greene 7:30 8:00 30+ Polk 7:50 8:15 25=
Bladen 7:45 8:05 20= Guilford 7:40 11:40 240‐ Randolph 7:50 9:00 70‐
Brunswick 7:40 8:05 25+ Halifax 7:30 8:00 30‐ Asheboro City 7:40 8:20 40‐
Buncombe 7:45 8:45 60= Roanoke Rapids 7:35 8:30 55= Richmond 8:00 10:30 150+
Asheville City 7:55 9:00 65+ Weldon City 7:30 8:15 45+ Robeson 7:30 8:30 60=
Burke 7:40 8:25 45= Harnett 7:35 8:45 70= Rockingham 7:20 9:00 100+
Cabarrus 7:15 9:30 135+ Haywood 8:00 9:00 60= Rowan‐Salisbury 7:20 9:30 130=
Kannapolis City 7:30 8:40 70= Henderson 7:50 8:30 40+ Rutherford 7:30 8:45 75+
Caldwell 7:40 8:30 50+ Hertford 7:45 8:20 35= Sampson 7:45 8:30 45=
Camden 7:55 8:20 25= Hoke 7:50 9:00 70= Clinton City 7:15 9:00 105+
Carteret 7:30 8:05 35= Hyde 7:45 7:55 10= Scotland 8:00 9:30 90=
Caswell 7:45 8:30 45= Iredell‐ 7:30 8:50 80+ Stanly 7:50 9:00 70=
Catawba 7:15 8:55 100= Mooresville 7:30 8:45 75‐ Stokes 7:30 8:30 60+
Hickory City 7:20 9:00 100+ Jackson 8:00 8:10 10‐ Surry 7:50 8:00 10‐
Newton‐Conover 7:40 8:15 35+ Johnston 7:10 11:00 230‐ Elkin City 8:20 8:20 0=
Chatham 8:00 8:00 0= Jones 7:45 8:00 15= Mount Airy City 7:40 8:10 30+
Cherokee 7:40 8:35 55+ Lee 7:30 8:00 30‐ Swain 7:50 8:05 15‐
Edenton/Chowan 7:55 8:00 5= Lenoir 7:45 8:15 30= Transylvania 8:00 8:20 20=
Clay 8:00 8:00 0= Lincoln 7:45 8:30 45+ Tyrell 7:45 7:50 5=
Cleveland 7:40 9:00 80= Macon 7:30 8:30 60= Union 7:15 9:00 105+
Columbus 7:45 9:20 95= Madison 8:00 8:20 20= Vance 7:50 9:00 70=
Whiteville City 7:50 9:10 80= Martin 7:25 8:10 45= Wake 7:25 9:30 125+
Craven 7:35 9:05 90= McDowell 7:50 8:31 41+ Warren 7:55 8:30 35‐
Cumberland 7:30 1:20 350= Charlotte‐Meck. 7:15 9:15 120= Washington 8:00 8:00 0=
Currituck 7:30 8:30 60+ Mitchell 7:20 7:55 35+ Watauga 7:45 8:30 45=
Dare 8:00 8:30 30= Montgomery 7:45 8:00 15= Wayne 7:20 10:50 210+
Davidson 7:40 8:30 50= Moore 7:45 8:15 30= Wilkes 7:35 8:30 55+
Lexington City 7:30 8:00 30‐ Nash‐ Rocky Mount 7:29 10:30 181‐ Wilson 8:00 11:00 180+
Thomasville City 7:35 8:00 25= New Hanover 7:30 9:15 105‐ Yadkin 7:55 8:10 15+
Davie 7:55 8:45 50= Northampton 7:30 8:00 30‐ Yancey 7:40 8:00 20+
Duplin 7:30 8:20 50+ Onslow 7:10 8:45 95=
Durham 7:25 9:00 95‐ Orange 7:30 8:45 75+ State Average 7:40 8:30 62=
School Start Times
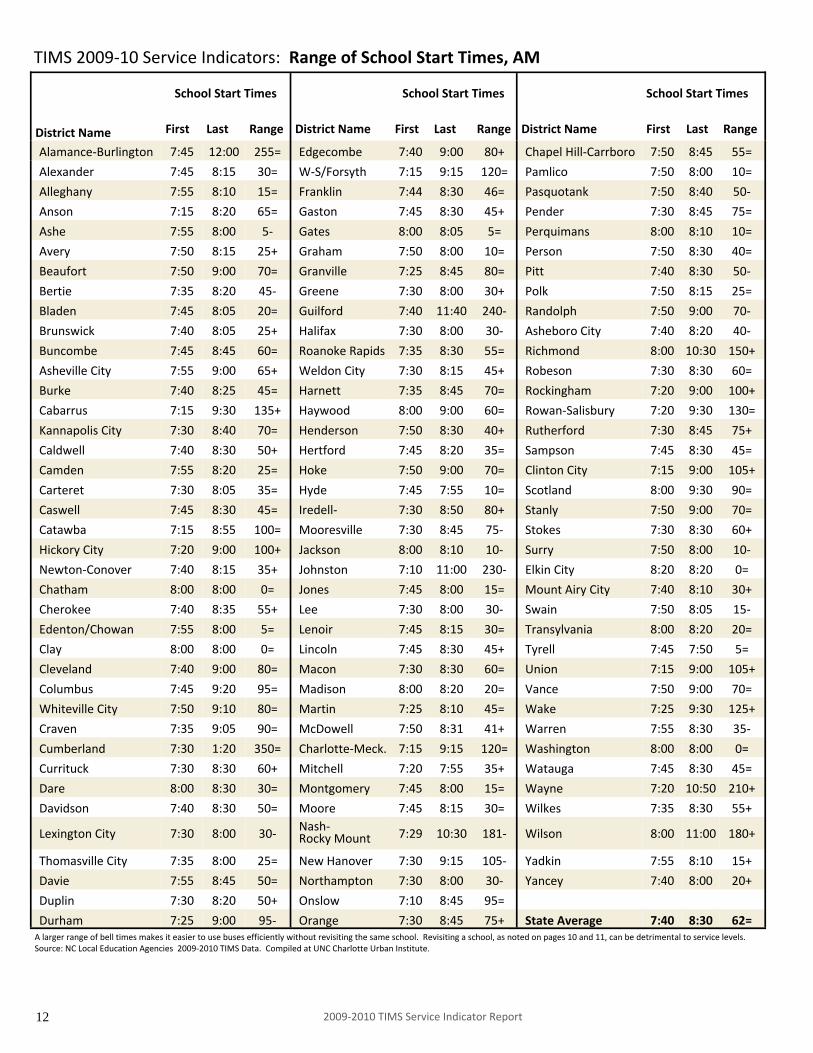
TIMS 2009‐10 Service Indicators: Range of School Start Times, AM
12
A larger range of bell times makes it easier to use buses efficiently without revisiting the same school. Revisiting a school, as noted on pages 10 and 11, can be detrimental to service levels. Source: NC Local Education Agencies 2009‐2010 TIMS Data. Compiled at UNC Charlotte Urban Institute.
2009‐2010 TIMS Service Indicator Report

District Name
Avg. Runs per Rte.
% Rtes > 1 Run District Name
Avg. Runs per Rte.
% Rtes > 1 Run District Name
Avg. Runs per Rte.
% Rtes > 1 Run
Alamance‐Burlington 1.58+ 54.67+ Edgecombe 1.06= 6.14+ Chapel Hill‐Carrboro 2.72+ 98.25+
Alexander 1.00= 0.00= W‐S/Forsyth 2.71‐ 96.50‐ Pamlico 1.08+ 8.00+
Alleghany 1.04= 4.35= Franklin 1.26+ 25.49+ Pasquotank 1.43‐ 43.48+
Anson 1.20‐ 20.00‐ Gaston 1.60‐ 55.92+ Pender 1.41‐ 36.96‐
Ashe 1.00‐ 0.00‐ Gates 1.00= 0.00= Perquimans 1.00= 0.00=
Avery 1.18‐ 18.18‐ Graham 1.00= 0.00= Person 1.10= 9.59=
Beaufort 1.18+ 17.65+ Granville 1.44‐ 40.95‐ Pitt 1.44‐ 43.78‐
Bertie 1.00= 0.00= Greene 1.10+ 9.62+ Polk 1.00= 0.00=
Bladen 1.00= 0.00= Guilford 2.20= 89.79‐ Randolph 1.08‐ 8.19‐
Brunswick 1.00= 0.00= Halifax 1.00= 0.00= Asheboro City 2.11= 100.00+
Buncombe 1.52‐ 45.38‐ Roanoke Rapids 2.25= 91.67+ Richmond 1.30‐ 29.67‐
Asheville City 2.17= 96.55= Weldon City 1.53= 40.00= Robeson 1.20‐ 19.63‐
Burke 1.43+ 42.06+ Harnett 1.15+ 15.13+ Rockingham 1.28‐ 28.15‐
Cabarrus 2.90+ 98.17+ Haywood 1.24‐ 24.32+ Rowan‐Salisbury 1.45+ 41.94+
Kannapolis City 2.65‐ 96.77= Henderson 1.33‐ 31.82‐ Rutherford 1.21+ 20.00+
Caldwell 1.48‐ 45.00‐ Hertford 1.07‐ 6.94‐ Sampson 1.03= 2.96+
Camden 1.00= 0.00= Hoke 1.92‐ 91.95‐ Clinton City 1.39+ 38.46+
Carteret 1.07+ 7.00+ Hyde 1.00= 0.00= Scotland 1.52‐ 51.85‐
Caswell 1.00= 0.00= Iredell‐Statesville 1.75+ 71.36+ Stanly 1.34‐ 29.81‐
Catawba 1.24‐ 24.35‐ Mooresville 1.97‐ 97.22‐ Stokes 1.21‐ 21.35‐
Hickory City 2.30‐ 91.30= Jackson 1.00= 0.00= Surry 1.06‐ 6.48‐
Newton‐Conover 1.45‐ 44.83‐ Johnston 1.76+ 47.76+ Elkin City 2.00 100.00
Chatham 1.08+ 7.78+ Jones 1.00= 0.00= Mount Airy City 1.00 0.00
Cherokee 1.19+ 19.15+ Lee 1.12‐ 11.70‐ Swain 1.10+ 9.52+
Edenton/Chowan 1.00= 0.00= Lenoir 1.13+ 11.81+ Transylvania 1.26‐ 25.71‐
Clay 1.00= 0.00= Lincoln 1.31‐ 28.83‐ Tyrell 1.00= 0.00=
Cleveland 1.04‐ 4.07‐ Macon 1.17+ 17.31+ Union 2.59+ 96.27‐
Columbus 1.06‐ 6.45‐ Madison 1.00= 0.00= Vance 1.28+ 26.14+
Whiteville City 1.11‐ 9.87‐ Martin 1.00= 0.00= Wake 2.63‐ 94.45+
Craven 1.33‐ 25.66‐ McDowell 1.06= 5.88+ Warren 1.00= 0.00=
Cumberland 1.56‐ 55.15‐ Charlotte‐Meck. 2.54+ 95.27+ Washington 1.00= 0.00=
Currituck 1.26+ 26.32+ Mitchell 1.00= 0.00= Watauga 1.47‐ 46.51‐
Dare 1.29+ 29.27+ Montgomery 1.09+ 8.62+ Wayne 1.30‐ 28.24‐
Davidson 1.28‐ 27.66‐ Moore 1.01= 0.74+ Wilkes 1.20= 20.00+
Lexington City 2.68= 90.91= Nash‐ Rocky Mount 1.31‐ 28.37‐ Wilson 1.42‐ 38.35‐
Thomasville City 2.15+ 100.00+ New Hanover 1.75‐ 71.89+ Yadkin 1.10+ 6.45+
Davie 1.19+ 19.18+ Northampton 1.00= 0.00= Yancey 1.03+ 2.56+
Duplin 1.01= 0.86+ Onslow 1.71+ 56.54+
Durham 1.99‐ 94.44‐ Orange 1.61‐ 60.61‐ State Average 1.65+ 47.01‐
TIMS 2009‐10 Service Indicators: Average Number of Runs per Route, PM
Average Runs per Route: The average number of separate runs (trips) each bus makes in the afternoon. % of Routes >1 Run: The percentage of buses making more than one run in the afternoon. A bus is considered to have completed a run when it has unloaded all students. All the runs a bus makes constitute its route. Only the pm portions of routes are considered here. Source: NC Local Education Agencies 2009‐2010 TIMS Data. Compiled at UNC Charlotte Urban Institute.
13 2009‐2010 TIMS Service Indicator Report

CONTACT INFORMATION: North Carolina Department of Public Instruction 919.807.3750 Philip Price, Chief Financial Officer, Financial and Business Services Ben Matthews, Director, School Support Division Derek Graham, Section Chief, Transportation Services Institute for Transportation Research and Education 919.515.9999 North Carolina State University Nagui Rouphail, Director Jeff Tsai, Pupil Transportation Program Director Mickey Michael, TIMS Program Manager, ITRE Marc Perez, Computer Support Analyst Bonnie Sluder, Computer Support Technician UNC Charlotte Urban Institute 704.687.2874 Jeff Michael , Director Rob Hamby, Director of School Services / Business Applications Analyst Jody Pressley, Computer Support Analyst Kevin Hart, Social Research Specialist
2009‐2010 TIMS Service Indicator Report
14