transportation related injuries - pitt.eduepi2670/transpo/transport.pdf · the haddon matrix...
TRANSCRIPT

1
EPI 2670: Injury Epidemiology
Transportation Related Injuries
Thomas Songer, PhDUniversity of Pittsburgh
Road traffic accidents are a part of everyday life. They range from minor “fender-benders” to horrific crashes, such as the one that killed Princess Diana. In the extreme, motor vehicle accidents attract our morbid attention.
Injuries from motor vehicle accidents represent a significant burden in the United States and the world. In 1990, traffic accidents were the 9th leading cause of death worldwide. Their frequency is expected to increase, where in the year 2020, they are projected to be the 5th leading cause of death (Source: World Health Report, 2008).
While the picture may appear bleak, there is room for optimism. Injury research, injury surveillance, and injury control in the transportation area is far advanced relative to other injury categories. Integrated efforts have dramatically decreased the impact of crashes in the western world. Further, efforts are underway to extend this practice to the developing world.

2
Types of Transportation
Motor vehicle crashes pertain to a variety of means of transportation. Foremost, road traffic accidents involve automobiles, but the term also includes events related to small and large trucks, buses, motorcycles, and collisions between vehicles and pedestrians.

3
Top Ten Public Health Achievement
The reduction in the rate of death attributable to motor-vehicle crashes has been called one of the most successful public health responses to a great technologic advance of the 20th century--the motorization of America. Six times as many people drive today as in 1925, and the number of motor vehicles in the country has increased 11-fold since then to approximately 215 million. The number of miles traveled in motor vehicles is 10 times higher than in the mid-1920s. Despite this steep increase in motor-vehicle travel, the annual death rate has declined from 18 per 100 million vehicle miles traveled (VMT) in 1925 to 1.7 per 100 million VMT in 1997--a 90% decrease. Injury control efforts and epidemiology have had a large part in this decline.
Achievements in Public Health, 1900-1999 Motor-Vehicle Safety: A 20th Century Public Health Achievement. MMWR May 14, 1999 / 48(18);369-374
4
History of Crashes
0
5
10
15
20
25
19351940
19451950
19551960
19651970
19751980
19851990
1995
USA Pennsylvania
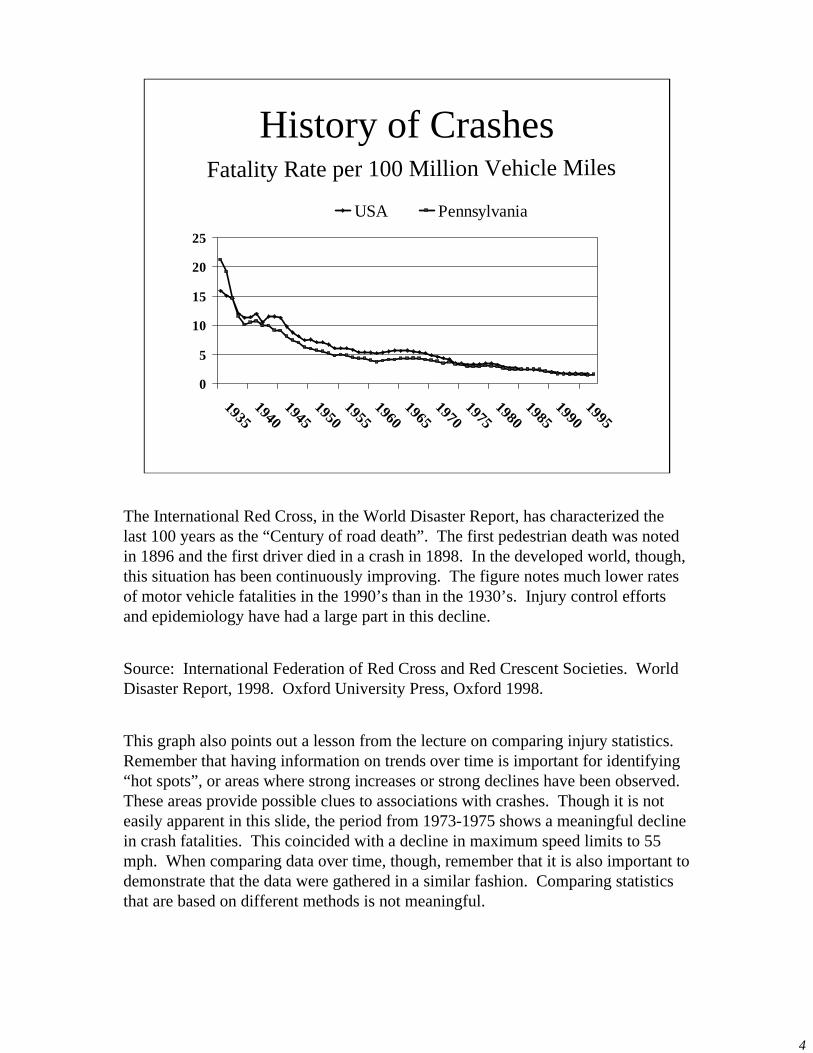
Fatality Rate per 100 Million Vehicle Miles
The International Red Cross, in the World Disaster Report, has characterized the last 100 years as the “Century of road death”. The first pedestrian death was noted in 1896 and the first driver died in a crash in 1898. In the developed world, though, this situation has been continuously improving. The figure notes much lower rates of motor vehicle fatalities in the 1990’s than in the 1930’s. Injury control efforts and epidemiology have had a large part in this decline.
Source: International Federation of Red Cross and Red Crescent Societies. World Disaster Report, 1998. Oxford University Press, Oxford 1998.
This graph also points out a lesson from the lecture on comparing injury statistics. Remember that having information on trends over time is important for identifying “hot spots”, or areas where strong increases or strong declines have been observed. These areas provide possible clues to associations with crashes. Though it is not easily apparent in this slide, the period from 1973-1975 shows a meaningful decline in crash fatalities. This coincided with a decline in maximum speed limits to 55 mph. When comparing data over time, though, remember that it is also important to demonstrate that the data were gathered in a similar fashion. Comparing statistics that are based on different methods is not meaningful.

5
Studying the Epidemiology of Injuries from Crashes

6
The Accident Triumvirate
• Environment
• Vehicle
• Driver
Epidemiologic efforts to study injuries from crashes have followed the same basic framework for the last 40 years. This framework considers crash events as an interaction of three factors; the host (driver), the agent (vehicle), and the environment. Driver factors represent the human element behind accidents. It describes how the characteristics and traits of the driver may affect both crashes and injuries from crashes. The vehicle is viewed as the mechanism for energy transfer in motor vehicle accidents. The characteristics of the vehicle, such as weight and design, may influence crashes and injuries. Environmental factors represent the weather or road conditions surrounding the event and their relationship to crashes and injuries. The accident triumvirate points out that accidents are not just due to one event, but are multi-factorial. That means that several circumstances come together at the time of the crash. The notion of accidents as being a matter of fate arises from this view. However, remember that it is possible to intervene on these circumstances to either reduce the likelihood for a crash or the severity of injuries involved. Crashes are entirely preventable.

7
The Crash Sequence
• Pre-crash Period• Crash Period• Post-crash Period
William Haddon also spoke of the “Crash Sequence” as being meaningful for studying injuries from motor vehicle accidents. This sequence involves events which occur prior to the crash, the circumstances surrounding the crash itself, and the situation that exists after the crash. Haddon argued that there are circumstances in the period of time right before the collision that may dictate whether a crash or injury from a crash happens. The characteristics of the crash itself, (i.e., how energy is transferred) influences the likelihood for and severity of injury. Third, the events which take place after a crash occurs can determine the outcome of a crash. For example, the ability to extricate victims from the car, the response time of EMS (Emergency Medical Services) to the accident scene, and the type of medical care received may all influence the injury outcome of a crash.

8
The Haddon Matrixuse for planning, resource allocation, strategy identification
Human Vehicle Environment
Pre-event
Event
Post-event
The Haddon Matrix highlights the important finding that the temporal events of the crash (it’s sequence) and it’s epidemiologic components (the triad) can be viewed together. In other words, Haddon argued that the analysis of crashes should consider these two schemata together. There are human, vehicular, and environmental factors involved in each stage of a crash. Understanding how they work together to result in a crash or an injury can help investigators plan prevention strategies.

9
How do we know what the impact of crashes are?

10
Surveillance:Systematic, regular ascertainment of incidence using methods distinguished by their practicality, uniformity, and frequently their rapidity, rather than by complete accuracy.
Last, 1990
Identifying the importance or magnitude of crashes as a public health issue is the function of accident or injury surveillance systems.
We will examine two surveillance systems related to motor vehicle accidents in the United States; The Fatality Analysis Reporting System (FARS) and the General Estimates System (GES). Both provide regular assessments of accidents in the USA.
Since motor vehicle accidents are a leading cause of death in the world, several public health officials regard them as sentinel events. Surveillance of sentinel events is a primary function of a public health system. It can provide quick identification of changes in fatalities that may warrant further action. That is the intent behind sentinel event surveillance. The FARS surveillance system fulfills this function for the United States.
11
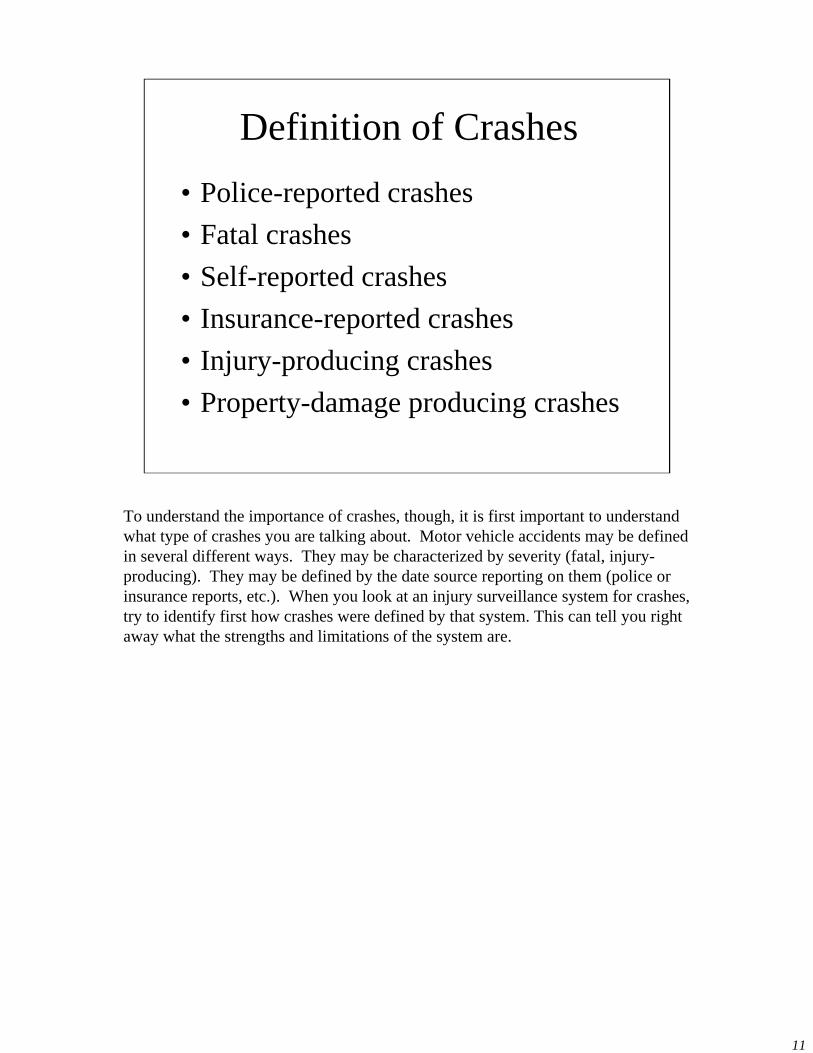
Definition of Crashes• Police-reported crashes• Fatal crashes• Self-reported crashes• Insurance-reported crashes• Injury-producing crashes• Property-damage producing crashes
To understand the importance of crashes, though, it is first important to understand what type of crashes you are talking about. Motor vehicle accidents may be defined in several different ways. They may be characterized by severity (fatal, injury-producing). They may be defined by the date source reporting on them (police or insurance reports, etc.). When you look at an injury surveillance system for crashes, try to identify first how crashes were defined by that system. This can tell you right away what the strengths and limitations of the system are.

12
Fatality Analysis Reporting System
The Fatality Analysis Reporting System (FARS) represents the primary sentinel event surveillance system related to transportation injuries. FARS contains data on all traffic accidents in which a fatality is involved in the USA and Puerto Rico.
This surveillance system is dependent upon reporting through the states. Standard forms are filled out at this level and include three databases on the vehicle, driver, and environmental characteristics of the crash. The definition of a event in the FARS system is “a crash involving a motor vehicle on a public traffic way that results in the death of a person (driver, occupant, or non-motorist).” The death must occur within 30 days of the crash. In many areas, specially trained accident investigation teams review the events and circumstances surrounding the fatal crash.
The FARS system began in 1975. Data are maintained and available through NHTSA. With the FARS Query System, data have become available online through the NHTSA site.
13
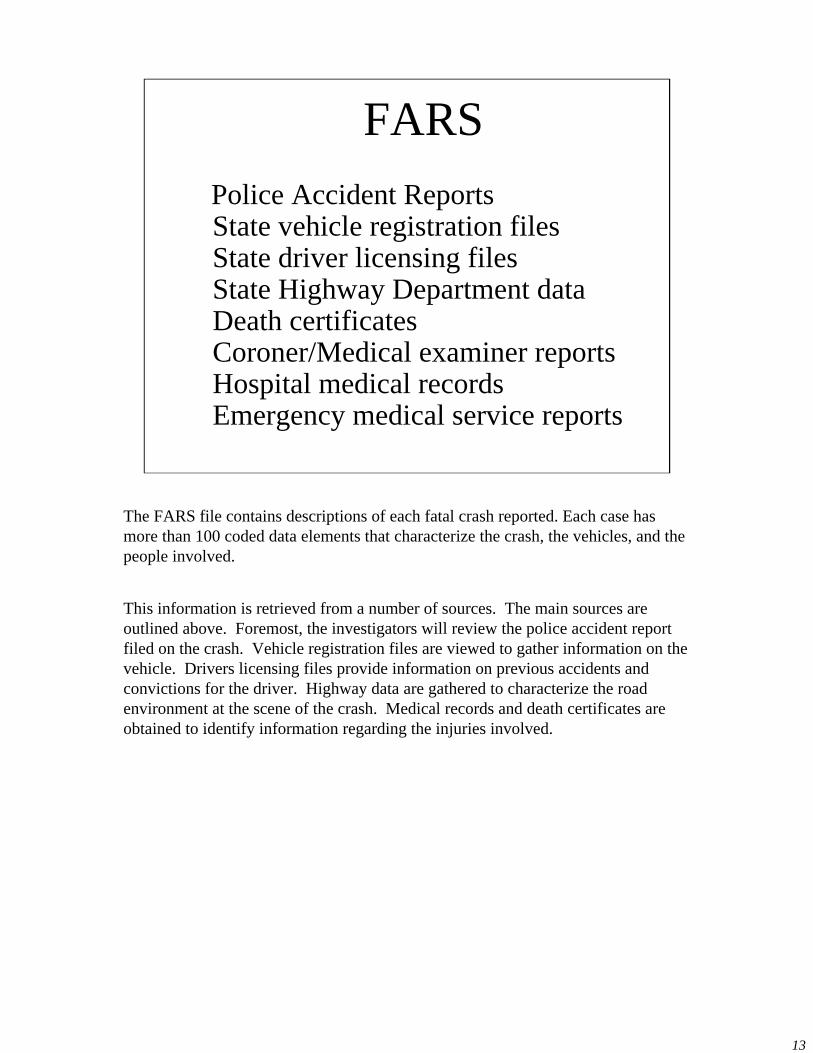
Police Accident ReportsState vehicle registration files State driver licensing files State Highway Department data Death certificates Coroner/Medical examiner reports Hospital medical records Emergency medical service reports
FARS
The FARS file contains descriptions of each fatal crash reported. Each case has more than 100 coded data elements that characterize the crash, the vehicles, and the people involved.
This information is retrieved from a number of sources. The main sources are outlined above. Foremost, the investigators will review the police accident report filed on the crash. Vehicle registration files are viewed to gather information on the vehicle. Drivers licensing files provide information on previous accidents and convictions for the driver. Highway data are gathered to characterize the road environment at the scene of the crash. Medical records and death certificates are obtained to identify information regarding the injuries involved.

14
Fatality Analysis Reporting System
39,187 fatal motor vehicle crashes occurred in the United States in 2005, and 43,443 deaths occurred in these
crashes.
The latest data available from FARS are for the year 2005. They demonstrate that there are about 43,000 deaths per year in the USA from motor vehicle accidents. This number has been relatively stable over time despite a growth in the US population and a growth in the number of vehicle miles traveled.

15
Fatal Crashes, 1975-2003

16
Persons Killed, United States, 1975-2003
38,000
39,000
40,000
41,000
42,000
43,000
44,000
91 92 93 94 95 96 97 98 99 0 1 2 3

17
Number % Speed % Alcohol Costs Related Related (millions)
1,562 16.1 32.9 $ 4,385
All figures are 1997
State of Pennsylvania Department of Transportation
Fatal Accidents in Pennsylvania
For Pennsylvania, there were 1562 deaths from MVA in 1997. This represents a fatality rate of 1.6 per 100 million vehicle miles, and is roughly comparable to the USA rate. Nearly 33% of the fatal crashes had some alcohol involvement. This figure is also similar to the percentage observed for the USA as a whole.

18
GESGeneral Estimates System
The General Estimates System (GES) reports on all types of motor vehicle crashes (from minor to fatal). The GES is based on a representative sample of police reported motor vehicle accidents in the United States. It was established to provide information on the frequency of motor vehicle crashes, their driver, vehicular, and environmental characteristics, and their outcomes. It represents a surveillance system for less severe crashes, as the characteristics of these events may differ from those for fatal events.
The definition of a crash in the GES is an event involving at least one motor vehicle traveling on a public roadway that results in property damage, injury, or death. A police accident report must be completed for each event.
The sample used in the GES is a survey of 60 geographical areas in the USA. Data collection experts make weekly visits to 400 police jurisdictions in those areas and randomly sample about 50,000 accidents reports each year. Further information on the methods of the GES is available at it’s NHTSA site.
Definitions are an important component of the GES. Injury producing crashes are those where any of the following criteria were noted in the police report; (1) an incapacitating injury, (2) a visible, but not incapacitating injury, (3) the identification of possible injury, or (4) an injury of unknown severity.
Property damage crashes are classified as those where no injuries were observed. The criteria by which police reports are filled out for these events may differ by jurisdiction. Often, though, these will include all crashes in which one vehicle has

19
USA Crash Rates By Severity
6,279,000 total crashes
Fatal
Injury
PropertyDamage
per 100 million VMT
1.4
77
156
1999 FARS, GES
In 1999, there were an estimated 6,279,000 motor vehicle accidents in the USA. The vast majority of these incidents involved only property damage (67.1%). Crashes producing injury accounted for 32.2% of this figure (n=2,054,000 crashes), while fatal crashes made up only 0.6% of these events. Again, the rate of injury producing and property damage crashes has been declining over time.
Source: Traffic Safety Facts 1999, NHTSA

20
What are the descriptive factors related to crashes?
Both the FARS and GES surveillance systems gather a great deal of information regarding the driver, vehicle and environmental characteristics surrounding the crash. This data has been used quite frequently to describe the possible factors related to automobile crashes. It is important to remember that the data from these systems are descriptive and one cannot necessarily determine causality from the factors identified within them. This is important to point out because others have used these systems to imply causality. Both the FARS and GES provide data for people and vehicles that crashed. There is no information on the characteristics of persons who have not crashed. Thus, it remains an important step to consider analytic studies to identify the causal association of risk factors in crashes.

21
Human
Environmental
VehicularFailureDesignSpeed
AgeGenderExperience
AlcoholFatigue
Road Cond.TrafficWeather
Some of the risk factors suggested for motor vehicle accidents are shown here. Broken down by the epidemiologic framework, we see that a series of human factors have been implicated in MVA including driver age and gender, number of years driving, alcohol use, and fatigue, amongst others. Vehicular factors include mechanical failure, poor vehicle design (e.g. Rollover tendencies), and vehicle speed at the time of the crash (also a human factor). Environmental characteristics include the road, traffic, and weather conditions.

22
0
1000
2000
3000
4000
5000
6000
Injury PropertyDamage
Driver Involvement Rates in Crashes by Gender and Crash Severity
1999 GES/FARS
per 100,000 licensed drivers
0
10
20
30
40
50
Fatal
Males Females
Human factors can explain the vast majority of all motor vehicle accidents. Strong relationships have been found between gender and crashes, age and crashes, driving experience and crashes and so forth. In this slide, we see the demonstration of the gender effect in crashes. For every 100,000 licensed drivers, males are more frequently involved in fatal, injury-related, and property damage associated crashes. The effect is strongest for fatal events.
23
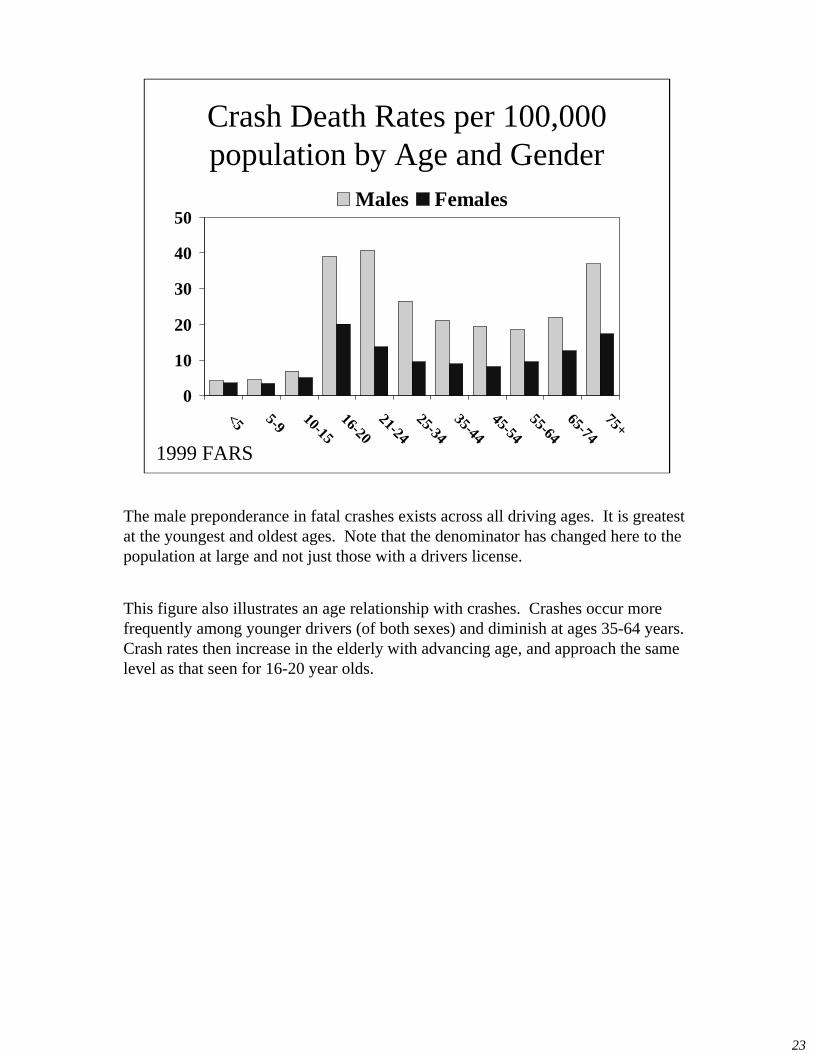
Crash Death Rates per 100,000 population by Age and Gender
0
10
20
30
40
50
<5 5-9 10-1516-20
21-2425-34
35-4445-54
55-6465-74
75+
Males Females
1999 FARS
The male preponderance in fatal crashes exists across all driving ages. It is greatest at the youngest and oldest ages. Note that the denominator has changed here to the population at large and not just those with a drivers license.
This figure also illustrates an age relationship with crashes. Crashes occur more frequently among younger drivers (of both sexes) and diminish at ages 35-64 years. Crash rates then increase in the elderly with advancing age, and approach the same level as that seen for 16-20 year olds.

24
Motor Vehicle Crash Death Rates among Males by Country, 1980
010203040506070
0-4 15-24 35-44 55-64 75+
Rat
e pe
r 100
,000
pop
.USA France Japan GER UK
Age group
The age relationship with crashes is not just confined to the United States. This figure illustrates a very similar age pattern across several different, industrialized countries. The greatest risk is among young males (age 15-24 years) in each country. All also have high rates in the aged. A similar finding has been observed for females as well. Japan is particularly noted for higher crash rates in persons over age 75 years.

25
Percent of Drivers in Crashes with Alcohol Involvement by Age Group
05
10152025303540
16-20 21-24 25-34 35-44 45-54 55-64 65+
1999 GES/FARSAge (in years)
FatalInjury
Driving under the influence of alcohol is another hazard related to road traffic accidents. In the graphic displayed here, the percent of all drivers in crashes who had some alcohol involvement (a blood alcohol level above 0.00 mg/dl) is illustrated. Alcohol involvement appears to be particularly strong in fatal crashes, particularly for the young, but also very high (10-15%) in those over 65 years.

26
Drivers Involved in Fatal Crashes by Previous Driving Record
Previous Crashes 14.8%Previous Suspensions 12.4%Previous DWI Convictions 3.4%Previous Speeding Convictions 21.0%Other Moving Violations 17.6%No Previous Convictions 57.3%
1999 FARS
Driving experience is another human factor of importance in road crashes. For experience, one typically would think of a metric such as the number of years driving as a key indicator, and the evidence certainly suggests that it is. A large number of the most inexperienced drivers (16-17 year olds), for example, are involved in crashes.
Experience, though, can also be measured from the perspective of the driver’s previous driving record. The FARS accident surveillance system actively collects information from drivers licensing files. As noted here, the majority of drivers in fatal crashes had no previous violations or accidents in their records. Large proportions, though, had evidence of previous crashes or previous speeding violations. Both indicators have been used as flags for problematic drivers in accident reduction programs.

27
Proportion of Vehicles Involved in Traffic Crashes
CarsOtherLarge TrucksBusLight TruckMotorcycle
1999 GES/FARS
Vehicular factors are another dimension to consider in both the development of crashes and the consequences of crashes. Far more information, however, is available on the relationships between vehicles and the consequences of crashes. Most accidents in the United States involve passenger vehicles, such as sedans or station wagons. This is due to the large number of these vehicles on the road. A fairly large proportion of crashes (33%) also involve light trucks. Light trucks include pickups, vans, sport-utility vehicles and other vehicles weighing under 10,000 pounds. Large trucks (vehicles over 10,000 pounds) are involved in only 4 percent of all crashes. Buses carrying more than 10 passengers (such as school or city buses) and motorcycles (2 or 3 wheels) account for less than 1 percent of all events. There are also fewer of these vehicles on the road.

28
Crash Rates by Type of Vehicle
0
5
10
15
20
25
Cars LightTrucks
LargeTrucks
Motor-cycles1997 FARS
per 100 million vehicle miles traveledFatal Crashes
While there may be fewer motorcycles on the road, the risk for a fatal crash is extremely high for these vehicles, swamping the risks related to cars and trucks by a significant amount. This risk for motorcycles is most likely due to the limited protection that a motorcycle offers the operator or passenger in the event of a crash. The rider will have a direct impact with the road or an obstacle. Whereas, the driver or passenger in an automobile or truck will have some protection from the vehicle. The parts of the car or truck may absorb some of the energy transfer from the crash and protect (comparatively) the occupants.

29
Crash Rates by Type of Vehicle
0
70
140
210
280
350
Cars LightTrucks
LargeTrucks
Motor-cycles1997 GES
per 100 million vehicle miles traveledInjury Property Damage
Interesting patterns are also seen for injury producing and property damage only accidents. For injury-related crashes, motorcycles, again, have the highest rates. Large trucks have the lowest rates. For property damage crashes, passenger cars have the highest crash rates.

30
USA Crash Rates by Month
0
100
200
300
400
Jan
Feb Mar Apr May Jun Ju
lAug Sep Oct Nov Dec
Total Property Damage Injury Severe/Fatal Injury
1999 GES/FARS
per 100 million vehicle miles traveled
Environmental factors are the third dimension of crashes. This slide portrays an indirect assessment of the possible role of weather conditions in crashes. Overall, more crashes are observed in the winter months. The lowest crash rates are seen in the summer months. Remember also that the vehicle miles traveled increase substantially in the summer months. No monthly relationship is seen for fatal crashes.

31
Crash Rates by Road Type, 1997, Pennsylvania (per 100 million VMT)
0.45 0.39
1.51
2.4
0
1
2
3
Interstate Turnpike OtherState
Highway
LocalRoad
PennDOT
Road conditions are another factor related to crashes in the literature. Data for Pennsylvania, for example, illustrate a pattern seen in other areas. That is the lowest crash rates are generally observed for four lane, divided highways (such as the interstate system). The highest rates are seen for local roads, which are usually two lanes and not divided. Divided roads are roads with a barrier or buffer between lanes of oncoming traffic.

32
Crashes by Hour of Day, PA
0
2000
4000
6000
8000
10000
12000
6:00AM
9 12:00PM
3 6 9 12:00AM
3
Number
1997 PennDOT
A unique pattern has also been observed between crashes and the time of day in which they occur. Overall, most crashes occur during the evening rush hours. A large number are also seen in the morning rush hours as well. Fewer crashes are observed in the late evening hours. This pattern is due to the number of vehicles on the road. Far more vehicles are traveling during the day and, as such, the chance for a crash is heightened.

33
Alcohol Involved Crashes by Time of Day
1999 GES,FARSNumber of Crashes
0
20,000
40,000
60,000
80,000
100,000
6-9 9-12 12-3 3-6 6-9 9-12 12-3 3-6Morning Evening
When one considers alcohol involvement and the time of the crash, another unique pattern emerges. While overall, we generally see fewer crashes in the late evening, this appears to be the time of greatest risk for alcohol involved crashes. Most crashes which have some relationship to alcohol occur between 9:00 pm and 3:00 am. Prime nightclub hours!

34
Alcohol Related Crashes by Time of Day1999 GES,FARS
0
20
40
60
80
100
6-9 9-12 12-3 3-6 6-9 9-12 12-3 3-6
perc
ent a
lcoh
ol r
elat
ed
Morning Evening
Property Damage Injury Fatal Injury
The percentage of fatal crashes involving alcohol increases dramatically after 6 o’clock in the evening. About 75% of the fatal crashes between midnight and 3am involve alcohol.
35
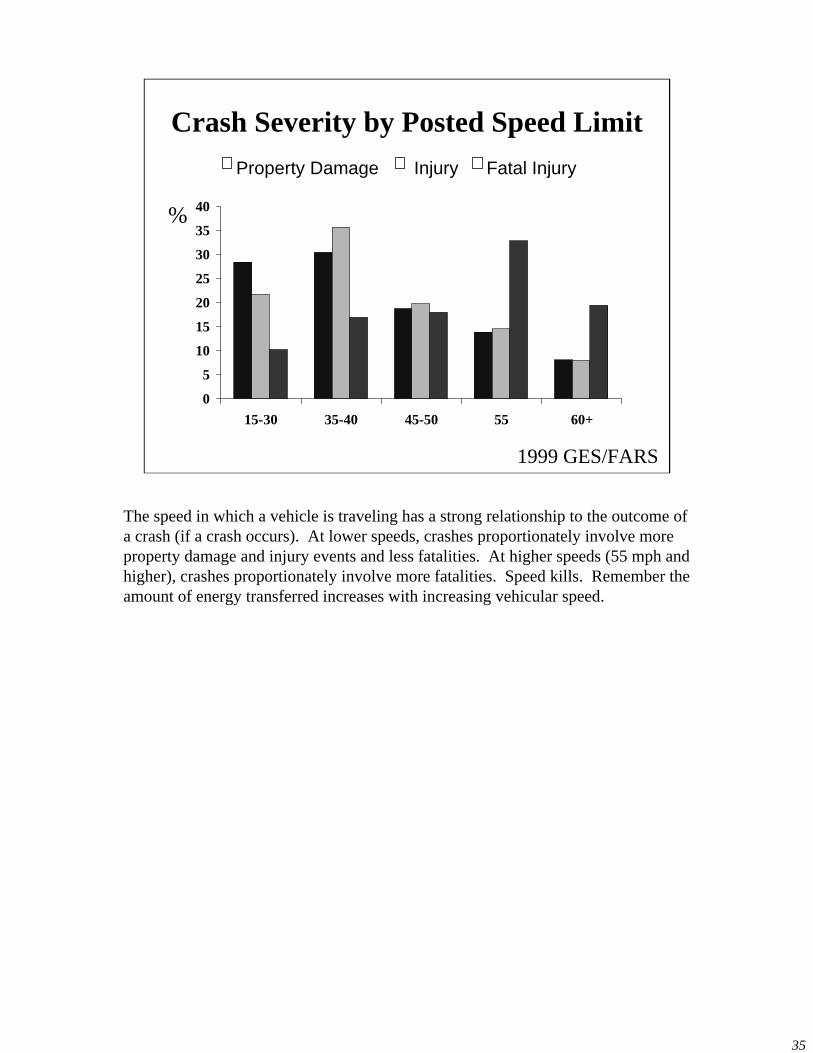
Crash Severity by Posted Speed Limit
1999 GES/FARS
Property Damage Injury Fatal Injury
0
5
10
15
20
25
30
35
40
15-30 35-40 45-50 55 60+
%
The speed in which a vehicle is traveling has a strong relationship to the outcome of a crash (if a crash occurs). At lower speeds, crashes proportionately involve more property damage and injury events and less fatalities. At higher speeds (55 mph and higher), crashes proportionately involve more fatalities. Speed kills. Remember the amount of energy transferred increases with increasing vehicular speed.

36
Research Issues
Let me now shift the focus of this lecture to a discussion of some research issues in the study of injuries from motor vehicle accidents.
Most studies of motor vehicle accidents are not perfect in their design or analysis. They are, in fact, influenced by issues such as the manner in which the numerator (crashes) is defined, the type of denominator chosen, the degree of accuracy and ascertainment of data collection, and the type of study factors considered.

37
No Standard Definition of Crashes
• Police-reported crashes– under-reports non-fatal & less severe events
• Self-reported crashes– drivers with impairments may under-report
• Injury-producing crashes– does not include less severe events
• Property-damage producing crashes– under-reporting to insurance companies
One of the first things that a researcher should do when examining a study on motor vehicle crashes is to identify the manner in which crashes were defined. In other words, how did a crash become an endpoint for the numerator?
This is important, as there is no gold standard for defining a crash. Information on road accidents can be gathered from a number of data sources. Each source has it’s own nuances and limitations. This suggests that the results obtained in a study can be affected by the definition of crashes used. It also indicates that comparisons should not be undertaken unless the definitions used are similar.

38
Various sources suggest that about half the motor vehicle crashes in the
country are not reported to the police, the majority of these unreported
crashes involve only minor property damage and little personal injury.
General Underreporting of Accidents
Crashes are notoriously under-reported. There are both financial and administrative reasons why individuals may not disclose or report an accident if it occurs. For example, insurance rates may increase with a record of accidents. A drivers license may also be in jeopardy with too many reported crashes. Various studies, fortunately, suggest that the vast majority of unreported crashes are less severe events. By restricting attention to police-reported crashes, the GES concentrates on the crashes of some significance and crashes with the greatest concern to the highway safety community and the public.

39
Death Rates per 10,000 Vehicles Registered by Country
0 40 80 120 160 200
Australia
Indonesia
India
China
GhanaEthiopia
Bangladesh
Swaziland
Ecuador
Hong Kong
Denominator issues may also affect the results of a study. We see here a look at the global impact of crashes as defined by the number of fatal events per 10,000 registered vehicles. This is an unusual type of denominator, but probably the only metric that can be obtained from all of the listed countries. The data suggest that several areas in the developing world may have extremely high fatal crash rates. The denominator, however, does not consider other factors, such as exposure (mileage driven, type of roads driven on) and the results could differ with the use of a different denominator.

40
MMUCC
• Crash Date & Time• Place• Manner of Crash• Weather Conditions• Road Condition• Vehicle Make• VIN
Model Minimum Uniform Crash Criteria
• Total Occupants• Seating Position• Injury Status• Seat Belt Use• Alcohol Involvement• Air bag Deployment
Important Data Elements
Another limitation affecting studies of motor vehicle crashes is the degree of completeness of data collection and the definitions applied to crash data elements. The GES system relies upon information from police accident reports. There is no guarantee, though, that the information included in the reports will be similar across jurisdictions or that similar types of data elements will be recorded in the report.
The MMUCC is an active effort by the NHTSA to standardize the data elements included in crash reports and the definitions applied to these elements. The philosophy behind this effort is similar to the ICE project. It makes crash data more comparable and more effective in terms of the meaning to be gathered from the conclusions.

41
To measure benefits in terms of reducing death, disability, and medical costs, NHTSA determined that statewide data were needed that included all persons involved in police-
reported crashes --
those who were injured as well as those who were not injured.
CODES
Most studies and data sources on motor vehicle crashes contain no information on persons who have not been in the crash or have not been injured. This creates a problem for evaluations where it is important to understand the risk for injury among participants or where it is important to understand the extent to which injury control programs reduce injuries. This also highlights the fundamental limitation of existing surveillance systems; I.e. they are descriptive and not analytic.
A major criticism of injury control programs is that very few have been evaluated to determine their effectiveness. Indeed it is difficult to examine their effectiveness with surveillance sources that include only individuals who are injured. The CODES project outlined above represents a significant change from past practices in this regard. In this program, an active effort has been made to link databases together to identify the role of seat belts, airbags, and other preventive efforts in reducing injuries amongst persons involved in crashes.

42
Prevention of Injuries from Motor Vehicle Accidents
• Changes in Highway Design• Changes in Vehicle Design• Seat Belts• Air Bags• Speed Limits• Changes in Licensing
I will end this lecture with a brief mention of the successes seen in reducing injuries from motor vehicle accidents. Research into this area has been underway for well over seventy years now. The injury field is blessed by having had remarkable success in reducing fatalities from traffic accidents (re: slide 3). Several initiatives have led the way in this effort. These include better engineering of roads and cars, the implementation of safety devices in cars, and the active enforcement of traffic laws. Many of the initiatives have been drawn from the work of injury surveillance and injury researchers.

43
Air Bags Work(except for a few)
- Up through December 1999, air bags have saved an estimated 4969 lives.
- In purely frontal crashes, air bags reduce car driver deaths by 26-32 percent.
- Since 1990, 175 deaths have been caused by airbags
One safety device, air bags, has garnered particular attention. By a large margin, the data demonstrate that air bags are effective in saving lives, particularly in frontal collisions (head-on crashes). However, this benefit does not exist without some risk. In part due to engineering configurations designed to maximize the effects of air bags, they represent a hazard to some population sub-groups, particularly little children and little old ladies.

44
As a result of the fatalities associated with children (in relatively low speed crashes), the injury prevention field has been forced to change it’s message. The recognition that air bags can kill brought about the strategy of seating children in the rear seat. This message is long overdue independent of airbags. We have known for some time now that rear seated occupants of all ages have the lowest fatality rates in crashes.
This is an illustration that benefits carry risks as well. Overall, the injury prevention field has been remarkably successful and will likely continue to be so in the future.