transurban investor day · disclaimer this publication is prepared by the transurban group...
TRANSCRIPT
TRANSURBANINVESTOR DAY

DISCLAIMER
This publication is prepared by the Transurban Group comprising Transurban Holdings Limited (ACN 098 143 429), Transurban Holding Trust (ARSN 098 807 419) and TransurbanInternational Limited (ACN 121 746 825). The responsible entity of Transurban Holding Trust is Transurban Infrastructure Management Limited (ACN 098 147 678) (AFSL 246 585). Norepresentation or warranty is made as to the accuracy, completeness or correctness of the information contained in this publication. To the maximum extent permitted by law, none of theTransurban Group, its Directors, employees or agents or any other person, accept any liability for any loss arising from or in connection with this publication including, without limitation, anyliability arising from fault or negligence, or make any representations or warranties regarding, and take no responsibility for, any part of this publication and make no representation orwarranty, express or implied, as to the currency, accuracy, reliability, or completeness of information in this publication. The information in this publication does not take into accountindividual investment and financial circumstances and is not intended in any way to influence a person dealing with a financial product, nor provide financial advice. It does not constitute anoffer to subscribe for securities in the Transurban Group. Any person intending to deal in Transurban Group securities is recommended to obtain professional advice.
UNITED STATES OF AMERICAThese materials do not constitute an offer of securities for sale in the United States of America, and the securities referred to in these materials have not been and will not be registeredunder the United States Securities Act of 1933, as amended, and may not be offered or sold in the United States absent registration or an exemption from registration.
© Copyright Transurban Limited ABN 96 098 143 410. All rights reserved. No part of this publication may be reproduced, stored in a retrieval system, or transmitted in any form or by anymeans, electronic, mechanical, photocopying, recording or otherwise, without the written permission of the Transurban Group.
TRANSURBAN INVESTOR DAY | 29 APRIL 2019 2
06
21
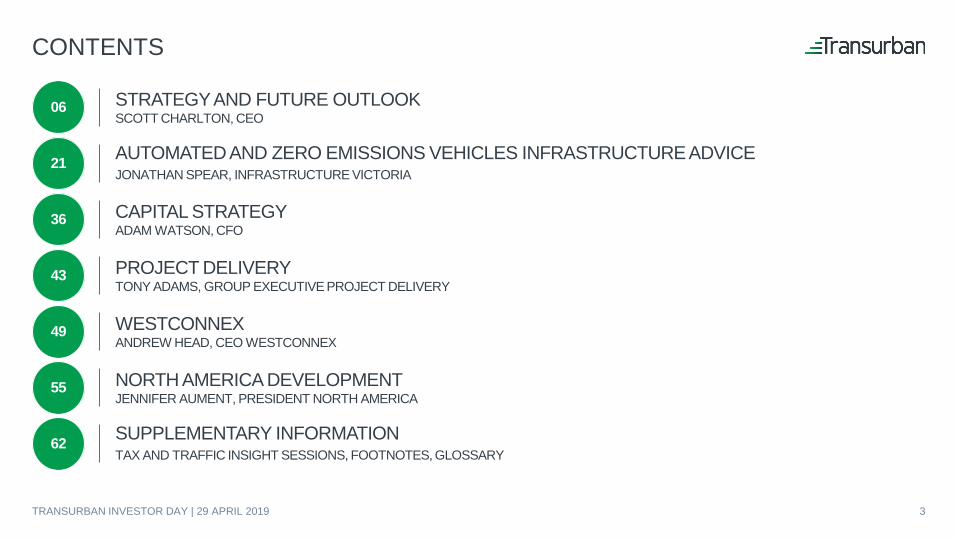
CONTENTS
36
43
49
55
62
STRATEGY AND FUTURE OUTLOOKSCOTT CHARLTON, CEO
AUTOMATED AND ZERO EMISSIONS VEHICLES INFRASTRUCTURE ADVICEJONATHAN SPEAR, INFRASTRUCTURE VICTORIA
CAPITAL STRATEGYADAM WATSON, CFO
NORTH AMERICA DEVELOPMENTJENNIFER AUMENT, PRESIDENT NORTH AMERICA
WESTCONNEXANDREW HEAD, CEO WESTCONNEX
PROJECT DELIVERYTONY ADAMS, GROUP EXECUTIVE PROJECT DELIVERY
SUPPLEMENTARY INFORMATIONTAX AND TRAFFIC INSIGHT SESSIONS, FOOTNOTES, GLOSSARY
TRANSURBAN INVESTOR DAY | 29 APRIL 2019 3
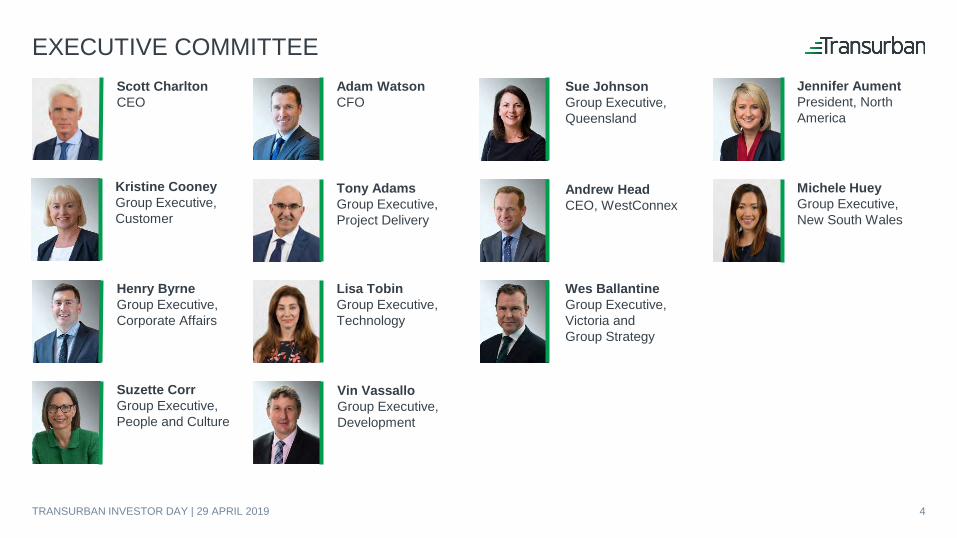
EXECUTIVE COMMITTEEAdam WatsonCFO
Tony AdamsGroup Executive, Project Delivery
Lisa TobinGroup Executive, Technology
Kristine CooneyGroup Executive, Customer
Andrew HeadCEO, WestConnex
Sue JohnsonGroup Executive, Queensland
Wes BallantineGroup Executive, Victoria and Group Strategy
Jennifer AumentPresident, North America
Michele HueyGroup Executive, New South Wales
Scott CharltonCEO
Henry ByrneGroup Executive, Corporate Affairs
Suzette CorrGroup Executive, People and Culture
Vin VassalloGroup Executive, Development
TRANSURBAN INVESTOR DAY | 29 APRIL 2019 4
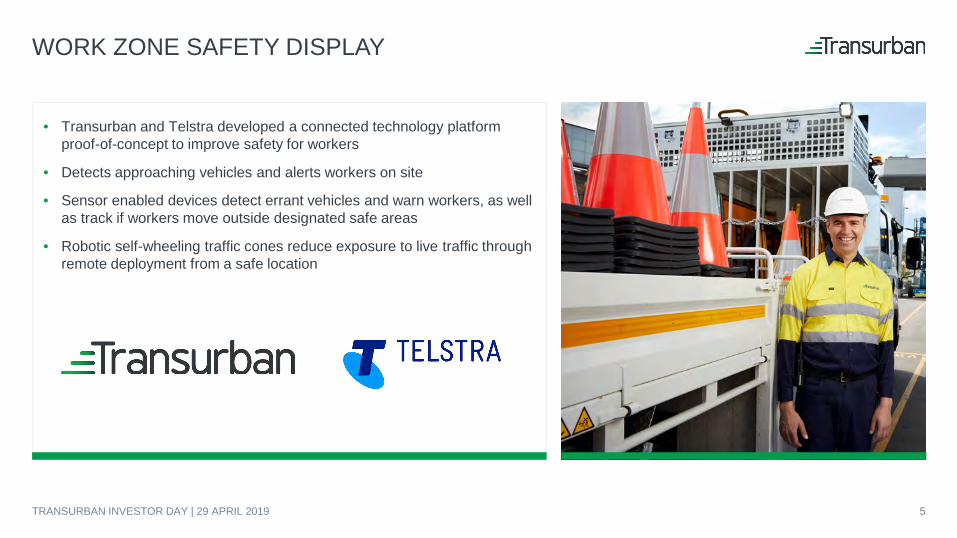
WORK ZONE SAFETY DISPLAY
• Transurban and Telstra developed a connected technology platform proof-of-concept to improve safety for workers
• Detects approaching vehicles and alerts workers on site
• Sensor enabled devices detect errant vehicles and warn workers, as well as track if workers move outside designated safe areas
• Robotic self-wheeling traffic cones reduce exposure to live traffic through remote deployment from a safe location
TRANSURBAN INVESTOR DAY | 29 APRIL 2019 5
STRATEGY AND FUTURE OUTLOOK
SCOTT CHARLTON – CEO
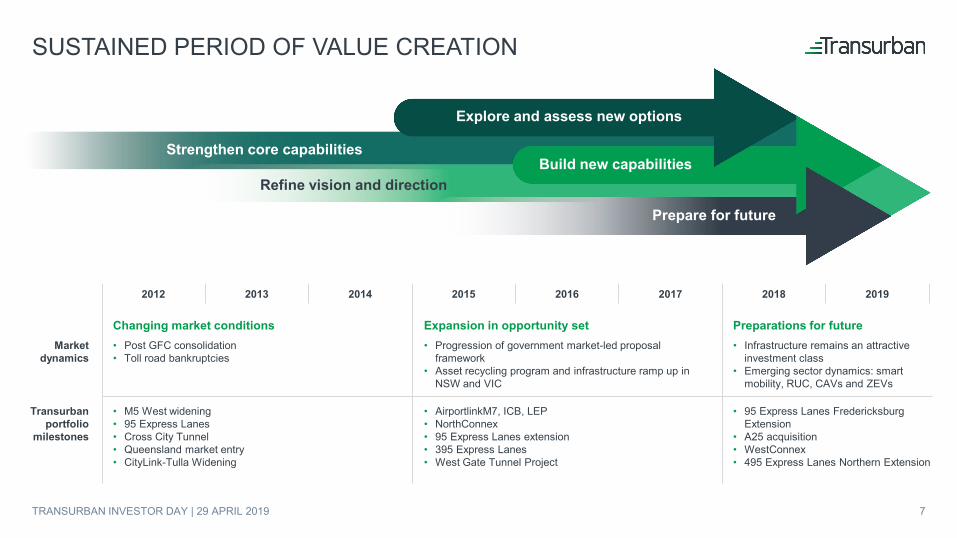
SUSTAINED PERIOD OF VALUE CREATION
Changing market conditions Expansion in opportunity set Preparations for futureMarket
dynamics• Post GFC consolidation• Toll road bankruptcies
• Progression of government market-led proposal framework
• Asset recycling program and infrastructure ramp up in NSW and VIC
• Infrastructure remains an attractive investment class
• Emerging sector dynamics: smartmobility, RUC, CAVs and ZEVs
Transurban portfolio
milestones
• M5 West widening • 95 Express Lanes• Cross City Tunnel• Queensland market entry• CityLink-Tulla Widening
• AirportlinkM7, ICB, LEP • NorthConnex • 95 Express Lanes extension • 395 Express Lanes • West Gate Tunnel Project
• 95 Express Lanes Fredericksburg Extension
• A25 acquisition • WestConnex• 495 Express Lanes Northern Extension
Explore and assess new options
Build new capabilities
Prepare for future
Refine vision and direction
Strengthen core capabilities
2012 2013 2014 2015 2016 2017 2018 2019
TRANSURBAN INVESTOR DAY | 29 APRIL 2019 7

NEAR-TERM PRIORITIES
DELIVERCOMMITTED
PROJECTS
ENHANCE CUSTOMER AND COMMUNITY
OFFERINGS
MAXIMISEPERFORMANCE OF
OPERATIONS
8TRANSURBAN INVESTOR DAY | 29 APRIL 2019
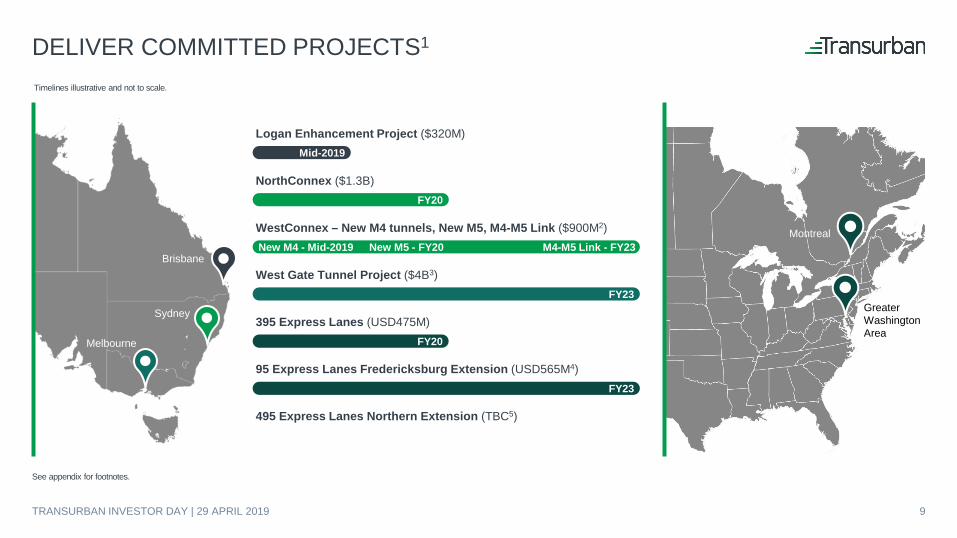
DELIVER COMMITTED PROJECTS1
See appendix for footnotes.
Sydney
Melbourne
Brisbane
Greater Washington Area
Montreal
Logan Enhancement Project ($320M)
NorthConnex ($1.3B)
WestConnex – New M4 tunnels, New M5, M4-M5 Link ($900M2)
West Gate Tunnel Project ($4B3)
395 Express Lanes (USD475M)
95 Express Lanes Fredericksburg Extension (USD565M4)
495 Express Lanes Northern Extension (TBC5)
Mid-2019
FY20
New M4 - Mid-2019 New M5 - FY20 M4-M5 Link - FY23
FY23
FY20
FY23
Timelines illustrative and not to scale.
9TRANSURBAN INVESTOR DAY | 29 APRIL 2019
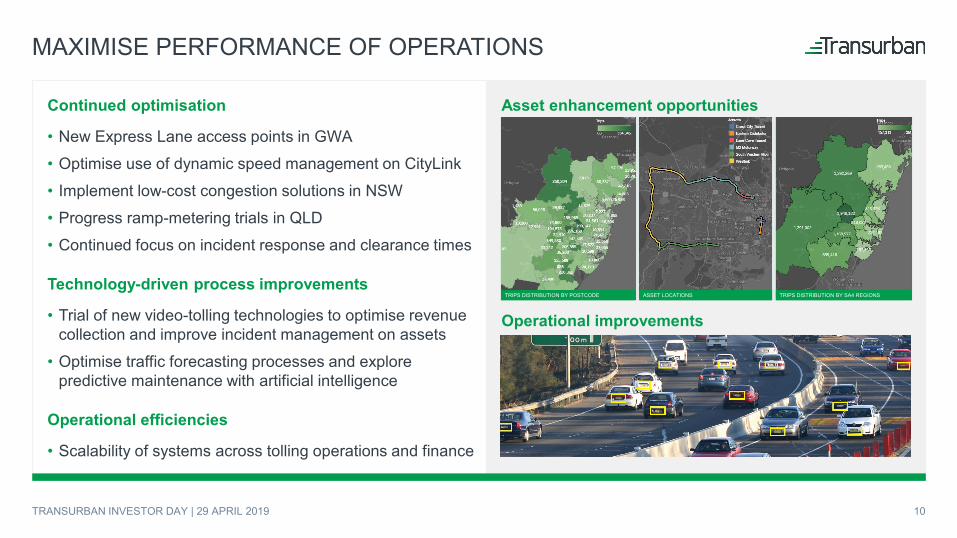
MAXIMISE PERFORMANCE OF OPERATIONS
Continued optimisation
• New Express Lane access points in GWA• Optimise use of dynamic speed management on CityLink• Implement low-cost congestion solutions in NSW• Progress ramp-metering trials in QLD• Continued focus on incident response and clearance times
Technology-driven process improvements
• Trial of new video-tolling technologies to optimise revenue collection and improve incident management on assets
• Optimise traffic forecasting processes and explore predictive maintenance with artificial intelligence
Operational efficiencies
• Scalability of systems across tolling operations and finance
Asset enhancement opportunities
Operational improvements
TRIPS DISTRIBUTION BY POSTCODE ASSET LOCATIONS TRIPS DISTRIBUTION BY SA4 REGIONS
10TRANSURBAN INVESTOR DAY | 29 APRIL 2019
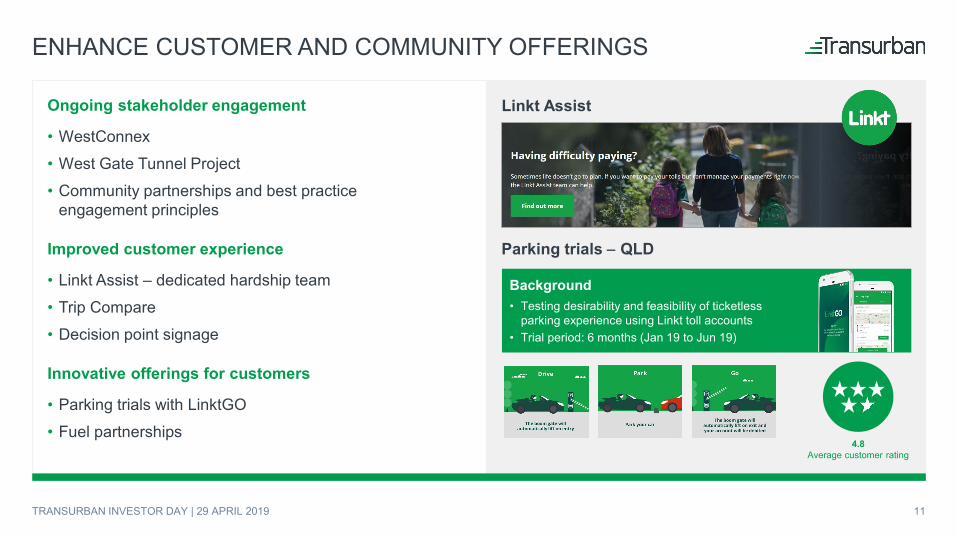
Ongoing stakeholder engagement
• WestConnex• West Gate Tunnel Project• Community partnerships and best practice
engagement principles
Improved customer experience
• Linkt Assist – dedicated hardship team• Trip Compare • Decision point signage
Innovative offerings for customers
• Parking trials with LinktGO• Fuel partnerships
ENHANCE CUSTOMER AND COMMUNITY OFFERINGS
Parking trials − QLD
Linkt Assist
Background• Testing desirability and feasibility of ticketless
parking experience using Linkt toll accounts• Trial period: 6 months (Jan 19 to Jun 19)
4.8Average customer rating
11TRANSURBAN INVESTOR DAY | 29 APRIL 2019
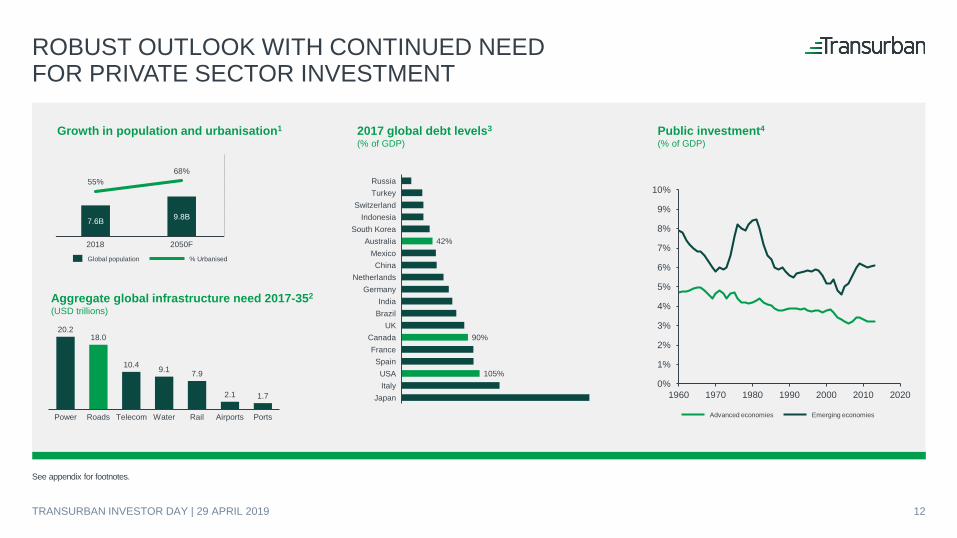
7.6B 9.8B
55%68%
0
5
10
15
20
0
20
40
60
80
100
2018 2050F
ROBUST OUTLOOK WITH CONTINUED NEED FOR PRIVATE SECTOR INVESTMENT
0%
1%
2%
3%
4%
5%
6%
7%
8%
9%
10%
1960 1970 1980 1990 2000 2010 2020
20.218.0
10.4 9.1 7.9
2.1 1.7
PortsRailPower Roads Telecom Water Airports
42%
90%
105%
Mexico
Switzerland
UK
TurkeyRussia
IndonesiaSouth Korea
Australia
China
Brazil
NetherlandsGermany
India
CanadaFrance
SpainUSAItaly
Japan
Advanced economies Emerging economies
Aggregate global infrastructure need 2017-352
(USD trillions)
2017 global debt levels3
(% of GDP)Public investment4
(% of GDP)
% UrbanisedGlobal population
Growth in population and urbanisation1
See appendix for footnotes.
TRANSURBAN INVESTOR DAY | 29 APRIL 2019 12
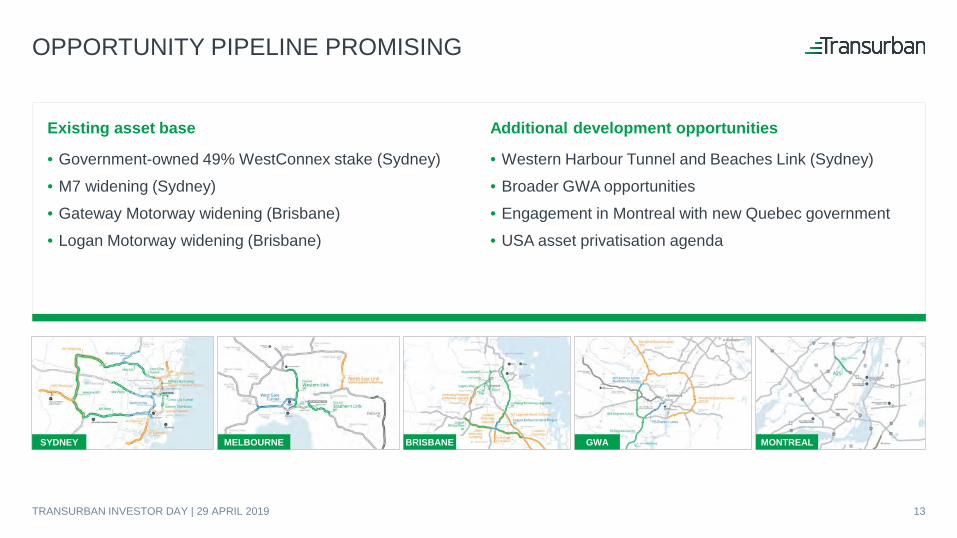
OPPORTUNITY PIPELINE PROMISING
Existing asset base
• Government-owned 49% WestConnex stake (Sydney)• M7 widening (Sydney)• Gateway Motorway widening (Brisbane)• Logan Motorway widening (Brisbane)
Additional development opportunities
• Western Harbour Tunnel and Beaches Link (Sydney)• Broader GWA opportunities• Engagement in Montreal with new Quebec government • USA asset privatisation agenda
SYDNEY MELBOURNE BRISBANE GWA MONTREAL
13TRANSURBAN INVESTOR DAY | 29 APRIL 2019
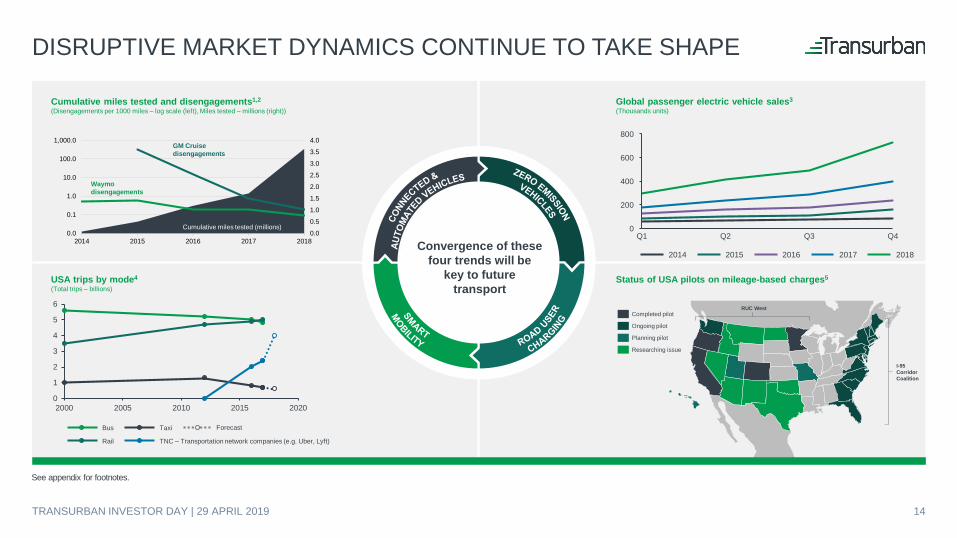
DISRUPTIVE MARKET DYNAMICS CONTINUE TO TAKE SHAPE
0
1
2
3
4
5
6
2000 2005 2010 2015 2020
200
400
0
600
800
Q3Q2Q1 Q4
20182014 20172015 2016
0.0
0.5
1.0
1.5
2.0
2.5
3.0
3.5
4.0
0.0
0.1
1.0
10.0
100.0
1,000.0
2014 2015 2016 2017 2018
Cumulative miles tested (millions)
Cumulative miles tested and disengagements1,2
(Disengagements per 1000 miles – log scale (left), Miles tested – millions (right))
GM Cruisedisengagements
Waymo disengagements
USA trips by mode4
(Total trips – billions)
Global passenger electric vehicle sales3
(Thousands units)
Status of USA pilots on mileage-based charges5
I-95 Corridor Coalition
RUC WestCompleted pilot
Ongoing pilot
Planning pilot
Researching issue
Convergence of thesefour trends will be
key to futuretransport
Bus
Rail
Taxi
TNC – Transportation network companies (e.g. Uber, Lyft)
See appendix for footnotes.
Forecast
14TRANSURBAN INVESTOR DAY | 29 APRIL 2019
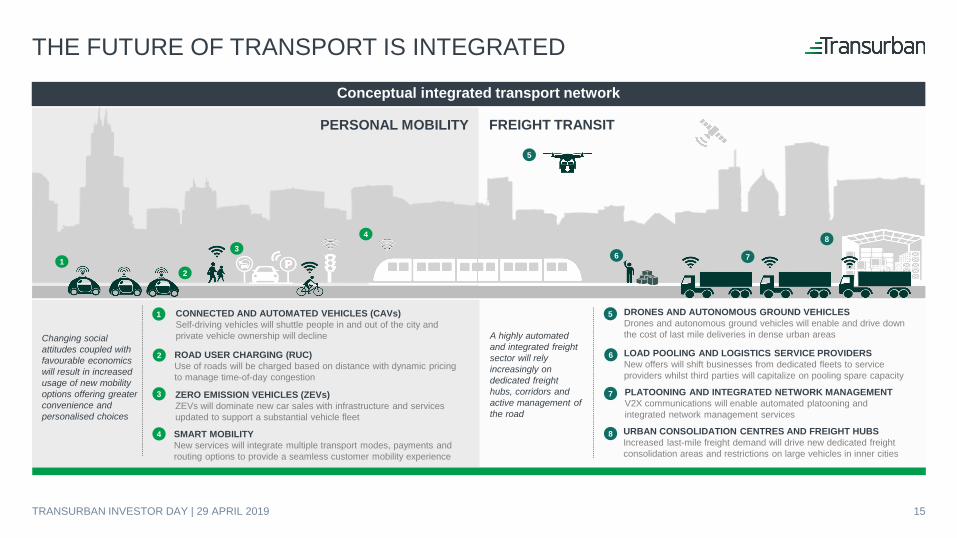
THE FUTURE OF TRANSPORT IS INTEGRATED
Conceptual integrated transport network
Changing social attitudes coupled with favourable economics will result in increased usage of new mobility options offering greater convenience and personalised choices
A highly automated and integrated freight sector will rely increasingly on dedicated freight hubs, corridors and active management of the road
1
2
3
4
CONNECTED AND AUTOMATED VEHICLES (CAVs)Self-driving vehicles will shuttle people in and out of the city and private vehicle ownership will decline
ROAD USER CHARGING (RUC)Use of roads will be charged based on distance with dynamic pricing to manage time-of-day congestion
ZERO EMISSION VEHICLES (ZEVs)ZEVs will dominate new car sales with infrastructure and services updated to support a substantial vehicle fleet
SMART MOBILITYNew services will integrate multiple transport modes, payments and routing options to provide a seamless customer mobility experience
5
6
7
8
PERSONAL MOBILITY FREIGHT TRANSIT
1
5
2
36
4
7
8
PLATOONING AND INTEGRATED NETWORK MANAGEMENTV2X communications will enable automated platooning and integrated network management services
DRONES AND AUTONOMOUS GROUND VEHICLESDrones and autonomous ground vehicles will enable and drive down the cost of last mile deliveries in dense urban areas
LOAD POOLING AND LOGISTICS SERVICE PROVIDERSNew offers will shift businesses from dedicated fleets to service providers whilst third parties will capitalize on pooling spare capacity
URBAN CONSOLIDATION CENTRES AND FREIGHT HUBSIncreased last-mile freight demand will drive new dedicated freight consolidation areas and restrictions on large vehicles in inner cities
TRANSURBAN INVESTOR DAY | 29 APRIL 2019 15
0%
50%
100%
2020 2025 2030 2035 2040
Traffic penetration not directly translatable to roadway capacity and demand effects
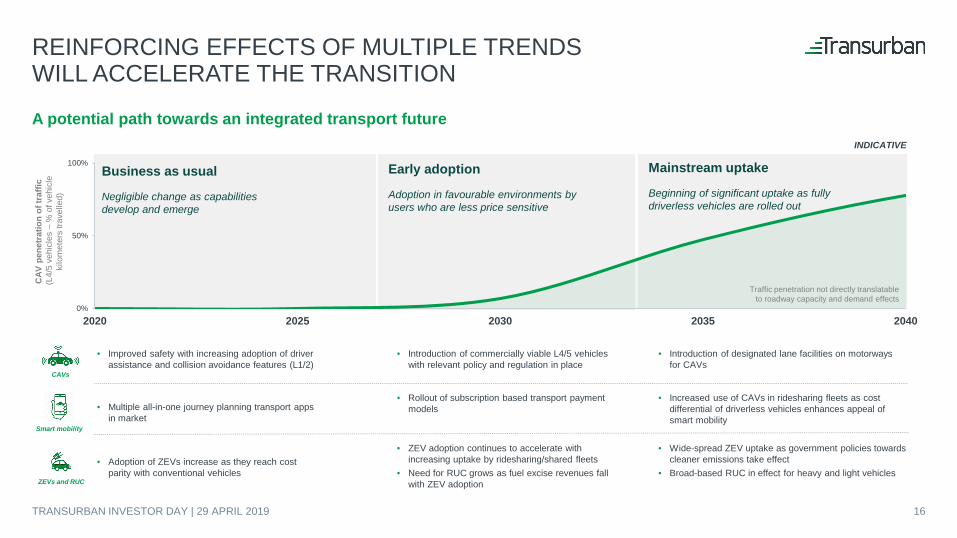
REINFORCING EFFECTS OF MULTIPLE TRENDS WILL ACCELERATE THE TRANSITION
CAV
pen
etra
tion
of tr
affic
(L4/
5 ve
hicl
es –
% o
f veh
icle
ki
lom
eter
s tra
velle
d)
A potential path towards an integrated transport futureINDICATIVE
Smart mobility
ZEVs and RUC
CAVs
• Multiple all-in-one journey planning transport apps in market
• Adoption of ZEVs increase as they reach cost parity with conventional vehicles
• Introduction of commercially viable L4/5 vehicles with relevant policy and regulation in place
• ZEV adoption continues to accelerate with increasing uptake by ridesharing/shared fleets
• Need for RUC grows as fuel excise revenues fall with ZEV adoption
• Rollout of subscription based transport payment models
• Wide-spread ZEV uptake as government policies towards cleaner emissions take effect
• Broad-based RUC in effect for heavy and light vehicles
Mainstream uptake
Beginning of significant uptake as fully driverless vehicles are rolled out
Early adoption
Adoption in favourable environments by users who are less price sensitive
Business as usual
Negligible change as capabilities develop and emerge
• Increased use of CAVs in ridesharing fleets as cost differential of driverless vehicles enhances appeal of smart mobility
• Introduction of designated lane facilities on motorways for CAVs
• Improved safety with increasing adoption of driver assistance and collision avoidance features (L1/2)
16TRANSURBAN INVESTOR DAY | 29 APRIL 2019
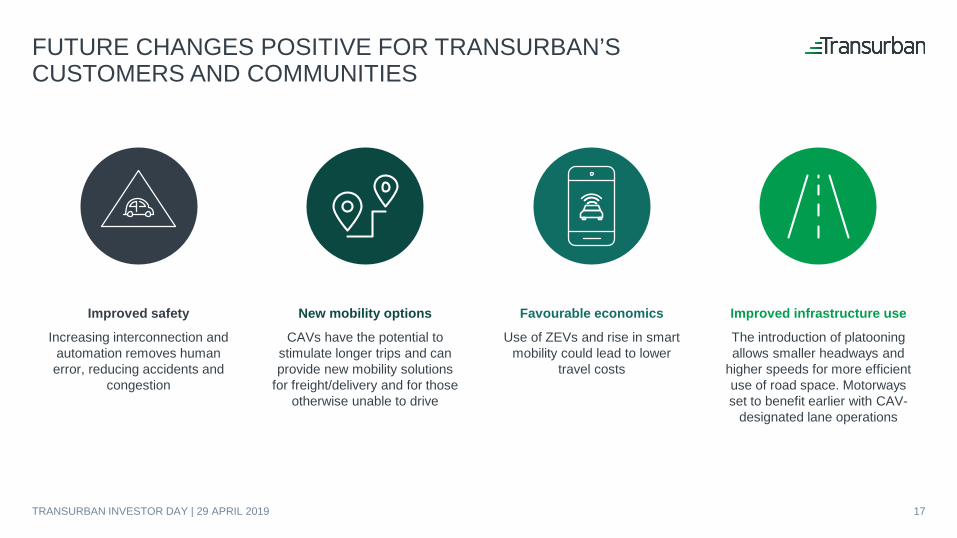
Improved safety
Increasing interconnection and automation removes human error, reducing accidents and
congestion
New mobility options
CAVs have the potential to stimulate longer trips and can provide new mobility solutions
for freight/delivery and for those otherwise unable to drive
Favourable economics
Use of ZEVs and rise in smart mobility could lead to lower
travel costs
Improved infrastructure use
The introduction of platooning allows smaller headways and
higher speeds for more efficient use of road space. Motorways set to benefit earlier with CAV-
designated lane operations
FUTURE CHANGES POSITIVE FOR TRANSURBAN’S CUSTOMERS AND COMMUNITIES
17TRANSURBAN INVESTOR DAY | 29 APRIL 2019
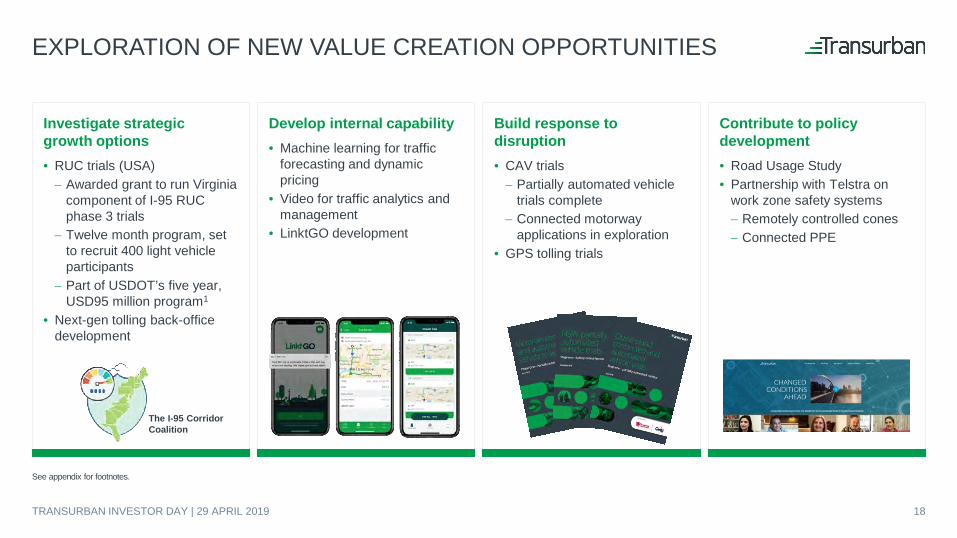
Build response to disruption • CAV trials− Partially automated vehicle
trials complete− Connected motorway
applications in exploration• GPS tolling trials
Investigate strategic growth options• RUC trials (USA)− Awarded grant to run Virginia
component of I-95 RUC phase 3 trials
− Twelve month program, set to recruit 400 light vehicle participants
− Part of USDOT’s five year, USD95 million program1
• Next-gen tolling back-office development
Develop internal capability• Machine learning for traffic
forecasting and dynamic pricing
• Video for traffic analytics and management
• LinktGO development
Contribute to policy development• Road Usage Study• Partnership with Telstra on
work zone safety systems − Remotely controlled cones− Connected PPE
EXPLORATION OF NEW VALUE CREATION OPPORTUNITIES
The I-95 Corridor Coalition
See appendix for footnotes.
18TRANSURBAN INVESTOR DAY | 29 APRIL 2019
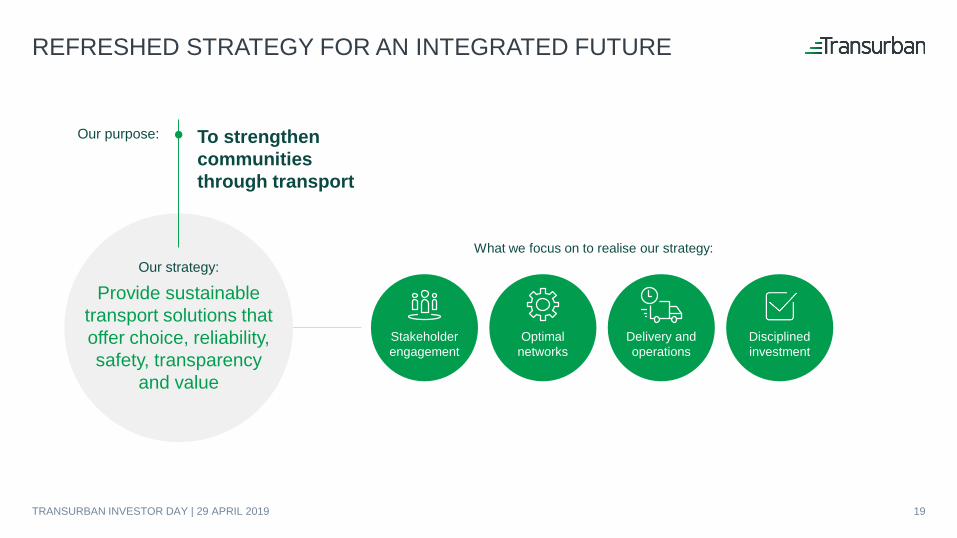
REFRESHED STRATEGY FOR AN INTEGRATED FUTURE
Our strategy:
Provide sustainable transport solutions that offer choice, reliability, safety, transparency
and value
Our purpose: To strengthen communities through transport
Stakeholder engagement
Optimal networks
Delivery and operations
Disciplinedinvestment
What we focus on to realise our strategy:
19TRANSURBAN INVESTOR DAY | 29 APRIL 2019
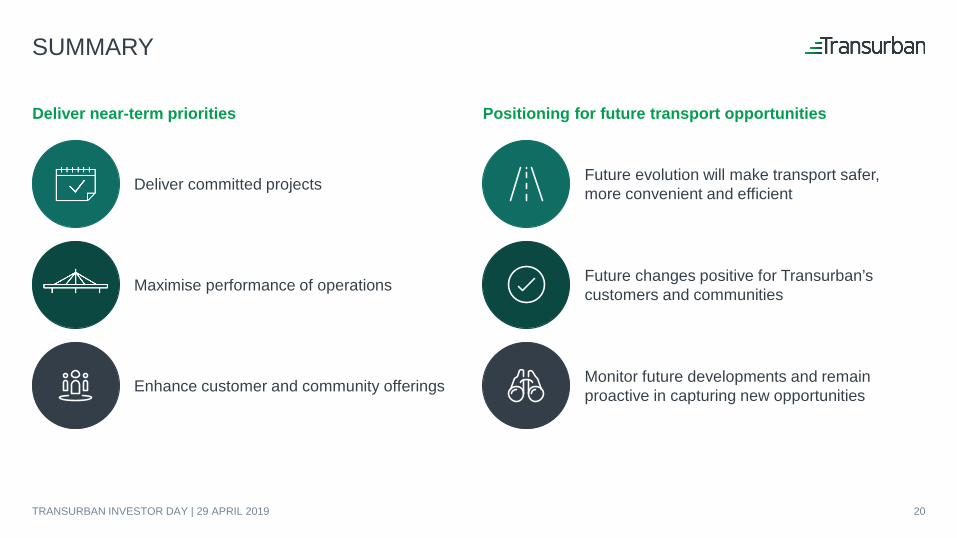
SUMMARY
Deliver near-term priorities
Deliver committed projects
Maximise performance of operations
Enhance customer and community offerings
Positioning for future transport opportunities
Future evolution will make transport safer, more convenient and efficient
Future changes positive for Transurban’s customers and communities
Monitor future developments and remain proactive in capturing new opportunities
20TRANSURBAN INVESTOR DAY | 29 APRIL 2019
AUTOMATED AND ZERO EMISSIONS
VEHICLES INFRASTRUCTURE
ADVICEDr Jonathan Spear | Executive Director
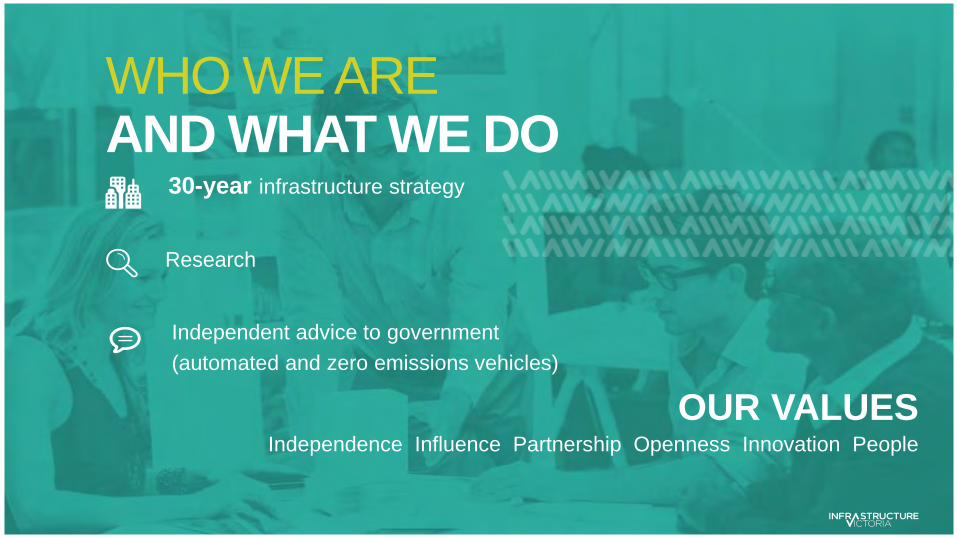
30-year infrastructure strategy
WHO WE ARE AND WHAT WE DO
Independence Influence Partnership Openness Innovation People
Research
Independent advice to government(automated and zero emissions vehicles)
OUR VALUES
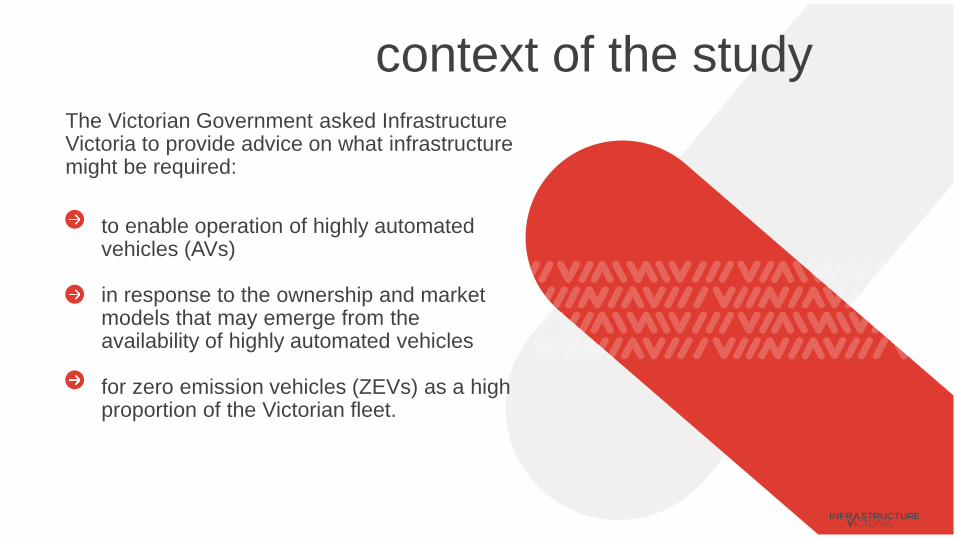
context of the studyThe Victorian Government asked Infrastructure Victoria to provide advice on what infrastructure might be required:
to enable operation of highly automated vehicles (AVs)
in response to the ownership and market models that may emerge from the availability of highly automated vehicles
for zero emission vehicles (ZEVs) as a high proportion of the Victorian fleet.
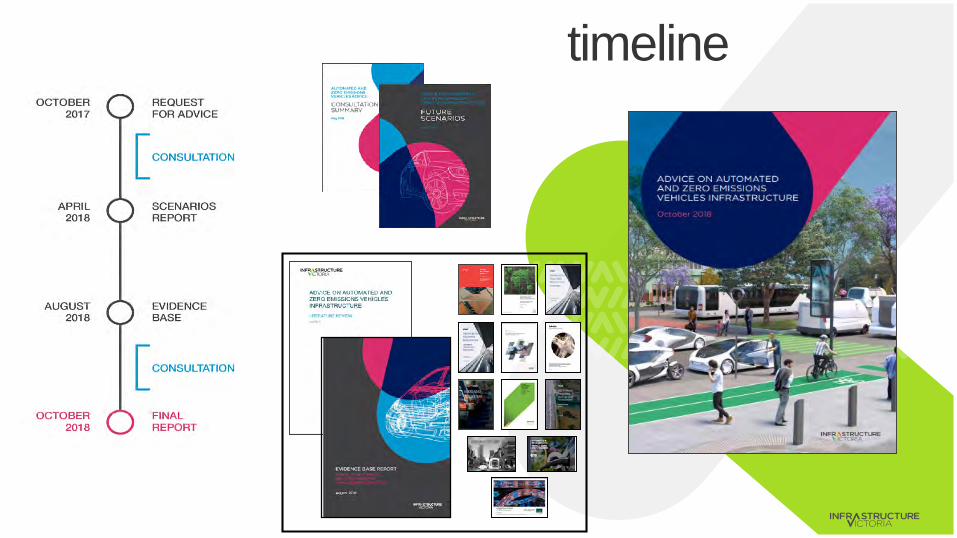
timeline
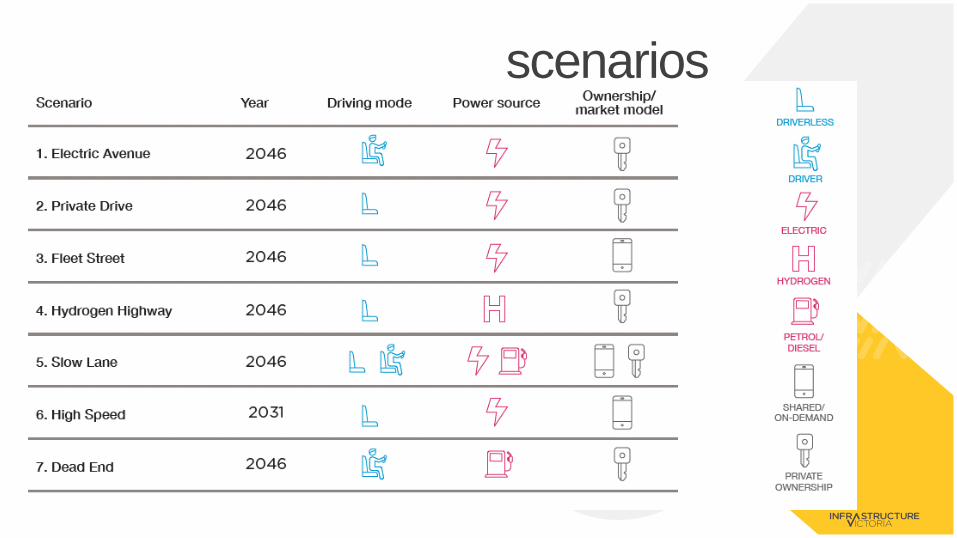
scenarios
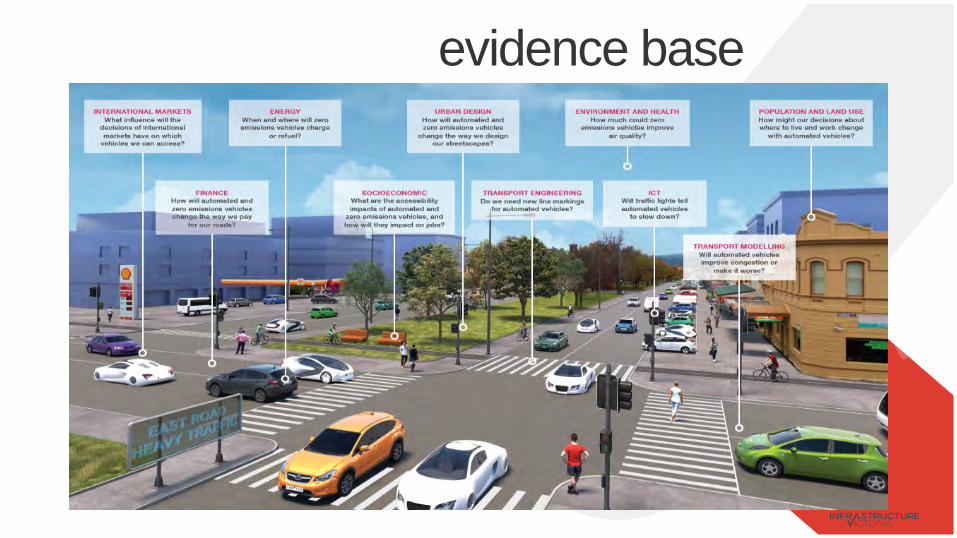
evidence base
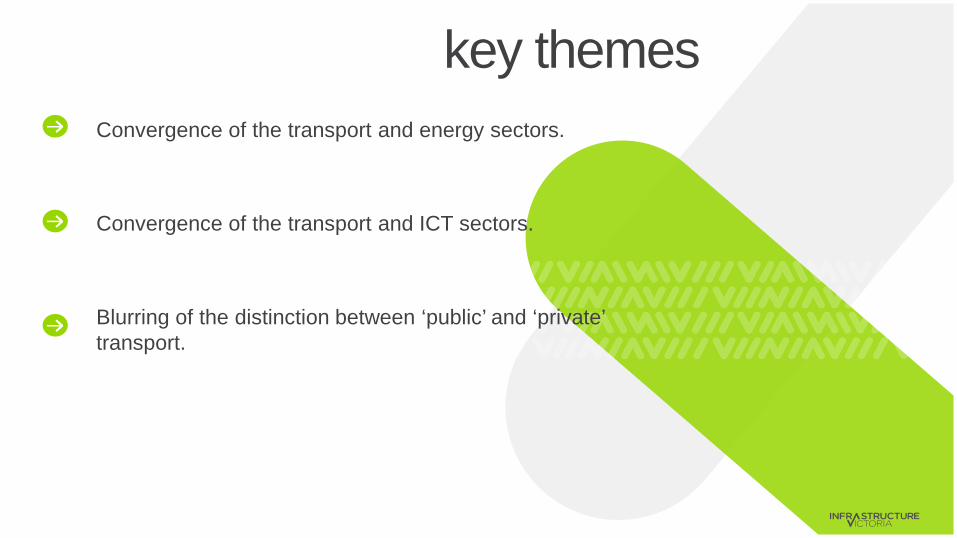
key themesConvergence of the transport and energy sectors.
Convergence of the transport and ICT sectors.
Blurring of the distinction between ‘public’ and ‘private’ transport.
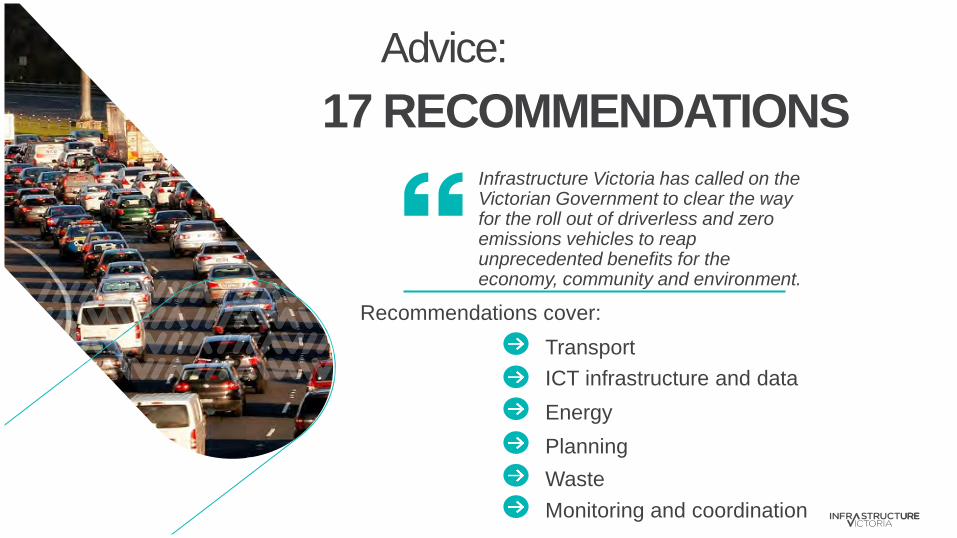
Transport
Infrastructure Victoria has called on the Victorian Government to clear the way for the roll out of driverless and zero emissions vehicles to reap unprecedented benefits for the economy, community and environment.
ICT infrastructure and data
Advice:17 RECOMMENDATIONS
Energy
Recommendations cover:
PlanningWasteMonitoring and coordination
Update Victoria's roads, including an audit of suitability for automated vehicles and evaluation of the impact of changing road network features (for example sign consistency, machine readability and placement; line quality, consistency and reflectivity).
Rethink road space, including proactively increasing pick-up and drop-off areas in and around public transport stations, activity centers and destinations.
Future-proof projects by incorporating real options to defer, stage, modify or cancel projects due to technology or demand change, review planned projects and seek low marginal cost opportunities that allow for future flexibility.
‘do now’ transport recommendations
Integrate on-demand and mobility as a service (including booking and payment systems) into the transport mix in preparation for automated vehicles.
Identify priority corridors for high quality cellular data coverage, based on need and demand, and monitor the market’s delivery of coverage in these areas as automated vehicles are adopted.
Expand the availability of open, real-time information on government-owned transport system data and establish principles for data sharing between government and commercial transport service providers.
‘do now’ ICT recommendations
Ensure regulatory frameworks governing energy network investment are flexible enough to facilitate investment in the transmission and distribution networks at the right times and places to support the uptake of zero emission vehicles.
Allow for incentives or other mechanisms (such as controlled charging services) to shift energy demand from peak periods.
Develop design standards for public EV charging infrastructure and principles for interoperability between charging providers.
‘do now’ energy recommendations
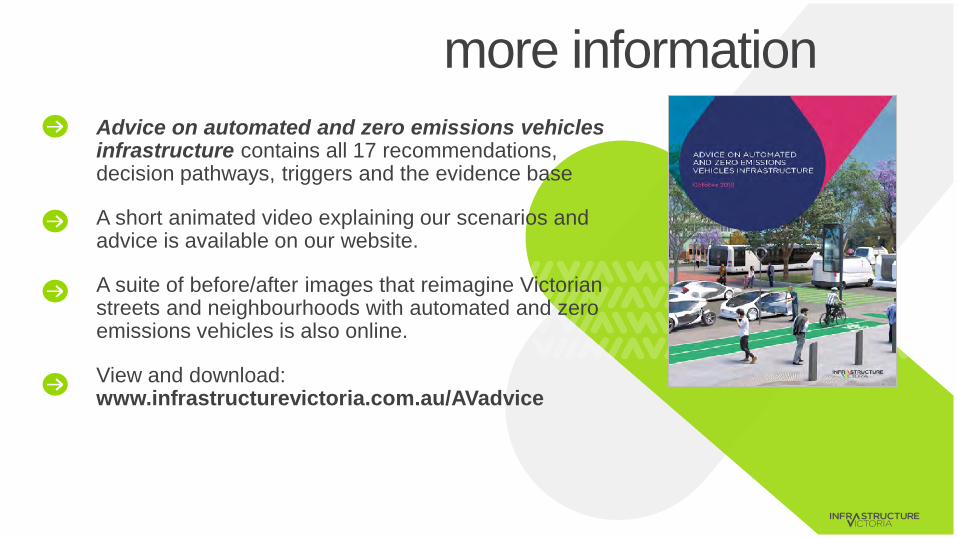
more informationAdvice on automated and zero emissions vehicles infrastructure contains all 17 recommendations, decision pathways, triggers and the evidence base
A short animated video explaining our scenarios and advice is available on our website.
A suite of before/after images that reimagine Victorian streets and neighbourhoods with automated and zero emissions vehicles is also online.
View and download: www.infrastructurevictoria.com.au/AVadvice

Keep [email protected]
phone
twitter@infravic
facebookfacebook.com/infrastructurevictoria
03 9936 1737
websiteinfrastructurevictoria.com.au/AVadvice

CAPITAL STRATEGYADAM WATSON – CFO

CAPITAL STRATEGY – BALANCING DISTRIBUTION GROWTH WITH LONG-TERM VALUE CREATION
MAINTAIN DISTRIBUTIONGROWTH
MAXIMISEEQUITY VALUE
STRONG INVESTMENT-GRADE CREDIT METRICS
TRANSURBAN INVESTOR DAY | 29 APRIL 2019 37
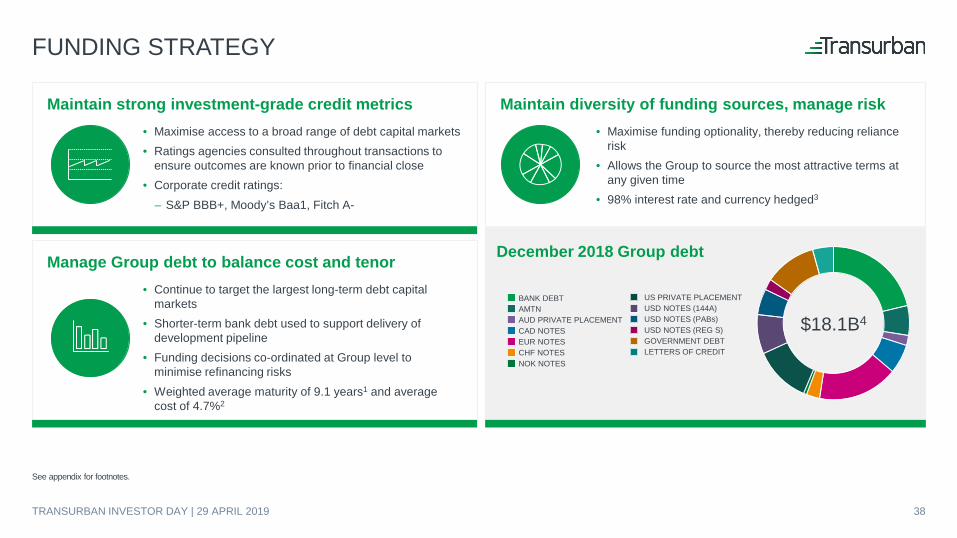
December 2018 Group debt
FUNDING STRATEGY
Maintain strong investment-grade credit metrics• Maximise access to a broad range of debt capital markets • Ratings agencies consulted throughout transactions to
ensure outcomes are known prior to financial close• Corporate credit ratings:
– S&P BBB+, Moody’s Baa1, Fitch A-
Manage Group debt to balance cost and tenor• Continue to target the largest long-term debt capital
markets• Shorter-term bank debt used to support delivery of
development pipeline• Funding decisions co-ordinated at Group level to
minimise refinancing risks• Weighted average maturity of 9.1 years1 and average
cost of 4.7%2
Maintain diversity of funding sources, manage risk• Maximise funding optionality, thereby reducing reliance
risk• Allows the Group to source the most attractive terms at
any given time• 98% interest rate and currency hedged3
$18.1B4
BANK DEBTAMTNAUD PRIVATE PLACEMENTCAD NOTESEUR NOTESCHF NOTESNOK NOTES
US PRIVATE PLACEMENTUSD NOTES (144A)USD NOTES (PABs)USD NOTES (REG S)GOVERNMENT DEBTLETTERS OF CREDIT
See appendix for footnotes.
TRANSURBAN INVESTOR DAY | 29 APRIL 2019 38
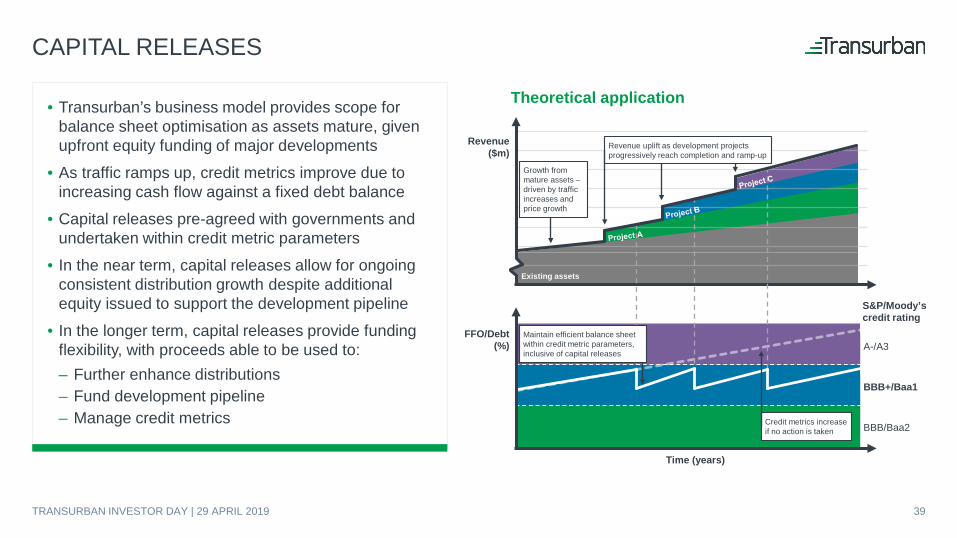
FFO/Debt(%)
BBB+/Baa1
BBB/Baa2
A-/A3
Time (years)
Credit metrics increase if no action is taken
Revenue($m)
Revenue uplift as development projects progressively reach completion and ramp-up
Growth from mature assets –driven by traffic increases and price growth
Existing assets
S&P/Moody’s credit rating
Maintain efficient balance sheet within credit metric parameters, inclusive of capital releases
• Transurban’s business model provides scope for balance sheet optimisation as assets mature, given upfront equity funding of major developments
• As traffic ramps up, credit metrics improve due to increasing cash flow against a fixed debt balance
• Capital releases pre-agreed with governments and undertaken within credit metric parameters
• In the near term, capital releases allow for ongoing consistent distribution growth despite additional equity issued to support the development pipeline
• In the longer term, capital releases provide funding flexibility, with proceeds able to be used to:– Further enhance distributions– Fund development pipeline– Manage credit metrics
CAPITAL RELEASES
Theoretical application
39TRANSURBAN INVESTOR DAY | 29 APRIL 2019
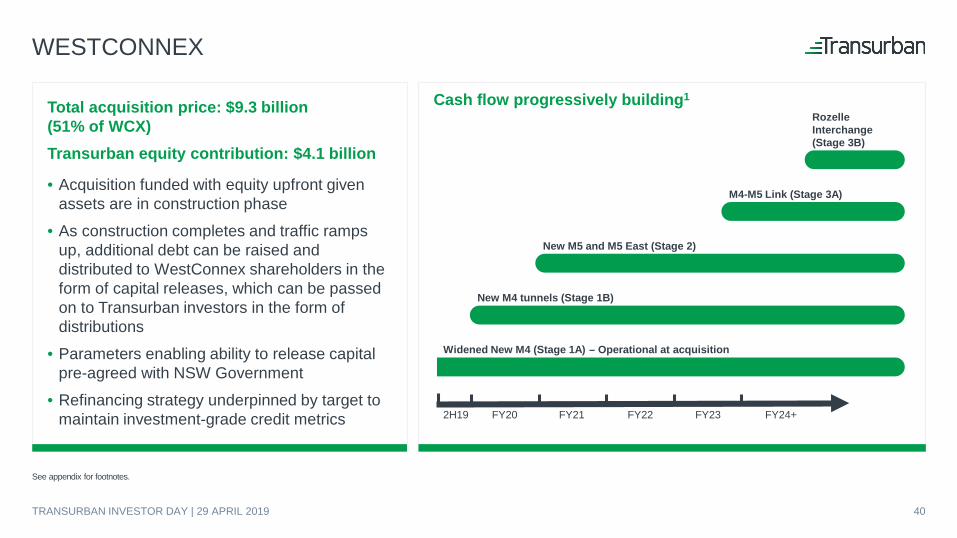
Cash flow progressively building1
WESTCONNEX
Total acquisition price: $9.3 billion(51% of WCX) Transurban equity contribution: $4.1 billion
• Acquisition funded with equity upfront given assets are in construction phase
• As construction completes and traffic ramps up, additional debt can be raised and distributed to WestConnex shareholders in the form of capital releases, which can be passed on to Transurban investors in the form of distributions
• Parameters enabling ability to release capital pre-agreed with NSW Government
• Refinancing strategy underpinned by target to maintain investment-grade credit metrics
M4-M5 Link (Stage 3A)
New M4 tunnels (Stage 1B)
New M5 and M5 East (Stage 2)
Rozelle Interchange (Stage 3B)
2H19 FY20 FY21 FY22 FY23 FY24+
Widened New M4 (Stage 1A) – Operational at acquisition
See appendix for footnotes.
TRANSURBAN INVESTOR DAY | 29 APRIL 2019 40
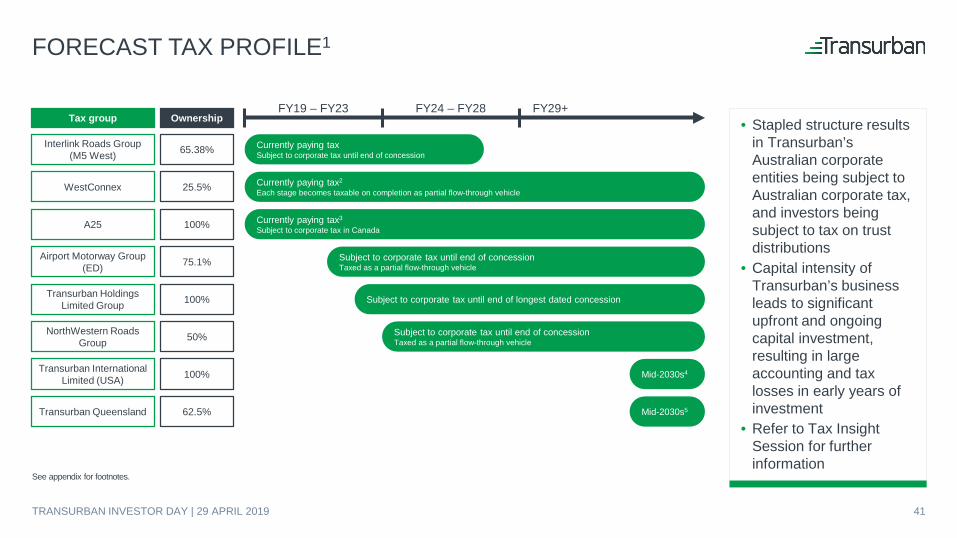
FORECAST TAX PROFILE1
Tax group Ownership
Interlink Roads Group (M5 West) 65.38%
WestConnex 25.5%
A25 100%
Airport Motorway Group (ED) 75.1%
Transurban Holdings Limited Group 100%
NorthWestern Roads Group 50%
Transurban International Limited (USA) 100%
Transurban Queensland 62.5%
FY19 – FY23 FY24 – FY28 • Stapled structure results
in Transurban’s Australian corporate entities being subject to Australian corporate tax, and investors being subject to tax on trust distributions
• Capital intensity of Transurban’s business leads to significant upfront and ongoing capital investment, resulting in large accounting and tax losses in early years of investment
• Refer to Tax Insight Session for further information
FY29+
See appendix for footnotes.
Currently paying taxSubject to corporate tax until end of concession
Currently paying tax2
Each stage becomes taxable on completion as partial flow-through vehicle
Currently paying tax3
Subject to corporate tax in Canada
Subject to corporate tax until end of concessionTaxed as a partial flow-through vehicle
Subject to corporate tax until end of longest dated concession
Subject to corporate tax until end of concessionTaxed as a partial flow-through vehicle
Mid-2030s4
Mid-2030s5
TRANSURBAN INVESTOR DAY | 29 APRIL 2019 41
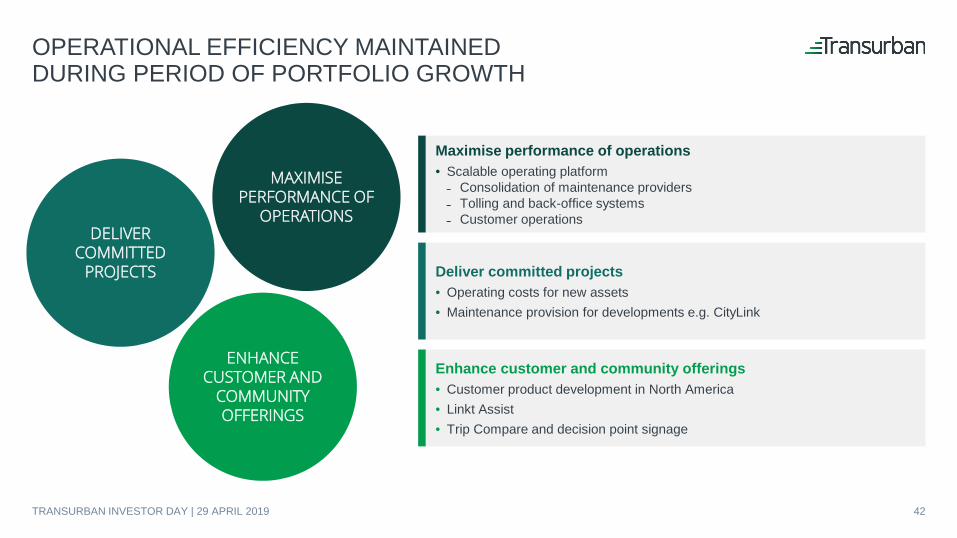
OPERATIONAL EFFICIENCY MAINTAINED DURING PERIOD OF PORTFOLIO GROWTH
Maximise performance of operations• Scalable operating platform Consolidation of maintenance providers Tolling and back-office systems Customer operations
Enhance customer and community offerings• Customer product development in North America• Linkt Assist• Trip Compare and decision point signage
Deliver committed projects• Operating costs for new assets• Maintenance provision for developments e.g. CityLink
MAXIMISEPERFORMANCE OF
OPERATIONSDELIVER
COMMITTEDPROJECTS
ENHANCE CUSTOMER AND
COMMUNITY OFFERINGS
TRANSURBAN INVESTOR DAY | 29 APRIL 2019 42
PROJECT DELIVERYTONY ADAMS – GROUP EXECUTIVE,
PROJECT DELIVERY
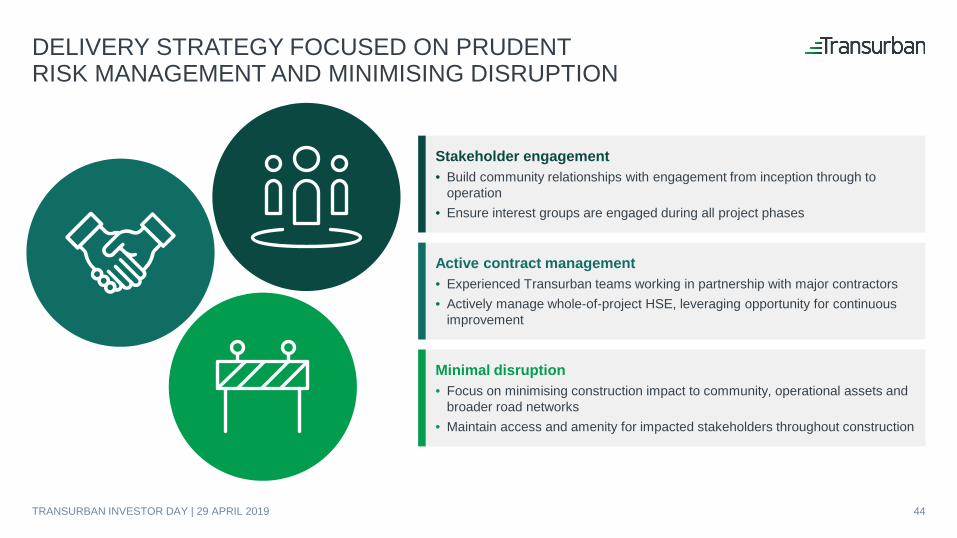
DELIVERY STRATEGY FOCUSED ON PRUDENT RISK MANAGEMENT AND MINIMISING DISRUPTION
Stakeholder engagement• Build community relationships with engagement from inception through to
operation • Ensure interest groups are engaged during all project phases
Minimal disruption• Focus on minimising construction impact to community, operational assets and
broader road networks• Maintain access and amenity for impacted stakeholders throughout construction
Active contract management• Experienced Transurban teams working in partnership with major contractors• Actively manage whole-of-project HSE, leveraging opportunity for continuous
improvement
TRANSURBAN INVESTOR DAY | 29 APRIL 2019 44
TRANSURBAN APPROACH TO DELIVER DEVELOPMENT PIPELINE
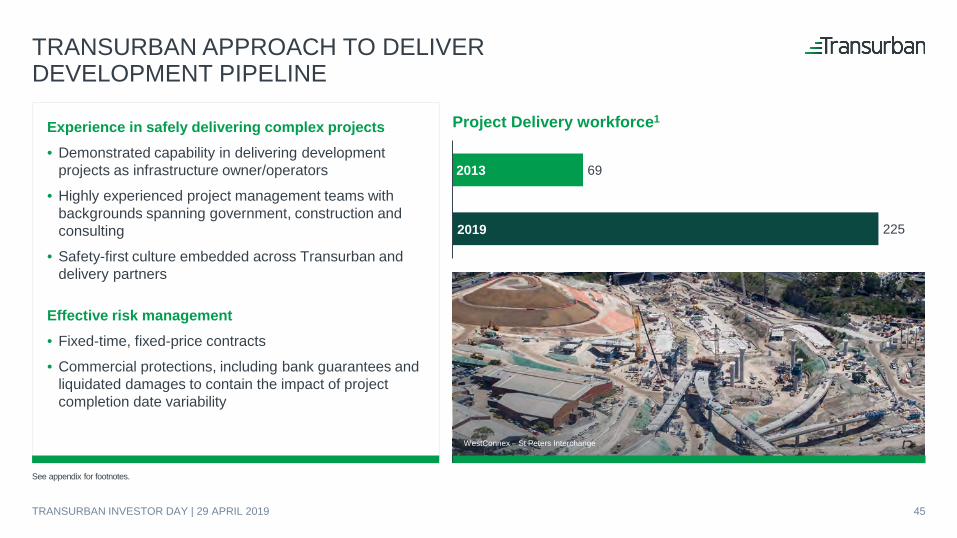
WestConnex – St Peters Interchange
Experience in safely delivering complex projects• Demonstrated capability in delivering development
projects as infrastructure owner/operators
• Highly experienced project management teams with backgrounds spanning government, construction and consulting
• Safety-first culture embedded across Transurban and delivery partners
Effective risk management• Fixed-time, fixed-price contracts
• Commercial protections, including bank guarantees and liquidated damages to contain the impact of project completion date variability
69
225
Project Delivery workforce1
2013
2019
See appendix for footnotes.
TRANSURBAN INVESTOR DAY | 29 APRIL 2019 45
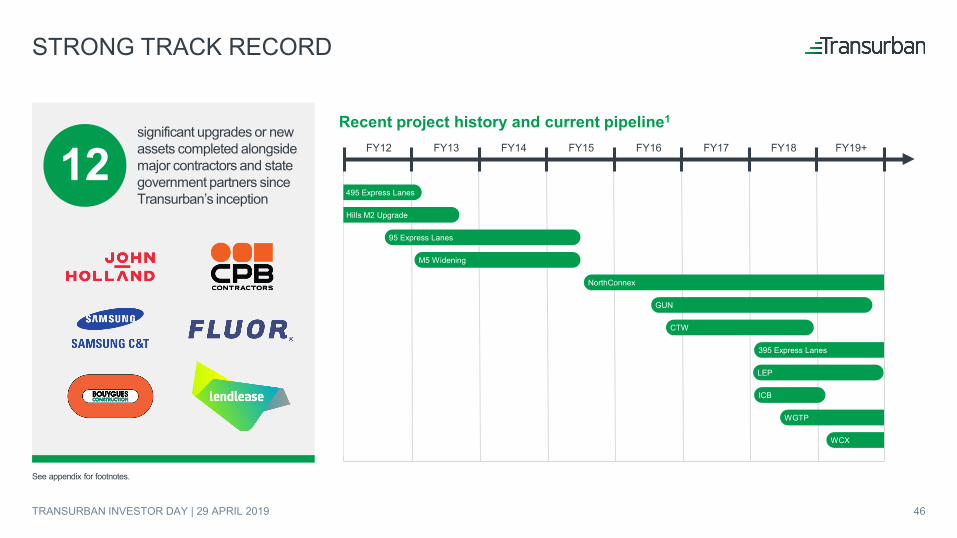
STRONG TRACK RECORD
Recent project history and current pipeline1significant upgrades or new assets completed alongside major contractors and state government partners since Transurban’s inception
12 FY13
M5 Widening
NorthConnex
ICB
FY19+FY15 FY16 FY17 FY18FY14FY12
GUN
95 Express Lanes
WGTP
395 Express Lanes
LEP
WCX
CTW
Hills M2 Upgrade
495 Express Lanes
See appendix for footnotes.
TRANSURBAN INVESTOR DAY | 29 APRIL 2019 46
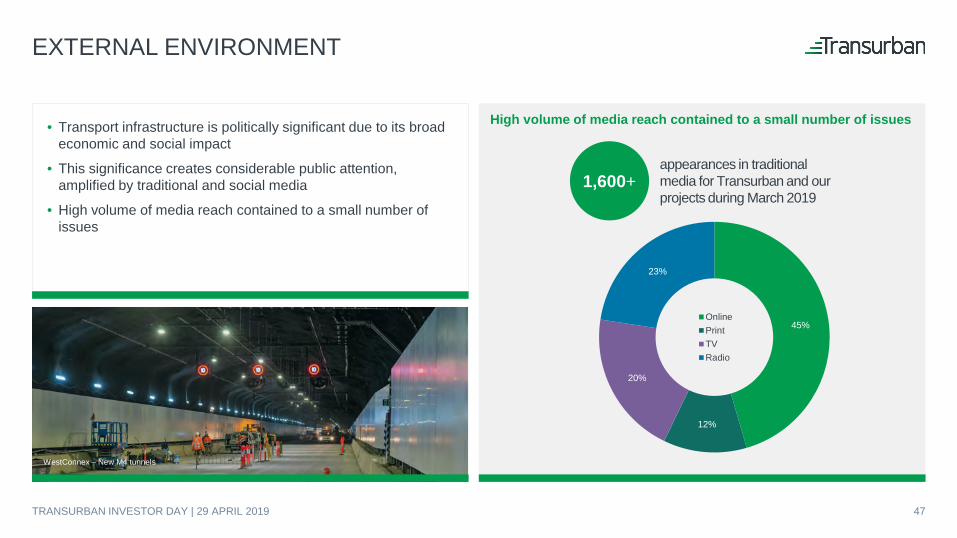
High volume of media reach contained to a small number of issues
EXTERNAL ENVIRONMENT
• Transport infrastructure is politically significant due to its broad economic and social impact
• This significance creates considerable public attention, amplified by traditional and social media
• High volume of media reach contained to a small number of issues
45%
12%
20%
23%
OnlinePrintTVRadio
appearances in traditional media for Transurban and our projects during March 2019
1,600+
WestConnex – New M4 tunnels
TRANSURBAN INVESTOR DAY | 29 APRIL 2019 47
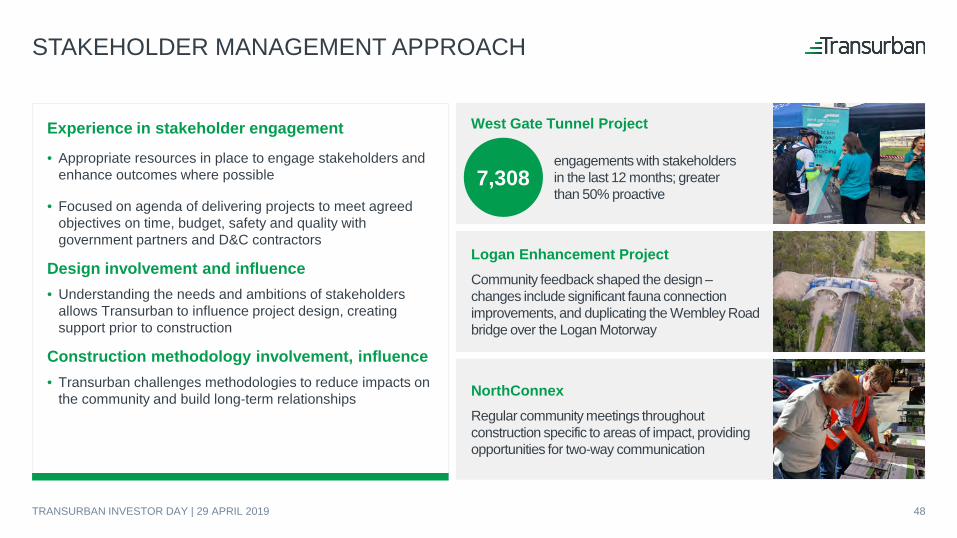
STAKEHOLDER MANAGEMENT APPROACH
Experience in stakeholder engagement
• Appropriate resources in place to engage stakeholders and enhance outcomes where possible
• Focused on agenda of delivering projects to meet agreed objectives on time, budget, safety and quality with government partners and D&C contractors
Design involvement and influence• Understanding the needs and ambitions of stakeholders
allows Transurban to influence project design, creating support prior to construction
Construction methodology involvement, influence• Transurban challenges methodologies to reduce impacts on
the community and build long-term relationships
Logan Enhancement ProjectCommunity feedback shaped the design –changes include significant fauna connection improvements, and duplicating the Wembley Road bridge over the Logan Motorway
NorthConnexRegular community meetings throughout construction specific to areas of impact, providing opportunities for two-way communication
West Gate Tunnel Project
engagements with stakeholders in the last 12 months; greater than 50% proactive
7,308
TRANSURBAN INVESTOR DAY | 29 APRIL 2019 48
WESTCONNEXANDREW HEAD – CEO, WESTCONNEX
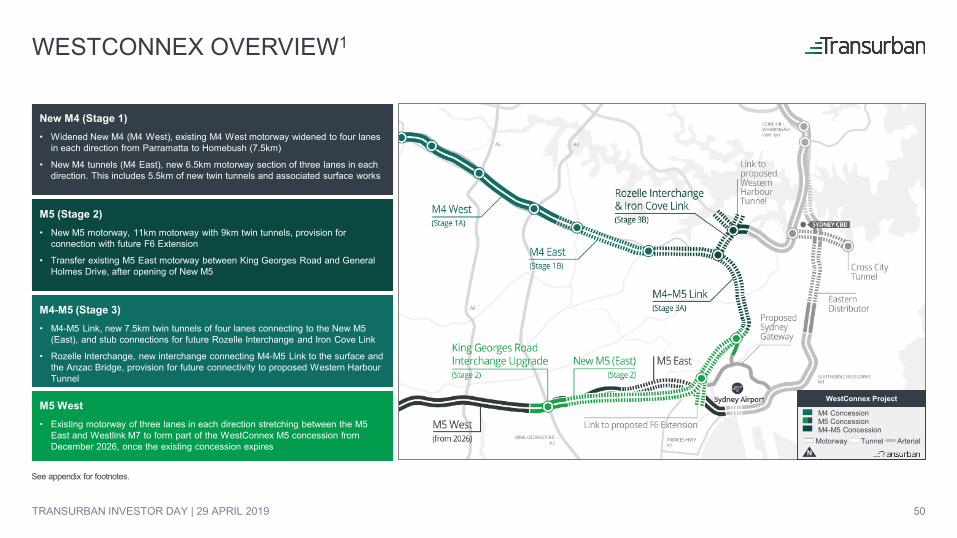
WESTCONNEX OVERVIEW1
M4 ConcessionM5 Concession
Motorway Tunnel ArterialN
M4-M5 Concession
WestConnex Project
New M4 (Stage 1)• Widened New M4 (M4 West), existing M4 West motorway widened to four lanes
in each direction from Parramatta to Homebush (7.5km)
• New M4 tunnels (M4 East), new 6.5km motorway section of three lanes in each direction. This includes 5.5km of new twin tunnels and associated surface works
M5 (Stage 2)• New M5 motorway, 11km motorway with 9km twin tunnels, provision for
connection with future F6 Extension
• Transfer existing M5 East motorway between King Georges Road and General Holmes Drive, after opening of New M5
M4-M5 (Stage 3)• M4-M5 Link, new 7.5km twin tunnels of four lanes connecting to the New M5
(East), and stub connections for future Rozelle Interchange and Iron Cove Link
• Rozelle Interchange, new interchange connecting M4-M5 Link to the surface and the Anzac Bridge, provision for future connectivity to proposed Western Harbour Tunnel
M5 West• Existing motorway of three lanes in each direction stretching between the M5
East and Westlink M7 to form part of the WestConnex M5 concession from December 2026, once the existing concession expires
See appendix for footnotes.
TRANSURBAN INVESTOR DAY | 29 APRIL 2019 50
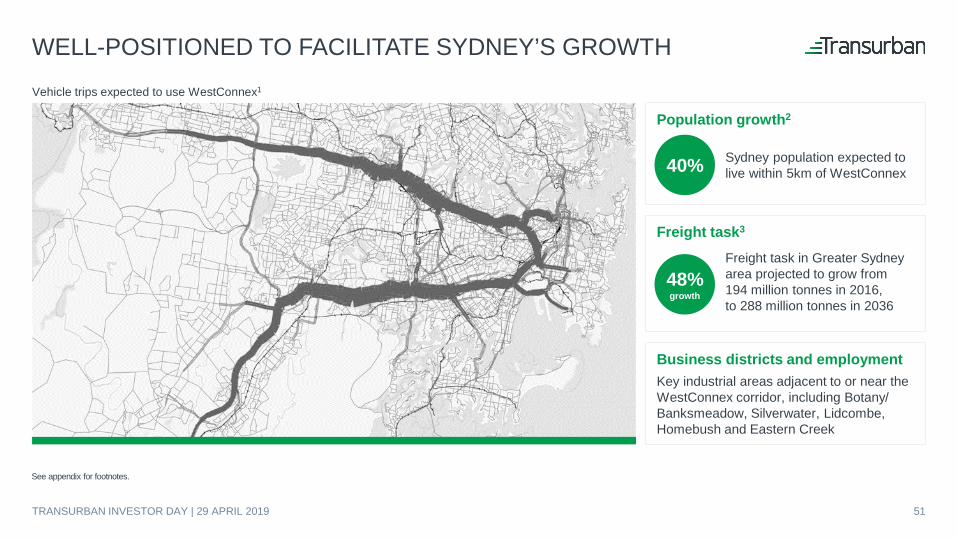
WELL-POSITIONED TO FACILITATE SYDNEY’S GROWTH
Sydney population expected tolive within 5km of WestConnex40%
Population growth2
Freight task3
Business districts and employmentKey industrial areas adjacent to or near the WestConnex corridor, including Botany/ Banksmeadow, Silverwater, Lidcombe, Homebush and Eastern Creek
Freight task in Greater Sydney area projected to grow from 194 million tonnes in 2016,to 288 million tonnes in 2036
48%growth
Vehicle trips expected to use WestConnex1
See appendix for footnotes.
TRANSURBAN INVESTOR DAY | 29 APRIL 2019 51
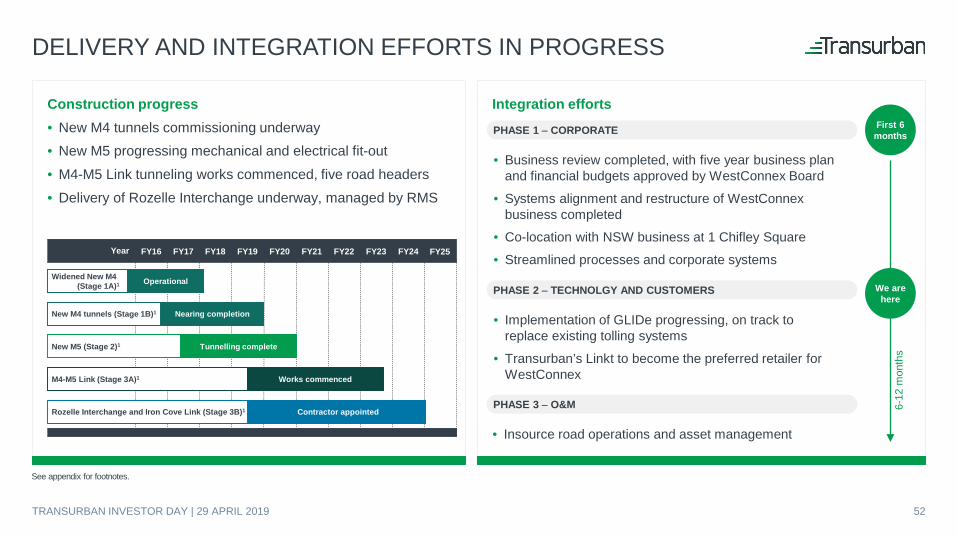
Construction progress• New M4 tunnels commissioning underway• New M5 progressing mechanical and electrical fit-out• M4-M5 Link tunneling works commenced, five road headers • Delivery of Rozelle Interchange underway, managed by RMS
DELIVERY AND INTEGRATION EFFORTS IN PROGRESS
Integration efforts
OperationalWidened New M4 (Stage 1A)1
Works commencedM4-M5 Link (Stage 3A)1
FY16 FY17 FY18 FY19 FY20 FY21 FY22 FY23 FY24
Contractor appointedRozelle Interchange and Iron Cove Link (Stage 3B)1
Year FY25
Nearing completionNew M4 tunnels (Stage 1B)1
Tunnelling completeNew M5 (Stage 2)1
PHASE 1 − CORPORATE First 6 months
PHASE 2 − TECHNOLGY AND CUSTOMERS We are here
PHASE 3 − O&M 6-12
mon
ths
• Business review completed, with five year business plan and financial budgets approved by WestConnex Board
• Systems alignment and restructure of WestConnex business completed
• Co-location with NSW business at 1 Chifley Square
• Streamlined processes and corporate systems
• Implementation of GLIDe progressing, on track to replace existing tolling systems
• Transurban’s Linkt to become the preferred retailer for WestConnex
• Insource road operations and asset management
See appendix for footnotes.
TRANSURBAN INVESTOR DAY | 29 APRIL 2019 52
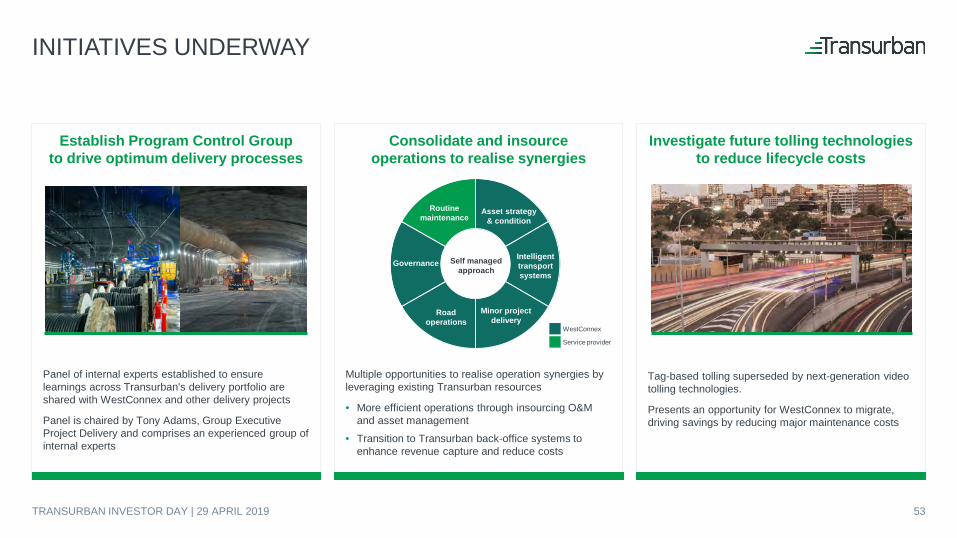
INITIATIVES UNDERWAY
Establish Program Control Groupto drive optimum delivery processes
Investigate future tolling technologies to reduce lifecycle costs
Tag-based tolling superseded by next-generation video tolling technologies.
Presents an opportunity for WestConnex to migrate, driving savings by reducing major maintenance costs
Panel of internal experts established to ensure learnings across Transurban's delivery portfolio are shared with WestConnex and other delivery projects
Panel is chaired by Tony Adams, Group Executive Project Delivery and comprises an experienced group of internal experts
Consolidate and insourceoperations to realise synergies
Multiple opportunities to realise operation synergies by leveraging existing Transurban resources
• More efficient operations through insourcing O&M and asset management
• Transition to Transurban back-office systems to enhance revenue capture and reduce costs
Self managed approach
Asset strategy & condition
Intelligent transport systems
Minor project delivery
Road operations
Governance
Routine maintenance
WestConnex
Service provider
TRANSURBAN INVESTOR DAY | 29 APRIL 2019 53
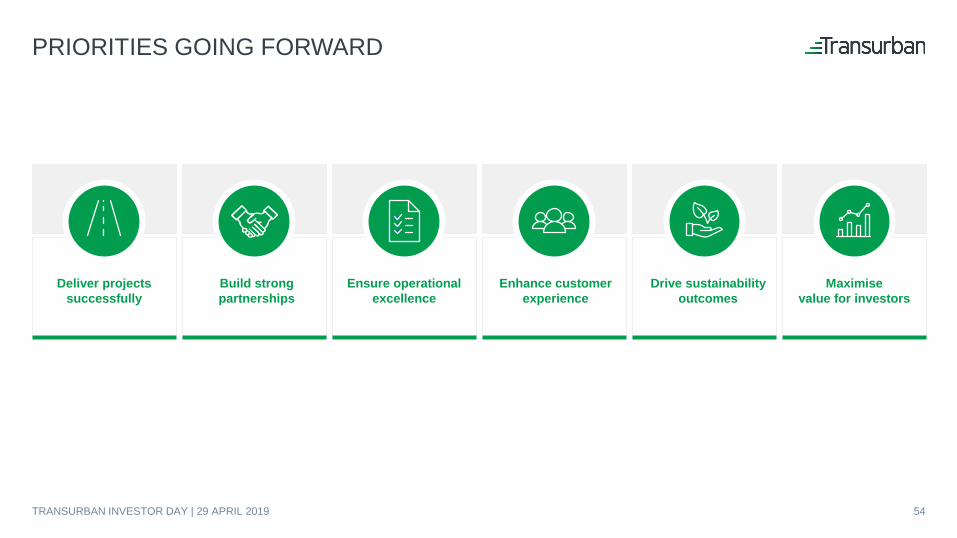
PRIORITIES GOING FORWARD
Ensure operational excellence
Deliver projects successfully
Enhance customer experience
Drive sustainabilityoutcomes
Build strong partnerships
Maximise value for investors
TRANSURBAN INVESTOR DAY | 29 APRIL 2019 54
NORTH AMERICA DEVELOPMENT
JENNIFER AUMENT – PRESIDENT NORTH AMERICA
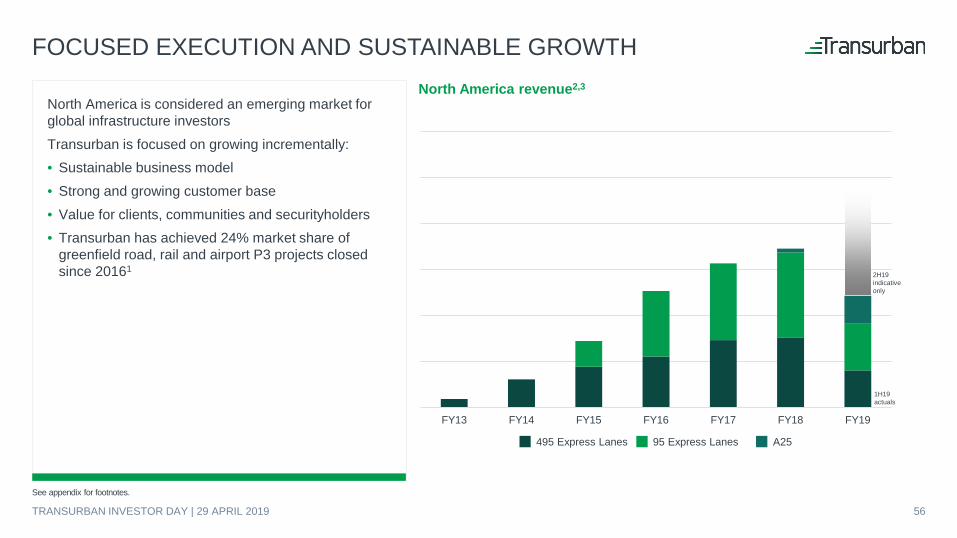
FOCUSED EXECUTION AND SUSTAINABLE GROWTH
North America is considered an emerging market for global infrastructure investors Transurban is focused on growing incrementally:• Sustainable business model• Strong and growing customer base• Value for clients, communities and securityholders• Transurban has achieved 24% market share of
greenfield road, rail and airport P3 projects closed since 20161
North America revenue2,3
See appendix for footnotes.
FY13 FY14 FY15 FY16 FY17 FY18 FY19
495 Express Lanes 95 Express Lanes A25
2H19 indicative only
1H19 actuals
TRANSURBAN INVESTOR DAY | 29 APRIL 2019 56
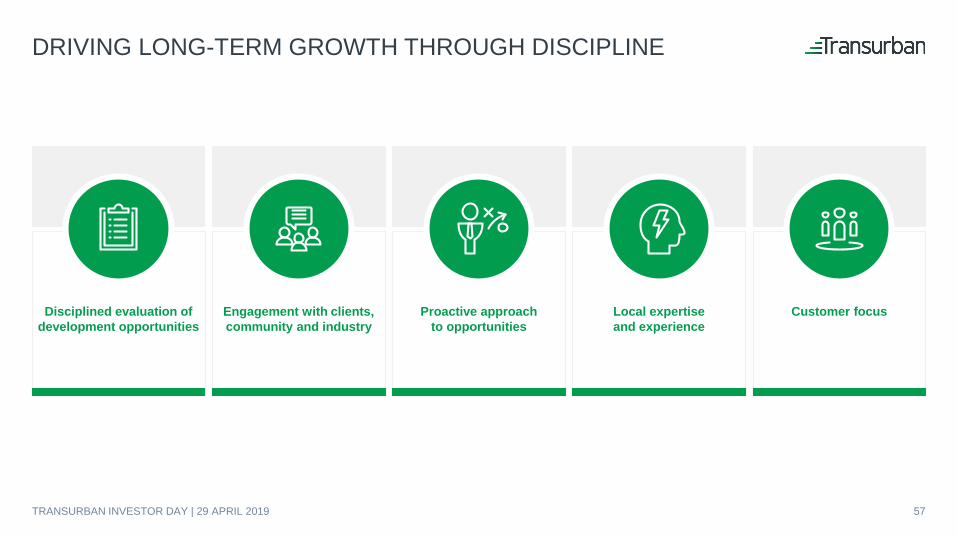
Disciplined evaluation ofdevelopment opportunities
Engagement with clients, community and industry
Proactive approach to opportunities
Local expertiseand experience
Customer focus
DRIVING LONG-TERM GROWTH THROUGH DISCIPLINE
TRANSURBAN INVESTOR DAY | 29 APRIL 2019 57
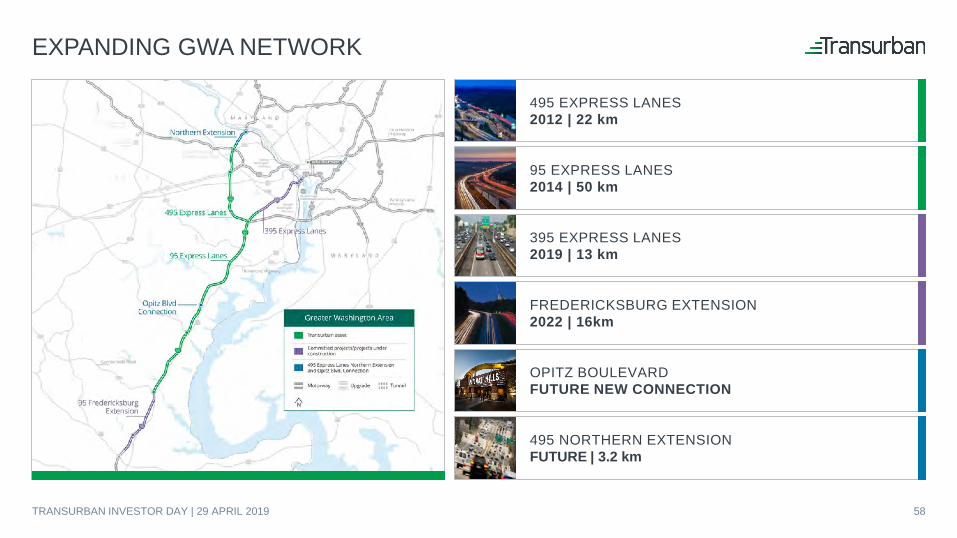
EXPANDING GWA NETWORK
495 NORTHERN EXTENSIONFUTURE | 3.2 km
OPITZ BOULEVARDFUTURE NEW CONNECTION
FREDERICKSBURG EXTENSION2022 | 16km
395 EXPRESS LANES2019 | 13 km
95 EXPRESS LANES2014 | 50 km
495 EXPRESS LANES2012 | 22 km
58TRANSURBAN INVESTOR DAY | 29 APRIL 2019
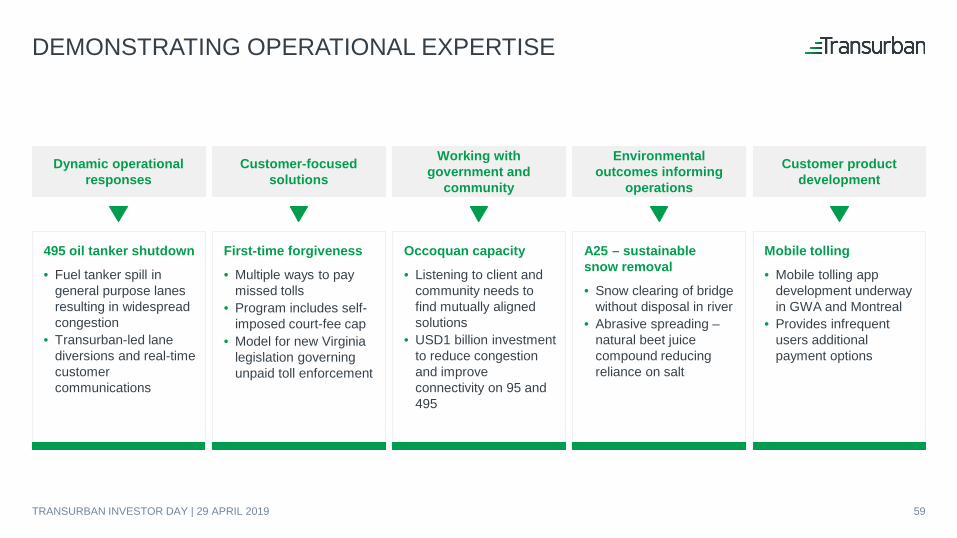
DEMONSTRATING OPERATIONAL EXPERTISE
Customer product development
Dynamic operational responses
Customer-focusedsolutions
Working with government and
community
Environmental outcomes informing
operations
495 oil tanker shutdown
• Fuel tanker spill in general purpose lanes resulting in widespread congestion
• Transurban-led lane diversions and real-time customer communications
First-time forgiveness
• Multiple ways to pay missed tolls
• Program includes self-imposed court-fee cap
• Model for new Virginia legislation governing unpaid toll enforcement
Occoquan capacity
• Listening to client and community needs to find mutually aligned solutions
• USD1 billion investment to reduce congestion and improve connectivity on 95 and 495
A25 – sustainablesnow removal
• Snow clearing of bridge without disposal in river
• Abrasive spreading –natural beet juice compound reducing reliance on salt
Mobile tolling
• Mobile tolling app development underway in GWA and Montreal
• Provides infrequent users additional payment options
59TRANSURBAN INVESTOR DAY | 29 APRIL 2019
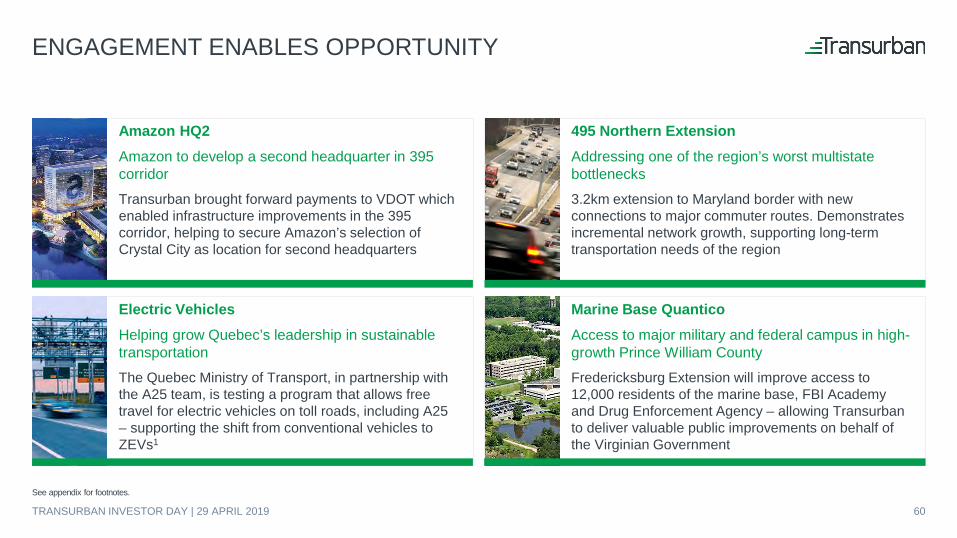
ENGAGEMENT ENABLES OPPORTUNITY
Amazon HQ2Amazon to develop a second headquarter in 395 corridorTransurban brought forward payments to VDOT which enabled infrastructure improvements in the 395 corridor, helping to secure Amazon’s selection of Crystal City as location for second headquarters
495 Northern ExtensionAddressing one of the region’s worst multistate bottlenecks 3.2km extension to Maryland border with new connections to major commuter routes. Demonstrates incremental network growth, supporting long-term transportation needs of the region
Electric VehiclesHelping grow Quebec’s leadership in sustainable transportationThe Quebec Ministry of Transport, in partnership with the A25 team, is testing a program that allows free travel for electric vehicles on toll roads, including A25 – supporting the shift from conventional vehicles to ZEVs1
Marine Base QuanticoAccess to major military and federal campus in high-growth Prince William CountyFredericksburg Extension will improve access to 12,000 residents of the marine base, FBI Academy and Drug Enforcement Agency – allowing Transurban to deliver valuable public improvements on behalf of the Virginian Government
See appendix for footnotes.
60TRANSURBAN INVESTOR DAY | 29 APRIL 2019
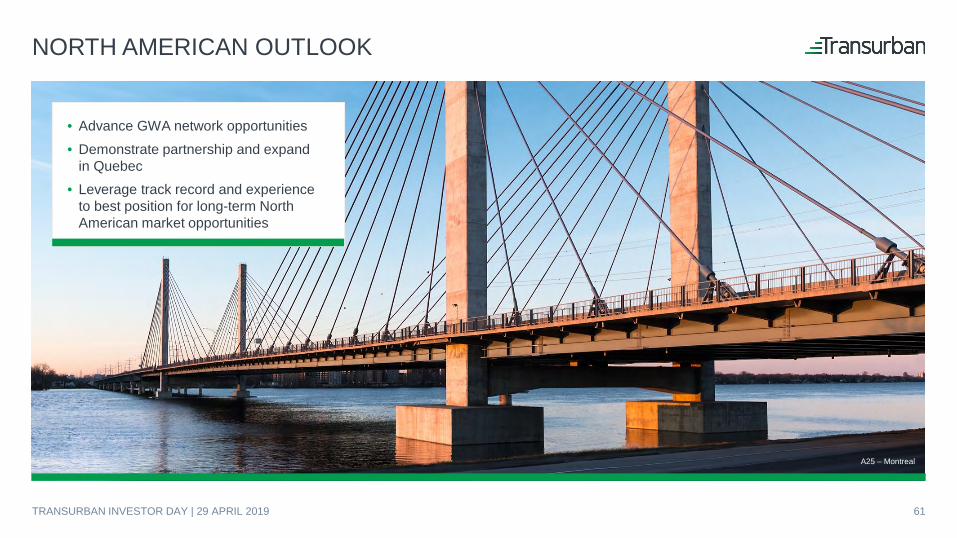
NORTH AMERICAN OUTLOOK
• Advance GWA network opportunities• Demonstrate partnership and expand
in Quebec• Leverage track record and experience
to best position for long-term North American market opportunities
A25 – Montreal
61TRANSURBAN INVESTOR DAY | 29 APRIL 2019

SUPPLEMENTARY INFORMATION
TAX INSIGHT SESSIONSHASHI SIVAYOGANATHAN – PRINCIPAL TAX ADVISOR
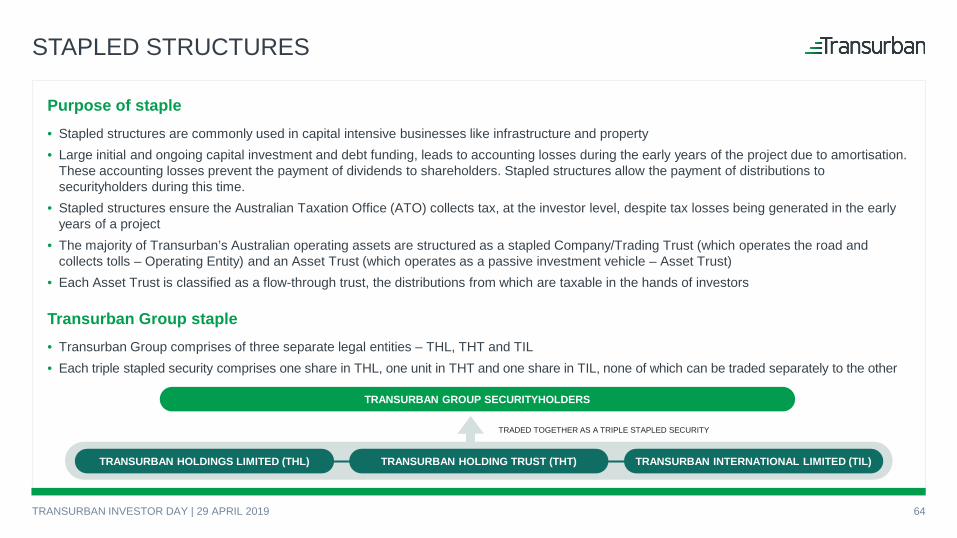
Purpose of staple• Stapled structures are commonly used in capital intensive businesses like infrastructure and property• Large initial and ongoing capital investment and debt funding, leads to accounting losses during the early years of the project due to amortisation.
These accounting losses prevent the payment of dividends to shareholders. Stapled structures allow the payment of distributions to securityholders during this time.
• Stapled structures ensure the Australian Taxation Office (ATO) collects tax, at the investor level, despite tax losses being generated in the early years of a project
• The majority of Transurban’s Australian operating assets are structured as a stapled Company/Trading Trust (which operates the road and collects tolls – Operating Entity) and an Asset Trust (which operates as a passive investment vehicle – Asset Trust)
• Each Asset Trust is classified as a flow-through trust, the distributions from which are taxable in the hands of investors
Transurban Group staple• Transurban Group comprises of three separate legal entities – THL, THT and TIL• Each triple stapled security comprises one share in THL, one unit in THT and one share in TIL, none of which can be traded separately to the other
STAPLED STRUCTURES
TRANSURBAN GROUP SECURITYHOLDERS
TRANSURBAN HOLDINGS LIMITED (THL) TRANSURBAN HOLDING TRUST (THT) TRANSURBAN INTERNATIONAL LIMITED (TIL)
TRADED TOGETHER AS A TRIPLE STAPLED SECURITY
64TRANSURBAN INVESTOR DAY | 29 APRIL 2019
TAX TREATMENT OF STAPLE
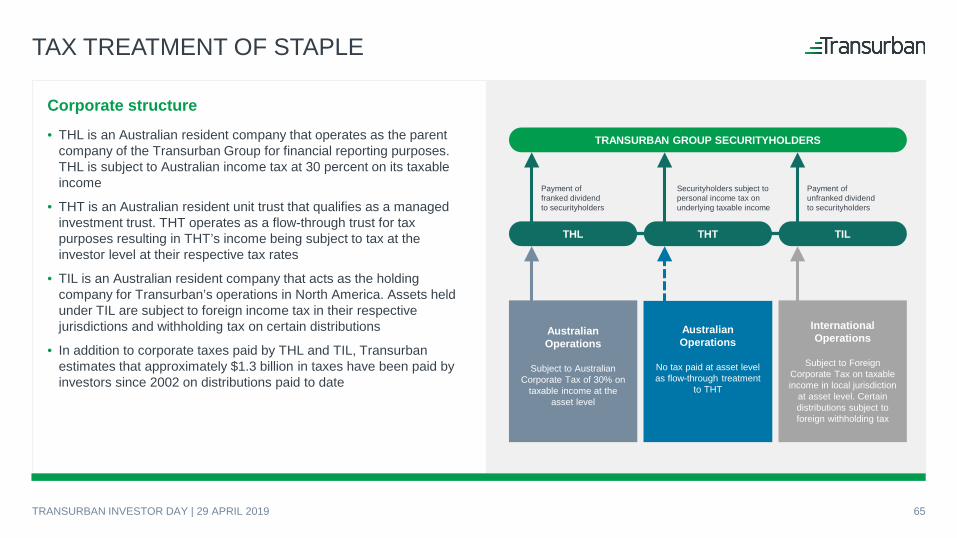
Corporate structure
• THL is an Australian resident company that operates as the parent company of the Transurban Group for financial reporting purposes. THL is subject to Australian income tax at 30 percent on its taxable income
• THT is an Australian resident unit trust that qualifies as a managed investment trust. THT operates as a flow-through trust for tax purposes resulting in THT’s income being subject to tax at the investor level at their respective tax rates
• TIL is an Australian resident company that acts as the holding company for Transurban’s operations in North America. Assets held under TIL are subject to foreign income tax in their respective jurisdictions and withholding tax on certain distributions
• In addition to corporate taxes paid by THL and TIL, Transurban estimates that approximately $1.3 billion in taxes have been paid by investors since 2002 on distributions paid to date
TRANSURBAN GROUP SECURITYHOLDERS
THL TILTHT
Payment of franked dividend to securityholders
Securityholders subject to personal income tax on underlying taxable income
Payment of unfranked dividend to securityholders
AustralianOperations
Subject to Australian Corporate Tax of 30% on
taxable income at the asset level
AustralianOperations
No tax paid at asset level as flow-through treatment
to THT
International Operations
Subject to Foreign Corporate Tax on taxable income in local jurisdiction
at asset level. Certain distributions subject to foreign withholding tax
65TRANSURBAN INVESTOR DAY | 29 APRIL 2019
TAX TREATMENT OF STAPLE
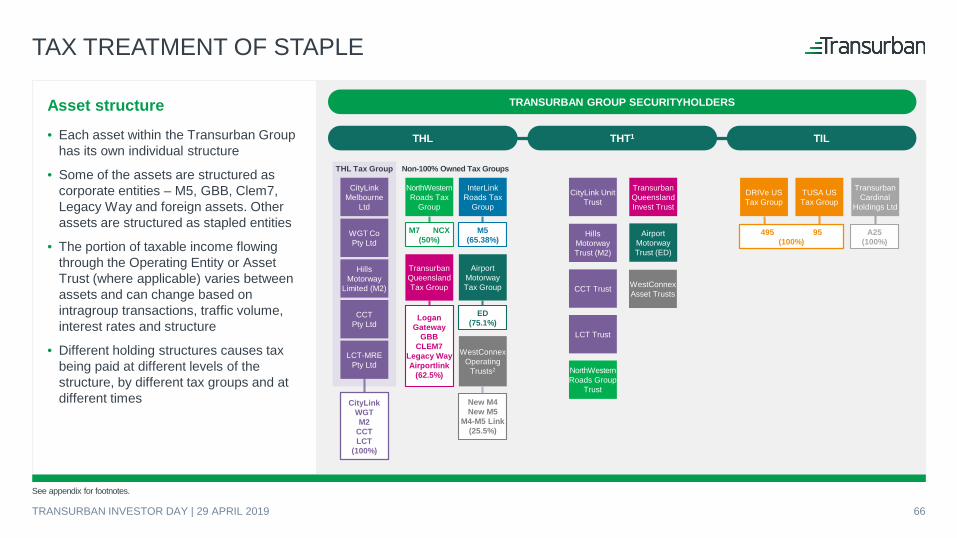
Asset structure• Each asset within the Transurban Group
has its own individual structure
• Some of the assets are structured as corporate entities – M5, GBB, Clem7, Legacy Way and foreign assets. Other assets are structured as stapled entities
• The portion of taxable income flowing through the Operating Entity or Asset Trust (where applicable) varies between assets and can change based on intragroup transactions, traffic volume, interest rates and structure
• Different holding structures causes tax being paid at different levels of the structure, by different tax groups and at different times
TRANSURBAN GROUP SECURITYHOLDERS
THL TILTHT1
Non-100% Owned Tax GroupsTHL Tax Group
DRIVe US Tax Group
TUSA US Tax Group
Transurban Cardinal
Holdings Ltd
CityLink Melbourne
Ltd
WGT CoPty Ltd
Hills Motorway
Limited (M2)
CCTPty Ltd
LCT-MRE Pty Ltd
CityLinkWGTM2
CCTLCT
(100%)
NorthWestern Roads Tax
Group
M7 NCX (50%)
Transurban Queensland Tax Group
LoganGateway
GBBCLEM7
Legacy WayAirportlink
(62.5%)
InterLinkRoads Tax
Group
M5 (65.38%)
Airport Motorway Tax Group
ED (75.1%)
WestConnex Operating
Trusts2
New M4New M5
M4-M5 Link(25.5%)
CityLink Unit Trust
Hills Motorway Trust (M2)
CCT Trust
LCT Trust
NorthWestern Roads Group
Trust
Transurban Queensland Invest Trust
Airport Motorway Trust (ED)
WestConnex Asset Trusts
495 95(100%)
A25 (100%)
See appendix for footnotes.
66TRANSURBAN INVESTOR DAY | 29 APRIL 2019
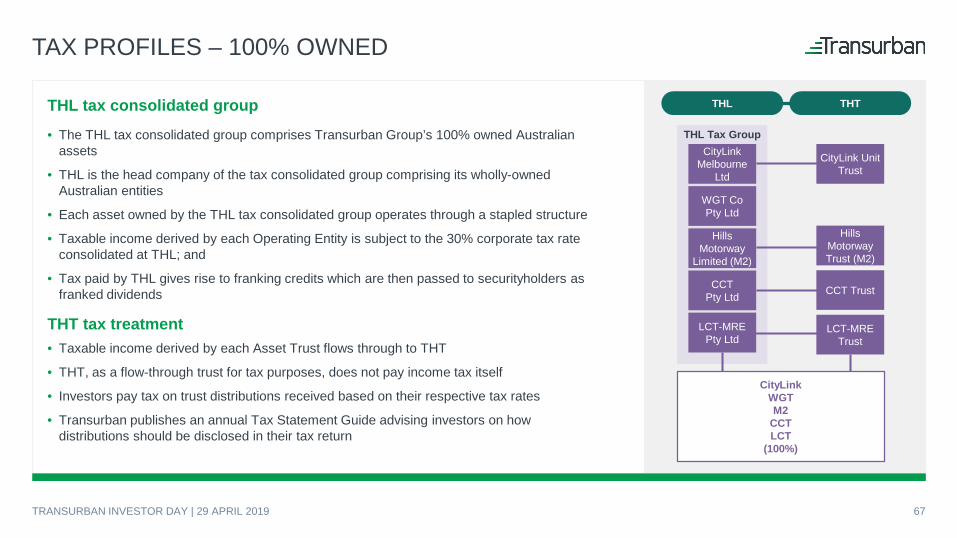
THL tax consolidated group• The THL tax consolidated group comprises Transurban Group’s 100% owned Australian
assets
• THL is the head company of the tax consolidated group comprising its wholly-owned Australian entities
• Each asset owned by the THL tax consolidated group operates through a stapled structure
• Taxable income derived by each Operating Entity is subject to the 30% corporate tax rate consolidated at THL; and
• Tax paid by THL gives rise to franking credits which are then passed to securityholders as franked dividends
THT tax treatment• Taxable income derived by each Asset Trust flows through to THT
• THT, as a flow-through trust for tax purposes, does not pay income tax itself
• Investors pay tax on trust distributions received based on their respective tax rates
• Transurban publishes an annual Tax Statement Guide advising investors on how distributions should be disclosed in their tax return
TAX PROFILES – 100% OWNED
THL THT
THL Tax GroupCityLink
MelbourneLtd
WGT CoPty Ltd
HillsMotorway
Limited (M2)
CCTPty Ltd
LCT-MREPty Ltd
CityLink Unit Trust
HillsMotorway Trust (M2)
CCT Trust
LCT-MRE Trust
CityLinkWGTM2
CCTLCT
(100%)
67TRANSURBAN INVESTOR DAY | 29 APRIL 2019
TAX PROFILES – NON-100% OWNED
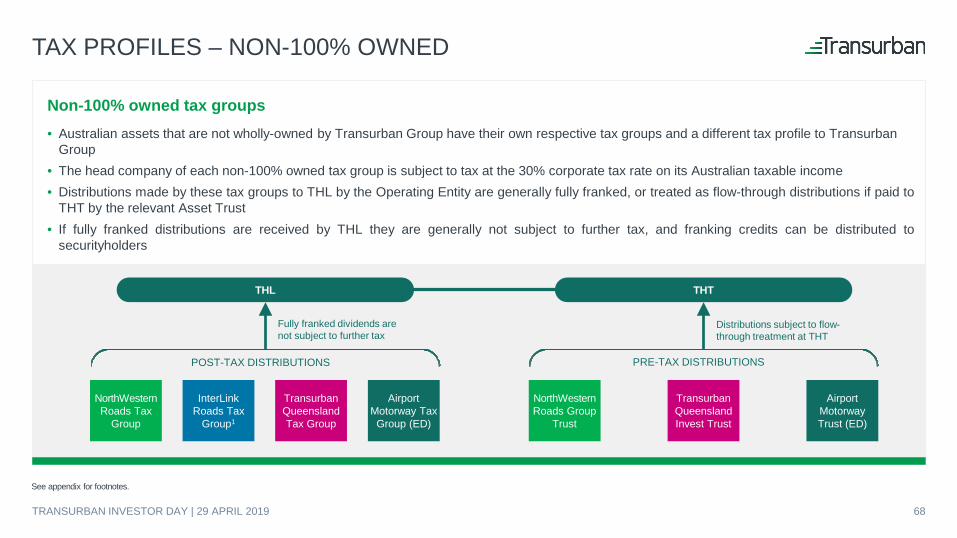
Non-100% owned tax groups• Australian assets that are not wholly-owned by Transurban Group have their own respective tax groups and a different tax profile to Transurban
Group• The head company of each non-100% owned tax group is subject to tax at the 30% corporate tax rate on its Australian taxable income• Distributions made by these tax groups to THL by the Operating Entity are generally fully franked, or treated as flow-through distributions if paid to
THT by the relevant Asset Trust• If fully franked distributions are received by THL they are generally not subject to further tax, and franking credits can be distributed to
securityholders
THL THT
Fully franked dividends are not subject to further tax
Distributions subject to flow-through treatment at THT
POST-TAX DISTRIBUTIONS PRE-TAX DISTRIBUTIONS
See appendix for footnotes.
68TRANSURBAN INVESTOR DAY | 29 APRIL 2019
NorthWestern Roads Tax
Group
Transurban Queensland Tax Group
InterLinkRoads Tax
Group1
Airport Motorway Tax
Group (ED)
NorthWestern Roads Group
Trust
Transurban Queensland Invest Trust
Airport Motorway Trust (ED)
TAX PROFILES – TIL
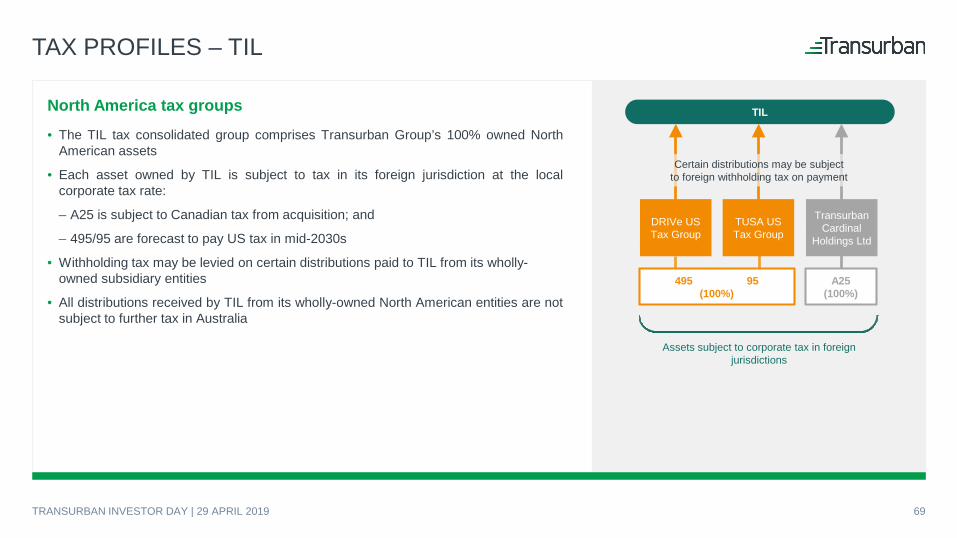
North America tax groups• The TIL tax consolidated group comprises Transurban Group’s 100% owned North
American assets
• Each asset owned by TIL is subject to tax in its foreign jurisdiction at the localcorporate tax rate:
‒ A25 is subject to Canadian tax from acquisition; and
‒ 495/95 are forecast to pay US tax in mid-2030s
• Withholding tax may be levied on certain distributions paid to TIL from its wholly-owned subsidiary entities
• All distributions received by TIL from its wholly-owned North American entities are notsubject to further tax in Australia
TIL
Assets subject to corporate tax in foreign jurisdictions
Certain distributions may be subjectto foreign withholding tax on payment
69TRANSURBAN INVESTOR DAY | 29 APRIL 2019
DRIVe US Tax Group
TUSA US Tax Group
Transurban Cardinal
Holdings Ltd
495 95(100%)
A25 (100%)
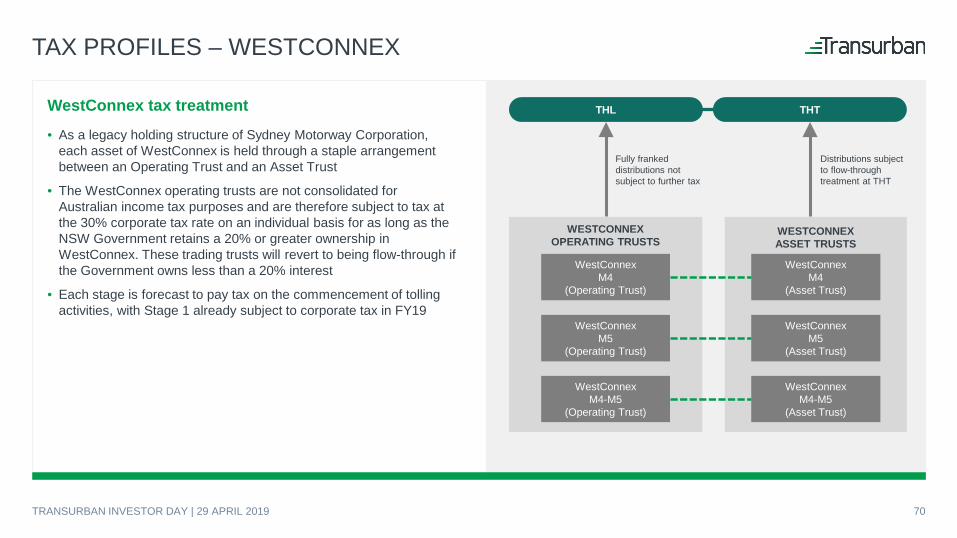
WESTCONNEX ASSET TRUSTS
WESTCONNEXOPERATING TRUSTS
TAX PROFILES – WESTCONNEX
WestConnex tax treatment
• As a legacy holding structure of Sydney Motorway Corporation, each asset of WestConnex is held through a staple arrangement between an Operating Trust and an Asset Trust
• The WestConnex operating trusts are not consolidated for Australian income tax purposes and are therefore subject to tax at the 30% corporate tax rate on an individual basis for as long as the NSW Government retains a 20% or greater ownership in WestConnex. These trading trusts will revert to being flow-through if the Government owns less than a 20% interest
• Each stage is forecast to pay tax on the commencement of tolling activities, with Stage 1 already subject to corporate tax in FY19
Distributions subject to flow-through treatment at THT
THL THT
Fully franked distributions not subject to further tax
WestConnexM4
(Operating Trust)
WestConnexM4
(Asset Trust)
WestConnexM5
(Operating Trust)
WestConnexM5
(Asset Trust)
WestConnexM4-M5
(Operating Trust)
WestConnexM4-M5
(Asset Trust)
70TRANSURBAN INVESTOR DAY | 29 APRIL 2019
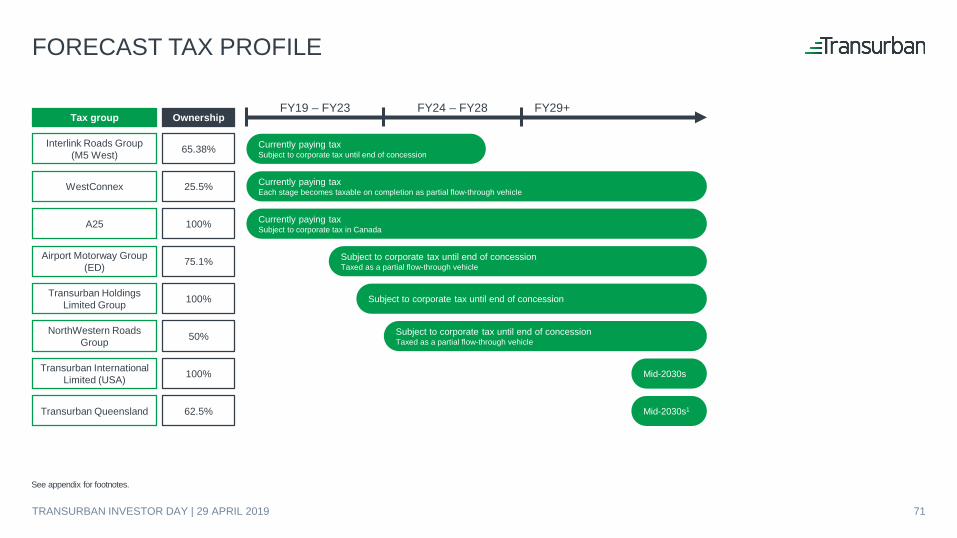
FORECAST TAX PROFILE
Tax group Ownership
Interlink Roads Group (M5 West) 65.38%
WestConnex 25.5%
A25 100%
Airport Motorway Group (ED) 75.1%
Transurban Holdings Limited Group 100%
NorthWestern Roads Group 50%
Transurban International Limited (USA) 100%
Transurban Queensland 62.5%
FY19 – FY23 FY24 – FY28
Currently paying taxSubject to corporate tax until end of concession
Currently paying tax Each stage becomes taxable on completion as partial flow-through vehicle
Currently paying taxSubject to corporate tax in Canada
Subject to corporate tax until end of concessionTaxed as a partial flow-through vehicle
Subject to corporate tax until end of concession
Subject to corporate tax until end of concessionTaxed as a partial flow-through vehicle
Mid-2030s
Mid-2030s1
FY29+
See appendix for footnotes.
TRANSURBAN INVESTOR DAY | 29 APRIL 2019 71
Tax paid by each tax group is subject to a number of variables• New development projects – new projects generate additional tax deductible costs, including tax depreciation, costs of transferring assets and
borrowing costs
• Timing differences between accounting and tax treatment of depreciation and amortisation – tax depreciation on capital works based on a statutory effective life of 40 years whereas the effective life of concession assets may be shorter
• Intragroup charges and arrangements – charges paid by the Operating Entity to the Asset Trust for the use of assets and funds (i.e. rent and interest) reduces tax paid. These charges form the basis of the taxable distributions from THT
• Traffic volume – changes in traffic volume will either increase or reduce taxable income
• Interest rates and gearing levels – as interest is a tax deductible expense, higher borrowing costs reduce taxable income
Factors affecting near term taxable distributions• Taxes paid by each tax group will be used to frank dividends from THL
• All other taxable income is expected to be paid out of THT as a trust distribution
• THL and TIL are not expected to pay unfranked dividends
• The split of taxable income between Operating Entity and Asset Trust is dependent on factors specific to the structure but is guided by ATO accepted principles. These principles and examples are provided by the ATO in LCR 2015/15
FACTORS – TAX FORECASTING
72TRANSURBAN INVESTOR DAY | 29 APRIL 2019
Transurban Group’s approach to tax• Transurban Group adopts tax positions that comply with tax laws, allow for efficient business activities and utilise structures that maximise value
for investors
• Transurban Group continues to foster its longstanding and co-operative relationship with the ATO and other Revenue Authorities in Australia and abroad, by undertaking self-assessment activities with a view to be well positioned to meet the ATO or other Revenue Authorities expectations
• Transurban Group recognises the inherent value for investors resulting from compliance with all tax laws by maximizing operational efficiencies, reducing the risk of penalties and maintaining a reputation as a compliant and transparent corporate taxpayer. A Tax Transparency Report is published annually by Transurban
Recent tax policy changes• Transurban Group continuously monitors all developments in tax policy which may affect Transurban Group’s tax positions
• Recent integrity measures introduced for stapled structures in Treasury Laws Amendment (Making Sure Investors Pay Their Fair Share of Tax in Australian and Other Measures) Act 2019 will have application to Transurban. However, Transurban believes its structures are compliant with the new law
• The introduction of these integrity measures will not impact Transurban’s distributions or its tax paid. Transurban is currently assessing the impact of the new rules on the rate of withholding for certain distributions paid to non-resident investor for distributions after 1 July 2019
TAX GOVERNANCE AND POLICY1
See appendix for footnotes.
73TRANSURBAN INVESTOR DAY | 29 APRIL 2019
TRAFFIC INSIGHT SESSIONDARRYN PATERSON – GENERAL MANAGER NETWORK STRATEGY
AND TRAFFIC ANALYSIS
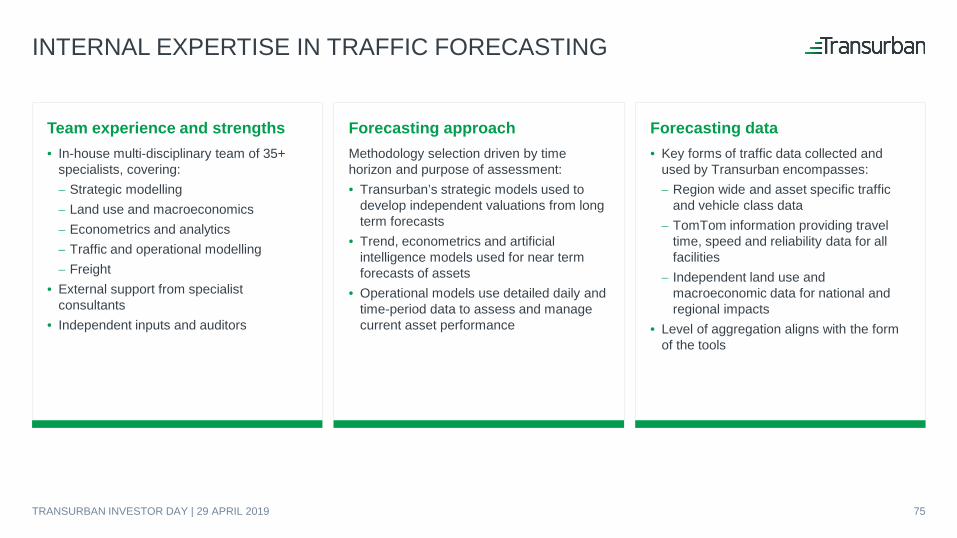
INTERNAL EXPERTISE IN TRAFFIC FORECASTING
Team experience and strengths• In-house multi-disciplinary team of 35+
specialists, covering:− Strategic modelling− Land use and macroeconomics− Econometrics and analytics− Traffic and operational modelling− Freight
• External support from specialist consultants
• Independent inputs and auditors
Forecasting approachMethodology selection driven by time horizon and purpose of assessment:• Transurban’s strategic models used to
develop independent valuations from long term forecasts
• Trend, econometrics and artificial intelligence models used for near term forecasts of assets
• Operational models use detailed daily and time-period data to assess and manage current asset performance
Forecasting data • Key forms of traffic data collected and
used by Transurban encompasses:− Region wide and asset specific traffic
and vehicle class data − TomTom information providing travel
time, speed and reliability data for all facilities
− Independent land use and macroeconomic data for national and regional impacts
• Level of aggregation aligns with the form of the tools
TRANSURBAN INVESTOR DAY | 29 APRIL 2019 75
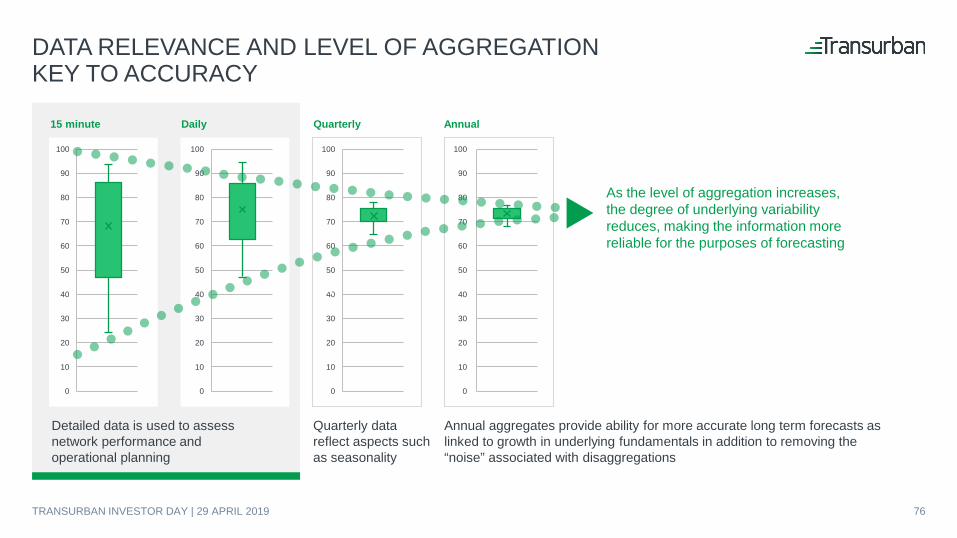
DATA RELEVANCE AND LEVEL OF AGGREGATION KEY TO ACCURACY
Annual aggregates provide ability for more accurate long term forecasts as linked to growth in underlying fundamentals in addition to removing the “noise” associated with disaggregations
Detailed data is used to assess network performance and operational planning
Quarterly data reflect aspects such as seasonality
15 minute Daily Quarterly Annual
As the level of aggregation increases, the degree of underlying variability reduces, making the information more reliable for the purposes of forecasting
100
90
80
70
60
50
40
30
20
10
0
100
90
80
70
60
50
40
30
20
10
0
100
90
80
70
60
50
40
30
20
10
0
100
90
80
70
60
50
40
30
20
10
0
x
TRANSURBAN INVESTOR DAY | 29 APRIL 2019 76
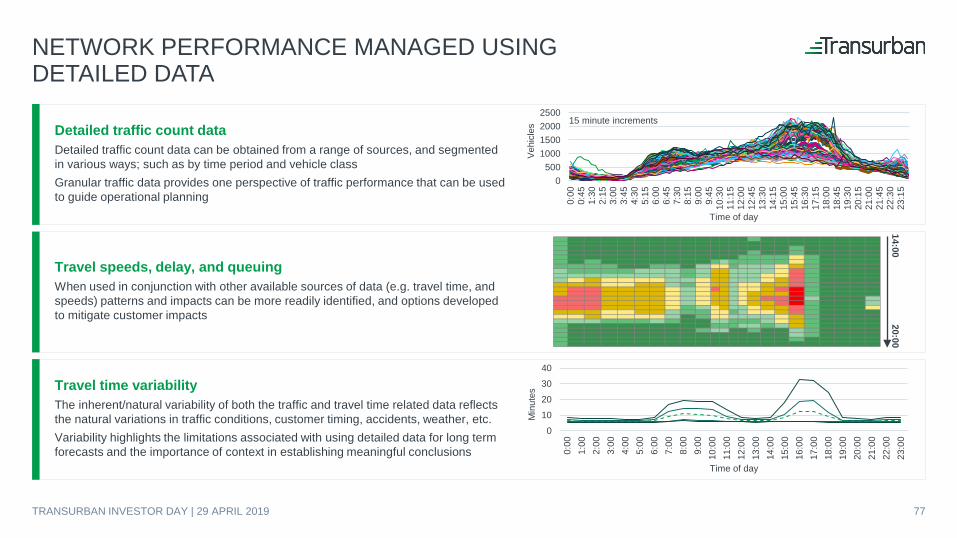
NETWORK PERFORMANCE MANAGED USING DETAILED DATA
Detailed traffic count dataDetailed traffic count data can be obtained from a range of sources, and segmented in various ways; such as by time period and vehicle classGranular traffic data provides one perspective of traffic performance that can be used to guide operational planning
Travel speeds, delay, and queuing When used in conjunction with other available sources of data (e.g. travel time, and speeds) patterns and impacts can be more readily identified, and options developed to mitigate customer impacts
Travel time variabilityThe inherent/natural variability of both the traffic and travel time related data reflects the natural variations in traffic conditions, customer timing, accidents, weather, etc. Variability highlights the limitations associated with using detailed data for long term forecasts and the importance of context in establishing meaningful conclusions
15 minute increments
0500
1000150020002500
0:00
0:45
1:30
2:15
3:00
3:45
4:30
5:15
6:00
6:45
7:30
8:15
9:00
9:45
10:3
011
:15
12:0
012
:45
13:3
014
:15
15:0
015
:45
16:3
017
:15
18:0
018
:45
19:3
020
:15
21:0
021
:45
22:3
023
:15
Vehi
cles
Time of day
14:0020:00
010203040
0:00
1:00
2:00
3:00
4:00
5:00
6:00
7:00
8:00
9:00
10:0
011
:00
12:0
013
:00
14:0
015
:00
16:0
017
:00
18:0
019
:00
20:0
021
:00
22:0
023
:00
Min
utes
Time of day
TRANSURBAN INVESTOR DAY | 29 APRIL 2019 77
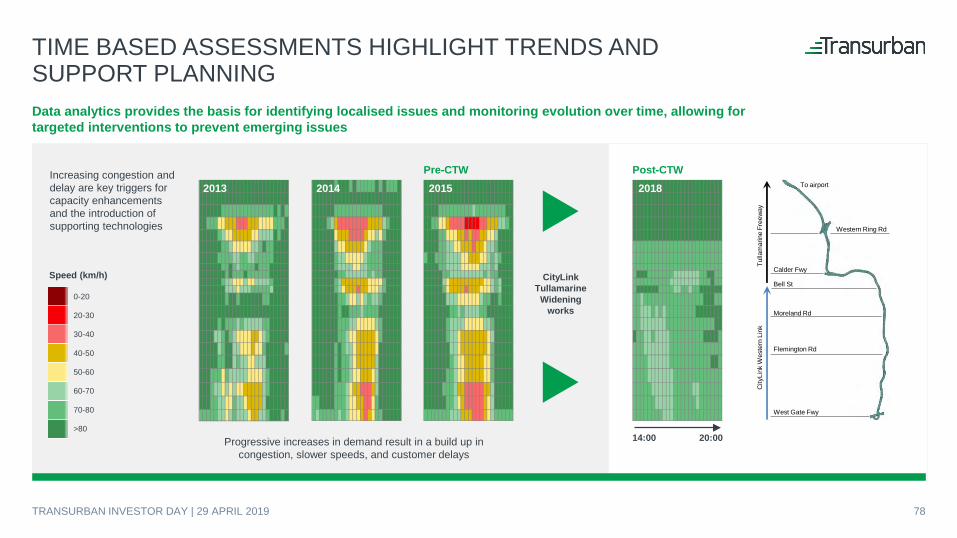
TIME BASED ASSESSMENTS HIGHLIGHT TRENDS AND SUPPORT PLANNINGData analytics provides the basis for identifying localised issues and monitoring evolution over time, allowing for targeted interventions to prevent emerging issues
14:00 20:00
Speed (km/h) CityLink Tullamarine
Widening works
Progressive increases in demand result in a build up in congestion, slower speeds, and customer delays
Increasing congestion and delay are key triggers for capacity enhancements and the introduction of supporting technologies
0-20
20-30
30-40
40-50
50-60
60-70
70-80
>80
2013 2014 2015 2018Pre-CTW
Calder Fwy
Western Ring Rd
Bell St
West Gate Fwy
Flemington Rd
Moreland Rd
Post-CTWTo airport
Tulla
mar
ine
Free
way
City
Link
Wes
tern
Lin
k
TRANSURBAN INVESTOR DAY | 29 APRIL 2019 78
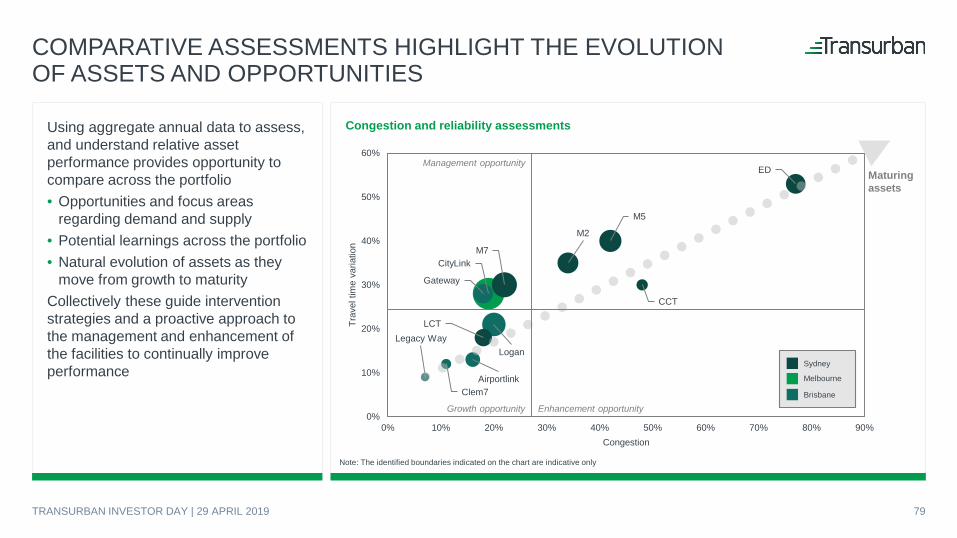
COMPARATIVE ASSESSMENTS HIGHLIGHT THE EVOLUTIONOF ASSETS AND OPPORTUNITIES
Using aggregate annual data to assess, and understand relative asset performance provides opportunity to compare across the portfolio• Opportunities and focus areas
regarding demand and supply• Potential learnings across the portfolio• Natural evolution of assets as they
move from growth to maturityCollectively these guide intervention strategies and a proactive approach to the management and enhancement of the facilities to continually improve performance
Congestion and reliability assessments
CityLink
Legacy Way
Clem7Airportlink
Gateway
Logan
LCT
M7
M2
M5
CCT
ED
0%
10%
20%
30%
40%
50%
60%
0% 10% 20% 30% 40% 50% 60% 70% 80% 90%
Trav
el ti
me
varia
tion
Congestion
Maturing assets
Management opportunity
Growth opportunity Enhancement opportunity
Note: The identified boundaries indicated on the chart are indicative only
Sydney
Melbourne
Brisbane
TRANSURBAN INVESTOR DAY | 29 APRIL 2019 79
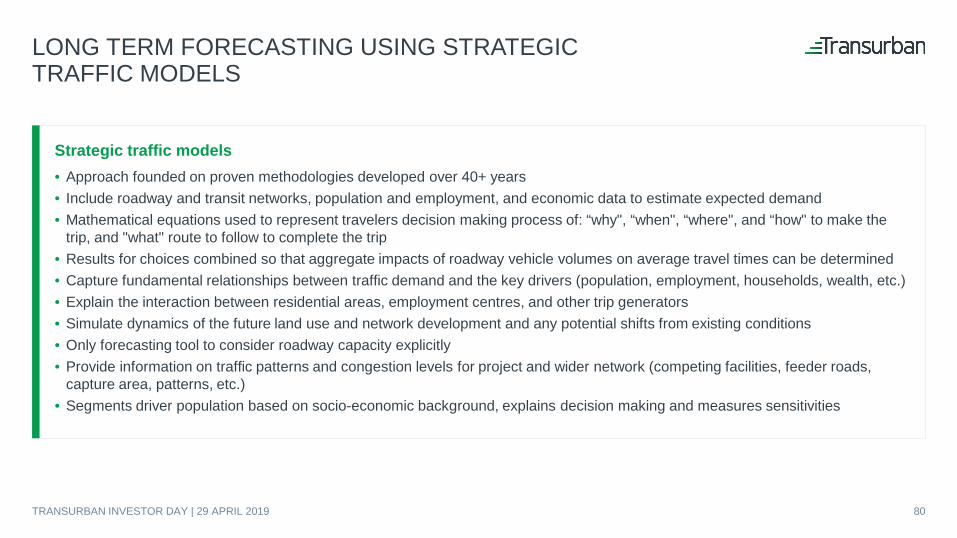
LONG TERM FORECASTING USING STRATEGICTRAFFIC MODELS
Strategic traffic models• Approach founded on proven methodologies developed over 40+ years• Include roadway and transit networks, population and employment, and economic data to estimate expected demand• Mathematical equations used to represent travelers decision making process of: “why", “when", “where", and “how" to make the
trip, and "what" route to follow to complete the trip• Results for choices combined so that aggregate impacts of roadway vehicle volumes on average travel times can be determined• Capture fundamental relationships between traffic demand and the key drivers (population, employment, households, wealth, etc.) • Explain the interaction between residential areas, employment centres, and other trip generators• Simulate dynamics of the future land use and network development and any potential shifts from existing conditions• Only forecasting tool to consider roadway capacity explicitly• Provide information on traffic patterns and congestion levels for project and wider network (competing facilities, feeder roads,
capture area, patterns, etc.) • Segments driver population based on socio-economic background, explains decision making and measures sensitivities
TRANSURBAN INVESTOR DAY | 29 APRIL 2019 80
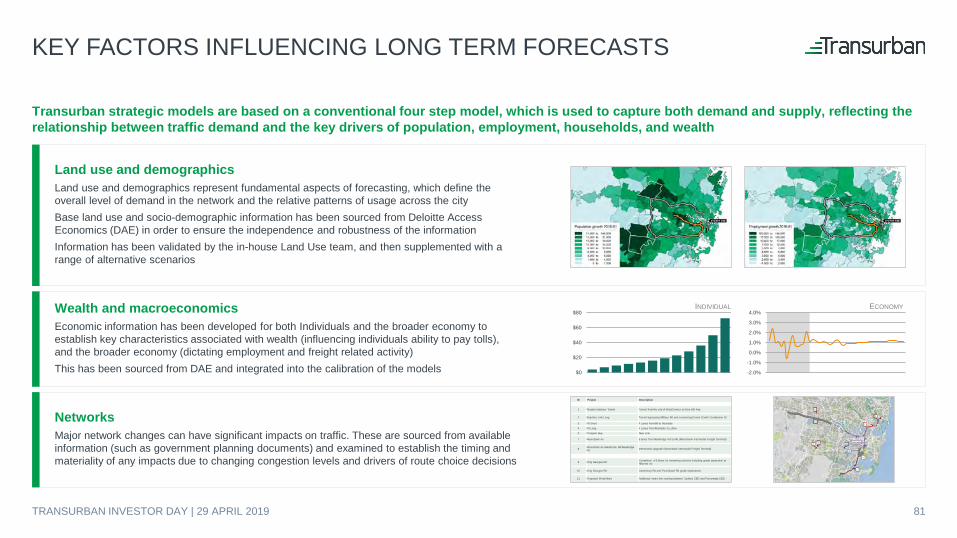
KEY FACTORS INFLUENCING LONG TERM FORECASTS
Land use and demographicsLand use and demographics represent fundamental aspects of forecasting, which define the overall level of demand in the network and the relative patterns of usage across the cityBase land use and socio-demographic information has been sourced from Deloitte Access Economics (DAE) in order to ensure the independence and robustness of the information Information has been validated by the in-house Land Use team, and then supplemented with a range of alternative scenarios
Wealth and macroeconomicsEconomic information has been developed for both Individuals and the broader economy to establish key characteristics associated with wealth (influencing individuals ability to pay tolls), and the broader economy (dictating employment and freight related activity)This has been sourced from DAE and integrated into the calibration of the models
NetworksMajor network changes can have significant impacts on traffic. These are sourced from available information (such as government planning documents) and examined to establish the timing and materiality of any impacts due to changing congestion levels and drivers of route choice decisions
Transurban strategic models are based on a conventional four step model, which is used to capture both demand and supply, reflecting the relationship between traffic demand and the key drivers of population, employment, households, and wealth
ECONOMYINDIVIDUAL
-2.0%
-1.0%
0.0%
1.0%
2.0%
3.0%
4.0%
$0
$20
$40
$60
$80
ID Project Description
1 Western Harbour Tunnel Tunnel from the end of WestConnex to Gore Hill Fwy
2 Beaches Link-Long Tunnel bypassing Military Rd and connecting Ernest St with Condamine St
3 F6 Short 4 Lanes from M5 to Rockdale
4 F6 Long 4 Lanes from Rockdale to Loftus
5 Prospect Hwy New Link
7 Moorebank Av. 6 lanes from Newbridge Rd to M5 (Moorebank Intermodal Freight Terminal)
8 Moorebank Av./Heathcote Rd/Newbridge Rd Intersection upgrade (Moorebank Intermodal Freight Terminal)
9 King Georges Rd Completion of 6 lanes for remaining sections including grade separation at Hillcrest Av.
10 King Georges Rd Canterbury Rd and Punchbowl Rd grade separations
11 Proposed West Metro Additional metro line running between Sydney CBD and Parramatta CBD.
TRANSURBAN INVESTOR DAY | 29 APRIL 2019 81
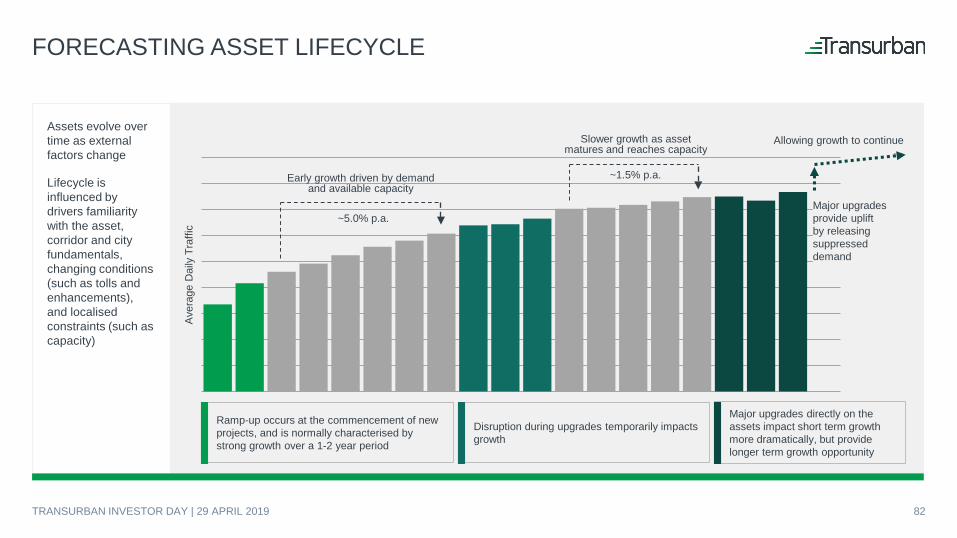
FORECASTING ASSET LIFECYCLE
Ramp-up occurs at the commencement of new projects, and is normally characterised by strong growth over a 1-2 year period
Early growth driven by demand and available capacity
Slower growth as asset matures and reaches capacity
~5.0% p.a.
~1.5% p.a.
Disruption during upgrades temporarily impacts growth
Major upgrades directly on the assets impact short term growth more dramatically, but provide longer term growth opportunity
Major upgrades provide uplift by releasing suppressed demand
Allowing growth to continue …
Assets evolve over time as external factors change
Lifecycle is influenced by drivers familiarity with the asset, corridor and city fundamentals, changing conditions (such as tolls and enhancements), and localisedconstraints (such as capacity)
Aver
age
Dai
ly T
raffi
c
TRANSURBAN INVESTOR DAY | 29 APRIL 2019 82
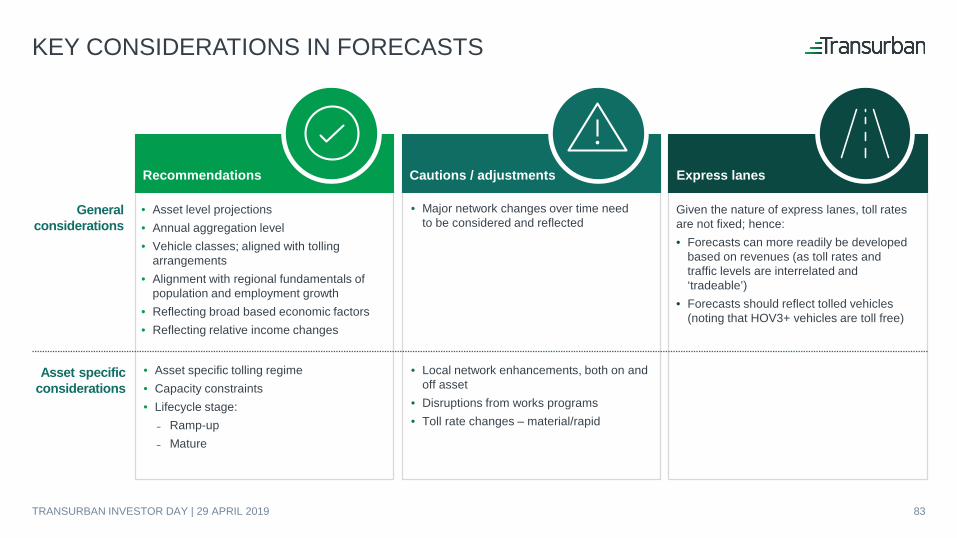
Recommendations Cautions / adjustments Express lanes
KEY CONSIDERATIONS IN FORECASTS
• Asset level projections • Annual aggregation level• Vehicle classes; aligned with tolling
arrangements• Alignment with regional fundamentals of
population and employment growth• Reflecting broad based economic factors • Reflecting relative income changes
• Major network changes over time need to be considered and reflected
Given the nature of express lanes, toll rates are not fixed; hence:• Forecasts can more readily be developed
based on revenues (as toll rates and traffic levels are interrelated and ‘tradeable’)
• Forecasts should reflect tolled vehicles (noting that HOV3+ vehicles are toll free)
General considerations
Asset specific considerations
• Asset specific tolling regime• Capacity constraints• Lifecycle stage:
Ramp-up Mature
• Local network enhancements, both on and off asset
• Disruptions from works programs• Toll rate changes – material/rapid
TRANSURBAN INVESTOR DAY | 29 APRIL 2019 83
FOOTNOTES
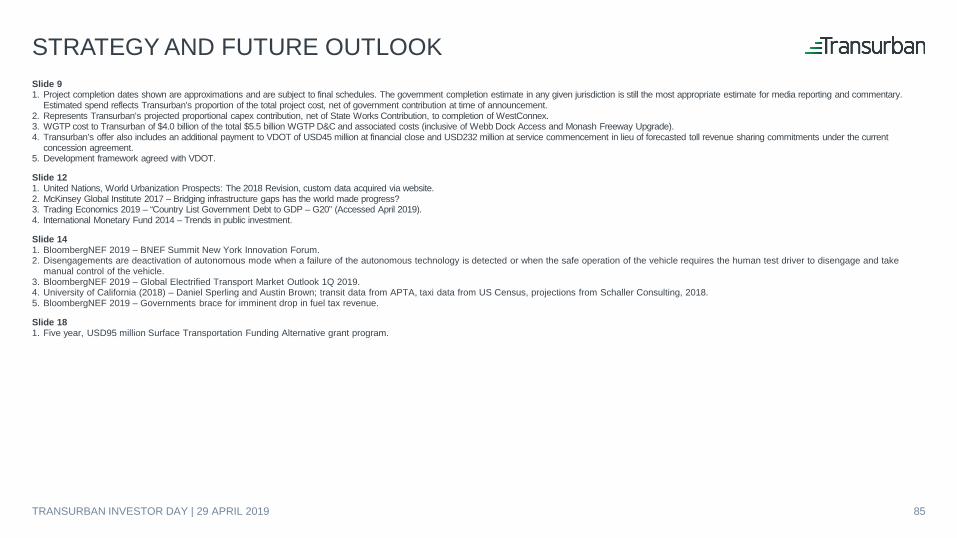
STRATEGY AND FUTURE OUTLOOKSlide 91. Project completion dates shown are approximations and are subject to final schedules. The government completion estimate in any given jurisdiction is still the most appropriate estimate for media reporting and commentary.
Estimated spend reflects Transurban’s proportion of the total project cost, net of government contribution at time of announcement.2. Represents Transurban’s projected proportional capex contribution, net of State Works Contribution, to completion of WestConnex.3. WGTP cost to Transurban of $4.0 billion of the total $5.5 billion WGTP D&C and associated costs (inclusive of Webb Dock Access and Monash Freeway Upgrade). 4. Transurban’s offer also includes an additional payment to VDOT of USD45 million at financial close and USD232 million at service commencement in lieu of forecasted toll revenue sharing commitments under the current
concession agreement.5. Development framework agreed with VDOT.
Slide 121. United Nations, World Urbanization Prospects: The 2018 Revision, custom data acquired via website.2. McKinsey Global Institute 2017 – Bridging infrastructure gaps has the world made progress?3. Trading Economics 2019 – “Country List Government Debt to GDP – G20” (Accessed April 2019).4. International Monetary Fund 2014 – Trends in public investment.
Slide 141. BloombergNEF 2019 – BNEF Summit New York Innovation Forum.2. Disengagements are deactivation of autonomous mode when a failure of the autonomous technology is detected or when the safe operation of the vehicle requires the human test driver to disengage and take
manual control of the vehicle.3. BloombergNEF 2019 – Global Electrified Transport Market Outlook 1Q 2019.4. University of California (2018) – Daniel Sperling and Austin Brown; transit data from APTA, taxi data from US Census, projections from Schaller Consulting, 2018.5. BloombergNEF 2019 – Governments brace for imminent drop in fuel tax revenue.
Slide 181. Five year, USD95 million Surface Transportation Funding Alternative grant program.
TRANSURBAN INVESTOR DAY | 29 APRIL 2019 85
CAPITAL STRATEGYSlide 381. Calculated using proportional drawn debt at 31 December 2018.2. AUD debt only, calculated using proportional drawn debt exclusive of issued letters of credit.3. At 31 December 2018. A total of USD967 million and CAD650 million of corporate debt is not swapped to AUD, this debt forms part of the Group’s net investment hedge relating to the US and Canadian entities respectively.4. CAD, CHF, EUR, NOK and USD debt converted at the hedged rate where cross currency swaps are in place. USD debt is converted at the spot exchange rate (0.7060 at 31 December 2018) where no cross currency swaps are
in place. CAD debt is converted at the spot exchange rate (0.9623 at 31 December 2018) where no cross currency swaps are in place. Proportional drawn debt inclusive of issued letters of credit.
Slide 401. Project completion dates shown are approximations and are subject to final schedules. The NSW Government completion estimate is still the most appropriate estimate for media reporting and commentary.
Slide 411. Effective tax rates may differ to the corporate tax rate due to a number of items, including timing differences in accounting vs. tax depreciation and amortisation, intragroup funding arrangements and asset holding structure.2. WestConnex to convert to flow-through taxation entity in the event of a NSW Government sell-down.3. Certain distributions made by the A25 are subject to withholding tax on payment.4. Certain distributions made by US assets are subject to withholding tax on payment. US assets subject to tax in United States of America.5. Taxed as a partial flow-through vehicle.
PROJECT DELIVERYSlide 451. As at 30 June 2013 and 31 March 2019. Includes employees and contingent workers.
Slide 461. Approximate project construction timeframes. WestConnex shown from acquisition date.
TRANSURBAN INVESTOR DAY | 29 APRIL 2019 86
WESTCONNEXSlide 501. Map is for illustrative purposes only and is not indicative of distance, proximity or scale.
Slide 511. Map is for illustrative purposes only and is not indicative of distance, proximity or scale.2. In 2031, based on Deloitte Access Economics estimates and Transurban’s own internal estimates and assessments. Expectations relating to population and employment growth are based on a number of assumptions including
fertility and mortality rates, overseas and interstate migration, land use, the form and timing of government planning and infrastructure policies, demographic trends and macroeconomic factors and there can be no assurance that these projections are accurate and actual outcomes may differ materially from such projections because events and actual circumstances frequently do not occur as projected.
3. TfNSW Freight and Ports Plan 2018 – 2023, September 2018.
Slide 521. Project completion dates shown are approximations and are subject to final schedules. The government completion estimate in any given jurisdiction is still the most appropriate estimate for media reporting and commentary.
NORTH AMERICA DEVELOPMENTSlide 561. Inframation data: https://inframationnews.com/deals.2. FY19 bar represents 1H19 North America revenue only. 2H19 revenue is shown for indicative purposes only and should not be considered as a Transurban forecast.3. Transurban reached financial close on acquiring A25 on 5 June 2018.
Slide 601. Program allowing free travel for electric vehicles on A25 commenced prior to Transurban acquiring A25.
TRANSURBAN INVESTOR DAY | 29 APRIL 2019 87
TAX INSIGHT SESSIONSlide 661. There are no tax groups under THT. Each sub-trust is treated as a flow-through trust.2. WestConnex operating entities are operating trusts and are not part of a tax consolidated group.
Slide 681. InterLink Roads is a stand-alone entity.
Slide 711. Taxed as a partial flow-through vehicle.
Slide 731. For more information on Transurban Group’s approach to tax, see Transurban Group’s FY17 Tax Transparency Report: https://www.transurban.com/investor-centre/distributions-and-tax/tax-profile.
TRANSURBAN INVESTOR DAY | 29 APRIL 2019 88
GLOSSARY
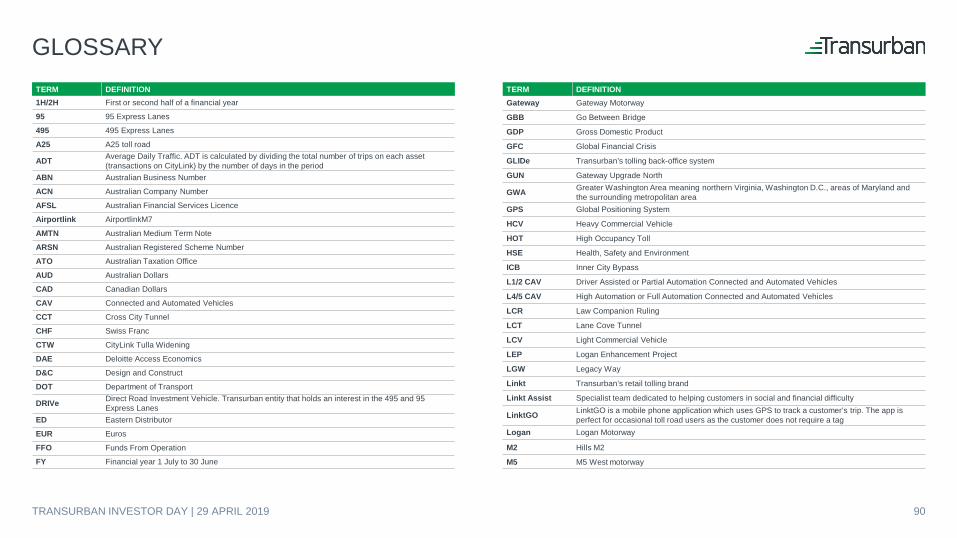
GLOSSARYTERM DEFINITION 1H/2H First or second half of a financial year
95 95 Express Lanes
495 495 Express Lanes
A25 A25 toll road
ADT Average Daily Traffic. ADT is calculated by dividing the total number of trips on each asset (transactions on CityLink) by the number of days in the period
ABN Australian Business Number
ACN Australian Company Number
AFSL Australian Financial Services Licence
Airportlink AirportlinkM7
AMTN Australian Medium Term Note
ARSN Australian Registered Scheme Number
ATO Australian Taxation Office
AUD Australian Dollars
CAD Canadian Dollars
CAV Connected and Automated Vehicles
CCT Cross City Tunnel
CHF Swiss Franc
CTW CityLink Tulla Widening
DAE Deloitte Access Economics
D&C Design and Construct
DOT Department of Transport
DRIVe Direct Road Investment Vehicle. Transurban entity that holds an interest in the 495 and 95 Express Lanes
ED Eastern Distributor
EUR Euros
FFO Funds From Operation
FY Financial year 1 July to 30 June
TERM DEFINITION Gateway Gateway Motorway
GBB Go Between Bridge
GDP Gross Domestic Product
GFC Global Financial Crisis
GLIDe Transurban’s tolling back-office system
GUN Gateway Upgrade North
GWA Greater Washington Area meaning northern Virginia, Washington D.C., areas of Maryland and the surrounding metropolitan area
GPS Global Positioning System
HCV Heavy Commercial Vehicle
HOT High Occupancy Toll
HSE Health, Safety and Environment
ICB Inner City Bypass
L1/2 CAV Driver Assisted or Partial Automation Connected and Automated Vehicles
L4/5 CAV High Automation or Full Automation Connected and Automated Vehicles
LCR Law Companion Ruling
LCT Lane Cove Tunnel
LCV Light Commercial Vehicle
LEP Logan Enhancement Project
LGW Legacy Way
Linkt Transurban’s retail tolling brand
Linkt Assist Specialist team dedicated to helping customers in social and financial difficulty
LinktGO LinktGO is a mobile phone application which uses GPS to track a customer’s trip. The app isperfect for occasional toll road users as the customer does not require a tag
Logan Logan Motorway
M2 Hills M2
M5 M5 West motorway
TRANSURBAN INVESTOR DAY | 29 APRIL 2019 90
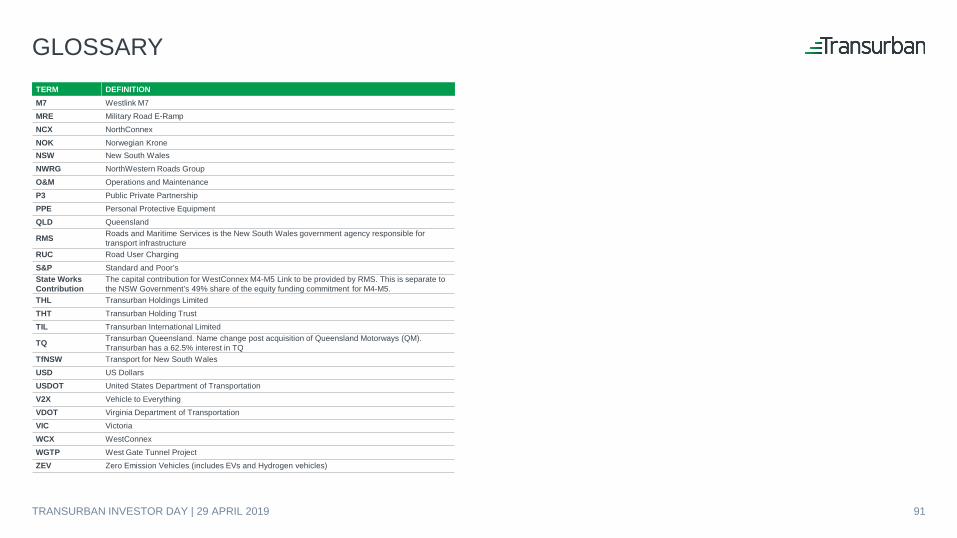
GLOSSARYTERM DEFINITION M7 Westlink M7MRE Military Road E-RampNCX NorthConnexNOK Norwegian KroneNSW New South WalesNWRG NorthWestern Roads Group O&M Operations and MaintenanceP3 Public Private PartnershipPPE Personal Protective EquipmentQLD Queensland
RMS Roads and Maritime Services is the New South Wales government agency responsible for transport infrastructure
RUC Road User ChargingS&P Standard and Poor’sState Works Contribution
The capital contribution for WestConnex M4-M5 Link to be provided by RMS. This is separate to the NSW Government’s 49% share of the equity funding commitment for M4-M5.
THL Transurban Holdings LimitedTHT Transurban Holding TrustTIL Transurban International Limited
TQ Transurban Queensland. Name change post acquisition of Queensland Motorways (QM). Transurban has a 62.5% interest in TQ
TfNSW Transport for New South WalesUSD US DollarsUSDOT United States Department of TransportationV2X Vehicle to EverythingVDOT Virginia Department of TransportationVIC VictoriaWCX WestConnexWGTP West Gate Tunnel ProjectZEV Zero Emission Vehicles (includes EVs and Hydrogen vehicles)
TRANSURBAN INVESTOR DAY | 29 APRIL 2019 91