travel & tourism · for more than 20 years the world travel & tourism council (wttc) has...
TRANSCRIPT
WTTC Travel & Tourism Economic Impact 2012 1
The Authority on World Travel & Tourism
Travel & Tourism Economicimpact2012 ITaly

For more information please contact:
Olivia Ruggles-BriseDirector,policy&Research
Eva Aimablemanager,policy&Research
©2012Worldtravel&tourismcouncil
For more than 20 years the World Travel & Tourism Council (WTTC) has been investing in economic impact research, which assesses the Travel & Tourism industry’s contribution to GDP and jobs. Our ten-year forecasts are unique in the information they provide to assist governments and private companies plan for the future.
Travel & Tourism continues to be one of the world’s largest industries. The total impact of the industry means that, in 2011, it contributed 9% of global GDP, or a value of over US$6 trillion, and accounted for 255 million jobs. Over the next ten years this industry is expected to grow by an average of 4% annually, taking it to 10% of global GDP, or some US$10 trillion. By 2022, it is anticipated that it will account for 328 million jobs, or 1 in every 10 jobs on the planet. 2011 was one of the most challenging years ever experienced by the global Travel & Tourism industry. However, our latest research suggests that, despite political upheaval, economic uncertainty and natural disasters, the industry’s direct contribution to world GDP grew by nearly 3% to US$2 trillion and directly generated 1.2 million new jobs. This was supported by a 3% increase in visitor exports to US$1.2 trillion, with almost 3% growth in capital investment, which rose to over US$0.7 trillion. Moreover, while the macroeconomic environment remains very challenging, our latest projections point to continuous growth in the contribution of Travel & Tourism to global GDP and employment. Rising household incomes in emerging economies – not only the BRICs (Brazil, Russia, India and China) but increasingly across the rest of Southeast Asia and Latin America – will continue to fuel increased leisure demand. Similarly, growing international trade – particularly from emerging markets – will sustain business travel demand. In developed economies, consumers are likely to remain cautious, especially in European countries where austerity programmes are being implemented. This means that we expect growth in Travel & Tourism’s direct contribution to GDP to remain stable at 3% in 2012. We expect the industry to generate directly over 2 million new jobs, with a 2% increase in visitor exports and 3.5% growth in investment over the year. Rarely over the past 20 years have we been challenged by such economic and political uncertainty as we are seeing now. Our ongoing research underlines the importance of Travel & Tourism as a stabilising force globally – providing jobs, generating prosperity, and facilitating international trade and investment.
David ScowsillPresident & CEOWorld Travel & Tourism Council
Foreword
Contents2012 Annual Research: Key Facts .......................................................................................................1
Defining the Economic Contribution of Travel & Tourism .............................2
Travel & Tourism’s Contribution to GDP .....................................................................................3
Travel & Tourism’s Contribution to Employment ..........................................................4
Visitor Exports and Investment ..................................................................................................................5
Different Components of Travel & Tourism ............................................................................6
Country Rankings: Absolute Contribution, 2012 ........................................................7
Country Rankings: Relative Contribution, 2011 ...........................................................8
Country Rankings: Real Growth, 2012 .........................................................................................9
Country Rankings: Long Term Growth, 2012 - 2022 ......................................10
Summary Tables: Estimates and Forecasts ....................................................................11
The Economic Contribution of Travel & Tourism: Real 2011 Prices .............................................................................................................................................................12
The Economic Contribution of Travel & Tourism: Nominal Prices ...................................................................................................................................................................13
The Economic Contribution of Travel & Tourism: Growth ......................14
Glossary .........................................................................................................................................................................................15
Methodological Note ...............................................................................................................................................16
Regions, Sub-regions, Countries ......................................................................................................17
USEoFmatERiaLiSaUtHoRiSED,pRoViDEDSoURcEiSacKnoWLEDGED
1-2QueenVictoriaterrace,Sovereigncourt,LondonE1W3Ha,UK
2tel:+44(0)2074818007.Fax:+44(0)2074881008.Email:[email protected]
The Economic Impact of Travel & Tourism 2012
= Total contribution of Travel & Tourism
Italy
2012 ANNUAL RESEARCH: KEY FACTS 2012 forecast
EMPLOYMENT: DIRECT CONTRIBUTION
EMPLOYMENT: TOTAL CONTRIBUTION
VISITOR EXPORTS
INVESTMENT
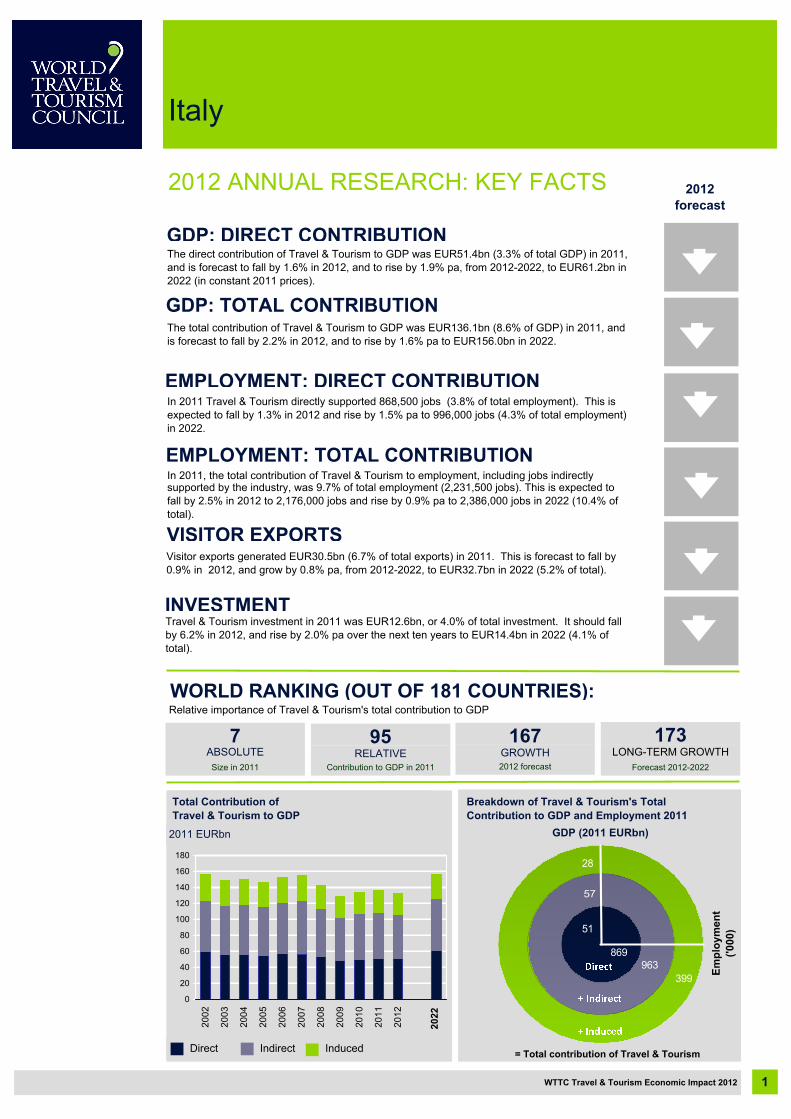
WORLD RANKING (OUT OF 181 COUNTRIES):Relative importance of Travel & Tourism's total contribution to GDP
7ABSOLUTE
Size in 2011
95Contribution to GDP in 2011
RELATIVE167
GROWTH2012 forecast
Total Contribution of Travel & Tourism to GDP
Breakdown of Travel & Tourism's Total Contribution to GDP and Employment 2011
2011 EURbn GDP (2011 EURbn)
Direct Indirect Induced
0
20
40
60
80
100
120
140
160
180
2002
2003
2004
2005
2006
2007
2008
2009
2010
2011
2012
2022
2011 EURbn2011 EURbn
28
57
51
869963
399 Empl
oym
ent
('000
)
WTTC Travel & Tourism Economic Impact 2012 1
The direct contribution of Travel & Tourism to GDP was EUR51.4bn (3.3% of total GDP) in 2011, and is forecast to fall by 1.6% in 2012, and to rise by 1.9% pa, from 2012-2022, to EUR61.2bn in 2022 (in constant 2011 prices).
The total contribution of Travel & Tourism to GDP was EUR136.1bn (8.6% of GDP) in 2011, and is forecast to fall by 2.2% in 2012, and to rise by 1.6% pa to EUR156.0bn in 2022.
In 2011 Travel & Tourism directly supported 868,500 jobs (3.8% of total employment). This is expected to fall by 1.3% in 2012 and rise by 1.5% pa to 996,000 jobs (4.3% of total employment) in 2022.
In 2011, the total contribution of Travel & Tourism to employment, including jobs indirectly
Visitor exports generated EUR30.5bn (6.7% of total exports) in 2011. This is forecast to fall by 0.9% in 2012, and grow by 0.8% pa, from 2012-2022, to EUR32.7bn in 2022 (5.2% of total).
Travel & Tourism investment in 2011 was EUR12.6bn, or 4.0% of total investment. It should fall by 6.2% in 2012, and rise by 2.0% pa over the next ten years to EUR14.4bn in 2022 (4.1% of total).
2022
GDP: DIRECT CONTRIBUTION
GDP: TOTAL CONTRIBUTION
supported by the industry, was 9.7% of total employment (2,231,500 jobs). This is expected to fall by 2.5% in 2012 to 2,176,000 jobs and rise by 0.9% pa to 2,386,000 jobs in 2022 (10.4% of total).
173LONG-TERM GROWTH
Forecast 2012-2022
●
●
●
WTTC Travel & Tourism Economic Impact 20122
Defining the economiccontribution of Travel & Tourism
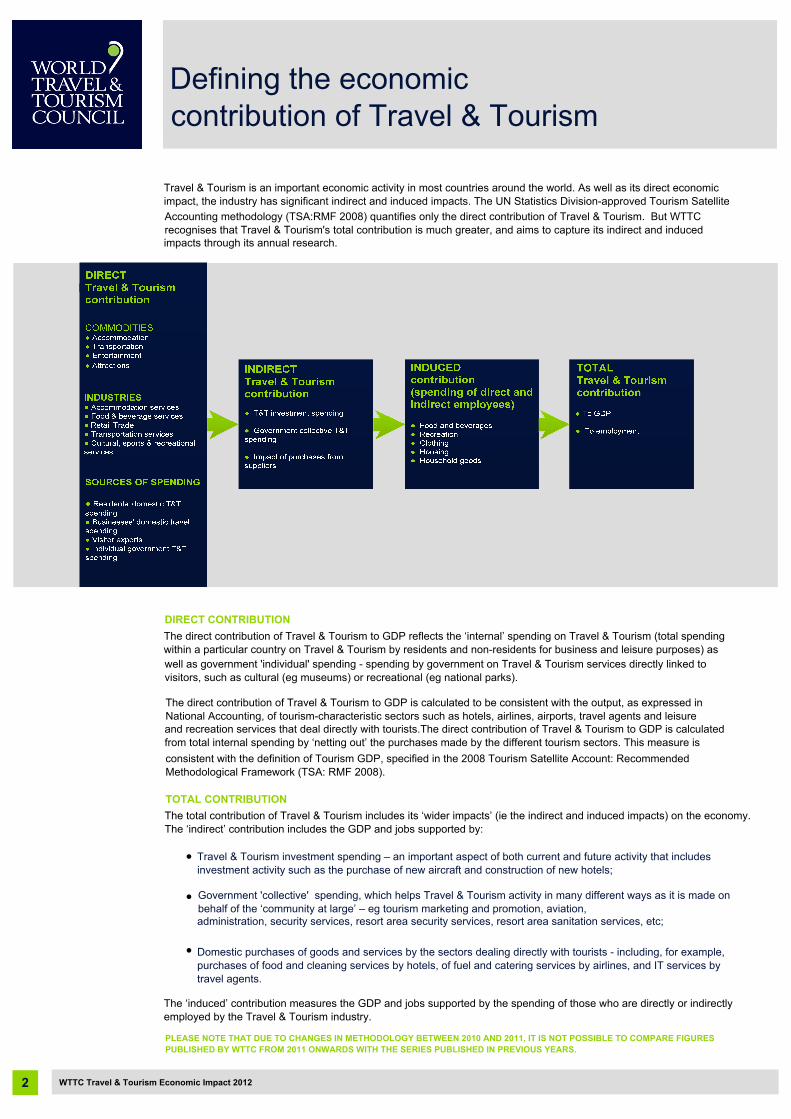
Travel & Tourism is an important economic activity in most countries around the world. As well as its direct economic impact, the industry has significant indirect and induced impacts. The UN Statistics Division-approved Tourism SatelliteAccounting methodology (TSA:RMF 2008) quantifies only the direct contribution of Travel & Tourism. But WTTC recognises that Travel & Tourism's total contribution is much greater, and aims to capture its indirect and induced impacts through its annual research.
DIRECT CONTRIBUTIONThe direct contribution of Travel & Tourism to GDP reflects the ‘internal’ spending on Travel & Tourism (total spending within a particular country on Travel & Tourism by residents and non-residents for business and leisure purposes) as well as government 'individual' spending - spending by government on Travel & Tourism services directly linked to visitors, such as cultural (eg museums) or recreational (eg national parks).
The direct contribution of Travel & Tourism to GDP is calculated to be consistent with the output, as expressed in National Accounting, of tourism-characteristic sectors such as hotels, airlines, airports, travel agents and leisure and recreation services that deal directly with tourists.The direct contribution of Travel & Tourism to GDP is calculated from total internal spending by ‘netting out’ the purchases made by the different tourism sectors. This measure is consistent with the definition of Tourism GDP, specified in the 2008 Tourism Satellite Account: Recommended Methodological Framework (TSA: RMF 2008).
TOTAL CONTRIBUTION The total contribution of Travel & Tourism includes its ‘wider impacts’ (ie the indirect and induced impacts) on the economy. The ‘indirect’ contribution includes the GDP and jobs supported by:
Travel & Tourism investment spending – an important aspect of both current and future activity that includes investment activity such as the purchase of new aircraft and construction of new hotels;
Government 'collective' spending, which helps Travel & Tourism activity in many different ways as it is made on behalf of the ‘community at large’ – eg tourism marketing and promotion, aviation, administration, security services, resort area security services, resort area sanitation services, etc;
Domestic purchases of goods and services by the sectors dealing directly with tourists - including, for example, purchases of food and cleaning services by hotels, of fuel and catering services by airlines, and IT services by travel agents.
The ‘induced’ contribution measures the GDP and jobs supported by the spending of those who are directly or indirectly employed by the Travel & Tourism industry.
PLEASE NOTE THAT DUE TO CHANGES IN METHODOLOGY BETWEEN 2010 AND 2011, IT IS NOT POSSIBLE TO COMPARE FIGURES PUBLISHED BY WTTC FROM 2011 ONWARDS WITH THE SERIES PUBLISHED IN PREVIOUS YEARS.
ITALY: DIRECT CONTRIBUTION OF TRAVEL & TOURISM TO GDP
ITALY: TOTAL CONTRIBUTION OF TRAVEL & TOURISM TO GDP
1 All values are in constant 2011 prices & exchange rates
3
Travel & Tourism's contribution to GDP1
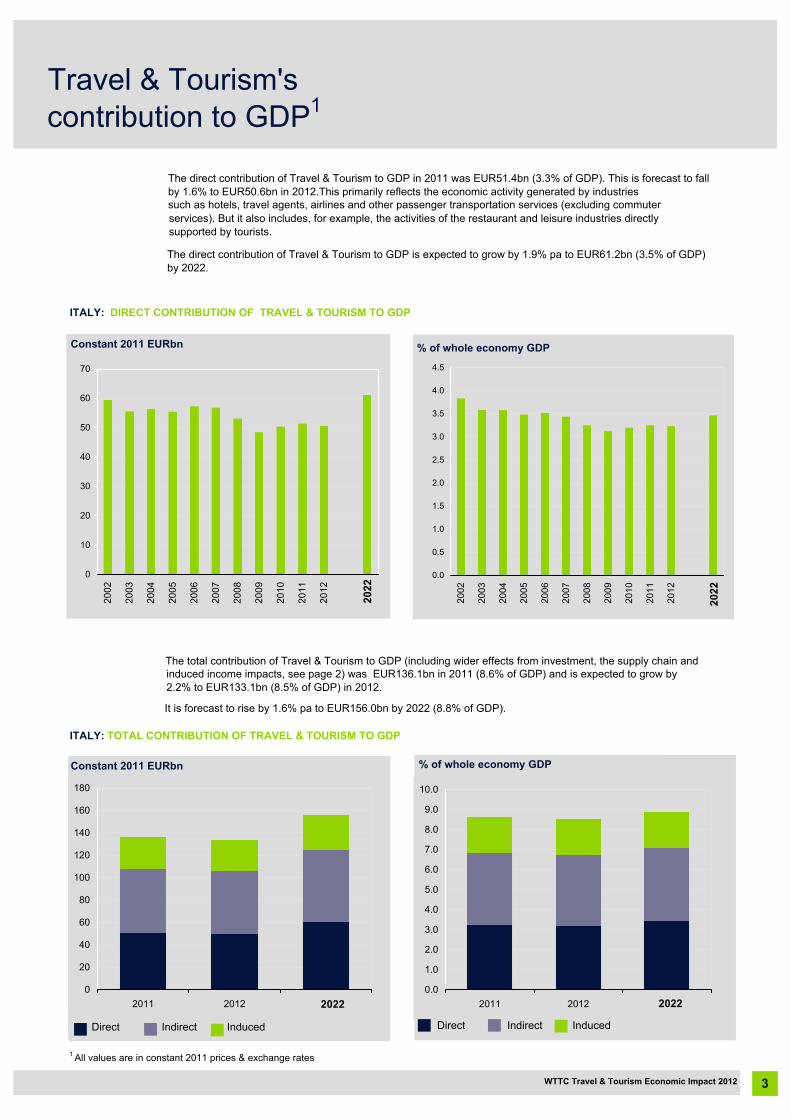
The direct contribution of Travel & Tourism to GDP in 2011 was EUR51.4bn (3.3% of GDP). This is forecast to fall by 1.6% to EUR50.6bn in 2012.This primarily reflects the economic activity generated by industries such as hotels, travel agents, airlines and other passenger transportation services (excluding commuter services). But it also includes, for example, the activities of the restaurant and leisure industries directly supported by tourists.
The direct contribution of Travel & Tourism to GDP is expected to grow by 1.9% pa to EUR61.2bn (3.5% of GDP) by 2022.
0
10
20
30
40
50
60
70
2002
2003
2004
2005
2006
2007
2008
2009
2010
2011
2012
2022
2022
Constant 2011 EURbn % of whole economy GDP
0.0
0.5
1.0
1.5
2.0
2.5
3.0
3.5
4.0
4.5
2002
2003
2004
2005
2006
2007
2008
2009
2010
2011
2012
2022
2022
induced income impacts, see page 2) was EUR136.1bn in 2011 (8.6% of GDP) and is expected to grow by 2.2% to EUR133.1bn (8.5% of GDP) in 2012.
It is forecast to rise by 1.6% pa to EUR156.0bn by 2022 (8.8% of GDP).
Constant 2011 EURbn
Direct Indirect Induced
0
20
40
60
80
100
120
140
160
180
2011 2012 2022202220220.0
1.0
2.0
3.0
4.0
5.0
6.0
7.0
8.0
9.0
10.0
2011 2012 20222022
% of whole economy GDP
Direct Indirect Induced
WTTC Travel & Tourism Economic Impact 2012
The total contribution of Travel & Tourism to GDP (including wider effects from investment, the supply chain and

ITALY: DIRECT CONTRIBUTION OF TRAVEL & TOURISM TO EMPLOYMENT
ITALY: TOTAL CONTRIBUTION OF TRAVEL & TOURISM TO EMPLOYMENT
4
Travel & Tourism generated 868,500 jobs directly in 2011 (3.8% of total employment) and this is forecast to fall by 1.3% in 2012 to 857,000 (3.8% of total employment).This includes employment by hotels, travel agents, airlines and other passenger transportation services (excluding commuter services). It also includes, for example, the activities of the restaurant and leisure industries directly supported by tourists.
By 2022, Travel & Tourism will account for 996,000 jobs directly, an increase of 1.5% pa over the next ten years.
0.0
200.0
400.0
600.0
800.0
1,000.0
1,200.0
2002
2003
2004
2005
2006
2007
2008
2009
2010
2011
2012
2022
'000 jobs % of whole economy employment
0.0
0.5
1.0
1.5
2.0
2.5
3.0
3.5
4.0
4.5
5.0
2002
2003
2004
2005
2006
2007
2008
2009
2010
2011
2012
2022
The total contribution of Travel & Tourism to employment (including wider effects from investment, the supply
By 2022, Travel & Tourism is forecast to support 2,386,000 jobs (10.4% of total employment), an increase of 0.9% pa over the period.
'000 jobs
Direct Indirect Induced
0.0
500.0
1,000.0
1,500.0
2,000.0
2,500.0
3,000.0
2011 2012 2022202220220.0
2.0
4.0
6.0
8.0
10.0
12.0
2011 2012 20222022
% of whole economy employment
Direct Indirect Induced
WTTC Travel & Tourism Economic Impact 2012
Travel & Tourism'scontribution to employment
chain and induced income impacts, see page 2) was 2,231,500 jobs in 2011 (9.7% of total employment). This is forecast to fall by 2.5% in 2012 to 2,176,000 jobs (9.6% of total employment).
2022
2022
VISITOR EXPORTS
ITALY: VISITOR EXPORTS AND INTERNATIONAL TOURIST ARRIVALS
INVESTMENT
ITALY: CAPITAL INVESTMENT IN TRAVEL & TOURISM
1 All values are in constant 2011 prices & exchange rates
5
Visitor Exports and Investment1
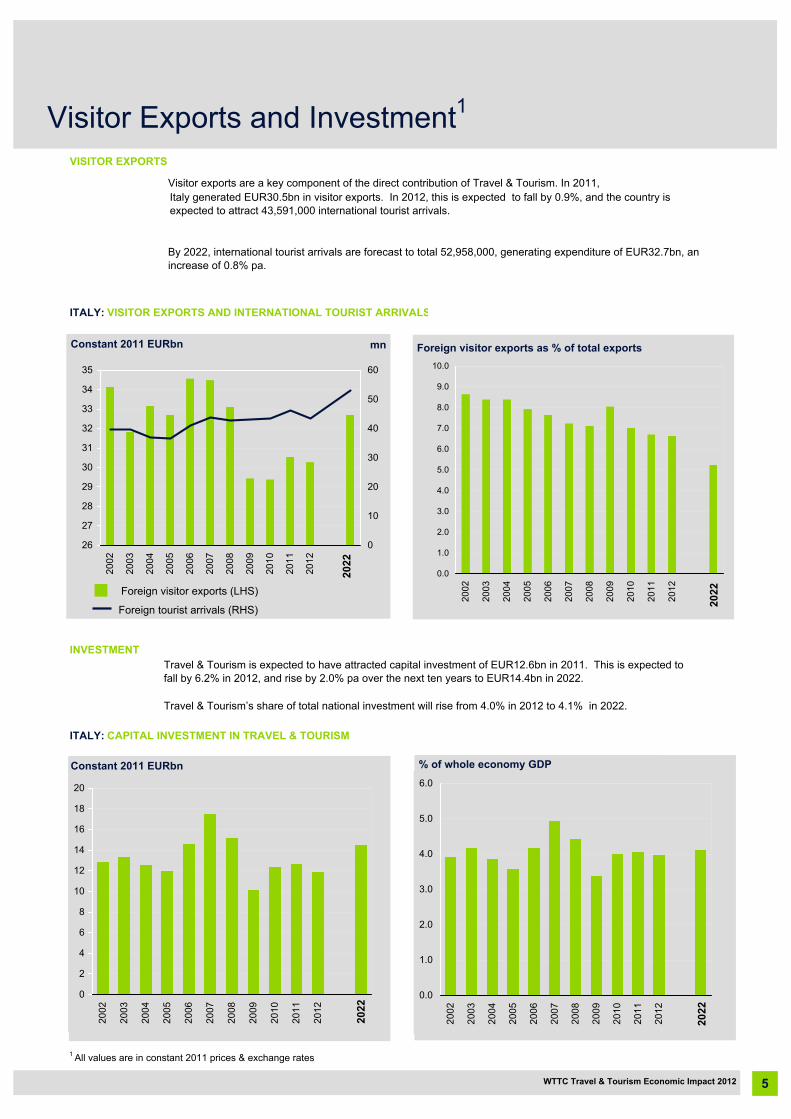
Visitor exports are a key component of the direct contribution of Travel & Tourism. In 2011,Italy generated EUR30.5bn in visitor exports. In 2012, this is expected to fall by 0.9%, and the country is expected to attract 43,591,000 international tourist arrivals.
By 2022, international tourist arrivals are forecast to total 52,958,000, generating expenditure of EUR32.7bn, an increase of 0.8% pa.
Constant 2011 EURbn Foreign visitor exports as % of total exports
0.0
1.0
2.0
3.0
4.0
5.0
6.0
7.0
8.0
9.0
10.0
2002
2003
2004
2005
2006
2007
2008
2009
2010
2011
2012
2022
2022
Travel & Tourism is expected to have attracted capital investment of EUR12.6bn in 2011. This is expected to fall by 6.2% in 2012, and rise by 2.0% pa over the next ten years to EUR14.4bn in 2022.
Travel & Tourism’s share of total national investment will rise from 4.0% in 2012 to 4.1% in 2022.
Constant 2011 EURbn
0
2
4
6
8
10
12
14
16
18
20
2002
2003
2004
2005
2006
2007
2008
2009
2010
2011
2012
2022
2022
0.0
1.0
2.0
3.0
4.0
5.0
6.0
2002
2003
2004
2005
2006
2007
2008
2009
2010
2011
2012
2022
2022
% of whole economy GDP
WTTC Travel & Tourism Economic Impact 2012
mn
Foreign tourist arrivals (RHS)
26
27
28
29
30
31
32
33
34
35
2002
2003
2004
2005
2006
2007
2008
2009
2010
2011
2012
2022
0
10
20
30
40
50
60
Foreign visitor exports (LHS)
2022
Leisure spending
Business spending
Foreign visitor spending
Domestic spending
Direct
Induced
Indirect
26.7%
8.1%
7.3% 1 All values are in constant 2011 prices & exchange rates
42.0%
(c) Government collective
Indirect is the sum of: (a) Supply chain
(b) Investment
37.8%
20.2%
32.5%
67.5%
74.7%
25.3%
6 WTTC Travel & Tourism Economic Impact 2012
Different components ofTravel & Tourism1
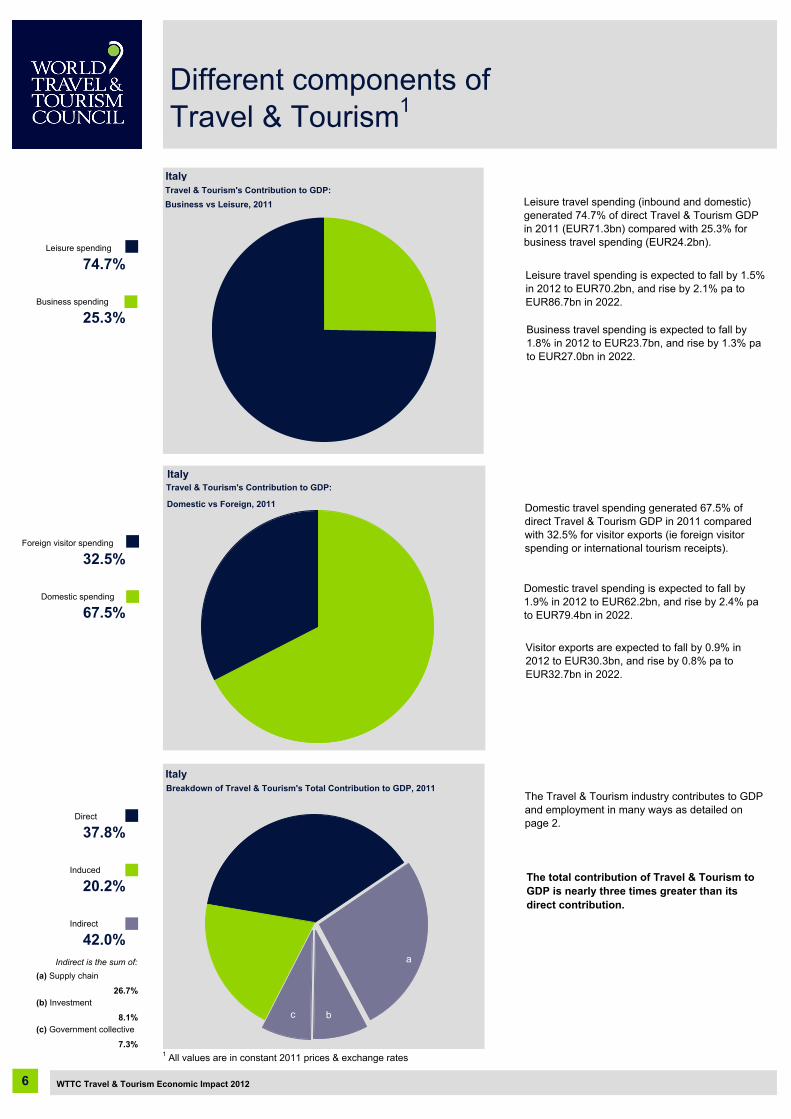
ItalyTravel & Tourism's Contribution to GDP:Business vs Leisure, 2011 Leisure travel spending (inbound and domestic)
generated 74.7% of direct Travel & Tourism GDP in 2011 (EUR71.3bn) compared with 25.3% for business travel spending (EUR24.2bn).
Business travel spending is expected to fall by 1.8% in 2012 to EUR23.7bn, and rise by 1.3% pa to EUR27.0bn in 2022.
Leisure travel spending is expected to fall by 1.5% in 2012 to EUR70.2bn, and rise by 2.1% pa to EUR86.7bn in 2022.
Italy
Domestic vs Foreign, 2011
Travel & Tourism's Contribution to GDP:
Domestic travel spending generated 67.5% of direct Travel & Tourism GDP in 2011 compared with 32.5% for visitor exports (ie foreign visitor spending or international tourism receipts).
Domestic travel spending is expected to fall by 1.9% in 2012 to EUR62.2bn, and rise by 2.4% pa to EUR79.4bn in 2022.
Visitor exports are expected to fall by 0.9% in 2012 to EUR30.3bn, and rise by 0.8% pa to EUR32.7bn in 2022.
c b
a
ItalyBreakdown of Travel & Tourism's Total Contribution to GDP, 2011
The Travel & Tourism industry contributes to GDP and employment in many ways as detailed on page 2.
The total contribution of Travel & Tourism to GDP is nearly three times greater than its direct contribution.
2011 2011(US$bn) (US$bn)
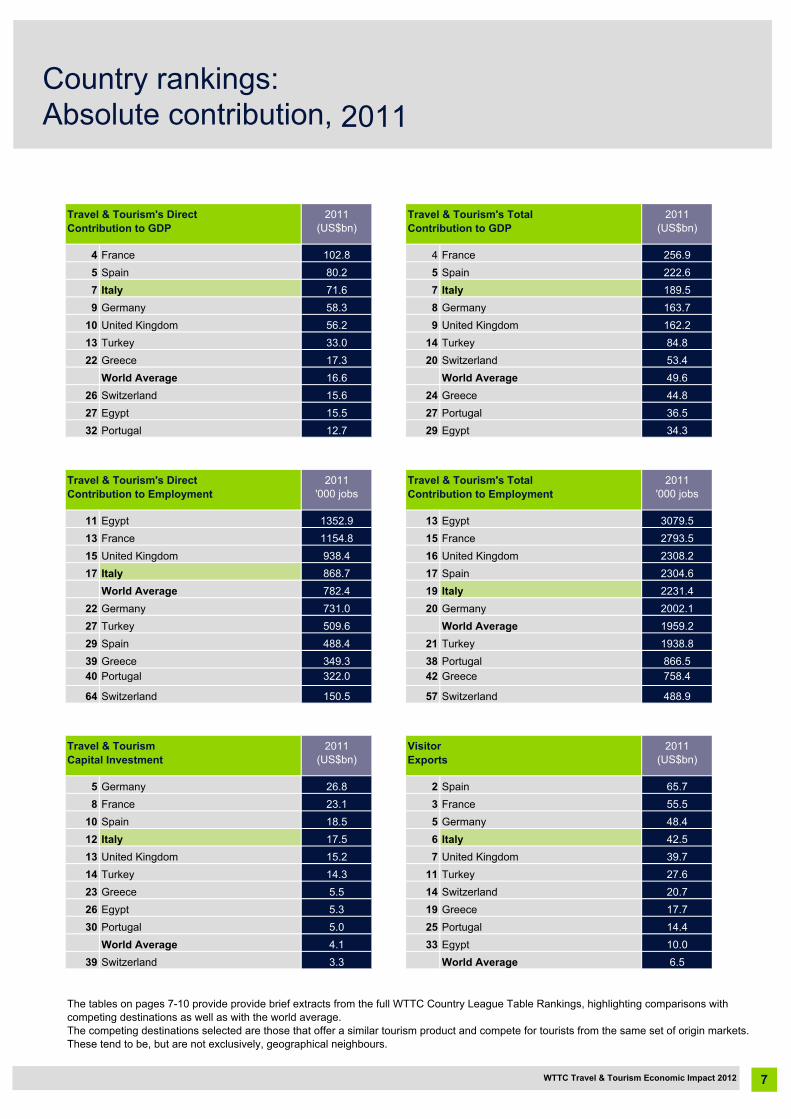
4 France 102.8 4 France 256.95 Spain 80.2 5 Spain 222.67 Italy 71.6 7 Italy 189.59 Germany 58.3 8 Germany 163.7
10 United Kingdom 56.2 9 United Kingdom 162.213 Turkey 33.0 14 Turkey 84.822 Greece 17.3 20 Switzerland 53.4
World Average 16.6 World Average 49.626 Switzerland 15.6 24 Greece 44.827 Egypt 15.5 27 Portugal 36.532 Portugal 12.7 29 Egypt 34.3
2011 2011'000 jobs '000 jobs
11 Egypt 1352.9 13 Egypt 3079.513 France 1154.8 15 France 2793.515 United Kingdom 938.4 16 United Kingdom 2308.217 Italy 868.7 17 Spain 2304.6
World Average 782.4 19 Italy 2231.422 Germany 731.0 20 Germany 2002.127 Turkey 509.6 World Average 1959.229 Spain 488.4 21 Turkey 1938.839 Greece 349.3 38 Portugal 866.540 Portugal 322.0 42 Greece 758.4
64 Switzerland 150.5 57 Switzerland 488.9
2011 2011(US$bn) (US$bn)
5 Germany 26.8 2 Spain 65.78 France 23.1 3 France 55.5
10 Spain 18.5 5 Germany 48.412 Italy 17.5 6 Italy 42.513 United Kingdom 15.2 7 United Kingdom 39.714 Turkey 14.3 11 Turkey 27.623 Greece 5.5 14 Switzerland 20.726 Egypt 5.3 19 Greece 17.730 Portugal 5.0 25 Portugal 14.4
World Average 4.1 33 Egypt 10.039 Switzerland 3.3 World Average 6.5
Capital InvestmentVisitorExports
The competing destinations selected are those that offer a similar tourism product and compete for tourists from the same set of origin markets. These tend to be, but are not exclusively, geographical neighbours.
The tables on pages 7-10 provide provide brief extracts from the full WTTC Country League Table Rankings, highlighting comparisons with competing destinations as well as with the world average.
Travel & Tourism's Direct Contribution to GDP Contribution to GDP
Travel & Tourism's Total
Travel & Tourism's Direct Contribution to Employment
Travel & Tourism's Total Contribution to Employment
Travel & Tourism
Country rankings: Absolute contribution, 2011
7WTTC Travel & Tourism Economic Impact 2012
2011 2011% share % share
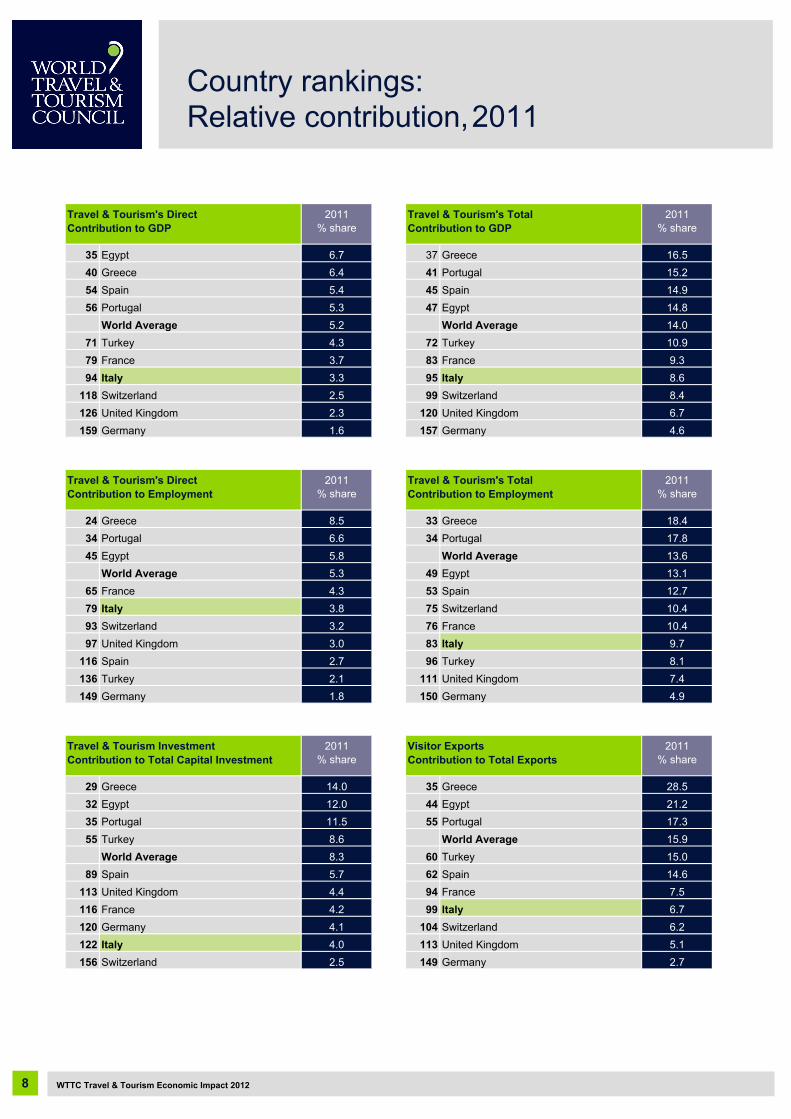
35 Egypt 6.7 37 Greece 16.540 Greece 6.4 41 Portugal 15.254 Spain 5.4 45 Spain 14.956 Portugal 5.3 47 Egypt 14.8
World Average 5.2 World Average 14.071 Turkey 4.3 72 Turkey 10.979 France 3.7 83 France 9.394 Italy 3.3 95 Italy 8.6
118 Switzerland 2.5 99 Switzerland 8.4126 United Kingdom 2.3 120 United Kingdom 6.7159 Germany 1.6 157 Germany 4.6
2011 2011% share % share
24 Greece 8.5 33 Greece 18.434 Portugal 6.6 34 Portugal 17.845 Egypt 5.8 World Average 13.6
World Average 5.3 49 Egypt 13.165 France 4.3 53 Spain 12.779 Italy 3.8 75 Switzerland 10.493 Switzerland 3.2 76 France 10.497 United Kingdom 3.0 83 Italy 9.7
116 Spain 2.7 96 Turkey 8.1136 Turkey 2.1 111 United Kingdom 7.4149 Germany 1.8 150 Germany 4.9
2011 2011% share % share
29 Greece 14.0 35 Greece 28.532 Egypt 12.0 44 Egypt 21.235 Portugal 11.5 55 Portugal 17.355 Turkey 8.6 World Average 15.9
World Average 8.3 60 Turkey 15.089 Spain 5.7 62 Spain 14.6
113 United Kingdom 4.4 94 France 7.5116 France 4.2 99 Italy 6.7120 Germany 4.1 104 Switzerland 6.2122 Italy 4.0 113 United Kingdom 5.1156 Switzerland 2.5 149 Germany 2.7
Travel & Tourism's Direct Contribution to GDP Contribution to GDP
Travel & Tourism's Total
Travel & Tourism's Direct Contribution to Employment
Travel & Tourism's Total Contribution to Employment
Travel & Tourism InvestmentContribution to Total Capital Investment
Visitor ExportsContribution to Total Exports
WTTC Travel & Tourism Economic Impact 2012
Country rankings: Relative contribution,2011
8

2012 2012% growth % growth
World Average 2.7 World Average 2.5118 Turkey 1.7 105 Switzerland 2.4124 Switzerland 1.4 111 Turkey 1.9126 United Kingdom 1.3 129 United Kingdom 0.7138 France 0.7 137 France 0.1143 Germany 0.0 158 Egypt -1.4147 Egypt -0.6 161 Spain -1.7161 Spain -1.5 162 Germany -1.8162 Italy -1.6 166 Portugal -2.1168 Greece -2.1 167 Italy -2.2170 Portugal -2.2 179 Greece -4.5
2012 2012% growth % growth
57 Turkey 4.4 61 Turkey 3.4World Average 2.2 68 Switzerland 2.7
101 Switzerland 2.0 World Average 1.980 United Kingdom 1.7 116 United Kingdom 0.385 Egypt 0.6 123 Egypt -0.270 Greece 0.2 125 Portugal -0.3
133 France 0.2 130 France -0.4129 Portugal -0.3 154 Greece -2.3167 Germany -1.1 155 Spain -2.4134 Spain -1.3 156 Italy -2.5114 Italy -1.3 161 Germany -2.9
2012 2012% growth % growth
21 Switzerland 11.0 46 Egypt 5.785 Turkey 4.9 68 United Kingdom 4.2
World Average 3.1 94 France 2.7112 Portugal 2.7 96 Switzerland 2.5125 United Kingdom 1.8 World Average 1.6126 Germany 1.8 114 Greece 0.9144 Spain 0.2 125 Portugal 0.6155 France -1.4 146 Italy -0.9170 Egypt -5.9 153 Turkey -1.6171 Italy -6.2 154 Spain -2.0178 Greece -12.6 157 Germany -2.4
Travel & Tourism's Direct Contribution to GDP Contribution to GDP
Travel & Tourism's Total
Travel & Tourism's Direct Contribution to Employment
Travel & Tourism's Total Contribution to Employment
Travel & TourismInvestment
VisitorExports
Country rankings: Real growth, 2012
9WTTC Travel & Tourism Economic Impact 2012
2012 - 2022 2012 - 2022% growth pa % growth pa
67 Egypt 4.6 59 Egypt 4.8World Average 4.1 World Average 4.1
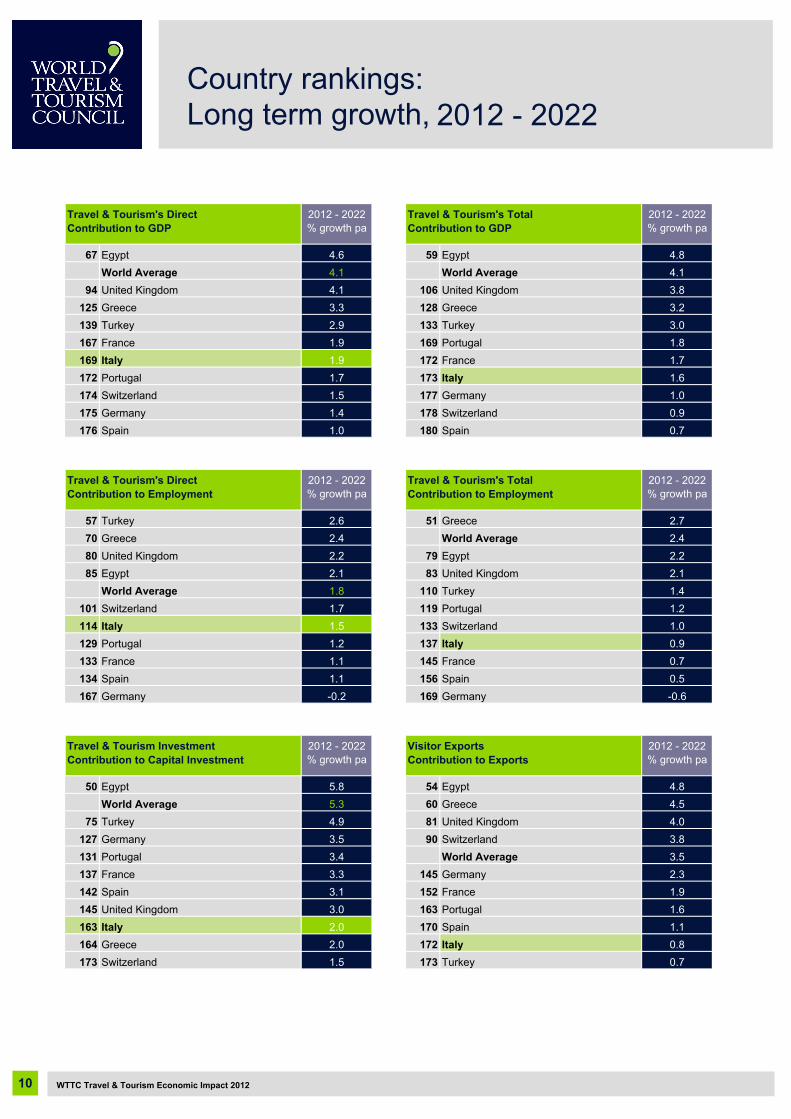
94 United Kingdom 4.1 106 United Kingdom 3.8125 Greece 3.3 128 Greece 3.2139 Turkey 2.9 133 Turkey 3.0167 France 1.9 169 Portugal 1.8169 Italy 1.9 172 France 1.7172 Portugal 1.7 173 Italy 1.6174 Switzerland 1.5 177 Germany 1.0175 Germany 1.4 178 Switzerland 0.9176 Spain 1.0 180 Spain 0.7
2012 - 2022 2012 - 2022% growth pa % growth pa
57 Turkey 2.6 51 Greece 2.770 Greece 2.4 World Average 2.480 United Kingdom 2.2 79 Egypt 2.285 Egypt 2.1 83 United Kingdom 2.1
World Average 1.8 110 Turkey 1.4101 Switzerland 1.7 119 Portugal 1.2114 Italy 1.5 133 Switzerland 1.0129 Portugal 1.2 137 Italy 0.9133 France 1.1 145 France 0.7134 Spain 1.1 156 Spain 0.5167 Germany -0.2 169 Germany -0.6
2012 - 2022 2012 - 2022% growth pa % growth pa
50 Egypt 5.8 54 Egypt 4.8World Average 5.3 60 Greece 4.5
75 Turkey 4.9 81 United Kingdom 4.0127 Germany 3.5 90 Switzerland 3.8131 Portugal 3.4 World Average 3.5137 France 3.3 145 Germany 2.3142 Spain 3.1 152 France 1.9145 United Kingdom 3.0 163 Portugal 1.6163 Italy 2.0 170 Spain 1.1164 Greece 2.0 172 Italy 0.8173 Switzerland 1.5 173 Turkey 0.7
Contribution to Capital InvestmentVisitor ExportsContribution to Exports
Travel & Tourism's Direct Contribution to GDP Contribution to GDP
Travel & Tourism's Total
Travel & Tourism's Direct Contribution to Employment
Travel & Tourism's Total Contribution to Employment
Travel & Tourism Investment
WTTC Travel & Tourism Economic Impact 2012
Country rankings: Long term growth, 2012 - 2022
10
2012
Italy EURbn % of total Growth2 EURbn % of total Growth3
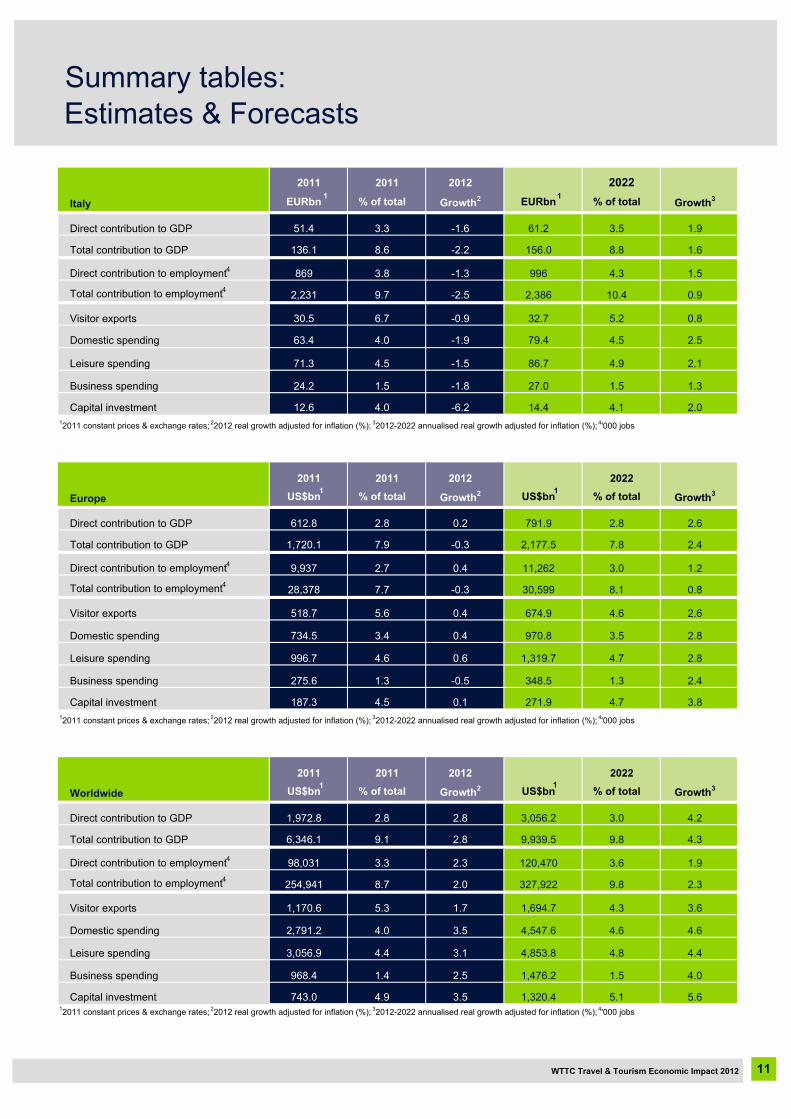
Direct contribution to GDP 51.4 3.3 -1.6 61.2 3.5 1.9
Total contribution to GDP 136.1 8.6 -2.2 156.0 8.8 1.6
Direct contribution to employment4 869 3.8 -1.3 996 4.3 1.5
Total contribution to employment4 2,231 9.7 -2.5 2,386 10.4 0.9
Visitor exports 30.5 6.7 -0.9 32.7 5.2 0.8
Domestic spending 63.4 4.0 -1.9 79.4 4.5 2.5
Leisure spending 71.3 4.5 -1.5 86.7 4.9 2.1
Business spending 24.2 1.5 -1.8 27.0 1.5 1.3
Capital investment 12.6 4.0 -6.2 14.4 4.1 2.012011 constant prices & exchange rates; 22012 real growth adjusted for inflation (%); 32012-2022 annualised real growth adjusted for inflation (%); 4'000 jobs
2012
Europe US$bn % of total Growth2 US$bn % of total Growth3
Direct contribution to GDP 612.8 2.8 0.2 791.9 2.8 2.6
Total contribution to GDP 1,720.1 7.9 -0.3 2,177.5 7.8 2.4
Direct contribution to employment4 9,937 2.7 0.4 11,262 3.0 1.2
Total contribution to employment4 28,378 7.7 -0.3 30,599 8.1 0.8
Visitor exports 518.7 5.6 0.4 674.9 4.6 2.6
Domestic spending 734.5 3.4 0.4 970.8 3.5 2.8
Leisure spending 996.7 4.6 0.6 1,319.7 4.7 2.8
Business spending 275.6 1.3 -0.5 348.5 1.3 2.4
Capital investment 187.3 4.5 0.1 271.9 4.7 3.812011 constant prices & exchange rates; 22012 real growth adjusted for inflation (%); 32012-2022 annualised real growth adjusted for inflation (%); 4'000 jobs
2012
Worldwide US$bn % of total Growth2 US$bn % of total Growth3
Direct contribution to GDP 1,972.8 2.8 2.8 3,056.2 3.0 4.2
Total contribution to GDP 6,346.1 9.1 2.8 9,939.5 9.8 4.3
Direct contribution to employment4 98,031 3.3 2.3 120,470 3.6 1.9
Total contribution to employment4 254,941 8.7 2.0 327,922 9.8 2.3
Visitor exports 1,170.6 5.3 1.7 1,694.7 4.3 3.6
Domestic spending 2,791.2 4.0 3.5 4,547.6 4.6 4.6
Leisure spending 3,056.9 4.4 3.1 4,853.8 4.8 4.4
Business spending 968.4 1.4 2.5 1,476.2 1.5 4.0
Capital investment 743.0 4.9 3.5 1,320.4 5.1 5.612011 constant prices & exchange rates; 22012 real growth adjusted for inflation (%); 32012-2022 annualised real growth adjusted for inflation (%); 4'000 jobs
2011
2011
2011 2011 2022
2011 2022
2011 2022
WTTC Travel & Tourism Economic Impact 2012 11
Summary tables:Estimates & Forecasts
1
1
1
1
1
1
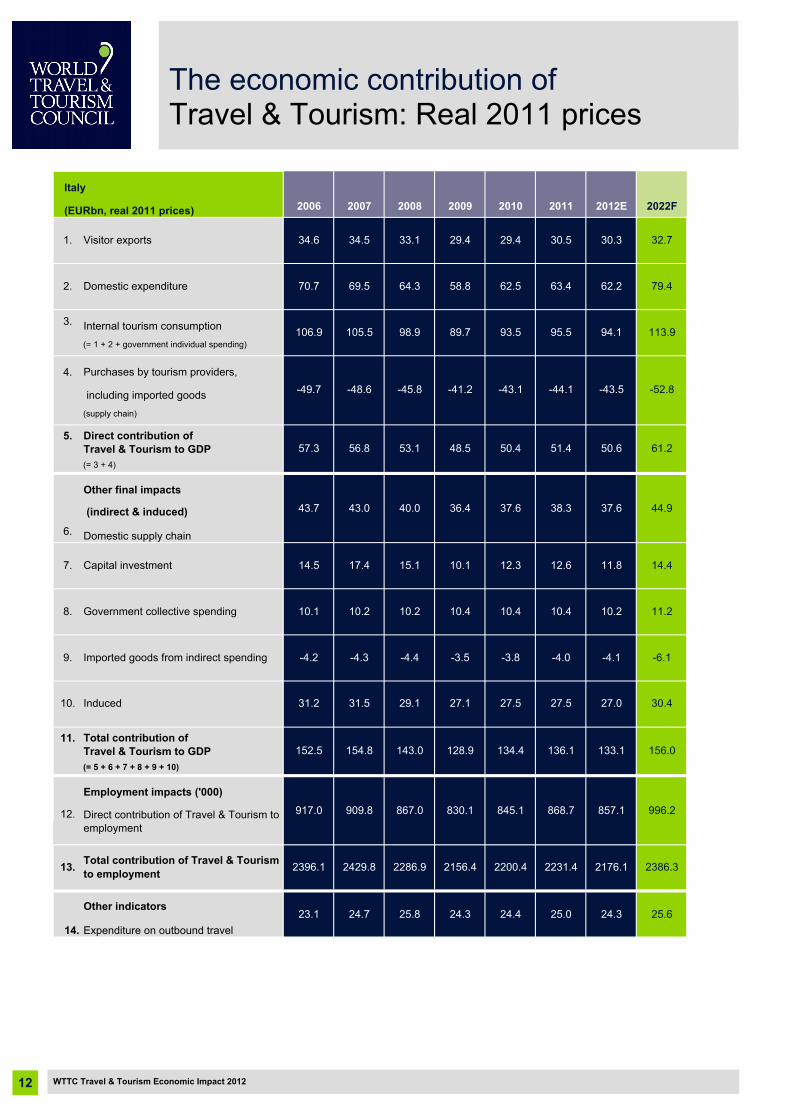
2006 2007 2008 2009 2010 2011 2012E 2022F
3. Internal tourism consumption(= 1 + 2 + government individual spending)
4. Purchases by tourism providers,
including imported goods (supply chain)
5. Direct contribution of Travel & Tourism to GDP(= 3 + 4)
Other final impacts
(indirect & induced)
6. Domestic supply chain
11. Total contribution of Travel & Tourism to GDP(= 5 + 6 + 7 + 8 + 9 + 10)
Employment impacts ('000)
12.
Other indicators
14. Expenditure on outbound travel
57.3 56.8 51.4 50.6
-52.8
53.1 48.5 50.4
-43.1 -44.1 -43.5
29.4 30.5 30.3
-49.7 -48.6 -41.2-45.8
34.6 34.5 33.1
Italy
(EURbn, real 2011 prices)
1. Visitor exports 29.4 32.7
2. Domestic expenditure 70.7 69.5 64.3 58.8 62.5 63.4 62.2
-6.1
79.4
106.9 105.5 98.9 89.7 93.5 95.5 94.1 113.9
2176.1
61.2
2386.3
156.0
857.1 996.2
133.1
37.6 44.9
917.0 909.8 867.0 830.1
Induced
152.5 154.8 143.0
31.2 31.5 29.1
9.
128.9 134.4
7. Capital investment
8. Government collective spending
43.7 43.0
24.3 24.4 25.0 24.3 25.6
Direct contribution of Travel & Tourism to employment
Imported goods from indirect spending
10.
-4.2 -4.3 -4.4 -3.5 -3.8 -4.0
40.0 36.4 37.6 38.3
14.5 17.4 15.1 10.1 12.3 12.6 11.8 14.4
10.1 10.2 10.2 10.4
2156.4 2200.4 2231.4
11.210.4 10.4 10.2
-4.1
27.027.1 27.5 27.5
845.1 868.7
136.1
30.4
13.
23.1 24.7 25.8
Total contribution of Travel & Tourism to employment 2396.1 2429.8 2286.9
WTTC Travel & Tourism Economic Impact 201212
The economic contribution ofTravel & Tourism: Real 2011 prices

2006 2007 2008 2009 2010 2011 2012E 2022F
3. Internal tourism consumption(= 1 + 2 + government individual spending)
4. Purchases by tourism providers,
including imported goods (supply chain)
5. Direct contribution of Travel & Tourism to GDP(= 3 + 4)
Other final impacts
(indirect & induced)
6. Domestic supply chain
11. Total contribution of Travel & Tourism to GDP(= 5 + 6 + 7 + 8 + 9 + 10)
Employment impacts ('000)
12.
Other indicators
14. Expenditure on outbound travel
Historical data for concepts has been benchmarked to match reported TSA data where available.
52.6 53.4 51.4 51.4
-64.3
51.2 47.7 49.8
-42.5 -44.1 -44.1
29.0 30.5 30.7
-45.5 -45.7 -40.6-44.2
31.7 32.4 31.9
Italy
(EURbn, nominal prices)
1. Visitor exports 29.0 40.0
2. Domestic expenditure 65.0 65.3 62.0 57.8 61.7 63.4 63.2
-7.5
97.0
98.1 99.1 95.4 88.3 92.2 95.5 95.4 139.0
2176.1
74.7
2386.3
190.7
857.1 996.2
135.2
38.2 54.9
-4.2
917.0 909.8 867.0 830.1
27.4Induced
140.1 145.5 137.9
28.6 29.6 28.0
9.
126.9 132.7
7. Capital investment
8. Government collective spending
40.1 40.4
23.9 24.1 25.0 24.7 31.3
Direct contribution of Travel & Tourism to employment
Imported goods from indirect spending
10.
-3.9 -4.0 -4.3 -3.4 -3.7 -4.0
38.5 35.8 37.1 38.3
13.3 16.4 14.5 9.9 12.2 12.6 12.0 17.6
13.79.3 9.6 9.9 10.2 10.3 10.4 10.4
2286.9
26.6 27.1 27.5
845.1 868.7
136.1
2156.4 2200.4 2231.4
*Concepts shown in this table align with the standard table totals as described in the 2008 Tourism Satellite Account: Recommended Methodological Framework (TSA: RMF 2008) developed by the United Nations Statistical Division (UNSD), the Statistical Officeof the European Communities (EUROSTAT), the Organisation for Economic Co-operation and Development (OECD) and the World Tourism Organization (UNWTO).
37.2
13.
21.2 23.2 24.9
Total contribution of Travel & Tourism to employment 2396.1 2429.8
WTTC Travel & Tourism Economic Impact 2012 13
The economic contribution ofTravel & Tourism: Nominal prices
2006 2007 2008 2009 2010 2011 2012E 2022F
3. Internal tourism consumption(= 1 + 2 + government individual spending)
4. Purchases by tourism providers,
including imported goods (supply chain)
5. Direct contribution of Travel & Tourism to GDP(= 3 + 4)
Other final impacts
(indirect & induced)
6. Domestic supply chain
11. Total contribution of Travel & Tourism to GDP(= 5 + 6 + 7 + 8 + 9 + 10)
Employment impacts ('000)
12.
Other indicators
14. Expenditure on outbound travel
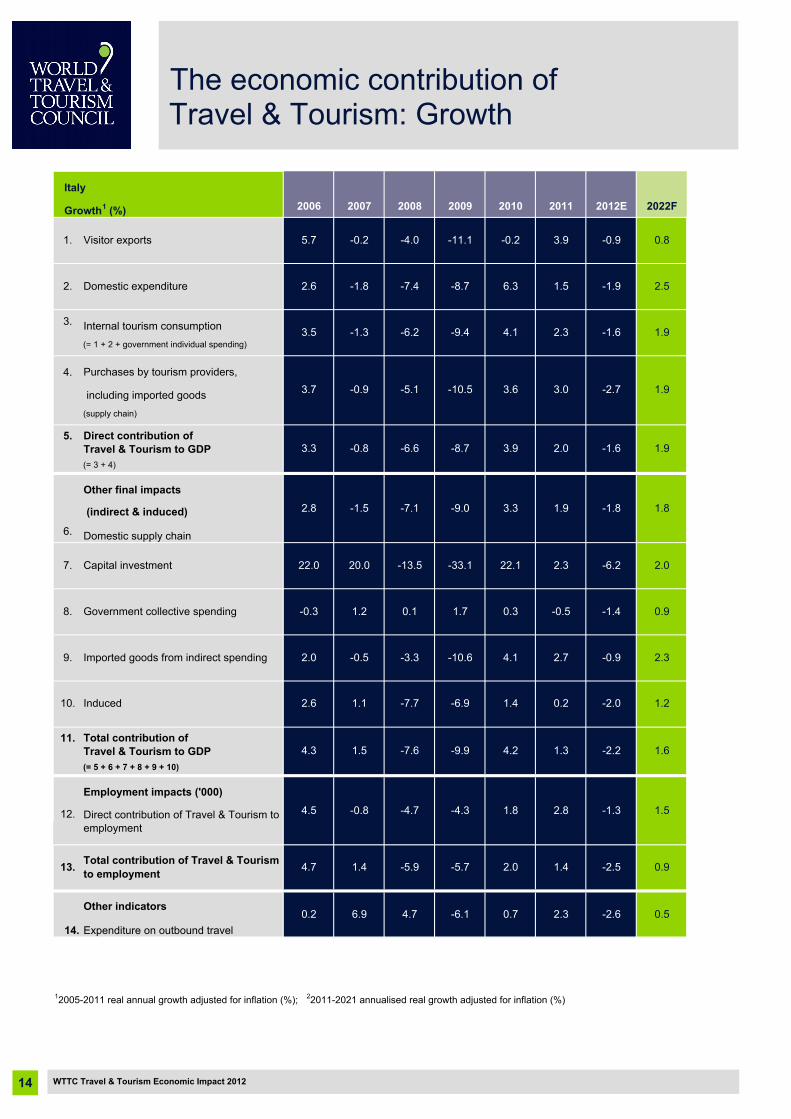
12005-2011 real annual growth adjusted for inflation (%); 22011-2021 annualised real growth adjusted for inflation (%)
1.2
13.
0.2 6.9 4.7
Total contribution of Travel & Tourism to employment 4.7 1.4 -5.9
-6.9 1.4 0.2
1.8 2.8
1.3
-5.7 2.0 1.4
0.9-0.3 1.2 0.1 1.7 0.3 -0.5 -1.4
22.1 2.3 -6.2 2.022.0 20.0 -13.5 -33.1
-7.1 -9.0 3.3 1.9
0.5
Direct contribution of Travel & Tourism to employment
Imported goods from indirect spending
10.
2.0 -0.5 -3.3 -10.6 4.1 2.7
-6.1 0.7 2.3 -2.6
9.
-9.9 4.2
7. Capital investment
8. Government collective spending
2.8 -1.5
Induced
4.3 1.5 -7.6
2.6 1.1 -7.7
-0.9
4.5 -0.8 -4.7 -4.3
-2.0
1.9
-2.5
1.9
0.9
1.6
-1.3 1.5
-2.2
-1.8 1.8
-1.9
2.3
2.5
3.5 -1.3 -6.2 -9.4 4.1 2.3 -1.6
-11.1 0.8
2. Domestic expenditure 2.6 -1.8 -7.4 -8.7 6.3 1.5
Italy
Growth1 (%)
1. Visitor exports -0.2 3.9 -0.9
3.7 -0.9 -10.5-5.1
5.7 -0.2 -4.0
1.9
-6.6 -8.7 3.9
3.6 3.0 -2.7
3.3 -0.8 2.0 -1.6
WTTC Travel & Tourism Economic Impact 201214
The economic contribution ofTravel & Tourism: Growth
WTTC Travel & Tourism Economic Impact 2012 15
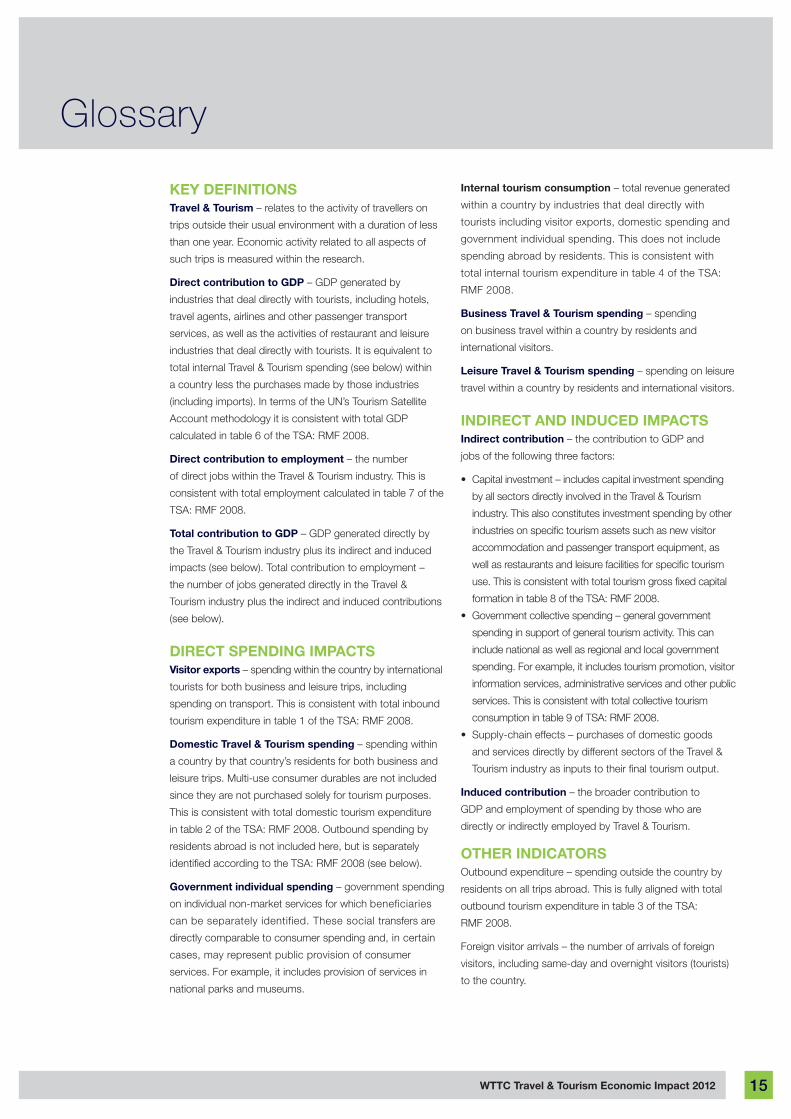
Glossary
KEy DEFINITIONSTravel & Tourism – relates to the activity of travellers on
trips outside their usual environment with a duration of less
than one year. Economic activity related to all aspects of
such trips is measured within the research.
Direct contribution to GDP – GDP generated by
industries that deal directly with tourists, including hotels,
travel agents, airlines and other passenger transport
services, as well as the activities of restaurant and leisure
industries that deal directly with tourists. It is equivalent to
total internal Travel & Tourism spending (see below) within
a country less the purchases made by those industries
(including imports). In terms of the UN’s Tourism Satellite
Account methodology it is consistent with total GDP
calculated in table 6 of the TSA: RMF 2008.
Direct contribution to employment – the number
of direct jobs within the Travel & Tourism industry. This is
consistent with total employment calculated in table 7 of the
TSA: RMF 2008.
Total contribution to GDP – GDP generated directly by
the Travel & Tourism industry plus its indirect and induced
impacts (see below). Total contribution to employment –
the number of jobs generated directly in the Travel &
Tourism industry plus the indirect and induced contributions
(see below).
DIRECT SPENDING IMPACTSVisitor exports – spending within the country by international
tourists for both business and leisure trips, including
spending on transport. This is consistent with total inbound
tourism expenditure in table 1 of the TSA: RMF 2008.
Domestic Travel & Tourism spending – spending within
a country by that country’s residents for both business and
leisure trips. Multi-use consumer durables are not included
since they are not purchased solely for tourism purposes.
This is consistent with total domestic tourism expenditure
in table 2 of the TSA: RMF 2008. Outbound spending by
residents abroad is not included here, but is separately
identified according to the TSA: RMF 2008 (see below).
Government individual spending – government spending
on individual non-market services for which beneficiaries
can be separately identified. These social transfers are
directly comparable to consumer spending and, in certain
cases, may represent public provision of consumer
services. For example, it includes provision of services in
national parks and museums.
Internal tourism consumption – total revenue generated
within a country by industries that deal directly with
tourists including visitor exports, domestic spending and
government individual spending. This does not include
spending abroad by residents. This is consistent with
total internal tourism expenditure in table 4 of the TSA:
RMF 2008.
Business Travel & Tourism spending – spending
on business travel within a country by residents and
international visitors.
Leisure Travel & Tourism spending – spending on leisure
travel within a country by residents and international visitors.
INDIRECT AND INDuCED IMPACTSIndirect contribution – the contribution to GDP and
jobs of the following three factors:
• Capital investment – includes capital investment spending
by all sectors directly involved in the Travel & Tourism
industry. This also constitutes investment spending by other
industries on specific tourism assets such as new visitor
accommodation and passenger transport equipment, as
well as restaurants and leisure facilities for specific tourism
use. This is consistent with total tourism gross fixed capital
formation in table 8 of the TSA: RMF 2008.
• Government collective spending – general government
spending in support of general tourism activity. This can
include national as well as regional and local government
spending. For example, it includes tourism promotion, visitor
information services, administrative services and other public
services. This is consistent with total collective tourism
consumption in table 9 of TSA: RMF 2008.
• Supply-chain effects – purchases of domestic goods
and services directly by different sectors of the Travel &
Tourism industry as inputs to their final tourism output.
Induced contribution – the broader contribution to
GDP and employment of spending by those who are
directly or indirectly employed by Travel & Tourism.
OThER INDICATORS Outbound expenditure – spending outside the country by
residents on all trips abroad. This is fully aligned with total
outbound tourism expenditure in table 3 of the TSA:
RMF 2008.
Foreign visitor arrivals – the number of arrivals of foreign
visitors, including same-day and overnight visitors (tourists)
to the country.
WTTC Travel & Tourism Economic Impact 201216
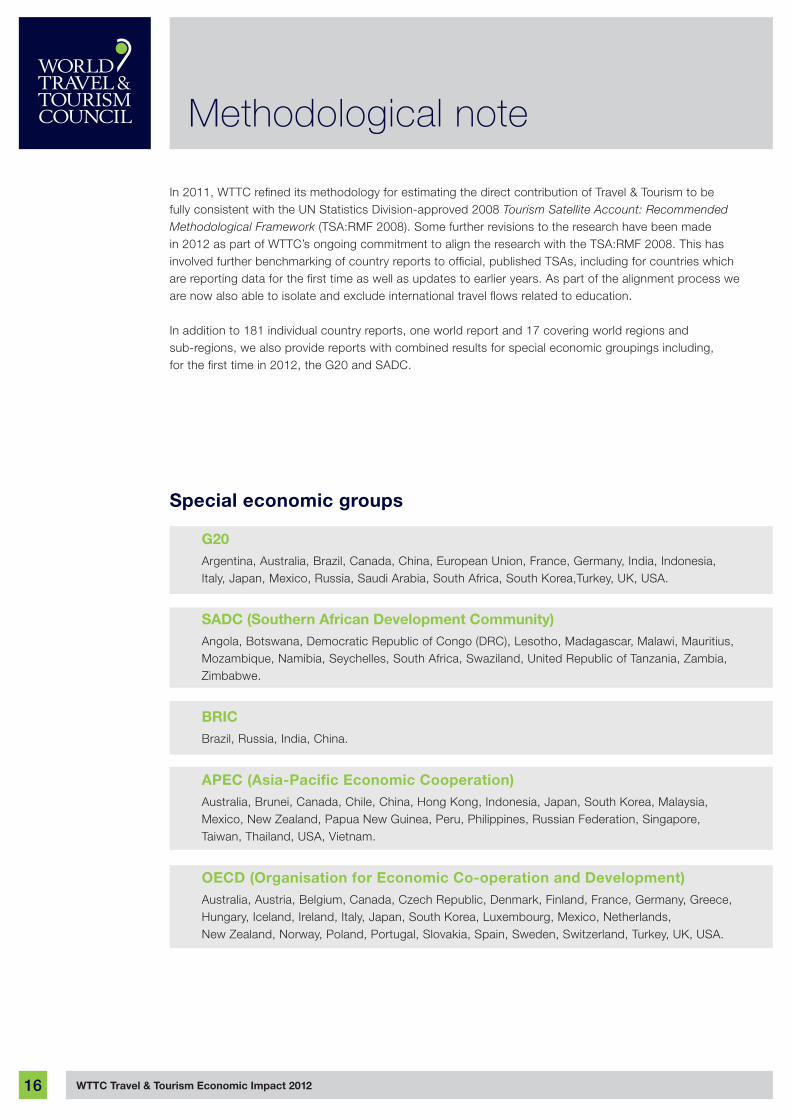
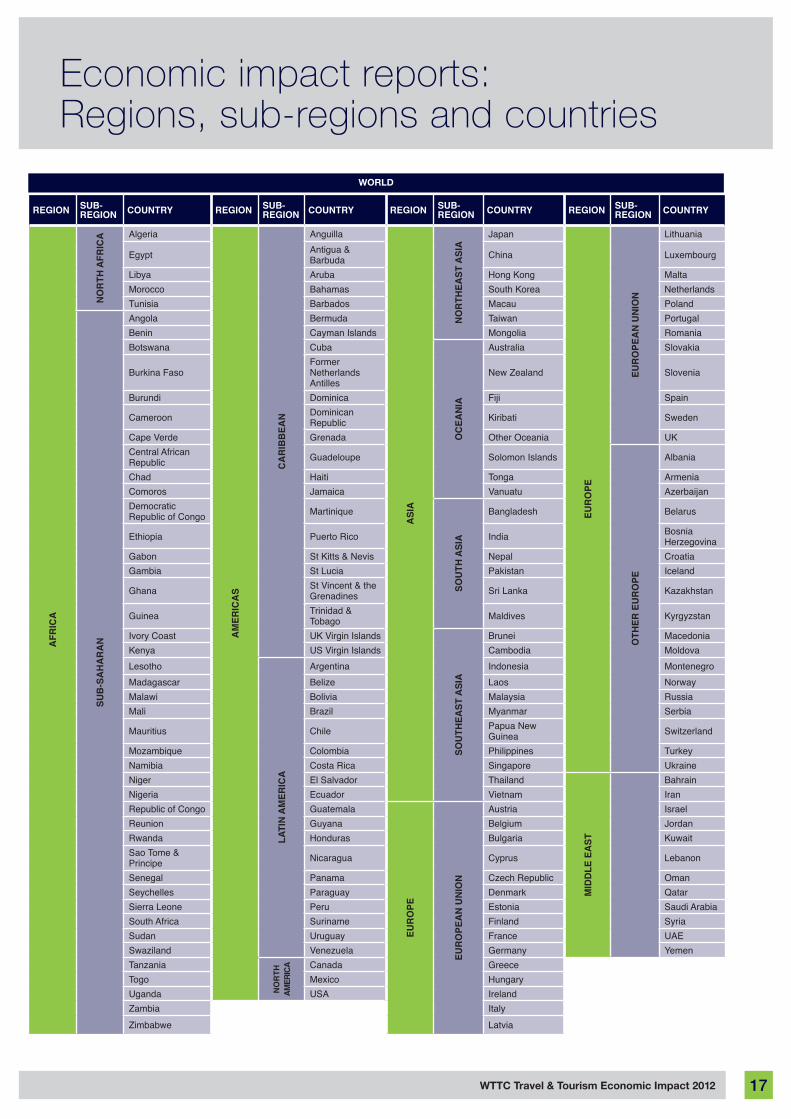
In 2011, WTTC refined its methodology for estimating the direct contribution of Travel & Tourism to be fully consistent with the UN Statistics Division-approved 2008 Tourism Satellite Account: Recommended Methodological Framework (TSA:RMF 2008). Some further revisions to the research have been made in 2012 as part of WTTC’s ongoing commitment to align the research with the TSA:RMF 2008. This has involved further benchmarking of country reports to official, published TSAs, including for countries which are reporting data for the first time as well as updates to earlier years. As part of the alignment process we are now also able to isolate and exclude international travel flows related to education. In addition to 181 individual country reports, one world report and 17 covering world regions and sub-regions, we also provide reports with combined results for special economic groupings including, for the first time in 2012, the G20 and SADC.
Special economic groups
G20Argentina, Australia, Brazil, Canada, China, European Union, France, Germany, India, Indonesia, Italy, Japan, Mexico, Russia, Saudi Arabia, South Africa, South Korea,Turkey, UK, USA.
SADC (Southern African Development Community)Angola, Botswana, Democratic Republic of Congo (DRC), Lesotho, Madagascar, Malawi, Mauritius, Mozambique, Namibia, Seychelles, South Africa, Swaziland, United Republic of Tanzania, Zambia, Zimbabwe.
BRICBrazil, Russia, India, China.
APEC (Asia-Pacific Economic Cooperation) Australia, Brunei, Canada, Chile, China, Hong Kong, Indonesia, Japan, South Korea, Malaysia, Mexico, New Zealand, Papua New Guinea, Peru, Philippines, Russian Federation, Singapore, Taiwan, Thailand, USA, Vietnam.
OECD (Organisation for Economic Co-operation and Development)Australia, Austria, Belgium, Canada, Czech Republic, Denmark, Finland, France, Germany, Greece, Hungary, Iceland, Ireland, Italy, Japan, South Korea, Luxembourg, Mexico, Netherlands, New Zealand, Norway, Poland, Portugal, Slovakia, Spain, Sweden, Switzerland, Turkey, UK, USA.
Methodological note
WTTC Travel & Tourism Economic Impact 2012 17
WORLD
Economic impact reports:Regions, sub-regions and countries
Region Sub-Region CountRy Region Sub-
Region CountRy Region Sub-Region CountRy Region Sub-
Region CountRy
AfR
iCA
no
Rth
AfR
iCA Algeria
Am
eRiC
AS
CA
Rib
beA
n
Anguilla
ASi
A
no
Rth
eASt
ASi
A
Japan
euR
ope
euR
ope
An
un
ion
Lithuania
Egypt Antigua & Barbuda China Luxembourg
Libya Aruba Hong Kong MaltaMorocco Bahamas South Korea NetherlandsTunisia Barbados Macau Poland
Sub
-SA
hA
RA
n
Angola Bermuda Taiwan PortugalBenin Cayman Islands Mongolia RomaniaBotswana Cuba
oC
eAn
iA
Australia Slovakia
Burkina FasoFormer Netherlands Antilles
New Zealand Slovenia
Burundi Dominica Fiji Spain
Cameroon Dominican Republic Kiribati Sweden
Cape Verde Grenada Other Oceania UKCentral African Republic Guadeloupe Solomon Islands
oth
eR e
uR
ope
Albania
Chad Haiti Tonga ArmeniaComoros Jamaica Vanuatu AzerbaijanDemocratic Republic of Congo Martinique
Sou
th A
SiA
Bangladesh Belarus
Ethiopia Puerto Rico India Bosnia Herzegovina
Gabon St Kitts & Nevis Nepal CroatiaGambia St Lucia Pakistan Iceland
Ghana St Vincent & the Grenadines Sri Lanka Kazakhstan
Guinea Trinidad & Tobago Maldives Kyrgyzstan
Ivory Coast UK Virgin Islands
Sou
theA
St A
SiA
Brunei MacedoniaKenya US Virgin Islands Cambodia MoldovaLesotho
LAti
n A
meR
iCA
Argentina Indonesia MontenegroMadagascar Belize Laos NorwayMalawi Bolivia Malaysia RussiaMali Brazil Myanmar Serbia
Mauritius Chile Papua New Guinea Switzerland
Mozambique Colombia Philippines TurkeyNamibia Costa Rica Singapore UkraineNiger El Salvador Thailand
mid
dLe
eA
St
BahrainNigeria Ecuador Vietnam IranRepublic of Congo Guatemala
euR
ope
euR
ope
An
un
ion
Austria IsraelReunion Guyana Belgium JordanRwanda Honduras Bulgaria KuwaitSao Tome & Principe Nicaragua Cyprus Lebanon
Senegal Panama Czech Republic OmanSeychelles Paraguay Denmark QatarSierra Leone Peru Estonia Saudi ArabiaSouth Africa Suriname Finland SyriaSudan Uruguay France UAESwaziland Venezuela Germany YemenTanzania
no
Rth
Am
eRiC
A Canada Greece Togo Mexico HungaryUganda USA IrelandZambia ItalyZimbabwe Latvia
WTTC Travel & Tourism Economic Impact 201218
ThE WORLD TRAVEL & TOuRISM COuNCIL IS ThE FORuM FOR BuSINESS LEADERS IN ThE TRAVEL & TOuRISM INDuSTRy.
With the Chairs and Chief Executives of the 100 foremost Travel & Tourism companies as its Members, WTTC has a unique mandate and overview on all matters related to Travel & Tourism.
WTTC works to raise awareness of Travel & Tourism as one of the world’s largest industries, supporting some 255 million jobs and generating 9% of global GDP in 2011.
Together with its research partner, Oxford Economics, WTTC produces comprehensive reports on an annual basis – with updates whenever required – to quantify, compare and forecast the economic impact of Travel & Tourism on 181 economies around the world. It also publishes a World report highlighting global trends, as well as reports on regions, sub-regions and special economic groupings.
To download one-page summaries, the full reports or spreadsheets, visit www.wttc.org
ASSISTING WTTC TO PROVIDE TOOLS FOR ANALySIS, BENChMARKING, FORECASTING AND PLANNING.
Over the last 30 years Oxford Economics has built a diverse and loyal client base of over 300 organisations worldwide, including international organisations, governments, central banks, and both large and small businesses. Headquartered in Oxford, England, with offices in London, Belfast, Paris, the UAE, Singapore, Philadelphia, New York and San Francisco, Oxford Economics employs over 70 full-time, highly qualified economists and data specialists, while maintaining links with a network of economists in universities worldwide.
For more information please take advantage of a free trial on our website, www.oxfordeconomics.com, or contact John Gaster, Oxford Economics, Abbey House, 121 St Aldates, Oxford, OX1 1HB, UK.
Tel: +44 (0) 1865 268 900; email: [email protected]

CHAIRMAN
ABERCROMBIE & KENTGeoffrey J W KentFounder, Chairman & CEO
PRESIDENT & CEO
WORLD TRAVEL & TOURISM COUNCILDavid Scowsill
VICE CHAIRMEN
GLOBAL LEISURE PARTNERSMark HarmsChairman & CEO
MANDARIN ORIENTALEdouard EttedguiGroup Chief Executive
SILVERSEA CRUISESManfredi Lefebvre d’Ovidio di Balsorano de ClunieresChairman
THE TRAVEL CORPORATIONBrett TollmanPresident & Chief Executive
TUI AGDr Michael FrenzelChairman of the Executive Board
WORLD TRAVEL & TOURISM COUNCILJean-Claude Baumgarten
WYNDHAM WORLDWIDEStephen P HolmesChairman & CEO
EXECUTIVE COMMITTEE
ACCORDenis HennequinChairman & CEO
AMERICAN EXPRESS COMPANYWilliam GlennPresident, Global Merchant Network Group
BEIJING TOURISM GROUPQiang DuanChairman
BHARAT HOTELSJyotsna SuriChairperson & Managing Director
CARLSONHubert Joly President, CEO & Director
EMIRATESGary ChapmanPresident Group Services & Dnata, Emirates Group
ETIHAD AIRWAYSJames HoganCEO
HILTON WORLDWIDEChristopher J NassettaPresident & CEO
INTERCONTINENTAL HOTELS GROUP PLCRichard SolomonsChief Executive
JUMEIRAH GROUPGerald LawlessExecutive Chairman
MARRIOTT INTERNATIONAL JW Marriott, JrChairman & CEO
Arne M SorensonPresident & CEO
MELIÁ HOTELS INTERNATIONALSebastián EscarrerVice Chairman
OUTRIGGER ENTERPRISES GROUPDr Richard R KelleyChairman Emeritus
RIOFORTE INVESTMENTS SAManuel Fernando Espírito SantoChairman
SABRE HOLDINGSTom Klein President
SHUN TAK HOLDINGS Pansy HoManaging Director
TRAVEL GUARD WORLDWIDEJeffrey C RutledgeChairman & CEO
TRAVELPORTGordon WilsonPresident & CEO
TSOGO SUN GROUPJabu MabuzaDeputy Chairman
VISITBRITAINChristopher Rodrigues, CBEChairman
GLOBAL MEMBERS
ALTOURAlexandre ChemlaPresident
AMADEUS IT GROUP SALuis MarotoPresident & CEO
Jose Antonio TazónChairman of the Board
AVIS BUDGET GROUPRonald L NelsonChairman & CEO
BEIJING CAPITAL INTERNATIONAL AIRPORT COZhiyi DongChairman
Guanghui ZhangPresident & CEO
BEIJING TOURISM GROUPYi LiuPresident
BOSCOLO GROUPGiorgio BoscoloCEO
CANNERY ROW COMPANYTed J BalestreriChairman & CEO
CHINA INTERNATIONAL TRAVEL SERVICE, HEAD OFFICE (CITS)Rong ChenCEO
CHOICE HOTELS INTERNATIONALStephen P JoycePresident & CEO
COSTA CRUISESPier Luigi FoschiChairman & CEO
CTRIP.COM INTERNATIONALMin FanCEO
DEPARTMENT OF TOURISM & COMMERCE MARKETING, GOVERNMENT OF DUBAIKhalid A bin SulayemDirector General
DIAMOND RESORTSStephen J CloobeckChairman & CEO
DLA PIPERSir Nigel KnowlesCo-CEO
DOLPHIN CAPITAL INVESTORSMiltos KambouridesManaging Partner
DUBAILANDMohammed Al HabbaiCEO
DUBAI AIRPORTS INTERNATIONALPaul Denis GriffithsCEO
EAST JAPAN RAILWAY COMPANYSatoshi SeinoPresident & CEO
EXPEDIA INCDara KhosrowshahiPresident & CEO
FAIRMONT RAFFLES HOTELS INTERNATIONALChris J CahillCOO
GLOBAL BLUE GROUPPer SetterbergPresident & CEO
HERTZ CORPORATIONMark FrissoraChairman & CEO, Hertz Corporation
Michel TaridePresident, Hertz International & Executive Vice President, Hertz Corporation
HNA GROUPFeng ChenChairman of the Board
HOGG ROBINSON GROUPDavid RadcliffeChief Executive
HONG KONG & SHANGHAI HOTELSClement KwokCEO & MD
HOTELPLAN HOLDING Hans LerchVice Chairman & CEO
HUANGSHAN TOURISM GROUPJiwei XuChairman
HYATT HOTELS CORPORATIONMark S HoplamazianPresident and CEO
IBMMarty SalfenGeneral Manager, Global Travel & Transportation Industry
INDIAN HOTELS COMPANY LTDRK Krishna KumarVice Chairman
JONES LANG LASALLE HOTELSArthur de HaastGlobal CEO
JTB CORPHiromi TagawaPresident & CEO
LEBUA HOTELS & RESORTS CO LTDRattawadee BualertPresident
Deepak OhriCEO
LOEWS HOTELSJonathan M TischChairman & CEO
LOS ANGELES WORLD AIRPORTSGina Marie LindseyExecutive Director
LOTTEDong-Bin ShinChairman
MESSE BERLIN GMBHRaimund HoschPresident & CEO
MGM RESORTS INTERNATIONALJim MurrenCEO
MISSION HILLS GROUPDr Ken ChuChairman & CEO
MÖVENPICK HOTELS & RESORTSJean Gabriel PérèsPresident & CEO
NH HOTELSMariano Pérez ClaverChairman
ORBITZ WORLDWIDEBarney HarfordCEO
PAN PACIFIC HOTEL GROUPPatrick ImbardelliPresident & CEO
PHOCUSWRIGHTPhilip C WolfPresident & CEO
QUNARChenchao ZhuangCo-Founder & CEO
RADISSON EDWARDIAN HOTELSJasminder SinghChairman & CEO
REED TRAVEL EXHIBITIONSRichard MortimoreManaging Director
RELAIS & CHÂTEAUXJaume TàpiesPresident
R TAUCK & PARTNERSRobin Tauck President
S-GROUP CAPITAL MANAGEMENTVladimir YakushevManaging Partner
SHANGRI-LA INTERNATIONAL HOTEL MANAGEMENTGreg DoganPresident & CEO
SOUTH AFRICAN AIRWAYSSizakele MzimelaCEO
SPENCER STUARTJerry NoonanCo-leader, Global Hospitality & Leisure Practice
STARWOOD HOTELS & RESORTS WORLDWIDE, INCFrits D van PaasschenPresident & CEO
TAJ HOTELS RESORTS & PALACESRaymond BicksonManaging Director & CEO
TAP PORTUGALFernando PintoCEO
TRANSAERO AIRLINESAlexander PleshakovCEO
UNITED AIRLINESJeff Smisek President & CEO
Jim ComptonExecutive Vice President & CEO
VIRTUOSO Matthew D Upchurch CTCCEO
WILDERNESS SAFARISAndy Payne CEO
ZAGAT SURVEY LLCTim ZagatCo-Founder, Co-Chair & CEO
INDUSTRY PARTNERS
DELOITTEAdam WeissenbergGlobal Segment Lead - Travel Hospitality and Leisure
REGIONAL MEMBERS
DOURO AZULMario FerreiraCEO
HONORARY MEMBERS
ACCORGérard PélissonCo-Chairman, Supervisory Board
AMERICAN EXPRESS COMPANYJonathan S LinenAdviser to Chairman
ANDRÉ JORDAN GROUPAndré JordanChairman
FT MOORE P/LSir Frank Moore, AOChairman
THE HERTZ CORPORATIONFrank OlsenRetired Chairman of the Board
NOMURA INTERNATIONALLord Colin Marshall of KnightsbridgeChairman
TZ ASSOCIATES Tommaso ZanzottoPresident
UNIVERSAL MEDIACarl RudermanChairman
CHAIRMAN EMERITUS
RRE VENTURESJames D Robinson IIIGeneral PartnerWTTC Chairman (1990-1994)
IMMEDIATE PAST CHAIRMAN
GLOBAL ALLIANCE ADVISORS LLCVincent A WolfingtonChairmanWTTC Chairman (2004-2007)
FORMER CHAIRMEN
INTERCONTINENTAL HOTELS GROUP PLCSir Ian ProsserRetired ChairmanWTTC Chairman (2001-2003)
AIG INCHarvey GolubNon-Executive ChairmanWTTC Chairman (1996-2001)
ROBERT H BURNS HOLDINGS LTDRobert H BurnsChairmanWTTC Chairman (1994-1996)

1-2 Queen Victoria Terrace, Sovereign Court,
London E1W 3HA United Kingdom
Telephone: +44 (0) 20 7481 8007 Fax: +44 (0) 20 7488 1008Email: [email protected]
www.wttc.org