travel & tourism - home | wttc impact research... · tunisia: direct contribution of travel...
TRANSCRIPT

Travel & TourismECONOMIC IMPACT 2016TUNISIA

For more information, please contact:
ROCHELLE TURNER | Head of [email protected]
EVELYNE FREIERMUTH | Policy & Research [email protected]©2016 World Travel & Tourism Council
The survival of many fish species depends on migrations up and down rivers. A fish ladder provides a detour route for migrating fish past a particular obstruction on the river. Designs vary but in general all fish ladders contain a series of ascending pools that are reached by swimming against a stream of water. Fish leap through the cascade of rushing water, rest in a pool, and then repeat the process until they are out of the ladder.

FOREWORDThe World Travel & Tourism Council (WTTC) is the global authority on the economic and social contribution of Travel & Tourism. WTTC promotes sustainable growth for the sector, working with governments and international institutions to create jobs, to drive exports and to generate prosperity.
For over 25 years, WTTC has been quantifying the economic impact of Travel & Tourism. This year, the 2016 Annual Economic Reports cover 184 countries and 24 regions of the world. Our 10 year forecasts provide a unique perspective on the sector’s potential for long-term growth, and the continued vital contribution to the economic strength and social development of the world.
For the fifth successive year, the growth of the Travel & Tourism sector in 2015 (2.8%) outpaced that of the global economy (2.3%) and a number of other major sectors such as manufacturing and retail. In total, Travel & Tourism generated US $7.2 trillion (9.8% of global GDP) and supported 284 million jobs, equivalent to 1 in 11 jobs in the global economy.
The outlook for Travel & Tourism in 2016 remains robust, despite economic fragilities and other sources of volatility in the wider market. The sector’s GDP growth contribution is expected to accelerate and again outpace growth of the wider economy. Stronger growth in 2016 is likely to be underpinned by an improving global economy. The lowest oil prices in more than a decade will continue to boost demand through lower transport costs, whilst household finances and disposable income will benefit from reduced energy costs.
Through the last year, safety and security concerns have moved into the spotlight, and we have to assume that these issues will continue to cause difficulties in the years ahead. We note that the sector remains resilient and that governments are working hard to ensure the safety of tourists and to minimise the impact of security threats. Incidents such as the ones we observed with shock and sadness in recent months will not stop people travelling, as the world continues to go about its business.
There are other factors which are influencing the flow of travellers around the world. Notably, the strength of the US dollar relative to other currencies is shifting the price competitiveness of destinations and will affect who travels where this year. Undoubtedly new developments will emerge alongside these existing factors. Travel & Tourism is a key force for good, and it has proven in the past that it is strong and adaptable enough to face any challenges. It will continue to grow, to create jobs, and to bring economic and social benefits.
The Travel & Tourism sector is expected to grow faster than the wider economy and many other industries over the next decade. It is anticipated to support over 370 million jobs by 2026. Such strong growth will require tourism destinations across the world to provide environments that are conducive to business development. It will require effective coordination between public institutions and the private sector around the world.
WTTC is proud to contribute the evidence base required for public and private bodies to make the right decisions for the future growth of a sustainable Travel & Tourism sector.
David ScowsillPresident & CEO
TRAVEL & TOURISM ECONOMIC IMPACT 2016

CONTENTSTHE ECONOMIC IMPACT OF TRAVEL & TOURISM MARCH 2016
FOREWORD
2016 ANNUAL RESEARCH: KEY FACTS 1
DEFINING THE ECONOMIC CONTRIBUTION OF TRAVEL & TOURISM 2
TRAVEL & TOURISM’S CONTRIBUTION TO GDP 3
TRAVEL & TOURISM’S CONTRIBUTION TO EMPLOYMENT 4
VISITOR EXPORTS AND INVESTMENT 5
DIFFERENT COMPONENTS OF TRAVEL & TOURISM 6
COUNTRY RANKINGS: ABSOLUTE CONTRIBUTION, 2015 7
COUNTRY RANKINGS: RELATIVE CONTRIBUTION, 2015 8
COUNTRY RANKINGS: REAL GROWTH, 2015 9
COUNTRY RANKINGS: LONG TERM GROWTH, 2016 - 2025 10
SUMMARY TABLES: ESTIMATES & FORECASTS 11
THE ECONOMIC CONTRIBUTION OF TRAVEL & TOURISM: REAL 2015 PRICES 12
THE ECONOMIC CONTRIBUTION OF TRAVEL & TOURISM: NOMINAL PRICES 13
THE ECONOMIC CONTRIBUTION OF TRAVEL & TOURISM: GROWTH 14
GLOSSARY 15
METHODOLOGICAL NOTE 16
REGIONS, SUB-REGIONS & COUNTRIES 17
Use of material is authorised, provided source is acknowledged
TRAVEL & TOURISM ECONOMIC IMPACT 2016 | 1
1All values are in constant 2015 prices & exchange rates
= Total contribution of Travel & Tourism
Tunisia
2016 ANNUAL RESEARCH: KEY FACTS 2016forecast
EMPLOYMENT: DIRECT CONTRIBUTION
EMPLOYMENT: TOTAL CONTRIBUTION
VISITOR EXPORTS
INVESTMENT
WORLD RANKING (OUT OF 184 COUNTRIES):Relative importance of Travel & Tourism's total contribution to GDP
78ABSOLUTE
Size in 2015
62Contribution to GDP in 2015
RELATIVE SIZE174
GROWTH2016 forecast
Total Contribution of Travel & Tourism to GDP
Breakdown of Travel & Tourism's Total Contribution to GDP and Employment 2015
2015 TNDmn GDP (2015 TNDmn)
Direct Indirect Induced
0
2,000
4,000
6,000
8,000
10,000
12,000
14,000
16,000
2006
2007
2008
2009
2010
2011
2012
2013
2014
2015
2016
2026
2015 TNDmn2015 TNDmn
Empl
oym
ent
('000
)
WTTC Travel & Tourism Economic Impact 2016 1
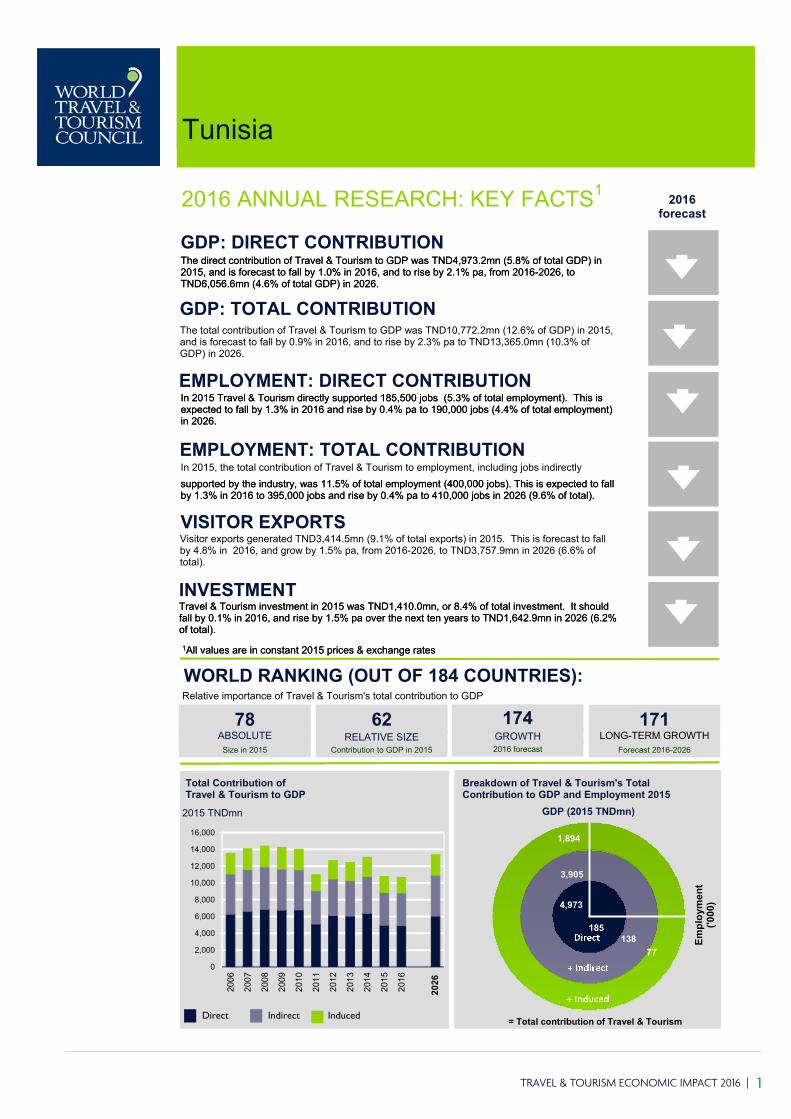
The direct contribution of Travel & Tourism to GDP was TND4,973.2mn (5.8% of total GDP) in 2015, and is forecast to fall by 1.0% in 2016, and to rise by 2.1% pa, from 2016-2026, to TND6,056.6mn (4.6% of total GDP) in 2026.
The total contribution of Travel & Tourism to GDP was TND10,772.2mn (12.6% of GDP) in 2015, and is forecast to fall by 0.9% in 2016, and to rise by 2.3% pa to TND13,365.0mn (10.3% of GDP) in 2026.
In 2015 Travel & Tourism directly supported 185,500 jobs (5.3% of total employment). This is expected to fall by 1.3% in 2016 and rise by 0.4% pa to 190,000 jobs (4.4% of total employment) in 2026.
In 2015, the total contribution of Travel & Tourism to employment, including jobs indirectly
Visitor exports generated TND3,414.5mn (9.1% of total exports) in 2015. This is forecast to fall by 4.8% in 2016, and grow by 1.5% pa, from 2016-2026, to TND3,757.9mn in 2026 (6.6% of total).
Travel & Tourism investment in 2015 was TND1,410.0mn, or 8.4% of total investment. It should fall by 0.1% in 2016, and rise by 1.5% pa over the next ten years to TND1,642.9mn in 2026 (6.2% of total).
2026
GDP: DIRECT CONTRIBUTION
GDP: TOTAL CONTRIBUTION
supported by the industry, was 11.5% of total employment (400,000 jobs). This is expected to fall by 1.3% in 2016 to 395,000 jobs and rise by 0.4% pa to 410,000 jobs in 2026 (9.6% of total).
171LONG-TERM GROWTH
Forecast 2016-2026
1
1,894
3,905
4,973
185138
77
1All values are in constant 2015 prices & exchange rates
= Total contribution of Travel & Tourism
Tunisia
2016 ANNUAL RESEARCH: KEY FACTS 2016forecast
EMPLOYMENT: DIRECT CONTRIBUTION
EMPLOYMENT: TOTAL CONTRIBUTION
VISITOR EXPORTS
INVESTMENT
WORLD RANKING (OUT OF 184 COUNTRIES):Relative importance of Travel & Tourism's total contribution to GDP
78ABSOLUTE
Size in 2015
62Contribution to GDP in 2015
RELATIVE SIZE174
GROWTH2016 forecast
Total Contribution of Travel & Tourism to GDP
Breakdown of Travel & Tourism's Total Contribution to GDP and Employment 2015
2015 TNDmn GDP (2015 TNDmn)
Direct Indirect Induced
0
2,000
4,000
6,000
8,000
10,000
12,000
14,000
16,000
2006
2007
2008
2009
2010
2011
2012
2013
2014
2015
2016
2026
2015 TNDmn2015 TNDmn
Empl
oym
ent
('000
)
WTTC Travel & Tourism Economic Impact 2016 1
The direct contribution of Travel & Tourism to GDP was TND4,973.2mn (5.8% of total GDP) in 2015, and is forecast to fall by 1.0% in 2016, and to rise by 2.1% pa, from 2016-2026, to TND6,056.6mn (4.6% of total GDP) in 2026.
The total contribution of Travel & Tourism to GDP was TND10,772.2mn (12.6% of GDP) in 2015, and is forecast to fall by 0.9% in 2016, and to rise by 2.3% pa to TND13,365.0mn (10.3% of GDP) in 2026.
In 2015 Travel & Tourism directly supported 185,500 jobs (5.3% of total employment). This is expected to fall by 1.3% in 2016 and rise by 0.4% pa to 190,000 jobs (4.4% of total employment) in 2026.
In 2015, the total contribution of Travel & Tourism to employment, including jobs indirectly
Visitor exports generated TND3,414.5mn (9.1% of total exports) in 2015. This is forecast to fall by 4.8% in 2016, and grow by 1.5% pa, from 2016-2026, to TND3,757.9mn in 2026 (6.6% of total).
Travel & Tourism investment in 2015 was TND1,410.0mn, or 8.4% of total investment. It should fall by 0.1% in 2016, and rise by 1.5% pa over the next ten years to TND1,642.9mn in 2026 (6.2% of total).
2026
GDP: DIRECT CONTRIBUTION
GDP: TOTAL CONTRIBUTION
supported by the industry, was 11.5% of total employment (400,000 jobs). This is expected to fall by 1.3% in 2016 to 395,000 jobs and rise by 0.4% pa to 410,000 jobs in 2026 (9.6% of total).
171LONG-TERM GROWTH
Forecast 2016-2026
1
1,894
3,905
4,973
185138
77

2 | WORLD TRAVEL & TOURISM COUNCIL
●
●
●
WTTC Travel & Tourism Economic Impact 20162
Defining the economiccontribution of Travel & Tourism
Travel & Tourism is an important economic activity in most countries around the world. As well as its direct economic impact, the sector has significant indirect and induced impacts. The UN Statistics Division-approved Tourism SatelliteAccounting methodology (TSA:RMF 2008) quantifies only the direct contribution of Travel & Tourism. WTTC recognises that Travel & Tourism's total contribution is much greater however, and aims to capture its indirect and induced impacts through its annual research.
DIRECT CONTRIBUTIONThe direct contribution of Travel & Tourism to GDP reflects the ‘internal’ spending on Travel & Tourism (total spending within a particular country on Travel & Tourism by residents and non-residents for business and leisure purposes) as well as government 'individual' spending - spending by government on Travel & Tourism services directly linked to visitors, such as cultural (eg museums) or recreational (eg national parks).
The direct contribution of Travel & Tourism to GDP is calculated to be consistent with the output, as expressed in National Accounting, of tourism-characteristic sectors such as hotels, airlines, airports, travel agents and leisure and recreation services that deal directly with tourists.The direct contribution of Travel & Tourism to GDP is calculated from total internal spending by ‘netting out’ the purchases made by the different tourism industries. This measure is consistent with the definition of Tourism GDP, specified in the 2008 Tourism Satellite Account: Recommended Methodological Framework (TSA: RMF 2008).
TOTAL CONTRIBUTION The total contribution of Travel & Tourism includes its ‘wider impacts’ (ie the indirect and induced impacts) on the economy.The ‘indirect’ contribution includes the GDP and jobs supported by:
Travel & Tourism investment spending – an important aspect of both current and future activity that includes investment activity such as the purchase of new aircraft and construction of new hotels;
Government 'collective' spending, which helps Travel & Tourism activity in many different ways as it is made on behalf of the ‘community at large’ – eg tourism marketing and promotion, aviation, administration, security services, resort area security services, resort area sanitation services, etc;
Domestic purchases of goods and services by the sectors dealing directly with tourists - including, for example, purchases of food and cleaning services by hotels, of fuel and catering services by airlines, and IT services by travel agents.
The ‘induced’ contribution measures the GDP and jobs supported by the spending of those who are directly or indirectly employed by the Travel & Tourism sector.

TRAVEL & TOURISM ECONOMIC IMPACT 2016 | 3
TUNISIA: DIRECT CONTRIBUTION OF TRAVEL & TOURISM TO GDP
TUNISIA: TOTAL CONTRIBUTION OF TRAVEL & TOURISM TO GDP
1 All values are in constant 2015 prices & exchange rates
3
Travel & Tourism'scontribution to GDP1
The direct contribution of Travel & Tourism to GDP in 2015 was TND4,973.2mn (5.8% of GDP). This is forecast to fall by 1.0% to TND4,921.8mn in 2016.This primarily reflects the economic activity generated by industries such as hotels, travel agents, airlines and other passenger transportation services (excluding commuter services). But it also includes, for example, the activities of the restaurant and leisure industries directly supported
The direct contribution of Travel & Tourism to GDP is expected to grow by 2.1% pa to TND6,056.6mn (4.6% of GDP) by 2026.
0
1,000
2,000
3,000
4,000
5,000
6,000
7,000
8,000
2006
2007
2008
2009
2010
2011
2012
2013
2014
2015
2016
2026
2026
Constant 2015 TNDmn % of whole economy GDP
0.0
1.0
2.0
3.0
4.0
5.0
6.0
7.0
8.0
9.0
10.0
2006
2007
2008
2009
2010
2011
2012
2013
2014
2015
2016
2026
2026
induced income impacts, see page 2) was TND10,772.2mn in 2015 (12.6% of GDP) and is expected to grow by 0.9% to TND10,674.8mn (12.1% of GDP) in 2016.
It is forecast to rise by 2.3% pa to TND13,365.0mn by 2026 (10.3% of GDP).
Constant 2015 TNDmn
Direct Indirect Induced
0
2,000
4,000
6,000
8,000
10,000
12,000
14,000
16,000
2015 2016 2026202620260.0
2.0
4.0
6.0
8.0
10.0
12.0
14.0
2015 2016 20262026
% of whole economy GDP
Direct Indirect Induced
WTTC Travel & Tourism Economic Impact 2016
The total contribution of Travel & Tourism to GDP (including wider effects from investment, the supply chain and

4 | WORLD TRAVEL & TOURISM COUNCIL
TUNISIA: DIRECT CONTRIBUTION OF TRAVEL & TOURISM TO EMPLOYMENT
TUNISIA: TOTAL CONTRIBUTION OF TRAVEL & TOURISM TO EMPLOYMENT
4
Travel & Tourism generated 185,500 jobs directly in 2015 (5.3% of total employment) and this is forecast to fall by 1.3% in 2016 to 183,000 (5.1% of total employment).This includes employment by hotels, travel agents, airlines and other passenger transportation services (excluding commuter services). It also includes, for example, the activities of the restaurant and leisure industries directly supported by tourists.
By 2026, Travel & Tourism will account for 190,000 jobs directly, an increase of 0.4% pa over the next ten years.
0.0
50.0
100.0
150.0
200.0
250.0
300.0
2006
2007
2008
2009
2010
2011
2012
2013
2014
2015
2016
2026
'000 jobs % of whole economy employment
0.0
1.0
2.0
3.0
4.0
5.0
6.0
7.0
8.0
9.0
2006
2007
2008
2009
2010
2011
2012
2013
2014
2015
2016
2026
The total contribution of Travel & Tourism to employment (including wider effects from investment, the supply
By 2026, Travel & Tourism is forecast to support 410,000 jobs (9.6% of total employment), an increase of 0.4% pa over the period.
'000 jobs
Direct Indirect Induced
0.0
50.0
100.0
150.0
200.0
250.0
300.0
350.0
400.0
450.0
2015 2016 202620260.0
2.0
4.0
6.0
8.0
10.0
12.0
14.0
2015 2016 20262026
% of whole economy employment
Direct Indirect Induced
WTTC Travel & Tourism Economic Impact 2016
Travel & Tourism'scontribution to employment
chain and induced income impacts, see page 2) was 400,000 jobs in 2015 (11.5% of total employment). This is forecast to fall by 1.3% in 2016 to 395,000 jobs (11.0% of total employment).
2026
2026

TRAVEL & TOURISM ECONOMIC IMPACT 2016 | 5
VISITOR EXPORTS
TUNISIA: VISITOR EXPORTS AND INTERNATIONAL TOURIST ARRIVALS
INVESTMENT
TUNISIA: CAPITAL INVESTMENT IN TRAVEL & TOURISM
1 All values are in constant 2015 prices & exchange rates
5
Visitor Exports and Investment1
Money spent by foreign visitors to a country (or visitor exports) is a key component of the direct contribution of Travel & Tourism. In 2015, Tunisia generated TND3,414.5mn in visitor exports. In 2016, this is expected to fall by 4.8%, and the country is expected to attract 4,255,000 international tourist arrivals.
By 2026, international tourist arrivals are forecast to total 5,404,000, generating expenditure of TND3,757.9mn, an increase of 1.5% pa.
Constant 2015 TNDmn Foreign visitor exports as % of total exports
0.0
2.0
4.0
6.0
8.0
10.0
12.0
14.0
16.0
18.0
20.0
2006
2007
2008
2009
2010
2011
2012
2013
2014
2015
2016
2026
2026
Travel & Tourism is expected to have attracted capital investment of TND1,410.0mn in 2015. This is expected to fall by 0.1% in 2016, and rise by 1.5% pa over the next ten years to TND1,642.9mn in 2026.
Travel & Tourism’s share of total national investment will fall from 8.0% in 2016 to 6.2% in 2026.
Constant 2015 TNDmn
0
500
1,000
1,500
2,000
2,500
2006
2007
2008
2009
2010
2011
2012
2013
2014
2015
2016
2026
2026
0.0
2.0
4.0
6.0
8.0
10.0
12.0
14.0
2006
2007
2008
2009
2010
2011
2012
2013
2014
2015
2016
2026
2026
% of whole economy GDP
WTTC Travel & Tourism Economic Impact 2016
mn
Foreign tourist arrivals (RHS)
0
1
2
3
4
5
6
7
8
0
1,000
2,000
3,000
4,000
5,000
6,000
7,000
2006
2007
2008
2009
2010
2011
2012
2013
2014
2015
2016
2026
Foreign visitor exports (LHS)
2026
6 | WORLD TRAVEL & TOURISM COUNCIL
Leisure spending
Business spending
Foreign visitor spending
Domestic spending
Direct
Induced
Indirect
16.1%
10.5%
9.6% 1 All values are in constant 2015 prices & exchange rates
(b) Investment
77.5%
22.5%
47.4%
52.6%
(c) Government collective
46.2%
17.6%
36.3%Indirect is the sum of:
(a) Supply chain
6 WTTC Travel & Tourism Economic Impact 2016
Different components ofTravel & Tourism1
TunisiaTravel & Tourism's Contribution to GDP:Business vs Leisure, 2015 Leisure travel spending (inbound and domestic)
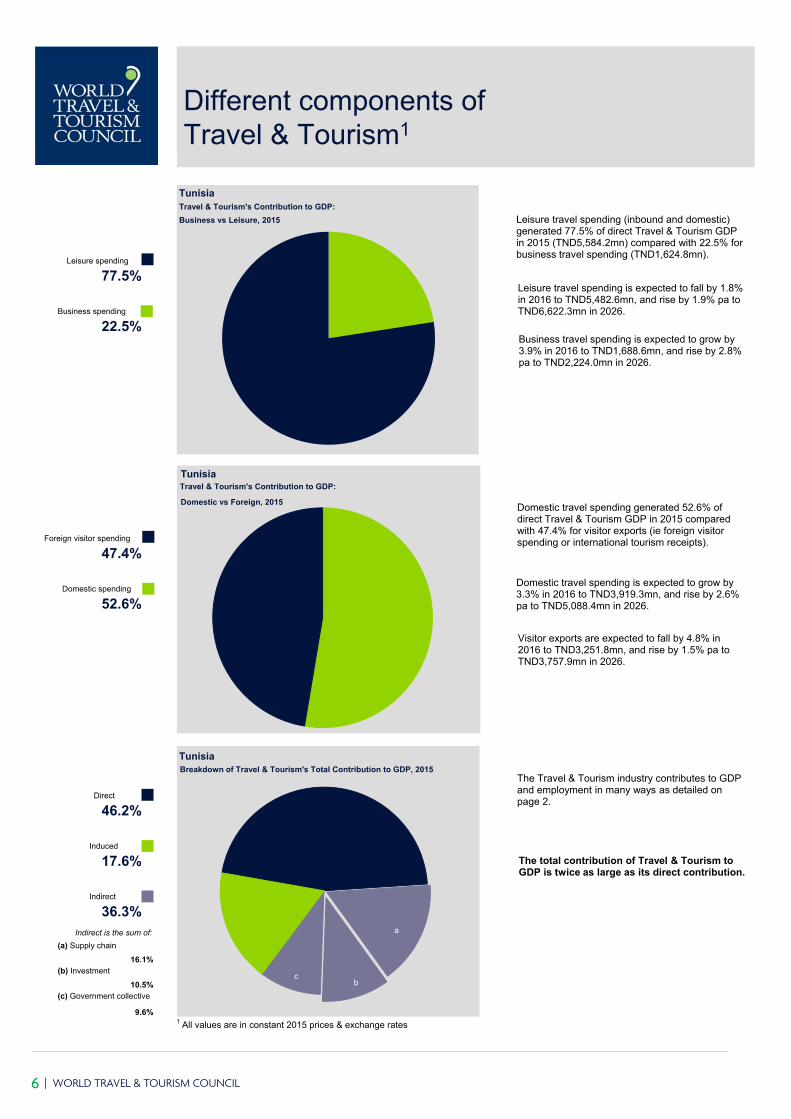
generated 77.5% of direct Travel & Tourism GDP in 2015 (TND5,584.2mn) compared with 22.5% for business travel spending (TND1,624.8mn).
Business travel spending is expected to grow by 3.9% in 2016 to TND1,688.6mn, and rise by 2.8% pa to TND2,224.0mn in 2026.
Leisure travel spending is expected to fall by 1.8% in 2016 to TND5,482.6mn, and rise by 1.9% pa to TND6,622.3mn in 2026.
Tunisia
Domestic vs Foreign, 2015
Travel & Tourism's Contribution to GDP:
Domestic travel spending generated 52.6% of direct Travel & Tourism GDP in 2015 compared with 47.4% for visitor exports (ie foreign visitor spending or international tourism receipts).
Domestic travel spending is expected to grow by 3.3% in 2016 to TND3,919.3mn, and rise by 2.6% pa to TND5,088.4mn in 2026.
Visitor exports are expected to fall by 4.8% in 2016 to TND3,251.8mn, and rise by 1.5% pa to TND3,757.9mn in 2026.
a
bc
TunisiaBreakdown of Travel & Tourism's Total Contribution to GDP, 2015
The Travel & Tourism industry contributes to GDP and employment in many ways as detailed on page 2.
The total contribution of Travel & Tourism to GDP is twice as large as its direct contribution.

TRAVEL & TOURISM ECONOMIC IMPACT 2016 | 7
2015 2015(US$bn) (US$bn)
8 Italy 76.3 7 Spain 192.09 Spain 68.8 8 Italy 185.9
13 Turkey 35.9 14 Turkey 91.6World Average 18.5 World Average 55.7
26 Greece 14.7 29 Greece 36.027 Egypt 14.5 30 Egypt 33.645 Morocco 7.7 51 Morocco 17.661 Lebanon 3.6 62 Lebanon 9.967 Tunisia 2.5 78 Tunisia 5.5
Africa Average 1.6 Africa Average 3.892 Malta 1.4 93 Cyprus 3.799 Cyprus 1.2 106 Malta 2.6
2015 2015'000 jobs '000 jobs
16 Italy 1119.0 15 Spain 2901.517 Egypt 1110.6 17 Egypt 2619.821 Spain 937.3 18 Italy 2609.2
World Average 845.8 22 Turkey 2192.822 Morocco 731.5 World Average 2123.029 Turkey 599.9 24 Morocco 1687.739 Greece 401.0 43 Greece 821.9
Africa Average 193.3 Africa Average 467.264 Tunisia 185.3 75 Tunisia 400.183 Lebanon 120.9 83 Lebanon 326.8
135 Malta 29.2 138 Cyprus 73.4140 Cyprus 24.1 144 Malta 50.8
2015 2015(US$bn) (US$bn)
9 Spain 18.7 2 Spain 61.913 Turkey 14.2 9 Italy 41.016 Italy 9.7 11 Turkey 35.530 Egypt 5.0 23 Greece 16.5
World Average 4.3 40 Egypt 7.436 Morocco 3.6 41 Morocco 7.244 Greece 3.0 World Average 7.161 Lebanon 1.3 42 Lebanon 6.974 Tunisia 0.7 69 Cyprus 2.5
Africa Average 0.6 84 Tunisia 1.7105 Cyprus 0.3 91 Malta 1.6122 Malta 0.2 Africa Average 1.0
Travel & Tourism's Direct Travel & Tourism's Total Contribution to GDP Contribution to GDP
Travel & Tourism's Direct Travel & Tourism's Total
The tables on pages 7-10 provide provide brief extracts from the full WTTC Country League Table Rankings, highlighting comparisons with competing destinations as well as with the world and regional average. The competing destinations selected are those that offer a similar tourism product and compete for tourists from the same set of origin markets. These tend to be, but are not exclusively, geographical neighbours.
Contribution to Employment Contribution to Employment
Travel & Tourism VisitorCapital Investment Exports
Country rankings: Absolute contribution, 2015
7WTTC Travel & Tourism Economic Impact 2016
Averages in above tables are simple cross-country averages.

8 | WORLD TRAVEL & TOURISM COUNCIL
2015 2015% share % share
12 Malta 15.1 23 Malta 27.731 Lebanon 8.1 30 Lebanon 22.134 Morocco 7.7 39 Cyprus 19.335 Greece 7.6 40 Greece 18.542 Cyprus 6.4 42 Morocco 17.547 Tunisia 5.8 47 Spain 16.048 Spain 5.8 61 Turkey 12.956 Turkey 5.0 62 Tunisia 12.658 Egypt 4.9 69 Egypt 11.472 Italy 4.2 84 Italy 10.2
Africa 3.3 World 9.8World 3.0 Africa 8.1
2015 2015% share % share
10 Malta 16.5 19 Malta 28.821 Greece 11.3 27 Greece 23.132 Lebanon 7.9 30 Lebanon 21.340 Morocco 6.8 33 Cyprus 20.142 Cyprus 6.6 47 Spain 16.255 Tunisia 5.3 49 Morocco 15.657 Spain 5.2 63 Italy 11.660 Italy 5.0 64 Tunisia 11.570 Egypt 4.4 76 Egypt 10.5
World 3.6 World 9.5Africa 3.0 105 Turkey 8.3
140 Turkey 2.3 Africa 7.2
2015 2015% share % share
28 Greece 14.8 20 Lebanon 51.931 Cyprus 14.0 47 Greece 25.834 Egypt 12.5 48 Cyprus 24.535 Morocco 12.4 55 Morocco 21.245 Malta 10.4 58 Egypt 20.747 Turkey 9.9 65 Turkey 17.748 Lebanon 9.9 71 Spain 15.660 Tunisia 8.4 85 Malta 10.367 Spain 7.7 93 Tunisia 9.1
Africa 6.3 Africa 9.0World 4.3 101 Italy 7.5
137 Italy 3.2 World 6.1
Travel & Tourism's Direct Travel & Tourism's Total Contribution to GDP Contribution to GDP
Travel & Tourism's Direct Travel & Tourism's Total Contribution to Employment Contribution to Employment
Travel & Tourism Investment Visitor ExportsContribution to Total Capital Investment Contribution to Total Exports
WTTC Travel & Tourism Economic Impact 2016
Country rankings: Relative contribution,2015
8

TRAVEL & TOURISM ECONOMIC IMPACT 2016 | 9
2016 2016% growth % growth
36 Malta 5.1 26 Lebanon 5.338 Lebanon 4.8 43 Malta 4.449 Cyprus 4.3 46 Cyprus 4.481 Spain 3.4 World 3.5
World 3.3 82 Spain 3.5Africa 2.5 Africa 2.6
124 Italy 2.1 130 Morocco 2.0132 Morocco 2.0 136 Italy 1.9156 Egypt 0.7 152 Turkey 1.1161 Turkey 0.2 154 Egypt 1.0170 Greece -0.5 174 Tunisia -0.9175 Tunisia -1.0 180 Greece -1.8
2016 2016% growth % growth
24 Lebanon 4.1 14 Lebanon 4.448 Malta 2.6 38 Cyprus 3.051 Spain 2.6 53 Spain 2.471 Italy 2.0 World 2.2
World 1.9 75 Malta 1.8123 Greece 0.6 84 Italy 1.7124 Morocco 0.4 118 Turkey 0.7
Africa 0.3 126 Morocco 0.4134 Cyprus -0.1 Africa 0.2136 Turkey -0.2 151 Egypt -0.6153 Egypt -0.9 152 Greece -0.6160 Tunisia -1.3 165 Tunisia -1.3
2016 2016% growth % growth
48 Spain 6.3 34 Malta 5.564 Lebanon 5.6 47 Spain 4.770 Italy 5.3 52 Cyprus 4.574 Cyprus 5.3 84 Lebanon 3.3
Africa 5.0 World 3.0World 4.7 106 Italy 2.4
108 Morocco 3.9 109 Morocco 2.3112 Turkey 3.7 116 Greece 2.2117 Malta 3.5 Africa 1.2129 Egypt 2.8 172 Turkey -2.3169 Tunisia -0.1 180 Egypt -4.0184 Greece -7.6 182 Tunisia -4.8
Travel & Tourism's Direct Travel & Tourism's Total Contribution to GDP Contribution to GDP
Travel & Tourism's Direct Travel & Tourism's Total Contribution to Employment Contribution to Employment
Travel & Tourism VisitorInvestment Exports
Country rankings: Real growth,
7
2016
9WTTC Travel & Tourism Economic Impact 2016

10 | WORLD TRAVEL & TOURISM COUNCIL
2016 - 2026 2016 - 2026% growth pa % growth pa
10 Lebanon 6.8 9 Lebanon 6.8Africa 4.8 Africa 4.8
81 Egypt 4.6 90 Egypt 4.3World 4.2 102 Morocco 4.1
99 Malta 4.0 World 4.0100 Morocco 4.0 110 Greece 3.9102 Greece 4.0 114 Malta 3.8114 Turkey 3.8 119 Turkey 3.7123 Cyprus 3.7 124 Cyprus 3.6172 Italy 2.2 171 Tunisia 2.3174 Tunisia 2.1 177 Spain 2.0175 Spain 2.1 179 Italy 1.9
2016 - 2026 2016 - 2026% growth pa % growth pa
16 Lebanon 4.1 12 Lebanon 4.032 Turkey 3.6 54 Greece 3.047 Egypt 3.3 55 Egypt 2.967 Greece 2.7 Africa 2.677 Italy 2.6 World 2.578 Malta 2.5 81 Turkey 2.4
Africa 2.5 90 Malta 2.2World 2.1 94 Cyprus 2.2
122 Morocco 1.6 100 Italy 2.0151 Cyprus 1.1 118 Morocco 1.6158 Spain 0.9 166 Spain 0.7173 Tunisia 0.4 174 Tunisia 0.4
2016 - 2026 2016 - 2026% growth pa % growth pa
30 Lebanon 6.2 25 Egypt 6.5World 4.5 46 Lebanon 5.7
96 Morocco 4.1 Africa 5.1Africa 4.1 94 Malta 4.4
111 Greece 3.8 96 Greece 4.4118 Turkey 3.7 World 4.3128 Egypt 3.3 105 Turkey 4.2129 Spain 3.3 114 Morocco 3.9140 Cyprus 2.9 121 Cyprus 3.6156 Malta 2.6 170 Spain 2.0171 Italy 1.8 174 Italy 1.8178 Tunisia 1.5 178 Tunisia 1.5
Travel & Tourism's Direct Travel & Tourism's Total Contribution to GDP Contribution to GDP
Travel & Tourism's Direct Travel & Tourism's Total Contribution to Employment Contribution to Employment
Travel & Tourism Investment Visitor ExportsContribution to Capital Investment Contribution to Exports
WTTC Travel & Tourism Economic Impact 2016
Country rankings: Long term growth, 2016 - 2026
10

TRAVEL & TOURISM ECONOMIC IMPACT 2016 | 11
2016
Tunisia US$mn % of total Growth2 US$mn % of total Growth3
Direct contribution to GDP 2,524.5 5.8 -1.0 3,074.4 4.6 2.1
Total contribution to GDP 5,468.1 12.6 -0.9 6,784.3 10.3 2.3
Direct contribution to employment4 185.3 5.3 -1.3 189.6 4.4 0.4
Total contribution to employment4 400.1 11.5 -1.3 410.0 9.6 0.4
Visitor exports 1,733.3 8.9 -4.8 1,907.6 6.5 1.5
Domestic spending 1,926.1 4.5 3.3 2,583.0 3.9 2.6
Leisure spending 2,834.6 4.4 -1.8 3,361.6 3.4 1.9
Business spending 824.8 1.3 3.9 1,128.9 1.2 2.8
Capital investment 715.7 8.4 -0.1 834.0 6.2 1.512015 constant prices & exchange rates; 22016 real growth adjusted for inflation (%); 32016-2026 annualised real growth adjusted for inflation (%); 4'000 jobs
2016
Africa US$bn % of total Growth2 US$bn % of total Growth3
Direct contribution to GDP 74.3 3.3 2.5 121.3 3.2 4.8
Total contribution to GDP 180.0 8.1 2.6 295.7 7.9 4.8
Direct contribution to employment4 9,083 3.0 0.3 11,707 2.9 2.5
Total contribution to employment4 21,956 7.2 0.2 28,513 7.0 2.6
Visitor exports 46.7 9.0 1.2 77.6 8.5 5.1
Domestic spending 77.0 3.5 3.8 123.8 3.3 4.5
Leisure spending 86.6 2.3 2.6 141.3 2.3 4.7
Business spending 37.1 1.0 3.3 60.1 0.9 4.6
Capital investment 29.6 6.3 5.0 46.3 5.8 4.112015 constant prices & exchange rates; 22016 real growth adjusted for inflation (%); 32016-2026 annualised real growth adjusted for inflation (%); 4'000 jobs
2016
Worldwide US$bn % of total Growth2 US$bn % of total Growth3
Direct contribution to GDP 2,229.8 3.0 3.3 3,469.1 3.4 4.2
Total contribution to GDP 7,170.3 9.8 3.5 10,986.5 10.8 4.0
Direct contribution to employment4 107,833 3.6 1.9 135,884 4.0 2.1
Total contribution to employment4 283,578 9.5 2.2 370,204 11.0 2.5
Visitor exports 1,308.9 6.1 3.0 2,056.0 6.2 4.3
Domestic spending 3,419.9 4.7 3.3 5,245.5 5.2 4.0
Leisure spending 3,621.9 2.3 3.0 5,645.8 2.6 4.2
Business spending 1,106.9 0.7 3.9 1,658.8 0.8 3.7
Capital investment 774.6 4.3 4.7 1,254.2 4.7 4.512015 constant prices & exchange rates; 22016 real growth adjusted for inflation (%); 32016-2026 annualised real growth adjusted for inflation (%); 4'000 jobs
2015 2015 2026
2015 2015 2026
2015 2015 2026
% of total refers to each indicator's share of the relevant whole economy indicator such as GDP and employment. Visitor exports is shown relative to total exports of goods and
WTTC Travel & Tourism Economic Impact 2016 11
Summary tables:Estimates & Forecasts
1
1
1
1
1
1
Domestic spending is expressed relative to whole economy GDP. For leisure and business spending, their direct contribution to Travel & Tourism GDP is calculated as a share of whole economy GDP (the sum of these shares equals the direct contribution). Investment is relative to whole economy investment.

12 | WORLD TRAVEL & TOURISM COUNCIL
2010 2011 2012 2013 2014 2015 2016E 2026F
Domestic expenditure
(includes government individual spending)
3. Internal tourism consumption(= 1 + 2 )
4. Purchases by tourism providers,
including imported goods (supply chain)
5. Direct contribution of Travel & Tourism to GDP(= 3 + 4)
Other final impacts
(indirect & induced)
6. Domestic supply chain
11. Total contribution of Travel & Tourism to GDP(= 5 + 6 + 7 + 8 + 9 + 10)
Employment impacts ('000)
12.
Other indicators
14. Expenditure on outbound travel
Tunisia
(TNDmn, real 2015 prices)
1. Visitor exports 6246.6 4277.1 5227.4 5093.7 5378.1 3414.5 3251.8 3757.9
2. 3410.7 3079.5 3577.4 3643.1 3790.6 3794.4 3919.3 5088.4
9657.3 7356.6 8804.8 8736.9 9168.7 7208.9 7171.1 8846.3
-2,862.3 -2,251.8 -2,679.7 -2,681.0 -2,781.3 -2,235.8 -2,249.3 -2,789.7
6,794.9 5,104.8 6,125.1 6,055.9 6,387.4 4,973.2 4,921.8 6,056.6
2,463.3 1,850.6 2,220.4 2,195.4 2,315.5 1,802.9 1,784.2 2,195.6
7. Capital investment 1,779.2 1,549.8 1,558.7 1,373.7 1,383.4 1,410.0 1,409.2 1,642.9
8. Government collective spending 844.8 902.4 949.3 1,018.9 1,068.5 1,080.0 1,101.4 1,565.5
9. Imported goods from indirect spending -309.7 -335.9 -366.7 -369.8 -370.2 -387.4 -399.3 -516.9
10. Induced 2,457.3 1,910.8 2,180.4 2,155.5 2,270.2 1,893.6 1,857.5 2,421.3
14,030 10,982 12,667 12,430 13,055 10,772 10,675 13,365
251.5 190.4 220.6 216.9 233.5 185.3 182.9 189.6Direct contribution of Travel & Tourism to employment
13. Total contribution of Travel & Tourism to employment 522.0 408.3 457.4 447.2
969.9 1,009.2 1,061.3 1,207.8 1,168.7 1,225.0 1,256.4 1,844.8
477.1 400.1 394.9 410.0
WTTC Travel & Tourism Economic Impact 201612
The economic contribution ofTravel & Tourism: Real 2015 prices
TRAVEL & TOURISM ECONOMIC IMPACT 2016 | 13
2010 2011 2012 2013 2014 2015 2016E 2026F
Domestic expenditure
(includes government individual spending)
3. Internal tourism consumption(= 1 + 2 )
4. Purchases by tourism providers,
including imported goods (supply chain)
5. Direct contribution of Travel & Tourism to GDP(= 3 + 4)
Other final impacts
(indirect & induced)
6. Domestic supply chain
11. Total contribution of Travel & Tourism to GDP(= 5 + 6 + 7 + 8 + 9 + 10)
Employment impacts ('000)
12.
Other indicators
14. Expenditure on outbound travel
Historical data for concepts has been benchmarked to match reported TSA data where available.
Tunisia
(TNDmn, nominal prices)
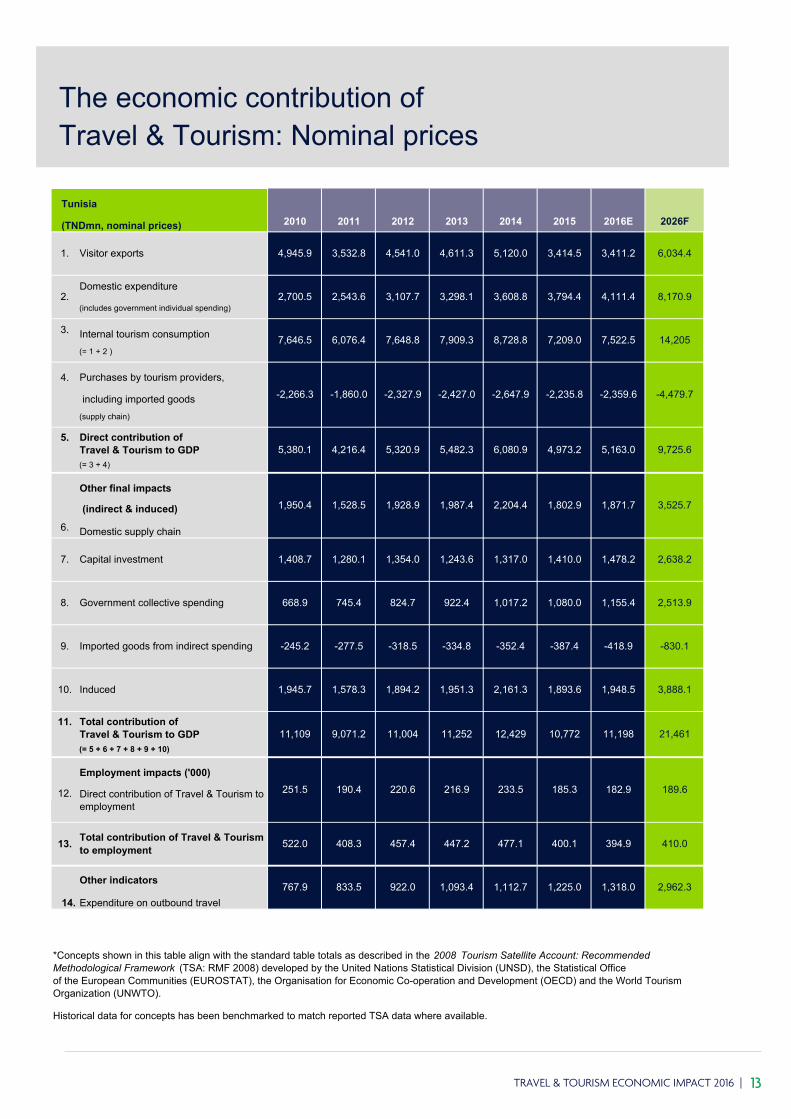
1. Visitor exports 4,945.9 3,532.8 4,541.0 4,611.3 5,120.0 3,414.5 3,411.2 6,034.4
2. 2,700.5 2,543.6 3,107.7 3,298.1 3,608.8 3,794.4 4,111.4 8,170.9
7,646.5 6,076.4 7,648.8 7,909.3 8,728.8 7,209.0 7,522.5 14,205
-2,266.3 -1,860.0 -2,327.9 -2,427.0 -2,647.9 -2,235.8 -2,359.6 -4,479.7
1,802.9 1,871.7
5,380.1 4,216.4 5,320.9 5,482.3 6,080.9 4,973.2
1,410.0 1,478.2
5,163.0 9,725.6
1,950.4 1,528.5 1,928.9 1,987.4 2,204.4
1,080.0 1,155.4
3,525.7
7. Capital investment 1,408.7 1,280.1 1,354.0 1,243.6 1,317.0
-387.4 -418.9
2,638.2
8. Government collective spending 668.9 745.4 824.7 922.4 1,017.2
1,893.6 1,948.5
2,513.9
9. Imported goods from indirect spending -245.2 -277.5 -318.5 -334.8 -352.4
11,198 21,461
-830.1
10. Induced 1,945.7 1,578.3 1,894.2 1,951.3 2,161.3
216.9 233.5 185.3
3,888.1
11,109 9,071.2 11,004 11,252 12,429 10,772
13. Total contribution of Travel & Tourism to employment 522.0 408.3 457.4 447.2
1,112.7 1,225.0 1,318.0
182.9 189.6Direct contribution of Travel & Tourism to employment
477.1
251.5 190.4 220.6
2,962.3
*Concepts shown in this table align with the standard table totals as described in the 2008 Tourism Satellite Account: Recommended Methodological Framework (TSA: RMF 2008) developed by the United Nations Statistical Division (UNSD), the Statistical Officeof the European Communities (EUROSTAT), the Organisation for Economic Co-operation and Development (OECD) and the World Tourism Organization (UNWTO).
400.1 394.9 410.0
767.9 833.5 922.0 1,093.4
WTTC Travel & Tourism Economic Impact 2016 13
The economic contribution ofTravel & Tourism: Nominal prices

14 | WORLD TRAVEL & TOURISM COUNCIL
2010 2011 2012 2013 2014 2015 2016E 2026F 2
Domestic expenditure
(includes government individual spending)
3. Internal tourism consumption(= 1 + 2 )
4. Purchases by tourism providers,
including imported goods (supply chain)
5. Direct contribution of Travel & Tourism to GDP(= 3 + 4)
Other final impacts
(indirect & induced)
6. Domestic supply chain
11. Total contribution of Travel & Tourism to GDP(= 5 + 6 + 7 + 8 + 9 + 10)
Employment impacts ('000)
12.
Other indicators
14. Expenditure on outbound travel
Tunisia
Growth1 (%)
1. Visitor exports -0.1 -31.5 22.2 -2.6 5.6 -36.5 -4.8 1.5
2. 3.3 -9.7 16.2 1.8 4.0 0.1 3.3 2.6
1.1 -23.4 19.4 -0.6 4.9 -21.0 -0.5 2.2
2.8 -21.3 19.0 0.0 3.7 -19.6 0.6 2.2
-22.1 -1.0
0.4 -24.9 20.0 -1.1 5.5 -22.1
1.9 -0.1
-1.0 2.1
0.4 -24.9 20.0 -1.1 5.5
1.1 2.0
2.1
7. Capital investment -2.3 -12.9 0.6 -11.9 0.7
3.2 2.9
1.5
8. Government collective spending 2.9 6.8 5.2 7.3 4.9
-16.6 -1.9
3.6
9. Imported goods from indirect spending 45.7 6.3 9.6 0.9 0.5
-0.9 2.3
2.6
10. Induced -5.1 -22.2 14.1 -1.1 5.3
-1.7 7.7 -20.7
2.7
-1.5 -21.7 15.3 -1.9 5.0 -17.5
13. Total contribution of Travel & Tourism to employment -1.9 -21.8 12.0 -2.2
-3.2 4.8 2.6
-1.3 0.4Direct contribution of Travel & Tourism to employment
6.7
0.1 -24.3 15.9
3.9
12009-2014 real annual growth adjusted for inflation (%); 22015-2025 annualised real growth adjusted for inflation (%)
-16.1 -1.3 0.4
33.5 4.0 5.2 13.8
WTTC Travel & Tourism Economic Impact 201614
The economic contribution ofTravel & Tourism: Growth
TRAVEL & TOURISM ECONOMIC IMPACT 2016 | 15
GLOSSARYKEY DEFINITIONS
TRAVEL & TOURISMRelates to the activity of travellers on trips outside their usual environment with a duration of less than one year. Economic activity related to all aspects of such trips is measured within the research.
DIRECT CONTRIBUTION TO GDPGDP generated by industries that deal directly with tourists, including hotels, travel agents, airlines and other passenger transport services, as well as the activities of restaurant and leisure industries that deal directly with tourists. It is equivalent to total internal Travel & Tourism spending (see below) within a country less the purchases made by those industries (including imports). In terms of the UN’s Tourism Satellite Account methodology it is consistent with total GDP calculated in table 6 of the TSA: RMF 2008.
DIRECT CONTRIBUTION TO EMPLOYMENTThe number of direct jobs within Travel & Tourism. This is consistent with total employment calculated in table 7 of the TSA: RMF 2008.
TOTAL CONTRIBUTION TO GDPGDP generated directly by the Travel & Tourism sector plus its indirect and induced impacts (see below).
TOTAL CONTRIBUTION TO EMPLOYMENTThe number of jobs generated directly in the Travel & Tourism sector plus the indirect and induced contributions (see below).
DIRECT SPENDING IMPACTS
VISITOR EXPORTSSpending within the country by international tourists for both business and leisure trips, including spending on transport, but excluding international spending on education. This is consistent with total inbound tourism expenditure in table 1 of the TSA: RMF 2008.
DOMESTIC TRAVEL & TOURISM SPENDINGSpending within a country by that country’s residents for both business and leisure trips. Multi-use consumer durables are not included since they are not purchased solely for tourism purposes. This is consistent with total domestic tourism expenditure in table 2 of the TSA: RMF 2008. Outbound spending by residents abroad is not included here, but is separately identified according to the TSA: RMF 2008 (see below).
GOVERNMENT INDIVIDUAL SPENDINGSpending by government on Travel & Tourism services directly linked to visitors, such as cultural services (eg museums) or recreational services (eg national parks).
INTERNAL TOURISM CONSUMPTIONTotal revenue generated within a country by industries that deal directly with tourists including visitor exports, domestic spending
and government individual spending. This does not include spending abroad by residents. This is consistent with total internal tourism expenditure in table 4 of the TSA: RMF 2008.
BUSINESS TRAVEL & TOURISM SPENDINGSpending on business travel within a country by residents and international visitors.
LEISURE TRAVEL & TOURISM SPENDINGSpending on leisure travel within a country by residents and international visitors.
INDIRECT AND INDUCED IMPACTS
INDIRECT CONTRIBUTIONThe contribution to GDP and jobs of the following three factors:
• CAPITAL INVESTMENT: Includes capital investment spending by all industries directly involved in Travel & Tourism. This also constitutes investment spending by other industries on specific tourism assets such as new visitor accommodation and passenger transport equipment, as well as restaurants and leisure facilities for specific tourism use. This is consistent with total tourism gross fixed capital formation in table 8 of the TSA: RMF 2008.
• GOVERNMENT COLLECTIVE SPENDING: Government spending in support of general tourism activity. This can include national as well as regional and local government spending. For example, it includes tourism promotion, visitor information services, administrative services and other public services. This is consistent with total collective tourism consumption in table 9 of TSA: RMF 2008.
• SUPPLY-CHAIN EFFECTS: Purchases of domestic goods and services directly by different industries within Travel & Tourism as inputs to their final tourism output.
INDUCED CONTRIBUTIONThe broader contribution to GDP and employment of spending by those who are directly or indirectly employed by Travel & Tourism.
OTHER INDICATORS
OUTBOUND EXPENDITURESpending outside the country by residents on all trips abroad. This is fully aligned with total outbound tourism expenditure in table 3 of the TSA: RMF 2008.
FOREIGN VISITOR ARRIVALSThe number of arrivals of foreign visitors, including same-day and overnight visitors (tourists) to the country.

16 | WORLD TRAVEL & TOURISM COUNCIL
METHODOLOGICAL NOTEWTTC has an on-going commitment to align its economic impact research with the UN Statistics Division-approved 2008 Tourism Satellite Account: Recommended Methodological Framework (TSA:RMF 2008). This involves benchmarking of country reports to official, published TSAs. This year the Ecuador TSA was integrated for the first time, alongside new data for Austria, Bermuda, Canada, Czech Rep, Ecuador, France, Lithuania, Malaysia, New Zealand, Nicaragua, Qatar, South Africa, Switzerland, UK, and the USA.
In addition to producing data on 184 countries, WTTC also produces reports on 24 other regions, sub-regions and economic and geographic groups. This year, there are 8 reports for special economic and geographic groups.
ECONOMIC AND GEOGRAPHIC GROUPS
APEC (ASIA-PAC IFIC ECONOMIC COOPERATION)Australia, Brunei, Canada, Chile, China, Hong Kong, Indonesia,Japan, South Korea, Malaysia, Mexico, New Zealand, Papua NewGuinea, Peru, Philippines, Russian Federation, Singapore, Taiwan,Thailand, USA, Vietnam.
THE COMMONWEALTHAnguilla, Antigua and Barbuda, Australia, Bahamas, Bangladesh,Barbados, Belize, Bermuda, Botswana, Brunei, Cameroon,Canada, Cayman Islands, Cyprus, Dominica, Ghana, Grenada,Guyana, India, Jamaica, Kenya, Kiribati, Lesotho, Malawi,Malaysia, Maldives, Malta, Mauritius, Mozambique, Namibia,Nigeria, New Zealand, Pakistan, Papua New Guinea, Rwanda,South Africa, Seychelles, Sierra Leone, Singapore, SolomonIslands, Sri Lanka, St Kitts and Nevis, St Lucia, St Vincent and theGrenadines, Swaziland, Tanzania, Tonga, Trinidad and Tobago,Uganda, UK, British Virgin Islands, Vanuatu, Zambia.
FORMER NETHERLANDS ANTILLESBonaire, Curacao, Sint Maarten, Saba and Sint Eustatius.
G20Argentina, Australia, Brazil, Canada, China, European Union,France*, Germany*, India, Indonesia, Italy*, Japan, Mexico,Russian Federation, Saudi Arabia, South Africa, South Korea,Turkey, UK*, USA.
MEDITERRANEAN (MEDITERRANEAN TRAVEL ASSOCIATION)Albania, Algeria, Bosnia Herzegovina, Croatia, Cyprus, Egypt,France, Greece, Israel, Italy, Jordan, Lebanon, Libya, Macedonia,Malta, Montenegro, Morocco, Portugal, Serbia, Slovenia, Spain,Syria, Tunisia, Turkey.
OAS (ORGANIZATION OF AMERICAN STATES)Argentina, Antigua and Barbuda, Bahamas, Barbados, Belize,Bolivia, Brazil, Canada, Chile, Colombia, Costa Rica, Cuba,Dominican Republic, Dominica, Ecuador, El Salvador, Grenada,Guatemala, Guyana, Haiti, Honduras, Jamaica, Mexico, St Kittsand Nevis, Nicaragua, Panama, Paraguay, Peru, St Lucia,St Vincent and the Grenadines, Suriname, Trinidad and Tobago,USA, Uruguay.
OECD (ORGANISATION FOR ECONOMIC CO-OPERATION AND DEVELOPMENT)Australia, Austria, Belgium, Canada, Chile, Czech Republic,Denmark, Estonia, Finland, France, Germany, Greece, Hungary,Iceland, Ireland, Israel, Italy, Japan, South Korea, Luxembourg,Mexico, Netherlands, New Zealand, Norway, Poland, Portugal,Slovak Republic, Slovenia, Spain, Sweden, Switzerland, Turkey,UK, USA.
OTHER OCEANIAAmerican Samoa, Cook Islands, French Polynesia, Guam,Marshall Islands, Micronesia (Federated States of), NewCaledonia, Niue, Northern Mariana Islands, Palau, Samoa, Tuvalu.
PACIFIC ALLIANCEChile, Colombia, Mexico, Peru.
SADC (SOUTHERN AFRICAN DEVELOPMENT COMMUNITY)Angola, Botswana, Democratic Republic of Congo (DRC), Lesotho,Madagascar, Malawi, Mauritius, Mozambique, Namibia, Seychelles,South Africa, Swaziland, Tanzania, Zambia, Zimbabwe.
*included in European Union

TRAVEL & TOURISM ECONOMIC IMPACT 2016 | 17
ECONOMIC IMPACT REPORTS:REGIONS, SUB REGIONS & COUNTRIES
WORLD
REG
ION
SUB
REG
ION
COUNTRY
AFR
ICA
NO
RTH
AFR
ICA
Algeria
Egypt
Libya
Morocco
Tunisia
SUB-
SAH
ARA
N
Angola
Benin
Botswana
Burkina Faso
Burundi
Cameroon
Cape Verde
Central African Republic
Chad
Comoros
Democratic Republic of Congo
Ethiopia
Gabon
Gambia
Ghana
Guinea
Ivory Coast
Kenya
Lesotho
Madagascar
Malawi
Mali
Mauritius
Mozambique
Namibia
Niger
Nigeria
Republic of Congo
Reunion
Rwanda
Sao Tome & Principe
Senegal
Seychelles
Sierra Leone
South Africa
Sudan
Swaziland
Tanzania
Togo
Uganda
Zambia
Zimbabwe
REG
ION
SUB
REG
ION
COUNTRY
AM
ERIC
AS
CA
RIBB
EAN
Anguilla
Antigua & Barbuda
Aruba
Bahamas
Barbados
Bermuda
Cayman Islands
Cuba
Former Netherlands Antilles
Dominica
Dominican Republic
Grenada
Guadeloupe
Haiti
Jamaica
Martinique
Puerto Rico
St Kitts & Nevis
St Lucia
St Vincent & the Grenadines
Trinidad & Tobago
UK Virgin Islands
US Virgin Islands
LATI
N A
MER
ICA
Argentina
Belize
Bolivia
Brazil
Chile
Colombia
Costa Rica
El Salvador
Ecuador
Guatemala
Guyana
Honduras
Nicaragua
Panama
Paraguay
Peru
Suriname
Uruguay
Venezuela
NO
RTH
A
MER
ICA Canada
Mexico
USA
REG
ION
SUB
REG
ION
COUNTRY
ASI
A-PA
CIF
IC
NO
RTH
EAST
ASI
A
Japan
China
Hong Kong
South Korea
Macau
Taiwan
Mongolia
OC
EAN
IA
Australia
New Zealand
Fiji
Kiribati
Other Oceania
Papua New Guinea
Solomon Islands
Tonga
Vanuatu
SOU
TH A
SIA
Bangladesh
India
Maldives
Nepal
Pakistan
Sri Lanka
SOU
THEA
ST A
SIA
(ASE
AN
)
Brunei
Cambodia
Indonesia
Laos
Malaysia
Myanmar
Philippines
Singapore
Thailand
Vietnam
EURO
PE
EURO
PEA
N U
NIO
N
Austria
Belgium
Bulgaria
Croatia
Cyprus
Czech Republic
Denmark
Estonia
Finland
France
Germany
Greece
Hungary
Ireland
Italy
Latvia
REG
ION
SUB-
REG
ION
COUNTRY
EURO
PE
EURO
PEA
N U
NIO
N
Lithuania
Luxembourg
Malta
Netherlands
Poland
Portugal
Romania
Slovakia
Slovenia
Spain
Sweden
UK
OTH
ER E
URO
PE
Albania
Armenia
Azerbaijan
Belarus
Bosnia Herzegovina
Georgia
Iceland
Kazakhstan
Kyrgyzstan
Macedonia
Moldova
Montenegro
Norway
Russian Federation
Serbia
Switzerland
Turkey
Ukraine
Uzbekistan
MID
DLE
EA
ST
Bahrain
Iran
Iraq
Israel
Jordan
Kuwait
Lebanon
Oman
Qatar
Saudi Arabia
Syria
UAE
Yemen
The World Travel & Tourism Council is the global authority on the economic and social contribution of Travel & Tourism.
WTTC promotes sustainable growth for the sector, working with governments and international institutions to create jobs, to drive exports and to generate prosperity. Council Members are the Chairs, Presidents and Chief Executives of the world’s leading, private sector Travel & Tourism businesses.
Together with its research partner, Oxford Economics, WTTC produces annual research that shows Travel & Tourism to be one of the world’s largest sectors, supporting 285 million jobs and generating 9.8% of global GDP in 2015. Comprehensive reports quantify, compare and forecast the economic impact of Travel & Tourism on 184 economies around the world. In addition to the individual country reports, WTTC produces a world report highlighting global trends and 24 further reports that focus on regions, sub-regions and economic and geographic groups. To download reports or data, please visit www.wttc.org
Assisting WTTC to Provide Tools for Analysis, Benchmarking, Forecasting and Planning.
Over the last 34 years, Oxford Economics has built a diverse and loyal client base of over 900 international organisations, including leading multinational companies and financial institutions; key government bodies and trade associations; and top universities, consultancies, and think tanks. Headquartered in Oxford, England, with regional centres in London, New York and Singapore, Oxford Economics has offices across the globe in Belfast, Cape Town, Chicago, Dubai, Frankfurt, Hong Kong, Mexico City, Miami, Milan, Paris, Philadelphia and San Francisco. The company employs over 250 full-time people, including more than 150 professional economists, industry experts and business editors – one of the largest teams of macroeconomists and thought leadership specialists – underpinned by our heritage with Oxford University and the academic community including a contributor network of over 500 economists, analysts and journalists around the world. For more information, please take advantage of a free trial on our website, www.oxfordeconomics.com or contact Courtney Egan, Director of Business Development, Oxford Economics Ltd, Broadwall House, 21 Broadwall, London SE1 9PL. Email: [email protected]
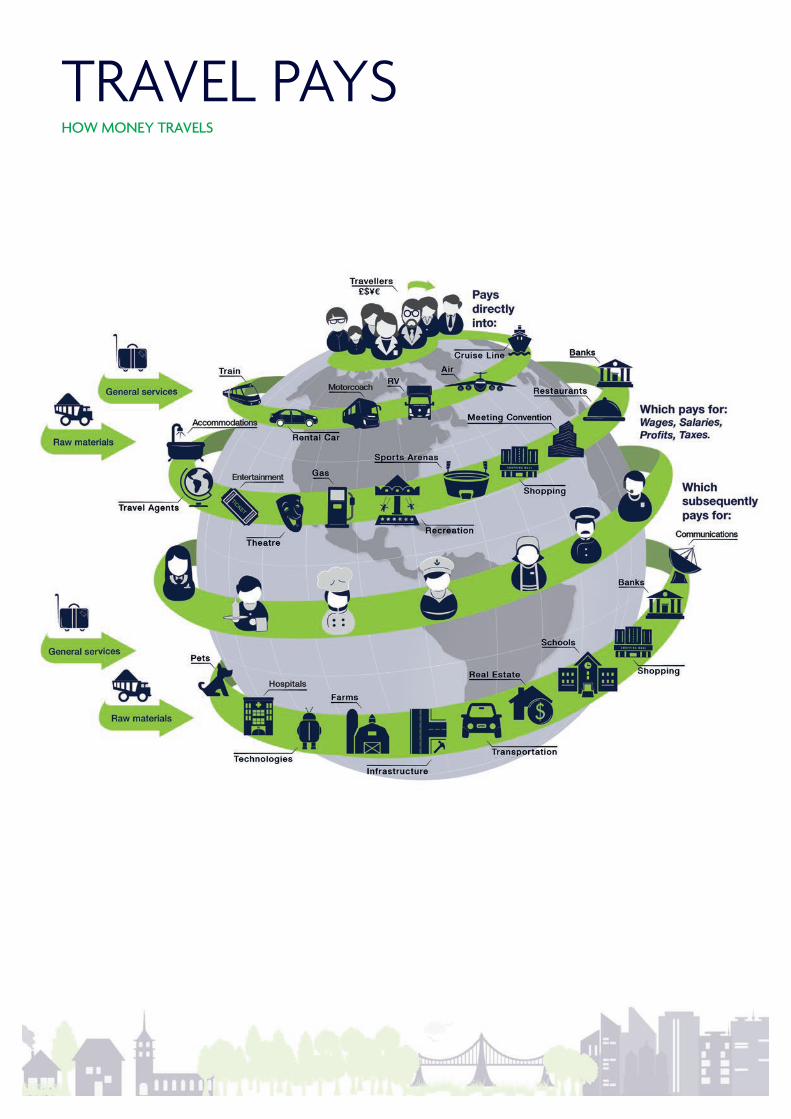
TRAVEL PAYSHOW MONEY TRAVELS

THE AUTHORITY ON WORLD TRAVEL & TOURISMWORLD TRAVEL & TOURISM COUNCIL (WTTC), THE HARLEQUIN BUILDING, 65 Southwark Street, London SE1 0HR, United KingdomTel: +44 (0) 207 481 8007 | Fax: +44 (0) 207 488 1008 | Email: [email protected] | www.wttc.org