trawl rockfish conservation area (rca) boundary modifications · 1 agenda item g.6.b draft ea...
TRANSCRIPT

1
Agenda Item G.6.b
Draft EA
September 2013
Trawl Rockfish Conservation Area (RCA)
Boundary Modifications
Draft Environmental Assessment September 2013
National Marine Fisheries Service
Sustainable Fisheries Division
Northwest Region
2
TABLE OF CONTENTS
Table of Contents Table of Contents .................................................................................................................................... 2
List of Figures ........................................................................................................................................... 5
List of Tables ............................................................................................................................................. 8
CHAPTER 1 Introduction ............................................................................................................. 11
1.1 How This Document is Organized ................................................................................. 11
1.2 Purpose and Need ................................................................................................................ 11
1.3 Background ............................................................................................................................ 11
1.3.1 History of the Trawl RCAs North of 40°10’ N. Latitude ................................. 12
1.4 Scoping ..................................................................................................................................... 13
CHAPTER 2 Description of Alternatives ................................................................................ 15
2.1 Alternatives ............................................................................................................................ 15
2.1.1 No-Action Alternative ................................................................................................. 15
2.1.2 Alternative 1, 100 fm Shoreward Boundary, 150 fm Seaward Boundary. 16
2.1.3 Alternative 2, Maintaining an RCA closure from 40°10’ N. latitude to 45°46’ N. latitude, 150 fm to modified 200 fm. ............................................................... 16
2.2 Alternatives considered but rejected from analysis ............................................... 17
CHAPTER 3 Status of the Affected Environment ................................................................ 18
3.1 Physical Environment ........................................................................................................ 18
3.2 West Coast Marine Ecosystem ........................................................................................ 18
3.3 Essential Fish Habitat ......................................................................................................... 19
3.3.1 Non-Groundfish Species ............................................................................................ 19
3.3.2 Pacific Coast Groundfish ............................................................................................ 19
3.3.3 Benthic Habitat Substrates and Recovery .......................................................... 24
3.3.4 Current Habitat as Affected by Fishing Gear ..................................................... 34
3.4 Biological Resources ........................................................................................................... 53
3.4.1 Groundfish Target Species ........................................................................................ 53
3.4.2 Non-target Species, including overfished groundfish .................................... 60
3.4.3 Invertebrates ................................................................................................................. 64
3.4.4 Protected Species, including ESA Species ........................................................... 70

3
3.5 Description of the Socio-economic Environment .................................................... 72
3.5.1 Shorebased IFQ Program .......................................................................................... 72
3.5.2 Processor Sector ........................................................................................................... 75
3.5.3 Communities .................................................................................................................. 75
CHAPTER 4 Environmental Consequences .......................................................................... 77
4.1 Physical Environment ........................................................................................................ 77
4.1.1 Physical Oceanography .............................................................................................. 77
4.2 West Coast Marine Ecosystems ...................................................................................... 78
4.2.1 No-action, Alternative 1, and Alternative 2 ....................................................... 78
4.3 Essential Fish Habitat ......................................................................................................... 78
4.3.1 No-action ......................................................................................................................... 78
4.3.2 Alternative 1 ................................................................................................................... 80
4.3.3 Alternative 2 ................................................................................................................... 81
4.4 Biological Resources ........................................................................................................... 83
4.4.1 Groundfish Target Species ........................................................................................ 83
4.4.2 Non-target Species, Including Overfished Groundfish .................................. 86
4.4.3 Invertebrates ............................................................................................................... 101
4.4.4 Protected Species, Including ESA listed species ............................................. 101
4.5 Socio-economic Impacts .................................................................................................. 105
4.5.1 Shorebased IFQ Program ........................................................................................ 105
4.5.2 Processor Sector ......................................................................................................... 109
4.5.3 Communities ................................................................................................................ 110
4.6 Cumulative Impacts ........................................................................................................... 111
4.6.1 Consideration of the Affected Resources .......................................................... 111
4.6.2 Geographic Boundaries ............................................................................................ 111
4.6.3 Temporal Boundaries ............................................................................................... 112
4.4.1 Non-fishing Actions .................................................................................................... 115
4.4.2 Magnitude and Significance of Cumulative Effects .......................................... 116
4.6.4 Proposed Action on all of the Affected Resources ......................................... 122
CHAPTER 5 Statutory Requirements and Applicable Law ........................................... 124
5.1 FMP Goals and Objectives and National Standards .............................................. 124
5.2 Other Applicable MSA Provisions ................................................................................ 128
CHAPTER 6 OTHER APPLICABLE LAW ................................................................................ 129
6.1 Other Federal Laws ........................................................................................................... 129

4
6.1.1 Coastal Zone Management Act .............................................................................. 129
6.1.2 Endangered Species Act ........................................................................................... 129
6.1.3 Marine Mammal Protection Act ............................................................................ 131
6.1.4 Migratory Bird Treaty Act ....................................................................................... 131
6.1.5 Paperwork Reduction Act ....................................................................................... 131
6.1.6 Regulatory Flexibility Act ........................................................................................ 132
6.2 Executive Orders ................................................................................................................ 133
6.2.1 EO 12866 (Regulatory Impact Review) ............................................................. 133
CHAPTER 7 List of Agencies and Persons Consulted and Preparers ........................ 136
CHAPTER 8 References .............................................................................................................. 137
8.1 Council and NMFS related document references: ................................................. 137
Journal article in prep: ................................................................................................................... 141
CHAPTER 9 Finding of No Significant Impact .................................................................... 142

5
LIST OF FIGURES
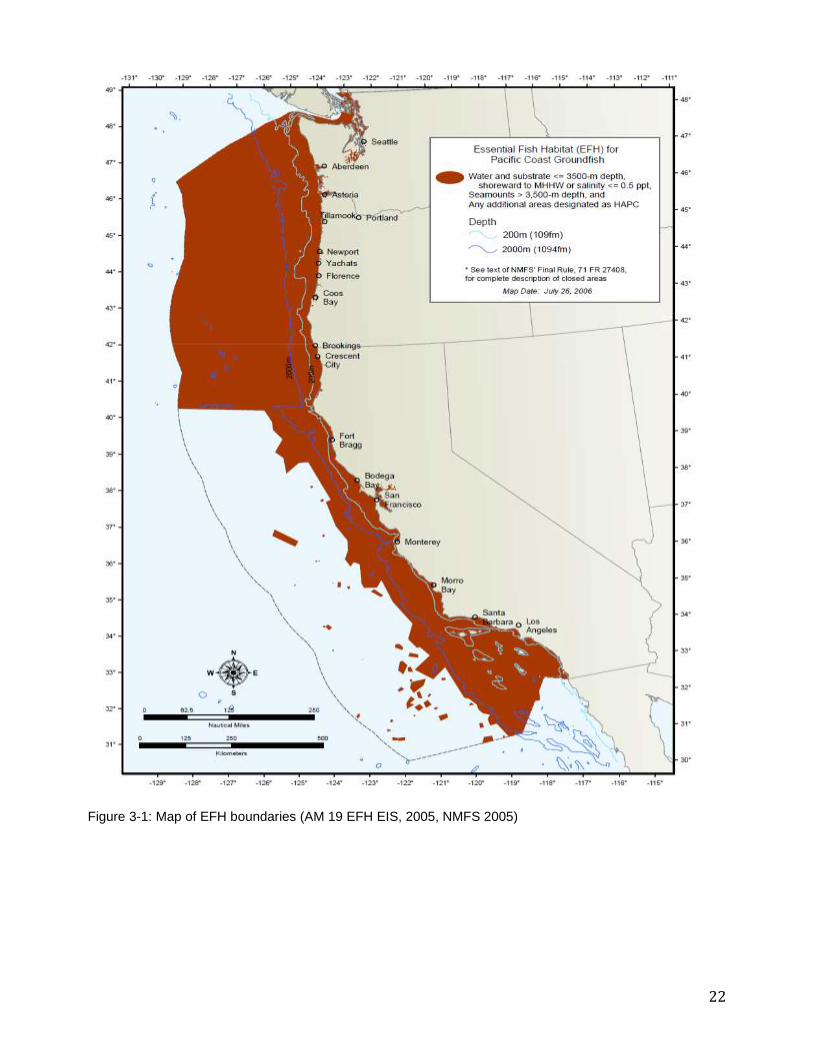
Figure 3-1: Map of EFH boundaries (AM 19 EFH EIS, 2005, NMFS 2005) ................. 22 Figure 3-2: Map of EFH area closures to protect Pacific Coast groundfish
habitat (AM 19 EFH EIS, 2005, NMFS 2005). ................................................. 23 Figure 3-3: Proposed action area with selected RCA areas, interval by fm,
emphasis added for 40° 10’ N. latitude, 45° 43’ N. latitude, and 48° 10’ N. latitude.. ............................................................................................................ 26
Figure 3-4: Proposed action area with selected RCA areas, 200 fm estimated waypoint line and modified “petrale cutouts”, North of 40° 10’ N. lat. to 48° 10’ N. lat., 150-200 fm). ...................................................................... 27
Figure 3-4: Substrates within the 75-100 fathom line interval, between 40° 10’ N. latitude and 48° 10’ N. latitude, and estimated substrate (seabed) types soft, mixed, and hard................................................................. 30
Figure 3-5: Substrates within the 100-150 fathom line interval, between 40° 10’ N. latitude and 48° 10’ N. latitude, and estimated substrate (seabed) types soft, mixed, and hard................................................................. 31
Figure 3-6: Substrates within the 150-200 fathom line interval, between 40° 10’ N. latitude and 48° 10’ N. latitude, and estimated substrate (seabed) types soft, mixed, and hard................................................................. 32
Figure 3-7: Proportional distribution of different substrate types in the area between the 150 and 200 fathom RCA boundaries, between 40° 10’ N. lat. and 45° 46’ N. lat. .................................................................................. 33
Figure 3-8: Proportional distribution of different substrate types in the area between the 150 and 200 fathom RCA boundaries, between 45°46’ N. lat. and 48°10’ N. lat. ........................................................................................... 33
Figure 3-9. Proposed action area with selected RCA areas, interval by fm, 45° 46’ N. latitude to 48° 10’ N. latitude. Interval by fathom areas is represented in 75, 100, 150 and 200 fathom lines. ..................................... 35
Figure 3-10: Proposed action area with selected RCA areas, interval by fm, 40° 10’ N. latitude to 45° 43’ N. latitude. Interval by fathom areas is represented in 75, 100, 150 and 200 fathom lines.. .................................... 36

6
Figure 3-11: WCGOP distribution data of bottom trawl observed trips from 2005-2011, by latitude, longitude, and effort hours under tow. ............ 40
Figure 3-12: WCGOP distribution data of bottom trawl observed trips during 2011, by latitude, longitude, and effort hours under tow. ........................ 40
Figure 3-13: Observed 2005-2011 longline fixed-gear effort by depth (fm) and latitude. Heat cell units in thousands of hooks observed. ........................ 43
Figure 3-14: Observed 2011 longline fixed-gear effort by depth (fm) and latitude. ......................................................................................................................... 44
Figure 3-15: Observed 2005-2011 groundfish pot fixed-gear effort by depth (fm) and latitude........................................................................................................ 44
Figure 3-16: Observed 2011 groundfish pot fixed-gear effort by depth (fm) and latitude. Heat cell units in numbers of pots observed. .............................. 45
Figure 3-17: Diagram of a finfish excluder used in pink shrimp bottom trawl nets ................................................................................................................................. 46
Figure 3-18: WCGOP distribution data of Pink Shrimp trawl observed trips from 2005-2011, by latitude, longitude, and effort hours under tow. ............ 47
Figure 3-19: WCGOP distribution data of Pink Shrimp trawl observed trips from 2005-2011, by latitude, longitude, and effort hours under tow. ............ 48
Figure 3-20: Oregon Department of Fish and Wildlife (ODFW) depth of shrimp tows compared with the number of observations in various recorded depths from ODFW logbooks. ........................................................... 48
Figure 3-21: Map of the number of times per survey grid cell a successful tow was made by NWFSC West Coast Groundfish surveys (2003 to 2012). ............................................................................................................................. 51
Figure 3-22: Map of the number of times per survey grid cell a successful tow was made by NWFSC West Coast Groundfish surveys (2012). ............... 52
Figure 3-23: Map showing locations of deep coral bycatch recorded by fishery observers in the West Coast Groundfish Observer Program.. ................. 66
Figure 3-24: Picture of sea whips on soft substrate. ............................................................. 70 Figure 3-25: The action area, showing major coastal communities and
management areas (2013-2014 FEIS). ............................................................. 76 Figure 4-1. 2011 Fixed gear (longline and pot) groundfish landings and non-
groundfish whiting trawl total landings (mt). ............................................... 85 Figure 4-2 : Comparison of historical time-weighted average annual bycatch
rates of rebuilding species (2006-2010, prior to trawl rationalization), under the current RCA configuration (No Action), versus the proposed configuration (Alternative 1), for the area between 40°10’ and 48°10’ N. lat., during the seasons listed. ................. 90
Figure 4-3. Spatial distribution of canary rockfish survey catch (2003-2012), from 40°10’ to 48°10’ N. lat................................................................................... 92
Figure 4-4. Spatial distribution of darkblotched rockfish survey catch (2003-2012), from 40°10’ to 48°10’ N. lat. Data source: NWFSC Groundfish Bottom Trawl Survey. ...................................................................... 93
Figure 4-5. Spatial distribution of Pacific ocean perch rockfish survey catch (2003-2012), from 40°10’ to 48°10’ N. lat.. .................................................... 94

7
Figure 4-6. Total annual catch of rebuilding species from 2009 and 2010, in the limited entry (LE) trawl and shoreside whiting sectors, as well as 2011 and 2012, in the Shorebased IFQ Program, in metric tons. ..... 95
Figure 4-7. Relative weights of canary rockfish per haul using trawl gear, north of 40°10’ N. lat., shoreward of the RCA, during 2011 under IFQ, plotted versus average haul latitude and average haul depth (fm); bubble width represents weight of canary rockfish per haul. ..... 97
Figure 4-8. Distribution of canary rockfish catch by haul depth using trawl gear, north of 40°10’ N. lat., shoreward of the RCA, during 2011 in the IFQ fishery. ........................................................................................................... 97
Figure 4-9. Relative weights of darkblotched rockfish per haul using trawl gear, north of 40°10’ N. lat., seaward of the RCA, during 2011 under IFQ, plotted versus average haul latitude and average haul depth (fm); bubble width represents weight of canary rockfish per haul. ................................................................................................................................ 99
Figure 4-10. Distribution of darkblotched rockfish catch by haul depth using trawl gear, north of 40°10’ N. lat., seaward of the RCA, during 2011 in the IFQ fishery. ...................................................................................................... 99
Figure 4-11: Landings and revenue by port group, for non-whiting trips, in the Shorebased IFQ Program. Port groups are arranged by latitude ................ 107

8
LIST OF TABLES
Table 2-1: Current (No-Action) trawl RCA boundaries (fathom) for the area between 48°10’ N. lat. and 40°10' N. lat. Grey filled cells indicate the boundaries and seasons which would be changed under the action alternative(s). ................................................................................................ 15
Table 2-2: Alternative 1 trawl RCA boundaries (fathom) for the area between 40°10' N. lat. and 48°10’ N. latitude. .................................................................. 16
Table 2-3: Alternative 2 trawl RCA boundaries (fathom) for the area between 40°10' N. lat. and 48°10’ N. latitude. .................................................................. 17
Table 3-1: Recovery time (years) for four major gear and three bottom types adapted from PFMC 2004 (EFH EIS) & PFMC 2013 (EFH habitat synthesis report, April 2013). .............................................................................. 24
Table 3-2: Comparison of probable substrate type by 75-100 fathom range, square miles, and percent substrate type between 40° 10’ N. latitude and 48° 10’ N. latitude, including probable substrate (seabed) types soft, mixed, and hard................................................................. 30
Table 3-3: Comparison of probable substrate type by100-150 fathom range, square miles, and percent substrate type between 40° 10’ N. latitude and 48° 10’ N. latitude, including probable substrate (seabed) types soft, mixed, and hard................................................................. 31
Table 3-4: Comparison of probable substrate type by 150-200 fathom range, square miles, and percent substrate type between 40° 10’ N. latitude and 48° 10’ N. latitude, including probable substrate (seabed) types soft, mixed, and hard................................................................. 32
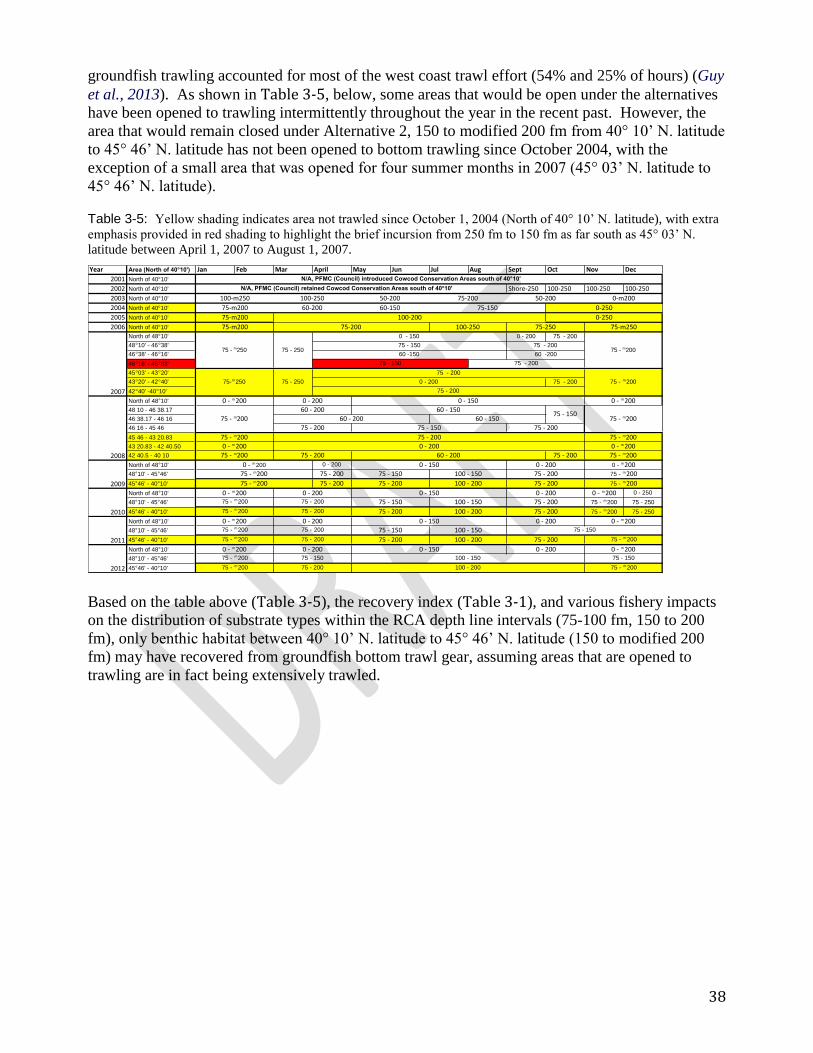
Table 3-5: Yellow shading indicates area not trawled since October 1, 2004 (North of 40° 10’ N. latitude), with extra emphasis provided in red shading to highlight the brief incursion from 250 fm to 150 fm as far south as 45° 03’ N. latitude between April 1, 2007 to August 1, 2007. .............................................................................................................................. 38
Table 3-6: Non-whiting Observer Coverage Rates, 2002-2010 (pre-IFQ). Total trips, tows, vessels and groundfish landings observed in the limited entry groundfish bottom trawl fishery, 2002-2010..................... 41

9
Table 3-7: Fixed gear RCA depth boundaries by year and month, 2002-2013, including inseason changes.. ................................................................................. 42
Table 3-8: History of pink shrimp trawl effort from state logbook records in max depth (fm) and total number of recorded hauls. ................................. 46
Table 3-9: Observer Coverage Rates. Total trips, tows, vessels and pink shrimp landings observed in the pink shrimp trawl fishery. ................... 49
Table 3-10: WA, OR, CA Dungeness crab pot gear sets by depth .................................... 49 Table 3-11: Latitudinal and depth distributions of groundfish species (adults)
managed under the FMP. ....................................................................................... 53 Table 3-12: General statistics on deep corals sampled during National Marine
Fisheries Service (NMFS) bottom trawl surveys, which were conducted off the coasts of Washington, Oregon and California by the Alaska and Northwest Fisheries Science Centers between 1980 and 2005. ...................................................................................................................... 65
Table 3-13: Frequency of occurrence, depth, and latitudinal ranges for fish and invertebrate species, grouped by family (or higher taxonomic classification), caught during the 2005 NWFSC slope/shelf survey ..... 67
Table 3-14: Summary of coral and sponge bycatch metrics for observed tows using bottom trawls as part of the West Coast Groundfish Observer Program (WCGOP), comparing two time periods: “Before” (3 Jan 2002 – 11 Jun 2006) and “After” (12 Jun 2006 – 31 Dec 2010) implementation of Amendment 19 regulationsa/. ................ 67
Table 3-15: Summary of coral and sponge taxa recorded during tows as part of the West Coast Groundfish Bottom Trawl Survey (WCGBTS), comparing two time periods: “Before” (2003-05) and “After” (2006-10) ..................................................................................................................... 69
Table 3-16: Number of vessels making at least one groundfish landing each year by Port Group and Sector, 2005-2009 .................................................... 72
Table 3-17: Monthly landings (left) and revenue (right) during 2011 and 2012, for nonwhiting trips in the Shorebased IFQ Program. ............................... 74
Table 3-18: Average monthly landings (left) and revenue (right) during 2009-2010 (green open circles, dashed lines), versus 2011-2012 (black squares, solid lines), for non-whiting trips in the Shorebased IFQ Program (limited entry non-whiting trawl fishery during 2009-10) ... 74
Table 4-1: Estimated Substrate Square Miles within Alternative 1 ............................ 85 Table 4-2: Estimated Substrate Square Miles maintained as Rockfish
Conservation Areas under Alternative 1 ......................................................... 86 Table 4-3: Historical time-weighted average annual bycatch rates of
rebuilding species (2006-2010, prior to trawl rationalization), under the current RCA configuration (No Action), versus the proposed configuration (Alternative 1), for the area between 40°10’ and 48°10’ N. lat., during the seasons listed. ................................... 91
Table 4-4: Total annual catch of rebuilding species from 2009 and 2010, in the limited entry trawl and shoreside whiting sectors, as well as 2011 and 2012, in the Shorebased IFQ Program, in metric tons. .......... 96
10
Table 4-5: Annual landings and revenue, distributed by port group, for non-whiting trips (top) and directed whiting trips (bottom), in the Shorebased IFQ Program, for 2011 and 2012. Port groups are arranged by latitude. .............................................................................................. 108
Table 4-6: Ex-vessel revenue from shorebased non-whiting and whiting trips in the IFQ program, during 2011 and 2012, only for the area between 40° 10’ N. latitude to 48° 10’ N. lat. ................................................ 109
Table 4-7: Summary of the effects of past, present, and reasonably foreseeable future actions on habitat.............................................................. 118
Table 4-8: Summary of the effects of past, present, and reasonably foreseeable future actions on biological resources ................................... 120
Table 4-9: Summary of the effects of past, present, and reasonably foreseeable future actions on human communities .................................. 121

11
CHAPTER 1 INTRODUCTION
1.1 How This Document is Organized
This document proposes alternatives (Chapter 2), describes the current physical,
biological, and socio-economic environments relevant to the action (Chapter 3), and
analyzes the alternatives for trawl rockfish conservation area (RCA) boundary
configurations (Chapter 4). The analyses in Chapter 4 compare the action alternatives to
the No Action Alternative and provide an assessment of the potential impacts relative to
specified ecological, biological, and socio-economic resources.
1.2 Purpose and Need
The purpose of the action is to increase access to target stocks through liberalizations of
the trawl RCA boundaries from 40°10’ to 48° 10’ N. latitude while allowing the
individual accountability of the shorebased trawl Individual Fishing Quota (IFQ) program
to minimize bycatch and incidental catch of overfished species. The action is needed to
enable participants the ability to more fully and efficiently utilize their quota pounds
while still meeting the Council’s and Agency’s goal for sustainability of the Pacific Coast
groundfish fishery.
1.3 Background
An RCA is an area closed to fishing by particular gear types, bounded by lines
specifically defined by latitude and longitude coordinates established at 50 CFR 660.391–
394. Although the boundary lines defined by the latitude and longitude coordinates are
typically generalized approximations of depth, the RCAs are not actually defined by
depth contours, and the boundary lines that define the RCA may close areas that are
deeper or shallower than the actual depth contours. Vessels that are subject to the RCA
restrictions may not fish in the RCA, or operate in the RCA for any purpose other than
transiting. The coordinates establishing a specific boundary line, such as the 100 fathom
(fm) line, can be used to define RCAs for different gear types.

12
There are numerous commercial gears used in the Pacific coast groundfish fishery,
among which are groundfish trawl gears. There are two primary types of groundfish
trawl: bottom trawl and midwater trawl. Bottom trawl gear is divided into large footrope
and small footrope gear (including selective flatfish gear). The action being considered
here would affect where vessels fishing with groundfish bottom trawl gear can fish.
Trawl RCA boundaries have been routinely adjusted over various depths since their
inception. Once RCA boundary lines are established in regulation through latitude and
longitude coordinates and are available for use, there are two primary ways in which
RCAs can change through time. The first is modification of latitude and longitude
coordinate points to better approximate a particular depth contour while allowing access
to target stocks, or to correct inaccurate coordinates. The second is changing already
approved waypoints to alter seaward and shoreward boundary lines that are used to
define the RCA (e.g., an RCA originally bounded by the lines approximating the 75 fm
and 150 fm depth contours may be changed to be bounded from the shoreline to 250 fm).
The action alternatives under consideration, described in Chapter 2, are this second type
of change.
1.3.1 History of the Trawl RCAs North of 40°10’ N. Latitude
Depth-based management measures, particularly the setting of large areas closed to
bottom trawling, were first implemented in 2002 to reduce catch of darkblotched
rockfish. Darkblotched rockfish was declared overfished in 2000 and management
measures at the time were proving inadequate to keep catch within the species’ optimum
yield (OY). Through the use of depth-based closures, the Council and NMFS sought to
allow some fishing for healthy stocks while still protecting darkblotched rockfish.
After reviewing the darkblotched rockfish depth distribution and the depth distribution of
healthy co-occurring stocks, in 2002, the Council recommended prohibiting bottom
trawling between lines approximating the 100 fm and 250 fm depth contours north of
40°10’ N. latitude. To allow vessels to fish for nearshore flatfish and deepwater species
occurring outside of the primary darkblotched rockfish depth range, flatfish trawling
shoreward of the 100 fm line was still allowed, as was bottom trawling seaward of the
250 fm line. (67 FR 57973, September 13, 2002). The only depth-based management
measure in the groundfish fishery that was in use prior to that action was a 20 fm contour
off California south of 40°10’ N. lat., used to control fishing inside and outside of that
contour by commercial and recreational hook-and-line fisheries.1
Subsequently, when designing 2003 management measures, the Council recommended
and NMFS implemented trawl RCAs that would provide protection for several overfished
species including darkblotched rockfish, canary, lingcod, widow rockfish, yelloweye
rockfish, and Pacific ocean perch. For the 2003 limited entry bottom trawl fisheries north
of 40°10’ N. lat., the Council recommended a closed area between lines approximating
1 For the month of September, all groundfish bottom trawling shoreward of the 100 fm line was
prohibited. Other closures, such as the cowcod conservation areas, were established earlier (e.g.,
2001).

13
the 100–250 fm depths, with the shoreward boundary line moving to a 75 fm line for the
months of July-August. In the months of January–February and November–December,
the offshore closed area boundary was revised to allow some bottom trawling in areas
where petrale sole tends to aggregate. These revisions, often referred to as “petrale
cutouts” are still in use when the trawl RCA boundary is established using the “modified”
boundary lines as described in regulation. For example, the modified 200 fm line would
include petrale cutouts, the 200 fm line would not.
While the majority of U.S. protected areas were established to conserve biodiversity or
ecosystem structure (NOAA 2008), the management goal of the RCA was to aid in
rebuilding overfished rockfish species (Keller et al., in prep., 2013).
Beginning in 2007, the structure of the RCA became highly complex, due to efforts by
management to allow as much access to target species as possible, while avoiding
discrete areas with high bycatch rates of rebuilding species (Agenda Item E.5.b,
Supplemental GMT Report, March 2007); much of this management effort was focused
on controlling catch of darkblotched rockfish and canary rockfish; breaking up the RCA
into numerous discreet blocks to encourage more seaward effort in areas of lower risk of
extreme catch events for darkblotched rockfish, to take some fishing pressure off of the
shoreward areas, and balance against bycatch of canary rockfish on the shelf.
1.4 Scoping
At the Council’s March 7–11, 2013 meeting in Tacoma, Washington, the Groundfish Advisory Sub-panel (GAP ) requested a liberalization of the shoreward trawl RCA from 75 fm to 100 fm, between 40° 10’ N. latitude and 48° N. latitude, for the latter part of Period two (March-April). The GAP stated that the boundary change could increase access to target species such as yellowtail rockfish, Pacific cod, lingcod, and Dover sole (Agenda Item H.3.b, Supplemental GAP Report). The Groundfish Management Team (GMT) analyzed current and historical catch data to assess the potential for increased catch of overfished species resulting from the proposal (Agenda Item H.3.b, Supplemental GMT Report). After consideration, the Council adopted the recommendation to move the shoreward trawl rockfish conservation area boundary from 75 to 100 fm between 40°10' and 48°10' N. latitude for Period two. Due to questions about the adequacy of the timing of the Federal Register notice announcing the March 2013 meeting, the Council’s recommendations from March were considered “Preliminary Selections” to be formalized under a specific agenda item at the April 6–11, 2013 Council meeting in Portland, Oregon. At the April meeting, the Council reaffirmed its recommendation from the March meeting. In addition, Mr. Frank Lockhart (Assistant Regional Administrator for Sustainable Fisheries, NMFS Northwest Region) met with the GAP to discuss NMFS’ intention to make any liberalizations being considered for 2013-2014 trawl RCA boundaries through full notice and comment rulemaking. The setting of depth-based management measures, such as changes to RCA boundaries, is designated as a

14
routine management measure under the Groundfish FMP. As a routine measure, the Council can make recommendations for changes at a single Council meeting, which typically occurs under the groundfish inseason agenda items. Under the typical inseason process, NMFS usually asserts it has good cause to waive the Administrative Procedure Act requirements for notice and comment rulemaking because allowing for the time necessary for notice and comment would be impracticable and contrary to the public interest. However, under the specific circumstances, it did not seem that the benefits of the Council’s March recommendation, as reconfirmed at the April meeting, outweighed the public's interest in having the opportunity to provide comment. (PFMC, June, Agenda Item F.9.b, NMFS Letter 2). Based on NMFS’ belief that that it was in the broader public interest to allow for notice and comment rulemaking during the consideration of RCA liberalizations for 2013-2014, at its April meeting the Council also considered shoreward and seaward trawl RCA boundary modifications beyond its March recommendation. Specifically, the GAP recommended making changes to the trawl RCA boundaries north of 40° 10’ N. lat. to 48° 10’ N. lat. through the remainder of 2014 beginning in period six of 2013 such that a 100 fm shoreward boundary and 150 fm seaward boundary would be in place year round north of 40° 10’ N. lat. to 48° 10’ N. lat. The GAP noted the recent low attainments of some economically important species and that liberalizing the RCA lines would allow trawlers to take advantage of opportunities to maximize the potential of their business plans, while allowing the IFQ system to minimize risks to stocks of concern. (Agenda Item D.8.b Supplemental GAP Report.) After consideration, the Council adopted the GAP’s recommendation. Additionally, at the Council’s June 18-25, 2013 meeting in Garden Grove, California, NMFS staff notified GMT and GAP members that there was an area in the 2013-2014 recommendation that would open fishing grounds that may have had some opportunity to recover from impacts caused by bottom trawl gear. The Council was also made aware of NMFS’ intention to prepare an environmental assessment (EA). The Council requested to have opportunity to evaluate the draft EA on the proposed action and either reaffirm its April recommendation, or revise their recommendation during the public comment period for the proposed action. Additionally, an environmental organization provided public comment on the inseason agenda item (PFMC, June 2013, agenda item F.9). That testimony mentioned concerns about opening areas that may have recovered from bottom trawling impacts prior to completion of the groundfish Essential Fish Habitat (EFH) review. The group also stated that habitat value and the risks of a bycatch “disaster tow” should be the focus of analysis with respect to RCA boundary modifications. Last, representatives from industry commented that they were in support of the proposed action at the March, April, and June Council meetings.
15
CHAPTER 2 DESCRIPTION OF
ALTERNATIVES
2.1 Alternatives
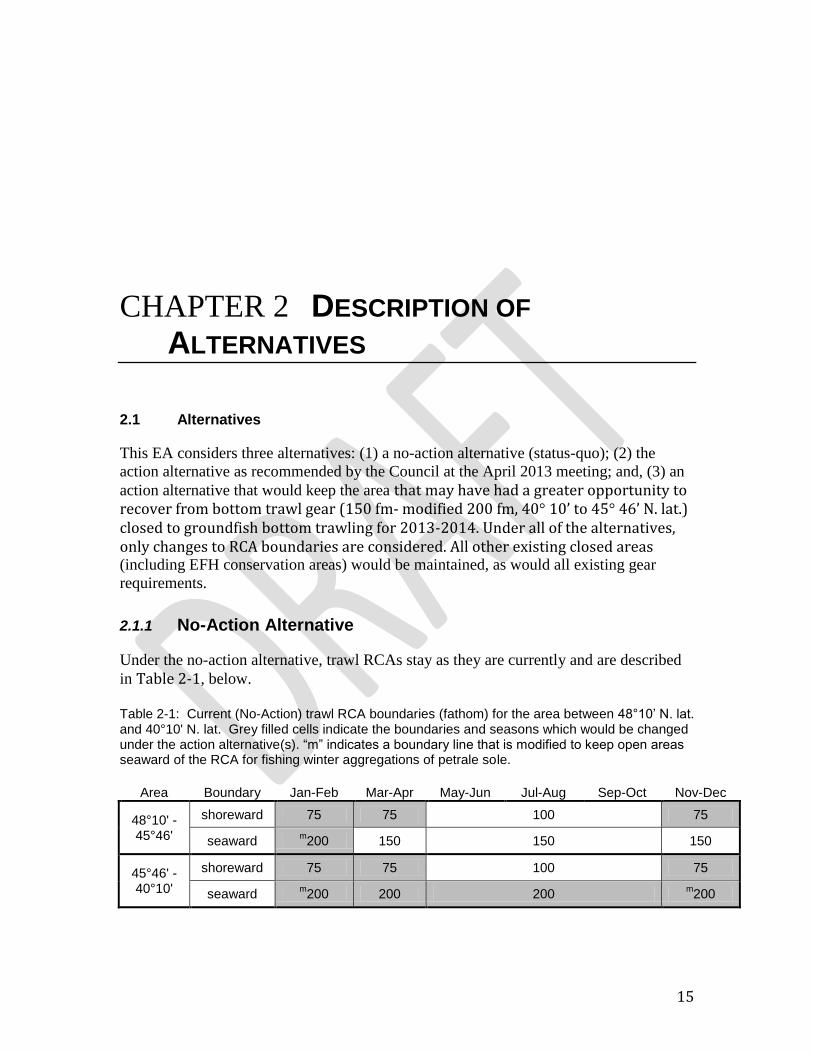
This EA considers three alternatives: (1) a no-action alternative (status-quo); (2) the
action alternative as recommended by the Council at the April 2013 meeting; and, (3) an
action alternative that would keep the area that may have had a greater opportunity to recover from bottom trawl gear (150 fm- modified 200 fm, 40° 10’ to 45° 46’ N. lat.) closed to groundfish bottom trawling for 2013-2014. Under all of the alternatives, only changes to RCA boundaries are considered. All other existing closed areas (including EFH conservation areas) would be maintained, as would all existing gear
requirements.
2.1.1 No-Action Alternative
Under the no-action alternative, trawl RCAs stay as they are currently and are described
in Table 2-1, below.
Table 2-1: Current (No-Action) trawl RCA boundaries (fathom) for the area between 48°10’ N. lat. and 40°10' N. lat. Grey filled cells indicate the boundaries and seasons which would be changed under the action alternative(s). “m” indicates a boundary line that is modified to keep open areas seaward of the RCA for fishing winter aggregations of petrale sole.
Area Boundary Jan-Feb Mar-Apr May-Jun Jul-Aug Sep-Oct Nov-Dec
48°10' - 45°46'
shoreward 75 75 100 75
seaward m200 150 150 150
45°46' - 40°10'
shoreward 75 75 100 75
seaward m200 200 200
m200

16
2.1.2 Alternative 1, 100 fm Shoreward Boundary, 150 fm Seaward Boundary.
Under alternative 1, trawl RCAs would be modified as recommended by the Council at its April 2013 meeting. The end result under alternative 1 would be a trawl RCA structure south of 48° 10' N. latitude that prohibits bottom trawling between the 100 fm and 150 fm RCA boundary lines. Specifically, the proposed action would change the trawl RCA boundaries as follows: (1) from a shoreward boundary line between 40° 10' N. latitude and 48° 10' N. latitude approximating 75 fm to a line approximating100 fm during periods 1, 2, and 6; (2) from a seaward boundary line between 40° 10' N. latitude and 45° 46' N. latitude approximating 200 fm to a line approximating 150 fm, during periods 1-6 (note that the modified 200 fm line is currently in place in periods 1 and 6), and; (3) from a seaward boundary line between 45° 46' N. latitude and 48° 10' N. latitude approximating the modified 200 fm to a line approximating 150 fm, during period 1. Table 2-2 below depicts the trawl RCA boundaries under alternative 1. Table 2-2: Alternative 1 trawl RCA boundaries (fathom) for the area between 40
°10' N. lat. and
48°10’ N. latitude. Note: no-action trawl RCA boundaries prior to November 1, 2013 will be as demonstrated in the No-Action alternative for 2013.
Area Boundary Jan-Feb Mar-Apr May-Jun Jul-Aug Sep-Oct Nov-Dec
48°10' - 40°10'
shoreward 100
seaward 150
2.1.3 Alternative 2, Maintaining an RCA closure from 40°10’ N. latitude to 45°46’ N. latitude, 150 fm to modified 200 fm.
Under alternative 2, all of the trawl RCA boundary modifications under alternative 1 would be implemented with the exception of the changes to the seaward boundary from 200 fm to 150 fm, 40° 10’ N. lat to 45° 46’ N. lat. Instead, the seaward boundary in this area would be changed to the modified 200 fm line year-round. The end result under alternative 2 would be a trawl RCA structure south of 48° 10' N. lat.
that: (1) prohibits bottom trawling between the 100 fm and 150 fm RCA boundary lines
from 45° 46’ N. latitude to 48° 10’ N. latitude; and (2), prohibits bottom trawling from
100 fm to the modified 200 fm line from 40° 10’ N. latitude to 45° 46’ N. latitude.
Specifically, the proposed action would change the trawl RCA boundaries as follows: (1)
from a shoreward boundary line between 40° 10' N. lat. and 48° 10' N. lat. approximating
75 fm to a line approximating100 fm during periods 1, 2, and 6; (2) from a seaward
boundary line between 45° 46' N. latitude and 48° 10' N. latitude approximating the
modified 200 fm to a line approximating 150 fm, during period 1.; (3) from a seaward
200 fm boundary in periods 2-5 to a modified 200 fm boundary in periods 2-5. The table
below depicts the trawl RCA boundaries under alternative 2

17
Table 2-3: Alternative 2 trawl RCA boundaries (fathom) for the area between 40°10' N. lat. and 48°10’ N. latitude. Note: no-action trawl RCA boundaries prior to November 1, 2013 are as demonstrated in the no-action alternative for 2013. “m” indicates a boundary line that is modified to keep open areas seaward of the RCA for fishing winter aggregations of petrale sole.
Area Boundary Jan-Feb Mar-Apr May-Jun Jul-Aug Sep-Oct Nov-Dec
shoreward
seaward
shoreward
seaward
48°10' -
45°46'
45°46' -
40°10'
100
150
100
m200
2.2 Alternatives considered but rejected from analysis
At the Council’s March 7-11, 2013 meeting, the Council considered an industry request
for changes to the trawl RCA boundaries forwarded by the GAP and analyzed by the
GMT (see Scoping1.4). After consideration, the Council adopted the recommendation to
move the shoreward trawl rockfish conservation area boundary from 75 to 100 fm
between 40°10' and 48°10' N. latitude for Period two (March-April). Because the March
recommendation, which was reconfirmed at the Council’s April meeting, was considered
a preliminary selection and would have only made boundary changes for the last two
weeks of Period 2, the alternative was rejected. Making changes only for two weeks
within a single period is not considered further in this EA under either Alternatives 1 or 2
because the short-term change would not fully meet the need to provide increased access
to underutilized target species.
Neither the Council nor the GAP recommended changes to RCA boundaries south of 40°
10' N. latitude because the trawl RCA south of 40°10' N. lat. was already based on a 100
fm shoreward boundary and a 150 fm seaward boundary, and thus was not restricting
access to target stocks in the same manner as the trawl RCA between 40° 10' N. latitude
and 48° 10' N. latitude. Additional changes to trawl RCA boundaries could be
considered in the future under a different action. Changes to RCA boundaries north of
48°10' N. lat. were not recommended due to concerns with high bycatch rates of
yelloweye and canary rockfish.
NMFS also considered but rejected an alternative that would have made the shoreward
boundary change from 75 to 100 fm and the seaward boundary change from north of 45°
46’ N. lat. to 48° 10’ N. lat. from the modified 200 fm line to the 150 fm line, but
maintained the no-action seaward boundaries from 40° 10’ N. lat. to 45° 46’ N. lat. This
alternative was rejected from detailed analysis because the modified 200 fm line was
already in place between 40° 10’ N. lat. and 45° 46’ N. lat. and being trawled in periods 1
and 6. Accordingly, an alternative that established a year-round modified 200 fm
boundary in this area was more consistent with the purpose and need and is considered in
Alternative 2.

18
Total elimination of the trawl RCA between 40°10' N. lat. and 48°10' N. lat. was not
recommended for detailed analysis because gathering additional information about the
shorebased IFQ fishery’s performance in areas with potentially greater impacts to
overfished species was warranted. Additional changes to trawl RCA boundaries could be
considered in the future under a different action.
CHAPTER 3 STATUS OF THE AFFECTED
ENVIRONMENT
3.1 Physical Environment
A divergence in prevailing wind patterns causes the west wind drift (North Pacific Current) to split
into two broad coastal currents when it reaches the North American Continent near Vancouver,
B.C.: the California Current to the south and the Alaska Current to the north. As there are really
several dominant currents in the California Current region, all of which vary in geographical
location, intensity, and direction with the seasons, this region is often referred to as the California
Current System.
3.2 West Coast Marine Ecosystem
Along the U.S. west coast within the California Current system, spatial patterns of biological
distribution (biogeography) have been observed to be influenced by various factors including
depth, ocean conditions, and latitude. Cape Mendocino (Mendocino Escapement) is one of the
most noteworthy influences to the latitudinal distribution of rockfish species diversity in the PFMC
area. Most stock assessments for groundfish tend to be either coastwide assessments, or are relative
to the stocks north or south of Cape Mendocino (occasionally Cape Blanco).
The California Current Ecosystem (CCE) is loosely defined as encompassing most of the U.S. and
Canada west coasts, from the northern end of Vancouver Island, British Columbia, to Point
Conception, California. The trophic interactions in the CCE are extremely complex, with large
fluctuations over years and decades.

19
To some degree, food webs are structured around coastal pelagic species (CPS) that exhibit boom-
bust cycles over decadal time scales in response to low frequency climate variability, although this
is a broad generalization of the trophic dynamics. Similarly, the top trophic levels of such
ecosystems are often dominated by highly migratory species such as salmon, albacore tuna, sooty
shearwaters, fur seals, and baleen whales, whose dynamics may be partially or wholly driven by
processes in entirely different ecosystems, even different hemispheres.
3.3 Essential Fish Habitat
EFH is defined by the Magnuson-Stevens Act as those waters and substrate necessary to fish for
spawning, breeding, feeding, or growth to maturity (16 U.S.C. 1802(10)).
3.3.1 Non-Groundfish Species
EFH has been designated for non-groundfish species, such as salmon, coastal pelagic species, and
highly migratory species. For salmonids, EFH in the action area is limited to pelagic habitats. For
coastal pelagic and highly migratory species EFH is limited to pelagic (e.g. in the water column) or
oceanographic (e.g. temperature) habitats.
3.3.2 Pacific Coast Groundfish
Groundfish EFH has been deemed through the PFMC process to include 1) all ocean and estuarine
waters and substrates in depths less than or equal to 3,500 m, to the upriver extent of saltwater
intrusion, which is defined based on ocean salt content during low runoff periods, and 2) areas
associated with seamounts in depths greater than 3,500 m. The groundfish EFH designation
describes 59.2 percent of the EEZ, which equates to 48,719,109 ha (142,042 square miles) in
addition to state waters such as bays and estuaries (Figure 3-1) (EFH EIS, NMFS 2005).
NMFS prepared an EIS evaluating programmatic measures designed to identify and describe west
coast groundfish EFH (figure 3-1 below, NMFS 2005), and minimize potential fishing impacts on
west coast groundfish EFH. The Council took final action amending the groundfish FMP to
incorporate new EFH provisions in November 2005. NMFS partially approved the amendment in
March 2006. Implementing regulations became effective in June 2006.
In addition to identifying EFH and describing HAPCs, the Council also adopted mitigation
measures directed at the adverse impacts of fishing on groundfish EFH. Principal among these are
closed areas to protect sensitive habitats. There are three types of closed areas: bottom trawl closed
areas, bottom contact closed areas, and a bottom trawl footprint closure. The bottom trawl closed
areas are closed to all types of bottom trawl fishing gear. The bottom trawl footprint closure closes
areas in the EEZ between 1,280 m (700 fm) and 3,500 m (1,094 fm), which is the outer extent of
groundfish EFH. The bottom contact closed areas are closed to all types of bottom contact gear
intended to make contact with the bottom during fishing operations, which includes fixed gear such
as longline and pots. A more complete description of groundfish and associated EFH is contained
in the groundfish FMP
Bottom trawl gear is documented often in scientific literature as having a higher impact to ocean
habitat than other gear types, largely due to the unique impacts of bottom trawl gear to bottom
substrate caused primarily from the trawl doors. Trawl doors can penetrate the substrate, and
footropes and sweep gear may flatten and disturb biogenic mound, biogenic depression
microhabitats, and micro-topographic structures (De Marignac et al., 2008). Fish utilize these

20
micro-habitats for protection from predation and as refugia from currents (De Marignac et al.,
2008). Bottom trawling is anticipated to cause greater impact to mixed and hard substrates, as these
habitats have been observed to have the vast majority of sensitive biota such as coral and sponges.
Although fishermen may try to avoid these substrate types to reduce gear damage, incidental
encounters with these substrates may result in some increased impacts to sensitive biota. Small footrope gear (less than 8” in diameter) requirements were implemented to reduce impact
and incentive for trawling activities in mixed (boulder) and hard substrates, and are currently
required in regulation when fishing shoreward of 100 fm. In comparing differences in bottom trawl
fishing patterns since before and after small footrope gear requirements were put in place, “Spatial
shifts in fishing effort away from rock habitat were strikingly evident (intensity decreases were 69 -
93.7%) for all reference sites after the 2000 footrope restriction (Bellman et al, 2005).” Maximum
trawl footrope diameter restrictions were implemented in 2000 to help control rockfish catch in
hard substrate areas; reductions in rockfish catch limits prior to 2000 had already reduced trawl
activity within these areas. Because these two measures were implemented together, it has
confounded the effects of reduced trip limits and footrope diameter restrictions (Hannah, 2008).
However, regarding soft substrate, small footrope gear may have a larger impact on mud substrate
than sand, as small footropes may dig into the more consolidated mud causing greater disruption
and longer recovery from impacts.
The impacts of specific fisheries can vary widely on the characteristics of the gear and fleet
(Kaplan et al., 2012). It is typically assumed that trawl-induced changes have detrimental effects
on production of desired species, however heavily trawled systems remain very productive
(Hilborn, 2007). Recent analysis by NWFSC staff investigating long-term abundance of rockfish
and demersal groundfish in the survey area has been conducted. The authors point out that there is
“clear evidence that CPUE was higher in the closed area of the RCA for multiple fish species
including rockfishes and other commercially targeted and non-target species, even though we were
unsure if the differences were related to the original siting of the RCA in high density rockfish
habitat (Keller et al., in prep., 2013).” It is difficult to determine if the differences observed in
catch among areas existed before the closure or are a result of the ongoing protection from
commercial bottom trawling afforded to closed and periodically closed areas (Keller et al., in prep.,
2013). The consistently and significantly greater catch taken in the closed area of the trawl RCA
after accounting for covariates suggests that the closure provided some degree of protection for
demersal fish species within its borders (Keller et al., in prep., 2013).”
This analysis highlights a few key points in the Final EFH Synthesis Report to PFMC, April 2013
(incorporated by reference).
The majority of bottom trawling effort occurred over soft seafloor habitats on the shelf and
upper slope before EFH conservation areas were enacted, but shifted to the upper slope
post-2006.
The majority of observed fixed gear effort occurred over soft seafloor habitat.
Midwater trawling ranges from 8-31% annually over EFH conservation areas where bottom
trawling is prohibited.
Bottom trawl effort did not appear to occur where bottom contact gear was prohibited either
before or after the EFH conservation areas were established. A low level of bottom trawl
fishing in these areas is likely attributable to having only start and end points of trawl sets.
In areas were only fixed gear is allowed, effort has ranged annually from 4 – 18% of the

21
total fixed gear effort.
5% of observed fixed gear fishing effort on both the shelf and upper slope occurred over
hard habitat. The highest effort relative to hard habitat occurred over the central shelf
(23.7%).
Existing EFH conservation areas, other Federal closed areas, and the various state Marine Protected
Areas will not be affected by this proposed action (Figure 3-2, below).
22
Figure 3-1: Map of EFH boundaries (AM 19 EFH EIS, 2005, NMFS 2005)

23
Figure 3-2: Map of EFH area closures to protect Pacific Coast groundfish habitat (AM 19 EFH EIS, 2005, NMFS 2005).
Nehalem Bank/Shale Pile
Cowcod EFHConservation
Area East
Cherry Bank
Potato Bank Catalina Island
Hidden Reef/Kidney Bank
Selected Sites in CINMS
Santa Barbara
Point Conception
East San Lucia BankBig Sur Coast/Port San Luis
Davidson Seamount
Point Sur Deep
Monterey Bay/Canyon
Half Moon Bay
Farallon Islands/Fanny Shoal
Cordell Bank
Point Arena South Biogenic Area
Point Arena North
Tolo Bank
Delgada CanyonMendocino Ridge
Blunts ReefEel River Canyon
Rogue CanyonPresidentJackson
Seamount
Bandon High Spot
Deepwater off Coos Bay
Heceta Bank
Newport Rockpile/Stonewall Bank
Daisy Bank/Nelson IslandSiletz Deepwater
Astoria Canyon
ThompsonSeamount
Biogenic 3Grays CanyonBiogenic 2
Biogenic 1
Olympic 2
Santa Barbara
Morro Bay
Bodega
Bay
FortBragg
CrescentCity
Brookings
Florence
Yachats
Newport
Astoria
Tillamook
LosAngeles
Monterey
San
Francisco
CoosBay
Portland
Aberdeen
Seattle
-130°-131°
-129°
-129°
-128°
-128°
-127°
-127°
-126°
-126° -125°
-125°
-124°
-124°
-123°
-123°
-122°
-122°
-121°
-121°
-120°
-120°
-119°
-119°
-118°
-118°
-117°
-117°
-116°
-116°
-115°
-115°
-114° -113° -112° -111°
31°
31°
32°
32°
33°
33°
34°
34°
35°
35°
36°
36°
37°
37°
38°
38°
39°
39°
40°
40°
41°
41°
42°
42°
43°
43°
44°
44°
45°
45°
46°
46°
47°
47°
48°
48°
49°
30°
0 125 25062.5
Nautical Miles
0 250 500125
Kilometers
20
0m
20
00
m
Depth
200m (109fm)
2000m (1094fm)
Map Date: May 25, 2006
* See text of NMFS' Final Rule, 71 FR 27408,
for complete description of closed areas
Depth
200m (109fm)
2000m (1094fm)
Prohibition Type
Bottom trawl gear
Bottom-contact gear
Bottom trawl gearother than demersal seine
Bottom-contact gear or other geardeployed deeper than 500-fm
Westward of 700 fm depth contourand within designated EFH area:Closed to bottom trawl gear
EFH area closures to protect Pacific Coast groundfish habitat - Coastwide.

24
3.3.3 Benthic Habitat Substrates and Recovery
Considering that the trawl RCAs were established to reduce catch of overfished species, this EA
describes the overfished groundfish species most likely to be affected by the proposed action in
section 3.4.2 and analyzes the potential for increased catch of overfished species in Chapter 4,
section 4.4.2. However, this EA also addresses the primary offshore benthic habitat types contained
within the trawl RCA areas that would be opened to groundfish bottom trawling under the action
alternatives, taking into account their rates of recovery from historic and current impacts.
Offshore habitat recovery from the effects of trawl fishing varies by habitat type (2005 EFH EIS).
Offshore biogenic mixed and hard habitats generally have longer recovery times from trawl gear
impact compared to offshore unconsolidated habitats such as soft substrate (2005 EFH EIS).
Offshore mixed and hard bottom habitats may take up to 2.8 years to recover from pre-fishing
conditions for non-structure forming benthic habitats (Table 3-1, below). This estimation does not
take into account more defined habitat categories, such as slope sponge, which may take up to 10.5
years to recover (2005 EFH EIS, table 3-1), nor coral species, some of which are known to live
beyond 100 years or more. Regeneration rates for corals following disturbance are also not fully
understood in the scientific literature.
Table 3-1: Recovery time (years) for four major gear and three bottom types adapted from PFMC 2004 (EFH EIS) &
PFMC 2013 (EFH habitat synthesis report, April 2013).
Part B Recovery
Times Bottom Trawl Midwater Trawl
Fixed Gear
Distance
Fixed Gear
Point
Hard shelf 2.8 na 0.1 0.1
Hard upper
slope 2.8 na 0.3 0.1
Hard lower
slope 2.8 na 0.3 0.1
Mixed shelf 2.8 na 0.4 0.1
Mixed upper
slope 2.8 na 0.4 0.1
Mixed lower
slope 2.8 na 0.4 0.1
Soft shelf 0.4 na 0.4 0.1
Soft upper slope 1 na 0.4 0.1
Soft lower slope 1 na 0.4 0.1
Table 3-1 (above) demonstrates the estimated recovery time (years) for four major gear and three
bottom types (PFMC 2005 Amendment 19, EFH EIS, PFMC 2013 EFH habitat synthesis report,
April 2013). It is important to note that recovery times for bottom trawl habitat in soft substrates

25
are estimated to be substantially less than hard or mixed/medium substrates, ranging from 0.4 to 1
year, whereas impacts on hard and medium substrates are approximately 2.8 years. However, some
large coral and sponge species, particularly larger species over 30 cm in height are known to tangle,
damage, or experience mortality when pulled from substrate during entanglements from various
fishery gear types (fixed gear longline or pot, groundfish and non-groundfish), or when bottom
trawl gear (groundfish and shrimp) encounters medium and hard substrate (Brancato et al, 2007,
NMFS). Recovery time for some hard corals could be on the order of 100 years (EFH 5-year
review, Apendix J, September 2012).

26
Figure 3-3: Proposed action area with selected RCA areas, interval by fm, emphasis added for 40° 10’ N. latitude, 45°
43’ N. latitude, and 48° 10’ N. latitude. Interval by fm is represented in yellow (75-100 fm), green (100-150 fm), blue
(North of 45° 46’ N. lat. to 48° 10’ N. lat., 150-200 fm), and red (North of 40° 10’ N. lat. to 45° 46’ N. lat., 150-200
fm). Modified petrale cutouts are not displayed. Any discrepancies between the CSV coordinate files illustrated here
and the coordinates published in the Federal Register will be resolved in favor of the Federal Register.

27
Figure 3-4: Proposed action area with selected RCA areas, 200 fm estimated waypoint line and modified “petrale
cutouts”, North of 40° 10’ N. lat. to 48° 10’ N. lat., 150-200 fm). Any discrepancies between the CSV coordinate files
illustrated here and the coordinates published in the Federal Register will be resolved in favor of the Federal Register.

28
3.3.3.1 Description of Substrate Types in the Action Area
Bottom topography varieties may best be summarized among the following substrate types, which
may occur in nearshore, shelf, or slope benthic environments:
1. Soft substrate: unconsolidated sediment, mud, silt, sand.
2. Medium/mixed substrate: low-relief, cobble and boulder.
3. Hard substrate: steep ridge, rocky reef.
Some species of groundfish (and non-groundfish) may utilize varying substrate types at different
stages in their life history. For example, rockfish were usually quiescent beside or within erect
structures, but over flat seafloor they were swimming or moved passively with the current (Du
Preez & Tunnicliffe, 2011). Previously published studies agree that most rockfish have higher
abundances in areas that are difficult to trawl and that most flatfish have higher abundances in areas
that are easier to trawl (Zimmerman, 2003). Trawl marks on the California seafloor are commonly
oriented parallel to bathymetric contours (Bellman et al, 2005).
Soft substrate
Soft substrate may be the least susceptible to habitat impact by various groundfish gear types,
including bottom trawl. Although some degradation of invertebrate communities resulting from
bottom trawling has been described in various scientific literature publications and EFH
publications, impacts are considered to be less than when gear interacts with hard or medium
substrates. Shoreward of the trawl RCA, bottom trawl fishing vessels may target species such as
aggregations of lingcod, yellowtail rockfish, pacific sanddabs, and other groundfish species that
prefer soft sandy substrate or shallow mud, or are able to be intercepted while transiting through
soft substrates between mixed and hard substrate regions. Rockfish recruitment to soft benthic
habitats has been documented (Johnson et al., 2001). Seaward of the RCA, fishing vessels can
target what is often referred to as the “Deepwater Dover sole assemblage,” or Dover, Shortspine
thornyhead, and Sablefish (DTS) complex. Some species may migrate spatially among depth
zones depending on temporal season or interannual changes, but fish assemblages on deeper mud-
dominated bottoms appeared to be relatively constant among years (B.N. Tissot et al., 2007). “Deep
mud slope” is the primary habitat fished by commercial bottom trawlers outside the Heceta bank
region (Tissot et al, 2007).
Mixed substrate
Mixed substrate may be second most susceptible to habitat impact (and hence, longer times for
recovery from impacts). Although vertical relief may be less common in mixed substrates,
boulders/cobble, boulder/sand substrate may serve as intermittent refuge for groundfish from
predators, between potential feeding or localized seasonal depth migrations for overfished rockfish,
or other more prominent latitudinal migratory groundfish. Epibenthic sponges or corals greater
than 30 cm may have additional habitat benefit when connected to boulders or mixed substrate. In
general, bottom trawl fishermen try to avoid mixed or hard substrate areas as trawling in those
areas can cause damage to their nets and rigging. Mid-depth boulder-cobbles (55 fm to 82 fm) had
the second lowest density of fish and the lowest species richness (about 43 fish species) compared
to the other major habitats, and is of sufficiently low relief to be fished by commercial bottom
trawlers (Tissot et al, 2007).

29
Hard substrate
Hard substrate is one of least common substrates within the proposed action area, but these
substrates are also among the most important to rockfish. Off the West Coast of northern British
Columbia it was locally observed that 95% of the rockfish occurred on 27% of the seafloor
surveyed (Du Preez & Tunnicliffe, 2011). Other observations documented that “most of the hard
substrate (bedrock and boulders) had attached benthic invertebrates, and at two of the sand
transects, there were significant numbers of seawhips and hydroids present (Rooper et al., 2010).”
GIS analysis of 5,039 bottom trawl events from U.S. West Coast bottom trawl surveys (1977-1998)
estimated that the survey area was about 77% trawlable, but five of the 30 strata were less than
50% trawlable, while untrawlable areas by definition cannot be towed (Zimmerman, 2013). Jagielo
et al (2003) found higher rockfish (Sebastes) abundances on untrawlable (rocky) sites off
Washington State (Zimmerman, 2003). In general, bottom trawl fishermen try to avoid hard
substrate areas as trawling in those areas can cause damage to their nets and rigging. In some ROV
observations, “the shallow rock-ridge and large-boulder habitat was clearly untrawlable, and thus
represented a natural refuge from the bottom-trawl fishery (Tissot et al, 2007).” From submersible
observations made off southern B.C., Richards (1986) found that yelloweye rockfish abundance
increased with habitat complexity, whereas greenstriped rockfish abundance did not (Zimmerman,
2003).
3.3.3.2 Proportion of Substrate Types in the Action Area
Data supporting substrate assumptions in this assessment are from Oregon State University (titled
“NOAA EFH Synthesis Benthic Substrate”), which were put together as part of the Groundfish
EFH review process. The data is a compilation of many data sources, but is characterized by the
hardness. Percentages of substrate within the different depth zones throughout this assessment do
not subtract EFH conservation areas within RCA depth zones, nor do they subtract area opened
under the modified 200 fm line (petrale cutout areas). Therefore, actual square mileage estimates
within depth zones that would be opened under the proposed action are less than that described
below to some extent. However, most EFH conservation areas are outside of the RCAs.

30
75-100 fathom RCA Depth Zone
Figure 3-5and Table 3-2 (below) demonstrate the amount of: (1) estimated soft seabed (90 percent,
1,882 square miles); (2) estimated mixed seabed (3 percent, 63 square miles); and, (3) estimated
hard seabed (7 percent, 144 square miles) within the 75-100 fathom RCA depth zone.
Figure 3-5: Substrates within the 75-100 fathom line interval, between 40° 10’ N. latitude and 48° 10’ N. latitude, and
estimated substrate (seabed) types soft, mixed, and hard.
Table 3-2: Comparison of probable substrate type by 75-100 fathom range, square miles, and percent substrate type
between 40° 10’ N. latitude and 48° 10’ N. latitude, including probable substrate (seabed) types soft, mixed, and hard.
Substrate Type Fathom Range Sq Miles % Substrate
Probable Soft Seabed 75-100fm 1882.00 90.06
Probable Mixed Seabed 75-100fm 63.40 3.03
Probable Hard Seabed / Inferred Rock 75-100fm 144.39 6.91
90%
3% 7%
1
2
3
Probable Soft Seabed
Probable Mixed Seabed
Probable Hard Seabed /
Inferred Rock
Substrates within the 75 - 100 fm RCA Line
interval, Between 40d10m latitude
and 48d10m latitude
31
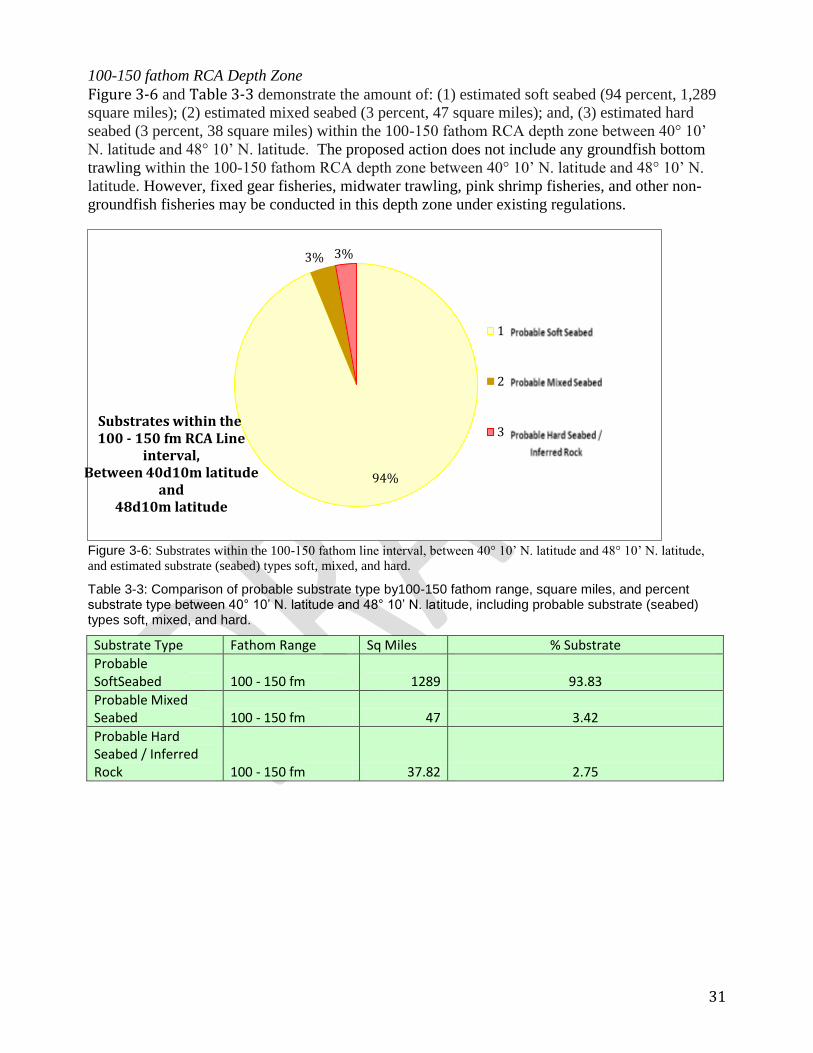
100-150 fathom RCA Depth Zone Figure 3-6 and Table 3-3 demonstrate the amount of: (1) estimated soft seabed (94 percent, 1,289
square miles); (2) estimated mixed seabed (3 percent, 47 square miles); and, (3) estimated hard
seabed (3 percent, 38 square miles) within the 100-150 fathom RCA depth zone between 40° 10’
N. latitude and 48° 10’ N. latitude. The proposed action does not include any groundfish bottom
trawling within the 100-150 fathom RCA depth zone between 40° 10’ N. latitude and 48° 10’ N.
latitude. However, fixed gear fisheries, midwater trawling, pink shrimp fisheries, and other non-
groundfish fisheries may be conducted in this depth zone under existing regulations.
Figure 3-6: Substrates within the 100-150 fathom line interval, between 40° 10’ N. latitude and 48° 10’ N. latitude,
and estimated substrate (seabed) types soft, mixed, and hard.
Table 3-3: Comparison of probable substrate type by100-150 fathom range, square miles, and percent substrate type between 40° 10’ N. latitude and 48° 10’ N. latitude, including probable substrate (seabed) types soft, mixed, and hard.
Substrate Type Fathom Range Sq Miles % Substrate
Probable SoftSeabed 100 - 150 fm 1289 93.83
Probable Mixed Seabed 100 - 150 fm 47 3.42
Probable Hard Seabed / Inferred Rock 100 - 150 fm 37.82 2.75
94%
3% 3%
1
2
3 Substrates within the 100 - 150 fm RCA Line
interval, Between 40d10m latitude
and 48d10m latitude

32
150-200 fathom RCA Depth Zone
Figure 3-7 and Table 3-4 (below) demonstrate the amount of: (1) estimated soft seabed (93
percent, 885 square miles); (2) estimated mixed seabed (4 percent, 36 square miles); and, (3)
estimated hard seabed (3 percent, 32 square miles) within the 150-200 fathom RCA depth zone
between 40° 10’ N. latitude and 48 10’ N. latitude.
Figure 3-7: Substrates within the 150-200 fathom line interval, between 40° 10’ N. latitude and 48° 10’ N. latitude,
and estimated substrate (seabed) types soft, mixed, and hard.
Table 3-4: Comparison of probable substrate type by 150-200 fathom range, square miles, and percent substrate type between 40° 10’ N. latitude and 48° 10’ N. latitude, including probable substrate (seabed) types soft, mixed, and hard.
Substrate Type Fathom Range Sq Miles % Substrate
Probable Soft Seabed 150 - 200 fm 885 92.89
Probable Mixed Seabed 150 - 200 fm 35.69 3.75
Probably Hard Seabed / Inferred Rock 150 - 200 fm 32 3.36
93%
4% 3%
1
2
3
Substrates within the 150 - 200 fm RCA Line
interval, Between 40d10m latitude
and 48d10m

33
The seaward area from 40° 10’ N. latitude to 45° 46’ N. latitude, 150-200 fm (Figure 3-8, below)
within the proposed action area is comprised primarily of soft substrate (greater than 90 percent),
which recovers from bottom trawl gear in a shorter amount of time compared to other substrate
types (Table 3-1, above).
Figure 3-8: Proportional distribution of different substrate types in the area between the 150 and 200 fathom RCA
boundaries, between 40° 10’ N. lat. and 45° 46’ N. lat.
The seaward area from 45°46’ N. lat. to 48°10’ N. lat. 150-200 fm (Figure 3-9, below) within the
proposed action area is also comprised primarily of soft substrate (greater than 95 percent), which
recovers from bottom trawl gear in a shorter amount of time compared to other substrate types
(Table 3-1, above).
Figure 3-9: Proportional distribution of different substrate types in the area between the 150 and 200 fathom RCA
boundaries, between 45°46’ N. lat. and 48°10’ N. lat.

34
3.3.4 Current Habitat as Affected by Fishing Gear
The impacts of specific fisheries can vary widely depending on the characteristics of the gear and
fleet (Kaplan et al., 2012). The effects of fishing on EFH are described in detail in the Amendment
19 EFH EIS and subsequent documents generated by the ongoing EFH review. Generally, on the
West Coast, benthic habitats are most disturbed by bottom trawl gear (e.g., groundfish and pink
shrimp), and to a lesser extent, fixed gear. Some of the areas containing substrate types described
above by proportion estimated in each RCA depth interval were closed to specific gear types
through Amendment 19. See Figure 3-10 and Figure 3-11, below. For a complete depiction of all
EFH closures established through Amendment 19 see Figure 3-2, above.

35
Figure 3-10. Proposed action area with selected RCA areas, interval by fm, 45° 46’ N. latitude to 48° 10’ N. latitude.
Interval by fathom areas is represented in 75, 100, 150 and 200 fathom lines.

36
Figure 3-11: Proposed action area with selected RCA areas, interval by fm, 40° 10’ N. latitude to 45° 43’ N. latitude.
Interval by fathom areas is represented in 75, 100, 150 and 200 fathom lines. 150-200 fm RCA Generalized depth zone
(green polygon border) represents the seaward area in Alternative 2 that would remain closed to bottom trawling,
unlike in Alternative 1.

37
3.3.4.1 Current Habitat as Affected by Groundfish Bottom Trawl Gear
Bottom trawling involves the towing of a funnel shaped net or nets behind a fishing vessel, which
use “doors” to spread the mouth of the net. The trawl gear varies depending on the species sought
and the size and horsepower of the boats used to fish the gear on the bottom. The mouth of trawl
nets is spread horizontally in the water column by the use of two doors located one on each side of
the net, forward and outward of the net. The doors, generally made of metal, are pushed apart and
down by hydrodynamic forces and by their own weight, and some increase their spread by bottom
friction. Fishermen choose trawl doors based on the horsepower of their vessel. Of the major
components, trawl doors affect the smallest area of seabed, though trawl door marks are the most
recognizable and frequently observed effect of trawls on the seabed. The trawl net is wide at the
mouth tapering to an intermediate piece attached to the codend, the bag that collects the fish. The
mesh sizes for the net and cod-end are regulated to allow undersized species to escape during
fishing. The bottom contact rate in Midwater trawl fisheries for Pacific Whiting or pelagic rockfish
is already understood to be very low (8 percent or less) in the whiting fishery and lower still in the
pelagic rockfish fishery (7 percent or less), therefore midwater trawl gear habitat impacts are
anticipated to be less than that by bottom trawl vessels.
The top of the mouth of the net is called the headrope (headline or floatline). The headrope usually
overhangs the footrope to ensure that fish disturbed by the groundrope do not escape upwards, but
selective flatfish nets have a cutrope to allow overfished rockfish an opportunity to escape, while
flatfish will continue to be herded into the net. Only selective flatfish trawl gear (which utilizes
small footropes) is required shoreward of the 100 fathom RCA line, and large footrope gear
seaward of the 100 fathom line (although in practice seaward of the western trawl RCA boundaries)
may not exceed 19 inches in diameter. The footrope or groundrope is directly attached to the lower
leading edge of the mouth of the net. The footrope may be weighted with chain or may be rope-
wrapped cable when used on a soft bottom. The footrope may contain boulders, rubber disks, or
rubber rollers (also called bobbins) attached to the footrope under the center and wing sections of
the net, to allow the net to ride over obstacles.
Two or more riblines are used on bottom trawl nets and midwater trawl nets. The riblines go fore
and aft in the net to provide strength to the net. Bottom fish trawl nets are attached by sets of
bridles (upper and lower bridles) to the doors, or may be attached to mud gear which in turn is
attached to the doors. Bridles are made of wire rope (also called cable). They function to hold the
net open as it is towed and help herd fish into the path of the trawl net. The bridles are cables that
connect the trawl doors to the trawl net. The bottom bridle may be in contact with the seabed for a
part of their distance.
The intermediate of the net is the section where the net begins to funnel into the cod-end. The
intermediate section of the net is often where bycatch reduction devices (BRDs), special net
webbing for halibut and salmon, or flexible plastic rockfish excluders are integrated. The cod end
is the last section of the net, which contains the nets’ contents. As the net is retrieved back to the
fishing vessel rear deck by two powerful winches on each side of the starboard and port sides of the
vessel, a large steel hoist extending across and above the back deck is firmly affixed to the back of
the vessel. This allows the intermediate section of the net to be hoisted above the vessel, ultimately
resulting in the cod end of the net being brought aboard, and its contents being dumped on deck.
RCA configurations have dictated where groundfish bottom trawl gear could be fished north of 40°
10’ N. latitude since 2002 (Table 3-5). Total estimated trawl effort from 2002 to 2009 was
436,899 tow-hours across the four trawl fisheries evaluated (Guy et al., 2013). Pink shrimp and
38
groundfish trawling accounted for most of the west coast trawl effort (54% and 25% of hours) (Guy
et al., 2013). As shown in Table 3-5, below, some areas that would be open under the alternatives
have been opened to trawling intermittently throughout the year in the recent past. However, the
area that would remain closed under Alternative 2, 150 to modified 200 fm from 40° 10’ N. latitude
to 45° 46’ N. latitude has not been opened to bottom trawling since October 2004, with the
exception of a small area that was opened for four summer months in 2007 (45° 03’ N. latitude to
45° 46’ N. latitude).
Table 3-5: Yellow shading indicates area not trawled since October 1, 2004 (North of 40° 10’ N. latitude), with extra
emphasis provided in red shading to highlight the brief incursion from 250 fm to 150 fm as far south as 45° 03’ N.
latitude between April 1, 2007 to August 1, 2007.
Based on the table above (Table 3-5), the recovery index (Table 3-1), and various fishery impacts
on the distribution of substrate types within the RCA depth line intervals (75-100 fm, 150 to 200
fm), only benthic habitat between 40° 10’ N. latitude to 45° 46’ N. latitude (150 to modified 200
fm) may have recovered from groundfish bottom trawl gear, assuming areas that are opened to
trawling are in fact being extensively trawled.
Year Area (North of 40o10') Jan Feb Mar April May Jun Jul Aug Sept Oct Nov Dec
2001 North of 40o10'
2002 North of 40o10' Shore-250 100-250 100-250 100-250
2003 North of 40o10'
2004 North of 40o10'
2005 North of 40o10'
2006 North of 40o10'
North of 48o10' 0 - 200 75 - 200
48o10' - 46o38'
46o38' - 46o16'
46o16' - 45o03'
45o03' - 43o20'
43o20' - 42o40' 75 - 200
42o40' -40o10'
North of 48°10'
48 10 - 46 38.17
46 38.17 - 46 16
46 16 - 45 46
45 46 - 43 20.83
43 20.83 - 42 40.50
42 40.5 - 40 10 75-200
North of 48°10' 0 - 200
48°10' - 45°46' 75-200
45°46' - 40°10' 75-200
North of 48°10' 0-m200 0 - 250
48°10' - 45°46' 75 - m200 75 - 250
45°46' - 40°10' 75 - m200 75 - 250
North of 48°10'
48°10' - 45°46'
45°46' - 40°10'
North of 48°10'
48°10' - 45°46'
45°46' - 40°10'
75-m200
75-m200
75-m200
75-m200
75-m200
75-m200
75-200
75-200
75 - m200
75 - m200
N/A, PFMC (Council) introduced Cowcod Conservation Areas south of 40o10'
N/A, PFMC (Council) retained Cowcod Conservation Areas south of 40o10'
75-m200 75-200 100-250 75-250 75-m250
75-200 50-200 0-m200
75-m200 100-200 0-250
75-m200 60-200 60-150 75-150 0-250
100-m250 100-250 50-200
0-m200 0-200 0-150 0-m200
0 - 150
75 - 150 75 - 200
60 -150 60 -200
75 - 150 75 - 200
75 - 200
75-m250
75 - m250 75 - 250
75 - 250
75 - m200
75 - m200
75-15060-200 60-150
75-200 75-150 75-200
0 - 200
75 - 200
75 - m200 75 - 200 75-200
75-200 100-200
2007
0-m200 0-150 0-200 0 - m200
75-150 100-150
75-200
0-m200 0-200 0-m200
75-m200 75-200 60-200 75-m200
60-200 60-150
0-m200 0-200 0-150 0-200
75-150 100-150
75 - m200 75 - 200 75-200
75-200 75 - m200
75-200 100-200
0-m200 0-200 0-150 0-200 0-m20075 - m200
75 - m200
75 - 200
75 - 200
2008
100 - 200 75 - m2002012
2011
2010
2009
0-m200 0-200 0-150 0-200 0-m20075 - 150 100 - 150 75 - 150
75 - 200
75-150 100-150 75 - 150
75-200 100-200
75 - m200
75 - m200

39
75-100 fm, 40° 10’ N. latitude to 48° 10’ N. latitude: Within this depth interval (75-100 fm), the
substrate types are approximately 90 percent soft, 10 percent mixed and hard substrates. Based on
the EFH synthesis report habitat recovery table described above (table 3-2), it would take an
estimated 2.8 years for the hard and mixed substrate areas to recover if closed to all bottom
trawling activity. However, it would take one year for the soft areas to recover, which comprise 90
percent of the area in the 75-100 fathom range. Under the no-action RCA configuration, the area
between 40° 10’ N. latitude and 48° 10’ N. latitude from 75-100 fm is currently open to bottom
trawling in periods 3, 4, and 5 (May through October). Accordingly, if it is assumed that bottom
trawling occurs in these areas when open, then there has not been sufficient time for recovery to
occur in the areas that have been impacted. Observed groundfish bottom trawl effort distribution
by trawl hours, depth and latitude are described in figures 3-8, below. The observed groundfish
bottom trawl effort between 75 and 100 fm, particularly above 43° N. latitude, indicates this area is
heavily utilized. The area between 40° 10’ N. latitude and 43° N. latitude, 75 fm to 100 fm is less
frequently trawled by groundfish bottom trawl gear, while other bottom trawl gear such as pink
shrimp bottom trawl gear (described below) frequently occurs south of 43° N. latitude in this depth
range.
150-200 fm, 45° 46’ N. latitude to 48° 10’ N. latitude: Within this depth interval (150 to 200 fm,
45° 46’ N. latitude to 48° 10’ N. latitude), the substrate types are approximately 98.5 percent soft,
and 1.4 percent mixed and hard substrates. Based on the EFH synthesis report habitat recovery
table described above (Table 3-1), it would take an estimated 2.8 years for the hard and mixed
substrate areas to recover if closed to all bottom trawling activity. However, it would take one year
for the soft areas to recover, which comprise 98.5 percent of the area in the 150 to 200 fathom
range, 45° 46’ N. latitude to 48° 10’ N. latitude. Under the no-action RCA configuration, the area
between 45° 46’ N. latitude to 48° 10’ N. latitude from 150 to 200 fm is currently open to bottom
trawling in periods 2-6 (March through December 31). Accordingly, if it is assumed that bottom
trawling occurs in these areas when open, then there has not been sufficient time for recovery to
occur in the areas that have been impacted. The observed effort from 2005 to 2011 demonstrates
that open groundfish bottom trawl habitat between 150 and 200 fm (Figure 3-12 and Table 3-6,
below), above 45° 46’ N. latitude is currently utilized.
150 to 200 fm, 40° 10’ N. latitude to 45° 46’ N. latitude: For the area that has been closed since
2004 (within 150- modified 200 fm, 40° 10’ N. latitude to 45° 46’ N. latitude), having been largely
closed for almost 9 years, it appears that even the habitat types (Table 3-1) with potentially longer
recovery (e.g., slope sponge maximum estimated recovery time of 10.5 years) would have had
some opportunity to recover. There was a small area between 45° 03’ N. latitude to 45° 46’ N.
latitude that was opened to groundfish bottom trawling April 1, 2007 to August 1, 2007 (Table 3-5,
above). However, it has been approximately six years since that narrow area has been opened,
longer than the estimated bottom trawl recovery times of 2.8 years. Therefore, throughout this
environmental assessment, the two areas (40° 10’ N. latitude to 45° 03’ N. latitude and 40° 10’ N.
latitude to 45° 46’ N. latitude) will be referred to as one area that has had a chance to recover from
bottom trawl gear from 40° 10’ N. latitude to 45° 46’ N. latitude, 150 to modified 200 fm. The
observed effort from 2005 to 2011 demonstrates that benthic habitat between 150 and modified 200
fm (described in Figure 3-12, below), 40° 10’ N. latitude to 45° 46’ N. latitude, is not generally
utilized due to the RCA closure. Some effort that may be showing up in this latitudinal depth zone
may be a result of differences in way points in the federal register and the actual depth contours, or
allowed modified petrale cut-outs, which enable fishermen to access limited areas of soft substrate
to access target species. In this latitudinal range, effort is heavier outside of 200 fm (Figure 3-12
and Table 3-6, below).

40
Figure 3-12: WCGOP distribution data of bottom trawl observed trips from 2005-2011, by latitude, longitude, and
effort hours under tow.
Figure 3-13: WCGOP distribution data of bottom trawl observed trips during 2011, by latitude, longitude, and effort
hours under tow.
Inferences from observer data may have certain limitations, such as the possibility that an observer
effect may be occurring when an observer is present onboard the vessel. Therefore, vessel
practices on unobserved trips may be different to some extent, and subsequently, assumptions on

41
spatial effort may be limited. However, since the inception of the trawl rationalization program in
2011, with the 100 percent monitoring requirement, observer effects are not a concern. Table 3-6
(below) demonstrates the observer coverage rates from 2002 to 2010, north of 40° 10’ N. latitude,
which ranged from 13 to 24 percent. Cells showing tiny amounts of effort (Figure 3-13, above) in
the trawl RCA could have a variety of explanations. It could be errors in the database, unintentional
incursions, or the fact that the RCA boundary is like a big polygon, such that there could be
locations near the boundary where a recorded actual average depth could vary from waypoints
defined in regulation, which are designed to simplify compliance and enforcement.
Table 3-6: Non-whiting Observer Coverage Rates, 2002-2010 (pre-IFQ). Total trips, tows, vessels and groundfish
landings observed in the limited entry groundfish bottom trawl fishery, 2002-2010. Coverage rates are computed as the
observed proportion of total FMP groundfish landings (excluding Pacific hake), summarized from fish ticket landing
receipts. Source: NWFSC
http://www.nwfsc.noaa.gov/research/divisions/fram/observation/data_products/bottom_trawl.cfm#coverage
3.3.4.2 Current Habitat as Affected by Groundfish Fixed Gear
Bottom longline gear fits into two categories: gear that targets fish living directly on the bottom
(halibut, cabezon, lingcod etc.) and gear that targets fish living very near the bottom (sablefish,
rockfish etc.). Marking buoys, buoy lines and anchors are the same for both types of bottom
longline. Additionally hook spacing and size, gangion size and length can also be the same. The
difference in longlines for fish living directly on the bottom as opposed to fish living near the
bottom comes between gangions and the groundline and in the composition of the groundline itself.
The longline is marked on both ends with a cane flagpole with a radar reflector and a flotation
buoy. Below the buoys the buoy line (30-50 fm longer than the water depth) travels from the
surface down to the anchor on the bottom. Groundline is used between the anchors, and gangions
are snapped or tied to the groundline with the baited hooks at the opposite end. Weights of one to
five pounds are sometimes attached to the groudline either to speed sinking rate through upper
waters that might house non-desired species, or when fishing uneven bottom contours. A series of
weights are used along the groundline to sink the groundline to the bottom. The floats have enough
buoyancy to lift the groundline, hooks and gangions, but not enough to hold up the weights. The
principal components of the longline that can produce effects on the seabed are the anchors or
weights, the hooks and the mainline. If the hauling vessel is not above the part of the line that is
being lifted, the line, hooks and anchors can be pulled across the seabed before ascending. If the
hooks and line snare exposed organisms they can be injured or detached.
Pots are baited boxes set on the ocean floor to catch various fish and shellfish. They can be
circular, rectangular or conical in shape. All pots contain entry ports and escape ports that allow
undersized species to escape. The pots used for the sablefish pot fishery are highly selective for
sablefish and are fished off a long-line in series (a set of pots) at various depths. They are generally
Fleet Total Coverage Rate
Management Area
Year
North of 40° 10' N Lat
2002 432 2567 93 1940.2 15369.9 13%
2003 316 1791 95 2076.3 14185.9 15%
2004 444 2697 75 3302.0 13971.0 24%
2005 396 2881 83 3573.8 16216.5 22%
2006 365 2506 70 2979.9 15378.4 19%
2007 283 2054 73 2890.4 17893.7 16%
2008 356 2727 83 4426.2 21257.7 21%
2009 484 3814 85 5425.7 23373.1 23%
2010 287 2257 72 3739.8 19825.4 19%
% landings observed
Observed
# of trips # of tows # of vessels
Groundfish
landings
(mt)
Groundfish
landings
(mt)

42
fished in waters up to 600 fm, though sometimes as deep as 760-800 fm. Up to 50 pots are attached
to each groundline line. The groundline is usually 3⁄4 inch polypropylene (ranging from 5/8” to 1
1/8”). Pots are spaced every 15 to 40 fm along the line, with 20 fm being average. An anchor
weighs each end of the line. Pots are set and retrieved using line haulers and/or drums.
Whereas bottom trawl fishing vessels will typically try to avoid areas of hard and mixed boulder
substrates, fixed gear is very effective at accessing these areas. Limited evidence suggests that
longline gear may entangle and pull large sponge and coral from boulder or rocky substrate, and
that target species are abundant in these areas. Fixed gear impacts on soft substrate are expected to
be minimal. The sablefish longline and near-shore rockfish longline fisheries together set an
estimated 86.2 million hooks from 2002 to 2009 (Guy et al., 2013). The sablefish longline fishery
set the majority of hooks (77%), most in the shelf-break domain (92%) (Guy et al., 2013). Table 3-7, below depicts the non-trawl (i.e., fixed gear) RCA configurations overtime.
Table 3-7: Fixed gear RCA depth boundaries by year and month, 2002-2013, including inseason changes. Emphasis
in yellow shading represents historical fixed gear RCAs in the trawl RCA proposed action area (fm).
75-100 fm, 40° 10’ N. latitude to 48° 10’ N. latitude: Due to the fixed gear RCAs, (Table 3-7,
above), there is no substantial fixed gear effort shoreward of the 100 fathom depth contour in this
depth zone (Figure 3-14, below). Within this depth interval (75-100 fm), the substrate types are
approximately 90 percent soft, 7 percent mixed, and 3 percent hard substrate. Based on the EFH
synthesis report habitat recovery table described above (Table 3-1), it would take an estimated 0.1
Year Location Jan Feb Mar Apr May Jun Jul Aug Sep Oct Nov Dec
2013 North 46 16
43 00 - 46 16
42 00 - 43 00
40 10 - 42 00
34 27 - 40 10
South 34 27 (+ islands)
2012 North 46 16
43 00 - 46 16
42 00 - 43 00
40 10 - 42 00
34 27 - 40 10
South 34 27 (+ islands)
2011 North 46 16
45 03 83 - 46 16
43 00 - 45 03 83
42 00 - 43 00
40 10 - 42 00
34 27 - 40 10
South 34 27 (+ islands)
2010 North 46 16
45 03 83 - 46 16
43 00 - 45 03 83
42 00 - 43 00
40 10 - 42 00
34 27 - 40 10
South 34 27 (+ islands)
2009 North 46 16
45 03 83 - 46 16
43 00 - 45 03 83
42 00 - 43 00
40 10 - 42 00
34 27 - 40 10
South 34 27 (+ islands)
2008 North 46 16
40 10 - 46 16
34 27 - 40 10
South 34 27 (+ islands)
2007 North 46 16
40 10 - 46 16
34 27 - 40 10
South 34 27 (+ islands)
2006 North 46 16
40 10 - 46 16
34 27 - 40 10
South 34 27 (+ islands)
2005 North 46 16
40 10 - 46 16
34 27 - 40 10
South 34 27 (+ islands)
2004 North 46 16
40 10 - 46 16
34 27 - 40 10 (+ islands)
South 34 27 (+ islands)
2003 North 46 16
40 10 - 46 16
34 27 - 40 10
South 34 27 (+ islands)20 - 150 fm
2002 South 40 10
60 fm - 150 fm line (also applies around islands)
shore - 100 fm
30 - 100 fm
20 - 100 fm
20 fm depth contour - 100 fm
30 fm - 150 fm line
20 fm depth contour - 100 fm
shore - 100 fm
30 - 100 fm
30 - 125 fm (125 line reduced to 100 fm during directed halibut days)
20 - 100 fm
shore - 150 fm
shore - 200 fmshore - 100 fm
27 - 100 fm
20 - 150 fm
20 - 150 fm 30 - 150 fm
30 - 150 fm
60 fm - 150 fm
shore - 100 fm
30 - 100 fm
30 - 150 fm 20 - 150 fm 30 - 150 fm
shore - 100 fm
30 - 100 fm
30 - 150 fm 20 - 150 fm 30 - 150 fm
60 fm - 150 fm
shore - 100 fm
30 - 100 fm
30 - 150 fm 20 - 150 fm
shore - 100 fm
30 - 100 fm
30 - 150 fm
60 fm - 150 fm
60 fm - 150 fm
60 fm - 150 fm
shore - 100 fm
30 - 100 fm
30 - 150 fm
60 fm - 150 fm
shore - 100 fm
30 - 100 fm
30 - 125 fm (125 line reduced to 100 fm during directed halibut days)
20 - 100 fm
20 fm depth contour - 100 fm
30 - 150 fm
30 fm - 150 fm line
60 fm - 150 fm line
30 fm - 150 fm line
60 fm - 150 fm line
CLOSED > 20fm (exceptions: sablefish, S Thorny and slope RF)
shore - 100 fm
30 - 100 fm
30 - 125 fm (125 line reduced to 100 fm during directed halibut days)
20 - 100 fm
20 fm depth contour - 100 fm
shore - 100 fm
30 - 100 fm
30 - 100 fm
20 fm depth contour - 100 fm
30 fm - 150 fm line
60 fm - 150 fm line (also applies around islands)

43
year for hard substrate areas, and 0.4 year for the mixed and soft substrate areas impacted by fixed
gear to recover if closed to all fixed gear activity.
150-200 fm, 45° 46’ N. latitude to 48° 10’ N. latitude: There is substantial fixed gear effort
seaward of the 100 fathom depth contour in this area (Figure 3-14, below). Within this depth
interval (150-200 fm), the substrate types are approximately 98.5 percent soft, 1.4 percent mixed,
and a negligible amount of hard/rock substrate (figures 3-6, 3-6 and table 3-4). Based on the EFH
synthesis report habitat recovery table described above (Table 3-1), it would take an estimated
0.1year for hard substrate areas, and 0.4 year for the mixed and soft substrate areas impacted by
fixed gear to recover if closed to all fixed gear activity.
150 to 200 fm, 40° 10’ N. latitude to 45° 46’ N. latitude: Due to the fixed gear RCAs, (Table 3-7, above), there is substantial fixed gear shoreward of the 100 fm depth contour in this area
(Figure 3-14, below). Within this depth interval (150-200 fm), the substrate types are
approximately 91.9 percent soft, 6 percent mixed, and 2 percent hard/rock substrate (Figure 3-7,
Table 3-7, and Table 3-4). Based on the EFH synthesis report habitat recovery table described
above (Table 3-1), it would take an estimated 0.1 year for hard substrate areas, and 0.4 year for the
mixed and soft substrate areas impacted by fixed gear to recover if closed to all fixed gear activity.
However, disruption to biogenic habitat such as coral or sponges where fixed gears are able to
access untrawlable hard or mixed areas may take longer to recover.
Figure 3-14: Observed 2005-2011 longline fixed-gear effort by depth (fm) and latitude. Heat cell units in thousands
of hooks observed.

44
Figure 3-15: Observed 2011 longline fixed-gear effort by depth (fm) and latitude. Heat cell units in thousands of
hooks observed.
Figure 3-12 and Figure 3-13 (above) may help to provide a rough contextual sense of longline
fixed gear effort within the trawl RCA depth/latitude range (heat cell units are described as number
of observed hooks set), particularly that within the “core” trawl RCA (100-150 fm) and seaward of
the trawl 150 fm RCA boundary from 2005 to 2011.
Figure 3-16: Observed 2005-2011 groundfish pot fixed-gear effort by depth (fm) and latitude. Heat cell units in
numbers of pots observed.

45
Figure 3-17: Observed 2011 groundfish pot fixed-gear effort by depth (fm) and latitude. Heat cell units in numbers of
pots observed.
Figure 3-14 and Figure 3-15 demonstrate that a substantial amount of fixed gear effort occurs
within and seaward of the trawl RCA, some of which may be on mixed or hard substrate areas that
are untrawlable. Pot fixed gear effort is consistently in more narrow, upper slope depths, 150-250
fm (Figure 3-16, Figure 3-16 above). This fishing behavior is likely due to sablefish abundance.
3.3.4.3 Current Habitat as Affected by Pink Shrimp Bottom Trawl Gear
The pink shrimp trawl fishery includes vessels using non-groundfish trawl gear (previously called
“exempted” trawl gear), which is gear other than the Pacific Coast groundfish trawl gear that is
authorized for use with a valid groundfish limited entry permit endorsed for trawl gear. Non-
groundfish trawl gear includes trawl gear used to fish for pink shrimp, ridgeback prawn, California
halibut south of Pt. Arena, and sea cucumbers south of Pt. Arena.
The pink shrimp trawl fishery commonly uses a four seam net in a box trawl design. A single
rigged shrimp vessel may use the same doors that are used by groundfish trawl vessels, while a
double rigged shrimp vessel uses doors that are typically much larger than those used by groundfish
trawlers. Of the major components, trawl doors affect the smallest area of seabed, though trawl
door marks are the most recognizable and frequently observed effect of trawls on the seabed. The
footropes used in pink shrimp trawling are not protected with any rollers or bobbins or other gear
and are generally rigged to run about 12-18 inches off the bottom (31-46 cm). That is, the footrope
of shrimp nets is not designed to contact the bottom. A groundline with disks or bobbins that are
two to five inches (5 cm-13 cm) in size may be suspended below the footrope by ladder chains that
drag along the bottom, which helps to prevent the footrope from digging into the bottom. The
bridles are cables that connect the trawl doors to the trawl net. The bottom bridle may be in contact
with the seabed for a part of their distance. Additional detail about the various gears used off the
Pacific Coast can be found in chapter 3 of the EFH EIS.
Pink shrimp bottom trawling is allowed, and occurs, within the groundfish trawl RCA. Bycatch
Reduction Devices (BRDs) have been required since 2001, and have greatly reduced finfish catch
(including overfished species)(Figure 3-18, below). Pink shrimp bottom trawl fisheries are now

46
well documented as having negligible overfished rockfish species bycatch. BRDs are effective at
nearly eliminating rockfish bycatch into the cod-end (Figure 3-18).
Figure 3-18: Diagram of a finfish excluder used in pink shrimp bottom trawl nets. Source: Frimodig et al., 2009,
NMFS 2009.
Recent annual pink shrimp bottom trawl effort by depth suggests that hauls outside150 fm are not
documented (Table 3-8). Additional WCGOP data from NWFSC staff suggests that the majority
of observed effort occurs between 50 to 110 fm (Figure 12). Oregon State logbook data, figure 3-
13 (below) suggests that there are a fair number of logged sets within depths between 60 to 120 fm,
ranging from approximately 40 to 150 fm. Washington logbook data may suggest similar trends
(Table 3-8). VMS data of all trips may help determine if that there is any sampling bias or
observer effect in fishing locations, and to better determine the spatial extent of shrimp trawling
impacts on benthic habitat.
Table 3-8: History of pink shrimp trawl effort from state logbook records in max depth (fm) and total number of
recorded hauls. CDFW has not been able to do much with their shrimp and prawn logs in recent years due to a lack of
data entry personnel (Peter Kalvass, CDFW, Personal Communication).
RECENT PINK SHRIMP TRAWL EFFORT (depth)
State Year max depth (fm) hauls
Washington
2012 142 3,531
2011 105 2,495
2010 N/A N/A
Oregon
2012 148 9,657
2011 117 9,736
2010 122 8,220
California N/A N/A N/A
75-100 fm, 40° 10’ N. latitude to 48° 10’ N. latitude: Available observer data (Table 3-8, Figure 3-19, Figure 3-20) suggest that there is a high degree of pink shrimp trawl effort in the 75 to 100
fathom depth zones, and therefore, impacts by pink shrimp bottom trawl gear are expected. Within
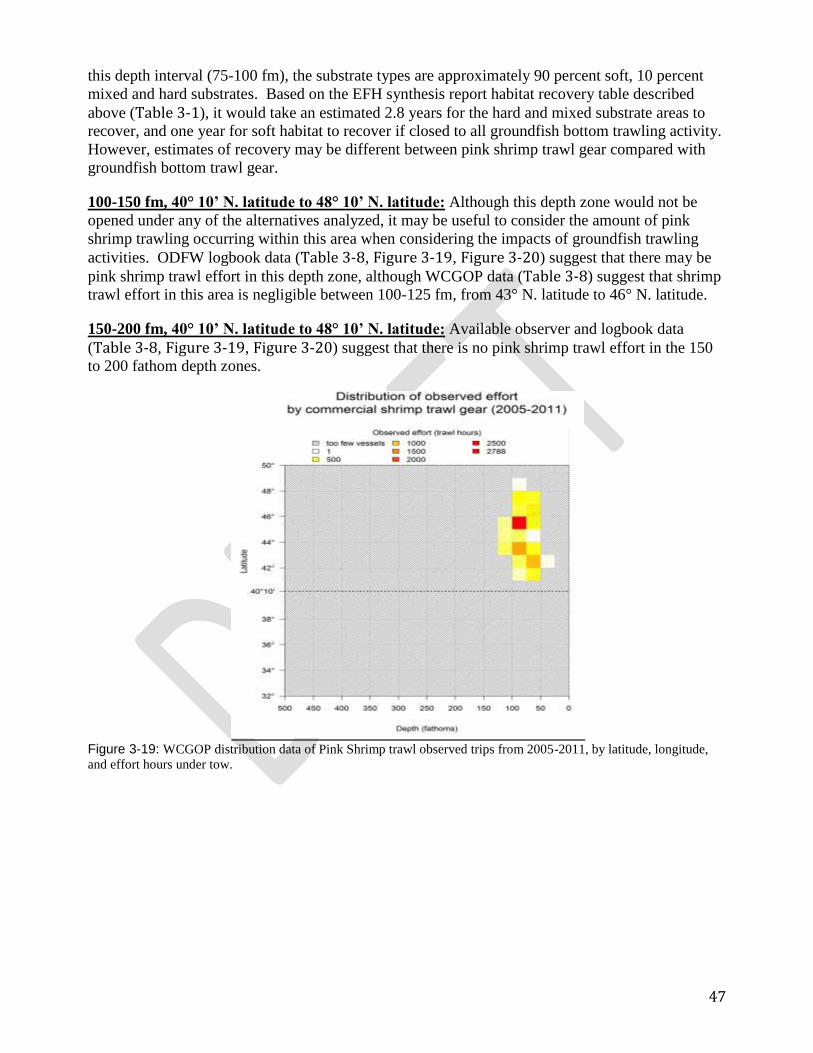
47
this depth interval (75-100 fm), the substrate types are approximately 90 percent soft, 10 percent
mixed and hard substrates. Based on the EFH synthesis report habitat recovery table described
above (Table 3-1), it would take an estimated 2.8 years for the hard and mixed substrate areas to
recover, and one year for soft habitat to recover if closed to all groundfish bottom trawling activity.
However, estimates of recovery may be different between pink shrimp trawl gear compared with
groundfish bottom trawl gear.
100-150 fm, 40° 10’ N. latitude to 48° 10’ N. latitude: Although this depth zone would not be
opened under any of the alternatives analyzed, it may be useful to consider the amount of pink
shrimp trawling occurring within this area when considering the impacts of groundfish trawling
activities. ODFW logbook data (Table 3-8, Figure 3-19, Figure 3-20) suggest that there may be
pink shrimp trawl effort in this depth zone, although WCGOP data (Table 3-8) suggest that shrimp
trawl effort in this area is negligible between 100-125 fm, from 43° N. latitude to 46° N. latitude.
150-200 fm, 40° 10’ N. latitude to 48° 10’ N. latitude: Available observer and logbook data
(Table 3-8, Figure 3-19, Figure 3-20) suggest that there is no pink shrimp trawl effort in the 150
to 200 fathom depth zones.
Figure 3-19: WCGOP distribution data of Pink Shrimp trawl observed trips from 2005-2011, by latitude, longitude,
and effort hours under tow.

48
Figure 3-20: WCGOP distribution data of Pink Shrimp trawl observed trips from 2005-2011, by latitude, longitude,
and effort hours under tow.
Figure 3-21: Oregon Department of Fish and Wildlife (ODFW) depth of shrimp tows compared with the number of
observations in various recorded depths from ODFW logbooks.
Given the relatively low observer coverage rate of 4-14 percent between 2004 and 2011 (Table 3-9, below), as well as the secondary role BRDs may have in filtering large coral or sponges
species, other inferences regarding pink shrimp bottom trawl impacts on groundfish EFH may be
limited.
Fleet Total Coverage Rate
Year # of trips # of tows # of vesselsPink shrimp
landings (mt) Pink shrimp
landings (mt)
% landings
observed
2002 25374.8
2003 13886.6
2004 57 1026 22 583.3 8974.3 6%
2005 38 509 23 424.7 10861.9 4%
2006 8399.8
2007 63 951 30 672.7 10935.0 6%
2008 55 840 31 805.8 15374.6 5%
2009 59 708 36 881.6 14412.2 6%
2010 126 1654 51 2365.3 20327.2 12%
2011 186 2579 57 4103.8 29459.9 14%
Observed
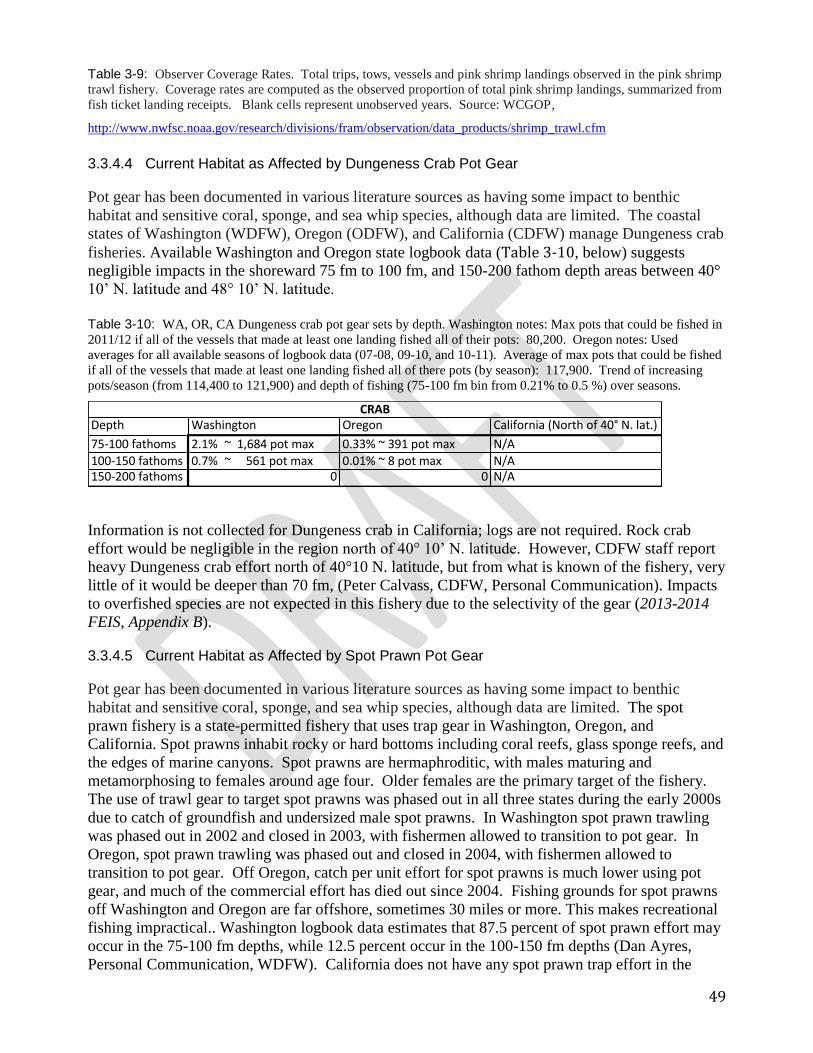
49
Table 3-9: Observer Coverage Rates. Total trips, tows, vessels and pink shrimp landings observed in the pink shrimp
trawl fishery. Coverage rates are computed as the observed proportion of total pink shrimp landings, summarized from
fish ticket landing receipts. Blank cells represent unobserved years. Source: WCGOP,
http://www.nwfsc.noaa.gov/research/divisions/fram/observation/data_products/shrimp_trawl.cfm
3.3.4.4 Current Habitat as Affected by Dungeness Crab Pot Gear
Pot gear has been documented in various literature sources as having some impact to benthic
habitat and sensitive coral, sponge, and sea whip species, although data are limited. The coastal
states of Washington (WDFW), Oregon (ODFW), and California (CDFW) manage Dungeness crab
fisheries. Available Washington and Oregon state logbook data (Table 3-10, below) suggests
negligible impacts in the shoreward 75 fm to 100 fm, and 150-200 fathom depth areas between 40°
10’ N. latitude and 48° 10’ N. latitude.
Table 3-10: WA, OR, CA Dungeness crab pot gear sets by depth. Washington notes: Max pots that could be fished in
2011/12 if all of the vessels that made at least one landing fished all of their pots: 80,200. Oregon notes: Used
averages for all available seasons of logbook data (07-08, 09-10, and 10-11). Average of max pots that could be fished
if all of the vessels that made at least one landing fished all of there pots (by season): 117,900. Trend of increasing
pots/season (from 114,400 to 121,900) and depth of fishing (75-100 fm bin from 0.21% to 0.5 %) over seasons.
Information is not collected for Dungeness crab in California; logs are not required. Rock crab
effort would be negligible in the region north of 40° 10’ N. latitude. However, CDFW staff report
heavy Dungeness crab effort north of 40°10 N. latitude, but from what is known of the fishery, very
little of it would be deeper than 70 fm, (Peter Calvass, CDFW, Personal Communication). Impacts
to overfished species are not expected in this fishery due to the selectivity of the gear (2013-2014
FEIS, Appendix B).
3.3.4.5 Current Habitat as Affected by Spot Prawn Pot Gear
Pot gear has been documented in various literature sources as having some impact to benthic
habitat and sensitive coral, sponge, and sea whip species, although data are limited. The spot
prawn fishery is a state-permitted fishery that uses trap gear in Washington, Oregon, and
California. Spot prawns inhabit rocky or hard bottoms including coral reefs, glass sponge reefs, and
the edges of marine canyons. Spot prawns are hermaphroditic, with males maturing and
metamorphosing to females around age four. Older females are the primary target of the fishery.
The use of trawl gear to target spot prawns was phased out in all three states during the early 2000s
due to catch of groundfish and undersized male spot prawns. In Washington spot prawn trawling
was phased out in 2002 and closed in 2003, with fishermen allowed to transition to pot gear. In
Oregon, spot prawn trawling was phased out and closed in 2004, with fishermen allowed to
transition to pot gear. Off Oregon, catch per unit effort for spot prawns is much lower using pot
gear, and much of the commercial effort has died out since 2004. Fishing grounds for spot prawns
off Washington and Oregon are far offshore, sometimes 30 miles or more. This makes recreational
fishing impractical.. Washington logbook data estimates that 87.5 percent of spot prawn effort may
occur in the 75-100 fm depths, while 12.5 percent occur in the 100-150 fm depths (Dan Ayres,
Personal Communication, WDFW). California does not have any spot prawn trap effort in the
Depth Washington Oregon California(Northof40°N.lat.)
75-100fathoms 2.1%~1,684potmax 0.33%~391potmax N/A
100-150fathoms 0.7%~561potmax 0.01%~8potmax N/A150-200fathoms 0 0 N/A
CRAB
50
action area; the region between 40° 10’ N. latitude and 42° N. lat. (Peter Calvass, CDFW, Personal
Communication).
3.3.4.6 Current Habitat as Affected by NMFS Bottom Trawl Surveys
NMFS conducts annual surveys of West Coast species abundance using bottom trawl gear,
information of which is used for fisheries independent stock assessments, and cataloguing of
species occurrences for fishery management units in and out of the Groundfish FMP. Samples are
collected by trawling within randomly selected cells for a target fishing time of 15 minutes at a
target speed of 2.2 knots (Keller et al., in prep., 2013). In order to answer the question of actual
groundfish trawl survey impacts (on habitat) most accurately, one would have to map at the actual
track lines of successful tows and calculate the total trawled area, taking into account any overlaps
(Whitmore, personal communication, July, 2013). Impacts from NWFSC groundfish surveys
(Figure 3-21, Figure 3-22, below) are expected to be extremely negligible, especially in context of
the valuable information on target and non-target stock assessments these surveys provide the
Council and the Agency in their decision-making. Because of the depth stratification used in the
groundfish survey design, the greatest number of stations occurred in the region periodically closed
to commercial bottom trawling (47980 km2), despite the greater area of the region open to fishing
(77058 km2) (Keller et al., in prep., 2013).

51
Figure 3-22: Map of the number of times per survey grid cell a successful tow was made by NWFSC West Coast
Groundfish surveys (2003 to 2012). Inferences of NWFSC survey impacts within the proposed action area may be
limited, as tow of average length covers <1% of the total cell area. However, this graphic is intended merely to offer a
conceptual sense of potential impacts.

52
Figure 3-23: Map of the number of times per survey grid cell a successful tow was made by NWFSC West Coast
Groundfish surveys (2012). Inferences of NWFSC survey impacts within the proposed action area may be limited, as
tow of average length covers <1% of the total cell area. However, this graphic is intended merely to offer a conceptual
sense of potential impacts.

53
3.4 Biological Resources
3.4.1 Groundfish Target Species
More than 90 species are managed under the Groundfish FMP (Table 3-11, below). These
species include: 60-plus rockfish, including all genera and species from the family Scorpaenidae
(Sebastes, Scorpaena, Sebastolobus, and Scorpaenodes); 12 flatfish species; 6 roundfish species;
and 6 miscellaneous fish species that include sharks, skates, grenadiers, rattails, and morids.
Table 3-11: Latitudinal and depth distributions of groundfish species (adults) managed under the FMP. Source: 2013-
14 Groundfish Harvest Specification FEIS, Chapter 3: Affected Environment.
Common Name
Scientific Name Latitudinal Distribution Depth Distribution (fm)
Overall Highest Density Overall Highest Density
Flatfish Species Arrowtooth flounder Atheresthes stomias N. 34º N lat. N. 40º N lat. 10-400 27-270
Butter sole Isopsetta isolepis N. 34º N lat. N. 34º N lat. 0-200 0-100
Curlfin sole Pleuronichthys decurrens Coastwide Coastwide 4-291 4-50 Dover sole Microstomus pacificus Coastwide Coastwide 10-500 110-270 English sole Parophrys vetulus Coastwide Coastwide 0-300 40-200
Flathead sole Hippoglossoides elassodon N. 38º N lat. N. 40º N lat. 3-300 100-200 Pacific sanddab Citharichthys sordidus Coastwide Coastwide 0-300 0-82 Petrale sole Eopsetta jordani Coastwide Coastwide 10-250 160-250
Rex sole Glyptocephalus zachirus Coastwide Coastwide 10-350 27-250
Rock sole Lepidopsetta bilineata Coastwide N. 32º30' N.lat. 0-200 summer 10-44
Sand sole Psettichthys melanostictus Coastwide N. 33º50' N.lat. 0-100 0-44
Starry flounder Platichthys stellatus Coastwide N. 34º20' N.lat. 0-150 0-82
Rockfish Species b/ Aurora rockfish Sebastes aurora Coastwide Coastwide 100-420 82-270
Bank rockfish Sebastes rufus S. 39º30' N.lat. S. 39º30' N.lat. 17-140 115-140
Black rockfish Sebastes melanops N. 34º N lat. N. 34º N lat. 0-200 0-30 Black-and-yellow Sebastes chrysomelas S. 40º N lat. S. 40º N lat. 0-20 0-10
Blackgill rockfish Sebastes melanostomus Coastwide S. 40º N lat. 48-420 125-300
Blue rockfish Sebastes mystinus Coastwide Coastwide 0-300 13-21
Bocaccio c/ Sebastes paucispinis Coastwide S. 40º N. lat., 15-180 54-82
Bronzespotted rockfish Sebastes gilli S. 37º N lat. S. 37º N lat. 41-205 110-160
Brown rockfish Sebastes auriculatus Coastwide S. 40º N lat. 0-70 0-50
Calico rockfish Sebastes dalli S. 38º N lat. S. 33º N lat. 10-140 33-50
California scorpionfish Scorpaena gutatta S. 37º N lat. S. 34º27' N.lat. 0-100 0-100
Canary rockfish Sebastes pinniger Coastwide Coastwide 27-460 50-
100 Chameleon rockfish Sebastes phillipsi 37º-33º N lat. 37º-33º N lat. 95-150 95-
150 Chilipepper rockfish Sebastes goodei Coastwide 34º-40º N lat. 27-190 27-
190 China rockfish Sebastes nebulosus N. 34º N lat. N. 35º N lat. 0-70 2-50
Copper rockfish Sebastes caurinus Coastwide S. 40º N lat. 0-100 0-100
Cowcod Sebastes levis S. 40º N lat. S. 34º27' N.lat 22-270 100-
130

54
Common Name
Scientific Name Latitudinal Distribution Depth Distribution (fm)
Overall Highest Density Overall Highest Density
Darkblotched rockfish Sebastes crameri N. 33º N lat. N. 38º N lat. 16-300 96-220
Dusky rockfish Sebastes ciliatus N. 55º N lat. N. 55º N lat. 0-150 0-150
Dwarf-Red rockfish Sebastes rufinanus 33º N lat. 33º N lat. >100 >100
Flag rockfish Sebastes rubrivinctus S. 38º N lat. S. 37º N lat. 17-100 shallow
Freckled rockfish Sebastes lentiginosus S. 33º N lat. S. 33º N lat. 22-92 22-92
Gopher rockfish Sebastes carnatus S. 40º N lat. S. 40º N lat. 0-30 0-16
Grass rockfish Sebastes rastrelliger S. 44º40' N.lat. S. 40º N lat. 0-25 0-8
Greenblotched rockfish Sebastes rosenblatti S. 38º N lat. S. 38º N lat. 33-217 115-130
Greenspotted rockfish Sebastes chlorostictus S. 47º N lat. S. 40º N lat. 27-110 50-100
Greenstriped rockfish Sebastes elongatus Coastwide Coastwide 33-220 27-136
Halfbanded rockfish Sebastes semicinctus S. 36º40' N.lat. S. 36º40' N.lat. 32-220 32-220
Harlequin rockfish d/ Sebastes variegatus N. 40 º N lat. N. 51º N. lat. 38-167 38-167
Honeycomb rockfish Sebastes umbrosus S. 36º40' N.lat. S. 34º27' N.lat. 16-65 16-38
Kelp rockfish Sebastes atrovirens S. 39º N lat. S. 37º N lat. 0-25 3-4
Longspine thornyhead Sebastolobus altivelis Coastwide Coastwide 167->833 320-550
Mexican rockfish Sebastes macdonaldi S. 36º20' N.lat. S. 36º20' N.lat. 50-140 50-140
Olive rockfish Sebastes serranoides S. 41º20' N.lat. S. 40º N lat. 0-80 0-16
Pacific ocean perch Sebastes alutus Coastwide N. 42º N lat. 30-350 110-220
Pink rockfish Sebastes eos S. 37º N lat. S. 35º N lat. 40-200 40-200
Pinkrose rockfish Sebastes simulator S. 34º N lat. S. 34º N lat. 54-160 108
Puget Sound rockfish Sebastes emphaeus N. 40º N lat. N. 40º N lat. 6-200 6-200
Pygmy rockfish Sebastes wilsoni N. 32º30' N.lat. N. 32º30' N.lat. 17-150 17-150
Quillback rockfish Sebastes maliger N. 36º20' N.lat. N. 40º N lat. 0-150 22-33
Redbanded rockfish Sebastes babcocki Coastwide N. 37º N lat. 50-260 82-245
Redstripe rockfish Sebastes proriger N. 37º N lat. N. 37º N lat. 7-190 55-190
Rosethorn rockfish Sebastes helvomaculatus Coastwide N. 38º N lat. 65-300 55-190
Rosy rockfish Sebastes rosaceus S. 42º N lat. S. 40º N lat. 8-70 30-58
Rougheye rockfish Sebastes aleutianus Coastwide N. 40º N. lat. 27-400 27-250
Semaphore rockfish Sebastes melanosema S. 34º27' N.lat. S. 34º27' N.lat. 75-100 75-100
Sharpchin rockfish Sebastes zacentrus Coastwide Coastwide 50-175 50-175
Shortbelly rockfish Sebastes jordani Coastwide S. 46º N lat. 50-175 50-155
Shortraker rockfish Sebastes borealis N. 39º30' N.lat. N. 44º N lat. 110-220 110-220
Shortspine thornyhead Sebastolobus alascanus Coastwide Coastwide 14->833 55-550
Silvergray rockfish Sebastes brevispinis Coastwide N. 40º N lat. 17-200 55-160
Speckled rockfish Sebastes ovalis S. 38º N lat. S. 37º N lat. 17-200 41-83
Splitnose rockfish Sebastes diploproa Coastwide Coastwide 50-317 55-250
Squarespot rockfish Sebastes hopkinsi S. 38º N lat. S. 36º N lat. 10-100 10-100
Starry rockfish Sebastes constellatus S. 38º N lat. S. 37º N lat. 13-150 13-150

55
Common Name
Scientific Name Latitudinal Distribution Depth Distribution (fm)
Overall Highest Density Overall Highest Density Stripetail rockfish Sebastes saxicola Coastwide Coastwide 5-230 5-190
Swordspine rockfish Sebastes ensifer S. 38º N lat. S. 38º N lat. 38-237 38-237
Tiger rockfish Sebastes nigrocinctus N. 35º N lat. N. 35º N lat. 30-170 35-170
Treefish Sebastes serriceps S. 38º N lat. S. 34º27' N.lat. 0-25 3-16
Vermilion rockfish Sebastes miniatus Coastwide Coastwide 0-150 4-130
Widow rockfish Sebastes entomelas Coastwide N. 37º N lat. 13-200 55-160
Yelloweye rockfish Sebastes ruberrimus Coastwide N. 36º N lat. 25-300 27-220
Yellowmouth rockfish Sebastes reedi N. 40º N lat. N. 40º N lat. 77-200 150-200
Yellowtail rockfish Sebastes flavidus Coastwide N. 37º N lat. 27-300 27-160
Roundfish Species Cabezon Scorpaenichthys Coastwide Coastwide 0-42 0-27
Kelp greenling Hexagrammos Coastwide N. 40º N lat. 0-25 0-10
Lingcod Ophiodon elongatus Coastwide Coastwide 0-233 0-40
Pacific cod Gadus macrocephalus N. 34º N lat. N. 40º N lat. 7-300 27-160
Pacific whiting Merluccius productus Coastwide Coastwide 20-500 27-270
Sablefish Anoplopoma fimbria Coastwide Coastwide 27->1,000 110-550
Shark and Skate Species Big skate Raja binoculata Coastwide S. 46º N lat. 2-110 27-110
California skate Raja inornata Coastwide S. 39º N lat. 0-367 0-10
Leopard shark Triakis semifasciata S. 46º N lat. S. 46º N lat. 0-50 0-2
Longnose skate Raja rhina Coastwide N. 46º N lat. 30-410 30-340
Soupfin shark Galeorhinus zyopterus Coastwide Coastwide 0-225 0-225
Spiny dogfish Squalus suckleyi Coastwide Coastwide 0->640 0-190
Other Species Finescale codling Antimora microlepis Coastwide N. 38º N lat. 190-1,588 190-470
Pacific rattail Coryphaenoides acrolepis Coastwide N. 38º N lat. 85-1,350 500-1,350
Ratfish Hydrolagus colliei Coastwide Coastwide 0-499 55-82
a/ Data from (Casillas, et al. 1998; Eschmeyer, et al. 1983; Hart 1988; Love, et al. 2002; Miller and Lea 1972), and
NMFS
survey data. Depth distributions refer to offshore distributions, not vertical distributions in the water column.
b/ The category “rockfish” includes all genera and species of the family Scorpaenidae, even if not listed, that
occur in the
Washington, Oregon, and California area. c/ Only the southern stock of bocaccio south of 40º10’ N. lat. is listed as depleted.
d/ Only two occurrences of harlequin rockfish south of 51º N. lat. (off Newport, OR and La Push, WA;
(Casillas, et al. 1998)).

56
These species vary greatly in life history, relative abundance, and their spatial and temporal
distribution. Spatial distribution of rockfish is highly linked to depth, and therefore most rockfish
species are split into one of three depth-based categories; nearshore, shelf and slope. Flatfish
species are most concentrated on the continental shelf, but vary in depth distribution depending on
the specie. Roundfish vary in depth distribution and targeted roundfish species are discussed in
more detail below. Most shark and skate species are not targeted and are caught incidentally with
other groundfish species. Most shark and skate species in the FMP are widely distributed across
depths, except for California skates and Leopard sharks which are most highly concentrated in the
nearshore waters.
Additional information on target groundfish species is presented below; additional detailed
information for all groundfish species can be found in Chapter 3 of the 2013-2014 Biennial
harvest specifications and management measures FEIS (NMFS 2012).
Annual catch limits are established through the biennial harvest specifications and management
measures. Under the Shorebased IFQ Program all catch of IFQ species (retained or discarded,
target and non-target) must be covered by quota pounds. Fishermen are individually accountable
for their catch of individual species (or stock complexes), and are subject to a 100 percent
monitoring requirement. Non-IFQ species are managed with trip limits.
There are prominent species that are primary economic drivers for IFQ vessels using bottom trawl
gear, and under trawl rationalization, underutilized species may have an increased opportunity for
improved marketability. There have been several notable changes in attainment by species,
between 2011 and 2012 (Matson, 2013). The largest increases in attainment include the
following: minor slope rockfish, south of 40°10’ N. lat., up 19 percent; Pacific cod, up 13 percent;
canary rockfish, up 13 percent; minor shelf rockfish, south of 40°10’ N. lat., up 10 percent; and
minor slope rockfish, north of 40°10’ N. lat., up nine percent. The largest decreases in attainment
include the following: sablefish south of 36° N. lat., down 42 percent, and shortspine thornyheads
south of 34°27’ N. lat., down 16 percent; yelloweye rockfish attainment was down four percent.
Rockfish Life History Larvae and pelagic juveniles of many rockfish species live in the upper 55 fm (100 m) of the
water column for one to several months before settling to benthic habitats (Johnson et al.,
2001). Timing and magnitude of recruitment could be influenced by either passive ocean
transport or active swimming of pelagic or newly settled juveniles (Johnson et al., 2001).
Density and size of fishes increasing with depth has been observed for some rockfish species
within their range (Johnson et al., 2001). Video analysis has suggested that juvenile and adult
rockfishes may be more abundant on the seafloor rocky ridge areas than on the surrounding
sandy flats (Rooper et al., 2010). While on bottom, all rockfishes were found in rocky ridge
habitats and rarely on sandy flat seafloor. Rockfishes in the water column were found
predominantly over the rocky ridges rather than over the flats (Rooper et al., 2010). On the
US West Coast, daytime pelagic behavior of rockfish is not as common, whereas nighttime
forays into the water column are more prevalent (Rooper et al., 2010).
Juveniles

57
Juvenile habitats are important to determining recruitment to adult fish populations through
density dependence that occurs in nursery areas (C.N. Rooper et al., 2007). Juvenile POP
have been found to exist predominantly in mixed sand and boulder substrata to the exclusion
of most other habitat types (C.N. Rooper et al., 2007). An examination of large-scale patterns
of juvenile and adult POP distribution indicates that juveniles use shallower depth zones on
the continental shelf (C.N. Rooper et al., 2007). Geographic separation has been observed in
POP: juvenile POP use nursery habitats that are different from adult POP (C.N. Rooper et al.,
2007). Juvenile POP were associated with upright sponges or corals attached to the seafloor,
cobble with a coral and sponge assemblage, crevices, or in one case a tangle of derelict
longline gear (C.N. Rooper et al., 2007). C.N. Rooper et al., (2007) found very specific
habitat preferences for juvenile POP for mixed sand-boulder substratum compared to other
available substratum types. Distinct juvenile nursery areas appear to be a common feature in
marine fish populations, the case of juvenile POP, although unique in terms of their specific
habitat requirements, may be mirrored in most commercial fish species (C.N. Rooper et al.,
2007).
Nearshore species
Recent ROV observations have concluded the following: highest densities of small benthic
rockfishes observations suggested that shallow, rocky portions of Heceta Bank were important
nursery areas from juvenile rockfishes (Tissot et al, 2008); shallow diagonal rock ridges (less
than 55 fm deep), dominated mostly by a mixture of deep cobbles and small boulders, were
important habitats for some fishes, especially juvenile rockfishes. Outcrop ridges on the
shallower bank tops, and the cobble-boulder fields, represented important habitats for species
of rockfish and other groundfish (Tissot et al, 2008).
Common groundfish target species in the nearshore environment are kelp greenling, lingcod,
black rockfish, China rockfish, copper rockfish, cabezon and blue rockfish. Overfished
rockfish species such as young-of-the-year yelloweye and canary rockfish are encountered in
nearshore environments.
Prominent Nearshore Target Species
Lingcod- Lingcod are abundant on the West Coast, and inhabit mostly nearshore and
shelf areas. At certain times of the year, these species are in high abundance in
predictable areas and are targeted by bottom trawl vessels.
Sanddabs- Pacific Sanddabs are a marketable flatfish that inhabit soft nearshore
substrate. Other marketable flatfish are commonly encountered in all soft substrates.
Shelf Species
Common groundfish target species in the shelf environment are vermillion, chilipepper,
redstripe, and yellowtail rockfish. Flatfish species are primarily found on the shelf, but vary
in depth distribution (2013-2014 FEIS). In addition, overfished rockfish such as cowcod,
yelloweye, canary rockfish, and bocaccio (south of 40° N. latitude) spend the majority of their
adult life stages in the shelf depths. Canary rockfish may migrate longer distances, and in
larger schools than cowcod and yelloweye rockfish, which exhibit higher site fidelity. Petrale

58
sole flatfish are currently designated as an overfished species, but are scheduled to be rebuilt
in 2014 based on the results of a recent STAR panel stock assessment review (2013). Petrale
sole exhibit a seasonal pattern of migration, following increased prey availability onto the
shelf in the summer months, while migrating in deep slope areas during the winter to form
deep spawning aggregations.
Prominent Shelf Target Species
Yellowtail rockfish- Yellowtail rockfish are a very marketable rockfish found in bottom
and midwater groundfish trawl fisheries. Yellowtail biomass is healthy on the West
Coast, and temporal and spatial schooling patterns can be somewhat predictable for
fishing vessels in their targeting efforts.
Pacific Cod- Pacific cod are found on the West Coast, but are more commonly found
on the northern West Coast, and strong migrations of Pacific Cod can be intermittent,
as the West Coast is on the outer range of the species, which has extremely high
abundances in Canadian and Alaskan waters. Large aggregations of Pacific cod can be
found in nearshore or shelf sand or mud substrates.
Petrale- Petrale sole, an overfished species likely to be declared rebuilt by the end of
2014, can be found in abundance in shelf waters in summer months. Petrale sole are
the most prized flatfish and marketable species among the West Coast sole species.
English sole- English sole are abundant in shelf waters, stocks are healthy, and make up
an important component of bottom trawl catch.
Lingcod- Lingcod are abundant on the West Coast, and inhabit mostly nearshore and
shelf areas. These species can be targeted by bottom trawl vessels in dense
aggregations.
Slope species
Common groundfish target species in the slope environment are Dover sole, shortspine and
longspine thornyheads, sablefish, and various other flatfish species, such as rex sole and bank
rockfish. Shortraker rockfish, a long lived data-poor species is encountered in slope depths.
Other slope species include aurora, rougheye, splitnose, and blackgill rockfish. Adult
overfished slope rockfish such as darkblotched and Pacific ocean perch (POP) are found in
slope depths.
Prominent Slope Target Species
The DTS complex is a primary economic driver for the IFQ bottom trawl fishery. These
species inhabit soft slope mud and sand substrates, can be found in abundance, and ex-vessel
price per pound on these species is high.
Dover sole (below)- Dover sole are an abundant flatfish in deeper shelf and upper slope
depths. Dover sole are abundant in soft substrates, and their marketability has been
increasing in recent years.

59
Shortspine and Longspine Thornyheads (below)- Longspine thornyhead are more
abundant in the deeper waters characteristic of the area open to commercial bottom
trawling while shortspine thornyhead were significantly more abundant in the
continuously closed area of the RCA after accounting for depth (Keller, et al., in prep.,
2013). The thornyhead subgroup exhibited significantly greater catch in both the open
and closed areas relative to the periodically closed area depth (Keller, et al., in prep.,
2013).
Sablefish (below)- Sablefish are an important species and migrate long distances
throughout the West Coast slope and shelf habitats, with some vertical migration between
seasons (larger fish on the shelf in summer months). Sablefish prices saw record ex-
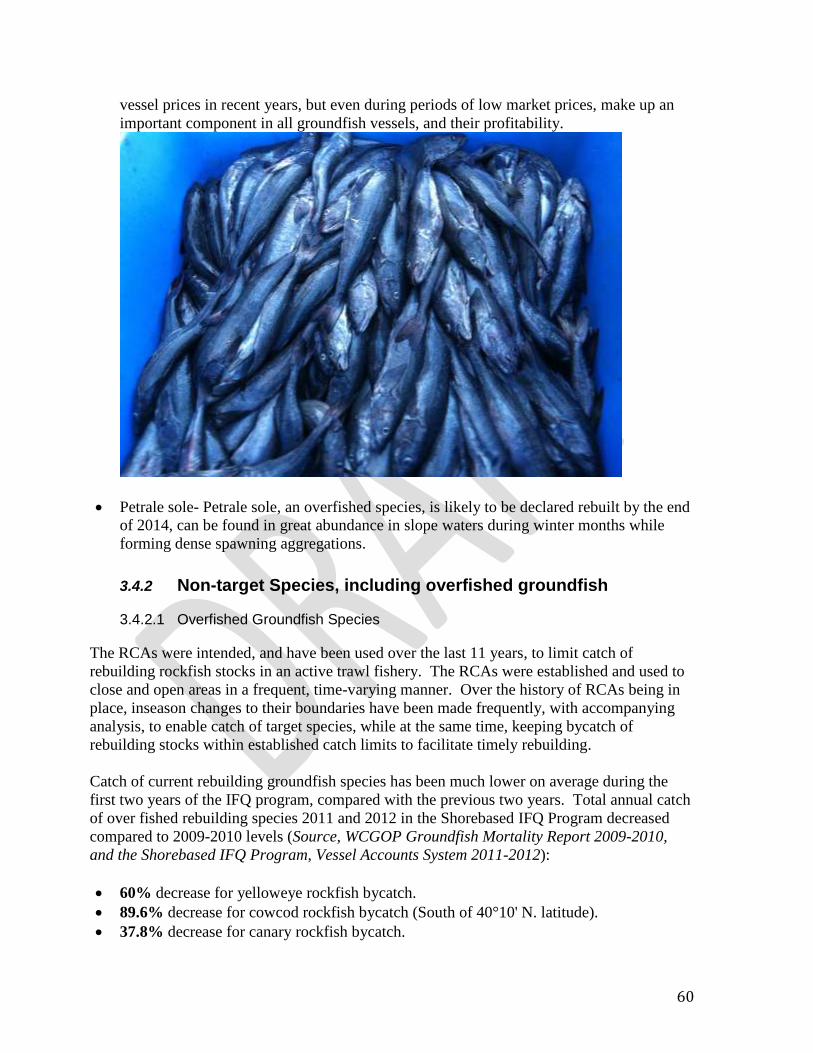
60
vessel prices in recent years, but even during periods of low market prices, make up an
important component in all groundfish vessels, and their profitability.
Petrale sole- Petrale sole, an overfished species, is likely to be declared rebuilt by the end
of 2014, can be found in great abundance in slope waters during winter months while
forming dense spawning aggregations.
3.4.2 Non-target Species, including overfished groundfish
3.4.2.1 Overfished Groundfish Species
The RCAs were intended, and have been used over the last 11 years, to limit catch of
rebuilding rockfish stocks in an active trawl fishery. The RCAs were established and used to
close and open areas in a frequent, time-varying manner. Over the history of RCAs being in
place, inseason changes to their boundaries have been made frequently, with accompanying
analysis, to enable catch of target species, while at the same time, keeping bycatch of
rebuilding stocks within established catch limits to facilitate timely rebuilding.
Catch of current rebuilding groundfish species has been much lower on average during the
first two years of the IFQ program, compared with the previous two years. Total annual catch
of over fished rebuilding species 2011 and 2012 in the Shorebased IFQ Program decreased
compared to 2009-2010 levels (Source, WCGOP Groundfish Mortality Report 2009-2010,
and the Shorebased IFQ Program, Vessel Accounts System 2011-2012):
60% decrease for yelloweye rockfish bycatch.
89.6% decrease for cowcod rockfish bycatch (South of 40°10' N. latitude).
37.8% decrease for canary rockfish bycatch.

61
56.7% decrease for bocaccio rockfish bycatch (South of 40°10' N).
68.1% decrease for Pacific ocean perch bycatch (North of 40°10' N).
68% decrease for Darkblotched rockfish bycatch.
32.8% decrease for Petrale2 sole bycatch.
Based on an analysis of the potential for incidental catch of overfished species occurring as a
result of the proposed action, canary rockfish, darkblotched rockfish, and POP have the
greatest potential for increased catch. These species descriptions are summarized from the
2013-2014 Harvest Specifications and Management Measures EIS. More details can also be
found in the stock assessments.
Canary Rockfish
Wallace and Cope (2011) prepared a coastwide stock assessment update for canary rockfish.
Based on a revised catch series, canary rockfish were very lightly exploited until the early
1940s, when catches increased and a decline in biomass began. The spawning biomass
experienced an accelerated rate of decline during the late 1970s, and reached a low of 9.7
percent of unfished biomass in the mid-1990s. The current depletion is 24 percent of the
unfished biomass level in 2011 (~95 percent confidence interval 18-30 percent) and is an
estimated increase of over 50 percent since 2000. The stock was estimated to have been at
11.5 percent the unfished biomass level in 2000. The canary rockfish spawning stock biomass
is gradually increasing in response to reductions in harvest and above-average recruitment in
the preceding decade. However, this trend is very uncertain.
Recent year class strengths (1997-2008) have generally been low, with only 4 of the 12 years
(1999, 2001, 2006, and 2007) estimated to have produced large recruitments. Unfished
spawning stock biomass is estimated to be 33,512 mt under the base case model in the 2011
assessment. The new assessment estimates the spawning stock biomass to be 8,036 mt (~95
percent confidence interval: 5,719-10,353 mt).
Darkblotched Rockfish
2 Petrale sole harvest is close to being rebuilt (estimated 2014), and is currently managed as a target stock.
0%
10%
20%
30%
40%
50%
60%
Pe
rce
nt
Canary Depletion
2011 2009
B40%
B25%

62
Stephens et al. (2011) prepared a stock assessment update for darkblotched rockfish in the
U.S. Vancouver, Columbia, Eureka and Monterey areas. The darkblotched rockfish
population in these areas was modeled as a single stock. The biomass (1+ age fish) in 2011
was estimated to be 13,926 mt. The recruitment pattern for darkblotched rockfish is highly
variable between years. With the exception of the 1999, 2000, and 2008 year classes,
recruitment levels (age-0 recruits) between the 1980s and 1990s were generally poor when
compared with historical average recruitment levels. Darkblotched rockfish continues to
show an increasing trend with the point estimate for the depletion of the spawning output at
the start of 2011 at 30.2 percent of its unfished biomass. The assessment suggests that the
west coast darkblotched stock is above the overfished threshold, but below the management
target of B40%. The spawning output appears to have increased steadily over the past 10
years. Since 2003, overfishing is estimated to have occurred once, with estimated catch
exceeding the ABC (now referred to as the OFL) by 1 mt in 2004.
0%
10%
20%
30%
40%
50%
60%
Pe
rce
nt
Darkblotched Depletion
2011 assessment 2009 assessment
B40%
B25%

63
Pacific Ocean Perch
Hamel and Ono (2011) prepared a stock assessment for POP in the waters off the U.S. West Coast
from northern California to the U.S.-Canada border. The estimate of depletion of the spawning
biomass at the start of 2011 is estimated to be 19.1 percent. The POP biomass shows an increasing
trend. In 2011, the spawning output (3+ year-old fish) was estimated to be 25,482 mt. Because the
estimated unfished biomass is estimated to be much larger in the 2011 stock assessment relative to past
assessments (Hamel 2009), the estimated depletion of 19.1 percent in 2011 is lower than that estimated
in 2009 (28.6 percent) in the 2009 assessment or the projected 2011 depletion (31.5 percent) in the
2009 assessment.
3.4.2.2 Non-target Species
Most shark and skate species are caught incidentally while trawl vessels target other groundfish
species. Most shark and skate species in the FMP are widely distributed across depths, except for
California skates and Leopard sharks which are most highly concentrated in the nearshore waters.
Additional detailed information on non-target groundfish species can be found in Chapter 3 of the
2013-2014 Biennial harvest specifications and management measures FEIS (NMFS 2012).
Some flatfish species, including some species that are in the groundfish FMP and some that are
not, are caught incidentally by vessels targeting other groundfish species and are most vulnerable
to the groundfish bottom trawl fishery.
Pacific halibut (Hippoglossus stenolepis) is a bottom-dwelling, right-eyed flatfish species. Pacific
halibut are taken with trawl, as well as commercial and recreational fixed gears as they co-occur
with groundfish stocks, including canary and yelloweye rockfish. The fixed gear sablefish fishery
is responsible for the most catch of Pacific halibut (NMFS 2012). Pacific halibut catch has been
restricted in the trawl fisheries through the issuance of bycatch allowances.
California halibut (Paralichthys californicus) are a left-eyed flatfish. They range from Northern
Washington to southern Baja California, Mexico, (Eschmeyer, et al., 1983), but are most common
south of Oregon. California halibut are taken incidentally in the groundfish fishery, but are most
vulnerable to groundfish bottom trawl gear. Harvest of California halibut in the groundfish
bottom trawl fishery has averaged 46 mt from 2007-2010, while catch in the non-trawl groundfish
fishery has averaged less than 3 mt during the same time period (NMFS 2012).
0%
10%
20%
30%
40%
50%
60%
Pe
rce
nt
POP Depletion
2011 assessment 2009 assessment
B40%
B25%
64
Coastal pelagic species, such as smelt and herring, are taken incidentally in the groundfish
fishery, and are believed to be most vulnerable to midwater trawl gear, with incidental take of
coastal pelagic species documented in the midwater whiting fisheries. Given that coastal pelagic
species are not associated with the ocean bottom, interactions with the groundfish bottom trawl
fishery are expected to be minimal (NMFS 2012). Additional information on catch of coastal
pelagic species in the midwater trawl fishery is available in Chapter 3 of the 2013-2014 Biennial
harvest specifications and management measures FEIS (NMFS 2012).
Greenlings (other than kelp greenling), are caught incidentally with vessels targeting nearshore
rockfish (NMFS 2012). Ocean whitefish are harvested using non-trawl gear, and are not generally
caught incidentally in the groundfish bottom trawl fishery (NMFS 2012). California sheephead
are not caught in the Shorebased IFQ Program, and additional information on bycatch of
California sheephead is not available.
Highly migratory species, such as marlin, tuna and non-FMP sharks are largely pelagic, open ocean species. These species are very infrequently caught in groundfish directed fisheries off Washington and Oregon. In California, highly migratory species are occasionally taken by fisheries targeting groundfish. In 2009, about 100 kg of albacore were taken incidentally with groundfish trolling (non-trawl gear) for sablefish and rockfish. Thresher sharks are incidentally taken in trawl gear (HMS SAFE Document, 2010).
3.4.3 Invertebrates
Various types of bottom-dwelling invertebrates occur in the action area including crab,
shrimp, coral and sponges. These include Dungeness crab, tanner crab, pink shrimp,
ridgeback prawns, spot prawns, sea cucumbers, coral, and sponges.
Dungeness crab is taken incidentally, or harmed unintentionally, by groundfish gears. In
some areas, interactions with Dungeness crab by nearshore flatfish trawls are a concern.
Concentrating vessel effort in shallow water during the summer months (<75 fm) affects
Dungeness crab in the north because they are less likely to survive discard during their
summer molting season. Shrimp trawl nets are usually constructed with net mesh sizes
smaller than the net mesh sizes for legal groundfish trawl gear. Thus, it is shrimp trawlers that
commonly take groundfish in association with shrimp, rather than the reverse. Additional
detailed information regarding these invertebrates can be found Chapter 3 of the 2013-2014
Biennial harvest specifications and management measures FEIS (NMFS 2012).
Additional information regarding structure-forming invertebrates, including corals, sponges
and sea whips, is provided below.
3.4.3.1 Coral
Coral species are most often observed in hard substrate, with some minor occurrences in
mixed substrate on boulders; on mixed substrate, most are less than 30-50 cm in height. Coral
species are not commonly found in sandy or mud substrate. In one ROV study off the West
Coast of northern British Columbia, over half of primnoid corals over 30 cm tall had
associated rockfish, less than 2% of the seafloor had large coral, and small coral had no

65
associated rockfish, and no rockfish were associated with short corals between 10 and 30 cm
height (Du Preez & Tunnicliffe, 2011).
Through stomach content analyses, Husebo et al. (2002) found rockfish are not linked to coral
sites through feeding habits and suggest the physical structure of corals attracts rockfish,
rather than some biological attribute (Du Preez & Tunnicliffe, 2011). Oceanographic factors,
such as El Ninõ events could affect larval survival of octocorals (Troffe et al, 2005). Studies
suggesting deep-sea coral reefs may be decades to hundreds of years old (Etnoyer and
Morgan, 2003). Retrospective analysis and isotope dating techniques for Primnoa
resdaeformis suggest that a 5 cm diameter sample may be as old as 500 years (Etnoyer and
Morgan, 2003). Andrews (2002) estimated growth rates of 1.74 cm per year in height,
suggesting the largest limb studied took approximately 112 yrs to grow from its initial
settlement to a total height of 197.5 cm (Etnoyer and Morgan, 2003). Any benthic features
sensitive to trawling, such as corals, have long since been impacted, and in trawl fisheries on
complex structures, such as California, Oregon, Washington, and British Columbia, each
vessel trawls the same set of “shots” year after year amounting to 10% of the total bottom
(Hilborn, 2007). NMFS’ bottom trawl survey has caught several coral species during their
research surveys. Most of the corals encountered in those activities are Pennatulaceans, both
in quantity and in frequency (Table 3-12). However, some coral species may have escaped
damage from trawl gear which could potentially be impacted by the proposed action.
Table 3-12: General statistics on deep corals sampled during National Marine Fisheries Service (NMFS)
bottom trawl surveys, which were conducted off the coasts of Washington, Oregon and California by the
Alaska and Northwest Fisheries Science Centers between 1980 and 2005. A total of 10,526 trawl catch
records were queried. Source: Whitmire and Clark, 2007, NMFS.
Stylasterids 1 <0.1% <0.1%
Total 2259 100.00%
Alcyonaceans 150 1.40% 6.60%
Scleractinians 26 0.20% 1.20%
Gorgonians 202 1.90% 8.90%
Antipatharians 197 1.90% 8.70%
# Trawls with Corals % Trawls with Corals % Coral Records
Pennatulaceans 1683 16.00% 74.50%

66
Figure 3-24: Map showing locations of deep coral bycatch recorded by fishery observers in the West
Coast Groundfish Observer Program. All observed trips and gear types from August 2001 – August 2004
were queried. Due to limitations of specific identifications, coral bycatch was grouped into two classes: 1)
gorgonians and stony corals, and 2) pennatulaceans. Point symbols represent start locations of bottom
trawls or longline and pot sets. Source: Whitmire and Clark, 2007, NMFS.
For the most part, corals in the region do not build reefs with observations of only L. pertusa
in the Olympic Coast National Marine Sanctuary (Whitmire and Clark, 2007, NMFS.).
Although associations of corals with other invertebrates and fishes have been reported, there
is no direct evidence that any of these represent obligate relationships between taxa (Whitmire
and Clark, 2007, NMFS.). Much of the recent information on the regional zoogeography of
higher-level coral taxa was collected during bottom trawl surveys (Whitmire and Clark, 2007,
NMFS.). More detailed information, but in a limited geographic scope, has been collected
using submersibles, remotely operated vehicles (ROVs) and more recently, autonomous
underwater vehicles (AUVs). Information on the distribution of corals as well as monitoring

67
fishing impacts can be gleaned from information collected by fisheries observers (Whitmire
and Clark, 2007, NMFS.). General statistics on deep corals sampled during National Marine
Fisheries Service (NMFS) bottom trawl surveys, which were conducted off the West Coast by
the Alaska and Northwest Fisheries Science Centers between 1980 and 2005 have enabled
cataloguing of coral species. Additionally, locations of deep coral bycatch have been
recorded by fishery observers in the West Coast Groundfish Observer Program and have been
mapped (Figure 3-24). With fishery management measures (e.g., area closures, gear
restrictions), the risk posed by bottom trawling has been significantly reduced (Whitmire and
Clark, 2007, NMFS.).
3.4.3.2 Sponges
As mentioned above, sponge species are often observed with coral species mostly in hard
substrate, with some minor occurrences in mixed substrate on boulders, and among those,
most are less than 30-50 cm in height. Sponge species are not commonly found in sandy or
mud substrate. Oceana has documented the presence of barrel, foliose, mound, branching,
shelf, and vase sponges in 16 of 17 ROV dive sites (Cape Arago, Coquille Reef, Orford Reef)
off the West Coast (Enticknap et al., 2013). Branching sponge was the most commonly
observed morphology, followed by foliose and mound (Enticknap et al., 2013). Over 50% of
the frames analyzed for the offshore cape arago site had branching sponges (Enticknap et al.,
2013). Barrel, shelf, and vase sponges were the least observed morphologies (Enticknap et
al., 2013). Inshore reefs at Cape Arago, Coquille, and Orford all have similar compositions of
and sponges (Enticknap et al., 2013). In ROV surveys off the West Coast of northern British
Columbia, the majority of rockfish (80%) occurred with sponges 50 cm in height (Du Preez &
Tunnicliffe, 2011).
Table 3-13: Frequency of occurrence, depth, and latitudinal ranges for fish and invertebrate species,
grouped by family (or higher taxonomic classification), caught during the 2005 NWFSC slope/shelf survey.
Source, NOAA Technical Memorandum NMFS-NWFSC-93, 2008.
Table 3-14: Summary of coral and sponge bycatch metrics for observed tows using bottom trawls as part
of the West Coast Groundfish Observer Program (WCGOP), comparing two time periods: “Before” (3 Jan
2002 – 11 Jun 2006) and “After” (12 Jun 2006 – 31 Dec 2010) implementation of Amendment 19
regulationsa/.
Table 3 continued. Frequency of occurrence, depth, and latitudinal ranges for fish and invertebrate species, grouped by family (or higher
taxonomic classification), caught during the 2005 NWFSC slope/shelf survey.
Depth (m)
Latitudinal
range (dd) Family and
scientific name Common name
Frequency of
occurrence
(No. hauls) Min. Max. Mean South North
Xystreurys liolepis Fantail sole 3 63 74 68 32.92 34.36
Cynoglossidae
Cynoglossidae Tonguefish unident. 1 60 60 60 36.86 36.86
Symphurus atricaudus California tonguefish 2 72 110 91 34.15 34.37
Osteichthyes (class) Fish eggs unident. 1 105 105 105 45.53 45.53
Osteichthyes (class) Fish unident. 1 60 60 60 33.79 33.79
Porifera (phylum)
Hexactinellida Glass sponge unident. 2 937 1,063 1,000 33.75 43.58
Porifera Sponge unident. 154 61 1,230 476 32.54 48.42
Porifera Vase sponge unident. 9 70 984 450 32.72 45.20
Acanthascus sp. Chimney sponge unident. 7 127 1,088 444 33.61 47.26
Aphrocallistes vastus Clay pipe sponge 61 97 1,098 584 32.72 47.87
Chonelasma calyx Goblet sponge 3 510 581 548 33.37 40.68
Farrea convolulus Crusty tube sponge 5 307 1,083 768 32.94 47.68
Hyalonema sp. Fiber optic sponge unident. 20 502 1,140 872 32.62 47.68
Leucandra heathi Spiny vase sponge 1 256 256 256 44.63 44.63
Rhabdocalyptus sp. Cloud sponge unident. 11 307 838 579 32.73 46.06
Staurocalyptus sp. Spiny vase sponge unident. 15 336 1,140 680 32.73 47.69
Suberites ficus Hermit sponge 1 87 87 87 33.84 33.84
Tethya sp. Ball sponge unident. 6 71 826 358 32.72 34.38
Scyphozoa (class)
Scyphozoa Jellyfish unident. 97 58 1,243 464 32.61 47.84
Aequorea sp. 2 584 857 721 35.09 43.32
Atolla sp. Wheel jelly unident. 62 455 1,243 886 32.77 47.69
Aurelia labiata 10 63 427 169 37.74 46.67
Aurelia sp. Moon jelly unident. 12 59 1,015 263 34.29 47.26
Chrysaora melanaster Sunrise jelly 1 79 79 79 46.82 46.82
Chrysaora sp. Chrysaora jellyfish unident. 28 58 761 118 32.58 47.84
30

68
2000-2005 2006-2010 2000-2010
Taxon # FREQ Wt CPUE (per 1,000
km)
# FREQ Wt CPUE (per 1,000
km)
# FREQ Wt CPUE (per 1,000 km)
Coral 319 2.00% 9,309 49.00 335 1.80% 2,197 9.00 654 1.90% 11,507 27.00
Sea pen/ whip
198 1.30% 232 1.20 474 2.50% 145 0.59 672 1.90% 377 0.87
Sponge 469 3.00% 10,025 53.00 1,444 7.60% 45,383 190.00 1,913 5.50% 55,408 130.00
Grand Total
903 5.70% 19,567 100.00 2,003 10.50% 47,725 200.00 2,906 8.40% 67,292 160.00
a/ “#” denotes number of hauls; “FREQ” denotes ratio of hauls with positive catch of taxon to total hauls observed;
“Weight” denotes catch (kg); “CPUE” denotes catch per unit effort (units: lb/1,000 km). Haul counts represent only those
hauls where corals or sponges were present in the catch. Annual WCGOP coverage of the limited-entry trawl sector can be
found online at: http://www.nwfsc.noaa.gov/research/divisions/fram/observer/sector_products.cfm.
Not all bottom contact events shown for the bottom trawl fishery resulted in the capture of
corals or sponges, as shown in Table 3-14 (above). During 2006-2010 the coral and sponge
contact rate in the bottom trawl fishery sample was 10.5 percent of tows. Bottom trawling
was conducted on the continental shelf and the continental slope, but was prohibited in the
RCA during 2006-2010. Distribution data for corals and sponges show widespread patchy
distributions (see Table 3-15, below). The bottom trawl data for 2006-2010 show a coral
and sponge catch rate of 10.5 percent of tows (table 3-14, above). Most (62%) areas of coral
and sponge presence are located within the upper slope, with 28% and 10% of presence in
the shelf and lower slope, respectively (EFH synthesis report, 2013, NMFS). Table 3-15
below summarizes coral and sponge taxa recorded during tows as part of the West Coast
Groundfish Bottom Trawl Survey (WCGBTS, Table 3-14, above), in which prevalence of
sponge (Porifera) catch per unit of effort was highest.

69
Table 3-15: Summary of coral and sponge taxa recorded during tows as part of the West Coast
Groundfish Bottom Trawl Survey (WCGBTS), comparing two time periods: “Before” (2003-05) and
“After” (2006-10). “#” denotes number of tows with recorded bycatch; “FREQ” denotes ratio of tows with
catch to total tows recorded; “CPUE” denotes catch per unit of effort (units: kg/ha). Tow counts represent
only those where corals or sponges were present in the catch. Taxa are listed in descending order of CPUE
for combined time period.
3.4.3.3 Sea Whips
Sea whips are pennatulacean octocorals that are broadly distributed across the continental
shelf along the West Coast from depths of 10 to at least 500 fm (figure 3-16). Sea whips have
a relatively simple morphology consisting of a basal peduncle that serve to anchor in soft
Pacific Coast Groundfish EFH 5-Year Review 32 August 2012
Table 4. Summary of coral and sponge taxa recorded during tows as part of the West Coast Groundfish Bottom Trawl Survey (WCGBTS), comparing two time periods: “Before” (2003-05) and “After” (2006-10). “#” denotes number of tows with recorded bycatch; “FREQ” denotes ratio of tows with catch to total tows recorded; “CPUE” denotes catch per unit of effort (units: kg/ha). Tow counts represent only those where corals or sponges were present in the catch. Taxa are listed in descending order of CPUE for combined time period.
BEFORE AFTER BEFORE + AFTER
Taxon # FREQ CPUE # FREQ CPUE # FREQ CPUE
Porifera 359 21.7% 1,852.90 647 19.0% 2,297.41 1,006 19.9% 4,150.31
Hexactinosida 103 6.2% 810.13 295 8.7% 2,371.76 398 7.9% 3,181.89
Rossellinae 53 3.2% 154.01 91 2.7% 698.79 144 2.8% 852.80
Suberites spp. 3 0.2% 425.77 9 0.3% 2.90 12 0.2% 428.67
Hyalonema spp. 47 2.8% 49.17 95 2.8% 174.32 142 2.8% 223.49
Hexactinellida 17 1.0% 77.80 0 0.0% 0.00 17 0.3% 77.80
Pennatulacea 245 14.8% 16.18 417 12.3% 24.44 662 13.1% 40.62
Anthoptilum grandiflorum 98 5.9% 6.64 289 8.5% 30.58 387 7.7% 37.22
Chrysopathes spp. 0 0.0% 0.00 31 0.9% 29.24 31 0.6% 29.24
Antipatharia 66 4.0% 23.85 25 0.7% 1.77 91 1.8% 25.61
Halipteris spp. 0 0.0% 0.00 161 4.7% 13.11 161 3.2% 13.11
Gorgonacea 58 3.5% 2.56 82 2.4% 10.34 140 2.8% 12.90
Anthomastus ritteri 16 1.0% 3.09 69 2.0% 8.04 85 1.7% 11.13
Ptilosarcus gurneyi 28 1.7% 2.48 62 1.8% 5.64 90 1.8% 8.12
Alcyonacea 14 0.8% 0.89 15 0.4% 3.53 29 0.6% 4.42
Anthomastus spp. 19 1.2% 3.00 11 0.3% 1.29 30 0.6% 4.29
Callogorgia kinoshitae 4 0.2% 0.06 22 0.6% 4.09 26 0.5% 4.15
Umbellula spp. 23 1.4% 1.38 94 2.8% 2.47 117 2.3% 3.84
Paragorgia spp. 6 0.4% 0.56 14 0.4% 2.68 20 0.4% 3.24
Isidella spp. 1 0.1% 0.06 9 0.3% 3.05 10 0.2% 3.11
Scleractinia 4 0.2% 2.43 3 0.1% 0.14 7 0.1% 2.57
Farrea spp. 5 0.3% 0.76 3 0.1% 0.85 8 0.2% 1.61
Anthoptilum murrayi 4 0.2% 0.06 29 0.9% 1.01 33 0.7% 1.07
Flabellidae 2 0.1% 0.03 9 0.3% 0.82 11 0.2% 0.84
Caryophylliidae 1 0.1% 0.09 5 0.1% 0.35 6 0.1% 0.45
Bathypathes spp. 6 0.4% 0.05 25 0.7% 0.37 31 0.6% 0.42
Keratoisis spp. 2 0.1% 0.41 0 0.0% 0.00 2 0.0% 0.41
Stylasteridae 1 0.1% 0.00 4 0.1% 0.37 5 0.1% 0.37
Lillipathes spp. 3 0.2% 0.08 9 0.3% 0.20 12 0.2% 0.28
Callogorgia spp. 1 0.1% 0.02 4 0.1% 0.17 5 0.1% 0.19
Pennatula phosphorea 1 0.1% 0.01 10 0.3% 0.10 11 0.2% 0.12
Acanthogorgiidae 0 0.0% 0.00 1 0.0% 0.01 1 0.0% 0.01
Combined 749 45.3% 3,434.45 1,554 45.7% 5,689.85 2,303 45.5% 9,124.30
Total Hauls /Time Period 1,652 3,404 5,056

70
sediment, and a verticle rachis extending distally from the peduncle (stem). The distal portion
of the sea whip colony comprises a sheath-like tissue layer made up of multiple autozooid
feeding polyps supported by an unbranched endoskeleton called an axial rod (Troffe et al,
2005). Juvenile sea whip density before and after trawling was not statistically significantly
different (Troffe et al, 2005). For sea whips that are impacted by fishing gear, re-growth of
young colonies may be slow at beginning life stages. Untrawled bottoms were strongly
dominated numerically by 30–50 cm high sea pens (Stylatula spp.), which accounted for over
95% of all recorded invertebrates (Hixon and Tissot, 2007). However, at untrawled area,
there was no correlation between sea-pen density and total fish density among transect
segments (Hixon and Tissot, 2007). Sea pens do not provide an obvious biogenic habitat for
demersal fishes (Hixon and Tissot, 2007).
Figure 3-25: Picture of sea whips on soft substrate. (Source:
http://www.afsc.noaa.gov/ABL/MESA/archives/effects%20of%20trawl%20on%20seawhips.htm)
3.4.4 Protected Species, including ESA Species
A variety of species are protected by Federal law (other than the MSA) with the objective of
sustaining, or rebuilding their populations from critically depleted levels.
3.4.4.1 Species Protected by the Endangered Species Act, Marine Mammal Protection Act, and the Migratory Bird Treaty Act
NMFS issued Biological Opinions under the Endangered Species Act (ESA) on August 10,
1990, November 26, 1991, August 28, 1992, September 27, 1993, May 14, 1996, and
December 15, 1999, pertaining to the effects of the Pacific Coast groundfish fisheries on
Chinook salmon (Puget Sound, Snake River spring/summer, Snake River fall, upper
Columbia River spring, lower Columbia River, upper Willamette River, Sacramento River
winter, Central Valley spring, California coastal), coho salmon (Central California coastal,
southern Oregon/northern California coastal), chum salmon (Hood Canal summer, Columbia

71
River), sockeye salmon (Snake River, Ozette Lake), and steelhead (upper, middle and lower
Columbia River, Snake River Basin, upper Willamette River, central California coast,
California Central Valley, south/central California, northern California, southern California).
These biological opinions have concluded that implementation of the Pacific Coast groundfish
fishery is not expected to jeopardize the continued existence of any endangered or threatened
salmonid species under the jurisdiction of NMFS, or result in the destruction or adverse
modification of critical habitat.
NMFS issued a Supplemental Biological Opinion on March 11, 2006, concluding that neither
the higher observed bycatch of Chinook in the 2005 whiting fishery nor new data
regarding salmon bycatch in the groundfish bottom trawl fishery required a reconsideration of
its prior ‘‘no jeopardy’’ conclusion. NMFS also reaffirmed its prior determination that
implementation of the Groundfish FMP is not likely to jeopardize the continued existence of
any of the affected ESUs. Lower Columbia River coho (70 FR37160, June 28, 2005) and
Oregon Coastal coho (73 FR 7816, February 11, 2008) were relisted as threatened under the
ESA. The 1999 biological opinion concluded that the bycatch of salmonids in the Pacific
whiting fishery were almost entirely Chinook salmon, with little or no bycatch of coho, chum,
sockeye, and steelhead.
U.S. west coast waters support a variety of marine mammals. Approximately 30 species,
including seals, sea lions, sea otters, whales, dolphins, and porpoise, occur within the EEZ.
Many species seasonally migrate through west coast waters, while others are year-round
residents. There are also several marine mammal species in the action area that are listed
under the ESA (see NMFS 2012 FEIS for full list). With respect to species protected by the
MMPA, the west coast groundfish trawl fisheries are Category III fisheries indicating a
remote likelihood of, or no known, serious injuries or mortalities to marine mammals.
On December 7, 2012, NMFS completed a biological opinion concluding that the groundfish
fishery is not likely to jeopardize non-salmonid marine species including listed eulachon,
green sturgeon, humpback whales, Steller sea lions, and leatherback sea turtles. The opinion
also concludes that the fishery is not likely to adversely modify critical habitat for green
sturgeon and leatherback sea turtles.
An analysis included in the same document as the opinion concludes that the fishery is not
likely to adversely affect green sea turtles, olive ridley sea turtles, or loggerhead sea
Turtles, sei whales, North Pacific right whales, blue whales, fin whales, sperm
whales, Southern Resident killer whales, Guadalupe fur seals, or the critical habitat for Steller
sea lions.
The California current system supports a diverse array of seabird species. Species found on
the west coast include resident species and transitory species (migrating or foraging). Several
species of seabirds have had documented takes in the groundfish fishery, including black-
footed albatross, common murres, other non-listed species, ESA-listed marbled murrelets and
ESA-listed short-tailed albatross (for a full list of species see Table 3-19 and Table 3-20 in the
NMFS 2012 FEIS). On November 21, 2012, the U.S. Fish and Wildlife Service (FWS) issued
a biological opinion concluding that the groundfish fishery will not jeopardize the continued
existence of the short-tailed albatross. The (FWS) also concurred that the fishery is not likely
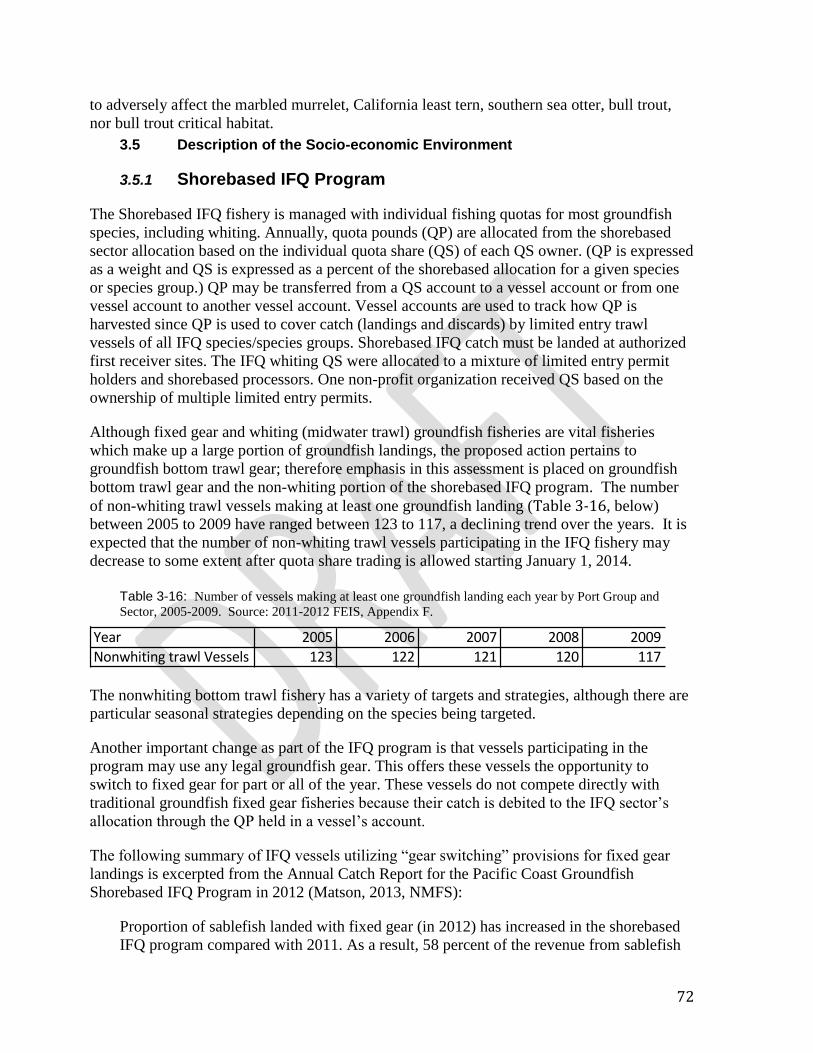
72
to adversely affect the marbled murrelet, California least tern, southern sea otter, bull trout,
nor bull trout critical habitat.
3.5 Description of the Socio-economic Environment
3.5.1 Shorebased IFQ Program
The Shorebased IFQ fishery is managed with individual fishing quotas for most groundfish
species, including whiting. Annually, quota pounds (QP) are allocated from the shorebased
sector allocation based on the individual quota share (QS) of each QS owner. (QP is expressed
as a weight and QS is expressed as a percent of the shorebased allocation for a given species
or species group.) QP may be transferred from a QS account to a vessel account or from one
vessel account to another vessel account. Vessel accounts are used to track how QP is
harvested since QP is used to cover catch (landings and discards) by limited entry trawl
vessels of all IFQ species/species groups. Shorebased IFQ catch must be landed at authorized
first receiver sites. The IFQ whiting QS were allocated to a mixture of limited entry permit
holders and shorebased processors. One non-profit organization received QS based on the
ownership of multiple limited entry permits.
Although fixed gear and whiting (midwater trawl) groundfish fisheries are vital fisheries
which make up a large portion of groundfish landings, the proposed action pertains to
groundfish bottom trawl gear; therefore emphasis in this assessment is placed on groundfish
bottom trawl gear and the non-whiting portion of the shorebased IFQ program. The number
of non-whiting trawl vessels making at least one groundfish landing (Table 3-16, below)
between 2005 to 2009 have ranged between 123 to 117, a declining trend over the years. It is
expected that the number of non-whiting trawl vessels participating in the IFQ fishery may
decrease to some extent after quota share trading is allowed starting January 1, 2014.
Table 3-16: Number of vessels making at least one groundfish landing each year by Port Group and
Sector, 2005-2009. Source: 2011-2012 FEIS, Appendix F.
The nonwhiting bottom trawl fishery has a variety of targets and strategies, although there are
particular seasonal strategies depending on the species being targeted.
Another important change as part of the IFQ program is that vessels participating in the
program may use any legal groundfish gear. This offers these vessels the opportunity to
switch to fixed gear for part or all of the year. These vessels do not compete directly with
traditional groundfish fixed gear fisheries because their catch is debited to the IFQ sector’s
allocation through the QP held in a vessel’s account.
The following summary of IFQ vessels utilizing “gear switching” provisions for fixed gear
landings is excerpted from the Annual Catch Report for the Pacific Coast Groundfish
Shorebased IFQ Program in 2012 (Matson, 2013, NMFS):
Proportion of sablefish landed with fixed gear (in 2012) has increased in the shorebased
IFQ program compared with 2011. As a result, 58 percent of the revenue from sablefish
Year 2005 2006 2007 2008 2009NonwhitingtrawlVessels 123 122 121 120 117

73
in this fishery is estimated to come from fixed gear (up ten percent from 2011), due to
(IFQ) increases in landings using hook and line gear. These changes in gear use for
sablefish translated in small overall changes to the distribution of aggregate landings of
all groundfish species, and associated revenue among gear types for the entire non whiting fleet. Much lower prices were seen in 2012 for sablefish for hook and line, pot,
and trawl gear, than during 2011. Fixed gear accounts for one fourth of the nonwhiting
revenue in the fishery, although it currently makes up only seven percent of landings.
Five species accounted for just over 90 percent of ex-vessel revenue during 2006-2010:
sablefish, 36 percent; Dover sole, 27 percent; petrale sole, 15 percent; thornyheads 9 percent;
and rockfish 3 percent. Note that petrale sole was declared overfished in 2010 with a
rebuilding plan implemented that requires reduced ACLs beginning in 2011 to rebuild the
stock.
As stated in the Annual Catch Report for the Pacific Coast Groundfish Shorebased IFQ
Program in 2012 (Matson, 2013, NMFS):
Total catch of several valuable groundfish species in 2012 was less than 50 percent of the
trawl allocation. Only 8 percent of the minor shelf rockfish complex north of 40°10’ N.
lat. was caught, leaving over 1 million pounds unharvested. Only 27 percent of the minor
slope rockfish complex north of 40°10’ N. lat. was caught, leaving over 1.3 million
pounds unharvested. For flatfish, excluding petrale sole, no species had attainment of
over 33 percent of the trawl allocation, with Dover sole being the highest. Over 33
million pounds of Dover sole was left unharvested in 2012. Only 21 percent of the trawl
allocation of lingcod was caught in 2012, leaving over 3 million pounds of the allocation
unharvested. Only 35 percent of the trawl allocation of Pacific cod was caught in 2012,
leaving over 2.5 million pounds unharvested. Only 32 percent of the trawl allocation of
yellowtail rockfish north of 40°10’ N. lat. was caught, leaving over 4.5 million pounds
unharvested.
Landings in the shorebased nonwhiting fleet were up slightly in 2012, at 101 percent of 2011
levels (40,892,262 pounds versus 40,610,190 pounds, respectively, Error! Reference source
ot found.). Revenue in 2012 maintained 92 percent of 2011 levels (30,452,763 dollars in 2012
versus 32,935,934 dollars in 2011), despite a 56 cent per pound drop in sablefish prices, a six
percent decrease in sablefish landings and a 24 percent decrease in revenue from sablefish, or
4.2 million dollars (17,614,666 dollars in 2011 versus 13,356,592 dollars in 2012). (Matson,
2013, NMFS):
Monthly trajectories of landings and revenue, by both the nonwhiting and shorebased whiting
fleets for 2012 are also very similar to the previous year, although nonwhiting landings and
revenue in December of 2012 returned to levels similar to pre-IFQ. Landings and revenue
during December 2011 spiked much higher than typical December levels (Error! Reference
ource not found.). (Matson, 2013, NMFS):
Considering the nonwhiting fleet for the two years before and the two years after trawl
rationalization (Table 3-17), revenues have been 12.5 percent higher, although annual
landings have on average been 24.8 percent lower. Total monthly landings and revenue have

74
been somewhat more variable throughout the year, in the first two years following trawl
rationalization, than before it. (Matson, 2013, NMFS):
Table 3-17: Monthly landings (left) and revenue (right) during 2011 and 2012, for nonwhiting trips in the
Shorebased IFQ Program. The “land % 2011” column expresses 2012 landings as a percentage of 2011
landings; the “rev % 2011” column expresses 2012 revenue in the same way. Source = paper and electronic
landing receipt data (PacFIN and PSMFC, respectively), Annual Catch Report for the Pacific Coast
Groundfish, Shorebased IFQ Program in 2012, Matson 2013.
Table 3-18: Average monthly landings (left) and revenue (right) during 2009-2010 (green open circles,
dashed lines), versus 2011-2012 (black squares, solid lines), for non-whiting trips in the Shorebased IFQ
Program (limited entry non-whiting trawl fishery during 2009-10). Source = paper and electronic landing
receipt data (PacFIN and PSMFC, respectively), Annual Catch Report for the Pacific Coast Groundfish,
Shorebased IFQ Program in 2012, Matson 2013.
Vessel Accounts
75
The following license data and catch monitor plans do not include landings to determine if
first receivers have actually received landings (or what type of landings) while they were
licensed:
2011: 152 vessel accounts; 110 made IFQ landings
2012: 166 vessel accounts (total, but not all renewed/active); 108 made IFQ landings
2013: 172 vessel accounts (total, but not all renewed/active); 89 made IFQ landings* (note:
this is a low estimate; many vessels come in to fish in September).
3.5.2 Processor Sector
The number of companies that reported having processed fish on the West Coast has increased slightly from 23 companies in 2009, to 25 companies in 2010, and 26 companies in 2011.
First Receivers
The following license data and catch monitor plans do not include landings to determine if
first receivers have actually received landings (or what type of landings) while they were
licensed:
2011: 51 first receivers; 5 whiting; 35 non-whiting; 11 both (whiting and non-whiting)
2012: 55 first receivers; 6 whiting; 38 non-whiting; 11 both (whiting and non-whiting)
2013: 54 first receivers; 6 whiting; 36 non-whiting; 12 both (whiting and non-whiting)* (note:
this is a low estimate; many vessels come in to fish in September).
3.5.3 Communities
Federally managed Pacific groundfish fisheries occurring within the EEZ off the coasts of
Washington, Oregon, and California establish the geographic context for the proposed action.
West coast communities engaged in these fisheries are also part of the context (Figure 3-26).
Although this is the Federal action area, the states manage the fisheries in the territorial sea to
meet the goals and objectives of the Pacific Groundfish FMP. At some level, when access to
healthy stocks is limited, communities are impacted (2013-2014 FEIS). The amount of
allowable canary bycatch has socioeconomic impacts to fishing communities dependent on
the shelf trawl fishery (i.e., shoreward of the RCA), (2013-2014 FEIS). Fishing communities
are described in terms of the port groups used in the IO Pac model (2013-2014 FEIS).
Community characteristics have been thoroughly investigated in the 2007-2008, 2011-2012,
and 2013-2014 FEISs.

76
Figure 3-26: The action area, showing major coastal communities and management areas (2013-2014
FEIS).
Chapter 1: Introduction
2013-14 Groundfish Harvest Specifications FEIS 4 September 2012
Figure 1-1.The action area, showing major coastal communities and groundfish management areas.
#Y
#Y
#Y
#Y #Y
#Y
#Y
#Y #Y#Y
#Y
#Y
#Y
#Y#Y
#Y
#Y
#Y
#Y
#Y#Y
#Y
#Y
#Y #Y
#Y
#Y
#Y
#Y
#Y
#Y
#Y
#Y
#Y
#Y
#Y
#Y
#Y
#Y
#Y
#Y#Y
#Y
#Y
#Y
#Y
#Y#Y #Y
#Y #Y#Y
#Y
#Y
#Y
#Y
#Y
#Y#Y#Y
#Y
#Y
#Y
#Y
#Y
#Y
#Y
#Y#Y
#Y
#Y
#Y
#Y
#Y
Eureka
Seattle
Olympia
Astoria
Newport
Neah Bay
Westport
Coos Bay
Monterey
Tillamook
Brookings
Morro Bay
San Pedro
Bellingham
Crescent City
Santa Barbara
San Francisco
San Diego
38°00' N
34°27' N
36°00' N
40°10' N40°30' N
43°00' N
47°30' N
Puget Sound
Olympic Peninsula
Cordell Bank
Channel Islands
Point Conception
Point Sur
Point Reyes
Point Arena
Cape Mendocino
Cape Blanco
Hecata Bank
Stonewall Bank
Cape Lookout
Cape Falcon
Destruction I.
CONCEPTION
COLUMBIA
EUREKA
VANCOUVER
Cape Flattery
MONTEREY

77
CHAPTER 4 ENVIRONMENTAL
CONSEQUENCES
A large portion of the RCA that would be opened under the proposed action is already
open to bottom trawling at specific periods during the year, has been opened in the recent
past, or is open to pink shrimp trawling, fixed gear effort, and other fisheries (including
midwater trawling bottom contact events), and non-fisheries related pressures. Therefore,
the action is not expected to cause significant impacts when compared to No-Action. The
portion of the proposed action (alternative 1) that would modify the RCA from a seaward
boundary line between 40° 10' N. lat. and 45° 46' N. latitude approximating 200 fm to a
line approximating 150 fm, during periods 1-6 (note that the modified 200 fm line is
currently in place in periods 1 and 6), would open an area that has been closed to bottom
trawling for a longer period of time (approximately nine years for most of the area).
Fixed gear/longline effort on hard and medium substrate in this area has likely already
impacted this habitat to some extent. Unintentional incursions into the RCA and
groundfish research surveys also have the potential to alter habitat despite the closure.
Although localized effects to physical and biological resources caused by groundfish
bottom trawling would occur under the action alternatives, when the context and intensity
is considered, the impacts are unlikely to be significant. The socioeconomic environment
would likely be beneficially affected to some degree by the proposed action.
4.1 Physical Environment
4.1.1 Physical Oceanography
4.1.1.1 No-action, Alternative 1, and Alternative 2
None of the alternatives are expected have any impacts on physical oceanography
because this proposed action will not affect natural phenomena such as upwelling, the
North Pacific Gyre, Pacific decadal oscillation, global plate tectonics, and climate
change, which are events that will continue to occur autonomously, regardless of
groundfish bottom trawling within the West Coast exclusive economic zone.

78
4.2 West Coast Marine Ecosystems
4.2.1 No-action, Alternative 1, and Alternative 2
None of the alternatives are expected have significant impacts on West Coast marine
ecosystems because this proposed action will not affect the fundamental integrity of food
web linkages, or biodiversity of the California Current in general. Atlantis simulation models quantifying the effects of single fleets such as bottom trawl and fixed gear suggest they primarily have direct impacts on their target and bycatch species, and few indirect effects from these fleets extended through predator-prey links to other parts of the food web (Kaplan et al., 2012). For other biodiversity and ecosystem function, no substantial change from No Action is
expected because the majority of the area proposed to be open has been recently impacted
by a combination of non-trawl gear, pink shrimp bottom trawl activity, and the
groundfish bottom trawl fisheries and research. Any impacts to ecosystem function and
biodiversity under both action alternatives 1 and 2 are anticipated to be minimal and
similar to No-Action.
4.3 Essential Fish Habitat
Fish and other species rely on habitat characteristics to support primary ecological
functions comprising spawning, breeding, feeding, and growth to maturity. Important
secondary functions that may form part of one or more of these primary functions include
migration and shelter. Most habitats provide only a subset of these functions. The type of
habitat available, its attributes, and its functions are important to species productivity and
the maintenance of healthy ecosystems. While we know that marine organisms require
habitat, the relationship of habitat to population dynamics or ecological function is poorly
understood.
Bottom trawling for groundfish is managed under the Pacific groundfish FMP. Fishing
effects are generally limited to (1) removal of prey species, (2) direct removal of adult
and juvenile groundfish, (3) contact with the bottom, and (4) effects resulting from loss of
trawl gear, potentially resulting in impacts to bottom habitats and ghost fishing.
Specific offshore habitat types have been identified as ones most likely to be potentially
negatively affected with implementation of any of the action alternatives compared to the
No Action Alternative. These are discussed and analyzed in following sections.
4.3.1 No-action
Under the no-action alternative, impacts to groundfish EFH are not expected to change
from the impacts that have been occurring in recent years.
All of the areas currently closed to groundfish bottom trawl gear would remain closed to
vessels fishing with groundfish bottom trawl gear. This includes areas that have been
closed to groundfish bottom trawling for long periods of time. Benthic habitat in areas
79
that have been closed for extended periods of time are more likely to have recovered, to
some extent, from impacts from groundfish bottom trawling that occurred in this area
before the trawl RCA was implemented. However, other marine activities (e.g. pink
shrimp trawling) are allowed inside the trawl RCA. Those activities, where they occur,
could hinder recovery of benthic habitat, despite the overlapping trawl RCA closure. No-
Action would not change the relative benefits of the trawl RCA closure to benthic
habitats, or change the relative negative impacts to benthic habitats from other marine
activities. If all of the areas currently open to groundfish bottom trawl gear remain open
to fishing with groundfish bottom trawl gear, recovery of benthic habitat in those areas
will continue to be hindered.
Specifically, the No-Action alternative would maintain trawl RCA boundaries of either
75fm-200fm or 100fm-150fm depending on the time of year. Groundfish bottom trawling
would continue to be prohibited inside the trawl RCA, and effort would continue to be
limited to areas seaward and shoreward of the trawl RCA. Under the No Action
alternative, shoreward effort would likely continue to be concentrated in depths of 75fm-
100fm between 42°N. lat. and 48°N. lat. (Figure 3-12). Under the No Action alternative,
seaward effort would likely continue to be concentrated in depths of 175 fm-375fm
(Figure 3-12). In the areas that have been open, regardless of substrate type, it is
unlikely that there has been sufficient time for recovery because impacts of the
groundfish bottom trawl fishery are ongoing in these areas. The No-Action alternative is
not anticipated to change impacts to groundfish EFH of other marine activities that occur
in the action area, including; fixed gear fishing for groundfish; pot fishing for groundfish;
bottom trawling for pink shrimp; and bottom trawl surveys.
Fixed gear fishing for groundfish would continue to access mixed and hard substrate
areas that may be untrawlable. Groundfish fishing with fixed gear would continue to be
concentrated in depths between 100fm-225fm, between 42°N. lat. and the U.S.-Canada
border (Figure 3-14). Pot fishing for groundfish can access mixed and hard substrate
areas that may be untrawlable. Groundfish fishing with pot gear is concentrated in depths
between 125fm-250fm, between 43°N. lat. and 47°N. lat. Therefore, fixed gear and pot
gear fishing for groundfish would continue to be concentrated, in part, in the areas that
are closed by the trawl RCA under the No-Action alternative.
Bottom trawling for pink shrimp would continue to be concentrated in depths between
50fm-125fm between 41°N. lat. and 48°N. lat. Most of the pink shrimp bottom trawl
effort occurs shoreward of the trawl RCA, but some effort does occur deeper than 75 fm
and 100fm. Bottom trawling in the groundfish surveys would continue as they have since
2003 under the No-Action alternative; survey tows would occur throughout the trawlable
habitat inside the trawl RCA with the location selected at random. Therefore, some
benthic habitats remaining closed under the No Action alternative would continue to be
impacted by pink shrimp bottom trawl gear and the groundfish bottom trawl survey.
There have been few attempts to quantitatively estimate the effects of particular gear
types on a broad suite of ecosystem attributes and to understand how those effects
interact (Kaplan et al., 2012). However, a spatial evaluation of the effectiveness of

80
management measures examined bottom trawl vessel logbook data to conduct a
quantitative analysis of the changes in the spatial distribution of trawl fishing effort that
resulted from the new management approach enacted in 2000 (Hannah, 2008). The
results of that evaluation determined that footrope restrictions, in combination have had a
substantial effect in reducing rockfish bycatch. No changes to gear restrictions are
considered as part of this proposed action; therefore, the differential impacts of bottom
trawl gear footrope size and other aspects of gear configurations are not anticipated to
vary between any of the alternatives.
Therefore, the No-Action alternative is not expected change current groundfish fishery
effects on groundfish EFH.
4.3.2 Alternative 1
Alternative 1 is anticipated to have a slightly higher degree of potential impact (in terms
of substrate recovery rates) on EFH as described in the EFH EIS, EFH five year review,
and EFH synthesis documents. Certainly, bottom trawling dramatically reduces the
diversity of some kinds of habitat, particularly corals, but in other habitats, such as mud
and sand bottoms, the impact on ecosystem structure and function is much less (Hilborn,
2007). Some areas that have been closed for long periods of time may have had a chance
for benthic habitat recovery. The seaward area between the 150 fm and the modified 200
fm lines between 40° 10’ N. lat. to 45° 03’ N. lat. has not been trawled by commercial
groundfish bottom trawl gear since October 2004. This depth range between 45° 03’ N.
lat. to 45° 46’ N. lat. has not been trawled by commercial groundfish bottom trawl gear
since August 2007.
Alternative 1 would open these areas to commercial groundfish bottom trawling.
Therefore, impacts to groundfish EFH under Alternative 1 are expected to be greater than
the no-action alternative, or Alternative 2. However, no significant impacts to soft,
mixed, or hard benthic habitats, or to the continued existence of non-structure forming
benthic invertebrate species such as sponges, corals, and sea whips are expected under
this alternative, when taking into consideration the broader untrawlable habitat EFH in
the marine environment of the California Current within the West Coast EEZ that will
continue to provide a natural refuge for sensitive species and habitats. It is expected that
impacts to benthic species such as coral, sponges, and sea whip colonies have already
largely occurred within trawlable fishing grounds, particularly in the height of bottom
trawl effort between 1980 to 2000, since some coral species may live up to 100 years.
The possibility that some trawlable areas may have escaped impact from higher effort
prior to 2000 may exist, although it is expected that these areas are less trawlable with
modern gear restrictions, and these sensitive areas will largely remain untrawled from
historical effort (prior to RCA closures). Mitigation of a closed area should be carefully
weighed against the potential for redistribution of fishing effort (Bellman et al, 2005). To
the extent that virgin coral or sponge may be impacted by this action, no significant
impacts are expected, considering the broader EFH conservation areas remaining within
the marine environment of the California Current within the West Coast EEZ.
Additionally, these areas are open to groundfish fixed gear (longline, pot) and non-

81
groundfish pot gear. Some research (Baer et al., 2010) found that bottom longlines can
cause significant damage to sensitive habitats through entanglement, and ROV research
surveys have observed fixed gear impacts on sensitive coral and sponge species
(Brancato et al, 2007). Fixed gear vessels may target mixed and hard substrate areas
seaward of 100 fm with some frequency of impact, as fish target species accessible to
fixed gear types, particularly on untrawlable grounds.
Given that bottom trawlers will likely seek to avoid untrawlable fishing grounds, bottom
trawl activity in the most sensitive areas, even those that have not been trawled since
October 2004, are not likely to incur any significant impacts. Effects to biological and
physical resources from the proposed action alternatives (1&2) are not anticipated to
involve unique or unknown risks because the actions are likely to redistribute some
existing trawl effort, with expected similar impacts to other areas that have been trawled
in the past. To the extent liberalized RCA configurations result in more dispersed effort
over a larger area, intensity of localized effects could be reduced. Although unlikely, it is
possible that some large coral or sponge species have survived many years of targeting
effort in nearshore, shelf, and slope substrates before regulatory changes to rockfish trip
limits coupled with footrope restriction, and RCAs (trawl and non-trawl) in prime
trawlable habitat near mixed or hard substrates. It is also feasible that even with footrope
restrictions, rare encounters with hard or boulder/mixed habitat may occur.
The shoreward area from 40° 10’ N. lat. to 48° 10’ N. lat., 75 fm to 100 fm is not
expected to have recovered, as these areas are being trawled throughout much of the year
by pink shrimp trawl gear and groundfish bottom trawl gear throughout portions of each
year under No-action activities.
4.3.3 Alternative 2
Under Alternative 2, effects on habitat are both predicted to be inconsequential, as
commercial groundfish bottom trawling already occurs within the shoreward area (75-
100 fm) between 40° 10’ N. lat. to 48° 10’ N. lat., and the seaward area (150-m200 fm)
between 45° 46’ N. lat. to 48° 10’ N. lat. at some point in the year (including the area
trawled within modified petrale cutouts). Therefore, impacts are expected to be similar
between no-action and alternative 2.
As described in chapter 3, some of the areas that would be opened under alternative 1
would allow trawling in an area that has been closed since 2004, and to a lesser extent,
2007, but these areas would remain closed under this proposed Alternative. It is possible
that increases in the spatial extent of the RCA could result in increased fishing intensity
in other areas due to displaced fishing effort (2013-2014 FEIS). However, with this
proposed action reducing the size of the RCA could potentially moderate fishing intensity
in other areas as existing effort distributes, potentially diluting the impact to currently
open areas. Some reductions in fleet size are also expected in the coming years
(potentially aided in part from further quota share trading options that will be allowed as
of January 1, 2014).

82
The liberalized RCA structure proposed in alternatives 1 and 2 would allow trawling in
areas with benthic substrate and habitat characteristics typical of areas currently subject
to trawl effort. Alternative 2, would maintain a temporary closure between 40 10’ N.
latitude and 45 46’ N. latitude, from 150 to m200 fm.
Effects to biological and physical resources from the proposed action alternatives (1&2)
are not anticipated to involve unique or unknown risks because the actions are likely to
redistribute some existing trawl effort, with expected similar impacts to other areas that
have been trawled in the past. To the extent liberalized RCA configurations result in
more dispersed effort over a larger area, intensity of localized effects could be reduced.
Although unlikely, it is possible that some large coral or sponge species have survived
many years of targeting effort in nearshore, shelf, and slope substrates before regulatory
changes to rockfish trip limits coupled with footrope restriction, and RCAs (trawl and
non-trawl) in prime trawlable habitat near mixed or hard substrates. It is also feasible
that even with footrope restrictions, rare encounters with hard or boulder/mixed habitat
may occur.
Areas that have been closed to commercial groundfish bottom trawl gear for a long
period of time may have had a chance for benthic habitat recovery. Alternative 2 will
keep those areas closed; therefore, only marginally increased impacts to EFH are
expected compared to the no-action alternative, specifically in the seaward area from 40°
10’ N. lat. to 45° 46’ N. lat., 150 fm to m200 fm.
No significant impacts to soft, mixed, or hard benthic habitats, or to benthic invertebrates
sponges, corals, and sea whips are expected under this alternative, especially when taking
into consideration that these species will continue benefit from untrawlable refuges
within the marine environment of the California Current within the West Coast EEZ. It is
expected that impacts to coral, sponges, and sea whip colonies have already occurred
within trawlable fishing grounds, particularly in the height of bottom trawl effort between
1980 to 2000, since some coral species may live up to 100 years. The possibility that
some trawlable areas may have escaped impact from higher effort prior to 2000 may
exist, although it is expected that these areas are less trawlable with gear restrictions, and
these areas will largely remain untrawled. To the extent that virgin coral or sponge may
be impacted by this action, no significant impacts are expected, especially when taking
into consideration the broader EFH within the marine environment of the California
Current within the West Coast EEZ. Given that bottom trawlers will likely seek to avoid
untrawlable fishing grounds, bottom trawl activity in the most sensitive areas are not
likely to incure any significant impacts.
The shoreward area from 40° 10’ N. lat. to 48° 10’ N. lat., 75 fm to 100 fm is not
expected to have recovered, as these areas are being trawled throughout much of the year
by pink shrimp trawl gear and groundfish bottom trawl gear throughout portions of each
year under No-action activities.

83
4.4 Biological Resources
The No-action, Alternative 1, and Alternative 2 proposed actions are not anticipated to have any substantial effect on biological resources in the nearshore, shelf, and slope regions of the California Current Ecosystem. Many heavily trawled regions of the world, particularly in areas where there is an abundance of soft substrate, continue to demonstrate record biomass abundance of target species. To the extent that the alternatives under consideration affect target and non-target species, these species will continue to be managed conservatively. Additionally, annual catch limits are established through the biennial harvest specifications and management measures. Under the Shorebased IFQ Program all catch of IFQ species (retained or discarded), including vessels using groundfish bottom trawl gear, must be covered by quota pounds. Fishermen are individually accountable for their catch of individual species (or species within a stock complex), and are subject to a 100 percent monitoring requirement. Non-IFQ species are managed by groundfish trip limits. Therefore, the proposed action is not expected to impact the sustainability of any target or non-target species.
4.4.1 Groundfish Target Species
4.4.1.1 No-action,
All of the alternatives, including No-Action, would continue to allow the targeting of
groundfish in the shorebased trawl IFQ program with 100 percent observer coverage and
100 percent dockside monitoring, with all catch of IFQ species required to be covered by
quota pounds. The amount of quota pounds available each year is a result of the
allocations established through the FMP and the 2013-2014 harvest specifications and
management measures. The harvest specifications, including annual catch limits (ACLs),
are established based on the best scientific information available about stock status and
would not change as result of the proposed action. Under all of the alternatives,
including the No Action alternative, the groundfish bottom trawl fleet would continue to
be held to individual accountability from the IFQ program, which after two years of
successful implementation has demonstrated that quota pounds can be managed within
IFQ sector allocations and ACLs for target species.
With the poor sablefish market of the past two years (although still the most valuable
species per pound in the fishery), and continued reduction in the northern sablefish ACL,
there is evidence that fishermen have shifted some effort to other target species to
compensate (Annual Catch Report for the Pacific Coast Groundfish, Shorebased IFQ
Program in 2012, Agenda Item D.2.a, April, 2013 PFMC meeting). Either Alternative 1
or 2 could make such a shift easier for fishers, according to the species cited in industry
rationale (bycatch analysis section). There were increases in revenue from species such as
yellowtail rockfish, Pacific cod, petrale sole, lingcod, and Dover sole from 2011 to 2012

84
in the IFQ program, together with a substantial drop in sablefish revenue (Annual Catch
Report for the Pacific Coast Groundfish, Shorebased IFQ Program in 2012, Agenda Item
D.2.a, April, 2013 PFMC meeting). These species were cited as targets in the areas
requested for opening by industry (bycatch analysis section).
In those southern ports, fishermen could still fish the seaward area between 150 and 200
fm using fixed gear, under the gear switching provision of IFQ regardless of this potential
action. If the area is not opened to trawling, it is conceivable that fishermen may do so, to
access some of the higher value targets that are often landed with fixed gear such as
lingcod, sablefish, and Pacific cod (these species were cited in industry rationale). Given
sufficient motivation to diversify their catch among species, it is conceivable that effort in
the seaward area (150-200 fm, 40°10’ to 45°46’) could increase by use of fixed gear
rather than trawl gear, even without the implementation of Alternative 2, under gear
switching provisions in the IFQ program, especially upon recovery of sablefish markets
and ex-vessel prices. However, this is speculative.
Impacts to target species under the no-action alternative are expected to continue in a similar manner to what has been seen since the implementation of the Shorebased IFQ Program in 2011. Vessels will continue efforts to maximize their harvest of target species quota pounds, and keep their bycatch of overfished species low. Additionally, beginning in 2014, quota shares will become transferrable and this might promote higher utilization of target species quota pounds. Specifically, access to lingcod, sanddabs, yellowtail rockfish and Pacific cod in the nearshore and shelf areas could continue to be somewhat limited by the shoreward boundary of the trawl RCA remaining at the 75 fm line for some parts of the year under the No Action alternative. Access to petrale sole, English sole, Dover sole, sablefish and thornyheads in the shelf and slope areas continue to be somewhat limited by the seaward boundary of the trawl RCA remaining at the 200 fm line for some parts of the year under the No Action alternative. If no new areas are opened to allow bottom trawling for IFQ species, fishermen that feel most affected may have increased incentives to sell their quota, or perhaps even switch to non-trawl gears to harvest their IFQ under the Shorebased IFQ Programs gear switching provisions. Vessels harvesting IFQ using non-trawl gears can currently fish seaward of the 100 fm line; in areas that would remain closed to bottom trawling under the No Action alternative. However, the extent of the motivation for these types of changes in behavior is unknown.
4.4.1.2 Alternative 1
The most likely potential impacts to target species under the action alternatives are higher attainment of the trawl allocation. Levels of attainment of the trawl allocation for target groundfish species would likely be highest for Alternative 1. Alternative 1 is likely to increase attainment of prominent species such as English sole, lingcod, Pacific cod, Pacific sanddabs, yellowtail rockfish, rex sole, and other

85
target species including the dover, thornyhead, sole (DTS) complex. Shortspine
thornyhead would not be adversely affected by losses in biogenic structures such as
sponges and corals and could even concentrate in areas of localized trawling or areas of
low biogenic structure density (Du Preez & Tunnicliffe, 2011). Greater access to fishing
grounds should increase benefit to the nation for food supply. When considering trawl
RCAs, it may also be worthwhile to consider the larger volume and greater diversity of
healthy groundfish stocks that can be intercepted uniquely by bottom trawl gear. Bottom
trawl gear is able to intercept a wide variety of healthy species, (mostly various flatfish)
which are encountered less commonly using all other well-tested groundfish gear types.
Figure 4-1 (below) illustrates volume of fish landed on the west coast in 2011 (under the
no-action alternative), bottom trawl gear landed catch (17,232 mt) was substantially
higher than that seen with fixed gear groundfish gears (1,188 mt). Table 4-1 illustrates
the estimated substrate miles (by substate type that would be accessed to bottom trawl
fishing gear year round under Alternative 1 (3,042 sq. mi.), most of which is still open to
bottom trawling activity at different periods throughout the year. In addition, this
alternative would maintain 1,374 square miles of trawl RCA closed to bottom trawling
(Table 4-2).
Figure 4-1. 2011 Fixed gear (longline and pot) groundfish landings and non-groundfish whiting trawl total
landings (mt). Fixed Gear Source: 2011 TM report.
0
5,000
10,000
15,000
20,000
Fixed Gear (LL +Pot) Non-Whiting Trawl
2011 Total Groundfish Landings (mt)
Alternative1,EstimatedSubstrateSquareMiles(notincludingEFH/GCA)
75-100fm 150-200fm Total
Soft 1882 885 2767
Mixed 63 36 99
Hard 144 32 176Total 2089 953 3042

86
Table 4-1: Estimated Substrate Square Miles within Alternative 1. Note: the majority of this area is
already open throughout much of the year under the No-action Alternative.
Table 4-2: Estimated Substrate Square Miles maintained as Rockfish Conservation Areas under
Alternative 1
4.4.1.3 Alternative 2
The most likely potential impacts to target species under the action alternatives are higher attainment of the trawl allocation than would be expected under the no-action alternative. Alternative 2 opens some areas that have been intermittently closed, but not as much new areas as Alternative 1. Impacts to target species under Alternative 2 are anticipated to be similar to that described in Alternative 1, although to a lesser degree because depths between 150 fm and m200 fm would remain closed between 45°46’ N. lat. and 40°10’ N. lat.
4.4.2 Non-target Species, Including Overfished Groundfish
Since 2002 NMFS has used large-scale, depth-based, RCA closures to reduce catch of
overfished rockfish in fisheries that take and retain groundfish, directing harvest of
healthy stocks to areas that remained open.
4.4.2.1 Overfished Species
No Action Over the history of RCAs, inseason changes to their boundaries have been made
frequently, with accompanying analysis, to enable catch of target species, while at the
same time, keeping bycatch of rebuilding stocks within established catch limits to
facilitate timely rebuilding. Under the No Action alternative, the RCAs are anticipated to
keep bycatch of rebuilding stocks lower then Alternative 1 or Alternative 2.
Under all of the Alternatives, including the No-Action alternative, the advent of precise,
near real-time data in the NMFS Vessel Account System, with which NMFS and the
Council can both stay informed of daily changes in catch and attainment is also a tool that
was not available under the previous trawl management regime. These important changes
under trawl rationalization make all of the Alternatives a relatively low risk proposition
to ACL accountability and rebuilding.
100-150fm
Soft 1289
Mixed 47
Hard 38
Total 1374

87
Alternative 1 To assess the potential impacts of Alternative 1 on overfished groundfish species, NMFS
undertook an analysis of fishery-dependent, weighted average, annual trawl bycatch
rates, calculated from a combination of logbook, fish ticket, and observer data from five
years previous to trawl rationalization. That analysis indicates that the probability of
encountering canary rockfish, darkblotched rockfish, and Pacific ocean perch will likely
be higher than under the No Action Alternative.
However, analysis of post-rationalization haul-level observer data, as well as aggregate
total catch data from the two years before and the two years after trawl rationalization
does not suggest any obvious danger of either extreme catch events, or accumulated
aggregate high catch of rebuilding species that would exceed the trawl allocation,
compared to the No Action alternative. For example, during 2011 the largest hauls of
canary rockfish, and darkblotched rockfish, both traditionally strong limiting influences
on attainment of target species in the trawl fishery, were just 1.21 percent, and 0.84
percent of each of their annual trawl allocations, respectively. Also, under the No Action
alternative, several liberalizing changes to the trawl RCA have already been made since
2011 without conservation incident, under IFQ, and catch of rebuilding species remains
much lower than during comparable pre-IFQ years.
Analysis of fishery-dependent, weighted average, annual trawl bycatch rates, calculated
from a combination of logbook, fish ticket, and observer data from five years previous to
trawl rationalization, indicates that the probability of encountering canary rockfish,
darkblotched rockfish, and Pacific ocean perch will likely be higher than if the status quo
shoreward boundary remained in place. However, analysis of post-rationalization haul-
level observer data, as well as aggregate total catch data from the two years before and
the two years after trawl rationalization does not suggest any obvious danger of either
extreme catch events, or accumulated aggregate high catch of rebuilding species that
would exceed the trawl allocation, by adopting proposed changes to the RCA boundaries.
For example, during 2011 the largest hauls of canary rockfish, and darkblotched rockfish,
both traditionally strong limiting influences on attainment of target species in the trawl
fishery, were just 1.21 percent, and 0.84 percent of each of their annual trawl allocations,
respectively. Also, several liberalizing changes to the trawl RCA have already been made
since 2011 without conservation incident, under IFQ, and catch of rebuilding species
remains much lower than during comparable pre-IFQ years.
Analysis of annual trawl bycatch rates (fishery-dependent, weighted average annual rates
calculated from a combination of logbook, fish ticket, and observer data from five years
previous to trawl rationalization), indicates that the probability of encountering canary
rockfish (a main limiting bycatch species on the shoreward side) and darkblotched
rockfish (historically, a primary limiting bycatch species on the seaward side), and
Pacific ocean perch (another limiting bycatch species on the seaward side) will likely be
higher than if the status quo boundaries remained in place.
However, analysis of post-rationalization haul-level observer data, as well as aggregate
total catch data from the two years before and the two years after trawl rationalization

88
does not suggest any obvious danger from either extreme catch events, or accumulated
aggregate high catch of rebuilding species that would exceed the trawl allocation, as a
result of making the proposed changes to the RCA boundaries. For example, during 2011,
the largest hauls of canary rockfish, and darkblotched rockfish, both traditionally strong
limiting influences on attainment of target species in the trawl fishery, were just 1.21
percent, and 0.84 percent of each of their annual trawl allocations, respectively. The most
recent annual attainment rates available for these same species (in 2012) were quite low
at 28 percent and 36 percent respectively.
Given the results of the bycatch analysis, consideration of change of management style
from cumulative landing limits to IFQ, the precise individual accountability that this new
management brings, and the continued availability of accountability measures under the
new system, Alternative 1 should pose little risk to rebuilding species by way of
individual fishers staying within their allocations, and the IFQ program staying within the
trawl allocations of rebuilding species. Alternative 1 should provide additional fishing
opportunity for valuable target species, with little conservation risk to rebuilding stocks
of groundfish.
Attainment of rebuilding species was low under IFQ management in 2011 (Agenda Item
F.6.b, Supplemental NMFS Report: West Coast Groundfish IFQ Fishery Catch Summary
for 2011: First Look), at 14 percent, 36 percent, 39 percent and 10 percent respectively. It
was also low during 2012, after other shoreward and seaward line changes to the trawl
RCA were made during 2011 and early 2012. Attainment rates for these same species in
2012 were: 28 percent, 36 percent, 45 percent and 6 percent, respectively (Agenda Item
D.2.a, April, 2013 PFMC meeting, Annual Catch Report for the Pacific Coast
Groundfish, Shorebased IFQ Program in 2012). Total catch of currently rebuilding
species under IFQ was lower in 2011 than 2010 (pre-IFQ management).
Although catch and attainment has increased for rebuilding species between 2011 and
2012, attainment of all rebuilding species (except petrale sole, which is managed as a
target species under the rebuilding program) is well below the sector allocation, after two
years of IFQ management; average annual total catch of these rebuilding species is
substantially lower for 2011 and 2012 than 2009 and 2010 (Figure 4-6, Table 4-4).
Analysis We analyzed three different data sets to gain insight into the potential effects of the
proposed RCA boundary change on catch of rebuilding rockfish species: 1) Historical
time-weighted average bycatch rates for rebuilding stocks. These latitude and depth-
specific bycatch rates were derived from a combination of trawl logbooks and landings,
both from the Pacific Fisheries Information Network (PacFIN) database, as well as
observer data from the West Coast Groundfish Observer Program (WCGOP) of the
NMFS Northwest Fishery Science Center (NWFSC), which covered the years 2006
through 2010. These data cover years before trawl rationalization, and were previously
used as inputs for the trawl bycatch forecasting model, the primary tool for management
of the groundfish bottom trawl fishery before IFQ management began in 2011. 2) The
second data set consisted of total catch and attainment data for rebuilding stocks in the

89
limited entry trawl sector, for two years before IFQ management, during 2009 and 2010,
and the first two years of IFQ management, in 2011 and 2012; these historical total catch
data were provided by WCGOP. Total catch data from the NMFS IFQ Vessel Accounts
System were used for the first two years of IFQ management (2011 and 2012), in
conjunction with the comparable WCGOP catch data. 3) Finally, the third data set was
haul-level catch data from the IFQ program during 2011, from WCGOP. The 2011
fishing year was the most recent available at the time of this analysis. The 2012 haul-
level data set will only be available in November of 2013.
We examined time-weighted average bycatch rates prior to rationalization from WCGOP,
from 2006 to 2010, (Figure 4-2), which show increased bycatch rates of primarily canary
rockfish, followed by darkblotched rockfish and Pacific ocean perch, in the area
shoreward of 100 fm, versus the area shoreward of 75 fm; for yelloweye rockfish, the
estimated bycatch rate is lower for the action alternatives. These data indicate that if the
shoreward RCA were moved from 75 fm to 100 fm during periods 1, 2, and 6 of 2013
(Alternatives 1 and 2), that the probability of encountering canary rockfish, darkblotched
rockfish, and Pacific ocean perch will likely be higher than under the No Action
shoreward boundaries (Figure 4-3). Canary rockfish shows the largest change is historical
bycatch rates on the shoreward side of the RCA. Canary rockfish is both distributed and
managed as a rebuilding stock coastwide, including the area between 40°10’ and 48°10’
(PFMC SAFE 2008, Figure 4-3).
Similarly, if the seaward boundary was moved from the status quo configuration (Table 2-1) to the 150 fathom boundary year-round (under Alternative 1, Table 2-2), the
probability of encountering darkblotched rockfish and POP would be higher (Figure 4-2,
Table 4-3). For the proposed seaward boundary moves, the data are shown in three strata,
according to season. These bycatch rates were available for major existing management
areas only (i.e. from 40°10’ to 48°10’, 36° to 40°10’, and 34°27’ to 36° N. lat. Thus, the
finer stratification necessary for a specific quantitative analysis of Alternative 2 was not
possible using the currently available data. Thus, it is discussed in comparison with
Alternative 1.

90
Figure 4-2 : Comparison of historical time-weighted average annual bycatch rates of rebuilding species (2006-2010, prior to trawl rationalization), under the current RCA configuration (No Action), versus the proposed configuration (Alternative 1), for the area between 40°10’ and 48°10’ N. lat., during the seasons listed. A substantial difference in historical bycatch rates is indicated for canary rockfish with movement of the shoreward boundary, and for the seaward boundary, the largest absolute differences in bycatch rates are seen for darkblotched rockfish, and less so for Pacific ocean perch.

91
Table 4-3: Historical time-weighted average annual bycatch rates of rebuilding species (2006-2010, prior to trawl rationalization), under the current RCA configuration (No Action), versus the proposed configuration (Alternative 1), for the area between 40°10’ and 48°10’ N. lat., during the seasons listed. A substantial difference in historical bycatch rates is indicated for canary rockfish with change in the shoreward boundary, and for the proposed seaward boundary change, the largest differences in bycatch rates are seen for darkblotched rockfish. The “proposed-current” field indicates the subtractive change in bycatch rate between areas (e.g. <100fm rate, minus <75fm rate).
a) Shoreward, November-April (periods 1,2,6)
Species Current <75 fm
Proposed <100 fm
Proposed - current
Canary rockfish 0.3400% 2.7210% 2.3810%
Darkblotched rockfish 0.0496% 0.0793% 0.0297%
Pacific ocean perch 0.0005% 0.1509% 0.1504%
Yelloweye rockfish 0.0105% 0.0063% -0.0042%
b) Seaward, average seasonal bycatch rates and standard deviation among seasonal rate estimates.
Species Current >200 fm
S.D. >200 fm
Proposed >150 fm
S.D. >150 fm
Proposed - current
Canary rockfish 0.0021% 0.0020% 0.0022% 0.0015% 0.0001%
Darkblotched rockfish 0.7815% 0.1811% 1.2284% 0.4451% 0.4470%
Pacific ocean perch 0.3830% 0.0860% 0.7203% 0.0914% 0.3374%
Yelloweye rockfish 0.00013% 0.00006% 0.00027% 0.00025% 0.00013%

92
Figure 4-3. Spatial distribution of canary rockfish survey catch (2003-2012), from 40°10’ to 48°10’ N. lat.
Data source: NWFSC Groundfish Bottom Trawl Survey.

93
Figure 4-4. Spatial distribution of darkblotched rockfish survey catch (2003-2012), from 40°10’ to 48°10’
N. lat. Data source: NWFSC Groundfish Bottom Trawl Survey.

94
Figure 4-5. Spatial distribution of Pacific ocean perch rockfish survey catch (2003-2012), from 40°10’ to
48°10’ N. lat. Data source: NWFSC Groundfish Bottom Trawl Survey.

95
Figure 4-6. Total annual catch of rebuilding species from 2009 and 2010, in the limited entry (LE) trawl
and shoreside whiting sectors, as well as 2011 and 2012, in the Shorebased IFQ Program, in metric tons.
Source = WCGOP Groundfish Mortality Report (2009-2010) and the Shorebased IFQ Program, Vessel
Accounts System (2011-2012). The grey, dashed, vertical line separates pre-IFQ years (left) from IFQ
years (right) in this sector. The current IFQ program includes both LE trawl and shoreside whiting sectors.
Taken from Annual Catch Report for the Pacific Coast Groundfish, Shorebased IFQ Program in 2012
(Agenda Item D.2.a, April, 2013 PFMC meeting).

96
Table 4-4: Total annual catch of rebuilding species from 2009 and 2010, in the limited entry trawl and shoreside whiting sectors, as well as 2011 and 2012, in the Shorebased IFQ Program, in metric tons. Two-year average catch, and average annual catch in 2011-12 as a percentage of that of 2009-10 is presented in the far right column (“post/pre IFQ”). Source = WCGOP Groundfish Mortality Report (2009-2010) and the Shorebased IFQ Program, vessel accounts system (2011-2012). The current IFQ program includes both LE trawl and shoreside whiting sectors. Taken from Annual Catch Report for the Pacific Coast Groundfish, Shorebased IFQ Program in 2012 (Agenda Item D.2.a, April, 2013 PFMC meeting).
Species 2009 2010
2009-2010 avg. 2011 2012
2011-2012 avg.
post/ pre %
Yelloweye rockfish 0.11 0.13 0.12 0.06 0.03 0.05 39.3%
Cowcod S. of 40°10' N. 0.45 0.61 0.53 0.02 0.09 0.06 10.4%
Canary rockfish 11.16 6.39 8.78 3.69 7.23 5.46 62.2%
Bocaccio rockfish S. of 40°10' N. 19.71 12.93 16.32 5.31 8.83 7.07 43.3%
Pacific ocean perch N. of 40°10' N. 175.41 136.55 155.98 46.01 53.59 49.80 31.9%
Darkblotched rockfish 272.32 291.84 282.08 90.84 89.64 90.24 32.0%
Petrale sole 1881.91 900.37 1391.14 811.76 1057.54 934.65 67.2%
Observer data
Shoreward boundary On the shoreward side, we focused further analysis on canary rockfish, because it showed
the largest bycatch rate, the largest absolute difference in rates, and because it has been
an important limiting influence on attainment of valuable target species in shallow
waters. We examined observer data from 2011 for canary-positive hauls, by depth and
latitude for inference of likelihood of an extreme catch event (often referred to as a
“disaster tow”), given the available data (Figure 4-7). During 2011, the shoreward trawl
RCA was only at 100 fm during Period 4 (July and August); aside from exceptions in
depth due to RCA line routes; note that Figure 4-2 reflects this. We see that more than 96
percent (575 of 599) hauls shallower than 100 fm yielded less than 50 pounds of canary
rockfish; 98 percent (587 of 599) of hauls shallower than 100 fm were smaller than 100
pounds. Only eleven hauls yielded more than 100 pounds, and the largest one yielded 693
pounds. The average haul weight was 10.94 pounds, minimum was 0.01 pounds, and the
standard deviation was 36.11 pounds.
The largest haul, of 693 pounds was 1.21 percent of the canary rockfish IFQ allocation
(57,100 pounds) in that year, 2011, when the annual IFQ attainment of this species was
14 percent (28 percent in 2012). The distribution of canary rockfish catch by haul depth is
shown in Figure 4-8.

97
Figure 4-7. Relative weights of canary rockfish per haul using trawl gear, north of 40°10’ N. lat.,
shoreward of the RCA, during 2011 under IFQ, plotted versus average haul latitude and average haul depth
(fm); bubble width represents weight of canary rockfish per haul.
Figure 4-8. Distribution of canary rockfish catch by haul depth using trawl gear, north of 40°10’ N. lat.,
shoreward of the RCA, during 2011 in the IFQ fishery.
These data, together with low catch of rebuilding species during the first two years of
IFQ, suggest that the probability of an extreme catch event, or “disaster tow”, i.e. one tow
which would catch enough canary rockfish so that it would lead to exceeding the IFQ
program allocation is relatively low, assuming similar fisher behavior as during 2011 and
2012.

98
The same shoreward boundary change was made for periods 3 through 5 during 2012 at
the March 2012 Council meeting, without a subsequent conservation incident. It is
important to note that the difference in historical canary rockfish bycatch rates between
the area shoreward of 75 fm versus shoreward of 100 fm was smaller for the boundary
change in periods 3 through 5 (Agenda Item F.6.b Supplemental GMT Report, March
2012) than the one currently proposed.
Fishing behavior, and bycatch rates in these areas and time periods, could potentially be
different than those observed during pre-IFQ, or during 2011 the first year of the
program, given the variation in catch among months that was observed for many species
within and between years under IFQ management so far.
Seaward boundary On the seaward side, we focused more closely on darkblotched rockfish because it
showed the largest difference in average bycatch rate from the current to the proposed
boundary, and it has traditionally been a strong limiting influence on access to seaward
target species in the trawl fishery. Although yelloweye rockfish also showed a high
difference in historical bycatch rate between the current and proposed seaward
boundaries, it shows one of the lowest catch rates, and attainment rates in the trawl
fishery, at just six percent of the allocation, in 2012.
We examined observer data from 2011 for darkblotched-positive hauls, by depth and
latitude for inference of likelihood of a “disaster tow”, given the available data (Figure 4-9). During 2011, the seaward trawl RCA was at 150 fm during periods 3-6 (May
through December), for the area between 45°46’ and 48°10’ N. lat.; aside from
exceptions in depth due to RCA line routes; note that Figure 4-4 reflects this. It should
also be noted that during 2011, the seaward boundary was at the modified 200 fathom
line during periods 1 and 2, north of 40°10’ N. lat. as well as during Period 6 (except
between 45°46’ and 48°10’ N. lat., where it was at 150fm). The modified 200 fathom line
is modified to exclude certain petrale sole areas from the RCA, and thus it allows access
in some shallower areas than the regular 200 fathom line.
For darkblotched rockfish, we see that 94.5 percent (2520 of 2667) hauls deeper than 150
fm yielded less than 250 pounds of darkblotched rockfish; 98 percent (2616 of 2667) of
hauls deeper than 150 fm were smaller than 750 pounds. Fifty-one hauls yielded more
than 750 pounds, and the largest one yielded 4641 pounds (0.84 percent of the trawl
allocation, which was 552,997 pounds). During 2011, the total attainment of
darkblotched rockfish in the IFQ program was 36 percent (it was the same in 2012 as
well). The average haul weight was 67.1 pounds, minimum was 0.0003 pounds, and the
standard deviation was 281.20 pounds. The distribution of darkblotched rockfish catch
by haul depth is shown in Figure 4-10.

99
Figure 4-9. Relative weights of darkblotched rockfish per haul using trawl gear, north of 40°10’ N. lat.,
seaward of the RCA, during 2011 under IFQ, plotted versus average haul latitude and average haul depth
(fm); bubble width represents weight of canary rockfish per haul.
Figure 4-10. Distribution of darkblotched rockfish catch by haul depth using trawl gear, north of 40°10’
N. lat., seaward of the RCA, during 2011 in the IFQ fishery.
IFQ management Additionally, the current catch share management system of Individual Fishing Quotas
provides sufficient controls to prevent exceedence of either the trawl allocation or the
Annual Catch Limit (ACL) for trawl-dominant species. This is accomplished by way of
individual accountability of fishers themselves. Typical inseason accountability measures

100
(AMs) still exist, which include inseason adjustment of RCA boundaries as routine
inseason measure
Accountability measures According to groundfish regulations , inseason accountability measures may be taken to
prevent a trawl allocation or ACL from being exceeded, or to mitigate it. Under existing
regulations at 50 CFR 660.140(a)(3), the Shorebased IFQ program may be restricted or
closed as a result of projected overages within the Shorebased IFQ program. Area
restrictions, season closures, or other measures can be used to prevent the shorebased IFQ
sector from exceeding an ACL, OY, ACT or formal allocation. In addition, to prevent
exceeding the ACL for a rebuilding stock such as canary or darkblotched rockfish,
inseason action such as changes to the trawl RCA (e.g. push the seaward trawl RCA out
to 250 fm for the remainder of the year to sharply restrict catch of darkblotched rockfish,
or pull the shoreward trawl RCA into either 75 or 50 fm, or even to the shore, to sharply
restrict catch of canary rockfish), maybe implemented quickly if necessary. 50 CFR
660.60(c). Other accountability measures, such as withholding surplus carryover of a
species to restrict its catch in the coming year, are also available in the IFQ program.
Alternative 2 Under Alternative 2, unlike Alternative 1, the seaward boundary from 45°46’ to 40°10’ N. lat. would be established year-round as the modified 200 fathom. Under Alternative 1, the seaward boundary would also be moved from 40°10’ to 45°46’ N. lat., from the current mix of 200 fathom and modified 200 fathom lines throughout the year, to the 150 fathom line year-round. Thus, one would expect substantially less potential for an increase in bycatch of these two rebuilding species due to implementing Alternative 2 versus Alternative 1; both the area affected by Alternative 2 and the additional time that area would be open relative to No Action are much smaller. The distribution patterns of these slope species are also relevant. Darkblotched rockfish is distributed fairly evenly along the coast, north of 40°10’, with its highest density being concentrated north of 38° N. lat. (PFMC SAFE 2008, Figure 4-4); which also supports Alternative 2 incurring substantially less bycatch of darkblotched than Alternative 1. However, Pacific ocean perch shows a much more northerly distribution pattern within the area between 40°10’ to 48°10’ N. lat., with its highest density north of 42° N. lat. (PFMC SAFE 2008, Figure 4-5). This suggests that Alternative 2, which makes a smaller seaward boundary change from 40°10’ to 45°46’, would show less decrease from Alternative 1, in terms of expected change in bycatch of POP than that of darkblotched rockfish. Alternative 2 includes a much
smaller change to the seaward boundary than Alternative 1, and thus would be expected
to exert substantially less influence on bycatch of slope species on the seaward side. Making the changes according to Alternative 2, which changes the seaward area between
40°10’ and 45°46’ N. lat. to the modified 200 fm line year-round (rather than moving it
to 150 fm) presents even less of a risk in terms of bycatch of slope rockfish rebuilding
species, such as darkblotched rockfish or Pacific ocean perch, than Alternative 1 (moving
boundaries in all areas requested by industry).

101
4.4.2.2 Bycatch of Other Non-target species
There is not anticipated to be a distinguishable difference among the No Action alternative, Alternative 1 and Alternative 2 on bycatch of non-groundfish, non-target species. Under all of the alternatives, the Shorebased IFQ Program will continue to be monitored with 100 percent monitoring requirement. Under either Alternative 1 or Alternative 2, overall fishing effort is not likely to increase or change significantly from No Action. Instead, some dispersal of existing effort is likely. Changes in effort location are difficult to predict but are not anticipated to increase impacts to incidentally caught non-groundfish species.
4.4.3 Invertebrates
4.4.3.1 No-action, Alternative 1, and Alternative 2
Invertebrate richness was less on untrawled bottoms, and a greater diversity of epibenthic
macroinvertebrates was documented in trawled areas (Hixon and Tissot, 2007). Any
impact changes to corals, sponges, or other biogenic habitat are considered as mentioned
as potential EFH considerations (3.3.4 and 4.3).
4.4.4 Protected Species, Including ESA listed species
4.4.4.1 Summary
No significant impacts are expected on listed species or their critical habitat outside of the
scope of what has been analyzed in existing biological opinions. Any encounters by IFQ
vessels will continue to be monitored with 100 percent monitoring requirement of the
IFQ program. Gathered data will be utilized by the Council’s newly forming Endangered
Species Groundfish Workgroup to advise the Council on how to improve avoidance of
protected species. Under the proposed action, overall fishing effort is not likely to
increase or change significantly. Instead, some dispersal of existing effort is likely.
Changes in effort location are difficult to predict, but are not anticipated to increase
impacts to non-target species, including listed species and marine mammals.
4.4.4.2 ESA-Listed Species
The fisheries undertaken under the Pacific coast groundfish FMP are not likely to
jeopardize the continued existence of ESA-listed salmonids in the action area (NMFS
2006, NMFS 2009, NMFS 1999, NMFS 1996, NMFS 1993).
No-action The no-action Alternative is not expected to have substantial negative effects on any
ESA-listed species occurring in the action area. The no-action Alternative would keep the same areas closed to bottom trawling that are currently closed. There would be no redistribution of current fishing effort, therefore impacts to ESA-listed salmonids are not expected to increase above those considered in past biological opinions.

102
Additionally, catch per unit effort is not expected to increase under the no-action alternative, the number of hours bottom trawl gear is deployed would likely remain similar to that in recent years.
Continued operation of the groundfish fishery is not likely to adversely affect ESA-listed
seabirds in the action area (USFWS 2012). Though trawl cables are a possible hazard to
ESA-listed seabirds, no takes have been documented and no reasonable and prudent
measures were recommended for vessels using bottom trawl gear to harvest groundfish in
the 2012 biological opinion (USFWS 2012). The no-action Alternative is not anticipated
to change fishing behaviors such that it would increase chances for interactions with
ESA-listed seabirds. Furthermore, investigations by Guy et al. (2013) suggest that any
seabird interactions with non-whiting bottom trawl groundfish fisheries are rare and not
essential to the survival of rebuilding seabird species.
Continued operation of the groundfish fishery is not likely to adversely affect southern
sea otters (USFWS 2012). The no-action Alternative will likely see a similar potential for
indirect impacts to southern sea otters from recent years, although potentially less that
that under Alternative 1 and 2, as transiting time will be unaffected by keeping areas
closer to shore closed which will not result in a change in boat traffic; the primary
impact, though not a threat, to southern sea otters.
Continued operation of the groundfish fishery is not likely to adversely affect bull trout
(USFWS 2012). The no-action alternative is not anticipated to change fishing behaviors
such that it would increase chances for interactions with bull trout or their designated
critical habitat.
Continued operation of the groundfish fishery is not likely to jeopardize the southern
distinct population segment of eulachon (NMFS 2012). A majority of eulachon
encounters in the groundfish bottom trawl fishery occur off Oregon. The no-action
alternative is not anticipated to change fishing behaviors such that it would increase
chances for interactions with eulachon but is instead anticipated to experience similar
impacts as the current fishing effort in recent years.
Continued operation of the groundfish fishery is not likely to jeopardize the southern
distinct population segment of green sturgeon or adversely modify their designated
critical habitat (NMFS 2012). The no-action alternative is not anticipated to change
fishing behaviors such that it would increase chances for interactions with green sturgeon
or their designated critical habitat. The no-action Alternative is not anticipated to displace
and redistribute current fishing effort.
Continued operation of the groundfish fishery is not likely to jeopardize humpback
whales (NMFS 2012). Under the no-action Alternative the groundfish bottom trawl
fishery should not vary from what has been seen in the recent past and no increased risk
to humpback whales is anticipated.

103
Continued operation of the groundfish fishery is not likely to jeopardize leatherback sea
turtles or adversely modify their designated critical habitat (NMFS 2012). The no-action
alternative is not anticipated to change fishing behaviors such that it would increase
chances for interactions with leatherback sea turtles or their designated critical habitat.
The no-action Alternative is not anticipated to displace or redistribute current fishing
effort.
At their September 2012 meeting, formation of a West Coast Endangered Species
Workgroup was explored and recommended by the Council. Further improvements in
data collection for ESA-listed species will be recommended and continually updated
upon formation of this workgroup, including from WCGOP 100 percent monitored trawl
rationalization data.
Alternative 1, and Alternative 2 Neither of the action alternatives (1 or 2) are expected to have substantial negative effects
on any ESA-listed species occurring in the action area.
Alternative 1 would open areas to bottom trawling that have been fairly consistently
closed since 2004. However, it is unlikely that the redistribution of current fishing effort
under either alternative will cause impacts to ESA-listed salmonids to increase above
those considered in past biological opinions. Additionally, if catch per unit effort is
increased under either of the action altenratives, the number of hours bottom trawl gear is
deployed could decrease, lowering impacts to ESA listed salmonids. Alternative 1 could
see slightly higher catch per unit effort than Alternative 2 because it opens additional
fishing areas.
Continued operation of the groundfish fishery is not likely to adversely affect ESA-listed
seabirds in the action area (USFWS 2012). Though trawl cables are a possible hazard to
ESA-listed seabirds, no takes have been documented and no reasonable and prudent
measures were recommended for vessels using bottom trawl gear to harvest groundfish in
the 2012 biological opinion (USFWS 2012). Neither of the alternatives is anticipated to
change fishing behaviors such that it would increase chances for interactions with ESA-
listed seabirds. Furthermore, investigations by Guy et al. (2013) suggest that any seabird
interactions with non-whiting bottom trawl groundfish fisheries are rare and not essential
to the survival of rebuilding seabird species.
Continued operation of the groundfish fishery is not likely to adversely affect southern
sea otters (USFWS 2012). Alternative 1 may actually reduce the potential for indirect
impacts to southern sea otters, as reductions in transiting time by opening areas closer to
shore may result in a net decrease in boat traffic; the primary impact, though not a threat,
to southern sea otters. Alternative 2 may also result in a small net decrease in boat traffic,
but to a lesser effect than Alternative 1 compared to No-Action.
Continued operation of the groundfish fishery is not likely to adversely affect bull trout
(USFWS 2012). Neither of the alternatives is anticipated to change fishing behaviors
such that it would increase chances for interactions with bull trout or their designated
critical habitat compared to No-Action.

104
Continued operation of the groundfish fishery is not likely to jeopardize the southern
distinct population segment of eulachon (NMFS 2012). A majority of eulachon
encounters in the groundfish bottom trawl fishery occur off Oregon. Alternative 1 would
open additional areas to bottom trawling off the entire Oregon coast. Alternative 2 would
open additional shoreward areas off the entire Oregon coast but only off a portion of the
coast at depths deeper than 150 fm. However, neither alternative is anticipated to change
fishing behaviors such that it would increase chances for interactions with eulachon but is
instead anticipated to displace and redistribute current fishing effort.
Continued operation of the groundfish fishery is not likely to jeopardize the southern
distinct population segment of green sturgeon or adversely modify their designated
critical habitat (NMFS 2012). Neither of the alternatives is anticipated to change fishing
behaviors such that it would increase chances for interactions with green sturgeon or their
designated critical habitat. Both alternatives are anticipated to displace and redistribute
current fishing effort.
Continued operation of the groundfish fishery is not likely to jeopardize humpback
whales (NMFS 2012). The 2012 biological opinion also issued a provisional take
statement. See below under 4.4.4.3.
Continued operation of the groundfish fishery is not likely to jeopardize leatherback sea
turtles or adversely modify their designated critical habitat (NMFS 2012). Neither of the
alternatives are anticipated to change fishing behaviors such that it would increase
chances for interactions with leatherback sea turtles or their designated critical habitat.
Both alternatives are anticipated to displace and redistribute current fishing effort.
At their September 2012 meeting, formation of a West Coast Endangered Species
Workgroup was explored and recommended by the Council. Further improvements in
data collection for ESA-listed species will be recommended and continually updated
upon formation of this workgroup, including from WCGOP 100 percent monitored trawl
rationalization data.
4.4.4.3 Marine Mammals and Sea Birds
No-action, Alternative 1, and Alternative 2 The groundfish bottom trawl fishery is a Category III fishery, where take of marine
mammals is extremely rare (78 FR 23708, April 22, 2013). In addition, investigations by
Guy et al. (2013) suggest that any seabird interactions with non-whiting bottom trawl
groundfish fisheries are rare.
No change in impacts to these animals is projected for any of the alternatives compared
to the baseline No Action Alternative, as overall effort is not expected to increase
substantially from the proposed action alternatives but is instead anticipated to displace
and redistribute current fishing effort. None of the action alternatives (1 or 2) are

105
expected to have any discernible impact on marine mammals. Any incidental takes of
marine mammals or seabirds (an extremely rare event in the groundfish bottom trawl
fishery) will continue to be subject to 100% monitoring requirements in the trawl
rationalization program.
At the June 2013 Council meeting, a draft EA was presented for consideration of a
proposed recommendation to require groundfish vessels over 55’ in length to use
mandatory seabird streamer lines, which have been shown to dramatically reduce seabird
take in the groundfish longline fisheries, and would pertain to IFQ vessels while utilizing
gear switching provisions of the IFQ program. The Council reviewed the draft EA, and
is expected to provide recommendations on this proposed action in the immediate future.
4.5 Socio-economic Impacts
4.5.1 Shorebased IFQ Program
4.3.2.1. No-action, Alternative 1, and Alternative 2
Summary Either of the two action alternatives is expected to have some favorable economic impact
for fishing vessels that harvest, purchase, or resell groundfish bottom trawl landings,
within the area of this potential action compared to the No-action alternative. New
opportunities for trawling on additional grounds (currently closed to this gear) may then
translate into additional landings and revenue from those valuable target species which
were specified in the industry rationale for this request (e.g. lingcod, Dover sole,
yellowtail rockfish, petrale sole, etc). The amount of expected economic benefit should
differ according to alternative, area and thereby principal port of landing. Both the
seaward and shoreward proposed changes would mean more fishing opportunities closer
to shore, and in areas that have not been trawled recently, which may result in economic
benefits in the form of fuel savings from fishing closer to port, additional fish on newly
opened grounds, or both.
None of the alternatives in the proposed action are expected to have a negative effect on
fishing vessels, processors, or communities which are dependent on groundfish fishing,
compared to the no-action alternative.
Differences among alternatives and areas There are some differences among the alternatives, in their potential amount of economic
benefit to different coastal communities. Either Alternative 1 or 2 is expected to benefit
IFQ vessels using groundfish bottom trawl gear when fishing between 45° 46’and 48° 10’
N. latitude, by opening additional areas to fishing on both the seaward and shoreward
side of the existing (No Action) RCA configuration. However, under Alternative 2,
vessels fishing in the area between 40° 10’ N. latitude to 45° 46’ N. latitude would see
less of an increase in fishing opportunity on the seaward side.
At the same time, the difference in time of additional seaward fishing area access (and
thereby potential for additional landings and revenue) between No Action and Alternative

106
1 is small for the northern area, while it is much larger for the southern area. Under
Alternative 2, there is again a small difference (two months) in the northern area between
No Action and Alternative 2, but no difference for the southern area; No Action and
Alternative 2 are the same in this respect. There is no difference in the time of additional
shoreward fishing access between the northern and southern areas, among any of the
alternatives. Both action alternatives offer six months additional access in the shoreward
area between 75 and 100 fm, compared with the No Action Alternative.
Differences in alternatives among ports and coastal communities Medium to small ports between 45° 46’ and 40° 10’ N. lat., including Newport, Coos
Bay, Brookings, Crescent City, and Eureka would stand to benefit from the increased
seaward opportunity of Alternative 1, but not from Alternative 2. The port with the
highest revenue from IFQ landings is Astoria by far (Figure 4-11, Table 4-5), which
would benefit equally from either Alternative 1 or 2, since it is north of 45° 46’ N. lat.
Table X, shows the percentage distribution of revenue from non-whiting groundfish in
the IFQ fishery between the northern and southern areas of this action during 2011 and
2012. Table 4-6 shows that the percentage of non-whiting IFQ revenue is very similar
between the two areas considered in this action, for both 2011 and 2012, with the
southern area showing slightly more revenue from non-whiting trips. For shorebased
whiting landings, the northern area shows substantially more revenue than the southern
area.
Considerations of species and gear type With the poor sablefish market of the past two years (although still the most valuable
species per pound in the fishery), and continued reduction in the northern sablefish ACL,
there is evidence that fishermen have shifted some effort to other target species in order
to compensate (Annual Catch Report for the Pacific Coast Groundfish, Shorebased IFQ
Program in 2012, Agenda Item D.2.a, April, 2013 PFMC meeting). Either Alternative 1
or 2 could make such a shift easier for fishers, according to the species cited in industry
rationale (bycatch analysis section). There were increases in revenue from species such as
yellowtail rockfish, Pacific cod, petrale sole, lingcod, and Dover sole from 2011 to 2012
in the IFQ program, together with a substantial drop in sablefish revenue (Annual Catch
Report for the Pacific Coast Groundfish, Shorebased IFQ Program in 2012, Agenda Item
D.2.a, April, 2013 PFMC meeting). These species were cited as targets in the areas
requested for opening by industry (bycatch analysis section).
In those southern ports, fishermen could still fish the seaward area between 150 and 200
fm using fixed gear, under the gear switching provision of IFQ regardless of this potential
action. If the area is not opened to trawling, it is conceivable that fishermen may do so, to
access some of the higher value targets that are often landed with fixed gear such as
lingcod, sablefish, and Pacific cod (these species were cited in industry rationale). Given
sufficient motivation to diversify their catch among species, it is conceivable that effort in
the seaward area (150-200 fm, 40°10’ to 45°46’) could increase by use of fixed gear
rather than trawl gear, even without the implementation of Alternative 2, under gear
switching provisions in the IFQ program, especially upon recovery of sablefish markets
and ex-vessel prices. However, this is speculative.

107
Figure 4-11: Landings and revenue by port group, for non-whiting trips, in the Shorebased IFQ Program. Port groups are arranged by latitude. Source = paper
and electronic landing receipt data (PacFIN and PSMFC, respectively).

108
Table 4-5: Annual landings and revenue, distributed by port group, for non-whiting trips (top) and directed whiting trips (bottom), in the Shorebased IFQ
Program, for 2011 and 2012. Port groups are arranged by latitude. Columns labeled “percent” express either 2012 landings or revenue (corresponding to the
column appearing to left) as a percent of 2011 values. Columns labeled “dist.” show the distribution of annual landings or revenue among port groups (%).
Port group (non-whiting trips) 2011 landings
2012 landings
2011 dist.
2012 dist.
Land. difference
Land. percent
2011 revenue
2012 revenue
2011 dist.
2012 dist.
Rev. difference
Rev. percent
Bellingham, Blaine, Neah Bay, La Push 1,185,687 1,500,658 3% 4% 314,971 127% 816,996 977,857 2% 3% 160,861 120%
Westport 162,774 494,278 0% 1% 331,504 304% 450,500 680,484 1% 2% 229,984 151%
Ilwaco, Chinook 2,882,683 2,809,640 7% 7% -73,043 97% 3,051,630 1,700,006 9% 6% -1,351,624 56%
Other or unknown Washington ports 130,220 0% 0% -130,220 0% 127,621 0% 0% -127,621 0%
Astoria 15,398,437 14,929,115 38% 37% -469,322 97% 8,567,173 9,338,689 26% 31% 771,516 109%
Newport, Tillamook, Garibaldi 2,759,574 3,590,916 7% 9% 831,342 130% 4,538,783 4,935,313 14% 16% 396,530 109%
Charleston (Coos Bay), Winchester Bay 4,665,899 4,744,945 11% 12% 79,046 102% 3,187,748 3,171,837 10% 10% -15,911 100%
Brookings, Crescent City, Port Orford 2,833,395 2,752,902 7% 7% -80,493 97% 2,021,490 2,177,826 6% 7% 156,336 108%
Eureka 4,671,640 4,159,850 12% 10% -511,790 89% 3,355,484 2,753,363 10% 9% -602,120 82%
Fort Bragg 2,897,221 2,623,714 7% 6% -273,507 91% 2,570,326 1,916,710 8% 6% -653,616 75%
San Francisco, San Mateo, Oakland, Princeton (Half Moon Bay), Santa Cruz, Bodega Bay 869,663 621,684 2% 2% -247,979 71% 878,513 476,211 3% 2% -402,302 54%
Moss Landing, Monterey, Morro Bay, Avila, Santa Barbara 2,152,997 2,664,560 5% 7% 511,563 124% 3,369,670 2,324,466 10% 8% -1,045,203 69%
Sum 40,610,190 40,892,262 100% 100% 282,072 101% 32,935,934 30,452,763 100% 100% -2,483,170 92%
Port group (whiting trips) 2011 landings
2012 landings
2011 dist.
2012 dist.
Land. difference
Land. percent
2011 revenue
2012 revenue
2011 dist.
2012 dist.
Rev. difference
Rev. percent
Westport, Ilwaco, Chinook 50,597,855 37,654,325 25% 26% -
12,943,530 74% 5,700,215 5,848,889 25% 28% 148,674 103%
Astoria 94,478,623 52,460,824 46% 36% -
42,017,799 56% 10,537,842 7,786,722 46% 37% -2,751,120 74%
Newport, Tillamook, Garibaldi, Charleston (Coos Bay), Winchester Bay 58,167,274 56,240,192 29% 38% -1,927,082 97% 6,572,762 7,323,068 29% 35% 750,306 111%
Sum 203,243,752 146,355,341 100% 100% -
56,888,411 72% 22,810,819 20,958,679 100% 100% -1,852,140 92%

109
Table 4-6: Ex-vessel revenue from shorebased non-whiting and whiting trips in the IFQ program, during
2011 and 2012, only for the area between 40° 10’ N. latitude to 48° 10’ N. lat. The “North” area includes
ports Westport, Ilwaco/Chinook, “other or unknown Washington ports” and Astoria; the “South” area
includes the ports Newport, Tillamook, Garibaldi, Charleston, Winchester Bay, Brookings, Crescent City,
Port Orford, and Eureka.
Non-whiting trips 2011 2012 2011 2012
North 12,196,924 11,719,179 48% 47%
South 13,103,505 13,038,340 52% 53%
Sum 25,300,429 24,757,519 100% 100%
Whiting trips 2011 2012 2011 2012
North 16,238,057 13,635,611 71% 65%
South 6,572,762 7,323,068 29% 35%
Sum 22,810,819 20,958,679 100% 100%
In the industry request to move the shoreward and seaward boundaries of the trawl RCA, the
GAP cited in public comment, in meeting with the GMT at the March and April 2013 meetings
of the PFMC, as well as in their team statements (Agenda Item H.3.b, Supplemental GAP
Report, March 2013; Agenda Item D.8.b, Supplemental GAP Report, April 2013), industry’s
need to gain additional access target species including Dover sole, petrale sole, and other flatfish
in the shoreward area, which they estimate will increase otherwise low overall attainment in the
fishery, and make fishing substantially more economically viable. They related that this would
be accomplished through increased efficiency and reduced fuel costs for some species that could
be accessed closer to shore, and fishing in areas of higher density for valuable target species.
They spoke to trawl fishers’ intent to use selective flatfish trawl gear in order to access these
target species, and avoid canary rockfish, and other rebuilding rockfish species. The GAP stated
they believe their complete request would also enable higher attainment of other valuable species
including lingcod, true cod, yellowtail rockfish, particularly in the seaward area. The GAP also
spoke about industry members’ desire to exercise the individual accountability which is inherent
in the Individual Fishing Quota (IFQ) program, and pointed out that several modifications to the
RCA structure have already been made in the first two years of the program, while maintaining
very low harvest levels of rebuilding species. Finally, industry members stated that more regular
RCA boundaries make those boundaries easier to comply with and to enforce.
4.5.2 Processor Sector
4.5.2.1 No-action
There are no expected impacts to processor sectors from the no-action Alternative. The
fishermen would continue to have the same access to fishing grounds as currently in place.

110
4.5.2.2 Alternative 1
There may be increased landings at processors expected from Alternative 1 to the extent
fishermen are able to increase their attainment levels of underutilized species. Fishermen would
gain increased access both shoreward and seaward of the current RCA between 40° 10’ N. lat.
and 48° 10’ N. lat.
4.5.2.3 Alternative 2
There may be increased landings at processors expected from Alternative 2 to the extent
fishermen are able to increase their attainment levels of underutilized species, although landings
are expected to slightly less than those under Alternative 1. Fishermen would gain increased
access both shoreward and seaward of the current RCA between 40° 10’ N. lat. and 48° 10’ N.
lat., although somewhat less access seaward than under Alternative 1. Landings to processors
south of 45° 46’ N. lat. may be less than those under Alternative 1.
4.5.3 Communities
4.5.3.1 No-action
There are no expected impacts to communities from the no-action Alternative. Fishermen would
continue to have the same access to fishing grounds as currently in place, and therefore
processors and communities are not anticipated to be affected differently than what is currently
occurring.
4.5.3.2 Alternative 1
There may be increased landings in communities expected from Alternative 1 to the extent
fishermen are able to increase their attainment levels of underutilized species. Fishermen would
gain increased access both shoreward and seaward of the current RCA between 40° 10’ N. lat.
and 48° 10’ N. lat., potentially benefitting processors. Therefore, communities are expected to
benefit from Alternative 1.
4.5.3.3 Alternative 2
There may be increased landings in communities expected from Alternative 2 to the extent
fishermen are able to increase their attainment levels of underutilized species, although
opportunities are expected to slightly less than those under Alternative 1. Fishermen would gain
increased access both shoreward and seaward of the current RCA between 40° 10’ N. lat. and
48° 10’ N. lat., potentially benefitting processors, although somewhat less than under Alternative
1. Landings to processors south of 45° 46’ N. lat. may be less than those under Alternative 1.
Therefore, communities are expected to benefit from Alternative 2, although to some extent less
than under Alternative 1, particularly for communities south of 45° 46’ N. lat.

111
4.6 Cumulative Impacts
A cumulative effects analysis is required by the Council on Environmental Quality (CEQ) (40
CFR part 1508.7). The purpose of a cumulative effects analysis is to consider the combined
effects of many actions on the human environment over time that would be missed if each action
were evaluated separately. CEQ guidelines recognize that it is not practical to analyze the
cumulative effects of an action from every conceivable perspective, but rather, the intent is to
focus on those effects that are truly meaningful. A formal cumulative impact assessment is not
necessarily required as part of an EA under NEPA as long as the significance of cumulative
impacts have been considered (U.S. EPA 1999). The following addresses the significance of the
expected cumulative impacts as they relate to the federally managed groundfish fishery.
4.6.1 Consideration of the Affected Resources
In Chapter 3 (Status of the Affected Environment), the affected resources that exist within the
non-whiting bottom trawl IFQ fishery environment are identified. Therefore, the significance of
the cumulative effects will be discussed in relation to these affected resources listed below.
1. Physical Environment, including Ecosystem and Essential Fish Habitat
2. Biological Environment, including:
Groundfish
Non-target Species
Protected Species, including ESA, MMPA, and MBTA
Marine Mammals and Seabirds
3. Socioeconomic Environment
4.6.2 Geographic Boundaries
The analysis of impacts focuses on actions related to the harvest of non-whiting groundfish
species. The core geographic scope for each of the affected resources listed above is focused on
the Eastern Pacific Ocean (Chapter 3) north of 40° 10’ N. lat. The coastal stocks of some
groundfish species, such as blackcod, are highly migratory in nature, whereas other rockfish
species have varying degrees of migratory behavior, with some species such as yelloweye
rockfish exhibiting high site fidelity in offshore waters of Oregon, Washington, and Vancouver
Island, Canada. For habitat, the core geographic scope is focused on EFH within the EEZ, and
particularly within the areas for RCA boundary modification, (75 to 200 fm, 40° 10’ N. lat. to
48° 10’ N. lat.), but includes all habitat utilized by demersal (bottom dwelling) groundfish and
non-target species in the Eastern Pacific Ocean. Rockfish species tend to be more localized
although their young may distribute widely within the large California current system, and across
different depth stratifications at different stages in their life history. For non-target species, those
ranges may be expanded and would depend on the biological range of each individual non-target
species in the Eastern Pacific Ocean. The core geographic scope for endangered and protected
resources can be considered the overall range of these resources in the Eastern Pacific Ocean.
For human communities, the core geographic boundaries are defined as those U.S. fishing
communities directly involved in the harvest or processing of the managed resources, which
112
were found to occur in coastal states most notably from Westport, Washington to Eureka,
California.
4.6.3 Temporal Boundaries
The temporal scope of past and present actions for the affected resources is primarily focused on
actions that have occurred after FMP implementation (1982) and more importantly, since
implementation of the trawl rationalization program in 2011. For endangered species and other
protected resources, the scope of past and present actions is on a species-by-species basis
(Section 3.2.3) and is largely focused on the 1980s and 1990s through the present, when NMFS
began generating stock assessments for marine mammals and sea turtles that inhabit waters of
the U.S. EEZ. The temporal scope of future actions for all affected resources extends through
December 31, 2018.
4.6.3.1 Actions Other than the Proposed Action
4.6.3.2 Past, Present, and Reasonably Foreseeable Future Actions
Fishery-related Actions The historical management practices of PFMC have resulted in positive impacts on the health of
the groundfish stocks and demersal rockfish complex species. Numerous actions have been
taken to manage the fisheries for these species through amendment and specifications actions. In
addition, the nature of the fishery management process is intended to provide the opportunity for
PFMC and NMFS to regularly assess the status of the fisheries and to make necessary
adjustments to ensure that there is a reasonable expectation of meeting the objectives of the FMP
and the targets associated with any rebuilding programs under the FMP. The statutory basis for
Federal fisheries management is the Magnuson-Stevens Act. To the degree with which this
regulatory regime is complied, the cumulative impacts of past, present, and reasonably
foreseeable future Federal fishery management actions on the affected resources should
generally be associated with positive long-term outcomes. Constraining fishing effort through
regulatory actions can often have negative short-term socioeconomic impacts. These impacts are
usually necessary to bring about long-term sustainability of a given resource, which should, in
the long-term, promote positive effects on human communities, especially those that are
economically dependent upon groundfish stocks and demersal rockfish complex species.
In addition, PFMC has developed harvest specifications for 2013 and 2014 for groundfish stocks,
which was implemented in January 2013 by NMFS. It is noted that the levels of groundfish
harvest are not expected to fluctuate dramatically in the near future for the short term (see 2013-
2014 harvest specifications), but ACLs for some demersal rockfish species may be slightly
increased as overfished species continue upward trends in biomass from rebuilding plan
consequences, and subsequently, are intercepted into the fishery. In the long term, it is important
to evaluate the impacts on shares of total harvest allocated to entities rather than the allocation
poundage.
There has likely been substantial habitat recovery within RCAs that have not been trawled within
the 2.8 years or more (see section 3.1, above), stemming from prohibition on bottom trawling
113
and low ACLs for demersal rockfish complex species since 2002. Increased bottom trawling for
demersal rockfish species within RCAs will result in occasional (but increased) gear contacts
with bottom habitats, mixed and hard bottom habitat in particular, which is where demersal
rockfish are typically found. There are important disincentives associated with gear contact with
mixed and hard demersal habitats due to various gear restriction implementation, which are
discussed in Section 3.1.3.4.1, beginning on page 31. These include the high cost of net repair or
replacement if the net is damaged and the reduced fishing efficiency and increased operating cost
that occurs when the net makes contact with the mixed boulder or hard ocean bottom substrates.
Gear restrictions have been implemented that further reduce the incentive to make bottom
contact with bottom trawl gear on mixed and hard substrates including the small footrope
requirement not to exceed 8 inches on all bottom trawl nets shoreward of 100 fm, and the
requirement for bottom trawl large footrope not to exceed 18 inches. Catch share
implementation is likely to consolidate fishing with fewer boats than in the past. This may result
in further reduction in bottom trawl gear contacts with demersal habitats because the more
efficient vessels will likely be doing most of the fishing and it is likely that the most efficient
vessels may reduce effort on bottom contact.
PFMC and NMFS continue to work together on the trawl rationalization trailing actions. All of
these actions are expected to increase benefits from the fishery and are not expected to
appreciably interact with the action considered here, except as noted in the following list.
Details on each action are available on the PFMC website
(http://www.pcouncil.org/groundfish/fishery-management-plan/trailing-actions/). The main
trailing actions are as follows:
Trawl/Fixed gear permit stacking (final PFMC action taken, not yet implemented) — This action
allows fixed gear and trawl permits to be registered to the same vessel at the same time.
Gear Issues (under PFMC consideration, deliberations delayed) -- Gear issues include multiple
gears on a trip, gear modifications to increase efficiency, and restrictions on areas in which gears
may be used. Consideration on this issue has been delayed until September 2013.
Cost Recovery (PFMC action completed, not yet implemented) – Cost recovery will be
implemented at the beginning of 2014 resulting in the collection of additional fees in amounts of
3 percent of exvessel value for the shoreside fishery. For details see:
http://www.pcouncil.org/wp-
content/uploads/H2a_ATT1_COSTRECOV_FNL_SEP2012BB.pdf. In the context of this
additional cost, alternatives which increase the efficiency of fishing operations from increased
access to fishing grounds (alternative 1 and 2) may be more beneficial to stability in the industry
than would be the case under the no-action alternative.
Risk Pools (PFMC action completed, not yet implemented) —PFMC has recommended a
number of provisions to facilitate fishers working together in risk pools. These actions include
providing a safe harbor from limits on the accumulation of control over QS.

114
Lender Safe Harbor from Control Rules (PFMC action completed, not yet implemented) --- This
action clarified who qualifies for the lender safe harbor exception and the activities for which an
exception is provided.
Whiting Season and Southern Allocation (PFMC action complete, not yet implemented) – This
action will set a common start date for all shoreside fisheries which matches the start date for the
at-sea fishery (May 15) and eliminate the cap on early season harvest in the south. While not
changing the total amount of trawling with midwater gear and total amount of the target species
caught, it may alter the timing of that harvest, advancing some of the harvest by one month, and
subsequently have some effect on the timing of bottom trawl fishing activities. The expected
change in impact of the trawl season date movement as a result of the Rockfish Conservation
Area regulations would be minimal.
Pacific Whiting Surplus Carryover Implementation (PFMC action completed) - This provision,
which would allow up to 10 percent of unused whiting QP to be carried from one year to the
next, has not been implemented due to legal criteria related to treaty issues with Canada.
PFMC’s SSC has determined that from a scientific perspective, the surplus carryover provision
does not have a biological impact. On that basis, changes to the bottom trawl Rockfish
Conservation Area boundaries would not have an interaction with this provision that would have
any appreciable impact.
Electronic Monitoring as a Replacement for the 100 percent Observer Coverage Requirement
(under PFMC consideration) — This proposal is under preliminary study, and options have yet
to be developed. Interaction with this proposed Rockfish Conservation Area action will depend
on the nature of the alternative monitoring system developed. If full retention is required with
electronic monitoring, the combination of that requirement with the Rockfish Conservation
Areas could affect the amount of small fish and nonmarketable fish brought to shore but will not
alter estimated total mortality.
Furthermore, PFMC has adopted a Fishery Ecosystem Plan (FEP), which will broaden its current
authority to species and issues not currently addressed in existing FMPs, including the
groundfish plan. The scope of the plan is still under consideration. The guidance provided to the
plan development team thus far has included:
1. Development of an FEP that would primarily be advisory in nature with the potential to
expand in the future.
2. Amend existing FMPs to include management measures for forage fish as the Council
deems appropriate.
3. Develop a list of species not included in any FMP and that are not being managed to
define their trophic associations and ecological roles.
4. Complete an analysis of unmanaged species and potential processes for their
management.
Implementation of an FEP could have positive environmental and biological impacts associated
with forage fish and unmanaged fish protection. Such protections could accrue benefits to
managed species such as groundfish which depend on forage fish and some unmanaged fish for

115
their survival and reproduction. While adverse impacts on forage fish and unmanaged fish under
either of the alternatives are expected to be minimal, actions taken under the FEP are expected to
further benefit these resources, helping to offset any negative impacts. It could potentially have
negative short-term socioeconomic impacts if actions taken to protect forage species and
unmanaged species resulted in reduced harvest opportunity for managed species. In the context
of regulations that may impose further restrictions on harvest, alternatives which alleviate
production costs may be more beneficial to stability in the industry than would be the case if
harvest conditions were expected to remain stable.
4.4.1 Non-fishing Actions
Non-fishing activities that introduce chemical pollutants, sewage, changes in water temperature,
salinity, dissolved oxygen, and suspended sediment into the marine environment pose a risk to
all of the identified affected resources. Human-induced non-fishing activities tend to be
localized in nearshore areas and marine project areas where they occur. Examples of these
activities include, but are not limited to, agriculture, port maintenance, coastal development,
marine transportation, marine mining, dredging, and the disposal of dredged material. Wherever
these activities co-occur, they are likely to work additively or synergistically to decrease habitat
quality and may indirectly constrain the sustainability of the managed resources, non-target
species, and protected resources. Decreased habitat suitability would tend to reduce the
tolerance of these species to the impacts of fishing effort. Mitigation of this outcome through
regulations that would reduce fishing effort could then negatively impact human communities.
The overall impact to the affected species and their habitats on a population level is unknown,
but likely neutral to low negative, since a large portion of these species have a limited or minor
exposure to these local non-fishing perturbations.
In addition to guidelines mandated by the Magnuson-Stevens Act, NMFS reviews these types of
effects through the review processes required by Section 404 of the Clean Water Act and Section
10 of the Rivers and Harbors Act, for certain activities that are regulated by Federal, state, and
local authorities. The jurisdiction of these activities is in "waters of the U.S." and includes both
river and marine habitats.
For many of the proposed non-fishing activities to be permitted under other Federal agencies
(such as offshore energy facilities, etc.), those agencies would conduct examinations of potential
impacts on the affected resources. The Magnuson-Stevens Act (50 CFR 600.930) imposes an
obligation on other Federal agencies to consult with the Secretary of Commerce on actions that
may adversely affect EFH. The eight fishery management councils are engaged in this review
process by making comments and recommendations on any Federal or state action that may
affect habitat, including EFH, for their managed species and by commenting on actions likely to
substantially affect habitat, including EFH.
In addition, under the Fish and Wildlife Coordination Act (Section 662), “whenever the waters of
any stream or other body of water are proposed or authorized to be impounded, diverted, the
channel deepened, or the stream or other body of water otherwise controlled or modified for any
purpose whatever, including navigation and drainage, by any department or agency of the U.S.,
or by any public or private agency under Federal permit or license, such department or agency

116
first shall consult with the U.S. Fish and Wildlife Service (USFWS), Department of the Interior,
and with the head of the agency exercising administration over the wildlife resources of the
particular state wherein the” activity is taking place. This act provides another avenue for review
of actions by other Federal and state agencies that may impact resources that NMFS manages in
the reasonably foreseeable future. In addition, NMFS and the USFWS share responsibility for
implementing the ESA. ESA requires NMFS to designate "critical habitat" for any species it
lists under the ESA (i.e., areas that contain physical or biological features essential to
conservation, which may require special management considerations or protection) and to
develop and implement recovery plans for threatened and endangered species. The ESA
provides another avenue for NMFS to review actions by other entities that may impact
endangered and protected resources whose management units are under NMFS’ jurisdiction.
The effects of climate on the biota of the California Current ecosystem have been recognized for
some time. The El Niño/Southern Oscillation (ENSO) is widely recognized to be the dominant
mode of interannual variability in the equatorial Pacific, with impacts throughout the rest of the
Pacific basin and the globe. During the negative (El Niño) phase of the ENSO cycle, jet stream
winds are typically diverted northward, often resulting in increased exposure of the west coast of
the U.S. to subtropical weather systems. The impacts of these events to the coastal ocean
generally include reduced upwelling winds, deepening of the thermocline, intrusion of offshore
(subtropical) waters, dramatic declines in primary and secondary production, poor recruitment,
reduced growth and survival of many resident species (such as salmon and groundfish), and
northward extensions in the range of many tropical species. Concurrently, top predators such as
seabirds and pinnipeds often exhibit reproductive failure. In addition to interannual variability in
ocean conditions, the North Pacific seems to exhibit substantial interdecadal variability, which is
referred to as the Pacific (inter) Decadal Oscillation (PDO).
Within the California Current itself, Mendelssohn, et al. (2003) described long-term warming
trends in the upper 50 to 75 m of the water column. Recent paleoecological studies from marine
sediments have indicated that 20th century warming trend in the California Current have
exceeded natural variability in ocean temperatures over the last 1,400 years. Statistical analyses
of past climate data have improved our understanding of how climate has affected North Pacific
ecosystems and associated marine species productivities. Our ability to predict future impacts on
the ecosystem stemming from climate forcing events remains poor at best.
4.4.2 Magnitude and Significance of Cumulative Effects
In determining the magnitude and significance of the cumulative effects, the additive and
synergistic effects of the proposed action, as well as past, present, and future actions, must be
taken into account. The following section discusses the effects of these actions on each of the
managed resources.
4.4.2.1 Physical Environment, including Habitat and Ecosystem
Those past, present, and reasonably foreseeable future actions, whose effects may impact habitat
(including EFH) and the direction of those potential impacts, are listed in table 4-24, below. The
direct and indirect negative actions described in table 4-24 are localized in nearshore areas and
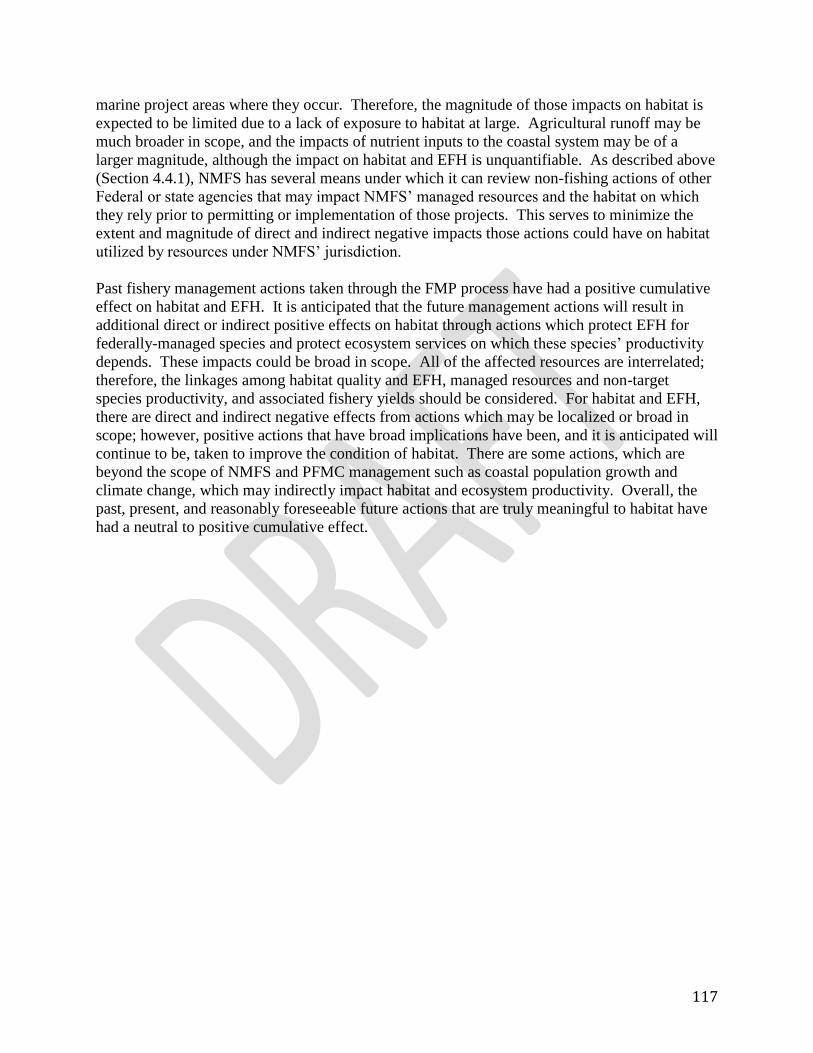
117
marine project areas where they occur. Therefore, the magnitude of those impacts on habitat is
expected to be limited due to a lack of exposure to habitat at large. Agricultural runoff may be
much broader in scope, and the impacts of nutrient inputs to the coastal system may be of a
larger magnitude, although the impact on habitat and EFH is unquantifiable. As described above
(Section 4.4.1), NMFS has several means under which it can review non-fishing actions of other
Federal or state agencies that may impact NMFS’ managed resources and the habitat on which
they rely prior to permitting or implementation of those projects. This serves to minimize the
extent and magnitude of direct and indirect negative impacts those actions could have on habitat
utilized by resources under NMFS’ jurisdiction.
Past fishery management actions taken through the FMP process have had a positive cumulative
effect on habitat and EFH. It is anticipated that the future management actions will result in
additional direct or indirect positive effects on habitat through actions which protect EFH for
federally-managed species and protect ecosystem services on which these species’ productivity
depends. These impacts could be broad in scope. All of the affected resources are interrelated;
therefore, the linkages among habitat quality and EFH, managed resources and non-target
species productivity, and associated fishery yields should be considered. For habitat and EFH,
there are direct and indirect negative effects from actions which may be localized or broad in
scope; however, positive actions that have broad implications have been, and it is anticipated will
continue to be, taken to improve the condition of habitat. There are some actions, which are
beyond the scope of NMFS and PFMC management such as coastal population growth and
climate change, which may indirectly impact habitat and ecosystem productivity. Overall, the
past, present, and reasonably foreseeable future actions that are truly meaningful to habitat have
had a neutral to positive cumulative effect.

118
Table 4-7: Summary of the effects of past, present, and reasonably foreseeable future actions on habitat.
Action Past to the Present Reasonably Foreseeable
Future
Original FMP and subsequent Amendments to the FMP Indirect Positive
Agricultural runoff Direct Negative
Port maintenance
Uncertain – Likely Direct Negative
Offshore disposal of dredged materials
Direct Negative
Marine transportation Direct Negative
Installation of pipelines, utility lines and cables Uncertain – Likely Direct Negative
Offshore Energy Facilities (wind, tidal, etc.) Potentially Direct Negative
2013-2014 Biennial Harvest Specifications Positive
Trawl Rationalization Trailing Actions Uncertain – Likely Positive
Summary of past, present, and future actions excluding those
proposed in this document
Overall, actions have had, or will have, neutral to positive
impacts on habitat, including EFH

119
4.6.3.3 Biological Environment
Those past, present, and reasonably foreseeable future actions, whose effects may impact
groundfish resources and the direction of those potential impacts, are summarized in Table 4-25,
below. The indirectly negative actions described in Table 4-25 are localized in nearshore areas
and marine project areas where they occur. Therefore, the magnitude of those impacts on the
managed resources is expected to be limited due to a lack of exposure to the population at large.
Agricultural runoff may be much broader in scope, and the impacts of nutrient inputs to the
coastal system may be of a larger magnitude, although the impact on productivity of the
managed resources is unquantifiable. As described above (Section 4.6.3.1), NMFS has several
means under which it can review non-fishing actions of other Federal or state agencies that may
impact NMFS’ managed resources prior to permitting or implementation of those projects. This
serves to minimize the extent and magnitude of indirect negative impacts those actions could
have on resources under NMFS’ jurisdiction.
Past fishery management actions taken through the FMP have had a positive cumulative effect
on the managed resources. It is anticipated that the future management actions, described in
Table 4-25, will result in additional indirect positive effects on the managed resources through
actions which reduce and monitor bycatch, protect habitat, and protect ecosystem services on
which groundfish and demersal rockfish complex species productivities depend. In addition,
past fishery management actions taken through the FMP process have had a positive cumulative
effect on ESA-listed and MMPA-protected species through the reduction of fishing effort
(potential interactions) and implementation of gear requirements. It is anticipated that the future
management actions will continue to result in additional indirect positive effects on protected
resources. The impacts of these future actions could be broad in scope, and it should be noted
the biological resources are often coupled in that they utilize similar habitat areas and ecosystem
resources on which they depend. Overall, the past, present, and reasonably foreseeable future
actions that are truly meaningful to the biological resources have had a positive cumulative
effect.
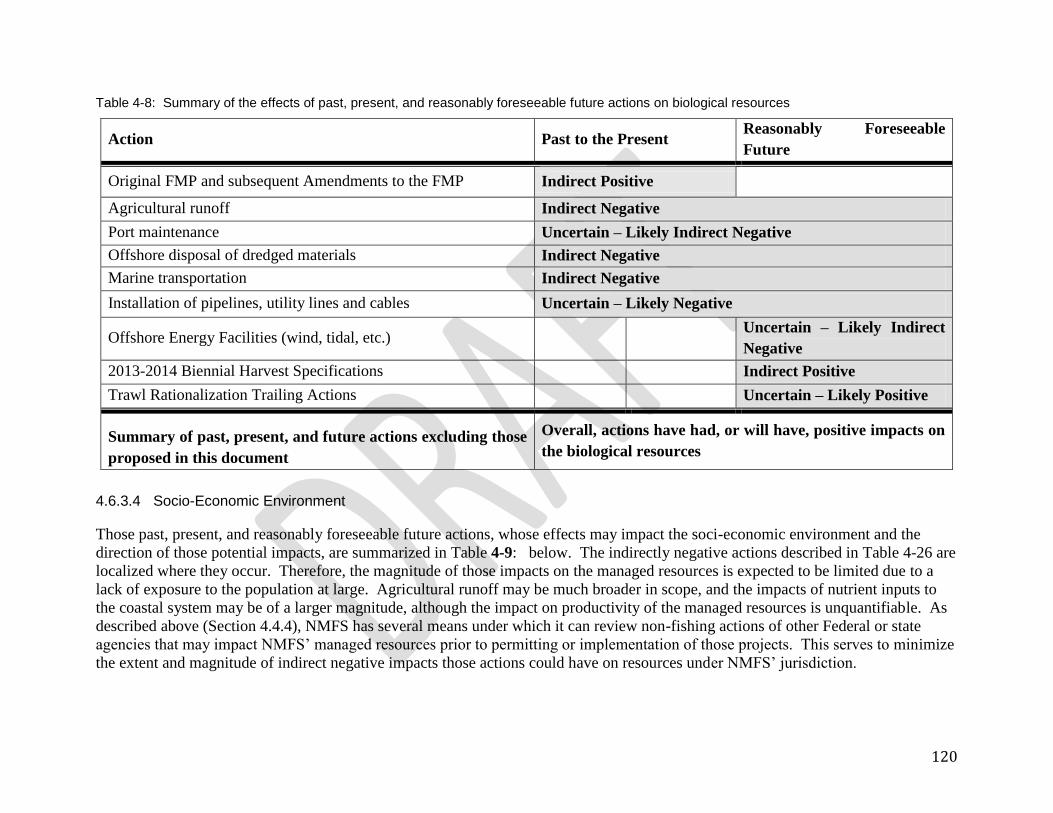
120
Table 4-8: Summary of the effects of past, present, and reasonably foreseeable future actions on biological resources
Action Past to the Present Reasonably Foreseeable
Future
Original FMP and subsequent Amendments to the FMP Indirect Positive
Agricultural runoff Indirect Negative
Port maintenance
Uncertain – Likely Indirect Negative
Offshore disposal of dredged materials
Indirect Negative
Marine transportation Indirect Negative
Installation of pipelines, utility lines and cables Uncertain – Likely Negative
Offshore Energy Facilities (wind, tidal, etc.) Uncertain – Likely Indirect
Negative
2013-2014 Biennial Harvest Specifications Indirect Positive
Trawl Rationalization Trailing Actions Uncertain – Likely Positive
Summary of past, present, and future actions excluding those
proposed in this document
Overall, actions have had, or will have, positive impacts on
the biological resources
4.6.3.4 Socio-Economic Environment
Those past, present, and reasonably foreseeable future actions, whose effects may impact the soci-economic environment and the
direction of those potential impacts, are summarized in Table 4-9: below. The indirectly negative actions described in Table 4-26 are
localized where they occur. Therefore, the magnitude of those impacts on the managed resources is expected to be limited due to a
lack of exposure to the population at large. Agricultural runoff may be much broader in scope, and the impacts of nutrient inputs to
the coastal system may be of a larger magnitude, although the impact on productivity of the managed resources is unquantifiable. As
described above (Section 4.4.4), NMFS has several means under which it can review non-fishing actions of other Federal or state
agencies that may impact NMFS’ managed resources prior to permitting or implementation of those projects. This serves to minimize
the extent and magnitude of indirect negative impacts those actions could have on resources under NMFS’ jurisdiction.

121
Past fishery management actions taken through the FMP have had a positive cumulative effect on the managed resources. It is
anticipated that the future management actions, described in Table 4-26,will result in additional indirect positive effects on the
managed resources through actions which reduce and monitor bycatch, protect habitat, and protect ecosystem services on which
groundfish and demersal rockfish complex species productivities depend. In addition, past fishery management actions taken through
the FMP process have had a positive cumulative effect on ESA-listed and MMPA-protected species through the reduction of fishing
effort (potential interactions) and implementation of gear requirements. It is anticipated that the future management actions will
continue to result in additional indirect positive effects on protected resources. The impacts of these future actions could be broad in
scope, and it should be noted the biological resources are often coupled in that they utilize similar habitat areas and ecosystem
resources on which they depend. Overall, the past, present, and reasonably foreseeable future actions that are truly meaningful to the
biological resources have had a positive cumulative effect.
Table 4-9: Summary of the effects of past, present, and reasonably foreseeable future actions on human communities
Action Past to the Present Reasonably Foreseeable
Future
Original FMP and subsequent Amendments to the FMP Indirect Positive
Agricultural runoff Indirect Negative
Port maintenance
Uncertain – Likely Mixed
Offshore disposal of dredged materials
Indirect Negative
Marine transportation Mixed
Installation of pipelines, utility lines and cables Uncertain – Likely Mixed
Offshore Energy Facilities (wind, tidal, etc.) Uncertain – Likely Mixed
2013-2014 Biennial Harvest Specifications Indirect Positive
Trawl Rationalization Trailing Actions Uncertain – Likely Positive
Summary of past, present, and future actions excluding those
proposed in this document
Overall, actions have had, or will have, positive impacts on
human communities

122
4.6.4 Proposed Action on all of the Affected Resources
The magnitude and significance of the cumulative effects, which include the additive and
synergistic effects of the proposed action, as well as past, present, and reasonably foreseeable
future actions, have been taken into account throughout this section.
Impacts to the physical environment are between slightly negative to neutral compared to the No
Action Alternative. The potential for greater bottom contact in the groundfish bottom trawl fishery
compared to the No Action Alternative is due to concentrated effort causing the vessel operator to
fish within a larger range of bottom habitat. Under No Action or action Alternatives (1&2),
groundfish bottom trawl gear could continue to be deployed in untrawlable habitat where
groundfish bottom trawl fishing is allowed, by which contact could damage the net, and endanger
the safety of the crew; two behaviors bottom trawl vessels are likely to avoid when possible. Most
of the increased bottom contact compared to the No Action Alternative will be to soft sedimentary
and mud bottom habitat (over 90 percent); no significant difference in impacts is projected among
the alternatives with regard to impact to hard bottom habitats, when considering the amount of
untrawlable hard bottom habitat in California Current Ecosystem within the entire West Coast EEZ
which bottom trawl fishing vessels will likely continue to avoid to avoid harm to their gear and to
reduce safety risks onboard the vessel. However, under the No-action Alternative, there is already
a great disincentive to allow groundfish bottom trawl gear to come into contact with sensitive
mixed/boulder and hard benthic habitats, such that the additional disincentive from increased
accessibility to fishing grounds may not have a substantial impact on behavior from areas that are
currently untrawled within open habitat (outside of existing trawl RCAs). Further, under catch
share management, bottom contact rate in the groundfish bottom trawl fishery is expected to
decline as catch is consolidated with the more efficient harvesters3.
Since 2002, NMFS has used large-scale, depth-based, closures to reduce catch of overfished
rockfish in fisheries that take and retain groundfish, directing harvest of healthy stocks to areas that
remained open. Impacts on the biological resources are primarily a function of the areas fished,
gear types used, and level of effort; and of these, area fished is the only factor that might be
affected. The levels of dermersal harvests will be variable. However declining trends in sablfish
ex-vessel price per pound coupled with lower biomass trajectories from historical levels in the near
future, at least for the short term (see 2013-2014 biennial specifications for the groundfish fishery,
discussed in Section 4.2.1 of this EA). This reduced population size will result in reduced harvest
opportunity for sablefish by all groundfish fishers and may shift effort to other fisheries to the
degree that fishery or individual fisher quotas allow. Processors and communities will also have
reduced product and fishery income, respectively, from the prominent sablefish resource and they
too will have to depend on other fisheries or income sources to make up for the reduced landings.
In the context of this downturn, alternatives which alleviate dependence on the sablefish resource,
allowing increased underutilized harvest may be more beneficial to the long-term stability in the
industry than would be the case if harvest levels were expected to remain stable, as underutilized
species markets will continue to improve under trawl rationalization.
In addition, the assumption is that small fish (i.e., non-target species) are able to escape codend
meshes improves small fish escapement and survival. While it is possible that under the No Action
Alternative there could be a decreased impact relative to the action alternatives, that impact is quite
3 Starting on January 1, 2014, all IFQ quota share permit holders may trade quota share pounds. Thus far, annual sales of quota pounds is allowed, but not of quota shares from individual permits.

123
small. In addition, minimally increased impacts to eulachon due to increased shoreward (75fm to
100fm) trawling opportunity compared to No Action conditions may occur. There is no difference
in impacts to listed species or to eulachon in particular because fishery impacts on eulachon have
been very small or negligible. In addition, the eulachon Biological Opinion concludes that West
Coast groundfish fisheries have minimal impact to the eulachon population growth rate. No
changes in impacts to target species, marine mammals, and seabirds compared to No Action are
expected among the action alternatives. Overall, the impacts on biological resources are neutral
when compared to the No Action Alternative.
In addition, West coast trawl vessels engage in other fisheries and derive substantial revenues from
those fisheries. Notable ones include shrimp and albacore. The income that trawlers receive from
these other fisheries is far from stable and as a result can be expected to fluctuate in future years
depending on the abundance or availability of these other resources to harvest. The availability of
these other fishing opportunities somewhat diminishes the importance of any gain in economic
efficiencies under the action alternatives, as compared to a situation in which vessels relied only on
the groundfish bottom trawl fishery.
For impacts to human communities, greater revenues from increased opportunity to fishing
grounds, with potentially a wider range of available opportunities to harvest target and
underutilized species compared to the No Action Alternative. The other action alternatives (1 and
2) have minimal impacts compared to the No Action Alternative. Thus, expected impacts are
beneficial in comparison to the baseline.
Therefore, when this proposed action is considered in conjunction with all the other pressures
placed on fisheries by past, present, and reasonably foreseeable future actions, it is not expected to
result in any significant impacts, positive or negative. Based on the information and analyses
presented in these past FMP documents and this document, there are no significant cumulative
effects associated with the action proposed in this document.
124
CHAPTER 5 STATUTORY REQUIREMENTS AND
APPLICABLE LAW
5.1 FMP Goals and Objectives and National Standards
The proposed action should further the goals and objectives of, and be consistent with, the Pacific
Coast Groundfish Fishery Management Plan (Groundfish FMP), and also be consistent with the
National Standards (NS) contained in the Magnuson-Stevens Act. The Groundfish FMP contains
three broad goals and 17 objectives intended to achieve those goals. As briefly described below, the
proposed action should:
Minimize bycatch, and mortality to bycatch, by demonstrating the effectiveness of
individual accountability under the Shorebased IFQ Program, even with increased
access to fishing grounds (NS 9, NS 1; FMP goal 3; FMP objectives 6, 9, 11,).
Improve safety at sea through reduced transiting requirements (NS 10; FMP objective
17).
Reduce regulatory complexity for industry and management (FMP objectives 15, 16)
Increase access to target stocks, while ensuring all other statutory requirements are met (NS 1, FMP Goals 1–3).
NATIONAL STANDARD 1 National Standard 1 states that conservation and management measures shall prevent overfishing
while achieving, on a continuing basis, the optimum yield from each fishery for the United
States fishing industry. The groundfish harvest specifications and management measures are implemented every two
years and incorporate the most recent scientific information, including new stock assessments.
The most recent harvest specifications cover 2013-2014 (78 FR 580, January 3, 2013). The
harvest specifications establish, in generally decreasing order, overfishing limits, acceptable
biological catch limits, annual catch limits, and harvest guidelines. In addition, for some species,
the harvest specifications also establish sector-specific allocations. Under the Groundfish FMP,
the annual catch limits are established in a manner to prevent overfishing while achieving optimum
yield (OY).

125
For the shorebased trawl fishery, the IFQ program increases individual accountability for total
catch, including bycatch, and gives fishermen greater discretion as to when and how to fish. This
provides greater opportunity to extract the full optimum yield while avoiding overfished species.
The 100 percent monitoring and increased accountability further reduces the risk of overfishing.
The proposed action would increase access to fishing grounds and contribute to achieving OY. Because this action would not change the overall amount of groundfish available to the trawl
fishery, and considering the increased accountability under the shorebased IFQ program,
the proposed action would continue to prevent overfishing while achieving OY. As the EA
demonstrates, the risk of exceeding an ACL or trawl sector allocation is low.
NATIONAL STANDARD 2 National Standard 2 states that conservation and management measures shall be based upon the best scientific information available. The EA and supporting analyses are based upon the best scientific information
available. The EA used data from various sources or summaries of that data, including data
from the Pacific Fisheries Information Network (PacFIN), Federal electronic fish tickets, the
NMFS limited entry permit database, West Coast Groundfish Observer Program (WCGOP)
data, state logbooks, and NMFS vessel monitoring systems and declarations data. NATIONAL STANDARD 3 National Standard 3 states that, to the extent practicable, an individual stock of fish shall be
managed as a unit throughout its range, and interrelated stocks of fish shall be managed as a
unit or in close coordination. The environmental impact statement for the 2013-2014 Groundfish Harvest Specifications and
Management Measures described the management units for Pacific coast groundfish. This action
would not modify those management units.
NATIONAL STANDARD 4 National Standard 4 states that conservation and management measures shall not discriminate
between residents of different states. If it becomes necessary to allocate or assign fishing privileges
among various United States fishermen, such allocation shall be (A) fair and equitable to all
such fishermen; (B) reasonably calculated to promote conservation; and (C) carried out in such
manner that no particular individual, corporation, or other entity acquires an excessive share of
such privileges.
The proposed action does not discriminate between residents of different states. The trawl RCA
boundaries could have incidental allocative effect, but the proposed action is not a direct
assignment of fishing privileges. NATIONAL STANDARD 5

126
National Standard 5 states that conservation and management measures shall, where
practicable, consider efficiency in the utilization of fishery resources; except that no such
measure shall have economic allocation as its sole purpose. The shorebased IFQ program was designed, in part, to reduce fleet capacity and to
economically rationalize the groundfish trawl fishery. The trawl fleet will likely consolidate and
fewer vessels will be used to harvest the available allocations, especially once quota share trading
is allowed. Reducing excess capacity is expected to improve the efficiency in the utilization of
fishery resources as well as reduce the levels of incidental catch. In addition, once quota trading
begins, quota is expected to move over the long-term to owners with more efficient fishing
operations. The proposed action would not alter these components of the shorebased IFQ program.
The proposed action should also increase the amount of fishing grounds available shoreward and
seaward of the current RCA boundaries, reducing fuel costs and transiting time. The proposed
action would also result in a simpler RCA configuration for enforcement and management
purposes. NATIONAL STANDARD 6 National Standard 6 states that conservation and management measures shall take into
account and allow for variations among, and contingencies in, fisheries, fishery resources, and
catches. The shorebased IFQ program provides greater flexibility to individual fishermen to determine
when and how to fish. This flexibility enhances the ability of fishermen and managers to
respond to unexpected circumstances. The program also provides for variations and contingencies
in the fishery by allowing transfer of quota through leasing and sales. In addition, the Council
retains the flexibility to act inseason to modify RCA boundaries in response to new information
should it be necessary. NATIONAL STANDARD 7 National Standard 7 states that conservation and management measures shall, where
practicable, minimize costs and avoid unnecessary duplication. The proposed action should minimize costs by simplifying RCA boundaries, increasing access to
fishing grounds, and reducing vessel transiting time. Generally, by coordinating management,
monitoring, and enforcement activities between NMFS, the Council, and the States, duplication,
and thus cost, is minimized. The proposed action would not introduce any new measures that
duplicate those already in place. NATIONAL STANDARD 8 National Standard 8 states that conservation and management measures shall, consistent
with the conservation requirements of this Act (including the prevention of overfishing and
rebuilding of overfished stocks), take into account the importance of fishery resources to fishing
communities in order to (A) provide for the sustained participation of such communities, and
(B) to the extent practicable, minimize adverse economic impacts on such communities. The proposed action alternatives would benefit fishing communities by increasing access to target
stocks and are not expected to have adverse economic impacts.

127
NATIONAL STANDARD 9 National Standard 9 states that conservation and management measures shall, to the extent
practicable, (A) minimize bycatch and (B) to the extent bycatch cannot be avoided, minimize the
mortality of such bycatch. The shorebased IFQ program was designed to improve total catch accounting (with 100% observer
coverage in all sectors and 100% dockside monitoring), reduce bycatch, increase target catches,
and promote greater individual responsibility. The proposed action would open areas where some
overfished species are more likely to be encountered. However, the action is not anticipated to
increase the amount of bycatch and fishermen are expected to avoid overfished species due to the
limited amount of quota pounds available.
NATIONAL STANDARD 10 National Standard 10 states that conservation and management measures shall, to the extent
practicable, promote the safety of human life at sea. The shorebased IFQ program provides fishermen with increased flexibility in determining when,
where, and how to fish. This is expected to reduce incentives to fish in unsafe conditions. Some
safety benefits were also expected to the degree that the fishery is more profitable and more
money is put into vessel maintenance. Less efficient vessels are expected to leave the trawl
fishery, which may eliminate older, less safe vessels. RCAs could affect safety if more vessels elect
to fish seaward of the closed areas and are more exposed to bad weather conditions. The proposed
action would increase the amount of fishing grounds both shoreward and seaward of the RCAs,
potentially reducing transit time and increasing safety.
128
5.2 Other Applicable MSA Provisions
NMFS prepared an EIS evaluating programmatic measures designed to identify and
describe west coast groundfish EFH (NMFS 2005), and minimize to the extent
practicable, adverse effects of fishing on west coast groundfish EFH. The Council took
final action amending the groundfish FMP to incorporate new EFH provisions in
November 2005. NMFS partially approved the amendment in March 2006. Implementing
regulations became effective in June 2006. The EA describes impacts of the proposed
action on EFH, consistent with the EFH assessment requirements of 50 CFR 600.920
(e)(3). The proposed action is not anticipated to result in substantial adverse effects to
groundfish EFH and is not anticipated to affect EFH designated for other species. No
additional EFH conservation recommendations are provided. The Council is currently
undertaking a review of its groundfish EFH designations and may take further steps to
minimize adverse effects of fishing on groundfish EFH at that time, if practicable.

129
CHAPTER 6 OTHER APPLICABLE
LAW
6.1 Other Federal Laws
6.1.1 Coastal Zone Management Act
Section 307(c)(1) of the Federal Coastal Zone Management Act (CZMA) of 1972
requires all Federal activities that directly affect the coastal zone be consistent with
approved state coastal zone management programs to the maximum extent practicable.
The proposed action would be implemented in a manner that is consistent to the
maximum extent practicable with the enforceable policies of the approved coastal zone
management programs of Washington, Oregon, and California. This determination has
been submitted to the responsible state agencies for review under Section 307(c)(1) of the
CZMA.
6.1.2 Endangered Species Act
The Endangered Species Act of 1973 (ESA) was signed on December 28, 1973, and
provides for the conservation of species that are endangered or threatened throughout all
or a significant portion of their range, and the conservation of the ecosystems on which
they depend. The ESA replaced the Endangered Species Conservation Act of 1969; it
has been amended several times.
A “species” is considered endangered if it is in danger of extinction throughout all or a
significant portion of its range. A species is considered threatened if it is likely to
become an endangered species within the foreseeable future.
Federal agencies are directed, under section 7(a)(1) of the ESA, to utilize their authorities
to carry out programs for the conservation of threatened and endangered species. Federal
agencies must also consult with NMFS or USFWS, under section 7(a)(2) of the ESA, on
activities that may affect a listed species. These interagency consultations, or section 7
consultations, are designed to assist Federal agencies in fulfilling their duty to ensure
Federal actions do not jeopardize the continued existence of a species or destroy or
adversely modify critical habitat. Should an action be determined to jeopardize a species
or result in the destruction or adverse modification of critical habitat, NMFS or USFWS
will suggest Reasonable and Prudent Alternatives (RPAs) that would not violate section
7(a)(2).

130
Biological opinions document whether the Federal action is likely to jeopardize the
continued existence of listed species, or result in the destruction or adverse modification
of critical habitat. Where appropriate, biological opinions provide an exemption for the
“take” of listed species while specifying the extent of take allowed, the Reasonable and
Prudent Measures (RPMs) necessary to minimize impacts from the Federal action, and
the Terms and Conditions with which the action agency must comply.
NMFS issued Biological Opinions under the Endangered Species Act (ESA) on August
10, 1990, November 26, 1991, August 28, 1992, September 27, 1993, May 14, 1996, and
December 15, 1999 pertaining to the effects of the PCGFMP fisheries on Chinook
salmon (Puget Sound, Snake River spring/summer, Snake River fall, upper Columbia
River spring, lower Columbia River, upper Willamette River, Sacramento River winter,
Central Valley spring, California coastal), coho salmon (Central California coastal,
southern Oregon/northern California coastal), chum salmon (Hood Canal summer,
Columbia River), sockeye salmon (Snake River, Ozette Lake), and steelhead (upper,
middle and lower Columbia River, Snake River Basin, upper Willamette River, central
California coast, California Central Valley, south/central California, northern California,
southern California). These biological opinions have concluded that implementation of
the PCGFMP is not expected to jeopardize the continued existence of any endangered or
threatened species under the jurisdiction of NMFS, or result in the destruction or adverse
modification of critical habitat.
NMFS issued a Supplemental Biological Opinion on March 11, 2006 concluding that
neither the higher observed bycatch of Chinook in the 2005 whiting fishery nor new data
regarding salmon bycatch in the groundfish bottom trawl fishery required a
reconsideration of its prior ‘‘no jeopardy’’ conclusion. NMFS also reaffirmed its prior
determination that implementation of the PCGFMP is not likely to jeopardize the
continued existence of any of the affected ESUs. Lower Columbia River coho (70 FR
37160, June 28, 2005) and Oregon Coastal coho (73 FR 7816, February 11, 2008) were
recently relisted as threatened under the ESA. The 1999 biological opinion concluded
that the bycatch of salmonids in the Pacific whiting fishery were almost entirely Chinook
salmon, with little or no bycatch of coho, chum, sockeye, and steelhead.
On November 21, 2012, the U.S. Fish and Wildlife Service (FWS) issued a biological
opinion concluding that the groundfish fishery will not jeopardize the continued existence
of the short-tailed albatross. The (FWS) also concurred that the fishery is not likely to
adversely affect the marbled murrelet, California least tern, southern sea otter, bull trout,
nor bull trout critical habitat.
On December 7, 2012, NMFS completed a biological opinion concluding that the
groundfish fishery is not likely to jeopardize non-salmonid marine species including
listed eulachon, green sturgeon, humpback whales, Steller sea lions, and leatherback sea
turtles. The opinion also concludes that the fishery is not likely to adversely modify
critical habitat for green sturgeon and leatherback sea turtles. An analysis included in the
same document as the opinion concludes that the fishery is not likely to adversely affect
green sea turtles, olive ridley sea turtles, loggerhead sea turtles, sei whales, North Pacific
131
right whales, blue whales, fin whales, sperm whales, Southern Resident killer whales,
Guadalupe fur seals, or the critical habitat for Steller sea lions.
6.1.3 Marine Mammal Protection Act
The MMPA of 1972 is the principle Federal legislation that guides marine mammal
species protection and conservation policy in the United States. Under the MMPA,
NMFS is responsible for the management and conservation of 153 stocks of whales,
dolphins, porpoise, as well as seals, sea lions, and fur seals; while the U.S. Fish and
Wildlife Service is responsible for walrus, sea otters, and the West Indian manatee.
Off the west coast, the Steller sea lion (Eumetopias jubatus) eastern stock, Guadalupe fur
seal (Arctocephalus townsendi), and Southern sea otter (Enhydra lutris) California stock
are listed as threatened under the ESA. The sperm whale (Physeter macrocephalus)
Washington, Oregon, and California stock, humpback whale (Megaptera novaeangliae)
Washington, Oregon, and California - Mexico Stock, blue whale (Balaenoptera
musculus) eastern north Pacific stock, and Fin whale (Balaenoptera physalus)
Washington, Oregon, and California stock are listed as depleted under the MMPA. Any
species listed as endangered or threatened under the ESA is automatically considered
depleted under the MMPA.
The west coast groundfish trawl fisheries are category III fisheries indicating a remote
likelihood of or no known serious injuries or mortalities to marine mammals. The
proposed action could affect the intensity, duration, and location of the groundfish bottom
trawl fishery through changes to RCA boundaries. But these changes are not anticipated
to change the effects of the groundfish fisheries on marine mammals.
6.1.4 Migratory Bird Treaty Act
The MBTA of 1918 was designed to end the commercial trade of migratory birds and
their feathers that, by the early years of the 20th century, had diminished the populations
of many native bird species. The MBTA states that it is unlawful to take, kill, or possess
migratory birds and their parts (including eggs, nests, and feathers) and is a shared
agreement between the United States, Canada, Japan, Mexico, and Russia to protect a
common migratory bird resource. The MBTA prohibits the directed take of seabirds,
but the incidental take of seabirds does occur. The proposed action is unlikely to affect
the incidental take of seabirds protected by the MBTA.
6.1.5 Paperwork Reduction Act
The proposed action, as implemented by any of the alternatives considered, does not
require collection-of-information subject to the Paperwork Reduction Act.

132
6.1.6 Regulatory Flexibility Act
The purpose of the Regulatory Flexibility Analysis (RFA) is to relieve small businesses,
small organizations, and small governmental entities of burdensome regulations and
record-keeping requirements. Major goals of the RFA are; (1) to increase agency
awareness and understanding of the impact of their regulations on small business, (2) to
require agencies to communicate and explain their findings to the public, and (3) to
encourage agencies to use flexibility and to provide regulatory relief to
small entities. The RFA emphasizes predicting impacts on small entities as a group
distinct from other entities and the consideration of alternatives that may minimize the
impacts while still achieving the stated objective of the action. An initial regulatory
flexibility analysis (IRFA) is conducted unless it is determined that an action will not
have a “significant economic impact on a substantial number of small
entities.” The RFA requires that an IRFA include elements that are similar to those
required by EO 12866 and NEPA. NMFS prepared an IRFA.
6.1.7 National Environmental Policy Act
The CEQ has issued regulations specifying the requirements for NEPA documents (40
CFR 1500 – 1508), and NOAA’s agency policy and procedures for NEPA can be found
in NOAA Administrative Order 216-6 (NAO 216-6). The following are core elements of
an EA (40 CFR § 1508.9):
1. The need for the proposal,
2. Alternatives as required by NEPA § 102(2)(E),
3. The environmental impacts of the proposed action and the alternatives, and
4. The agencies and persons consulted.
Related NEPA Documents
The following NEPA documents provide information and analyses related to the effects
of this proposed action:
Proposed Harvest Specifications and Management Measures for the 2013-2014
Pacific Coast Groundfish Fishery and Amendment 21-2 to the Pacific Coast
Groundfish Fishery Management Plan; Final Environmental Impact Statement.
Published by PFMC and NMFS in October 2012. (http://www.pcouncil.org/wp-
content/uploads/September_2012_Main_Document_13-14_FEIS_SPEX.pdf)
Proposed Harvest Specifications and Management Measures for the 2011-2012
Pacific Coast Groundfish Fishery and Amendment 16-5 to the Pacific Coast
Groundfish Fishery Management Plan to Update Existing Rebuilding Plans and
Adopt a Rebuilding Plan for Petrale Sole; Final Environmental Impact Statement.
Published by PFMC and NMFS in February 2011.
(http://www.pcouncil.org/groundfish/fishery-management-plan/fmp-amendment-
16-5/#16-5)

133
Rationalization of the Pacific Coast Groundfish Limited Entry Trawl Fishery
(Amendment 20 to the Groundfish FMP); Final Environmental Impact Statement
Including Regulatory Impact Review and Initial Regulatory Flexibility Analysis.
Published by the Pacific Fishery Management Council and NMFS in June 2010.
(http://www.pcouncil.org/groundfish/fishery-management-plan/fmp-amendment-
20/#EIS)
PFMC (Pacific Fishery Management Council) and NMFS (National Marine
Fisheries Service). Pacific Coast Groundfish Essential Fish Habitat, Final
Environmental Impact Statement. Pacific Fishery Management Council, Portland,
OR. December 2005.
(http://www.nwr.noaa.gov/publications/nepa/groundfish/final_groundfish_efh_eis
.html)
Information may be incorporated by reference from these documents into this EIS.
Council on Environmental Quality (CEQ) regulations (40 CFR 1502.21) state “Agencies
shall incorporate material into an environmental impact statement by reference when the
effect will be to cut down on bulk without impeding agency and public review of the
action. The incorporated material shall be cited in the statement and its content briefly
described.” When information from the above documents is incorporated, these
procedures are followed within the body of this EIS.
6.2 Executive Orders
6.2.1 EO 12866 (Regulatory Impact Review)
EO 12866, Regulatory Planning and Review, was signed on September 30, 1993, and
established guidelines for promulgating new regulations and reviewing existing
regulations. The EO covers a variety of regulatory policy considerations and establishes
procedural requirements for analysis of the benefits and costs of regulatory actions.
Section 1 of the EO deals with the regulatory philosophy and principles that are to guide
agency development of regulations. It stresses that in deciding whether and how to
regulate, agencies should assess all of the costs and benefits across all regulatory
alternatives. Based on this analysis, NMFS should choose those approaches that
maximize net benefits to society, unless a statute requires another regulatory approach.
6.2.2 EO 12898 (Environmental Justice)
EO 12898 obligates Federal agencies to identify and address “disproportionately high
adverse human health or environmental effects of their programs, policies, and activities
on minority and low-income populations in the United States” as part of any overall
environmental impact analysis associated with an action. NOAA guidance, NAO 216-6,
at Section 7.02, states that “consideration of EO 12898 should be specifically included in
the NEPA documentation for decision-making purposes.”

134
6.2.3 EO 13132 (Federalism)
EO 13132, which revoked EO 12612, an earlier federalism EO, enumerates eight
“fundamental federalism principles.” The first of these principles states “Federalism is
rooted in the belief that issues that are not national in scope or significance are most
appropriately addressed by the level of government closest to the people.” In this spirit,
the EO directs agencies to consider the implications of policies that may limit the scope
of or preempt states’ legal authority. Preemptive action having such “federalism
implications” is subject to a consultation process with the states; such actions should not
create unfunded mandates for the states; and any final rule published must be
accompanied by a “federalism summary impact statement.” The Council process offers
many opportunities for states (through their agencies, Council appointees, consultations,
and meetings) to participate in the formulation of management measures. This process
encourages states to institute complementary measures to manage fisheries under their
jurisdiction that may affect federally-managed stocks. The proposed action does not have
federalism implications subject to EO 13132.
6.2.4 EO 13175 (Consultation and Coordination with Indian Tribal Government)
EO 13175 is intended to ensure regular and meaningful consultation and collaboration
with tribal officials in the development of Federal policies that have tribal implications, to
strengthen the United States government-to-government relationships with Indian tribes,
and to reduce the imposition of unfunded mandates upon Indian tribes.
The Secretary recognizes the sovereign status and co-manager role of Indian tribes over
shared Federal and tribal fishery resources. In Section 302(b)(5), the MSA reserves a seat
on the Council for a representative of an Indian tribe with Federally-recognized fishing
rights from California, Oregon, Washington, or Idaho. The U.S. government formally
recognizes the four Washington coastal tribes (Makah, Quileute, Hoh, and Quinault) have
treaty rights to fish for groundfish. In general terms, the quantification of those rights is
50 percent of the harvestable surplus of groundfish available in the tribes’ U and A
fishing areas (described at 50 CFR 660.324). Each of the treaty tribes has the discretion
to administer their fisheries and to establish their own policies to achieve program
objectives.
6.2.5 EO 13186 (Responsibilities of Federal Agencies to Protect Migratory Birds)
EO 13186 supplements the MBTA (above) by requiring Federal agencies to work with
the U.S. Fish and Wildlife Service (USFWS) to develop memoranda of agreement to
conserve migratory birds. NMFS is in the process of implementing a memorandum of
understanding. The protocols developed by this consultation will guide agency regulatory
actions and policy decisions in order to address this conservation goal. The EO also
directs agencies to evaluate the effects of their actions on migratory birds in

135
environmental documents prepared pursuant to the NEPA. Past EISs evaluating the
impact of groundfish harvest specifications (PFMC 2004b; PFMC 2006; PFMC
2008a) evaluated impacts to seabirds and concluded that the proposed action will not
significantly impact seabirds. There is no new information to indicate that the current
proposed action would result in greater impacts to seabirds.

136
CHAPTER 7 LIST OF AGENCIES AND
PERSONS CONSULTED AND
PREPARERS
Agencies and Persons Consulted
Ryan Couch (NMFS; GCNW)
Sarah Biegel (NMFS; NWR NEPA)
Ian Taylor (NMFS; NWFSC)
Dr. Steve Freese (NMFS; NWR)
Dan Ayres (WDFW)
Lorna Wargo (WDFW)
Dan Erikson (ODFW)
Dr. Bob Hannah (ODFW)
Peter Calvass (CDFW)
Preparers
Colby Brady (NMFS; NWR)
Sean Matson (NMFS; NWR)
Barbara Seekins (NMFS; NWR)
Gretchen Hanshew (NMFS; NWR)
Point of Contact for Additional Copies of this Environmental Assessment or
Questions
Colby Brady (NMFS; NWR), [email protected], (206) 526-6117

137
CHAPTER 8 REFERENCES
8.1 Council and NMFS related document references:
PFMC and NMFS. 2002. Environmental Assessent/Regulatory Impact Review for
Proposed 2002 Groundfish Acceptable Biological Catch and Optimum Yield
Specification and Management Measures for the Pacific Coast Groundfish Fishery,
Pacific Fishery Management Council, Portland, OR. October 2001.
Pacific Fishery Management Council (PFMC). 2003. Final Environmental Impact
Statement for the Proposed Groundfish Acceptable Biological Catch and Optimum Yield
Specifications and Management Measures: 2003 Pacific Coast Groundfish Fishery.
Pacific Fishery Management Council, Portland, OR.
Pacific Fishery Management Council. 2004. Acceptable biological catch and optimum
yield specification and management measures for the 2004 Pacific Coast groundfish
fishery. Final environmental impact statement and regulatory analyses. Pacific Fishery
Management Council, Portland, OR. January 2004
Pacific Fishery Management Council. 2004. Acceptable biological catch and optimum
yield specification and management measures for the 2005-2006 Pacific Coast groundfish
fishery. Final environmental impact statement and regulatory analyses. Pacific Fishery
Management Council, Portland, OR. October 2004
PFMC (Pacific Fishery Management Council) and NMFS (National Marine Fisheries
Service). 2006. Proposed Acceptable Biological Catch and Optimum Yield Specifications
and Management Measures for the 2007-2008 Pacific Coast Groundfish Fishery, and
Amendment 16-4: Rebuilding Plans For Seven Depleted Pacific Coast Groundfish
Species; Final Environmental Impact Statement Including Regulatory Impact Review and
Initial Regulatory Flexibility Analysis. Pacific Fishery Management Council, Portland,
OR. October 2006.
PFMC and NMFS. 2009. Proposed Acceptable Biological Catch and Optimum Yield
Specifications and Management Measures for the 2009-2010 Pacific Coast Groundfish
138
Fishery Final Environmental Impact Statement Including Regulatory Impact Review and
Initial Regulatory Flexibility Analysis. Pacific Fishery Management Council, Portland,
OR. January 2009.
PFMC (Pacific Fishery Management Council) and NMFS (National Marine Fisheries
Service). 2012. Proposed Harvest Specifications and Management Measures for the
2013-2014 Pacific Coast Groundfish Fishery and Amendment 21-2 to the Pacific Coast
Fishery Management Plan, Final Environmental Impact Statement. Pacific Fishery
Management Council, Portland, OR. September 2012.
West Coast Groundfish IFQ Fishery Catch Summary for 2011: First Look, Sean E.
Matson, Ph.D. National Marine Fisheries Service NWR, Sustainable Fisheries Division,
Agenda Item F.6.b Supplemental NMFS Report March 2012
Annual Catch Report for the Pacific Coast Groundfish, Shorebased IFQ Program in 2012,
Sean E. Matson, Ph.D. National Marine Fisheries Service NWR, Sustainable Fisheries
Division, Agenda Item D.2.c, Supplemental NMFS Report April 2013
PFMC (Pacific Fishery Management Council) and NMFS (National Marine Fisheries
Service). Pacific Coast Groundfish Essential Fish Habitat, Final Environmental Impact
Statement. Pacific Fishery Management Council, Portland, OR. December 2005.
PFMC (Pacific Fishery Management Council) and NMFS (National Marine Fisheries
Service). 2010. Rationalization of the Pacific Coast Groundfish Limited Entry Trawl
Fishery; Final Environmental Impact Statement Including Regulatory Impact Review and
Initial Regulatory Flexibility Analysis. Pacific Fishery Management Council, Portland,
OR. June 2010.
Pacific Fishery Management Council. 2013. Pacific Coast Fishery Ecosystem Plan for
the U.S. Portion of the California Current Large Marine Ecosystem – Public Review
Draft, February 2013. (Document prepared for the Council and its advisory entities.)
Pacific Fishery Management Council, 7700 NE Ambassador Place, Suite 101, Portland,
Oregon 97220-1384.
PFMC (Pacific Fishery Management Council) and NMFS (National Marine Fisheries
Service). 2011. Pacific Coast Groundfish Fishery Management Plan for the California,
Oregon, and Washington Groundfish Fishery. Pacific Fishery Management Council,
Portland, OR, December 2011
National Marine Fisheries Service (NMFS). 2013. Groundfish Essential Fish Habitat
Synthesis: A Report to the Pacific Fishery Management Council. NOAA NMFS
Northwest Fisheries Science Center, Seattle, WA, April 2013. 107 p.
Jannot, J., Heery, E., Bellman, M.A., and J. Majewski. 2011. Estimated bycatch of
marine mammals, seabirds, and sea turtles in the US west coast commercial groundfish
fishery, 2002-2009. West Coast Groundfish Observer Program. National Marine
Fisheries Service, NWFSC, 2725 Montlake Blvd E., Seattle, WA 98112.
139
Whitmire C and Clarke E 2007. State of Deep Coral Ecosystems in the Pacific Coast
Region. pp. 109-154. In: SE Lumsden, Hourigan TF, Bruckner AW and Dorr G (eds.)
The State of Deep Coral Ecosystems of the United States. NOAA Technical Memo-
randum CRCP-3. Silver Spring MD 365 pp.
Keller, A.A., B.H. Horness, E.L. Fruh, V.H. Simon,V.J. Tuttle, K.L. Bosley, J.C.
Buchanan, D.J. Kamikawa, and J.R. Wallace. 2008. The 2005 U.S. West Coast bottom
trawl survey of groundfish resources off Washington, Oregon, and California: Estimates
of distribution, abundance, and length composition. U.S. Dept. Commer., NOAA Tech.
Memo. NMFS-NWFSC-93, 136 p.
Brancato, M.S., C.E. Bowlby, J. Hyland, S.S. Intelmann, and K. Brenkman. 2007.
Observations of Deep Coral and Sponge Assemblages in Olympic Coast National Marine
Sanctuary, Washington. Cruise Report: NOAA Ship McArthur II Cruise AR06-06/07.
Marine Sanctuaries Conservation Series NMSP-07-03. U.S. Department of Commerce,
National Oceanic and Atmospheric Administration, National Marine Sanctuary Program,
Silver Spring, MD. 48 pp.
Occurrences of Habitat-forming Deep Sea Corals in the Northeast Pacific Ocean, A
Report to NOAA’s Office of Habitat Conservation. Peter Etnoyer and Lance Morgan,
Marine Conservation Biology Institute, December 2003.
Important Ecological Areas, Seafloor Habitat Expedition Off the Oregon Coast.
Enticknap, Shester, Gorny, Kelly. Oceana Pacific, March, 2013.
Journal Articles
Shortspine thornyhead and rockfish (Scorpaenidae) distribution in response to
substratum, biogenic structures and trawling, Du Preez & Tunnicliffe: Scorpaenid fish
and seafloor features, Mar Ecol Prog Ser 425: 217–231, 2011
An assessment of juvenile Pacific Ocean perch (Sebastes alutus) habitat use in a
deepwater nursery, C.N. Rooper et al., Estuarine, Coastal and Shelf Science, (2007)
75:371-380.
Evaluation of a US west coast groundfish habitat conservation regulation via analysis of
spatial and temporal patterns of trawl fishing effort, Bellman et al, 2005, Can. J. Fish.
Aquat. Sci. 62: 2886–2900 (2005).
Twenty Years of Fish-Habitat Studies on Heceta Bank, Oregon, Tissot et al., Marine
Habitat Mapping Technology for Alaska, J.R. Reynolds and H.G. Greene (eds.) 203
Alaska Sea Grant College Program, University of Alaska Fairbanks.
doi:10.4027/mhmta.2008.15
Fishing gear effects and ecology of the sea whip (Halipteris willemoesi (Cnidaria:
Octocorallia: Pennatulacea)) in British Columbia, Canada: preliminary observations,

140
Troffe et al., Aquatic Conserv: Mar. Freshw. Ecosyst. 15: 523–533 (2005)
Assessing habitat utilization and rockfish (Sebastes spp.) biomass on an isolated rocky
ridge using acoustics and stereo image analysis, Rooper et al., Can. J. Fish. Aquat. Sci.
67: 1658–1670 (2010)
Habitat-based submersible assessment of macro-invertebrate and groundfish
assemblages at Heceta Bank, Oregon, from 1988 to 1990, B.N. Tissot et al. / Journal of
Experimental Marine Biology and Ecology 352 (2007) 50–64
Comparison of trawled vs untrawled mud seafloor assemblages of fishes and
macroinvertebrates at Coquille Bank, Oregon, M.A. Hixon, B.N. Tissot / Journal of
Experimental Marine Biology and Ecology 344 (2007) 23–34
Recruitment of Three Species of Juvenile Rockfish (Sebastes spp.) on Soft Benthic Habitat
in Monterey Bay, California, Johnson et. Al: CalCOFl Rep., Vol. 42, 2001
Spatial Changes in Trawl Fishing Effort in Response to Footrope Diameter Restrictions
in the U.S. West Coast Bottom Trawl Fishery, Robert W. Hannah, North American
Journal of Fisheries Management 23:693-702, 2003
Curtis, J.M.R., K. Poppe, C.C. Wood. 2013. Indicators, impacts and recovery of
temperate deepwater marine ecosystems following fishing disturbance. DFO Can. Sci.
Advis. Sec. Res. Doc. 2012/125. v + 37 p.
Mapping Cumulative human impacts to California Current marine ecosystems. Halpern
et al., 2009., Conservation Letters 2 (2009) 138-148
Reinterpreting the State of Fisheries and their Management. Ray Hilborn, Ecosystems,
Vol. 10, No. 8 (December, 2007), pp. 1362-1369
Calculation of untrawlable areas within the boundaries of a bottom trawl survey.
Zimmerman, Canadian Journal of Fisheries and Aquatic Science, 60: 657-669 (2003)
Cumulative impacts of fisheries in the California Current. Fish and Fisheries. Kaplan et
al., 19 JUN 2012, DOI: 10.1111/j.1467-2979.2012.00484.x
Review of the California Trawl Fishery for Pacific Ocean Shrimp, Pandalus jordani,
from 1992 to 2007. Frimodig et al., 71(2), 2009, Marine Fisheries Review (ISSN 0090-
1830), Na- tional Marine Fisheries Service, NOAA
Video-Supervised Classification of Sonar Data for Mapping Seafloor Habitat. Guy R.
Cochrane. Marine Habitat Mapping Technology for Alaska, J.R. Reynolds and H.G.
Greene (eds.) 183-194. 185 Alaska Sea Grant College Program, University of Alaska
Fairbanks. doi:10.4027/mhmta.2008.13, U.S. Geological Survey, Santa Cruz, California.

141
Journal article in prep:
Distribution of demersal fishes along the U.S. west coast (Canada to Mexico) in relation
to spatial fishing closures (2003 – 2011), In prep. Aimee A. Keller, W. Waldo
Wakefield, Curt E. Whitmire, Beth H. Horness, Marlene A. Bellman, Keith L. Bosley,
2013.

142
CHAPTER 9 FINDING OF NO SIGNIFICANT
IMPACT
National Oceanic and Atmospheric Administration Administrative Order 216-6 (NAO 216-6) (May 20, 1999) contains criteria for determining the significance of the impacts of a proposed action. In addition, the Council on Environmental Quality regulations at 40 C.F.R. 1508.27 state that the significance of an action should be analyzed both in terms of “context” and “intensity”. Each criterion listed below is relevant in making a finding of no significant impact and has been considered individually, as well as in combination with the others. The significance of this action is analyzed based on the NAO 216-6 criteria and CEQ’s context and intensity criteria. These include: (1) Can the proposed action be reasonably expected to jeopardize the sustainability of any target species that may be affected by the action? The proposed action is not expected to jeopardize the sustainability of groundfish target
species because the proposed action will not affect the manner by which annual catch
limits are established through the biennial harvest specifications and management
measures. Under the shorebased IFQ program, all catch of IFQ species, retained or
discarded, must be covered by quota pounds. Fishermen are individually accountable for
their catch, and are subject to a 100 percent monitoring requirement. Non-IFQ species are
managed by groundfish trip limits. Therefore, the proposed action is not expected to
jeopardize the sustainability of any target species (see chapter 4 for additional
discussion).
(2) Can the proposed action be reasonably expected to jeopardize the sustainability of any non-target species? This action cannot reasonably be expected to jeopardize the sustainability of any non-
target species because as mentioned above, the proposed action is anticipated to allow
members of industry greater flexibility in attaining their target catch. Catch of non-
groundfish species (i.e., CPS, HMS, etc.) are accounted for in set asides in their FMPs.
Catch of non-Groundfish FMP species are also reviewed and accounted for in annual
WCGOP Groundfish Mortality Reports. Under the proposed action, overall fishing effort
is not likely to increase or change significantly. Changes in effort location are not
anticipated to increase impacts to non-target species to the extent that their sustainability
would be jeopardized.

143
(3) Can the proposed action be reasonably expected to allow substantial damage to the ocean and coastal habitats and/or EFH as defined under the Magnuson-Stevens Fishery Conservation and Management Act and identified in FMPs?
As discussed in Sections 4.1 and 4.2, the action proposed cannot reasonably be expected
to allow substantial damage to the ocean and coastal habitats and/or EFH as defined
under the Magnuson-Stevens Fishery Conservation and Management Act and identified
in the FMP because the coastal habitats are not affected since the action is in the open
ocean. For non-groundfish FMPs, EFH is pelagic; therefore, the proposed action is not
expected to affect non-groundfish EFH. Only groundfish EFH would likely be affected.
The Council identified Groundfish EFH, and minimized to the extent practicable adverse
effects on such habitat caused by fishing, through the adoption of Amendment 19 to the
Groundfish FMP in 2005. Amendment 19, which NMFS partially approved in 2006,
recognized that the trawl RCA closures are established and modified on a continuing
basis to reduce bycatch of overfished species, although some habitat benefits may accrue
incidentally. A large portion of the RCA that would be opened under the proposed action
is already open to bottom trawling at specific periods during the year or has been opened
in the recent past. Therefore, the action is unlikely to cause substantial damage when
compared to the No Action. The portion of the proposed action that would modify the
RCA from a seaward boundary line between 40° 10' N. lat. and 45° 46' N. lat.
approximating 200 fm to a line approximating 150 fm, during periods 1-6 (note that the
modified 200 fm line is currently in place in periods 1 and 6), would open an area that
has been closed to bottom trawling for a longer period of time. Fixed gear/longline effort
on hard and medium substrate in this area has likely already impacted this habitat.
Unintentional incursions into the RCA or effort in other fisheries also have the potential
to alter habitat despite the closure. At this point, no substantial damage from the
proposed action is anticipated when viewed in the context of the action.
Additional GIS analysis has been conducted for the area that may have had a greater
opportunity to recover (150 fm-200 fm, 40 10’ to 45 46’) to more precisely determine the
localized intensity of any habitat impacts that would occur. All existing closures
established through Amendment 19 and gear requirements that minimize impacts to
habitat remain in place under the proposed action. In addition, the core RCA area
between the 100 fm and 150 fm boundary lines would remain in place.
(4) Can the proposed action be reasonably expected to have a substantial adverse impact on public health or safety? This action is not expected to have substantial adverse impacts on public health or safety
because the program as implemented in 2011 provides fishermen with increased
flexibility in determining when, where, and how to fish. This is expected to reduce
incentives to fish in unsafe conditions. Some safety benefits were also expected to the
degree that the fishery is more profitable and more money is put into vessel maintenance.
Less efficient vessels are expected to leave the trawl fishery, which may eliminate older,
less safe vessels. The proposed action boundaries will reduce transit distance and
therefore, potentially benefit safety of fishing crews by reducing time on the water.

144
(5) Can the proposed action be reasonably expected to adversely affect endangered or threatened species, marine mammals, or critical habitat of these species? The proposed action cannot reasonably be expected to adversely affect endangered or
threatened species, marine mammals, or the critical habitat of these species because the
activities to be conducted under the proposed action are within the scope of the FMP and
do not change the basis for the determinations made in previous consultations. Impacts of
this action on these resources were assessed in Sections 4.3 and 4.6 of this document. No
significant impacts are expected on listed species or critical habitat outside of the scope
of what has been analyzed in existing biological opinions. Any encounters will continue
to be monitored with 100 percent monitoring requirement of the IFQ program. Gathered
data will be utilized by the Council’s Endangered Species Groundfish Workgroup to
advise the Council on how to improve avoidance of protected species. Under the
proposed action, overall fishing effort is not likely to increase or change significantly.
Instead, some dispersal of existing effort is likely. Changes in effort location are difficult
to predict but are not anticipated to increase impacts to non-target species, including
listed species and marine mammals.
(6) Can the proposed action be expected to have a substantial impact on biodiversity and ecosystem function within the affected area (e.g., benthic productivity, predator-prey relationships)? The proposed action cannot be expected to have a substantial impact on biodiversity and
ecosystem function within the affected area because, as described in Chapter 4, minimal,
if any, impacts are expected from implementation of the proposed Alternatives. No
significant change from status quo is expected because the area proposed to be open has
been recently impacted by non-trawl gear, pink shrimp bottom trawl activity, groundfish
fixed gear, and groundfish bottom trawl activities. Any impacts to ecosystem function
and biodiversity are anticipated to be similar to No Action.
(7) Are significant social or economic impacts interrelated with significant natural or physical environmental effects? As discussed in Chapter 4 of this EA, there are no significant social or economic impacts interrelated with significant natural or physical environmental effects because the implementation of the proposed action will not result in significant natural or physical environmental effects. To the extent increased access to fishing grounds allows fishermen to more successfully harvest target stocks and minimize transit time, the proposed action could result in some beneficial economic effects. (8) To what degree are the effects on the quality of human environment expected to be highly controversial?

145
There is some scientific literature suggesting that invertebrate communities are healthier
in non-trawled habitat compared with trawled habitat. The effects of the proposed action
on the quality of human environment are not expected to be highly controversial because
this action is spatial in nature and is not expected to have any scientific controversy
associated with it.
(9) Can the proposed action reasonably be expected to result in substantial impacts on unique areas, such as historic or cultural resources, park land, prime farmlands, wetlands, wild and scenic rivers or ecologically critical areas? The Pacific coast groundfish fishery is not known to take place in any unique areas such
as historic or cultural resources, park land, prime farmlands, wetlands, wild and scenic
rivers, or ecologically critical areas. The proposed action is not anticipated to affect
unique characteristics of the geographic area. The liberalized RCA structure would allow
trawling in areas with benthic substrate and habitat characteristics typical of areas
currently subject to trawl effort. Therefore, the proposed action is not expected to have a
substantial impact on any of these areas.
(10) Are the effects on the human environment likely to be highly uncertain or involve unique or unknown risks? The effects of the proposed action on the human environment, which are described in
Chapter 4 of the EA, are not likely to be highly uncertain or involve unique or unknown
risks because the action is not expected to significantly alter fishing methods or activities
that would have a significant impact on the human environment. Trawl RCA boundaries
have been routinely adjusted over various depths through various inseason actions since
their inception in 2002, with catch documented (including habitat substrate data) by the
West Coast Groundfish Observer Program, and the effects of such catch have been
analyzed. Accordingly, highly uncertain, unique, or unknown risks are anticipated to be
minimal based on previous experience. Additionally, routine inseason action authority
will allow the Council and NMFS to revert to more restrictive RCA boundaries if
warranted, based on new biological or physical information. Effects to biological and
physical resources are not anticipated to involve unique or unknown risks because this
action is likely to redistribute some existing trawl effort, with expected similar impacts to
other areas that have been trawled in the past. To the extent liberalized RCA
configurations result in more dispersed effort over a larger area, intensity of localized
effects could be reduced.
(11) Is the proposed action related to other actions with individually insignificant, but cumulatively significant impacts?

146
The proposed action, together with past, present, and reasonably foreseeable future actions, is not expected to result in significant cumulative impacts on the biological and physical components of the environment or on human communities. This proposed action is not related to any other actions that could, together, have cumulatively significant impacts (see Cumulative Effects Summary in Section 4.6). (12) Is the proposed action likely to adversely affect districts, sites, highways, structures, or objects listed in or eligible for listing in the National Register of Historic Places or may cause loss or destruction of significant scientific, cultural or historical resources? The proposed action will not affect districts, sites, highways, structures, or objects listed in or eligible for listing in the National Register of Historic Places or cause the loss or destruction of significant scientific, cultural, or historical resources because the Pacific coast groundfish fishery does not take place in the vicinity of any of these areas or resources. (13) Can the proposed action reasonably be expected to result in the introduction or spread of a non-indigenous species? The proposed action cannot reasonably be expected to result in the introduction or spread of a non-indigenous species because the activities under the proposed action will not involve the transport of non-indigenous species. The fishing vessels participating in the proposed action would not increase the risk of introduction through ballast water or hull fouling. Disposition of the catch does not include any translocation of living marine resources, nor use of any non-indigenous species as bait. (14) Is the proposed action likely to establish a precedent for future actions with significant effects or represents a decision in principle about a future consideration? The proposed action is not anticipated to establish a precedent for future actions with
significant effects. The Council is currently undertaking a five-year review of groundfish
EFH. The ability for the Council to take additional practicable measures to minimize
adverse effects to EFH, should it be determined necessary through the EFH review, will
not be precluded by this proposed action. Most of the areas that would be opened under
the proposed action are already subject to trawl or other fishery effort at various times
during the year. Some of the preliminary EFH review documentation considers the core
RCA closure between the 100 fm and 150 fm boundary lines to be a Marine Protected
Area of unknown duration. This action would maintain that core closed area.
(15) Can the proposed action reasonably be expected to threaten a violation of Federal, state, or local law or requirements imposed for the protection of the environment?

147
This action is not expected to alter fishing methods or activities such that they threaten a violation of Federal, state, or local law or requirements imposed for the protection of the environment because this action is not expected to alter fishing methods in any way except to change the level of catch or landings that are permitted for the fishery as a whole. (16) Can the proposed action reasonably be expected to result in cumulative adverse effects that could have a substantial effect on the target species or non-target species? As detailed in Section 4.6, the proposed action is not expected to result in cumulative adverse effects that could have a substantial effect on the target species or non-target species because the proposed action is anticipated to allow members of industry greater flexibility in attaining their target catch by increasing the flexibility of groundfish bottom trawl fishing activities. Impacts on target and non-target species are primarily a function of the areas fished, gear types used, and level of effort; and, of these, area fished is the only factor that might be affected as a result of the proposed action. No change is being made to the allocation of quota; therefore, this action is not expected to jeopardize the sustainability of the target or non-target species. DETERMINATION In view of the information presented in this document and the analysis contained in the supporting Environmental Assessment, it is hereby determined that the proposed action will not significantly impact the quality of the human environment as described above and in the Environmental Assessment. In addition, all beneficial and adverse impacts of the proposed action have been addressed to reach the conclusion of no significant impacts. Accordingly, preparation of an Environmental Impact Statement for this action is not necessary. ________________________________________ _________________ Deputy Regional Administrator, Northwest Region, NMFS Date