trb webinar: maintenance practices for traffic sign...
TRANSCRIPT
TRB Webinar: Maintenance Practices for
Traffic Sign Retroreflectivity

Today’s Presenters and ModeratorPaul Carlson, Texas Transportation Institute at Texas A&M University, [email protected]
Jim Ellison, Pierce County, WA, [email protected]
Chris May, Herbert, Rowland & Grubic, Inc.,[email protected]

Today’s Presenters and ModeratorMatt Rauch, Wisconsin Department of Transportation, [email protected]
Dave Kniffin, 3M Company, [email protected]

Introductory Remarks
Paul CarlsonTexas Transportation Institute at Texas A&M University
Chair of TRB’s Signing and Marking Materials committee
Tapping into the Power of a Traffic Sign Inventory to Meet the New Retroreflectivity Requirements
James W. Ellison, P.E.County Traffic EngineerPierce County, WA
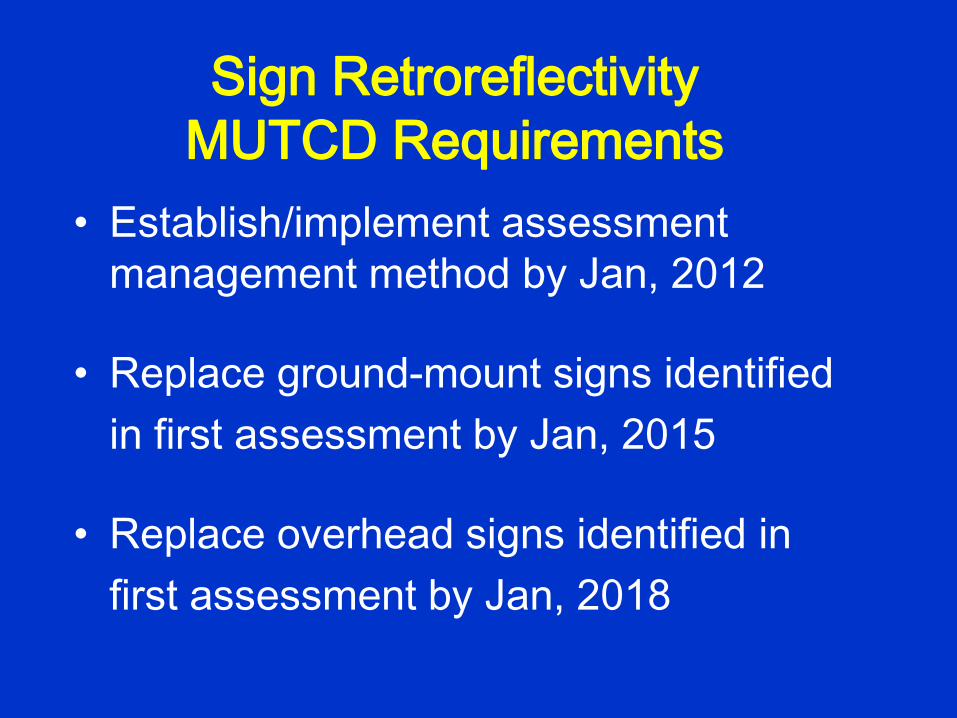
Sign Retroreflectivity MUTCD Requirements
• Establish/implement assessment management method by Jan, 2012
• Replace ground-mount signs identifiedin first assessment by Jan, 2015
• Replace overhead signs identified infirst assessment by Jan, 2018
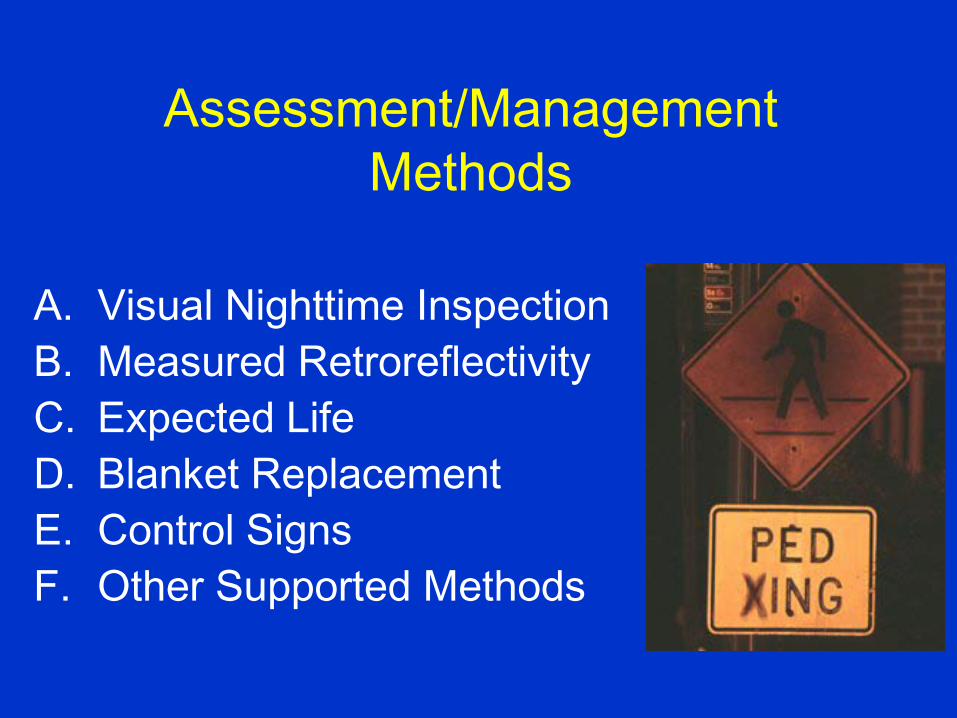
Assessment/Management Methods
A. Visual Nighttime InspectionB. Measured RetroreflectivityC. Expected LifeD. Blanket ReplacementE. Control SignsF. Other Supported Methods
Sign Retroreflectivity
• Which assessment or management method is best??
• What is the best way to optimize use of our labor, equipment, and materials??
• Our Sign Inventory became a powerful tool that helped guide us to the best answer…. for us.
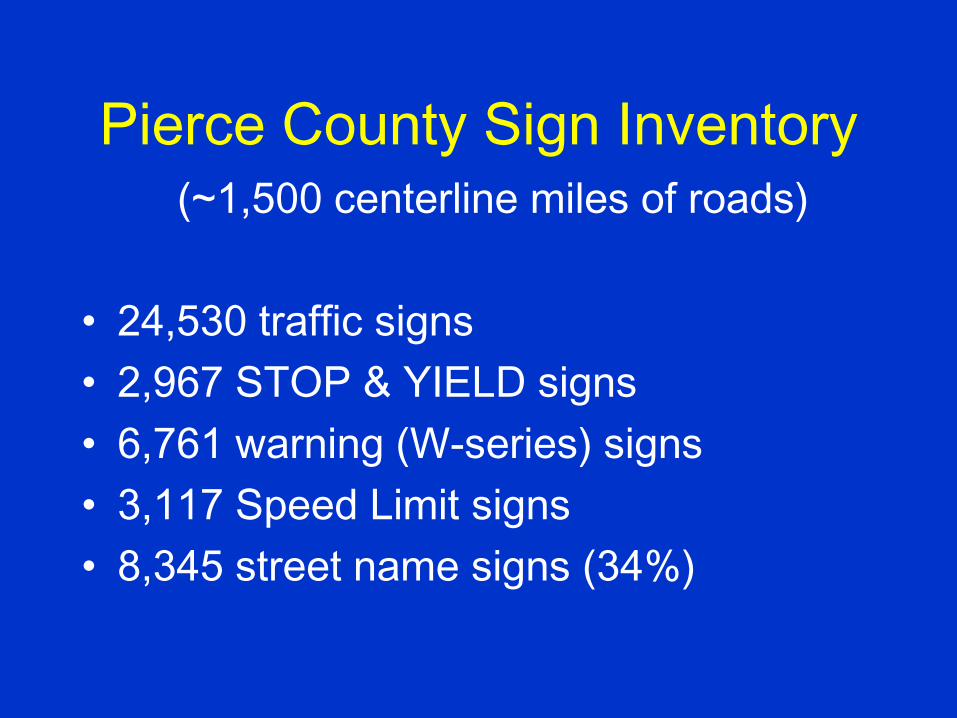
Pierce County Sign Inventory(~1,500 centerline miles of roads)
• 24,530 traffic signs• 2,967 STOP & YIELD signs• 6,761 warning (W-series) signs• 3,117 Speed Limit signs• 8,345 street name signs (34%)
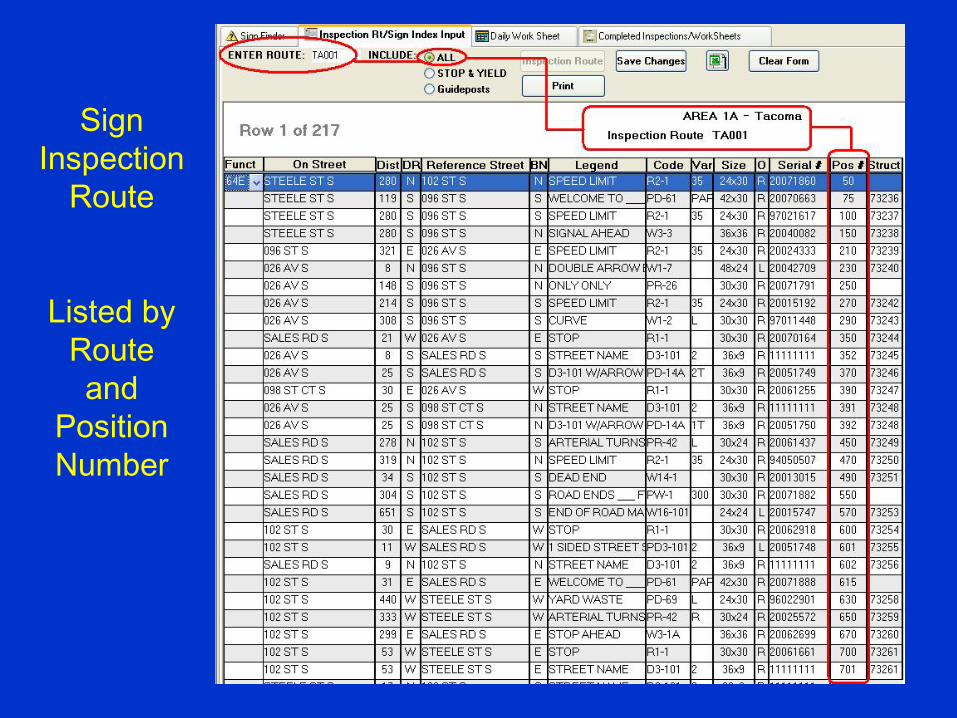
SignInspection
Route
Listed by Route and
Position Number
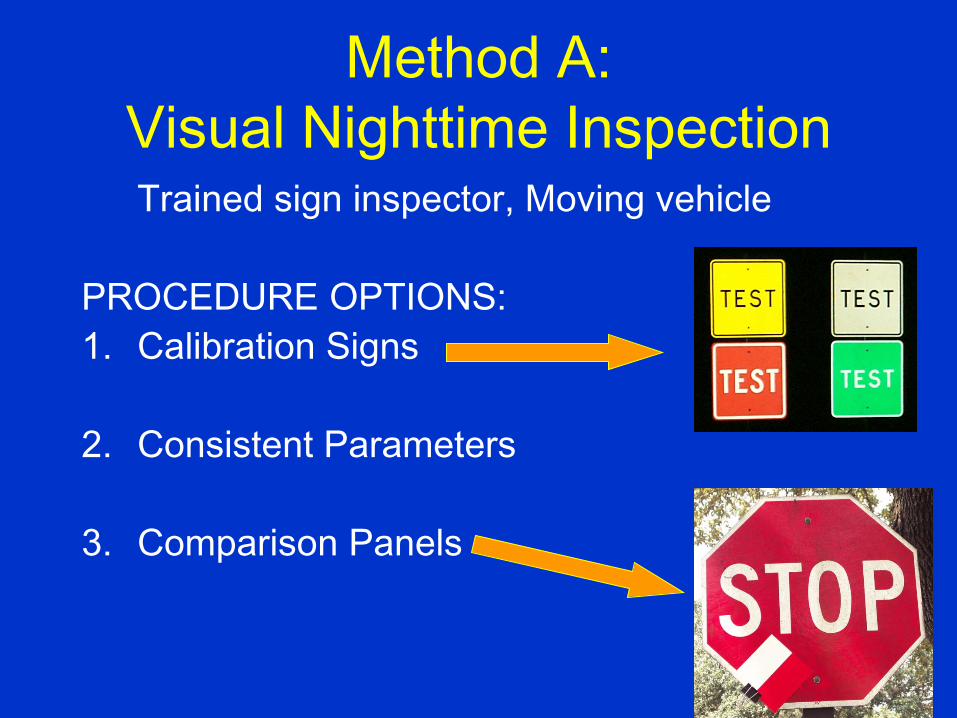
Method A: Visual Nighttime InspectionTrained sign inspector, Moving vehicle
PROCEDURE OPTIONS:1. Calibration Signs
2. Consistent Parameters
3. Comparison Panels
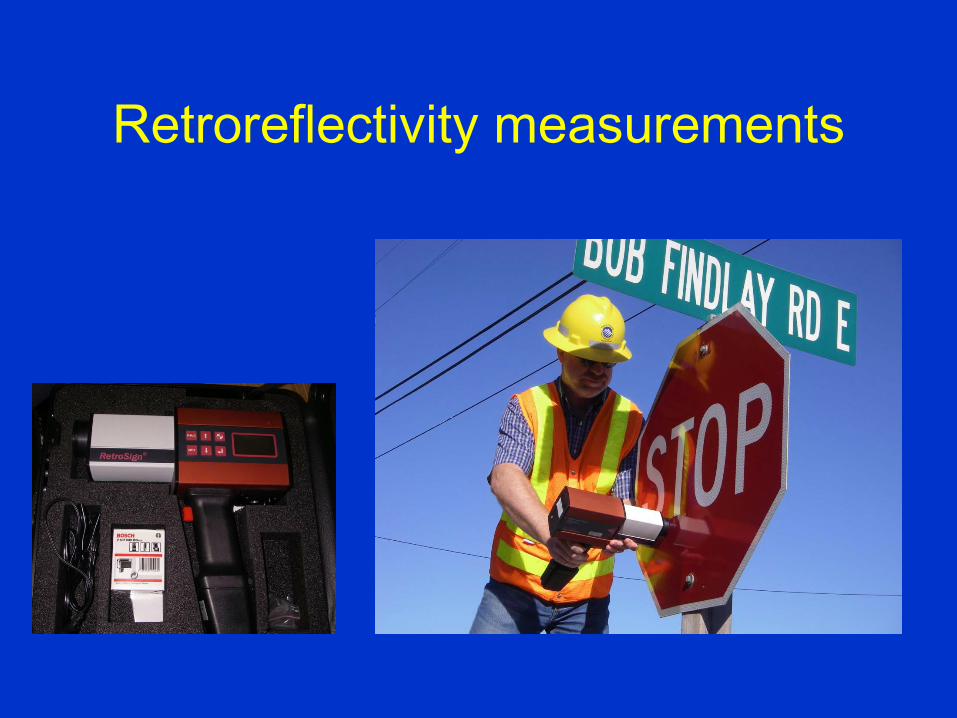
Retroreflectivity measurements
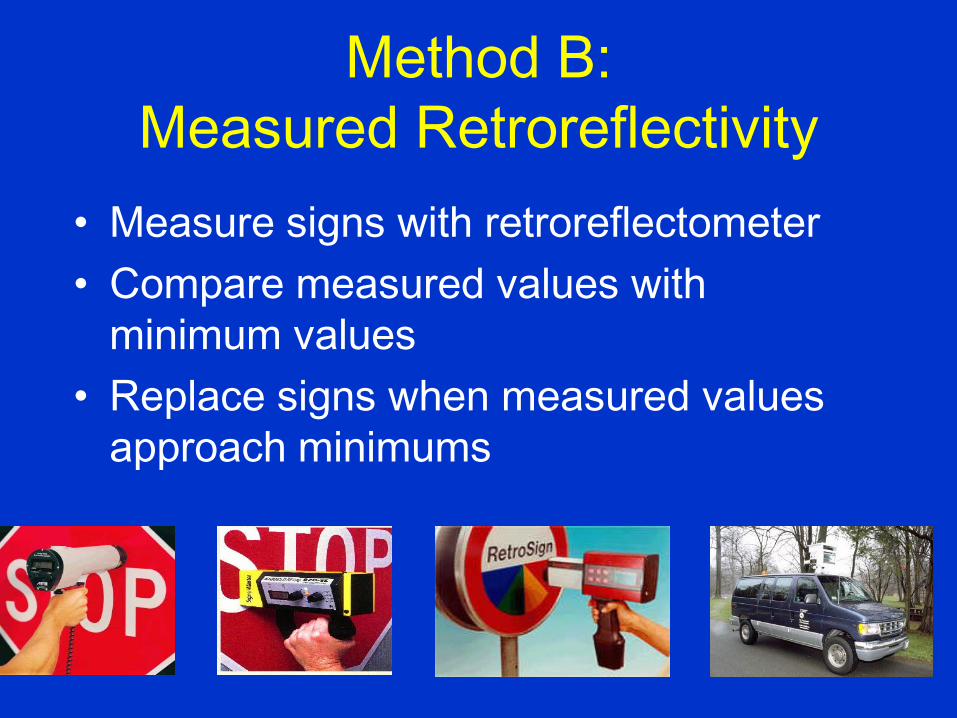
Method B:Measured Retroreflectivity
• Measure signs with retroreflectometer• Compare measured values with
minimum values• Replace signs when measured values
approach minimums
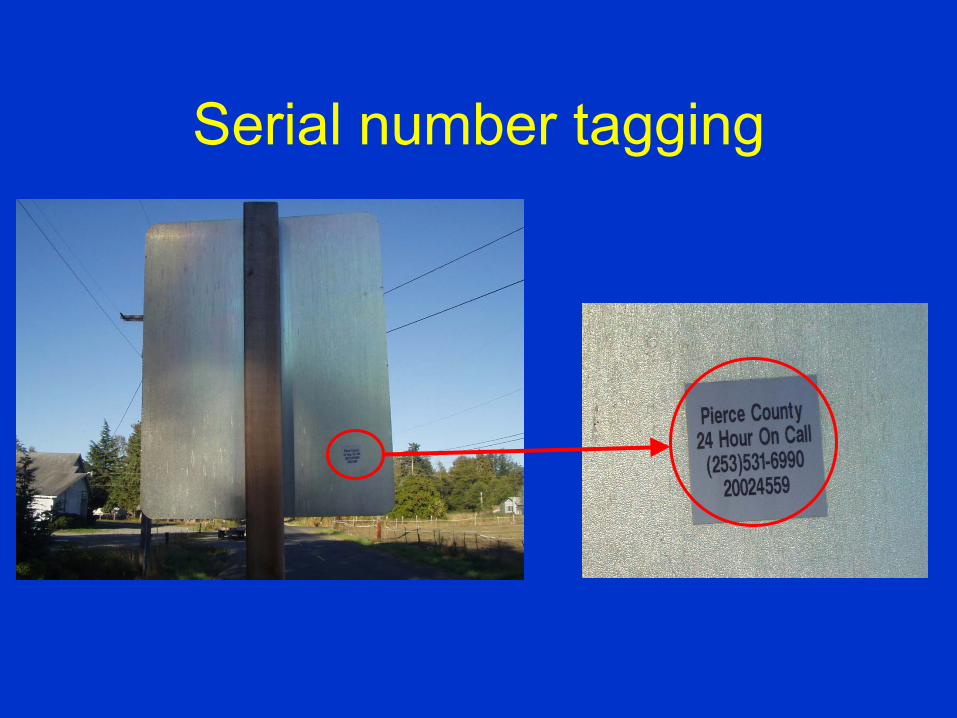
Serial number tagging
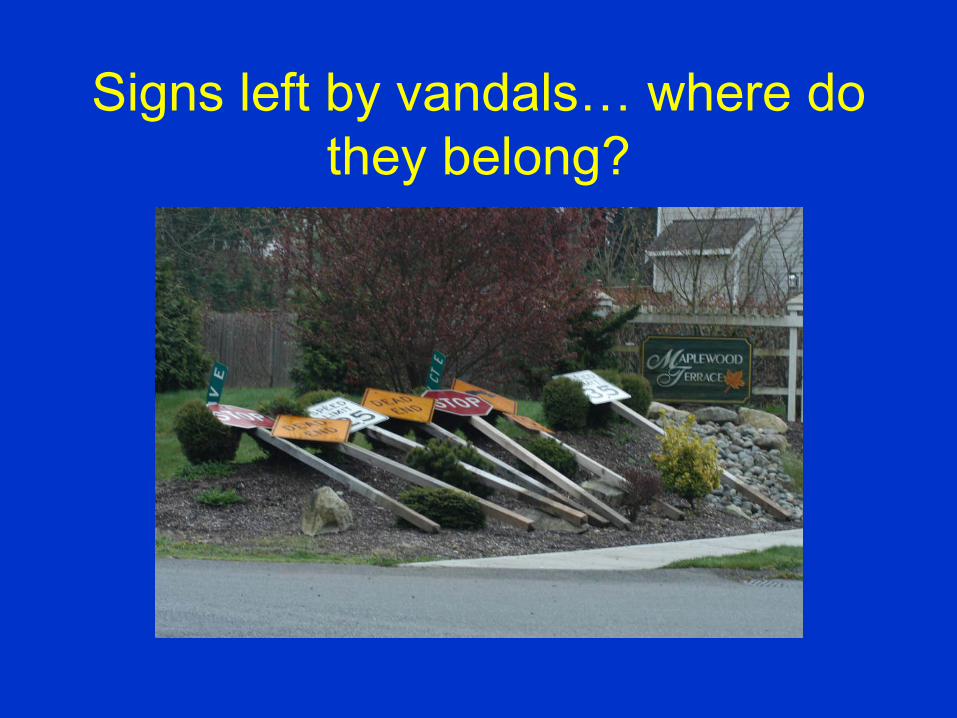
Signs left by vandals… where do they belong?
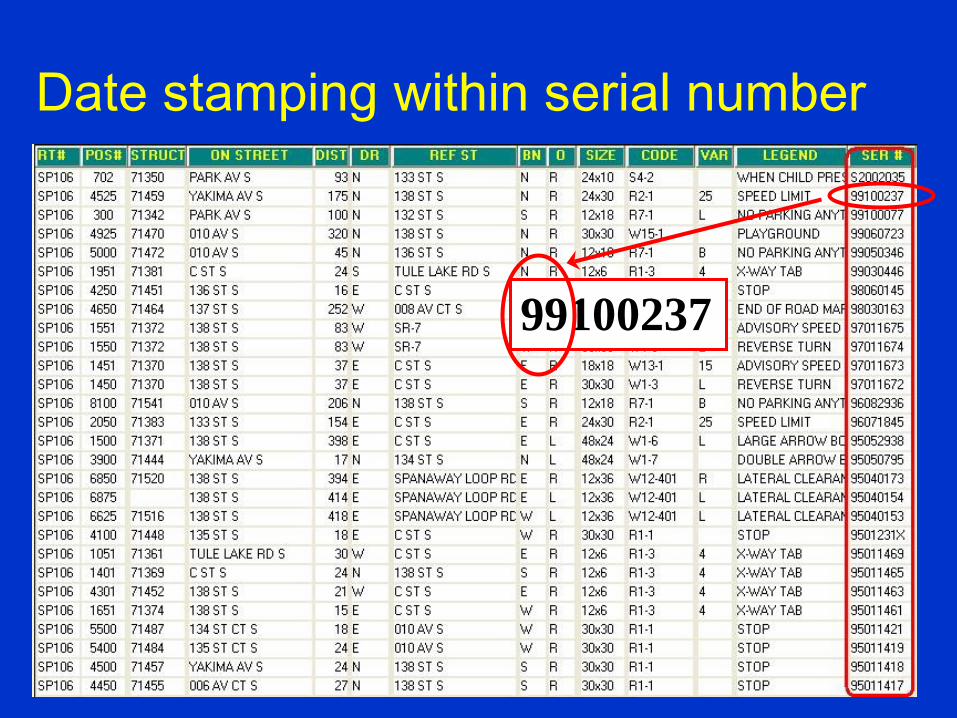
Date stamping within serial number
99100237
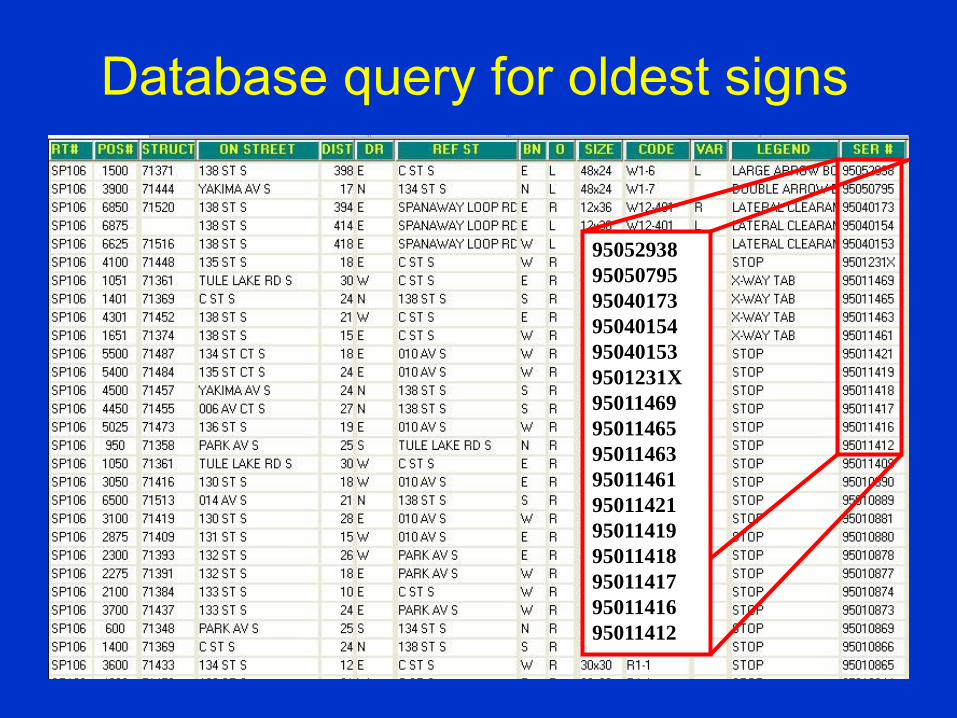
Database query for oldest signs
95052938 95050795 95040173 95040154 95040153 9501231X 95011469 95011465 95011463 95011461 95011421 95011419 95011418 95011417 95011416 95011412
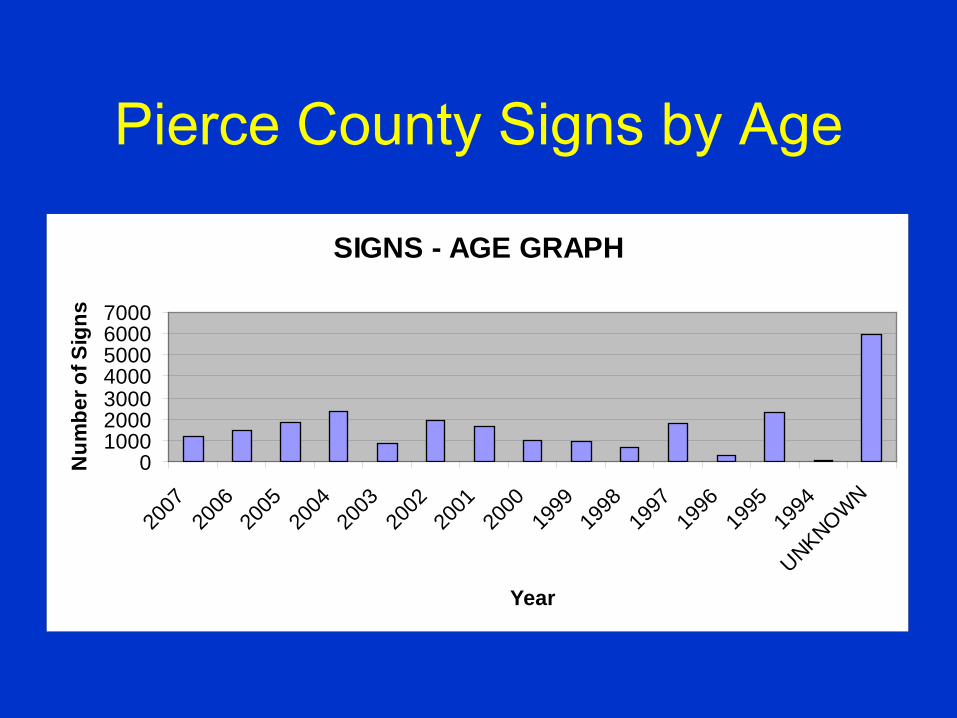
Pierce County Signs by Age
SIGNS - AGE GRAPH
01000200030004000500060007000
2007
2006
2005
2004
2003
2002
2001
2000
1999
1998
1997
1996
1995
1994
UNKNOWN
Year
Num
ber o
f Sig
ns
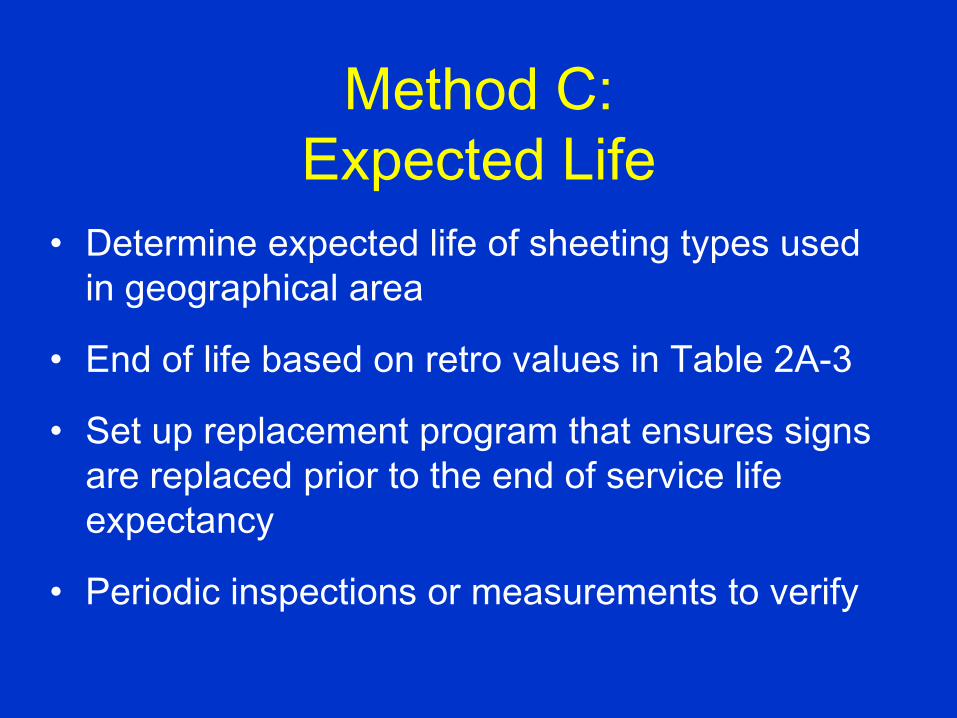
Method C:Expected Life
• Determine expected life of sheeting types used in geographical area
• End of life based on retro values in Table 2A-3
• Set up replacement program that ensures signs are replaced prior to the end of service life expectancy
• Periodic inspections or measurements to verify
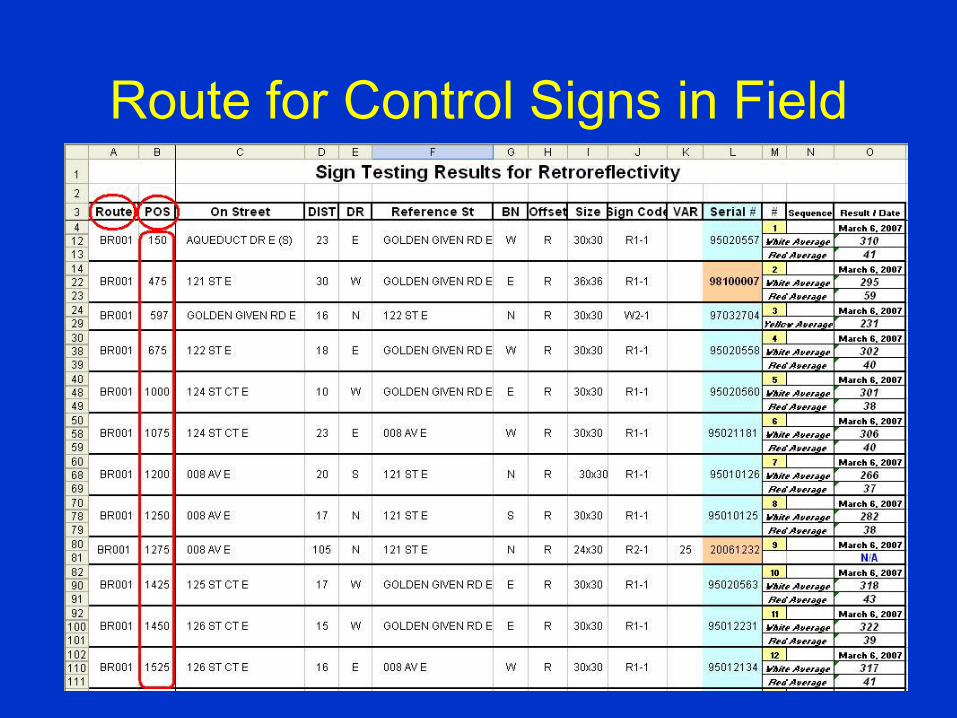
Route for Control Signs in Field
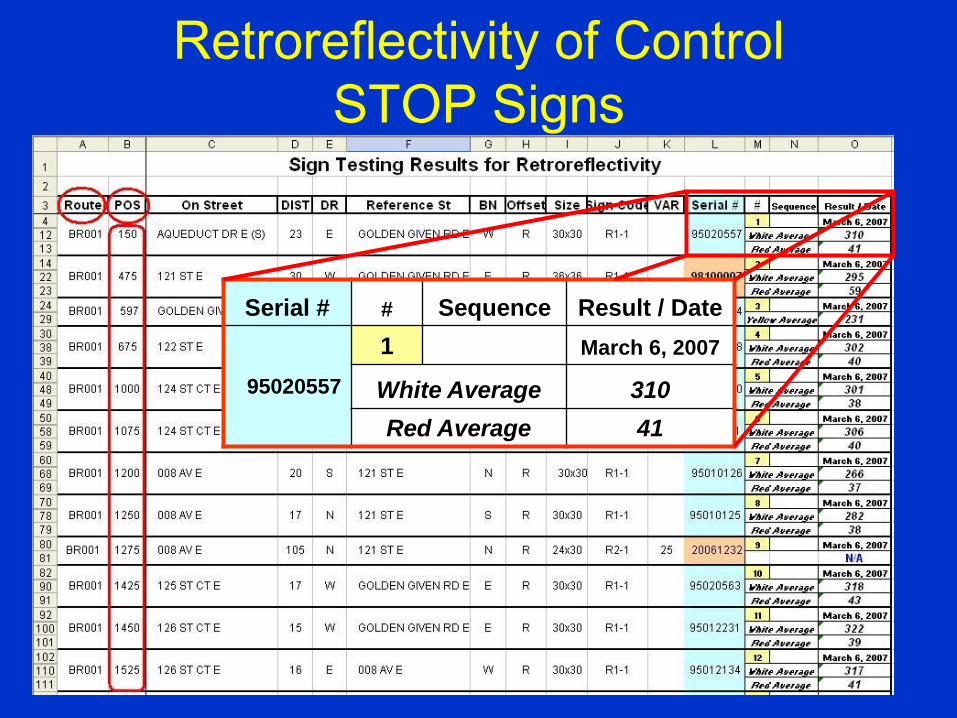
Retroreflectivity of Control STOP Signs
Serial # # Sequence Result / Date
95020557
1 March 6, 2007
White Average 310Red Average 41
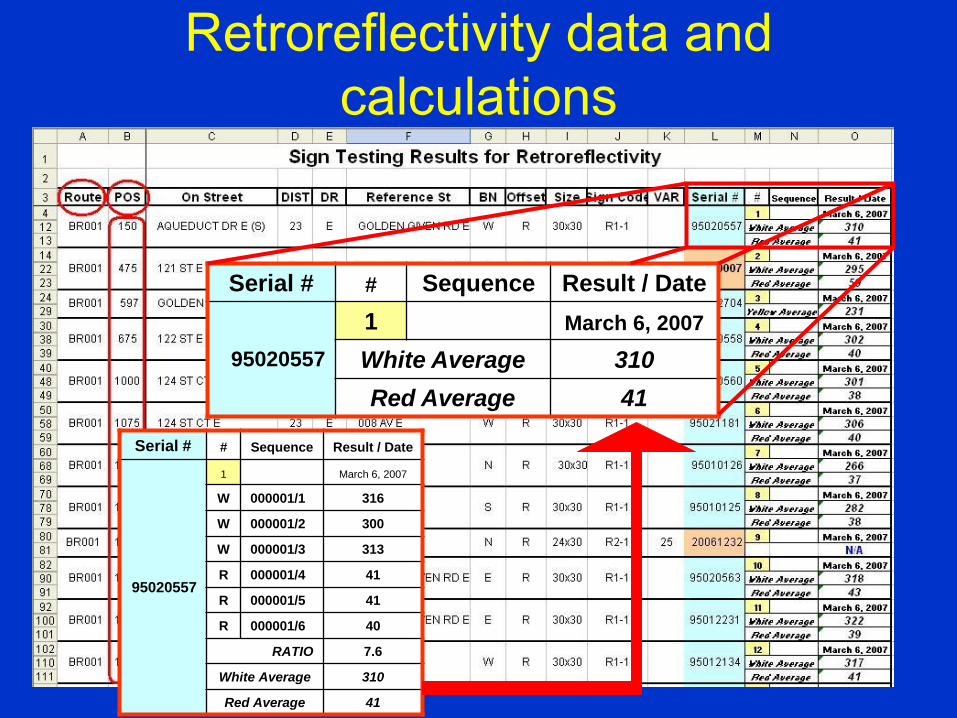
Retroreflectivity data and calculations
Serial # # Sequence Result / Date
950205571 March 6, 2007
White Average 310Red Average 41
Serial # # Sequence Result / Date
95020557
1 March 6, 2007
W 000001/1 316
W 000001/2 300
W 000001/3 313
R 000001/4 41
R 000001/5 41
R 000001/6 40
RATIO 7.6
White Average 310
Red Average 41
Method E:Control Signs
• Replacement of signs based on performance of control signs
• Control signs monitored to determine end of service life for associated signs
• Field signs represented by control samples are replaced prior to reaching minimum levels
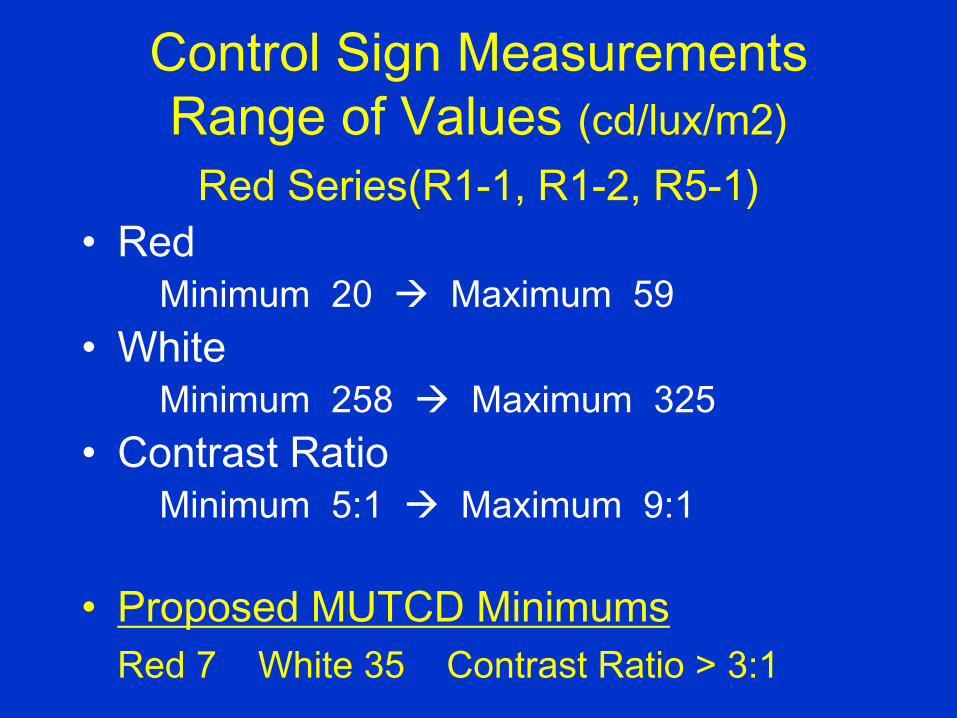
Control Sign MeasurementsRange of Values (cd/lux/m2)
Red Series(R1-1, R1-2, R5-1)• Red
Minimum 20 Maximum 59• White
Minimum 258 Maximum 325• Contrast Ratio
Minimum 5:1 Maximum 9:1
• Proposed MUTCD Minimums Red 7 White 35 Contrast Ratio > 3:1
Method D:Blanket Replacement
• All signs in area/corridor, or signs of a specific type, are replaced at specific intervals
• No need to track individual signs• Intervals based on the expected life of
material
Pilot Study Findings
• 12-year old Type III STOP signs okay
• 10 to 12-year old Type III Warning signs well above minimums
• 10 to 12-year old Type I Speed Limit signs still above minimums
Pilot Study Findings
• Engineer grade Street Name signs need to be replaced
• High intensity Type III or IV logical selection for ground-mounted Street Name signs
Pilot Study Findings
• Control Signs (in-field) Method was not too labor-intensive
• Oldest Signs easily identified & monitored via serial numbers
• Inspection Route → Measuring Efficiencies
• First Priorities Set → Street Name signs
Lessons Learned
• Standardize procedures & training for using retroreflectometer
• Increased sample sizes to 150 signs for each category
• Began adding serial numbers to street name signs
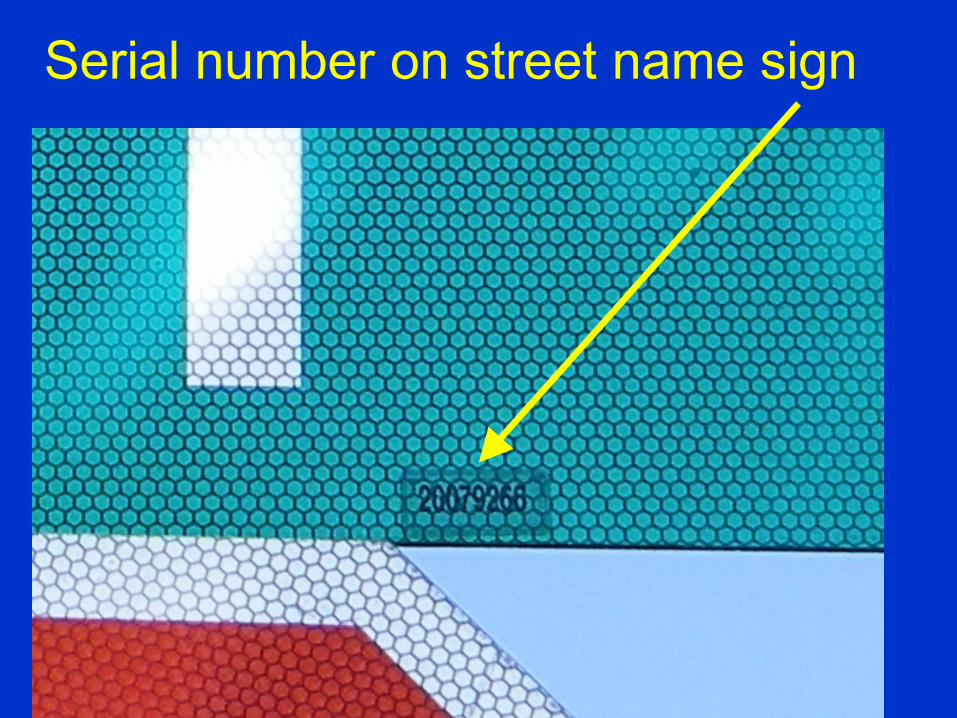
Serial number on street name sign
Lessons Learned
• Continue to use Type I sheeting for regulatory (e.g., Speed Limit) signs?
• Retroreflectivity – the final piece to our asset management system for signs
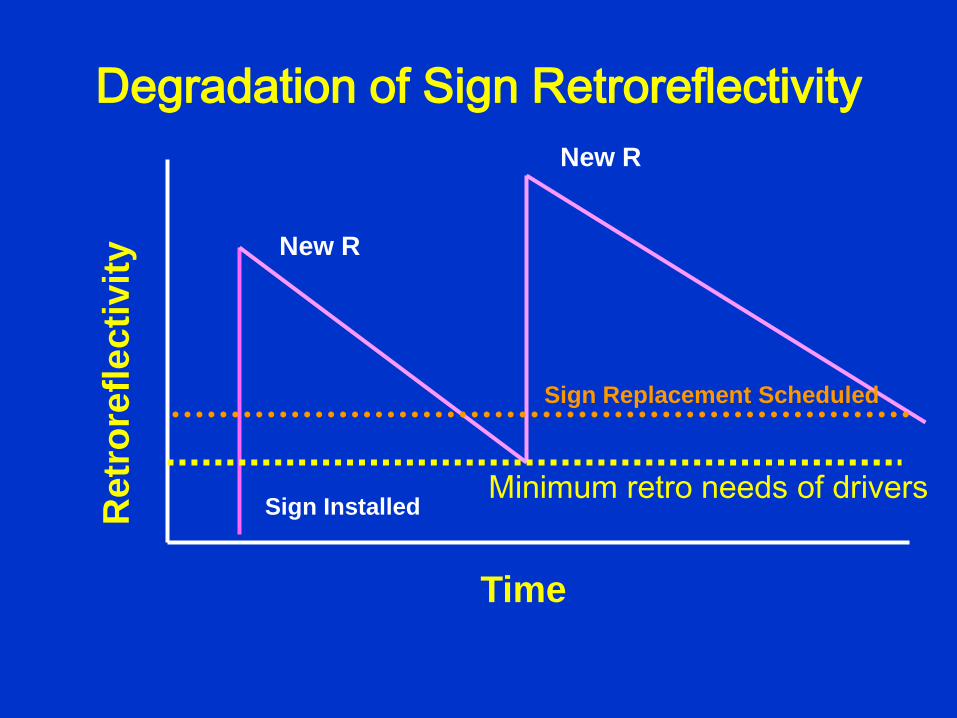
Degradation of Sign RetroreflectivityR
etro
refle
ctiv
ity
Time
Sign Installed
New R
Minimum retro needs of drivers
New R
Sign Replacement Scheduled
Paper Reference
“Tapping into the Power of a Traffic Sign Inventory to Meet the New Retroreflectivity Requirements”
Published in the ITE 2008 Annual Meeting (Anaheim) Compendium of Technical Papers
[email protected] 253-798-2267

Developing Sign Retroreflectivity Geographic
Information System Databases for Selected
Municipalities in PA
November 17, 2009Transportation Research BoardSign Retroreflectivity Webinar
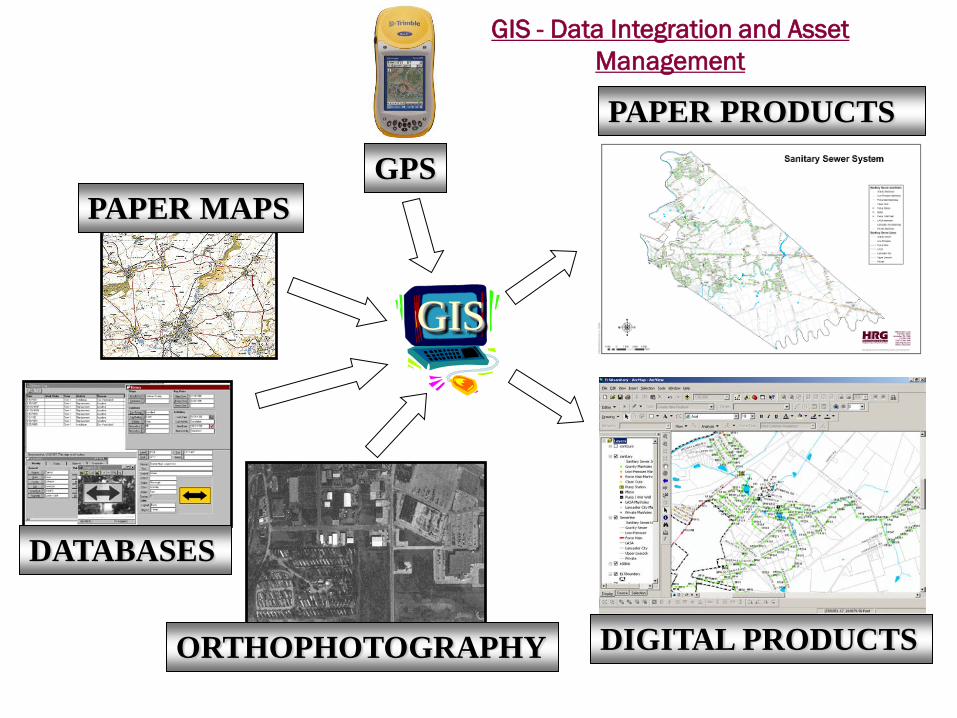
GIS
PAPER MAPS
ORTHOPHOTOGRAPHY
GIS - Data Integration and Asset Management
DIGITAL PRODUCTS
PAPER PRODUCTS
GPS
DATABASES
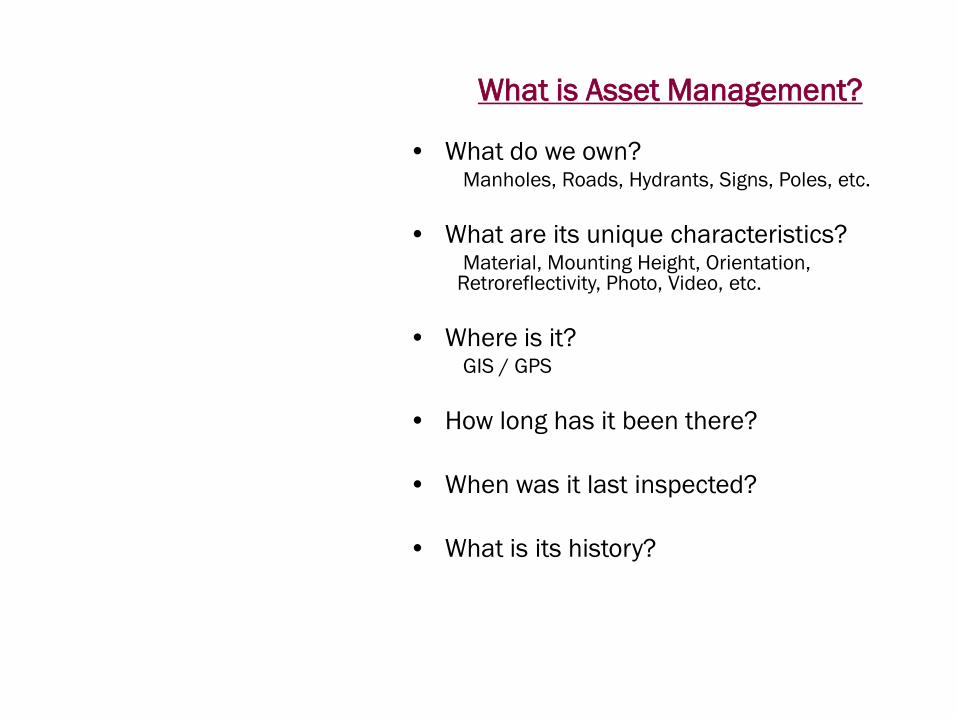
What is Asset Management?
• What do we own?Manholes, Roads, Hydrants, Signs, Poles, etc.
• What are its unique characteristics?Material, Mounting Height, Orientation,
Retroreflectivity, Photo, Video, etc.
• Where is it? GIS / GPS
• How long has it been there?
• When was it last inspected?
• What is its history?
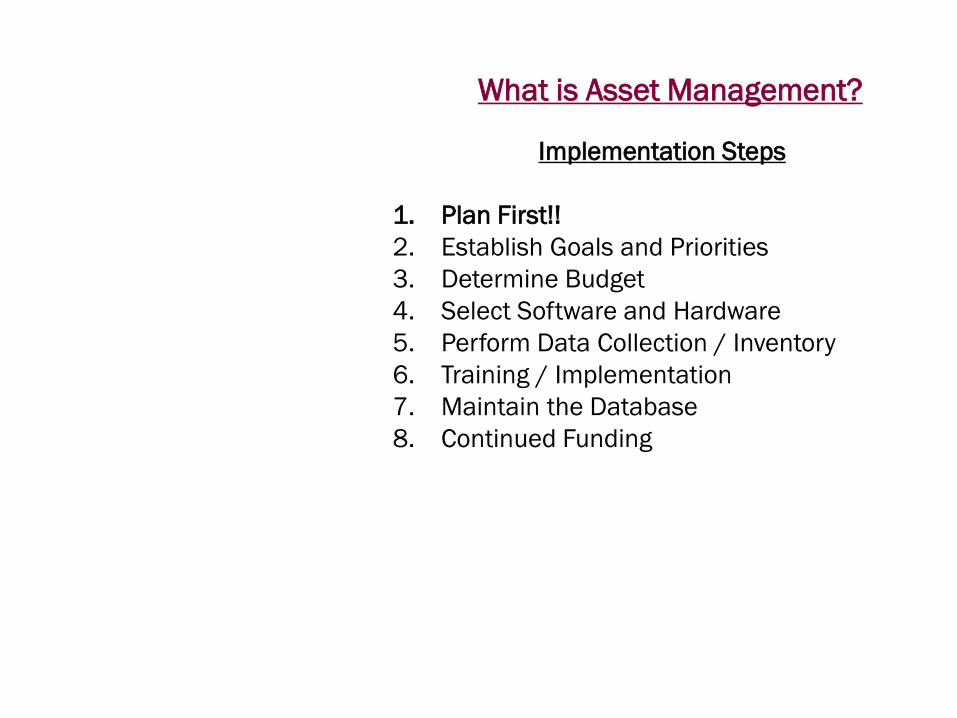
What is Asset Management?
Implementation Steps
1. Plan First!!2. Establish Goals and Priorities3. Determine Budget4. Select Software and Hardware5. Perform Data Collection / Inventory6. Training / Implementation7. Maintain the Database8. Continued Funding
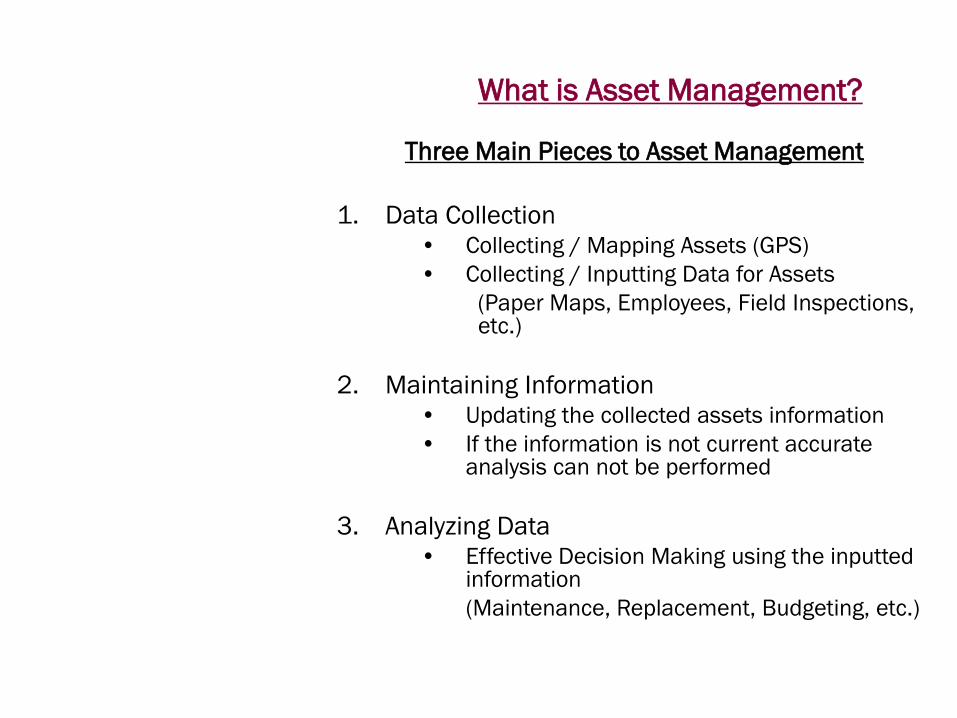
What is Asset Management?
Three Main Pieces to Asset Management
1. Data Collection• Collecting / Mapping Assets (GPS)• Collecting / Inputting Data for Assets
(Paper Maps, Employees, Field Inspections, etc.)
2. Maintaining Information• Updating the collected assets information• If the information is not current accurate
analysis can not be performed
3. Analyzing Data• Effective Decision Making using the inputted
information (Maintenance, Replacement, Budgeting, etc.)

GIS / GPS in Asset Management
GIS
GPS(RTK vs Code)
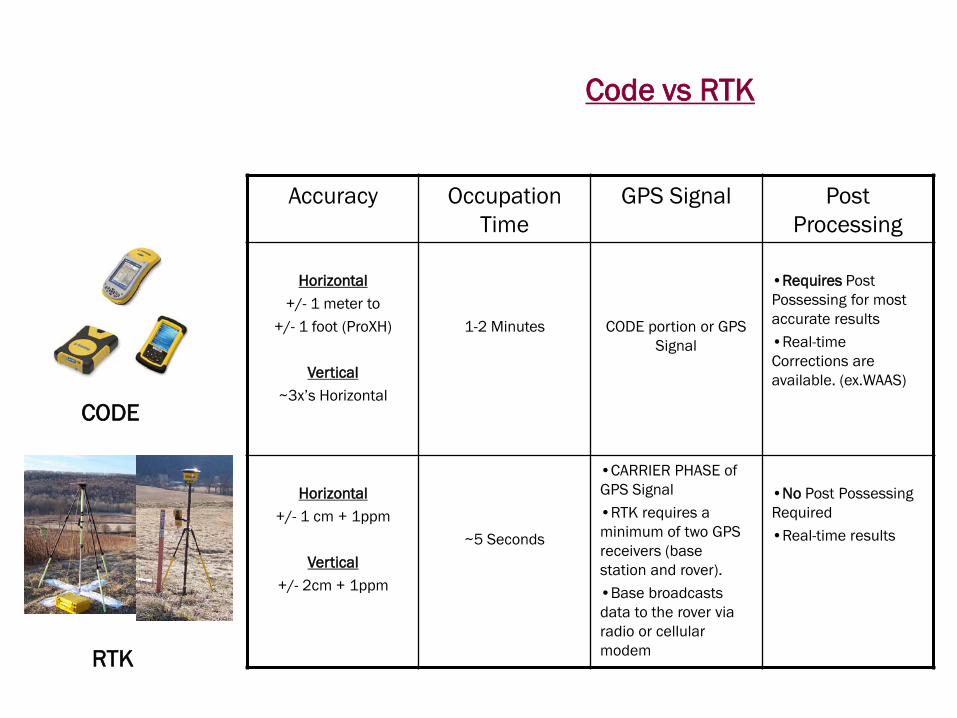
Accuracy Occupation Time
GPS Signal Post Processing
Horizontal+/- 1 meter to
+/- 1 foot (ProXH)
Vertical~3x’s Horizontal
1-2 Minutes CODE portion or GPS Signal
•Requires Post Possessing for most accurate results•Real-time Corrections are available. (ex.WAAS)
Horizontal+/- 1 cm + 1ppm
Vertical+/- 2cm + 1ppm
~5 Seconds
•CARRIER PHASE of GPS Signal•RTK requires a minimum of two GPS receivers (base station and rover).•Base broadcasts data to the rover via radio or cellular modem
•No Post Possessing Required•Real-time results
CODE
RTK
Code vs RTK
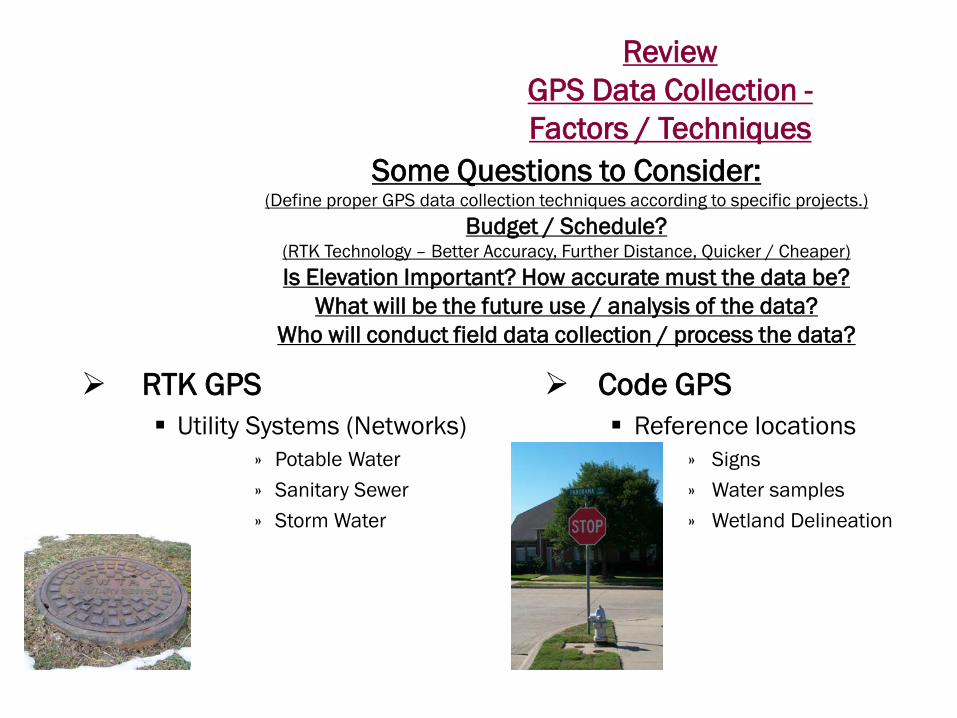
Some Questions to Consider:(Define proper GPS data collection techniques according to specific projects.)
Budget / Schedule?(RTK Technology – Better Accuracy, Further Distance, Quicker / Cheaper)Is Elevation Important? How accurate must the data be?
What will be the future use / analysis of the data? Who will conduct field data collection / process the data?
RTK GPS Utility Systems (Networks)
» Potable Water» Sanitary Sewer» Storm Water
Code GPS Reference locations
» Signs» Water samples» Wetland Delineation
ReviewGPS Data Collection -Factors / Techniques
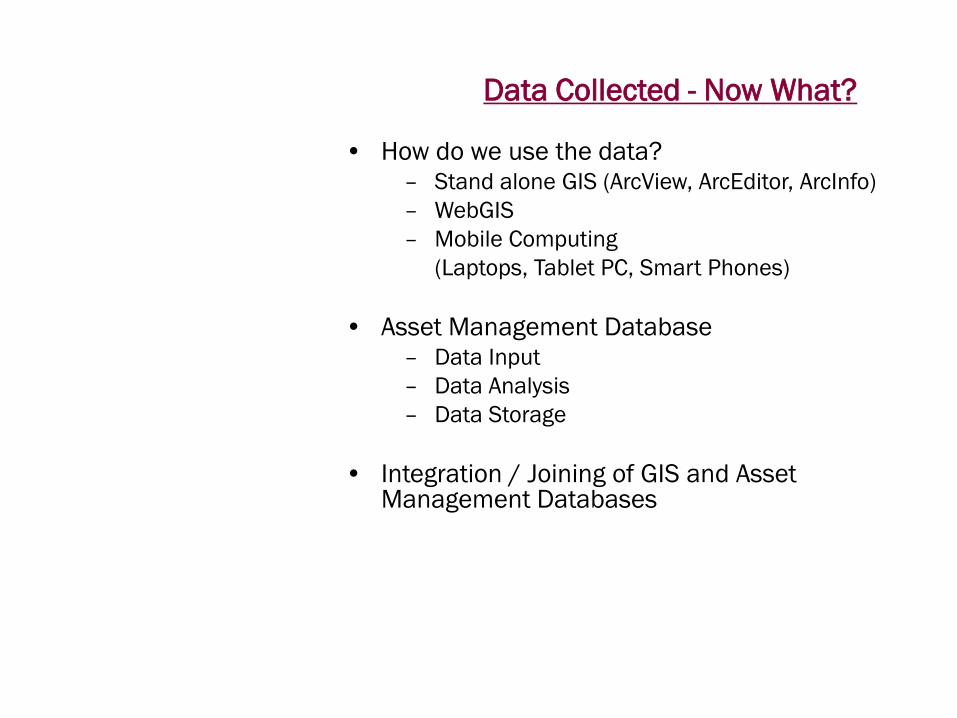
Data Collected - Now What?
• How do we use the data?– Stand alone GIS (ArcView, ArcEditor, ArcInfo)– WebGIS– Mobile Computing
(Laptops, Tablet PC, Smart Phones)
• Asset Management Database– Data Input– Data Analysis– Data Storage
• Integration / Joining of GIS and Asset Management Databases
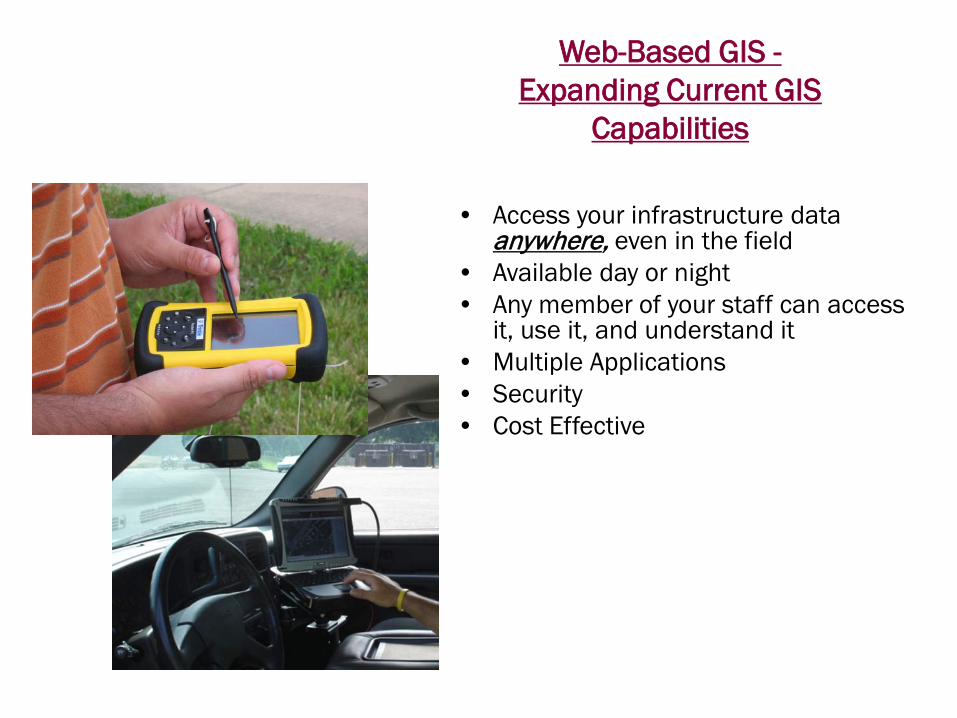
• Access your infrastructure data anywhere, even in the field
• Available day or night• Any member of your staff can access
it, use it, and understand it• Multiple Applications• Security• Cost Effective
Web-Based GIS -Expanding Current GIS
Capabilities
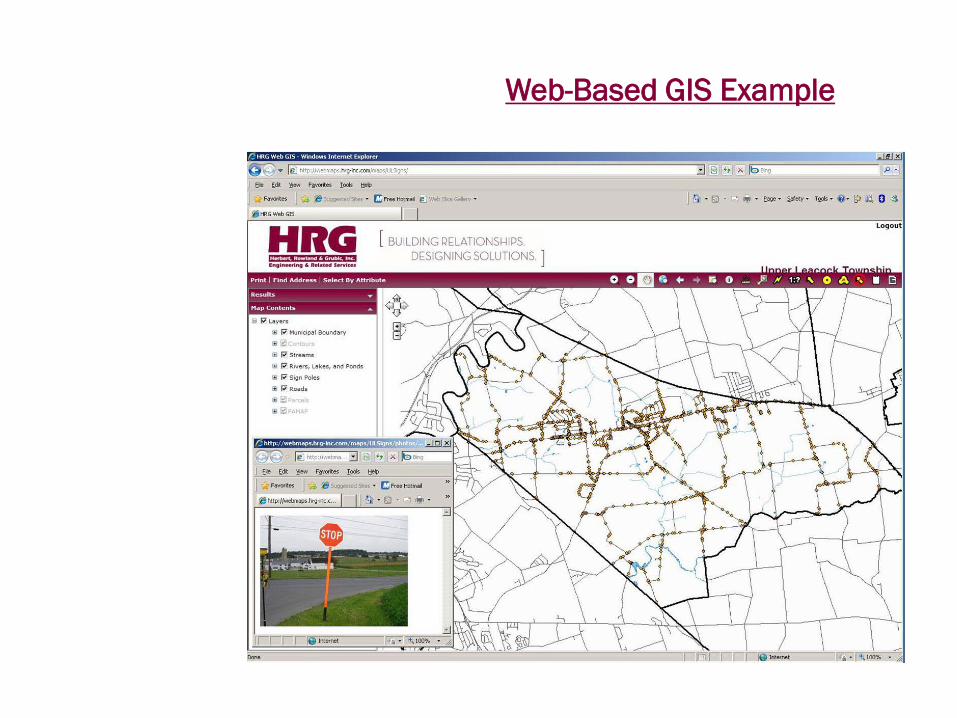
Web-Based GIS Example
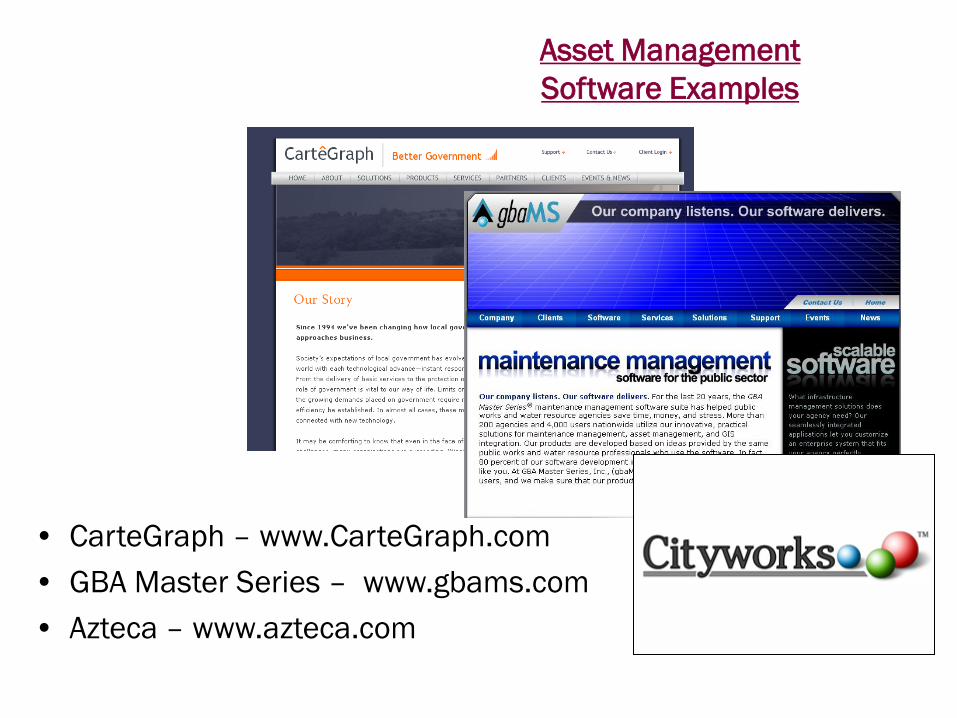
Asset ManagementSoftware Examples
• CarteGraph – www.CarteGraph.com• GBA Master Series – www.gbams.com• Azteca – www.azteca.com
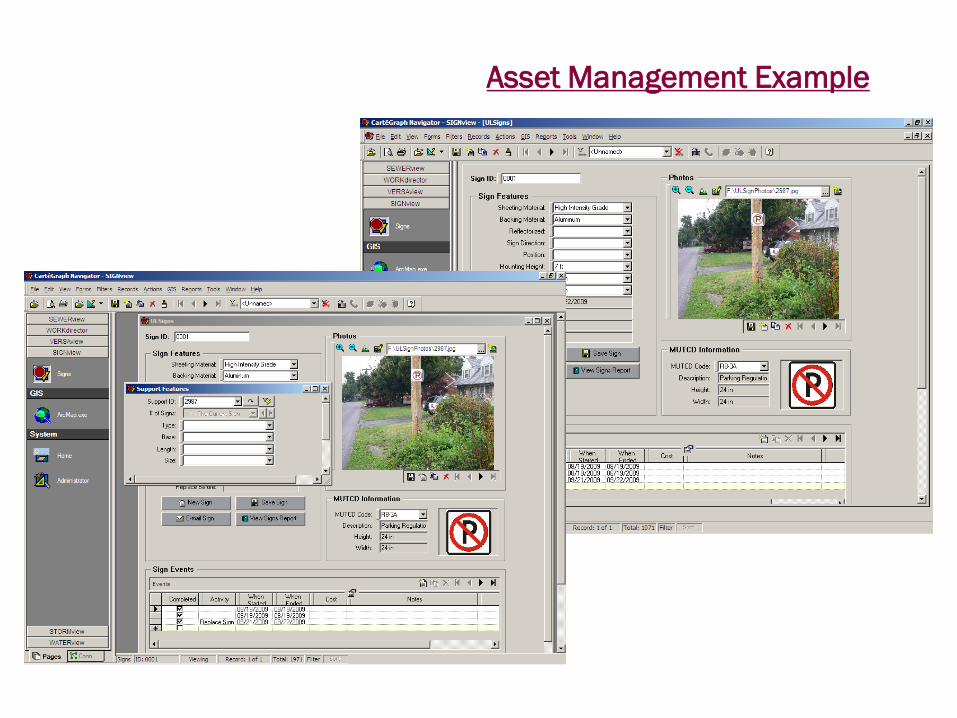
Asset Management Example

Thank you for your time.
For additional questions please contact:
Christopher W. May, P.E., PTOE 717-291-1783
Questions and Answers
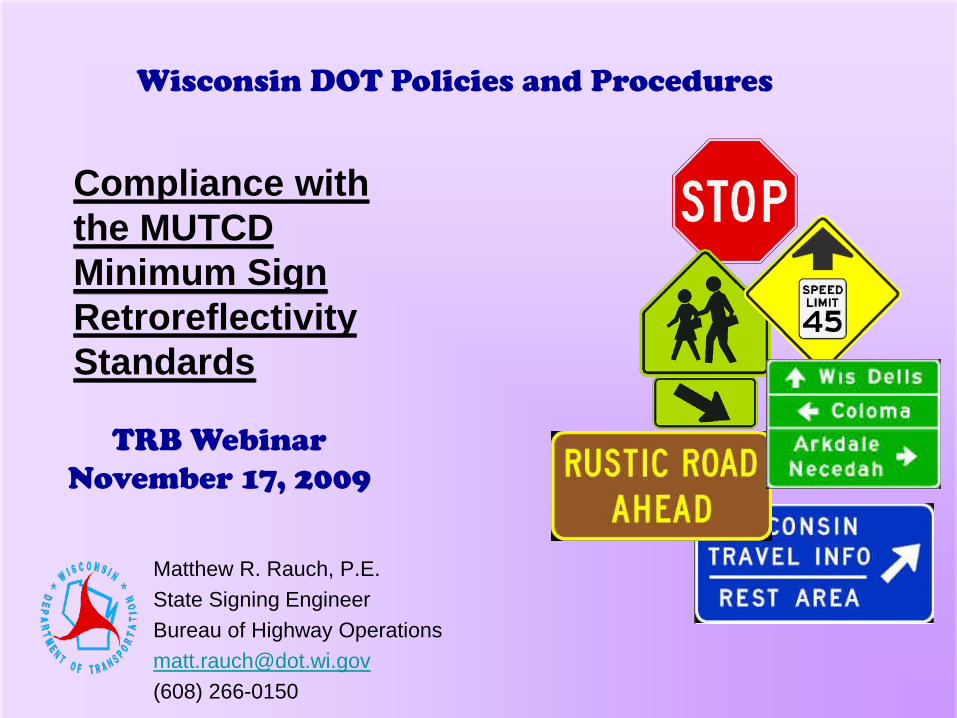
Compliance with the MUTCD Minimum Sign RetroreflectivityStandards
Matthew R. Rauch, P.E.State Signing EngineerBureau of Highway [email protected](608) 266-0150
Wisconsin DOT Policies and Procedures
TRB WebinarNovember 17, 2009
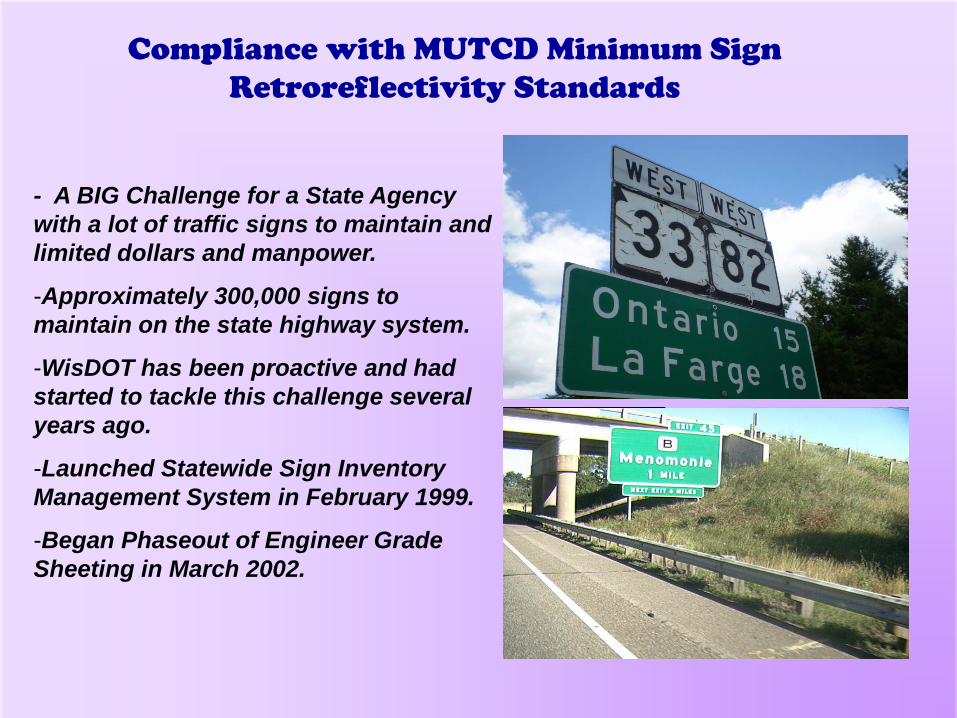
Compliance with MUTCD Minimum Sign Retroreflectivity Standards
- A BIG Challenge for a State Agency with a lot of traffic signs to maintain and limited dollars and manpower.
-Approximately 300,000 signs to maintain on the state highway system.
-WisDOT has been proactive and had started to tackle this challenge several years ago.
-Launched Statewide Sign Inventory Management System in February 1999.
-Began Phaseout of Engineer Grade Sheeting in March 2002.
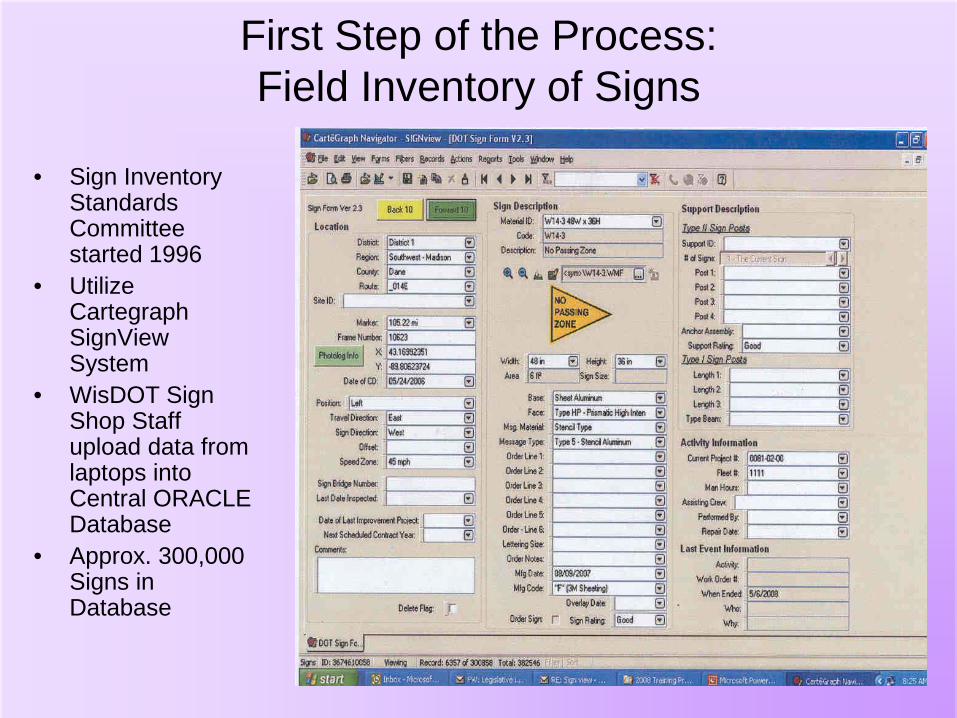
First Step of the Process:Field Inventory of Signs
• Sign Inventory Standards Committee started 1996
• Utilize CartegraphSignViewSystem
• WisDOT Sign Shop Staff upload data from laptops into Central ORACLE Database
• Approx. 300,000 Signs in Database
Implementation of the MUTCD Standard to Maintain Minimum Sign Reflectivity
-Sign Assessment Methods require evaluation of individual signs within an agencies jurisdiction.-Sign Management Methods provide an agency the ability to maintain sign retroreflectivity without having to assess individual signs.
After much discussion, it was determined that the Sign Assessment Methods were not feasible for WisDOT. Expense and lack of manpower prohibited utilization of this method.
As a result, a combination of Sign Management Methods are being used by WisDOT to maintain minimum sign retroreflectivity-
Sign Management Methods Used by WisDOT
BLANKET REPLACEMENT- Utilized in roadway improvement projects where all of the signs are replaced. Lots of benefits to this method:
-Utilize Sign Inventory Management System to help prepare sign replacement plans.
-All Signs are the same age. Do not have to send sign crews back in for routine replacements. Thus manpower savings.
-Good opportunity to “clean-up” the signing on the roadway by re-positioning signs, adjust spacing and ensure mounting heights and offsets are correct.
-Helps save dollars on the maintenance budget.
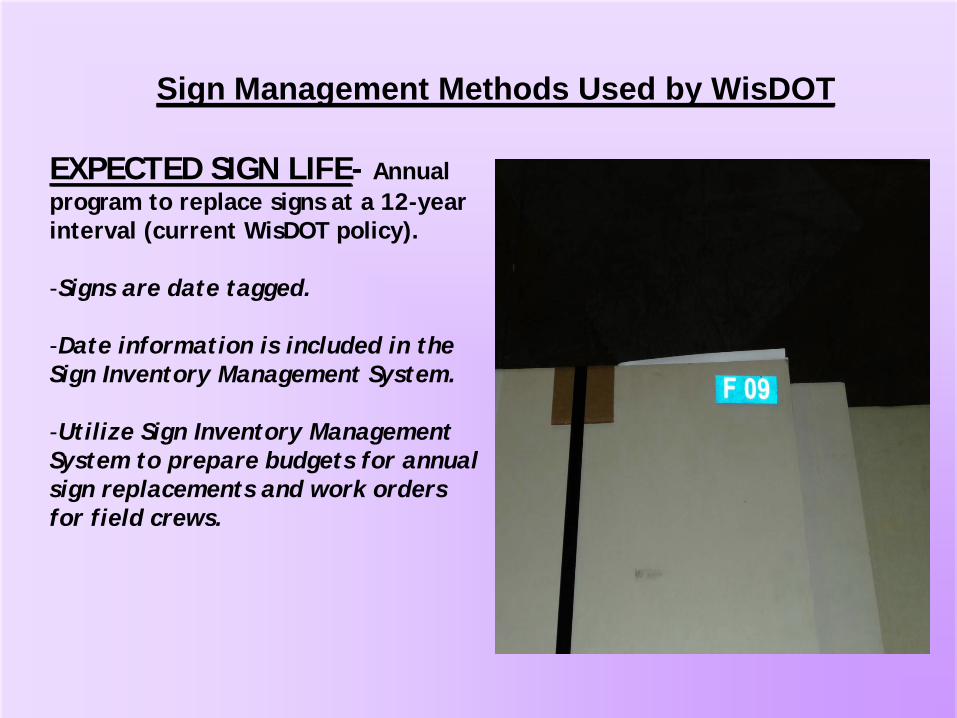
Sign Management Methods Used by WisDOT
EXPECTED SIGN LIFE- Annual program to replace signs at a 12-year interval (current WisDOT policy).
-Signs are date tagged.
-Date information is included in the Sign Inventory Management System.
-Utilize Sign Inventory Management System to prepare budgets for annual sign replacements and work orders for field crews.
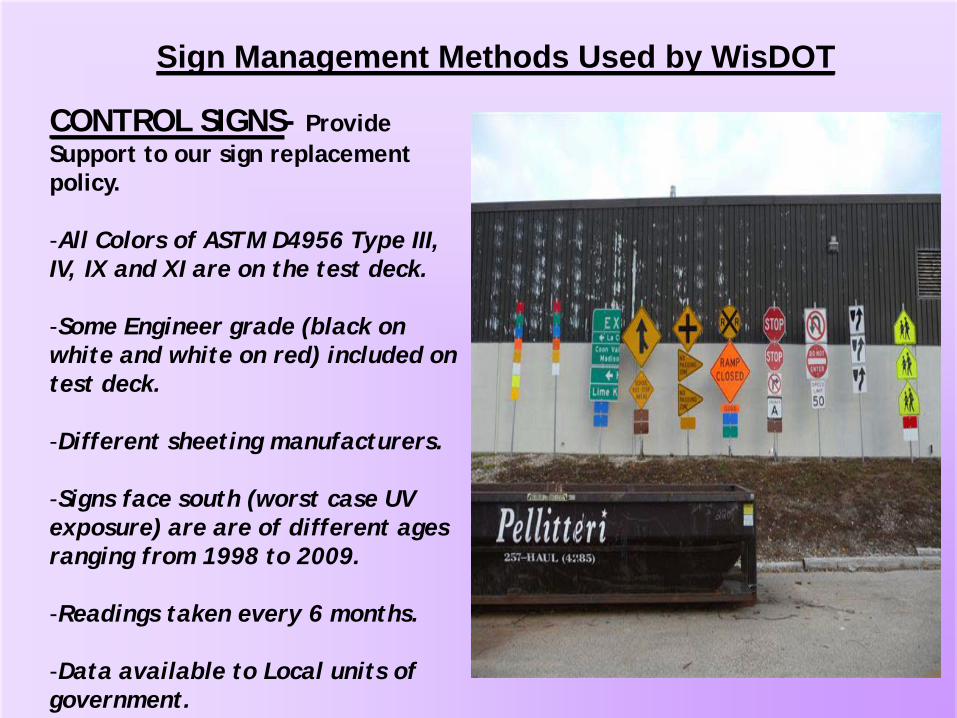
Sign Management Methods Used by WisDOT
CONTROL SIGNS- Provide Support to our sign replacement policy.
-All Colors of ASTM D4956 Type III, IV, IX and XI are on the test deck.
-Some Engineer grade (black on white and white on red) included on test deck.
-Different sheeting manufacturers.
-Signs face south (worst case UV exposure) are are of different ages ranging from 1998 to 2009.
-Readings taken every 6 months.
-Data available to Local units of government.
How do we accomplish this huge task and pay for it!?!?!
LIMITED MAINTENANCE DOLLARS• 4 yrs (January, 2012)
Establish and implement method to track condition of signs
• 7 yrs (January, 2015)Replace identified regulatory, warning, ground-
mounted guide signs (except street-name)• 10 yrs (January, 2018)
Replace identified street name & overhead guide signs
How do we accomplish this huge task and pay for it!?!?!
• Approx. 300,000 signs to maintain!
• Over 102,000 signs still Engineer Grade!!
• 1308 Overhead Guide signs (green backround) still have Type I or Type III Sheeting!!!
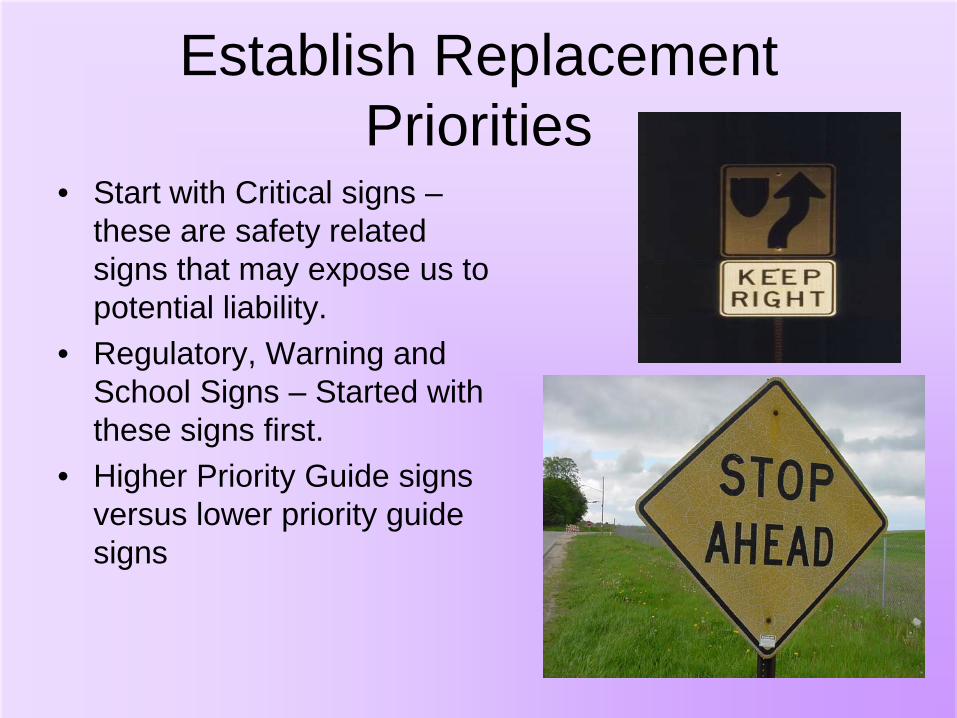
Establish Replacement Priorities
• Start with Critical signs –these are safety related signs that may expose us to potential liability.
• Regulatory, Warning and School Signs – Started with these signs first.
• Higher Priority Guide signs versus lower priority guide signs
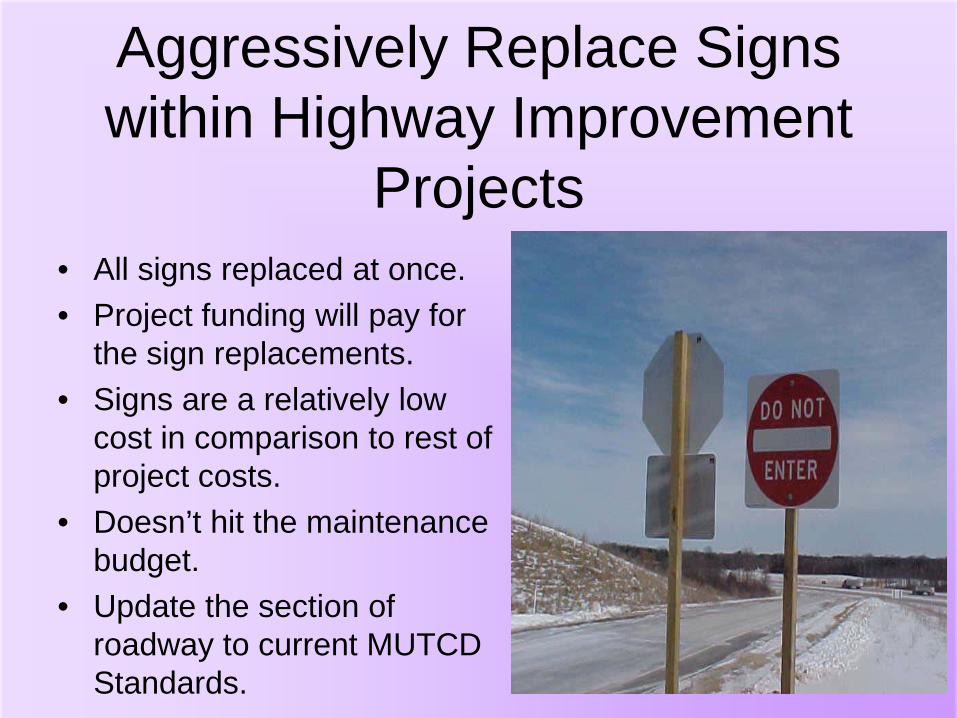
Aggressively Replace Signs within Highway Improvement
Projects• All signs replaced at once.• Project funding will pay for
the sign replacements.• Signs are a relatively low
cost in comparison to rest of project costs.
• Doesn’t hit the maintenance budget.
• Update the section of roadway to current MUTCD Standards.
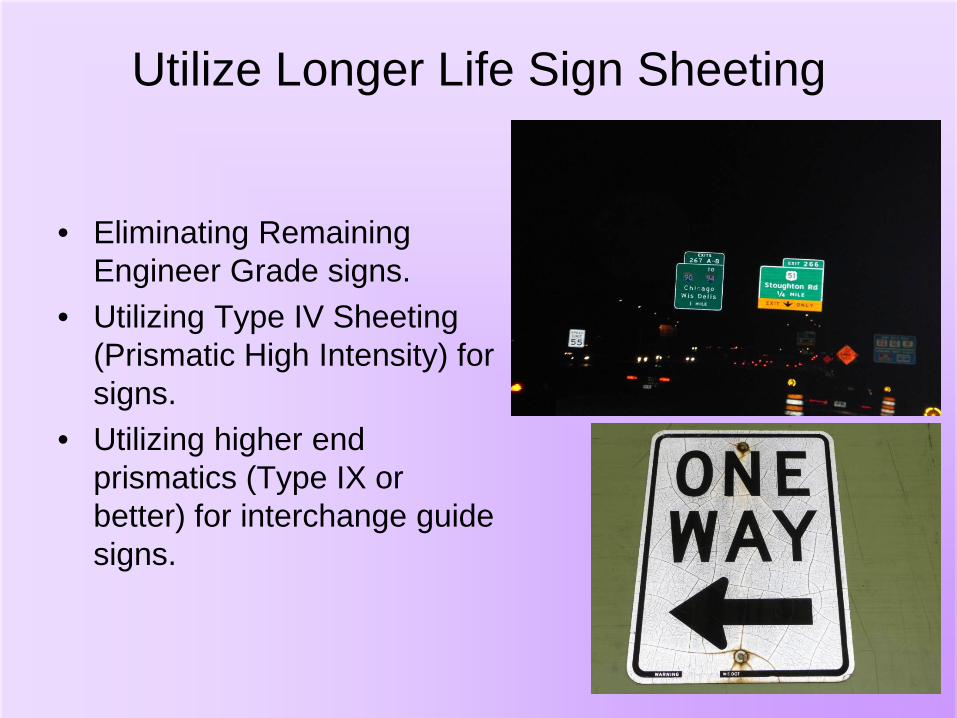
Utilize Longer Life Sign Sheeting
• Eliminating Remaining Engineer Grade signs.
• Utilizing Type IV Sheeting (Prismatic High Intensity) for signs.
• Utilizing higher end prismatics (Type IX or better) for interchange guide signs.
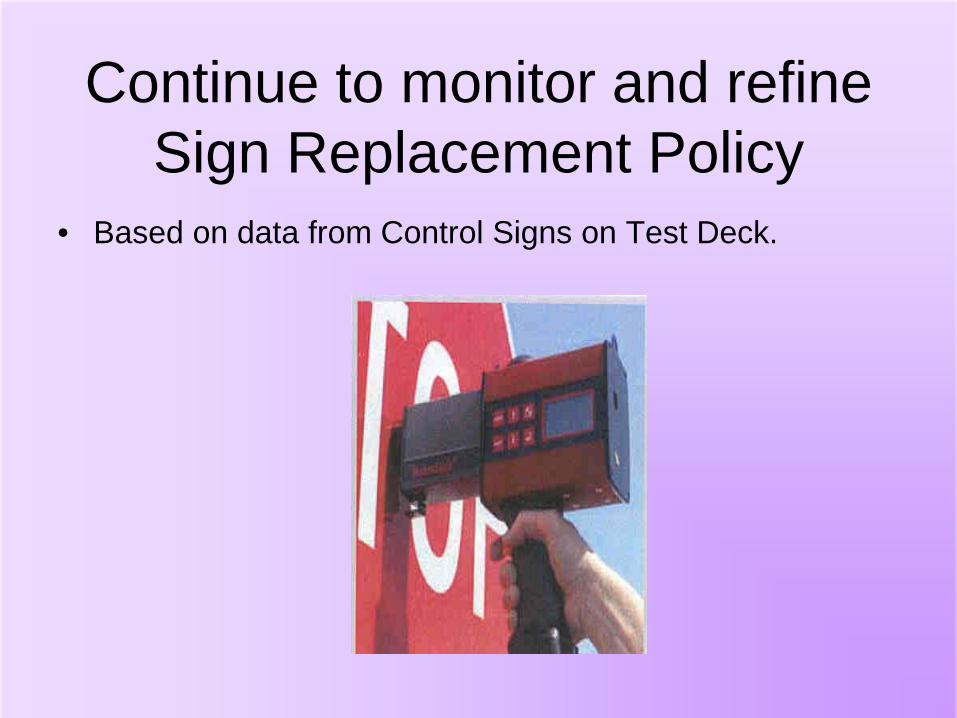
Continue to monitor and refine Sign Replacement Policy
• Based on data from Control Signs on Test Deck.
1© 3M 2009. All Rights Reserved.
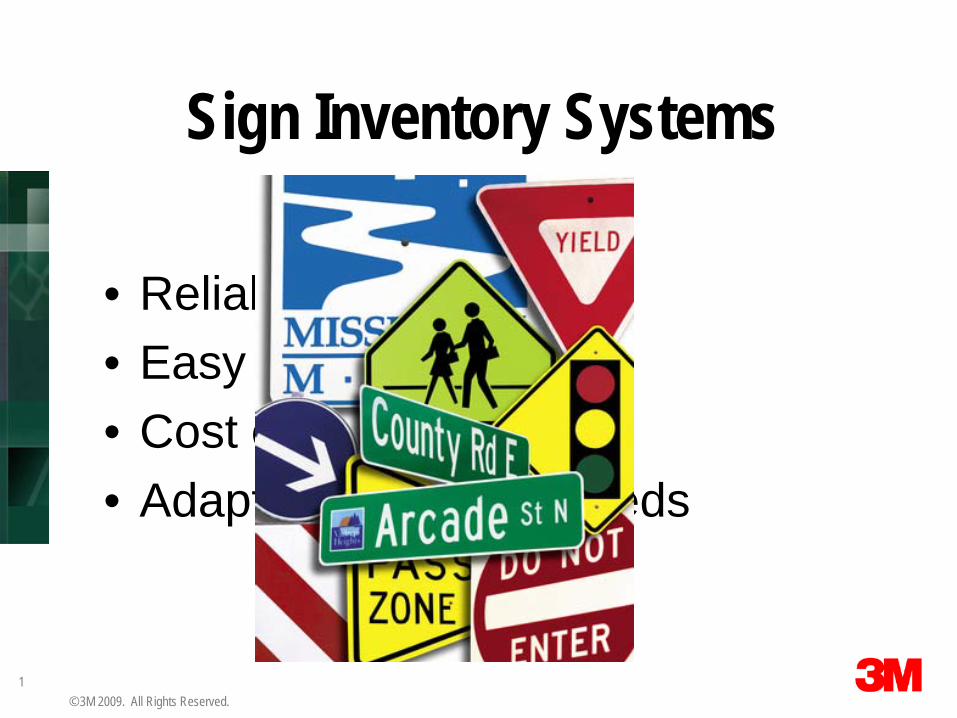
• Reliable• Easy to use• Cost effective• Adaptive to agency needs
Sign Inventory Systems
2© 3M 2009. All Rights Reserved.
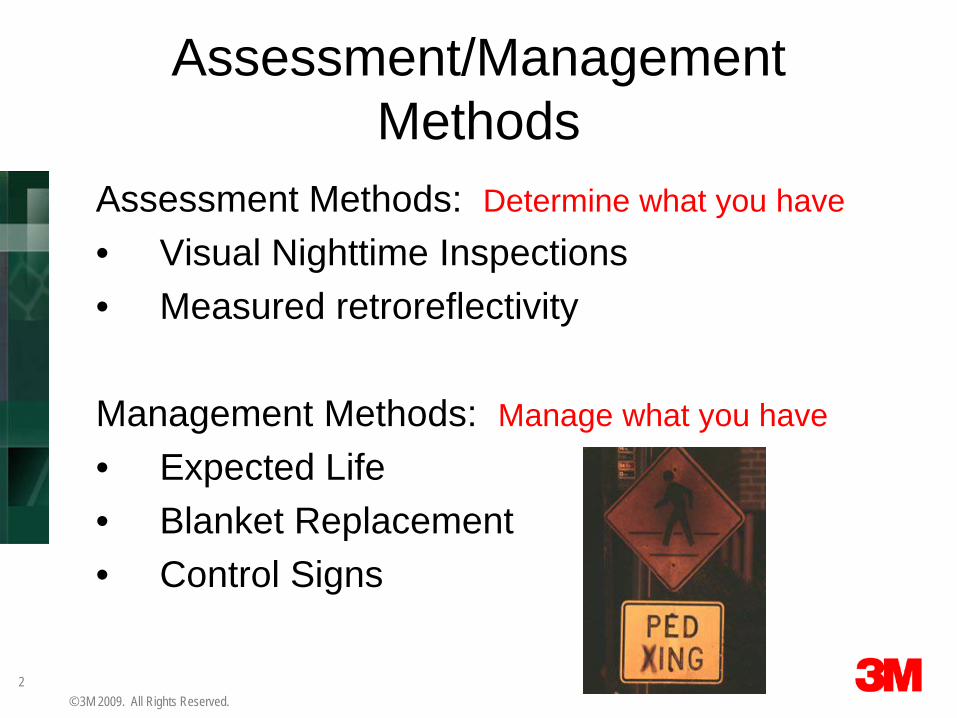
Assessment/Management Methods
Assessment Methods: Determine what you have
• Visual Nighttime Inspections• Measured retroreflectivity
Management Methods: Manage what you have
• Expected Life• Blanket Replacement• Control Signs
3© 3M 2009. All Rights Reserved.
Sign Inventory System
– Asset capture– Asset analysis – Efficient asset management– Budgeting
Importance of a Sign Inventory
4© 3M 2009. All Rights Reserved.
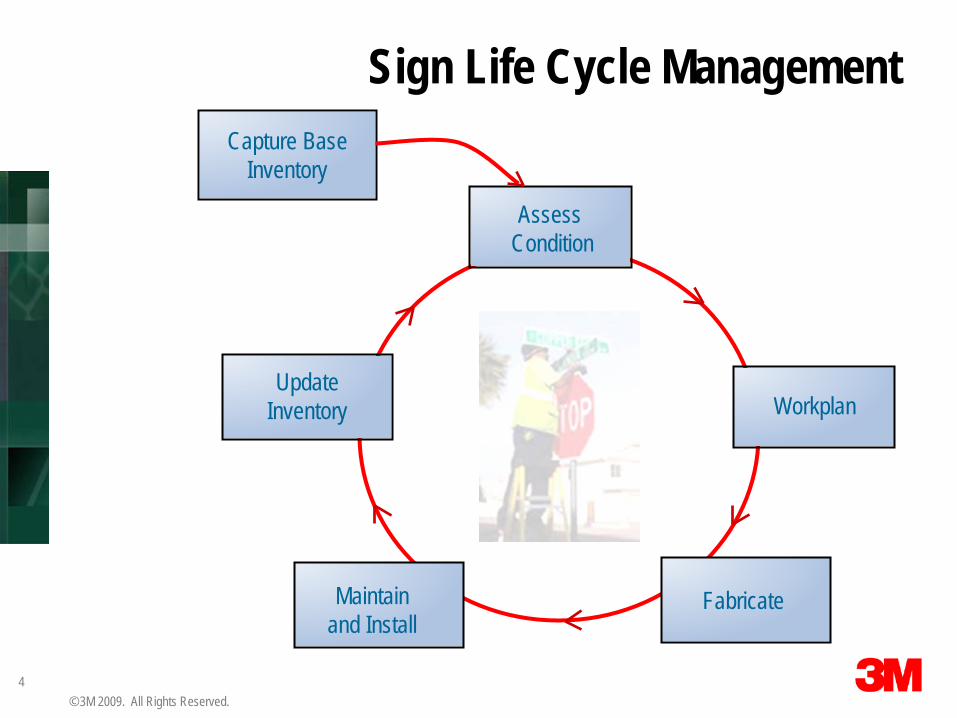
Sign Life Cycle ManagementCapture Base
Inventory
Assess Condition
Workplan
Maintainand Install
Update Inventory
Fabricate
5© 3M 2009. All Rights Reserved.
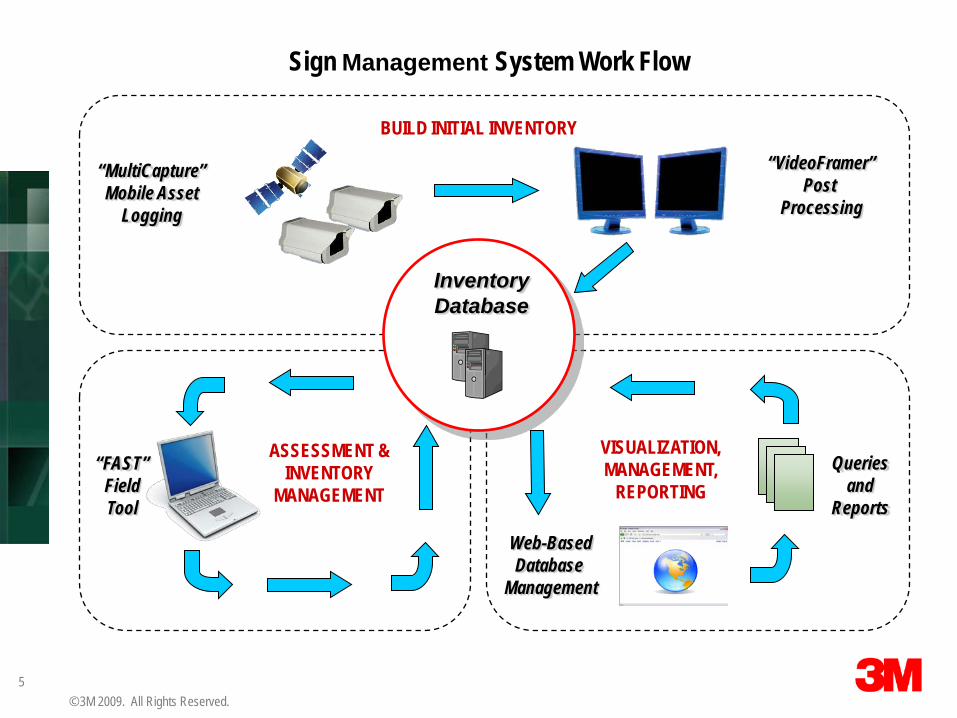
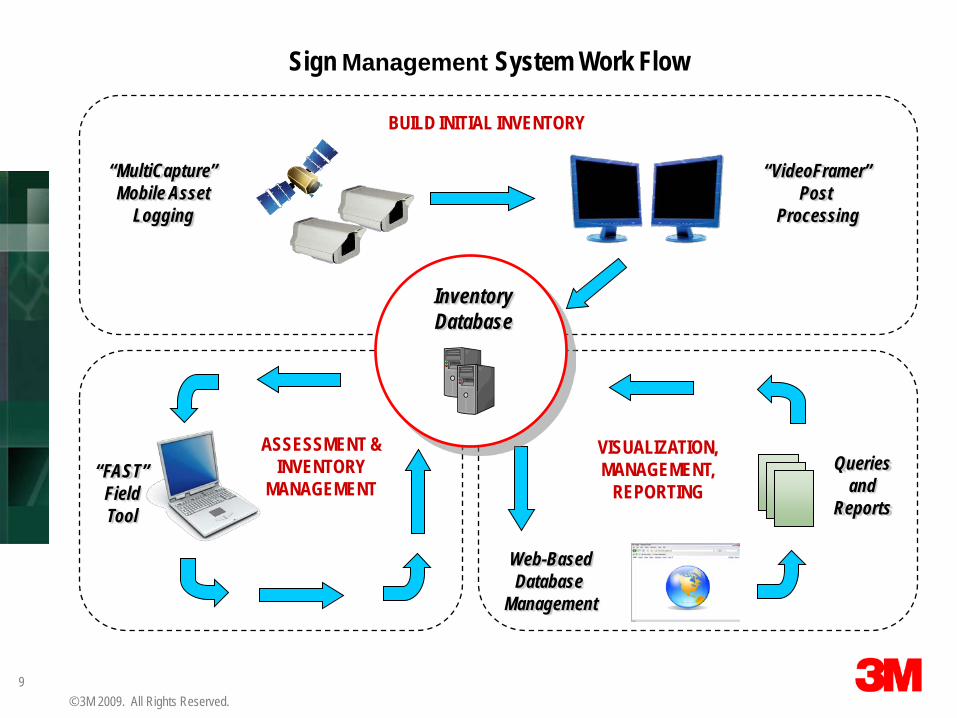
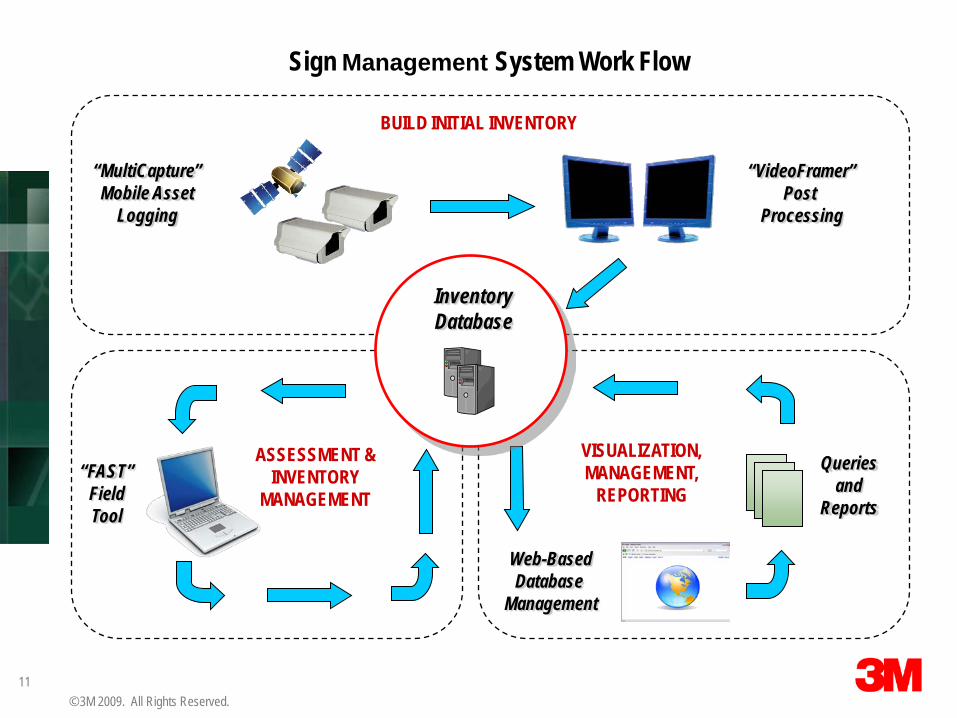
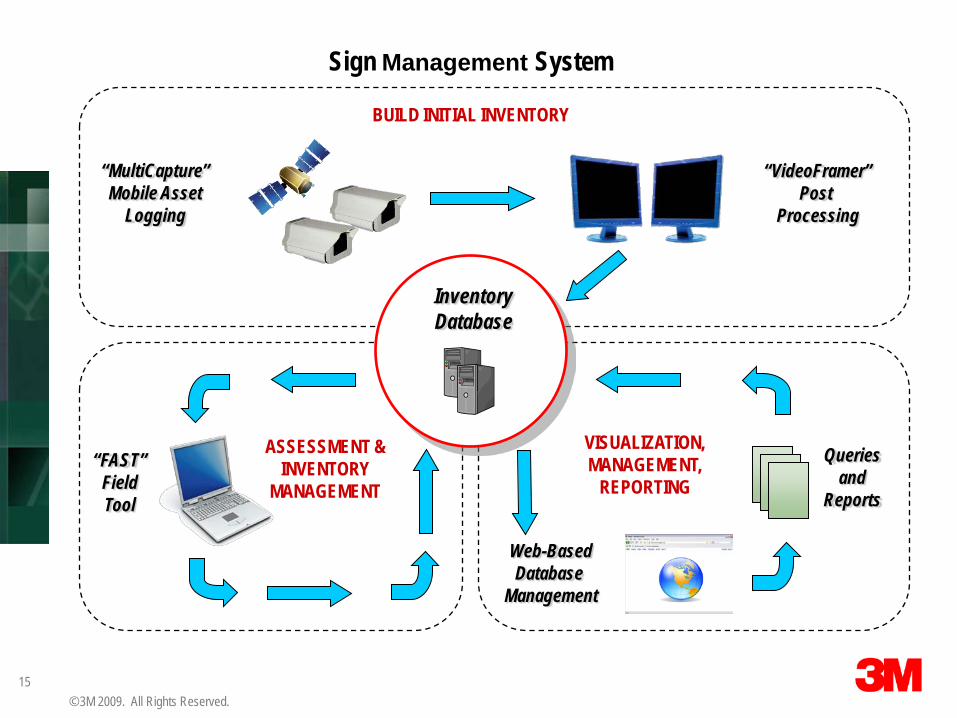
BUILD INITIAL INVENTORY
Web-BasedDatabase
Management
VISUALIZATION,MANAGEMENT,
REPORTINGQueries
andReports
“FAST”FieldTool
ASSESSMENT &INVENTORY
MANAGEMENT
“MultiCapture”Mobile Asset
Logging
“VideoFramer”Post
Processing
InventoryDatabase
Sign Management System Work Flow
6© 3M 2009. All Rights Reserved.
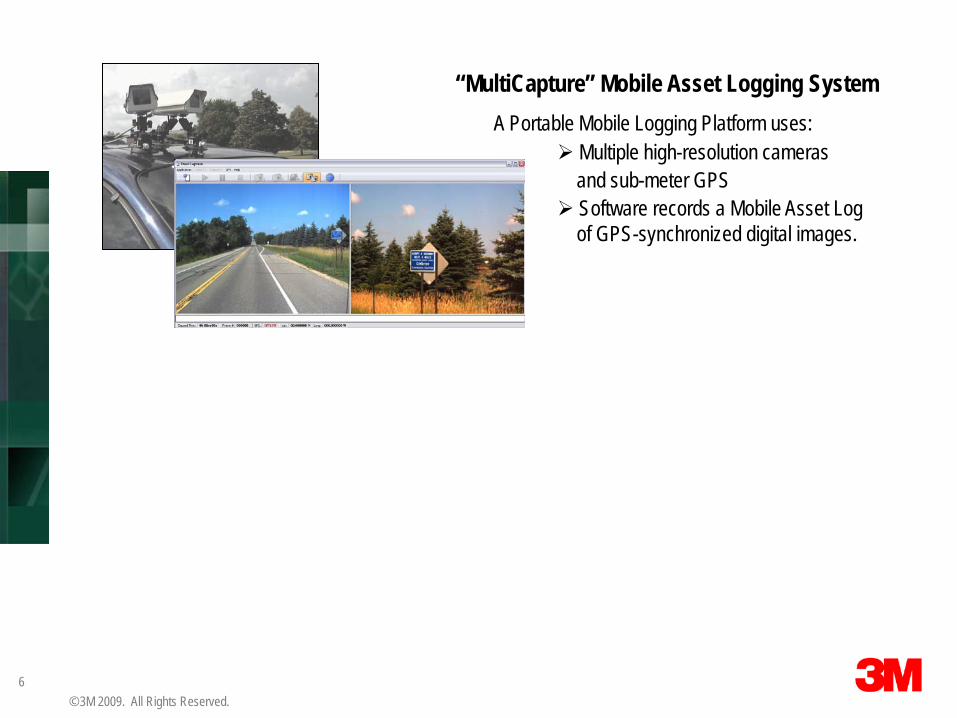
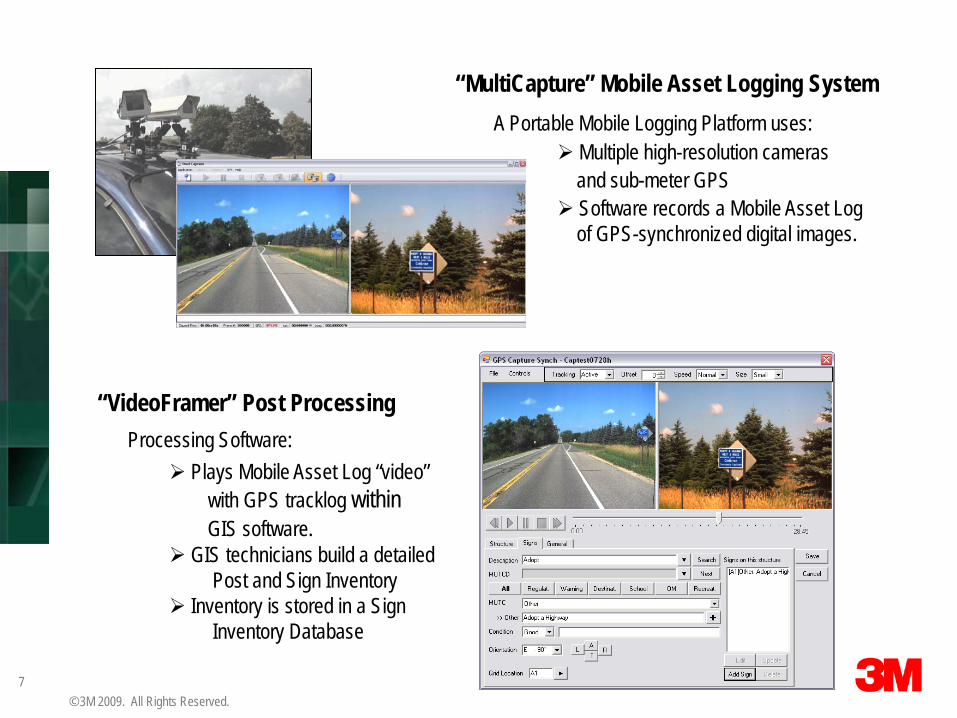
“MultiCapture” Mobile Asset Logging SystemA Portable Mobile Logging Platform uses:
Multiple high-resolution camerasand sub-meter GPS
Software records a Mobile Asset Log of GPS-synchronized digital images.
7© 3M 2009. All Rights Reserved.
“VideoFramer” Post ProcessingProcessing Software:
Plays Mobile Asset Log “video” with GPS tracklog within GIS software.
GIS technicians build a detailed Post and Sign Inventory
Inventory is stored in a Sign Inventory Database
“MultiCapture” Mobile Asset Logging SystemA Portable Mobile Logging Platform uses:
Multiple high-resolution camerasand sub-meter GPS
Software records a Mobile Asset Log of GPS-synchronized digital images.
8© 3M 2009. All Rights Reserved.
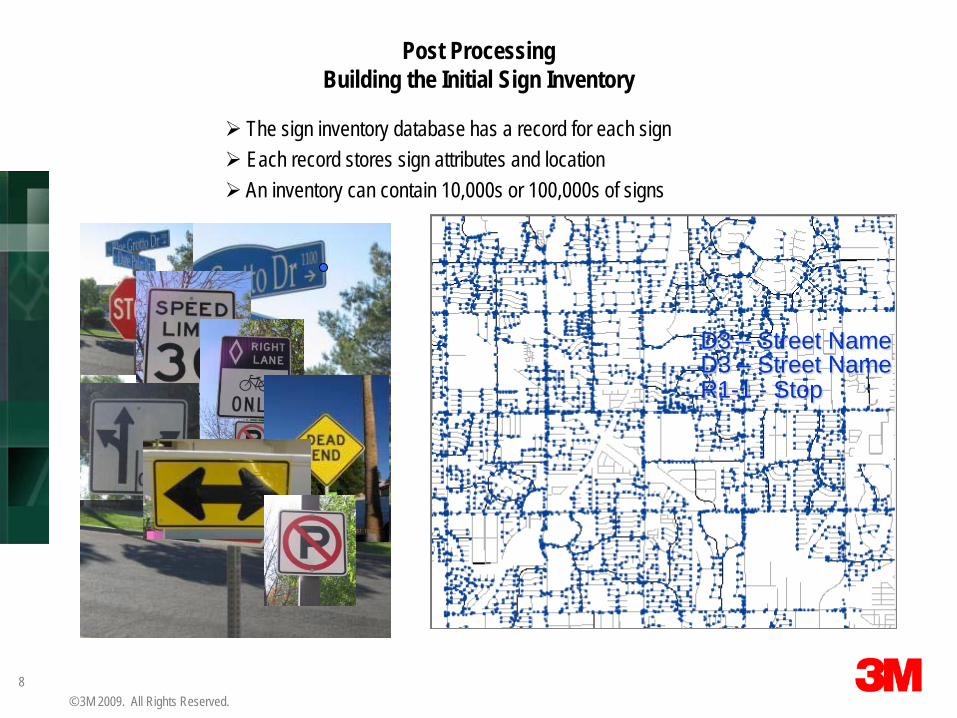
D3 – Street NameD3 – Street NameR1-1 - Stop
Post ProcessingBuilding the Initial Sign Inventory
The sign inventory database has a record for each sign Each record stores sign attributes and location An inventory can contain 10,000s or 100,000s of signs
9© 3M 2009. All Rights Reserved.
BUILD INITIAL INVENTORY
Web-BasedDatabase
Management
VISUALIZATION,MANAGEMENT,
REPORTINGQueries
andReports
“FAST”FieldTool
ASSESSMENT &INVENTORY
MANAGEMENT
“VideoFramer”Post
Processing
InventoryDatabase
“MultiCapture”Mobile Asset
Logging
Sign Management System Work Flow
10© 3M 2009. All Rights Reserved.
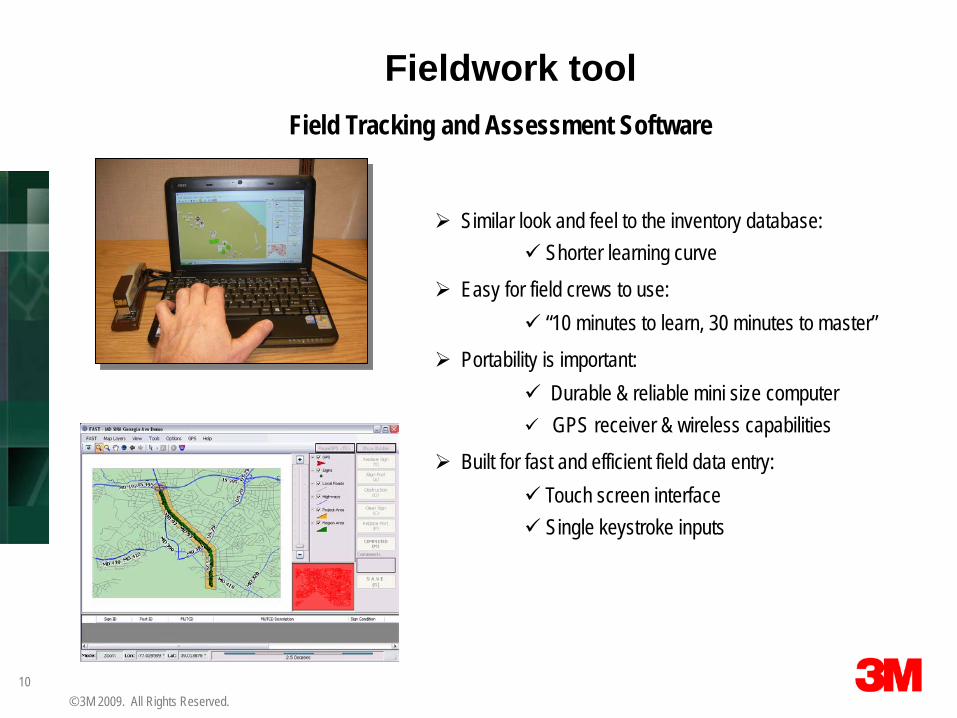
Similar look and feel to the inventory database: Shorter learning curve
Easy for field crews to use: “10 minutes to learn, 30 minutes to master”
Portability is important: Durable & reliable mini size computer GPS receiver & wireless capabilities
Built for fast and efficient field data entry: Touch screen interface Single keystroke inputs
Field Tracking and Assessment Software
Fieldwork tool
11© 3M 2009. All Rights Reserved.
BUILD INITIAL INVENTORY
Web-BasedDatabase
Management
VISUALIZATION,MANAGEMENT,
REPORTINGQueries
andReports
“FAST”FieldTool
ASSESSMENT &INVENTORY
MANAGEMENT
“VideoFramer”Post
Processing
InventoryDatabase
“MultiCapture”Mobile Asset
Logging
Sign Management System Work Flow
12© 3M 2009. All Rights Reserved.
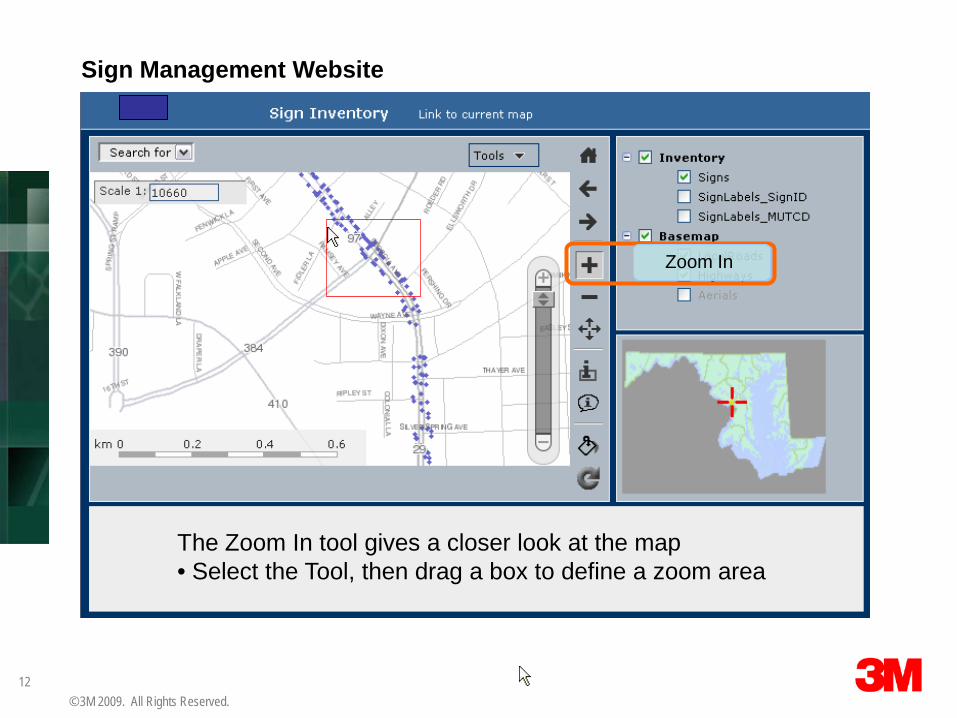
The Zoom In tool gives a closer look at the map• Select the Tool, then drag a box to define a zoom area
Zoom In
Sign Management Website
13© 3M 2009. All Rights Reserved.
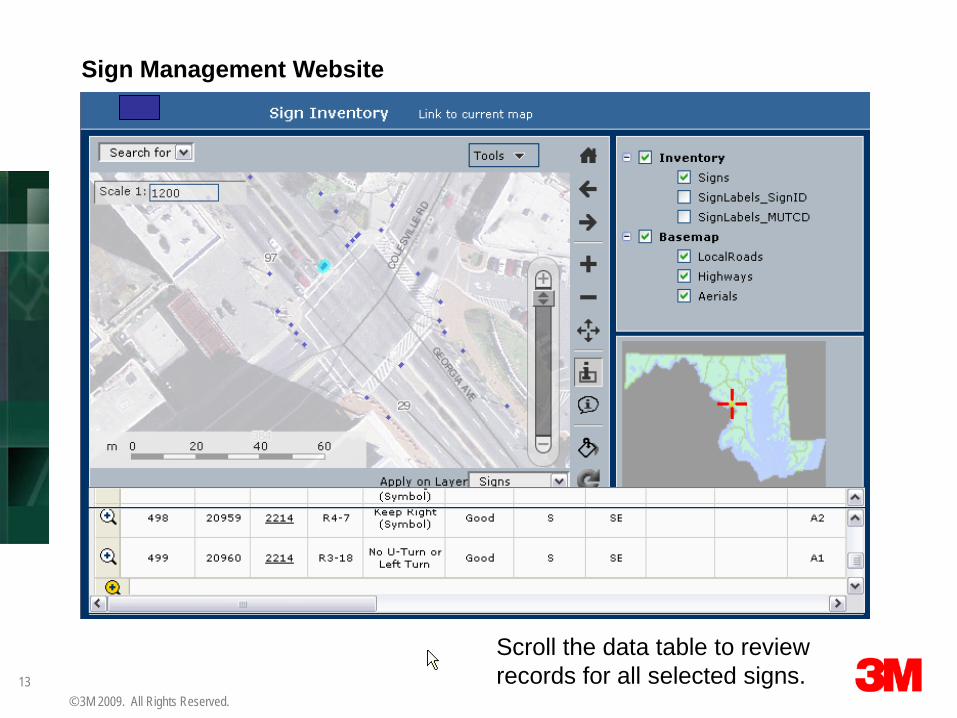
Scroll the data table to review records for all selected signs.
Sign Management Website
14© 3M 2009. All Rights Reserved.
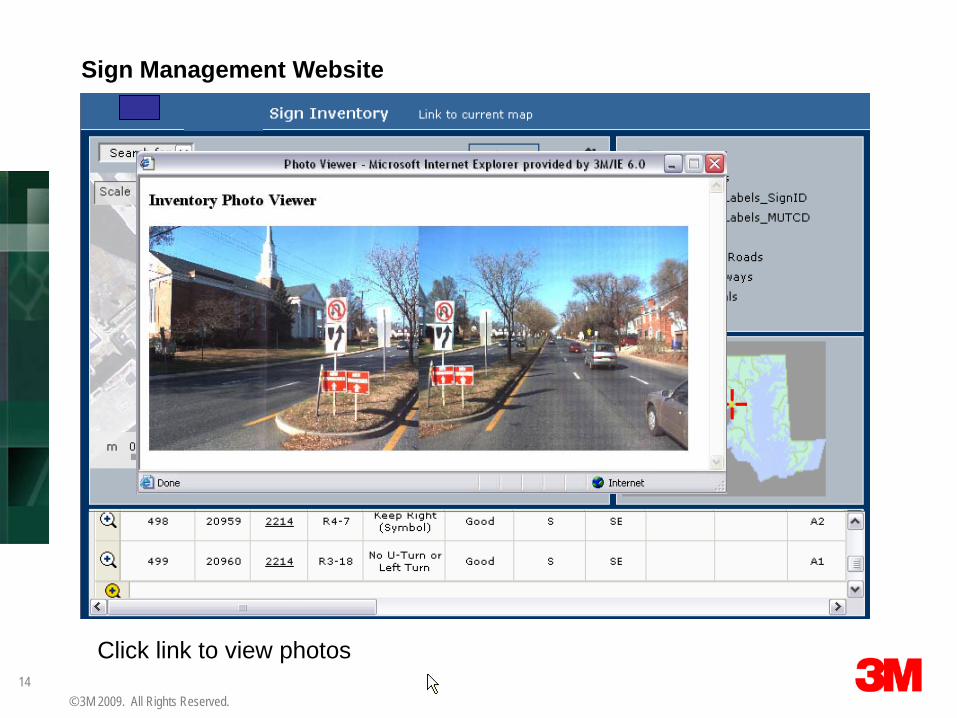
Click link to view photos
Sign Management Website
15© 3M 2009. All Rights Reserved.
Sign Management System
BUILD INITIAL INVENTORY
Web-BasedDatabase
Management
VISUALIZATION,MANAGEMENT,
REPORTINGQueries
andReports
“FAST”FieldTool
ASSESSMENT &INVENTORY
MANAGEMENT
“VideoFramer”Post
Processing
InventoryDatabase
“MultiCapture”Mobile Asset
Logging
16© 3M 2009. All Rights Reserved.
• Many options for sign management methods
• Sign inventory is key
• Cost effective short and long term
• A total solution including simple maintenance tools is important to long term success
Summary