treading water in quicksand: a look at poverty, income ... water in quicksand: a look at poverty,...
TRANSCRIPT

Treading Water in Quicksand: A Look at Poverty, Income Inadequacy and Self-
Sufficiency in Massachusetts
Prepared by:Andrew SumNeeta Fogg
Ishwar KhatiwadaSusan Perron
andSheila Palma
Center for Labor Market StudiesNortheastern UniversityBoston, Massachusetts
Prepared for:Workforce Solutions Group
Funding provided by:Skillworks
September 2004

1
Table of Contents
About the Workforce Solutions Group and Skillworks…………………………………………...2Introduction..................................................................................................................................... 4Data Sources and Concepts............................................................................................................. 6A Demographic and Socioeconomic Profile of Massachusetts Families in 2000 ...................... 133The Race/Ethnic Origins of Family Householders ..................................................................... 199The Educational Attainment of the State’s Family Householders ................................................ 21Poverty Trends in Massachusetts, 1979 – 2002.......................................................................... 288Poverty Rates of Key Demographic Subgroups of Families in Massachusetts ........................ 3030The Geographic Structure of Family Poverty Rates in 1999 ...................................................... 388The Incidence of Low Income Challenges Among Massachusetts Families, 1999.................... 433Geographic Variations in the Incidence of Low Income Challenges Among Families in
Massachusetts ....................................................................................................................... 5151Estimates of the Incidence of Family Economic Self-Sufficiency Challenges Among
Massachusetts Families, 1999 .................................................................................................. 54Methodologies for Estimating the Incidence of FESS Challenges Among Massachusetts
Families and Unrelated Individuals........................................................................................ 599Estimates of the Number and Per Cent of Families With an Income Below the
Self-Sufficiency Standard: 1999.............................................................................................. 60Family Economic Self-Sufficiency Deficits and the Educational Attainment and Nativity
Status of the Family Householder .......................................................................................... 677The Incidence of Family Economic Self-Sufficiency Deficit Challenges Among Different Types
of Families in Massachusetts.................................................................................................. 699The Incidence of Family Economic Self-Sufficiency Deficit Challenges Among Unrelated
Persons in Massachusetts in 1999 ............................................................................................ 71Measuring the Mean and Aggregate Size of Poverty and Family Economic Self-Sufficiency
Deficits ................................................................................................................................... 788Summary of Key Findings and Future Research Issues.............................................................. 833Appendix A: Comparisons of the U.S. Census Bureau Estimates of the Number of Family
Households in Massachusetts Counties in 2000 with the Number of Families in the CountyBased on the PUMA Assignment Model ................................................................................. 90
Appendix B: Methodologies for Calculating the Values of Family Economic Self-SufficeincyStandards for Family Subgroups ............................................................................................ 922
Appendix C: A Graphical Portrait of the Incidence of Poverty, Low Income, and FamilyEconomic Self-Sufficiency Challenges Among Families in Massachusetts Counties in 1999................................................................................................................................................ 100
Appendix D: Estimates of the Per Cent of Families in Massachusetts with a Family IncomeBelow the Family Economic Self-Sufficiency Standard by County and Type of Family, 1999.............................................................................................................................................. 1066
Appendix E: Estimates of the Mean and Aggregate Size of the Self-SufficiencyIncome Deficits of Massachusetts Families by County and Family Type in 1999............. 11111

2
About the Workforce Solutions Group
The Workforce Solutions Group is a coalition led by the Women’s Union, the
Massachusetts Workforce Board Association, the Organizing and Leadership Training Center
and the Massachusetts AFL-CIO that is dedicated to improving the Massachusetts workforce
development system. Its unique strength is that it brings together a broad range of employers,
unions, education and training providers, community colleges, immigrant advocates, workforce
investment boards and interfaith organizations. These diverse groups are united by their
common interest in having a strong and effective workforce development system.
The Workforce Solutions Group’s goal is to use the combined strength of its
constituencies to build public and political support for workforce development reform that
increases workers’ skills, advances families to self-sufficiency and promotes job creation and
economic growth. In pursuit of this goal, the Group is carrying out a regionally-based, statewide
campaign that aligns grassroots organizing and coalition building with coordinated media,
research, marketing and advocacy strategies. In addition to research, the Workforce Solutions
Group is conducting a series of eight regional forums around the state to bring together our
diverse constituencies to discuss the challenges and opportunities in the system and develop
policy recommendations.
The Workforce Solutions Group is the statewide public policy and advocacy grantee of
Skillworks.
About Skillworks
SKILLWORKS – Partners for a Productive Workforce (formerly known as the Boston
Workforce Development Initiative) is a five-year investment of approximately $15 million on the
part of philanthropy, government, community organizations, and employers to change how
workforce development is done in Boston. The goal is to create a system that helps low-skill,
low-income residents move to family-sustaining jobs and helps employers find and retain skilled
employees.

3
SKILLWORKS is a comprehensive, community-based approach to economic
development, Designed and led by the Boston Foundation, the City of Boston, the
Commonwealth of Massachusetts and other local and national donor organizations, it is unique
in the way a broad set of public and private stakeholders have come together to improve
economic opportunity for citizens. Designed with help from Jobs for the Future, a nationally
recognized non-profit workforce development organization, the initiative is supported by the
Boston Private Industry Council, Management Consulting Services, and Abt Associates. The
initiative is working with a wide array of employers and educational institutions to design
programs that provide low-income workers skills training for mid-level jobs at regional hospitals,
health research centers, universities, and the hospitality industry. These institutions are critical to
Boston’s economy in the 21st century, and will provide thousands of low-income Bostonians with
the resources they need to purchase affordable housing, send their children to college, and
become stakeholders in the American Dream.
The other funding organizations include the Annie E. Casey Foundation, The Hyams
Foundation, Paul and Phyllis Fireman Foundation/One Family Campaign, Fleet Financial
Charitable Asset Division, Making Connections Boston, Rockefeller Foundation, State Street
Foundation, and United Way of Massachusetts Bay.

4
Introduction
As part of its research and public policy promotion work in support of the Skillworks, the
Workforce Solutions Group has been preparing a series of research papers and reports on labor
market developments in the Commonwealth and trends in the economic well-being of
Massachusetts families and workers. In two earlier research reports prepared by the Center for
Labor Market Studies, trends in the level and distribution of the real incomes of Massachusetts
families over the decade of the 1990s were examined.1 Findings on the growth of the median
real incomes of families between 1989 and 1999 were presented and analyzed, with separate
breakouts of the data for key geographic areas within the state (metropolitan areas, counties,
selected cities and towns) and for selected demographic and socioeconomic subgroups of
families across the state. The economic forces underlying the changing levels and distribution of
family incomes also were examined.
The typical family in the state experienced only a very modest increase in its real income
(3.4%) over the past decade, a rate of growth far below the near 26% growth rate of median real
income during the decade of the 1980s. Massachusetts’ rate of growth of median real family
income went from 3rd highest among the states in the 1980s to only 41st highest in the 1990s.
The 1990s also witnessed growing gaps in the median incomes of families across family types
(married couple, female headed, male headed), the educational attainment of the family head, and
among the affluent, the middle class, and the low income population. The distribution of family
incomes in the state had become markedly more unequal by the end of the 1990s, with the bulk
of the gains in real incomes concentrated among those families in the top ten per cent of the
distribution.2
This research report is primarily devoted to an analysis of income inadequacy challenges
facing a wide array of Massachusetts families at the end of the 1990s. A wide variety of income 1 See: (i) Andrew Sum, Ishwar Khatiwada, Mykhaylo Trubs’kyy, with Sheila Palma, Family Income Developmentsin Massachusetts During the 1990s: Mediocre Growth for the Average Family Amidst Sharply Rising IncomeInequality, Prepared for the Workforce Solutions Group, Boston Workforce Development Initiative, Boston, January2004; (ii) Andrew Sum, Ishwar Khatiwada, Paulo Tobar, and Sheila Palma, Changes in the Economic Well-Being ofFamilies in Sub-state Areas of Massachusetts: Implications for the Future Targeting of Economic Development andWorkforce Development Programs, Prepared for the Workforce Solutions Group, Boston Workforce DevelopmentInitiative, Boston, June 2004.2 Using DOR income tax return data for 1999 rather than the U.S. Census Bureau family income data from the 2000Census yielded even higher estimates of income inequality. The DOR income data capture income sources (capital

5
inadequacy measures are used by economists, sociologists, and other social scientists. Three
alternative measures of income inadequacy are used in this paper: the poverty income thresholds
of the federal government, a measure of the low income status of families as represented by
200% of the existing poverty income thresholds, and the Family Economic Self Sufficiency
(FESS) standards of the Women’s Educational and Industrial Union (WEIU) and Wider
Opportunities for Women. For each of these three measures of income inadequacy, we will
provide estimates of the number and per cent of Massachusetts families (and at times for
unrelated individuals) that had incomes in calendar year 1999 below each of these three
standards. These estimates of income inadequacy are presented for all families in the state, for
selected geographic areas (counties, Local Workforce Investment Board service delivery areas),
and for a rather wide array of demographic and socioeconomic subgroups of families across the
state and selected sub-state areas.
Our report begins with an overview of the data sources that were used in conducting the
empirical analyses and a discussion of the key income inadequacy concepts and measures: the
federal government's poverty income thresholds, the family income measures used to represent
“low incomes,” and the Family Economic Self-Sufficiency standards of the Women’s
Educational and Industrial Union.3 The second section of the monograph will provide a detailed
demographic and socioeconomic profile of family households in the Commonwealth at the time
of the 2000 Census, including their distribution by family type, the presence in the home of
related children under 18 years of age, the educational attainment of the family householder, the
race/ethnicity of the householder, and the nativity status of the householder. The educational
attainment distribution of family householders also will be presented by type of family,
race/ethnic group, nativity status, and selected geographic areas of the state. A few comparisons
of Massachusetts and U.S. family characteristics will be presented.
The third section will present our estimates of the poverty rates of all families in
Massachusetts for selected time periods (1979, 1989, 1999, and 2002) and for a comprehensive
array of demographic, socioeconomic, and geographic subgroups at the time of the 2000 Census.
The fourth section will be devoted to findings on the incidence of low income challenges among
gains, management bonuses, stock options) not available from the 2000 Census and provide more reliable data onproperty income.3 For a review of the FESS standards and their values for selected types of families, See: Jean Bacon, Laura HenzeRussell, and Diana Pearce, The Self-Sufficiency Standard: Where Massachusetts Families Stand, Women’sEducational and Industrial Union, United Way of Massachusetts Bay, Boston, 2000.

6
Massachusetts families at the time of the 2000 Census. These estimates will be provided for all
families across the state and for a diverse set of families in demographic, socioeconomic, and
geographic subgroups (counties, LWIBs). The fifth section will present and assess key findings
on the number and per cent of families and unrelated individuals in Massachusetts who had
incomes below the Family Economic Self-Sufficiency standards in calendar year 1999.4 These
estimates of the share of families with incomes below the Self Sufficiency standards will be
provided for selected categories of families (adults only, single parent families with one or more
related children, married couple families with one or more children), for subgroups of families
classified by the gender, race/ethnicity, educational attainment, and nativity status of the
householder, and by county across the state.5 The final section of the paper will summarize key
findings of the study and briefly discuss their implications for the Boston Workforce
Development Initiative.
Data Sources and Concepts
Nearly all of the estimates of the number and percent of Massachusetts families that are
poor, low income, or with incomes below the Family Economic Self-Sufficiency standards are
based on the findings of the 2000 Census of Population and Housing.6 The long form
questionnaire that was used in conducting the 2000 Census collected information on family
incomes, the sources of those incomes, and on the poverty status of families.7 The long form
questionnaire was administered to a representative sample of one of every six households in each
city, county, and state. The U.S. Census Bureau has provided a set of public use data files for use
by social science researchers in analyzing the findings of the 2000 Census long form
questionnaires for households. We have used the 5-100 Public Use Micro-data Samples (PUMS)
4 Unrelated individuals are those persons who live on their own or in households with others to whom they are notrelated (roommates, unmarried partners, borders).5 We also will breakout estimates of the incidence of Family Economic Self-Sufficiency challenges amongdemographic subgroups of unrelated individuals in the state and variations in the incidence of such problems acrosscounties of the state.6 A few of the estimates presented in this monograph are based on the 1980 and 1990 Censuses and on the MarchCurrent Population Surveys for selected years from 1990 to 2003. The March CPS survey contains a workexperience and income supplement that collects data on the money incomes of all household members 15 and olderin the previous calendar year. These individual incomes for individual family members are aggregated to estimatefamily income and the family’s poverty status.7 The poverty income threshold and the 200% of poverty income threshold standard are based on pre-tax, moneyincomes only. They exclude the value of employee benefits, such as health insurance, pension contributions, orcompany cars, and exclude in-kind benefits such as food stamps or rental subsidies as well as federal and stateEarned Income Tax Credits. The FESS standard does account for some of these benefits, such as Earned IncomeTax Credits.

7
to conduct the analyses appearing in this report. This comprehensive data set provides us with
findings on the incomes, earnings, and poverty status of 1 of every 20 households in the state as
well as on the demographic and socioeconomic characteristics of the members of these family
households, especially the head of the family or in Census parlance the “family householder”.
In some cases, our estimates of the poverty or low income status of families at the county
level in Massachusetts are based on published estimates of the U.S. Census Bureau which follow
strict county boundaries. For many of our poverty and low income estimates and for all of our
Family Self Sufficiency Income estimates at the county level, we rely on close approximations to
county boundaries using combinations of Census Public Use Micro-data Areas (PUMAS) to
form counties. On the public use data files containing the micro-records from the long form
questionnaires, the U.S. Census Bureau does not provide county identifiers on the data files.
Instead, areas of 100,000 or more people (combinations of cities/towns, parts of large cities) are
categorized into PUMAS. These PUMAS unfortunately can cross county lines; thus, decisions
have to be made as to how to assign such PUMA’s to specific counties. Some counties will be
assigned more families than they actually have in residence while the remaining counties will
have slightly fewer. The PUMA classification scheme for the Family Economic Self-Sufficiency
Analysis provided pretty close fits for most counties. (See Appendix A for further details).
Ninety-nine per cent of families were assigned to one of the 14 counties (Barnstable, Dukes, and
Nantucket counties have to have combined for this analysis). In 8 of the 12 cases, the number of
families assigned to a county fell with +2 per cent of the official estimates of the number of
families. In 11 of the 12 cases, the counts were within +11%. In one case, Hampshire, there was
a gap of 19 per cent between the PUMA assigned number of families and the official count of
resident families in that county, but the total number of families involved in this gap was only
6,400.
The bulk of the income analyses presented in this paper are focused on the economic
well-being of families in the Commonwealth rather than on all households.8 Following
conventional Census Bureau definitions, a family household consists of two or more persons who
are related to each other by blood, marriage, or adoption. A family household may or may not
8 A household consists of one or more persons occupying separate living quarters. Households can be either familyhouseholds or non-family households.

8
contain any related children under the age of 18.9 Since the poverty, low income, and self-
sufficiency status of families frequently varies considerably by the number of children present in
the home, we will provide separate breakouts of the data for families by the presence of children
under 18 in the home. For the Family Economic Self-Sufficiency measures, we also will present
estimates of the number and per cent of unrelated individuals who had incomes below the self-
sufficiency standard for their geographic area.10
The poverty income estimates appearing in this paper are based on the poverty income
definitions and measures of the federal government as updated annually by the Office of
Management and Budget to reflect changes in the cost-of-living as measured by the Consumer
Price Index for All Urban Consumers. The poverty income thresholds vary with the number of
persons in the family, the age of the family householder, and the number of children under 18 in
the family.11 The 1999 weighted average poverty thresholds for families containing two to nine
persons are displayed in Table One. These poverty income thresholds ranged from $11,214 for a
family of two to $17,029 for a four person family to a high of $34,417 for families containing
nine or more persons. The same poverty income thresholds are applied to all states, metropolitan
areas, and cities across the country.
9 Household relationships in the Census data are always defined relative to the householder of the family. In amarried couple family, the householder can be either the husband or the wife.10 Unrelated individuals include persons living by themselves or in households with others to whom they are notrelated; i.e., roommates, unmarried partners, etc. Each unrelated individual is treated as a household of one indetermining their poverty, low income, and self-sufficiency status.11 Households headed by an individual over the age of 65 are assigned a lower poverty income threshold by thefederal government.

9
Table 1:Weighted Average Poverty Thresholds and Low Income
Thresholds for Families Containing Two to Nine Persons, 1999
Family Size
(A)
Weighted AveragePoverty Threshold
(B)
Low IncomeThreshold
Two (head under 65) $11,214 $22,428Three 13,290 26,580Four 17,029 34,058Five 20,127 40,254Six 22,727 45,454Seven 25,912 51,824Eight 28,967 57,934Nine or More 34,417 68,834
Source: U.S. Census Bureau; poverty income thresholds are updated annually by theOffice of Management and Budget.
The poverty status of a family is determined by comparing the pre-tax, money income of
the family with its poverty income threshold. The money income measure used to determine a
family’s poverty status includes income from employment, property income, and income from a
wide array of cash transfer programs, but excludes capital gains, federal and State Earned Income
Tax Credits, and in-kind benefits from the federal, state, and local governments, such as food
stamps, rental subsidies, and Medicare/Medicaid health care benefits. If the family’s combined
money income is below the assigned poverty income line for its given size and age composition,
then the family is classified as poor.
The federal government’s poverty income measures have been subject to a wide array of
criticisms by economists, sociologists, political scientists, and other social analysts over the past
decade, with some analysts claiming the poverty measures exaggerate the true extent of poverty
while many others critique the measures as under-estimating the magnitude of income
inadequacy challenges in the nation, individual regions, states, or cities. Among the major
criticisms12 from the point of view that the poverty lines underestimate true income inadequacy
are those that focus on the poverty line’s reliance on outdated family budgets which assume that
one-third of a family’s income is still spent on food, the poverty line’s failures to adjust for the 12 For a detailed review of alternative critiques of the federal government’s poverty lines, See: (i) Andrew Sum, W.Neal Fogg, and Garth Mangum, Poverty Ain’t What It Used to Be, Sar Levitan Center for Social Policy Studies,

10
changing relative costs of housing in the budget of low income families, the lack of any
adjustments in the poverty line for changes in the average living standards of American families
since the early 1960s, and the failure of the existing poverty lines to adjust for differences in the
cost of living across regions, states, and local areas, especially housing cost differences. A wide
array of alternative poverty lines have been proposed over the past 15 years, with these
alternative poverty lines ranging from 113% to 176% of the existing poverty income thresholds.13
During the past few years, a number of poverty and welfare reform researchers, including
those at the Urban Institute and the Manpower Demonstration Research Corporation, have
developed a measure of “low incomes” for families that utilizes 200 per cent of the current
federal government poverty lines as the thresholds for determining whether a family is low
income.14 The 1999 values of these low income thresholds for families in the U.S. by family size
are displayed in Column B of Table 1. The values of these “low income thresholds” in 1999
ranged from $22,428 for a family of two, to $34,058 for a family of four, to $68,834 for a family
containing nine or more persons.
These low income thresholds will be used to estimate the numbers, demographic/
socioeconomic characteristics, and geographic locations of Massachusetts families with 1999
money incomes below these low income thresholds. Estimates of the incidence of low income
challenges among families will be provided for the state as a whole, counties across the state,
Local Workforce Investment Board service delivery areas, and for families in a wide array of
demographic and socioeconomic groups, classified by family type, the presence of children, and
the educational attainment, race/ethnic origin, and nativity status of the family householder.
Our third set of measures of family income inadequacy in Massachusetts is based on the
Family Economic Self-Sufficiency standards developed jointly in our state by the Women’s
Johns Hopkins University, Baltimore, 1999; (ii) Garth Mangum, Stephen Mangum, and Andrew Sum, ThePersistence of Poverty in the United States, Johns Hopkins University Press, Baltimore, 2003.13 For a review of the sources of these alternative poverty income measures including the National ResearchCouncil’s Panel on Poverty and Family Assistance,See: Garth Mangum, Andrew Sum, and Neeta Fogg, “Poverty Ain’t What It Used to Be,” Challenge: The Magazineof Economic Affairs, March-April 2000, pp. 97-130.14 For examples of applications of this measure of low incomes,See: (i) Gregory Acs, Katherin Ross Phillips, and Daniel McKenzie, Playing by the Rules but Losing the Game:America’s Working Poor, Urban Institute, Washington, D.C., May 2000; (iii) Jennifer Miller, Lisa Grossman, et. al.,Building Bridges to Self-Sufficiency: Improving Services for Low Income Working Families, ManpowerDemonstration Research Corporation, New York City, 2004.

11
Educational and Industrial Union and Wider Opportunities for Women.15 The Self-Sufficiency
methodology attempts to address a number of the methodological shortcomings of the federal
government’s poverty lines by providing locally based cost measures for housing and child care,
taking federal and state taxes and Earned Income Tax credits into account in determining the
amount of gross income needed by a family to achieve the desired consumption bundle, and
varying child care costs with the age of the children in the family and the local cost of child care.
According to a report of the Women’s Educational and Industrial Union, the Self-Sufficiency
standard is intended to represent the amount of income needed by families in Massachusetts “to
meet their basic needs for housing, food, transportation, child care, health care, miscellaneous
expenses, and taxes.”16 Estimates of the 1999 values of the Family Economic Self-Sufficiency
standards for selected subgroups of families in Suffolk County are displayed in Table 2 below.
The values of these family standards range from $17,713 for a one person household, to $36,202
for one adult with a pre-school aged child (3-5 years old), and to $46,580 for a family with two
adults, one pre-school child, and 1 child over 6. We have used estimated Family Economic Self-
Sufficiency standards for Massachusetts families in 1997 and 2003 to impute values for calendar
year 1999.17 We also have applied a set of equivalence scales originally recommended by the
National Research Council’s Panel on Poverty and Family Assistance to estimate the appropriate
self-sufficiency standards for other types of families in our state.18 A description of the specific
methods used to derive these alternative self-sufficiency standards for other types of families is
presented in Appendix B.
15 See: Jean Bacon, Laura Henze Russell, and Diana Pearce, The Self-Sufficiency Standard: Where MassachusettsFamilies Stand, Women’s Educational and Industrial Union, United Way of Massachusetts Bay, Boston, 2000.16 Ibid. These budgets measure the amount of income needed to cover these expenses without either public orprivate subsidies, such as rental subsidies, food stamps, child care subsidies, or free day care from family members.17 See: Diana Pearce, The Self-Sufficiency Standard for Massachusetts, Women’s Educational and Industrial Union.Boston, April 2003.18 See: Constance F. Citro and Robert T. Michael (Editors), Measuring Poverty: A New Approach, NationalAcademy Press, Washington, D.C., 1995.

12
Table 2:Family Economic Self-Sufficiency Standards for Selected Types of Families in Suffolk County,
1999(Imputed)
Family Type Standard
1 Adult, no children $17,7132 Adults, no children 29,7761 Adult, 1 child under 6 36,2021 Adult, 2 children over 6 32,0422 Adults, 1 child under 6, 1 child over 6 46,580
Source: Women’s Educational and Industrial Union, selected publications, imputation by CLMS.
The values of the Family Economic Self-Sufficiency standards for Massachusetts families
substantially exceed the federal poverty income thresholds and are higher than the low income
thresholds based on twice the poverty line for families of a given size and composition. The
ratios of the Family Economic Self-Sufficiency standards to the federal government’s poverty
lines for the subset of family types appearing in Table 2 typically range from 2.5 to 3.0, with the
relative size of the gaps largest for families with children under the age of six due to the high
market costs of child care for such families. For example, the Family Economic Self-Sufficiency
budget for a single mother family with a pre-school aged child (ages 3 to 5) in the city of Boston
was $36,202 versus a poverty income threshold of only $11,483 for a family of two with one
child under 18 years of age.19 The FESS standard for this family was 3.14 times the official
poverty line. The relative size of the income gaps between the FESS budgets and the federal
government’s poverty line is smallest for unrelated individuals. The estimated FESS standard for
one adult in the city of Boston in 1999 was $17,713 versus a poverty line of $8,667 for a one
person household, a relative difference of 2.04 or approximately the same as the multiple for the
low income threshold which is 2.0 times the poverty line. Given the variations in the relative
size of the differences between the Family Economic Self-Sufficiency Standards and the poverty
lines and low income thresholds by family type and age composition, one would expect that the
application of the FESS methodology will yield a higher incidence of income inadequacy
challenges among families with pre-school aged children (under 6) than among families with no
children under 18 or only children ages 6 and older in the home.
19 The official poverty income thresholds of the federal government do take the number of children under 18 intoaccount but do not distinguish children under age 6 or infant children (under age 3) from older children.

13
The available Family Economic Self-Sufficiency standards for selected subgroups of
families and unrelated individuals by county in Massachusetts were expanded to produce FESS
standards for all other family types in each county, incorporating a common equivalence scale
formula recommended by the National Research Council’s Panel on Poverty and Family
Assistance.20 (See Appendix B for a more detailed discussion of the methods used to produce
these FESS standard estimates.) These other family types include families with 2 or more adults
and no related children under 18, families with one parent and 3 or more children, married couple
families with 3 or more children, and families with 3 or more adults and various combinations of
children under the age of 18. We also estimated the numbers of unrelated individuals (18 and
older) in each county with incomes below the Self-Sufficiency thresholds for single adults. For
each county and the state, we have produced estimates of the number and per cent of families
with incomes below the Self-Sufficiency thresholds in calendar year 1999. These estimates were
also generated for various types of families (adults only, single parent families, married couple
families with children under 18) and by selected demographic characteristics of the family
householder (age group, educational attainment, race-ethnic origin, and nativity status). For the
first time, comprehensive estimates of the incidence of Family Economic Self-Sufficiency
challenges for detailed demographic and socioeconomic subgroups are available for the
Commonwealth of Massachusetts.
A Demographic and Socioeconomic Profile of Massachusetts Families in 2000
Knowledge of the demographic and socioeconomic characteristics of Massachusetts
families is important in and of itself by providing us with insights as to who our families really
are and how their composition has changed over time. The demographic and socioeconomic
characteristics of these families also have important implications for the level and structure of
poverty, low income, and Family Economic Self-Sufficiency challenges. The composition of
families (married couple, single parent), the educational attainment of family householders, and
the nativity status of family householders influence the size of their annual incomes and, thus, the
likelihood of their being poor, low income, or unable to achieve economic self-sufficiency.
20 This equivalence scale formula treats each child in the family as the equivalent of .7 adults and incorporateseconomies of scale in consumption coefficient of .75. The formula for a given family type is equal to (A + .7C) .75.where A = the number of adults (18 and older) in the family and C = the number of children. The exponent .75 isthe power to which the sum in brackets is taken to determine the value of this family’s income adjustment factorrelative to a family with two adults and two children.

14
At the time of the 2000 Census, there were 1.584 million family households in
Massachusetts, accounting for slightly under 65% of the total 2.443 million households residing
in the state.21 The share of all households in Massachusetts that are family households has
declined steadily and sharply since 1950. At the time of the 1950 Census, nearly 90 per cent of
all households in the Commonwealth were categorized as family households. By 1980, this ratio
had declined to 71% and it fell to 67.4% in 1990 before declining to a new historical low of
64.8% in 2000.22
Slightly over three-fourths of the state’s families in 2000 were married couple families.
Another 18% of the state’s families were headed by unmarried women, many of whom contained
children under 18. The remaining 5 to 6 percent of the families were male headed families with
no female spouse present in the home. The composition of family households in Massachusetts
by family type in 2000 was nearly identical to that for the nation as a whole. In the U.S., 76.5%
of all family households were married couple families in 2000 versus 76.4% in our state.
Massachusetts had a slightly higher share of its family households in the female householder
category (18.1% vs. 17.5%) (Table 4). Many of these female-headed families had children under
18 present in the home. As will be revealed below, the economic well-being of female headed
families with children differs quite considerably from that of female-headed families with no
children under 18 in the home, especially in terms of the incidence of poverty and low income
challenges.
21 As noted earlier, there are two types of households in the state: family households and non-family households.The latter group consists of single individuals living alone or with others to whom they are not related.22 For a review of historical trends in household size, composition, and householder characteristics,See: Andrew Sum, Neeta Fogg, Jackie Sum, and Alice Winkler, One Hundred Years of Population and EconomicChanges: The Massachusetts Experience, 1890-1990, Center for Labor Market Studies, Northeastern University,Boston, 1991.

15
Table 3:Distribution of Family Households in Massachusetts by Type of Family, 2000
Type of Family
(A)
Number
(B)
Per Cent
Married Couple 1,211,434 76.4Female Householder, No Male Spouse Present 287,081 18.1Male Householder, No Female Spouse Present 86,006 5.4Total 1,584,521 100.0
Table 4:Comparisons of the Percentage Distribution of U.S. and
Massachusetts Families by Family Type, 2000
Family Type
(A)
U.S.
(B)
Massachusetts
(C)
Massachusetts – U.S.
Married Couple 76.5 76.4 -.1Female Householder, No Male Spouse
Present17.5 18.1 +.6
Male Householder, No Female SpousePresent
6.0 5.4 -.6
Family households also can be categorized by the presence of related children under 18
years of age in the home. At the time of the 2000 Census, only a slight majority of the state’s
families (50.5%) had one or more related children present in the home (Table 5). Nearly twenty-
one per cent of the families had only one child present in the home, and another 20 per cent had
two children living in the home. Only 10 per cent of the state’s families had 3 or more related
children under 18 in the home, and fewer than 1 per cent of all of the state’s families had 5 or
more children.

16
Table 5:Distribution of Family Households in Massachusetts by the
Number of Related Children Under 18, 2000
Number of RelatedChildren Under 18
(A)
Number
(B)
Per Cent
0 783,773 49.51 327,436 20.72 314,752 19.83 119,351 7.54 29,744 1.95 or More 9,465 .6Total 1,584,521 100.0
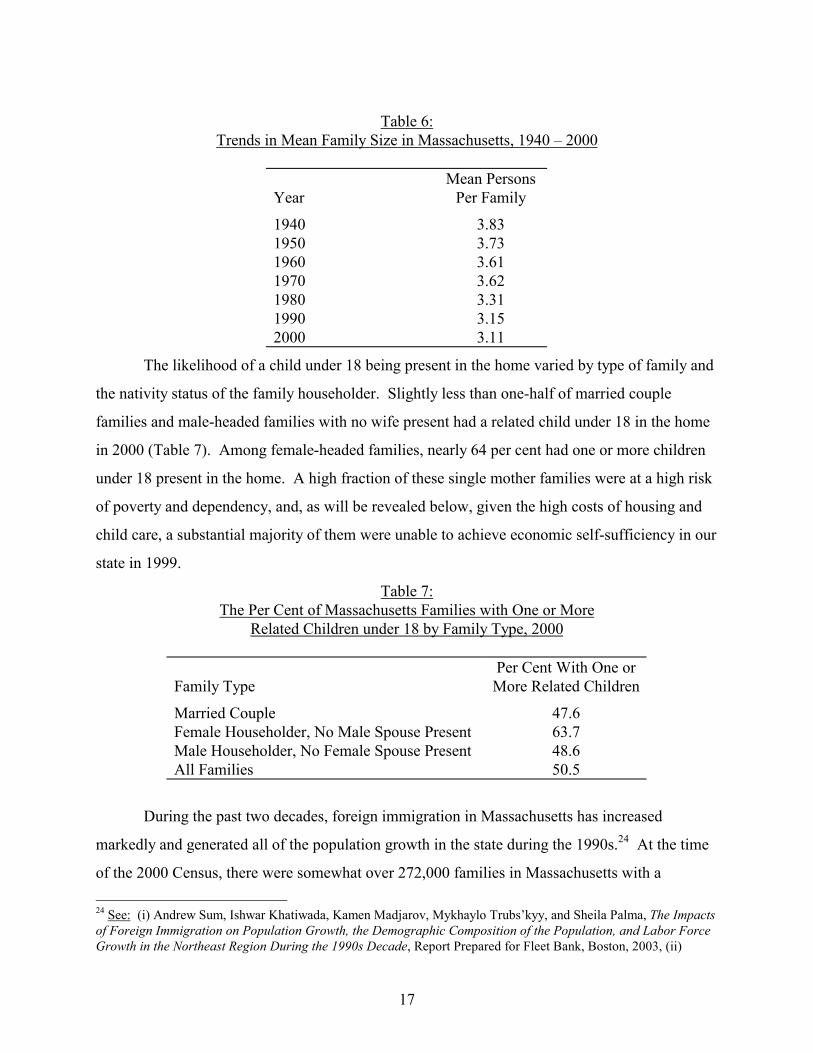
The mean number of persons per family household in Massachusetts during 2000 was
3.11 (Table 6). This mean family size was slightly below that of the U.S. (3.14) at the time of the
2000 Census. Mean family size in Massachusetts has declined nearly steadily and strongly since
1940 when mean family size was 3.83 (Table 6). By 1970, mean family size fell to 3.62, and it
would drop to 3.11 by the time of the 2000 Census, a near 20 percent reduction since 1940.
Small family size by itself should have facilitated the ability of the state to reduce poverty and
low income challenges over the past few decades, given the positive statistical link between
family size and the probability of a family being poor in the United States.23 Smaller families
have lower poverty incomes thresholds and FESS budgets.
23 For example, during 1999, poverty rates of U.S. families ranged from a low of 7.6 per cent for families containingonly two persons to 9 per cent for four person families, to 17 per cent for families containing six persons and to ahigh of 30 per cent among families with eight or more persons.See: Garth Mangum, Stephen Mangum, and Andrew Sum, The Persistence of Poverty in the United States, p. 58.
17
Table 6:Trends in Mean Family Size in Massachusetts, 1940 – 2000
YearMean Persons
Per Family
1940 3.831950 3.731960 3.611970 3.621980 3.311990 3.152000 3.11
The likelihood of a child under 18 being present in the home varied by type of family and
the nativity status of the family householder. Slightly less than one-half of married couple
families and male-headed families with no wife present had a related child under 18 in the home
in 2000 (Table 7). Among female-headed families, nearly 64 per cent had one or more children
under 18 present in the home. A high fraction of these single mother families were at a high risk
of poverty and dependency, and, as will be revealed below, given the high costs of housing and
child care, a substantial majority of them were unable to achieve economic self-sufficiency in our
state in 1999.
Table 7:The Per Cent of Massachusetts Families with One or More
Related Children under 18 by Family Type, 2000
Family TypePer Cent With One orMore Related Children
Married Couple 47.6Female Householder, No Male Spouse Present 63.7Male Householder, No Female Spouse Present 48.6All Families 50.5
During the past two decades, foreign immigration in Massachusetts has increased
markedly and generated all of the population growth in the state during the 1990s.24 At the time
of the 2000 Census, there were somewhat over 272,000 families in Massachusetts with a 24 See: (i) Andrew Sum, Ishwar Khatiwada, Kamen Madjarov, Mykhaylo Trubs’kyy, and Sheila Palma, The Impactsof Foreign Immigration on Population Growth, the Demographic Composition of the Population, and Labor ForceGrowth in the Northeast Region During the 1990s Decade, Report Prepared for Fleet Bank, Boston, 2003, (ii)

18
householder that was foreign born, accounting for 17 per cent of all families in the state (Table
8).25 Families with a foreign born householder were less likely to be married couples than their
native born counterparts (71% vs. 78%). An above average share of the families with a foreign
born householder were female-headed families (22%), with children frequently being present in
the home. This latter group of families was at high risk of being poor, low income, and unable to
achieve economic self-sufficiency. Given the younger ages of their householders, immigrant
families in Massachusetts in 2000 were more likely than their native born counterparts to contain
one or more related children under 18 years of age (Table 9). Fifty-nine per cent of immigrant
families had related children present in the home versus only 49 per cent of families with a native
born householder. In each of our three family type categories, immigrant families were more
likely to contain children. For example, 56% of married couple, immigrant families had one or
more children in the home versus only 46% of married couples headed by a native born
individual. Female-headed immigrant families (71%) were also more likely to contain children
than their native born counterparts (61%).
Table 8:The Percentage Distribution of Families in Massachusetts by Nativity
Status of Householder and Type of Family, 2000 (in %)
Type of Family
(A)
NativeBorn
(B)
ForeignBorn
Married Couple 77.7 70.6Female Householder, No Male Spouse Present 17.2 22.3Male Householder, No Female Spouse Present 5.1 7.0Total Number of Families 1,312,483 272,083Per Cent of All Families in State 82.8% 17.2%
Andrew Sum, W. Neal Fogg, et. al., The Changing Workforce: Immigrants and the New Economy in Massachusetts,Citizens Bank and the Massachusetts Institute for A New Commonwealth, Boston, 1999.25 Persons born in Puerto Rico, the U.S. Virgin Islands, or one of the other outlying territories of the U.S. areclassified as foreign born in this analysis.

19
Table 9:The Per Cent of Families in Massachusetts with One or More Related
Children under 18 by Nativity Status of Householder and Type of Family
Type of Family
(A)
NativeBorn
(B)
ForeignBorn
(C)
Foreign Born –Native Born
Married Couple 46.0 55.7 +9.7Female Householder, No Male Spouse
Present61.6 71.4 +9.8
Male Householder, No Female SpousePresent
48.8 59.0 +10.2
The Race/Ethnic Origins of Family Householders
The 2000 Census questionnaires also collected data on the race/ethnic backgrounds of
family members. We have organized the race/ethnic data to classify family householders into
one of the following five, mutually exclusive race/ethnic groups:
� Asian, Pacific Islander, not Hispanic� Black, not Hispanic� Hispanic26
� Other, not Hispanic27
� White, not Hispanic
At the time of the 2000 Census, families with White, non-Hispanic householders
accounted for 1.336 million families in the state or 84 per cent of all families (Table 10).
Hispanics were the second largest race/ethnic group, representing just under 6 per cent of all
families in the state, followed by Blacks (4.6%), Asians (3.3%), and other non-Hispanics (2.3%).
The race/ethnic characteristics of family householders varied fairly considerably across counties
of the state at the time of the 2000 Census. The share of White, non-Hispanic families varied
from a low of 48% in Suffolk County, to 79% in Hampden County, to highs of 96 to 97 per cent
in Berkshire and Franklin Counties (Table 11). Suffolk County was the only county in which
non-Hispanic Whites represented a minority of all family householders. Black and Hispanic
families together accounted for nearly 40 per cent of all families in Suffolk County in 2000 with 26 Hispanic persons can be members of any race. We have excluded Hispanics from the count of all races so that theabove five groups are mutually exclusive.

20
Asians representing another 7 per cent. A high fraction of these families headed by Asians and
Hispanics were also immigrant families. Black families were heavily concentrated in just one
county (Suffolk) with nearly half of all Black families of the state residing in this county. Three
out of every four Hispanic families lived in one of the following four counties: Essex, Hampden,
Middlesex, and Suffolk, with one of four Hispanic families living in Suffolk County.
Table 10:
The Distribution of Massachusetts Families by the Race/Ethnic Characteristics of the Family Householder, 2000
Race/Ethnic Characteristic
(A)
Number
(B)
Per Cent
Asian, Pacific Islander, not Hispanic 51,991 3.3 Black, not Hispanic 72,779 4.6 Hispanic 92,941 5.8 Other, not Hispanic(1) 36,822 2.3 White, not Hispanic 1,335,654 84.0
Note: Other category includes American Indians, Alaskan Natives, and persons of mixed race. Source: 2000 Census of Population and Housing, 5-100 PUMS files, tabulations by author.
27 The “other, not Hispanic group” includes American Indians, Alaskan Natives, and persons of mixed race. The2000 Census was the first to allow persons to identify more than one race.

21
Table 11:
The Share of Families with a White, non-Hispanic Householder in Counties of Massachusetts, 2000
County Per Cent
Barnstable, Dukes, Nantucket 94.3 Berkshire 96.7 Bristol 90.5 Essex 85.4 Franklin 97.2 Hampden 78.7 Hampshire 88.3 Middlesex 85.7 Norfolk 90.4 Plymouth 90.3 Suffolk 48.0 Worcester 87.4
All 84.0
The Educational Attainment of the State’s Family Householders
During the past two decades, the real wages and annual earnings of Massachusetts
workers have become more strongly associated with their educational attainment.28 Workers
with no high school diploma have lost ground, especially during the 1990s, as have year, round
male workers with only a high school diploma.29 Among both men and women, gains in real
annual earnings of workers during the 1990s were highest among those with a Bachelor’s or
higher degree.
We have used the findings from the 2000 Census long form questionnaires on the
educational attainment of respondents to classify all family householders into one of six
educational attainment categories, ranging from those without a regular high school
diploma/GED certificate to those holding a Master’s or more advanced academic degree (Table
12). At the time of the 2000 Census, 232,000 of the state’s family householders, or nearly 15 per
28 For a review of the annual earnings experiences of the state’s workers during 1989 and 1999, See: Andrew Sum, Paul Harrington, Neeta Fogg, et. al., The State of the American Dream in Massachusetts:2002,… 29 Among husbands in non-elderly married couple families, median real annual earnings declined for eacheducational group except those with a Bachelor’s or higher degree. In fact, those with a Bachelor’s degree were onlyable to maintain their median real annual earnings over the decade. See: Andrew Sum, Ishwar Khatiwada, et. al., Family Income Developments in Massachusetts During the 1990s….,
22
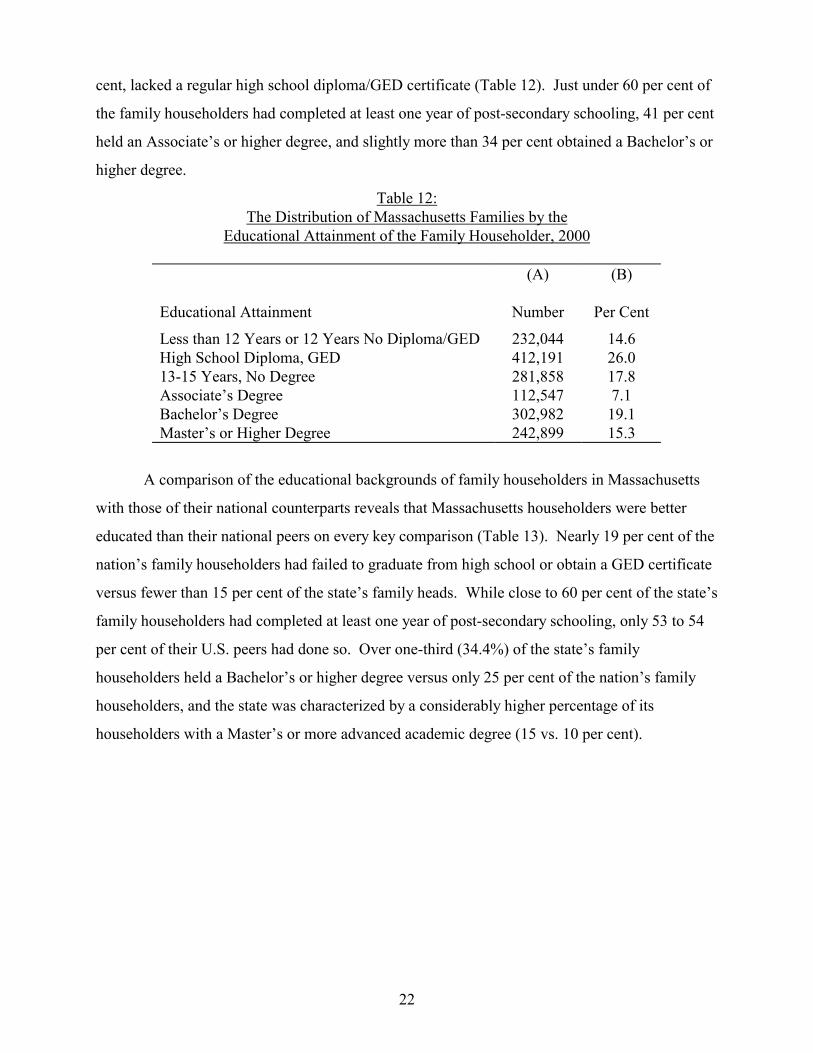
cent, lacked a regular high school diploma/GED certificate (Table 12). Just under 60 per cent of
the family householders had completed at least one year of post-secondary schooling, 41 per cent
held an Associate’s or higher degree, and slightly more than 34 per cent obtained a Bachelor’s or
higher degree.
Table 12: The Distribution of Massachusetts Families by the
Educational Attainment of the Family Householder, 2000
Educational Attainment
(A)
Number
(B)
Per Cent
Less than 12 Years or 12 Years No Diploma/GED 232,044 14.6 High School Diploma, GED 412,191 26.0 13-15 Years, No Degree 281,858 17.8 Associate’s Degree 112,547 7.1 Bachelor’s Degree 302,982 19.1 Master’s or Higher Degree 242,899 15.3
A comparison of the educational backgrounds of family householders in Massachusetts
with those of their national counterparts reveals that Massachusetts householders were better
educated than their national peers on every key comparison (Table 13). Nearly 19 per cent of the
nation’s family householders had failed to graduate from high school or obtain a GED certificate
versus fewer than 15 per cent of the state’s family heads. While close to 60 per cent of the state’s
family householders had completed at least one year of post-secondary schooling, only 53 to 54
per cent of their U.S. peers had done so. Over one-third (34.4%) of the state’s family
householders held a Bachelor’s or higher degree versus only 25 per cent of the nation’s family
householders, and the state was characterized by a considerably higher percentage of its
householders with a Master’s or more advanced academic degree (15 vs. 10 per cent).

23
Table 13: Comparisons of the Percentage Distribution of U.S. and Massachusetts
Family Householder, by Educational Attainment, 2000 (in %)
Educational Attainment
(A)
U.S.
(B)
Massachusetts
(C)
Massachusetts – U.S.
Less than 12 or 12 No Diploma/GED 18.8 14.6 -4.2 High School Diploma/GED 27.6 26.0 -1.6 13-15 Years, No College Degree 21.9 17.8 -4.1 Associate’s Degree 6.3 7.1 +.8 Bachelor’s Degree 15.4 19.1 +3.7 Master’s or Higher Degree 10.0 15.3 +5.3
The educational attainment backgrounds of the state’s family householder in each family
type category were analyzed separately (Table 14). On average, family householders in married
couple families were better educated than their counterparts in the two other family subgroups;
i.e., female-headed families with no male spouse present in the home and male-headed families
with no female spouse. Only 13 per cent of the householders in married couple families had
failed to obtain a regular high school diploma or a GED certificate versus 21 per cent of the
unmarried householders in female and male headed families.30 Sixty-two per cent of the
householders in married couple families had completed at least some post-secondary schooling
versus only 47 per cent and 45 per cent of their unmarried female and male counterparts. The
householders in married couple families were twice as likely as their unmarried peers to have
obtained a Bachelor’s or higher academic degree. At the time of the 2000 Census, just under 40
per cent of householders in married couple families held a Bachelor’s or higher degree in
comparison to only 18% of unmarried female, family householders and 22% of unmarried men.
Among the householders in female-headed families, those family heads with related children
present in the home were less well educated than their counterparts with no children under 18 in
the home, placing them and their children at greater risk of poverty and other forms of income
inadequacy, especially an inability to achieve economic self-sufficiency. As will be shown
below, the vast majority of single mother families in the state were unable to achieve economic

24
self-sufficiency in 1999, and the odds against them doing so were raised considerably when they
lacked any post-secondary schooling.
Table 14: The Percentage Distribution of Family Householders by
Educational Attainment and Family Type, Massachusetts: 2000
Educational Attainment
(A)
Married Couple
(B)
Female Householder, No Male Spouse Present
(C)
Male Householder, No Female Spouse Present
Less than 12 or 12, no Diploma 12.7 21.0 20.9 High School Diploma/GED 24.1 31.8 33.7 13-15 Years, No Degree 17.0 21.1 18.0 Associate’s Degree 7.0 8.2 5.6 Bachelor’s Degree 21.4 10.9 13.2 Master’s or Higher Degree 17.8 6.9 8.6
The percentage distributions of family householders by educational attainment in each of
five major race/ethnic groups in Massachusetts in 2000 are displayed in Table 15. The
educational attainments of family householders varied considerably by race/ethnic group at both
the bottom and top of the distribution. The per cent of family householders lacking a high school
diploma or a GED certificate ranged from a low of slightly under 12 per cent among White, non-
Hispanics to 21 to 23 per cent among Blacks and Asians, respectively, to a high of just under 41
per cent among Hispanics. The state’s Hispanic family householders, a high fraction of whom
were foreign born, were 3.5 times more likely to have left school without obtaining a high school
diploma than their White, non-Hispanic counterparts. Asian family householders (65%) were the
most likely to have completed at least one year of post-secondary schooling closely followed by
White, non-Hispanics (63%) while only 32% of Hispanic householders had completed some
college. Asian family householders were the most likely to have obtained a Bachelor’s or higher
academic degree. Approximately 53% of Asian householders held a Bachelor’s or higher degree
versus 37% of White, non-Hispanics, 21% of Black family householders, and only 12% of
Hispanic family householders. The far more limited educational attainment of the state’s
Hispanic family householders, particularly when combined with limited English speaking skills,
places a high fraction of them at risk of income inadequacy.
30 In a married couple family, either the husband or the wife can be the householder of the family. In the 2000Census in Massachusetts, the husband was classified as the householder in almost 80% of the cases but the share soclassified did vary by the educational attainment of the wife and husband.

25
Table 15: The Percentage Distribution of Massachusetts Family Householders by
Educational Attainment within Race/Ethnic Groups, 2000
Educational Attainment
(A)
Asian Only, NotHispanic
(B)
Black Only, NotHispanic
(C)
Hispanic
(D)
Mixed Race, NotHispanic
(E)
White Only, NotHispanic
Less than 12 or 12 no Diploma 23.0 20.7 40.9 23.4 11.7 High School Diploma, GED 12.2 27.7 27.4 27.0 26.2 13-15 Years, No Degree 8.0 22.4 15.3 20.0 18.0 Associate’s Degree 4.0 7.8 4.4 6.9 7.4 Bachelor’s Degree 19.3 12.9 6.7 13.7 20.6 Master’s or Higher Degree 33.6 8.4 5.3 9.0 15.9
As noted earlier, a rising fraction of the state’s families are immigrant families, and all of
the growth in the state’s family households over the 1990s decade was generated by immigrant
families. Given their growing demographic importance, the educational backgrounds of foreign
born family householders were examined and compared to those of native born family
householders in the state (Table 16). Foreign born family householders were considerably more
likely than native born householders to lack a high school diploma/GED certificate. At the time
of the 2000 Census, one-third of the state’s foreign born family householders lacked a regular
high school diploma/GED certificate versus only 11 per cent of native born family householders,
a relative difference of three to one. Foreign born householders were less likely than their native
born counterparts to have completed some post-secondary schooling (45 per cent vs. 62 per cent),
and they were less likely to have obtained a Bachelor’s or higher academic degree (28% vs.
36%). However, at the highest level of formal schooling, i.e., those with a Master’s or higher
academic degree, foreign born family householders matched the educational performance of their
native born counterparts. Between 15 and 16 per cent of both groups of family householders
held a Master’s or higher academic degree (Table 16).

26
Table 16: The Percentage Distribution of Massachusetts Family Householders by
Educational Attainment within Nativity Status Groups, 2000
Educational Attainment
(A)
Native Born
(B)
Foreign Born
(C)
Foreign Born – Native Born
Less than 12 or 12, No Diploma 10.7 33.4 +22.7 High School Diploma/GED 26.9 21.9 -5.0 13-15 Years, No Degree 19.0 12.2 -6.8 Associate’s Degree 7.6 4.6 -3.0 Bachelor’s Degree 20.6 12.2 -8.4 Master’s or Higher Degree 15.2 15.7 +.5
How do the educational backgrounds of the state’s foreign born and native born family
householders compare to those of their respective national counterparts? To answer this
question, we analyzed the educational attainment of both groups of family householders in the
state and the nation. Key findings are displayed in Table 17. In 2000, a higher fraction of
Massachusetts family householders were foreign born in comparison to the U.S. (17.2% vs.
13.6%). Foreign born family householders in Massachusetts were modestly better educated than
their U.S. counterparts. While 32.5% of the state’s immigrant householders held an Associate’s
or higher degree, only 30.3% of their national peers did so, a difference of 2.2 percentage points
in favor of Massachusetts (Table 17). The educational advantage of the state’s native born
family householders was considerably greater. Over 43% of all native born family householders
in Massachusetts at the time of the 2000 Census held an Associate’s or higher degree versus only
32 per cent of their national counterparts. These families with well educated, native born
householders tend to experience the lowest rates of income inadequacy on each of our three
income measures: poverty, low incomes, and economic self-sufficiency.

27
Table 17: Comparisons of the Percentage Distribution of U.S. and Massachusetts
Family Householders by Nativity Status and Selected Educational Attainment Groups, 2000
Nativity/Educational Status
(A)
U.S.
(B)
Massachusetts
(C)
Massachusetts – U.S.
Foreign Born 13.6 17.2 +3.6� % with Associate’s or Higher
Degree 30.3 32.5 +2.2
Native Born 86.4 82.8 -3.6� % with Associate’s or Higher
Degree31.9 43.4 +11.5
The educational attainment of family householders in Massachusetts also varied
considerably across counties and Local Workforce Investment Board (WIB) service delivery area
during 2000. Across counties of the state, the per cent of family householders with a bachelor’s
or higher degree ranged from lows of 21% in Bristol County and 22% in Hampden County to
highs of 46% to 47% in Middlesex and Norfolk Counties (Table 18). In Bristol and Suffolk
Counties, close to one-fourth of the family householders lacked a high school diploma or a GED
certificate while only 8% of those in Barnstable/Dukes/Nantucket and Norfolk Counties lacked a
regular high school diploma/GED. Across the 16 Local Workforce Investment Board service
delivery areas, the per cent of family householders with a Bachelor’s or higher academic degree
ranged from lows of 17% in the Greater New Bedford WIB area and 21% in the North Central
WIB to highs of 40% in Metro North and just under 57% in the Metro South/West WIB service
delivery area. Under 10% of family householders in the Cape Cod, Metro South/West, and
South Coastal LWIB areas lacked a high school diploma/GED while nearly one-fourth of those
in Boston and 31% of those in the Greater New Bedford LWIB areas did so.

28
Table 18:The Percentage Distribution of Massachusetts Families by the
Educational Attainment of the Family Householder within Each County, 2000
County
(A)
Less than 12 or12, No Diploma
(B)
High SchoolDiploma/GED
(C)
Some College,Including
Associate’sDegree
(D)
Bachelor’s orHigher Degree
Barnstable, Dukes, Nantucket 7.4 24.5 31.3 36.8Berkshire 13.1 31.7 27.1 28.1Bristol 25.8 28.4 24.8 21.0Essex 13.8 26.3 25.1 34.8Franklin 12.3 32.9 26.6 28.2Hampden 19.1 31.0 27.7 22.2Hampshire 10.8 20.1 22.8 46.3Middlesex 10.6 21.1 21.8 46.5Norfolk 8.0 21.8 23.8 46.4Plymouth 10.7 29.3 29.6 30.4Suffolk 24.2 28.0 21.9 25.9Worcester 16.5 28.8 26.9 27.8
Poverty Trends in Massachusetts, 1979 – 2002
Poverty rates in Massachusetts for both all persons and families have varied over the past
few decades, reflecting changes in national and state economic conditions which influence the
level and distribution of real incomes.31 The poverty rate for all persons in the Commonwealth
during 1979 was 9.6%, nearly 3 percentage points below the national poverty rate for all persons
in the U.S. during that year (Chart 1). During the 1980s, strong gains in jobs, wages, per capita
income, and median real family incomes in the state helped lower the person poverty rate to
8.9%, more than four full percentage points below the 13.1% poverty rate for the nation. The
family poverty rate of the state also declined from 7.8% to 6.7% during the decade of the 1980s.
The much more limited growth of median real family income in the decade of the 1990s and the
growing inequalities in worker earnings and family incomes pushed up the person poverty rate of
31 For a review of poverty developments in Massachusetts during the 1980s and 1990s,See: (i) Randy Albelda and Marlene Kim, A Tale of Two Decades: Changes in Work and Family in Massachusetts,1979-1999, University of Massachusetts, Boston, 2002; (ii) Andrew Sum, Anwiti Bahuguna, Neeta P. Fogg, et. al.,The Road Ahead: Emerging Threats to Workers, Families and the Massachusetts Economy, Teresa and H. JohnHeinz III Foundation and MassINC, Boston, 1998; (iii) Andrew M. Sum, Paul Harrington, Neeta Fogg, et. al., TheState of the American Dream in Massachusetts: 2002, Massachusetts Blue/Cross/Blue Shield and the MassachusettsInstitute for A New Commonwealth, Boston, 2002.

29
the state from 8.9% in 1989 to 9.3% in 1999 and kept the family poverty rate at 6.7%, its value at
the end of the 1980s. The family poverty rate did, however, fluctuate considerably over the
decade of the 1990s, rising sharply during the early years of the 1990s as the state underwent a
very severe economic recession characterized by steep job losses and declining real family
incomes and declining from the mid-1990s through the end of the decade as the state experienced
strong job growth, rising real earnings, and rising family incomes. A separate analysis of family
poverty rates from 1986-88 to 1997-99 by Albelda and Kim based on March CPS income data
revealed that poverty rates of families with at least one employed adult increased from 4.8% in
the late 1980s to 6.5% in the late 1990s.32 Part of this rise may have been attributable to the
increased number of single mother families with some paid work experience during the 1990s
that were unable to obtain annual earnings sufficiently high to raise their families above the
official poverty line. A more detailed understanding of the sources of the rise in the poverty rate
of working families in the 1990s is needed to guide future public policy formulation in the anti-
poverty area.
From early 2001 through 2003, Massachusetts labor markets deteriorated rapidly and
continuously. Wage and salary job losses mounted to over 200,000 by the end of 2003, and the
state’s unemployment rate more than doubled from 2.6% in 2000 to an annual average of 5.8% in
calendar year 2003. Weakened labor markets pushed up poverty problems in the state. By 2002,
the latest year for which poverty data are available from the CPS survey, the person poverty rate
in the state had climbed to 10.0% and the family poverty rate rose to 7.1% (Chart 1).33 The
estimated rise in the family poverty rate between 1999 and 2002 is actually quite modest, given
the severity of job losses in the Commonwealth over the past few years and the more than
doubling of the annual average unemployment rate of the state. The poverty measures, however,
do not adjust for differences in the cost of living across states or metropolitan areas. The use of a
rental cost of housing adjusted poverty line sharply raised the poverty rate of our state.
32 See: Randy Albelda and Marlene Kim, op.cit.33 In the early fall of 2004, the U.S. Census Bureau will release data from the March 2004 CPS survey which willprovide estimates of family incomes and the poverty status of persons and families in the state during calendar year2003.

30
Chart 1:Trends in the Incidence of Poverty Rates among Persons and
Families in Massachusetts, 1979, 1989, 1999, and 2002(in %)
9.68.9
9.310.0
7.8
6.7 6.77.1
0
2
4
6
8
10
12
1979 1989 1999 2002 1979 1989 1999 2002
Persons Families
Per C
ent
Poverty Rates of Key Demographic Subgroups of Families in Massachusetts
Knowledge of the incidence of poverty challenges among all families and demographic,
socioeconomic, and geographic subgroups of families is indispensable for formulating
antipoverty policies and programs within a given state. In this section, we will examine
estimates of the 1999 poverty rates for a diverse array of family subgroups classified by family
type, the presence of children, and the race/ethnic backgrounds, nativity status, and educational
attainment of the family householder. Family poverty rates also will be presented for counties
and Local Workforce Investment Board (LWIB) service delivery areas.
Nationally, family poverty rates vary considerably across family types and the presence of
children in the home.34 Estimates of 1999 poverty rates of Massachusetts families by family type
and the presence of children under 18 are displayed in Table 19. Poverty rates of Massachusetts
families varied considerably across family types, ranging from a low of 3 per cent among married

31
couple families to a high of 22 per cent among female-headed families. As a consequence of
their rising numbers and a continued high relative incidence of poverty, female headed families
in Massachusetts accounted for a majority of all poor families in 1999. Nearly 6 of every 10 poor
families in the state were headed by an unmarried woman in 1999. Families headed by
unmarried males accounted for another 8 per cent of all poor families in the state.
Table 19:1999 Poverty Rates of Families in Massachusetts by
Type of Family and Presence of Related Children under 18 in the Home(in %)
Presence of RelatedChildren in Home
(A)
AllFamilies
(B)
MarriedCouple
(C)
Female Householder,No Male Spouse Present
(D)
Male Householder,No Female Spouse Present
All 6.7 3.0 22.0 9.4No Related Children
Under 183.2 2.5 6.3 5.0
One or More RelatedChildren Under 18
10.3 3.5 31.0 14.1
One or More/None 3.2 1.4 4.9 2.8
Source: 2000 Census of Population and Housing, 5-100 PUMS files, tabulations by authors.
The incidence of family poverty challenges in our state is strongly associated with the
presence of children in the home. During 1999, families with one or more related children under
18 living in the home faced a poverty rate of 10.3% versus a poverty rate of only 3.2% among
families in which there were no children present in the home, a relative difference of 3.2 to one.
In each of the three family type groups, those families with children were more likely to be poor
than their counterparts with no children under 18 in the home. The relative size of the gap
between the poverty rates of these two groups of families was especially large for female-headed
families. When related children were present in the home, the poverty rate for female-headed
34 See: (i) Robert Lerman, “The Impact of the Changing U.S. Family Structure on Child Poverty and IncomeInequality,” Economica, 63, No. 250, 1996, pp. S119-S139; (ii) Garth L. Mangum, Stephen L. Mangum, andAndrew M. Sum, The Persistence of Poverty in the United States…

32
families was 31% versus a rate of only 6% when there were no children under 18 in the home.35
A fairly sizeable gap in poverty rates also existed between unmarried male headed families with
and without children. When one or more children were living in such families, 14 per cent of
these families were poor versus a poverty rate of only 5 per cent when there were no children
under 18 in the home.
Families with an immigrant householder faced a poverty rate nearly three times higher
than that of families with a native born householder (14.5% vs. 5.2.%) (See Table 20). Among
both groups of families, poverty rates varied considerably across family types, being much higher
among families headed by unmarried men and women. For example, of those families headed by
a foreign born individual, poverty rates ranged from a low of 8% among married couple families
to 15% for those headed by an unmarried male to a high of nearly 34% for those families headed
by an unmarried woman.36 The last poverty rate was four times higher than that of immigrant,
married couple families and nearly seventeen times higher than that of married couple families
with a native born householder, whose 1999 poverty rate was only 2.0%.
Table 20:1999 Poverty Rates of Families in Massachusetts by
Type of Family and Nativity Status of Family Householder(in %)
Nativity StatusOf Householder
(A)
AllFamilies
(B)
MarriedCouple
(C)
Female Householder,No Male Spouse Present
(D)
Male Householder,No Female Spouse Present
All 6.7 3.0 22.0 9.4Native Born 5.2 2.0 18.9 7.6Foreign Born 14.5 8.3 33.7 15.4Source: 2000 Census, 5-100 PUMS files, tabulations by CLMS.
Given the strong, positive statistical links between the annual incomes of families and the
educational attainment of family heads, one would expect family poverty rates to be strongly
linked to the educational attainment of the family householder. Findings in Table 21 clearly
35 In most cases, the children are the own child of the householder. But, in other cases, these children can be thegrandchildren, nieces, or nephews of the family householder.36 “Unmarried” does not imply single. A number of these women were previously married, but were separated,divorced, or widowed at the time of the 2000 Census. Single mothers do, however, run higher risks of being poorthan their separated or divorced counterparts.

33
reveal this to be the case in Massachusetts. The 1999 poverty rates of families fell steadily and
strongly with the level of schooling of the family householder. Seventeen per cent of families
headed by an individual lacking a high school diploma/GED certificate were poor versus only 8
per cent of those with a regular high school diploma, only 4.6 per cent of those holding an
Associate’s degree, and fewer than 2 per cent of the families headed by a person with a
Bachelor’s or higher degree (Table 21). These strong associations between family poverty rates
and the educational attainment of the family householder prevailed among families in each
family type category. Among families headed by unmarried women, poverty rates varied from a
low of under 6 per cent for those families headed by a woman holding a Master’s or higher
degree to a high of nearly 38 per cent for those headed by a woman lacking a high school
diploma/GED certificate. During 1999, poverty in Massachusetts came close to being eliminated
among the state’s married couple families with a householder holding a Bachelor’s or advanced
degree. Only slightly more than 1 per cent of such families were poor in that year.
Table 21:1999 Poverty Rates of Families in Massachusetts by Type ofFamily and Educational Attainment of Family Householder
EducationalAttainment ofFamily Householder
(A)
AllFamilies
(B)
MarriedCouple
(C)
Female Householder,No Male Spouse Present
(D)
Male Householder,No Female Spouse Present
Less than 12 or 12,no diploma
17.0 9.1 37.6 15.7
High SchoolGraduate/GED
8.4 3.5 23.5 10.0
13-15 Years, NoDegree
6.5 2.3 20.4 8.2
Associate’s Degree 4.6 1.9 13.4 8.2Bachelor’s Degree 1.9 1.2 7.5 3.5Master’s or Higher
Degree1.7 1.3 5.8 3.8
The poverty rates of both families with related children in the home and families with no
children under 18 also were strongly associated with the educational attainment of the family
householder (Table 22). Among families with one or more related children in the home, poverty
rates ranged from lows of 2 to 3 per cent among those families headed by a person with a
Bachelor’s or higher degree to nearly 14 per cent for those headed by a person with a high school

34
diploma but no completed years of college, to a high of just under 30 per cent for those headed
by a person who failed to graduate from high school or earn a GED or its equivalent. In each
educational attainment category, however, families with children present in the home were two to
four times more likely to be poor as families with no related children under 18. As a
consequence of these patterns, children under 18 were the most poverty prone age group in the
Commonwealth at the time of the 2000 Census.37
Table 22:1999 Poverty Rates of Massachusetts Families with and Without RelatedChildren under 18 by Educational Attainment of the Family Householder
(in %)
Educational Attainment
(A)
One or MoreChildren Under
18 in Home
(B)
No RelatedChildren Under
18 in Home
(C)
Col. A/Col. B
Less than 12 or 12, No Diploma 29.5 7.6 3.9High School Diploma/GED 13.6 3.5 3.913-15 Years, No Degree 9.8 2.5 3.9Associate’s Degree 6.8 1.8 3.8Bachelor’s Degree 2.7 1.1 2.5Master’s Degree or Higher 2.2 1.2 1.8All 10.3 3.2 3.2
The poverty rates of families classified by the race/ethnic origin of the family householder
are displayed in Tables 23 and 24. Family poverty rates in Massachusetts during 1999 varied
markedly by race/ethnic group from a low of 4 per cent for White, non-Hispanic families to 12
per cent for Asian families to a high of 28 per cent for families headed by a person of Hispanic
origin (Table 23). The poverty rate of Hispanic families in 1999 was, thus, seven times higher
than that of White, non-Hispanic families across the state. In each major race/ethnic group, the
poverty rates of families tended to decline steadily as the educational attainment of the family
head improved.38 Among Hispanic families, poverty rates declined from a high of just under
38% for those families headed by a person lacking a high school diploma/GED certificate to 21% 37 For a review of the changing age structure of poverty rates in the United States,See: Garth L. Mangum, Stephen L. Mangum, and Andrew M. Sum, The Persistence of Poverty in the United States,especially Chapter 2.38 The association was weakest for families headed by an individual of mixed race. There was little variation inpoverty rates for families in this race group headed by a person with no high school diploma to those with 1-3 years

35
for those with 1-3 years of college, and to a low of 8% for those holding a Bachelor’s degree
(Table 24). In each educational attainment group, however, poverty rates were lowest among
White, non-Hispanics and highest for Hispanic families. Among Hispanic families, poverty rates
also were significantly associated with family composition, the nativity status of the householder,
the timing of the arrival of immigrant householders into the U.S., and their English-speaking
proficiencies.39
Table 23:Poverty Rates of Massachusetts Families by Race/Ethnic Origin of Family Householder, 1999
(in %)
(A)
Asian, notHispanic
(B)
Black notHispanic
(C)
Hispanic
(D)
Other, notHispanic
(E)
White notHispanic
12.0% 18.5% 28.1% 16.5% 4.1%
of college, but they did fall sharply for those with a Bachelor’s or higher degree. Such families accounted for only 1to 2 per cent of all families in the state in 2000.39 A multivariate statistical analysis of the determinants of poverty among immigrant families in Massachusetts in1999 reveals the importance of each of these factors on the likelihood of being poor or low income,See: Andrew Sum, Johan Uvin, Ishwar Khatiwada, The Human Capital Skills of Immigrants and their Labor MarketSuccess, forthcoming, Fall 2004 from the Massachusetts Institute for a New Commonwealth.

36
Table 24:Poverty Rates of Families by the Educational Attainment of theFamily Householder in Each Major Race/Ethnic Group, 1999
(in %)
Educational Attainment
(A)
Asian, notHispanic
(B)
Black, notHispanic
(C)
Hispanic
(D)
MixedRace
(E)
White, notHispanic
Less than 12 or 12, No Diploma 27.7 32.9 37.6 17.4 9.4High School Diploma/GED 15.7 22.8 28.9 19.3 5.613-15 Years, No Degree 13.5 16.9 21.1 16.2 4.4Associate’s Degree 7.0 10.6 16.0 11.6 3.4Bachelor’s Degree 5.6 4.5 8.2 9.9 1.4Master’s or Higher Degree 4.4 2.6 9.8 8.2 1.2
The structure of family poverty rates for immigrant and native born families by the
educational attainment of the family householder is displayed in Table 25. As noted earlier,
families headed by a foreign born individual were nearly three times more likely than families
with native born householders to have been poor (14.5% vs. 5.2%). For both groups of families,
the incidence of poverty challenges falls steadily and strongly with the level of educational
attainment of the family householder. Among immigrant families, poverty rates ranged from a
high of 22 per cent for those families headed by a person who lacked a high school diploma/GED
certificate to 10% for those with an Associate’s degree, and to lows of 5% for those with a
Bachelor’s or more advanced degree. In each educational attainment category, however,
immigrant families were typically two to three times more likely than native born families to be
poor (Column D, Table 25).40 Over time, immigrant families have come to account for a rapidly
rising share of all poor families in the Commonwealth. At the time of the 2000 Census,
immigrant families represented only 17 per cent of all families in the state, but they accounted for
over 37 per cent of all poor families.
The preceding analyses have shown that the poverty rates of families in Massachusetts
were associated with family type, the presence of children in the family, and an array of
characteristics of the family householder, including their race/ethnic origin, nativity status, and
educational attainment. These analyses focused on one or at most two characteristics at a time.
40 The smallest relative difference prevails for those families headed by an individual who lacked a high schooldiploma. For such families, the immigrant/native born differential in family poverty rates was only 1.6 times.

37
To provide richer insights into the structure of family poverty rates, we have estimated family
poverty rates for a selected set of families ranging from among the lowest to the highest poverty
rates in the state. Estimates are displayed in Chart 2. The wide range in these poverty rates is
extraordinary. Married couple families with no children under age 18 in which the householder
was native born and held a Bachelor’s or more advanced degree encountered poverty rates of less
than one per cent. In essence, poverty has been eliminated among such families. Even among
immigrant families with no children, families headed by a person with an Associate’s degree
faced a poverty rate of only one per cent. Even when children are present in the home of married
couple, native born families, poverty rates are quite low (3%) as long as the family householder
graduated from high school.
Chart 2:1999 Poverty Rates of Massachusetts Families in Selected Family Types and
With a Householder with Selected Combinations of Characteristics(in %)
0.4 0.8 1.15.2
3.1
12.4
33.0
42.4
53.9
0
10
20
30
40
50
60
NB,MarriedCouple,No Kids,
Masters orHigher
NB,MarriedCouple,No Kids,Bachelors
FB,MarriedCouple,No Kids,Associate
Degree
NB,Female
Head, NoKids, 12
Years
NB,Married
Couple, 1or MoreKids, 12
Years
NB, MaleHead, 1 orMore Kids,12 Years
NB,Female
Head, 1 orMore Kids,12 Years
FB,Female
Head, 1 orMore Kids,12 Years
NB,Female
Head, 1 orMore Kids,<12 Years
Per
Cen
t
As the upper end of the distribution of poverty rates, families headed by unmarried
women with children present in the home faced very high poverty rates, especially when they
failed to complete any years of post-secondary schooling. Female headed families with 1 or
more children in the home faced a poverty rate of 33% even when the householder was native

38
born and held a high school diploma. This poverty rate would rise to 42% when the householder
was foreign born and would rise further to 54% when the head of the family was native born but
lacked a high school diploma. The poverty rate for this latter group of families was 135 times
higher than that for married couple families with no children under age 18 who were headed by a
native born person with a Master’s or higher degree. These two groups of families occupy
economic worlds that are light years away from each other.
The Geographic Structure of Family Poverty Rates in 1999
Given the large numbers of sample cases from the 2000 Census PUMS files, it is possible
to produce statistically reliable estimates of family poverty rates for a variety of sub-state areas.
In this section, we present and assess findings on estimated family poverty rates for counties and
LWIB service delivery areas across the state.41
Family poverty rates for counties across the state in 1999 are displayed in Chart 3.
There is a very high degree of variation in these poverty rates across counties of the state, ranging
from lows of 3% in Norfolk and Nantucket counties to highs of 11.4% in Hampden County and
nearly 15% in Suffolk County. Over the past decade, there has been a growing divergence in
family poverty rates across counties of the state, with Bristol, Hampden, and Suffolk Counties
moving further above the state average while Barnstable, Franklin/Hampshire and Plymouth
counties moved further below the state average. This stands in contrast to the state’s experience
during the 1980s when family poverty rates declined in all counties of the state, with the
exception of Hampden County.
41 The March CPS surveys provide poverty data for the state as a whole and for a few metropolitan areas, but thereare no geographic identifiers for counties or most large cities. The CPS sample is meant to be statisticallyrepresentative of the state as whole rather than for any sub-state area.

39
Chart 3:1999 Poverty Rates of Families in Massachusetts by County
(in %)
2.9 3.0
4.3 4.6 4.9 5.0 5.1
6.5 6.5 6.6 6.8
7.8
11.4
14.9
0
2
4
6
8
10
12
14
16
Norfol
k
Nantuck
et
Middles
ex
Barnsta
ble
Plymou
thDukes
Hampsh
ire
Franklin
Berksh
ireEsse
x
Wor
cester
Bristol
Hampden
Suffolk
Per
Cen
t
The poverty rates of families by family type in each county of Massachusetts during 1999
are displayed in Table 25. In each county of the state, family poverty rates were lowest among
married couple families and highest among families headed by unmarried women. With the
exception of Suffolk County, poverty rates of married couple families were quite low, ranging
from 1.4% in Norfolk County to 4.1% in Hampden County. In contrast, the poverty rates of
families headed by unmarried women were in the double digits in every county except Norfolk
County and were 20 per cent or higher in 7 of the 12 counties. In every county, except Suffolk
County, the poverty rates of female headed families exceeded those of married couple families by
multiples of six to ten times.42
42 In Suffolk County, the multiple was slightly under four to one, but 30 per cent of female headed families were poorin Suffolk County during 1999.

40
Table 25:Poverty Rates of Families by Type of Family in Massachusetts Counties, 1999
(in %)
County
(A)
MarriedCouple
(B)
MaleHeaded
(C)
FemaleHeaded
(D)
Female Headed/Married Couple
Barnstable, Dukes, Nantucket 2.3 8.1 17.3 7.5Berkshire 2.6 6.2 26.6 10.2Bristol 3.6 12.2 25.3 7.0Essex 2.9 11.6 22.2 7.7Franklin 2.4 11.3 23.0 9.6Hampden 4.1 11.8 32.4 7.9Hampshire 2.2 6.3 14.0 6.4Middlesex 2.1 6.1 15.1 7.2Norfolk 1.4 4.1 8.3 5.9Plymouth 2.0 9.6 18.8 9.4Suffolk 7.9 13.0 29.6 3.8Worcester 3.2 8.8 22.9 7.2
In each county of the state, family poverty rates were strongly associated with the
educational attainment of the family householder, declining steadily and strongly with the
amount of formal schooling completed by the householder. The degree of variability across
counties in poverty rates of families was still fairly high for families with a householder that
completed 12 or fewer years of schooling. For example, among families with a head who failed
to graduate from high school, poverty rates varied from a low of 8.5 per cent in Norfolk County
to highs of 22 to 26 per cent in Hampden and Suffolk Counties where a high fraction of such less
educated families were headed by immigrants. In each county except Franklin County, the
poverty rates of families with a householder lacking a high school diploma were seven to twelve
times higher than the poverty rates of families headed by an individual with a Bachelor’s or
higher academic degree.43
Family poverty rates also were estimated for the 16 local service delivery areas
administering employment and training programs under the Workforce Investment Act (WIA).
The cities and towns comprising each of these 16 areas were matched as closely as possible with
the PUMA areas identified on the 2000 Census public use files. The poverty rates of families in
43 In every county with the exception of Suffolk County, the poverty rates of families headed by an individual with aBachelor’s or higher degree were in the one to two per cent range.

41
these 16 LWIB areas varied over a fairly wide interval, ranging from lows of 2.5% in the Metro
South/West LWIB and 3.7% in the South Coastal LWIB to highs of 11% in the Greater New
Bedford and Hampden areas and just under 16% in the Boston LWIB service delivery area,
which consists of the city of Boston.
Similar to findings for the state as a whole and for each of the counties, poverty rates of
families in the 16 LWIB areas varied quite widely by family type and the educational attainment
of the family householder (Tables 26 and 27). In each of the 16 LWIB areas, poverty rates were
lowest among married couple families followed by families with unmarried male householders
and highest among families headed by unmarried women. Poverty rates for female headed
families were in the double digit range in each of the 16 LWIB areas and were 20% or higher in
10 of the 16 areas. The poverty rates of female headed families were 6 to 10 times higher than
those of married couple families in 14 of the 16 LWIB areas across the state.
The poverty rates of families in each of the 16 LWIB areas also were strongly correlated
with the educational attainment of the householders in these families. In 15 of the 16 LWIB
areas, the poverty rates of families declined steadily and strongly with the educational attainment
of the family householder (Table 27). As was the case for counties, however, there was a high
degree of variation across LWIBs in the family poverty rates of families headed by a person who
had no formal schooling beyond high school. For example, among families with a householder
who had graduated from high school but did not complete any post-secondary schooling, poverty
rates ranged from lows of 4 to 5 per cent in the Franklin/Hampshire, Metro South/West, and
South Coastal areas to highs of 13 per cent in the Hampden and Boston LWIB areas. In 15 of the
16 LWIB areas, the poverty rates of families headed by an individual with a Bachelor’s or higher
degree were in the 1 to 2 per cent range. In every LWIB area, family poverty challenges were
overwhelmingly concentrated among families with a householder who had no formal schooling
beyond high school.

42
Table 26:Per Cent of Families with Incomes below the Poverty Line in
Local Workforce Investment Board Service Delivery Areas, 1999(in %)
Local Workforce Investment Boards
(A)
MarriedCouple
(B)
MaleHeaded
(C)
FemaleHeaded
(D)
Total
Berkshire 2.6 6.2 26.6 7.2Boston 8.0 13.0 30.0 15.8Bristol 2.9 9.7 21.7 6.6Brockton 2.3 15.0 19.7 6.2Cape Cod 2.3 8.1 17.3 4.7Central Mass. 3.3 8.6 22.6 7.0Franklin/Hampshire 2.3 9.5 19.4 5.2Greater Lowell 2.3 8.9 22.2 6.1Greater New Bedford 5.1 17.5 31.6 11.0Hampden 4.1 11.8 32.4 11.0Lower Merrimack 3.2 17.6 28.8 9.2Metro North 3.2 6.9 15.6 5.5Metro South/West 1.3 5.2 10.9 2.5North Central 2.7 9.5 23.8 7.0South Coastal 1.9 3.7 13.6 3.7Southern Essex 2.7 7.6 17.7 5.5Total 2.9 9.4 22.0 6.7

43
Table 27:Poverty Rates of Families by Educational Attainment of the Family Householder in
Massachusetts Local Workforce Investment Board Service Delivery Areas, 1999(in %)
County
(A)
Less thanHigh School
Diploma
(B)
High SchoolGraduate/GED
(C)
Some CollegeIncluding
Associate’s Degree
(D)
Bachelor’sDegree or
Higher
Berkshire 17.7 8.2 6.0 2.2Boston 27.9 18.5 13.9 4.5Bristol 12.4 6.8 5.8 1.3Brockton 16.7 6.8 4.2 1.8Cape Cod 12.0 6.9 4.8 1.6Central Mass. 16.8 7.8 5.4 2.4Franklin/Hampshire 11.1 5.3 7.0 1.8Greater Lowell 15.9 8.1 4.1 1.0Greater New Bedford 16.9 11.5 9.3 2.1Hampden 22.3 12.9 8.4 1.9Lower Merrimack 23.9 10.5 7.5 2.0Metro North 13.6 6.7 5.2 2.2Metro South/West 8.6 4.2 3.2 1.1North Central 13.6 7.5 6.1 1.7South Coastal 9.0 5.1 3.8 1.1Southern Essex 14.5 6.9 4.8 2.0
Total 16.9 8.3 5.9 1.8
The Incidence of Low Income Challenges among Massachusetts Families,1999
Our second set of income inadequacy measures for families is based on the “low income”
standards utilized in recent years by a number of poverty and welfare reform researchers across
the country, especially at the Urban Institute in Washington, D.C. As noted earlier, the definition
of a “low income” family is a family that has an annual, money income less than two times the
poverty line for a family of its given size and age composition. The poverty lines are those used
by the federal government in identifying the annual number of poor families in the United States.
Estimates of the per cent of families that were low income in Massachusetts during 1999
are displayed in Table 28 for all families and for an array of demographic and socioeconomic
subgroups of families. At the time of the 2000 Census, 17 per cent of all families in the state

44
would have been classified as low income (Table 28). This estimated incidence of low income
challenges among families in the state was basically identical to the per cent of families with low
income challenges in the state at the time of the 1990 Census (Chart 4).44 The state, thus, made
no progress over the entire decade in reducing the incidence of low income problems among
families.45 Following 2000, the deterioration in state labor markets has pushed an increased
number of families below the low income thresholds. By 2002, the per cent of the state’s
families with money incomes below the low income threshold had risen to 19% (Chart 4).
Table 28:Per Cent of Massachusetts Families with Incomes Less Than Two
Times the Poverty Line by Type of Family and Householder Characteristics, 1999
Group of Families or Characteristic of Householder Per Cent Low IncomeAll Families 17.0Married Couple 10.5Female Householder, No Male Spouse 42.7Male Householder, No Female Spouse 24.3Asian 26.9Black 38.2Hispanic 53.1White, Not Hispanic 12.4Native Born 13.9Foreign Born 32.7Less than 12 Years or 12 Years, No Diploma 37.8High School Diploma/ GED 22.013 – 15 Years, No Degree 16.8Associate’s Degree 13.4Bachelor’s Degree 6.2Master’s or Higher Degree 4.9
44 For an earlier comparison of poverty and low income problems in Massachusetts during 1989 and 1999,See: Andrew Sum, Mykhaylo Trubs’kyy, Kamen Madjarov with Meredith Franks; Poverty and Other IncomeInadequacy Problems Among Massachusetts Families in 2000: Implications for Workforce Development Policy,Center for Labor Market Studies, Prepared for the Commonwealth Corporation, Boston, July, 2003.45 As was true of poverty problems, the fraction of the state’s families with low income problems increased duringthe recessionary environment of the early 1990s then declined as the economy improved from 1993 through the endof the decade. The gains in the latter part of the decade only offset the losses during the early years of the decade.

45
Chart 4:Trends in the Incidence of Low Income Challenges Among
Massachusetts Families, Selected Years, 1989 to 2002
17.117.0
18.9
16.0
16.5
17.0
17.5
18.0
18.5
19.0
19.5
1989 1999 2002
Per
Cen
t
A comparison of the findings for Massachusetts with those for the nation and the other 49
states revealed that our state fared better than most other states on this income inadequacy
measure. Nationally, 26% of all families would have been classified as low income during 2003,
and the 19% incidence of low income challenges in the state ranked 5th lowest during that year,
with the state tied for Connecticut. As was the case for the poverty income thresholds, however,
the low income thresholds are not adjusted for differences in the state cost of living, especially
housing. The state’s favorable rating on this measure would clearly diminish if cost-of-living
adjustments were taken into account.46 The problem in making such adjustments, however, is
that there are no uniform cost-of-living indices for states.
The per cent of Massachusetts families with low incomes in 1999 varied quite markedly
by family type (Table 29 and Chart 5). Only 1 of 10 married couple families in the state were
categorized as low income in 1999 versus 1 of every 4 families headed by an unmarried male and
43 of every 100 families headed by an unmarried woman. As was true for the structure of family
46 For example, adjustments of the nation’s and state’s CPS-based family poverty rates in 1999 for taxes, EITC taxcredits, and rental costs reduce Massachusetts’ poverty ranking from the middle of the pack to 8th highest in thenation. See: Andrew Sum, Paul Harrington, Neeta Fogg, et. al., The State of the American Dream in Massachusetts2002, Chapter 7.

46
poverty rates, the incidence of low income challenges among Massachusetts families varied
markedly by the presence of children in the home. Over 23% of families with one or more
children under 18 in the home were low income versus only 11% of the families with no child
under 18 (Table 29). Families with children were, thus, 2.2 times more likely to be low income
than their counterparts with no related children in the home. In each family type category, those
families with a related child under 18 in the home were more likely to be low income, with the
relative gaps larger among those families headed by an unmarried individual. Among married
couple families, the incidence of low income problems among families with children was only
1.3 times as high as that of their counterparts with no children. In contrast, the incidence of low
income challenges among female headed families with children was more than three times as
high as that of their peers with no children under 18 in the home (57% vs. 18%). Just under 57
per cent of female headed families with children and 35 per cent of male headed families with
children were low income in 1999.
Chart 5:Per Cent of Massachusetts Families with Incomes Less than
Two Times the Poverty Line by Type of Family, 1999
10.5
24.3
42.7
0
5
10
15
20
25
30
35
40
45
Married Couple Household Male Headed Household Female Headed Household
Per
Cen
t

47
Table 29:Per Cent of Massachusetts Families with Incomes below Two Times the
Poverty Line by Type of Family and Presence of Related Children in the Home
Presence ofRelated Children
(A)
MarriedCouple
(B)
Female Head,No Male Spouse
(C)
Male Head,No Female Spouse
(D)
AllFamilies
None 9.3 18.1 14.4 10.81 or More 12.0 56.8 34.9 23.41 or More/None 1.3* 3.1* 2.4* 2.2*
The incidence of low income challenges among Massachusetts families was strongly
associated with the educational attainment of the family householder (Table 28 and Chart 6).
Nearly 38 per cent of the families with a householder lacking a high school diploma were low
income in 1999. The incidence of such low income challenges declined steadily and sharply with
additional years of formal schooling of the householder, falling to 22 per cent for families headed
by high school graduates, to 13 per cent for Associate degree holders, and to a low of 5 per cent
for householders with a Master’s or higher degree. Families headed by a person lacking a high
school diploma were nearly eight times more likely to be low income than those families headed
by an individual with a Master’s or higher degree.

48
Chart 6:Per Cent of Massachusetts Families with Incomes Less Than Two Times thePoverty Line by Educational Attainment of the Family Householder, 1999
37.8
22.0
16.8
13.4
6.24.9
0
5
10
15
20
25
30
35
40
45
<12 or 12, NoDiploma
High SchoolDiploma/GED
13-15 Years, NoDegree
Associate'sDegree
B.A. or B.S. Master's orHigher Degree
Per C
ent
The strong relationships between the educational attainment of the family householder
and the low income status of families prevailed among both families with children and families
without children during 1999 (Table 30). Among families with one or more related children in
the home, the incidence of low income challenges ranged from a high of 54% among those
families with a householder lacking a high school diploma, down to 32% for those headed by a
high school graduate, down further to 19% for those with an Associate’s degree, and to a low of
6% for those families headed by an individual with a Master’s or more advanced degree. The
relative size of the difference between the incidence of low income challenges among families
with children with the least and best educated householders was more than 9 to 1. In each
educational attainment subgroup, however, families with children in the home were more likely
to be low income than their peers without children. In 5 of the 6 cases, the relative differences
were two to three times (Table 30).

49
Table 30:Per Cent of Massachusetts Families with Incomes below Two Times the Poverty Line byPresence of Children in Home and Educational Attainment of the Family Householder
Educational Attainment
(A)
No RelatedKids Under 18
(B)
1 or MoreRelated Kids
Under 18
(C)
Col. B/Col. A
Less than 12 or 12, no diploma 25.5 54.3 2.1High School Diploma/GED 12.8 31.9 2.513-15 Years, No Degree 7.5 24.4 3.3Associate’s Degree 5.9 19.2 3.3Bachelor’s Degree 4.2 7.8 1.9Master’s or Higher Degree 4.0 5.9 1.5All 10.8 23.4 2.2
Estimates of the percentage share of families experiencing a low income problem by the
race/ethnic origin of the family householder are presented in Tables 28 and 31. Similar to our
earlier findings on the structure of family poverty rates, the incidence of low income challenges
among families during 1999 varied considerably across race/ethnic groups. The per cent of state
families with an income below twice the poverty line ranged from a low of 12% for White, non-
Hispanic, to 27% among Asian families, and to a high of 53% among Hispanic families.
Families headed by individuals from race/ethnic minority groups were two to four times more
likely to experience a low income challenge than their White, non-Hispanic peers.
Among families in each major race/ethnic group, the likelihood that a family was low
income during 1999 was strongly associated with the educational attainment of the family
householder (Table 31). In each of the five race/ethnic groups, the share of families with an
income less than two times the poverty line fell consistently with the educational attainment of
the family householder. For example, among Black non-Hispanic families, 55% of those with a
householder lacking a high school diploma were low income. The share of low income Black
families declined to 48% if the family head was a high school graduate, to 31% if he/she had an
Associate’s degree and to below 10% if the family head held a Master’s or higher academic
degree. Within each of the six educational attainment subgroups, the incidence of low income
challenges was lowest among White, non-Hispanic families. For example, among families
headed by a high school graduate with no years of post-secondary schooling, the incidence of low

50
income challenges ranged from a low of 17% among White, non-Hispanics to a high of nearly
56% among families with a Hispanic householder.
Table 31:Per Cent of Massachusetts Families with Incomes below Two Times the
Poverty Level by Educational Attainment and Race/Ethnic Origin of Householder
Educational Attainment
(A)
Asian
(B)
Black, notHispanic
(C)
Hispanic
(D)
MixedRace
(E)
White, notHispanic
Less than 12 or 12, No Diploma 54.2 54.8 65.9 43.3 27.5High School Diploma/GED 40.3 48.0 55.8 40.3 17.113-15 Years, No Degree 29.3 38.1 45.8 35.8 12.8Associate’s Degree 25.9 31.4 38.4 27.3 10.5Bachelor’s Degree 13.2 14.4 16.5 23.2 5.1Master’s or Higher Degree 10.4 9.7 22.9 19.6 3.7Total 26.8 38.3 53.3 35.0 12.5
Given the younger ages, more limited schooling, and English language problems of many
immigrant family householders, one would expect that immigrant families would encounter low
income challenges with a higher frequency than families with a native born householder.
Findings in Table 28 and in Table 32 bear out this expectation. Overall, nearly one-third of the
state’s families with an immigrant householder were low income during 1999 versus only 14 per
cent of families with a householder that was native born, a relative difference of nearly 2.4 times.
Still, it should be noted that as we move from poverty to low income challenges among families
the gap between native born and foreign born families gets smaller. Immigrant families
accounted for 37% of all poor families in the state during 1999, but only 33% of low income
families, and as will be shown below, their share of all families with an income inadequacy
challenge will decline even further as we move to the Family Economic Self-Sufficiency
standards.
The incidence of low income challenges among both immigrant and native born families
declines steadily and strongly as the educational attainment of the householder improves (Table
32). Among immigrant families, just under 46 of every 100 families headed by a person lacking
a high school diploma/GED were low income versus 38 of every 100 with a high school diploma,
28 of every 100 with an Associate’s degree, and only 12 of every 100 with a Master’s or higher
degree. In every educational attainment subgroup, immigrant families were more likely to be low

51
income than native born families. The relative size of these differences did, however, vary by
educational attainment subgroup, ranging from multiples of 1.4 for those families lacking a high
school diploma to highs of 2.9 and 3.8 for those families with a Bachelor’s or Master’s or higher
degree, respectively. Increased English-speaking proficiencies and longer stays in the U.S. of
immigrant householders do significantly reduce the likelihood that they will be low income
families.
Table 32:Per Cent of Massachusetts Families with Incomes below Two Times the
Poverty Level by Educational Attainment and Nativity Status of the Householder
Educational Attainment
(A)
NativeBorn
(B)
ForeignBorn
(C)
Foreign/Native
Less than 12 or 12, No Diploma 32.7 45.9 1.4High School Diploma/GED 19.4 37.8 1.913-15 Years, No Degree 14.6 33.2 2.3Associate’s Degree 11.6 27.8 2.4Bachelor’s Degree 5.1 15.0 2.9Master’s or Higher Degree 3.3 12.5 3.8Total 13.9 32.7 2.4
Geographic Variations in the Incidence of Low Income Challenges amongFamilies in Massachusetts
The availability of the PUMA geographic identifiers on the Census 2000 PUMS files
enabled us to estimate the incidence of low income problems among families in counties and
Local WIB service delivery areas across the state. Findings on the incidence of low income
challenges among families in Massachusetts by family type across counties of the state are
displayed in Table 33. Variations in the incidence of low income challenges of families across
counties were quite substantial in 1999, ranging from lows of 8.5% in Norfolk County and 11.6%
in Middlesex County to highs of 24% in Hampden County and 32% in Suffolk County. The
relative size of the gap in the incidence of low income challenges between Suffolk County and
Norfolk County was nearly four to one, a very substantial degree of geographic variation.
Suffolk County, which is dominated by the city of Boston but includes the cities of Chelsea,
Revere, and Winthrop, has become characterized by an extraordinarily high degree of family

52
income inequality in recent years. It has become home for some of the poorest and richest
families in the state.
The incidence of low income problems among families in each county of the state in 1999
varied quite widely by type of family and the educational attainment of the family householder
(Tables 33 and 34). In each county, married couple families were characterized by the lowest
incidence of low income challenges while unmarried female headed families faced the most
severe degree of low income challenges, with 40% or more of these families having incomes
below 200% of the poverty line in 8 of the 12 counties.
Table 33:Per Cent of Families with Incomes Below 200% of the
Poverty Line by Type of Family in Massachusetts Counties, 1999
County
(A)
MarriedCouple
(B)
MaleHeaded
(C)
Female Headed,No Male
Spouse Present
(D)
Total
Barnstable, Dukes, Nantucket 10.2% 20.8% 39.7% 14.7%Berkshire 12.7% 32.5% 50.4% 20.6%Bristol 14.1% 35.5% 50.2% 21.9%Essex 9.8% 27.3% 43.1% 16.8%Franklin 12.6% 29.3% 50.0% 18.9%Hampden 13.5% 24.5% 56.7% 24.0%Hampshire 8.1% 14.1% 35.9% 12.7%Middlesex 7.6% 17.4% 31.4% 11.6%Norfolk 6.2% 13.2% 21.8% 8.5%Plymouth 8.5% 21.7% 38.4% 13.8%Suffolk 21.4% 31.1% 52.6% 32.1%Worcester 11.5% 26.2% 44.9% 18.2%Total 10.5% 24.3% 42.7% 17.0%
Estimates of the incidence of low income challenges among families by the educational
attainment of the family householder by county are displayed in Table 34. As was true for the
state as a whole, the per cent of families with an income below 200 per cent of the poverty line
declined consistently as the educational attainment of the family householder improved.
Families headed by an individual lacking a high school diploma/GED were typically four to eight
times more likely to be low income than families headed by a person with a bachelor’s or higher

53
degree.47 In each of the twelve counties, at least 25 per cent of the families headed by a high
school dropout were low income, in 10 of these counties 30 per cent of such families were low
income, and in four of the twelve counties at least 40 per cent of the families headed by high
school dropouts were classified as low income. Over time, families headed by individuals
lacking any post-secondary schooling are finding it increasingly difficult to obtain an income
high enough to enable them to avoid low income challenges.
Table 34:Per Cent of Families with Incomes Below 200% of the Poverty Line by
Educational Attainment of Family Householder in Massachusetts Counties, 1999
County
(A)
Less thanHigh School
Diploma
(B)
High SchoolGraduate/GED
(C)
Some College,Including
Associate’s Degree
(D)
Bachelor’s orHigher Degree
Barnstable, Dukes, Nantucket 30.9% 20.5% 15.8% 6.8%Berkshire 40.8% 25.8% 19.3% 6.4%Bristol 34.6% 24.4% 19.1% 6.1%Essex 42.3% 20.1% 15.6% 5.0%Franklin 29.1% 20.8% 20.9% 10.3%Hampden 43.6% 26.7% 21.0% 7.2%Hampshire 29.6% 13.2% 15.1% 7.2%Middlesex 29.5% 17.1% 12.2% 4.6%Norfolk 25.1% 12.4% 9.6% 3.2%Plymouth 32.1% 19.2% 10.9% 4.8%Suffolk 51.3% 37.9% 27.3% 12.1%Worcester 38.2% 21.9% 15.2% 5.6%Total 37.6% 21.9% 15.7% 5.6%
Estimates of the per cent of families with low incomes during 1999 in each of the sixteen
LWIB service delivery areas are displayed in Table 35. The incidence of low income problems
among families varied quite widely across these 16 service delivery areas, ranging from lows of
8% in the Metro South/West Service Delivery Area and 11% in the South Coastal area to highs
of 27% in the Greater New Bedford Area and nearly 33% in the city of Boston. The pattern of
low income challenges by family type in each of the LWIB areas closely approximated that for
the state as whole. In each of these LWIB areas, low income challenges were lowest among
married couple families followed by unmarried male householder families and highest among 47 The sole exception to this pattern was Franklin County where the relative difference in the incidence of lowincome problems between families headed by high school dropouts and four year college graduates was slightly less

54
families headed by unmarried women. In 12 of the LWIB’s, 40 per cent or more of the families
headed by women were low income, and in six of the 12 LWIB areas 50 per cent or more of such
families were low income. In each LWIB, the incidence of low income challenges was strongly
linked to the educational attainment of the family householder.
Table 35:Per Cent of Families with Incomes Below 200 Per Cent of the Poverty Line in
Local Workforce Investment Board Service Delivery Areas, 1999
Local Workforce Investment Boards
(A)
MarriedCouple
(B)
MaleHeaded
(C )
FemaleHeaded
(D)
Total
Berkshire 12.7% 32.5% 50.4% 20.6%Boston 21.2% 29.9% 53.5% 32.7%Bristol 12.6% 32.0% 45.8% 19.4%Brockton 10.6% 30.6% 39.9% 17.1%Cape Cod 10.2% 20.8% 39.7% 14.7%Central Mass. 11.0% 24.9% 43.6% 17.4%Franklin/Hampshire 10.9% 23.7% 44.3% 16.5%Greater Lowell 8.7% 28.0% 43.1% 15.6%Greater New Bedford 17.3% 42.9% 57.9% 26.7%Hampden 13.5% 24.5% 56.7% 24.0%Lower Merrimack 11.2% 38.8% 51.7% 21.0%Metro North 10.1% 19.4% 31.8% 14.4%Metro South/West 5.4% 13.0% 24.0% 7.8%North Central 13.4% 30.1% 49.2% 21.1%South Coastal 7.6% 12.7% 31.1% 11.3%Southern Essex 9.0% 19.7% 37.3% 14.4%
Total 10.5% 24.3% 42.7% 17.0%
Estimates of the Incidence of Economic Self-Sufficiency Challenges amongMassachusetts Families, 1999
Our third set of income inadequacy measures is based on the Family Economic Self-
Sufficiency standards of the Women’s Educational and Industrial Union and Wider Opportunities
for Women. Unlike the federal poverty income thresholds and the low income thresholds
discussed above, the FESS standards do vary across counties and other sub-state areas primarily
based on differences in the costs of rental housing and child care, which are both treated
than three to one.

55
explicitly in the FESS standards.48 The family standards also take into consideration the impacts
of payroll taxes, state and federal income taxes, Earned Income Tax Credits, and Child Care Tax
Credits in determining the gross amount of income needed per month or per year by a family of a
given size and age composition to purchase the consumption items that comprise the family
budget.
As noted earlier, the imputed Family Economic Self-Sufficiency standards for families in
Massachusetts in 1999 were well in excess of the official poverty income thresholds of the
federal government, typically exceeding them by multiples of 2.7 to 3.4 and higher.49 The
relative sizes of these differences do vary across the state’s counties. To illustrate the absolute
and relative sizes of the differences between the FESS and poverty income thresholds for
selected subgroups of families in the city of Boston and in Berkshire County, we have displayed
the values of the poverty income thresholds and FESS standards for five types of households
during 1999 (Table 36). As can be seen, in each of these five cases in Boston and four of the five
cases in Berkshire County, the FESS standard exceeded the poverty line by a multiple of at least
two to one, and in the four “family” cases in Boston the FESS standard exceeded the federal
government’s poverty income thresholds by multiples of 2.7 to 3.4.50 The relative size of the
differences between these two standards are greatest when preschool children are present in the
home since market-purchased child care costs loom large in the FESS standards for such
families, but are ignored by the poverty income thresholds. For example, the FESS standard for
a city of Boston family containing one adult, plus one preschooler (ages 3-5), and one school-
aged child (6-12) was equal to $45,865 versus a poverty line of only $13,423, a relative
difference of 3.41 times.51 In Berkshire County, with its lower cost of housing and child care, the
FESS budget standard for the same family was $31,677, versus a poverty line of $13,423, a
relative difference of 2.36 times.
Table 36: 48 The 1997 Self-Sufficiency Income Standards for Massachusetts families are described in the followingpublication: Jean Bacon, Laura Henze Russell and Diana Pearce, The Self-Sufficiency Standard: WhereMassachusetts Families Stand…49 We refer to these budgets as “imputed” budgets since they were based on weighted averages of the 1997 and 2003Self-Sufficiency Budgets for families in Massachusetts where the 1999 estimate was based on 1/3 of the differencebetween the 1997 and 2003 budgets.50 The “family cases” refer to those cases where the budget standard is being developed for a family household ratherthan a single individual.51 If the two children were an infant and preschooler, the FESS standard would have been $51,344 or 3.82 times ashigh as the poverty threshold for such a family.

56
Comparisons of the 1999 FESS Standards for Selected Groups of Families in theCity of Boston with the Official Poverty Income Thresholds of the Federal Government
Family Type
(A)
FESSStandard
(B)
PovertyLine
(C)
FESSStandard/
Poverty Line
Boston
One person (under 65)1 17,713 8,667 2.04Two adults, no children 29,790 11,156 2.67One adult plus one preschooler (3-6) 36,202 11,483 3.15One adult plus one preschooler plus one school age
child (6-12 years old)45,865 13,423 3.41
Two adults plus one preschooler plus one schoolaged child
46,580 16,895 2.76
BerkshireOne person (under 65) 13,651 8,667Two adults, no children 22,958 11,156One adult plus one preschooler (3-6) 26,830 11,483One adult plus one preschooler plus one school age
child (6-12 years old)31,677 13,423
Two adults plus one preschooler plus one schoolaged child
36,763 16,895
Note: 1In the federal poverty income thresholds, there are separate poverty income thresholds for singleindividuals under age 65 and over 65. The poverty line for a person under 65 is about $700higher.
Given the large differences between the FESS standards and the official poverty income
thresholds in the city of Boston, Middlesex and Norfolk Counties and other areas across the state,
one might question whether the standards exaggerate what might be needed for families to “get
by” in Boston and elsewhere in the state. Findings of a number of previous studies designed to
obtain the public’s views on how much income is needed by families to “avoid poverty” or “to
get by with the basics” indicate that the public would generally support the FESS standards.
Nationally, a number of household surveys over the past 15 years have solicited the public’s
views on how much income would be needed by a given family to either avoid poverty or to
achieve a minimum standard of living.52 Responses to such questions yielded average responses
that ran from 130 to 200 per cent of the federal government’s poverty lines, with higher values in
52 For a review of findings of these national surveys, See: Garth L. Mangum, Stephen L. Mangum, and Andrew M.Sum, The Persistence of Poverty in the United States, especially pp. 91-92.

57
large metropolitan areas of the Northeast and West. In the Boston Low Income Neighborhood
Survey in 1987-88, households were asked to identify the amount of annual income that a
household of their size in the city of Boston would “need at a minimum to avoid being poor.”53
The median estimates of the amounts of income needed in each family size to avoid poverty
substantially exceeded the federal government’s poverty lines. On average, the median response
to this question was 2.9 times as high as the existing poverty income thresholds of the federal
government. As the authors noted in their final report to the Massachusetts Executive Office of
Economic Affairs, “the federal government’s income guidelines for determining the poverty
status of city of Boston families seem to be a world apart from the perceptions of the adult
residents of these low income neighborhoods”.54
Findings of a more recent state household survey of 604 registered voters on economic
issues, welfare reform, and the income needs of families in Massachusetts shed additional insight
on the public’s subjective assessments of family income requirements.55 The telephone survey
administered by the Opinion Dynamics Corporation for the United Way of Massachusetts and the
Women’s Educational and Industrial Union included the following question:
“In general, how much income per year do you think a family of four needs to make ends
meet in Massachusetts – not to be rich – but just to get by adequately?”
The responses to this question ranged from a low of less than $10,000 to highs of $80,000
or more.56 Of those responding to this question, the median income required by families fell in
the $45,000 to $50,000 category, with an interpolated median value of $46,250. This income
level was equal to 2.6 times the poverty line for a four person family in the U.S. during calendar
year 2000. The Massachusetts public’s perceptions of the amount of income needed by a four
person family in Massachusetts “to get by adequately” comes quite close to most of the FESS
standards for 3 person and 4 person families in the state. Findings of the 2001 household survey
53 See: Andrew Sum, Neeta Fogg, Julio Goicoechea, et. al., White Poverty in Boston, The Boston Persistent PovertyProject, The Boston Foundation, Boston, 1993. A similar question asked of respondents in a set of higher incomesuburban communities in Boston yielded even higher multiples of the existing poverty line.54 See: Andrew Sum, Tom Maher, Ted Murphy, et. al. Income and Employment Problems in Low IncomeNeighborhoods: The Persistence of Family Poverty Amidst Increasing Affluence in Boston and Massachusetts,Report Prepared for the Executive Office of Economic Affairs, Massachusetts, 1999.55 Opinion Dynamics Corporation, A Survey of Voter Attitudes: Welfare, Self-Sufficiency, and Making Ends Meet, AJoint Project of the United Way of Massachusetts Bay and the Women’s Educational and Industrial Union, Boston,April 2001.56 Only 1% of the respondents cited $10,000 or less while 71% cited $80,000 or more.

58
also revealed that a clear majority of respondents (64%) agreed that the Self-Sufficiency
Standards should be adopted by the state as a replacement for the federal government’s poverty
guidelines for a four person family.
In recent years, there have been several other attempts to develop family budgets for use
in measuring economic hardship among families across the nation. One of these methodologies
developed by researchers at the Economic Policy Institute in Washington, D.C. involves
calculations of basic family budgets.57 According to the authors of this study, “Basic family
budgets measure the income a family requires to afford basic needs for a safe and decent standard
of living. The family budget methodology tabulates the cost of every major budget item a family
needs, including housing, child care, health care, food, transportation and taxes, based on the
composition of the family and where the family lives.”58
The study calculated the values of these basic budgets for selected family types for more
than 400 areas around the country, including 12 areas in Massachusetts. The values of these
basic budgets for three types of families in the Boston metropolitan area are displayed in Table
37 together with the Boston PMSA’s rank among all areas in the country and the size of that
basic budget relative to the federal government’s poverty line for a family of that size and age
composition. For each of these three family types, the values of the basic budgets were
substantially in excess of the poverty lines for these same families with the multiples ranging
from 2.95 to 3.33. The Boston metropolitan area’s basic budgets ranked 2nd to 4th highest in the
country among more than 420 areas. Findings for the Lowell and Pittsfield metropolitan area
yielded basic budgets that were typically 2.6 to 3.0 times the size of the federal government’s
poverty lines for families of these given sizes and age composition. The values of the Basic
Family Budgets are quite close to the Family Economic Self-Sufficiency standards for these same
Massachusetts families.
Table 37:Values of EPI Basic Family Budgets for Three
Types of Families in the Boston Metropolitan Area, 1999
(A)
EPI Basic
(B)
Poverty
(C)
EPI Basic Budget/
(D)
Boston’s Rank
57 See: Heather Boushey, Chauna Brocht, et. al., Hardship in America: The Real Story of Working Families,Economic Policy Institute, Washington, D.C., 2001.58 Ibid, p. 7.

59
Family Type Budget Line Poverty Line Among 420+ Areas
One Parent, One Child $38,290 $11,483 3.33 4th highestOne Parent, Two Children $44,490 $13,423 3.31 4th highestTwo Parents, Two Children $49,795 $16,895 2.95 2nd highest
Methodologies for Estimating the Incidence of Family Economic Self-Sufficiency Challenges among Massachusetts Families and UnrelatedIndividuals
The task of estimating the number and share of Massachusetts families with annual
incomes below the Family Economic Self-Sufficiency standards is a far more complex one than
estimating the number of poor or low income families. This added complexity is due to several
factors. First, the poverty income thresholds of the federal government do not vary by
geographic area across the country. Every family of a given size and age composition in the U.S.
is assigned the same poverty threshold regardless of where they live. In contrast, the Family
Economic Self-Sufficiency standards for families in Massachusetts vary across counties and
cities in the state to reflect local differences in housing and child care costs. A separate set of
family budgets must be established for each county.59
Second, the U.S. Census Bureau has calculated a set of poverty income thresholds for all
family size and age composition combinations and for unrelated individuals. The Census 2000
PUMS files contain the results of U.S. Census Bureau calculations as to whether a given family’s
income is below the poverty income threshold for a family of their size and age composition.
Children under 18 in a family are treated the same regardless of their age. FESS standards have
been calculated for only a subset of families in each county although the subset of families does
cover a majority of all families in the state. To determine the Family Economic Self-Sufficiency
status of the remaining families (there are more than 120 family combinations excluding the
distinction of classifying those children under 6 into infant and preschool categories), we utilized
a methodology for generating equivalence scales that was developed by the National Academy of
Science’s Panel on Poverty and Family Assistance.60 An equivalence scale allows one to
determine how to adjust the required incomes for families of varying sizes and age compositions.
We have used to the Self-Sufficiency Incomes for the base group families developed by WEIU
and applied the results from the equivalence scales to derive FESS standards for all other family 59 In the case of Dukes and Nantucket counties, they share the same budgets as families in Barnstable County.

60
types. A detailed description of our methodology is presented in Appendix B of this paper,
together with the estimates of the 1999 FESS standards for 42 different types of families in each
county of the state. To simplify the numbers of calculations required, we treated every child
under 6 as a preschool child rather than an infant in determining the family’s income
requirements. Since infants’ child care costs are typically quite higher than those of preschool
children, our estimating methodology yields slightly conservative estimates of the number of
families unable to achieve Economic Self-Sufficiency. To increase the public’s and
policymakers’ acceptance of our findings, we believed it to be better to err on the conservative
side than to exaggerate the problem. In addition to estimating the number and percent of families
with a FESS deficit, we also generated estimates of the incidence of FESS inadequacy challenges
among all unrelated individuals in the state; i.e., persons living on their own or with others to
whom they are not related. We also produced estimates for an array of demographic and
socioeconomic subgroups of unrelated individuals. A separate section will be devoted to a
discussion of the findings on the incidence of FESS deficits among unrelated adults in the state.
Estimates of the Number and Per Cent of Families with an Income below theSelf-Sufficiency Standard: 1999
Our estimates of the number and per cent of Massachusetts families with a 1999 income
below the FESS standards are displayed in Table 38 and Chart 7. Findings are presented for
families in four family types and for the state as a whole. Statewide, there were estimated to be
417,323 families with a 1999 income below the FESS standards, representing nearly 27 per cent
of all families in the state. The incidence of such income inadequacy challenges did vary quite
widely across different types. As expected, given our earlier findings on the structure of poverty
and low income problems among the state’s families, the incidence of FESS deficit challenges
was lowest among those families in which no children under 18 were present in the home and
was highest among single parent families with one or more children under 18. Among families
only containing adults, slightly over 19 per cent had an income below the self-sufficiency
standard for families of their given size.61 Among families with 2 adults and 1 or more related
children under age 18, the incidence of FESS deficit challenges increased to 24% and rose to just
60 See: Constance F. Citro and Robert T. Michael (Editors), Measuring Poverty: A New Approach….61 For those families with no children under 18, separate FESS standards are calculated for families with 2 adultsthrough 7 adults. Families with 8 or more adults (less than 1 per cent of all families in this category) were assignedthe same FESS standard as a family with 7 adults.

61
under 30% when three or more adults were present in the home.62 The incidence of FESS
deficits was most severe among single parent families, a group including both single mothers and
single fathers. Nearly two-thirds of such families had 1999 incomes below the FESS standard,
and the mean size of their deficits was quite substantial, exceeding $21,400.63
Table 38:Estimates of the Number and Per Cent of Massachusetts
Families with an Income below the Self-Sufficiency Standard by Family Type, 1999
Family Type
(A)
Number ofFamilies Witha FESS Deficit
(B)
Per Cent ofAll Families
in Group
2 or More Adults, No Children Under 18 149,314 19.41 Adult, 1 or More Children Under 18 109,767 66.42 Adults with 1 or More Children Under 18 121,455 24.43 or More Adults With One or More Children
Under 1836,787 29.3
Total, All Families 417,323 26.8
62 In most cases, families with 2 adults were married couple families; however, in other cases the family could havebeen a single parent family with a child 18 or older or another adult relative in the home.63 The FESS deficit for a given family is the difference between the FESS budget for that family and its annual pre-tax income in 1999, excluding Earned Income Tax Credits and Child Care Tax Credits. The mean FESS deficit forsingle parent families in Massachusetts during 1999 was $21,433.

62
Chart 7:Per Cent of Families in Massachusetts with a Family Income Below the
Self-Sufficiency Level, All and by Type of Family, 2000
26.8
19.4
66.4
24.4
29.3
0
10
20
30
40
50
60
70
80
All Families Two or More Adults,No Children
One Adult with Oneor More Children
Under 18
Two Adults withOne or More
Children Under 18
Three or MoreAdults with One or
More ChildrenUnder 18
Comparisons of the incidence of FESS deficit challenges among Massachusetts families
in 1999 with the poverty rates and incidence of low income problems among families are
presented in Chart 8. Fewer than 7 per cent of the state’s families were poor in 1999 versus 17
per cent with a low income challenge and just under 27 per cent with an income below the
economic self-sufficiency standards. Thus, there were four times as many families experiencing
a FESS deficit as there were poor families in the state during 1999. In every county of the state,
the number of families with a FESS deficit was substantially higher than the number of poor
families, with the size of these multiples ranging from lows of 2.4 and 2.8 in Hampden and
Franklin counties to highs of six to seven times in Hampshire, Norfolk, and Plymouth Counties.
For example, during 1999, Norfolk County had a family poverty rate of only 2.9%, the lowest
poverty rate in the state. Yet, during that same year, 20 per cent of all families in Norfolk County
were estimated to have incomes below the FESS standard thresholds for that county. Clearly,
families in Norfolk County were far more successful in obtaining incomes above the poverty line
than they were in achieving economic self-sufficiency during 1999 even though they had the
second lowest incidence of FESS deficit challenges during that year.

63
Chart 8:Comparisons of the Per Cent of Massachusetts Families with Incomes Below the
Poverty Line, the Low Income Threshold, and the Family Economic Self-Sufficiency Standards,1999
6.7
17.0
26.8
0
5
10
15
20
25
30
Poor Low Income SSI Budget Defict
Per
Cen
t
Estimates of the fraction of families in each county of the state with incomes below the
self-sufficiency standard in 1999 are displayed in Chart 9. Variations in the incidence of family
FESS deficit challenges are quite substantial, ranging from lows of 18% in Franklin County and
20% in Norfolk County to highs of 36% in Plymouth County and 47% in Suffolk County.64
Eleven of the state’s 12 counties had an incidence of FESS standard deficit challenges of 20 per
cent or higher, 5 of the 12 counties had an incidence of 25 per cent or higher, and in three of the
counties (Hampshire, Plymouth, and Suffolk) over one-third of the families had incomes below
the Self-Sufficiency standards. Suffolk County had the highest incidence of FESS deficit
challenges for each of the four family type subgroups and Plymouth ranked second or third
highest on each of these measures. Franklin and Norfolk Counties tended to rank near the
bottom of the distribution of FESS deficit challenges for most family types.
Chart 9:Percent of Families in Massachusetts with a Family Income
Below the Self-Sufficiency Level, by County, 2000 64 Some counties, such as Bristol County, do somewhat better than expected on this measure, given their relativelyhigh rates of family poverty and low income problems. The Self-Sufficiency Income budgets for Bristol County aretypically 20 to 30 per cent less than those for the city of Boston due to lower housing and child care costs.

64
17.920.1
21.4 22.3 22.724.2 24.5 25.0
27.8
33.836.0
46.8
0
5
10
15
20
25
30
35
40
45
50
Fran
klin
Nor
folk
Bris
tol
Wor
cest
er
Ber
kshi
re
Esse
x
Bar
nsta
ble,
Duk
es,
and
Nan
tuck
et
Mid
dles
ex
Ham
pden
Ham
pshi
re
Plym
outh
Suff
olk
For each of our major family type groups, there was a fairly high degree of dispersion in
the incidence of FESS deficit challenges across counties. Even among families where no
children were present in the home, the incidence of FESS deficit challenges ranged from a low of
12% in Franklin County to highs of 29% in Plymouth and 32% in Suffolk Counties, a relative
difference of 2.7 times from top to bottom (Chart 10). This group of families was the most
successful in avoiding FESS deficit challenges in each county of the state. In 10 of the 12
counties, fewer than 20 per cent of “adult only” families were unable to achieve economic self-
sufficiency.

65
Chart 10:Percent of Families in Massachusetts with No Children
Under 18 with a Family Income below the Self-Sufficiency Level, by County, 2000
12.0
14.415.9 16.3 16.4 16.6
17.7 17.8 18.119.1
29.2
31.9
0
5
10
15
20
25
30
35
Fran
klin
Ber
kshi
re
Ham
pden
Esse
x
Bris
tol
Wor
cest
er
Ham
pshi
re
Nor
folk
Bar
nsta
ble,
Duk
es,
and
Nan
tuck
et
Mid
dles
ex
Plym
outh
Suff
olk
As noted earlier, single parent families were characterized by the highest incidence of
FESS deficit challenges, with two-thirds of all such families in the state encountering such a
problem in 1999. When the analysis is confined to single mother families, the incidence of such
challenges statewide rises to 70 per cent. Single parent families in each county of the state faced
a high risk of being unable to obtain an income above the Self-Sufficiency Standard in 1999
(Chart 11). In eleven of the 12 counties, a majority of single parent families had a FESS deficit
during 1999, and in 8 of the 12 counties 60% or more of the single parent families were unable to
achieve economic self-sufficiency.

66
Chart 11:Percent of Families in Massachusetts with One Adult and
One or More Children under 18 with a Family Income below the Self-Sufficiency Level, 2000
41.1
56.7 57.1 59.2 60.0 61.5 62.968.0 68.9
73.978.2 78.4
0
10
20
30
40
50
60
70
80
90
Fran
klin
Nor
folk
Bar
nsta
ble,
Duk
es,
and
Nan
tuck
et
Wor
cest
er
Bris
tol
Ber
kshi
re
Mid
dles
ex
Esse
x
Ham
pden
Ham
pshi
re
Plym
outh
Suff
olk
Two parent families with children were considerably more successful than single parent
families in achieving economic self-sufficiency during 1999, but even here variation in the
incidence of such challenges was quite substantial across counties. The share of two adult
families with children that could not achieve economic self-sufficiency ranged from lows of 16%
in Norfolk County and 18% in Bristol and Franklin Counties to a high of 50% in Suffolk County
(Chart 12). The pattern of results by family type clearly suggests that a high fraction of children
in Massachusetts were living in families with income levels below the Self-Sufficiency standard
in 1999. Our estimates indicates that 34% of all children under 18 were residing in families with
incomes below the Self-Sufficiency Standard in 1999, with the share rising to 86% for children
in single parent families. The per cent of children living in families with FESS deficits varied
considerably across counties of the state, ranging from lows of 22% in Norfolk County and 23%
in Franklin County to a high of 60 percent in Suffolk County.

67
Chart 12:Percent of Families in Massachusetts with Two Adults and One or More Children
Under 18 with a Family Income below the Self-Sufficiency Level, by County, 2000
16.017.8 18.0 19.2
21.4 21.524.0
26.2 27.4
31.0
36.8
50.5
0
10
20
30
40
50
60
Nor
folk
Bris
tol
Fran
klin
Wor
cest
er
Esse
x
Ber
kshi
re
Mid
dles
ex
Ham
pden
Bar
nsta
ble,
Duk
es,
and
Nan
tuck
et
Plym
outh
Ham
pshi
re
Suff
olk
Family Economic Self-Sufficiency Deficits and the Educational Attainmentand Native or Immigrant Status of the Family Householder
Our preceding analyses of poverty and low income challenges among Massachusetts
families revealed the key role played by the educational attainment of the family householder in
determining the ability of the family to avoid the most severe income inadequacy challenges. To
determine the strength of the association between the educational attainment of the family
householder and the ability of families to achieve economic self-sufficiency, we produced
estimates of the share of Massachusetts families with FESS standard deficits in 1999 by the
educational attainment of the family householder. Findings for five educational subgroups of
family heads are displayed in Chart 13. The incidence of FESS deficits among these five groups
ranged from a high of nearly 54 per cent among those families headed by an individual lacking a
high school diploma to slightly more than one-third among high school graduates to lows of 11
per cent among Bachelor degree holders and 8 per cent among families with a householder
holding a Master’s or higher degree. Those families with a head who failed to graduate from

68
high school were five to six times more likely than their peers with a Bachelor’s or higher degree
to have failed to achieve economic self-sufficiency in our state in 1999. Even at the near peak of
the labor market boom of the 1990s, Massachusetts families with a householder lacking any post-
secondary schooling ran a high risk of having a FESS deficit.65
Chart 13:The Incidence of Family Economic Self-Sufficiency Deficits among Families in
Massachusetts by the Educational Attainment of the Householder, 1999
53.6
34.3
25.0
11.5
8.4
0
10
20
30
40
50
60
Less than 12 or 12,No Diploma
H.S. Graduate, GED Some College orAssoc. Degree
Bachelor's Degree Master's or Higher
Per
Cen
t Bel
ow S
SI S
tand
ard
Immigrant families were earlier found to face poverty and low income challenges at a rate
more than twice as high as that of families with a native born householder. To identify these two
groups’ success in achieving economic self-sufficiency, we estimated the per cent of native born
and foreign born families with a FESS deficit both overall and by family type (Table 39). During
1999, families headed by an immigrant adult were nearly twice as likely as families with a native
born householder to have failed to achieve economic self-sufficiency. Slightly over 43 per cent
of immigrant families fell into this problem group versus only 23 per cent of the native born. In
each of the four family type subgroups, immigrant families were more likely than native born
families to have faced a FESS deficit, but the relative size of the gap was smallest among 65 The labor market boom peaked in calendar year 2000 when the state’s unemployment rate reached an historical

69
families headed by a single parent with one or more children present in the home. Both
immigrant and native born single parent families faced an extraordinarily high incidence of
economic self-sufficiency challenges, with 82 of every 100 immigrant single parents having a
FESS deficit in 1999.
Table 39:Estimates of the Incidence of FESS Deficits among Families With aForeign Born and Native Born Householder by Family Type: 1999
(in %)
Family Type
(A)
ForeignBorn
(B)
NativeBorn
(C)
Foreign Born/Native Born
2 or More Adults, No Children 33.7 17.1 2.01 Adult, 1 or More Children Under 18 81.6 62.3 1.32 Adults, 1 or More Children Under 18 38.4 20.0 1.93 or More Adults, 1 or More Children Under 18 50.0 20.4 2.5Total, All Families 43.1 22.9 1.9
The Incidence of Family Economic Self-Sufficiency Deficit Challenges amongDifferent Types of Families in Massachusetts
As the preceding analyses have revealed, across the state, families with different sizes and
characteristics have experienced substantially different degrees of success in achieving a level of
income that meets or exceeds the Family Economic Self-Sufficiency standard for their family
type. The average share of families experiencing a Family Economic Self-Sufficiency deficit for
the entire state hides the experiences of some groups that find it very difficult to earn an income
that will make their family economically self-sufficient. Families with more than one adult
present in the home are much more successful in achieving economic self-sufficiency than
families with only one adult present. Families in which the head of household has a high school
or a college degree fare much better than families headed by a person who did not finish high
school.
To illustrate the influence of multiple characteristics of families on their chances of
achieving economic self-sufficiency, we looked at the incidence Family Economic Self-
low of 2.6%. Total wage and salary employment peaked in early 2001 and has declined sharply since then.

70
Sufficiency deficits for seven different types of families in Massachusetts. These seven types of
families had the following characteristics:
Family 1 2 Adults, No Children; Householder has a Masters degree or higherFamily 2 2 Adults, No Children; Householder has some college or an Associates degreeFamily 3 2 Adults, 2 Children; Householder has some college or an Associates degreeFamily 4 2 Adults, 2 Children; Householder is a high school graduate but did not attend collegeFamily 5 2 Adults, 2 Children; Householder did not graduate from high schoolFamily 6 1 Adult, 2 Children; Householder is a high school graduate but did not attend collegeFamily 7 1 Adult, 2 Children; Householder did not graduate from high school
The results of our analysis are displayed in Chart 14. Families with no children under age
18 that had two adults present and had a householder that had at least a Master’s degree were
very successful in achieving economic self-sufficiency. Only 7.1 percent of the families in this
group fell below the Family Economic Self-Sufficiency standard. Two adult childless families in
which the householder completed some college had similar experiences, with just over 15
percent of the families in this group falling short of the economic self-sufficiency standard. Two
adult families with the same level of education of the householder (some college) that had two
children present in the house did not fare as well. About 23 percent of the families in this group
were unable to achieve economic self-sufficiency. The percent of families unable to achieve
economic self-sufficiency increased by about ten percentage points for two adult/two children
families headed by an individual who finished high school but did not attend college, with 34
percent of the families in this group falling short of attaining a self-sufficient income. Families
with the same composition (two adults and two children) who were headed by an individual who
did not have a high school diploma found it considerably more difficult to achieve economic self-
sufficiency, with the portion of families in this group falling below self-sufficiency jumping to
over 60 percent. However, families with a householder that had the same level of formal
education (no high school diploma) but only had one adult present found it even more difficult to
achieve economic self-sufficiency, with almost 92 percent of the families in this category falling
below the income level needed to achieve economic self-sufficiency. Families with this same
composition (one adult and two children) headed by an individual who did obtain a high school
diploma did not fare much better, with over 80 percent of the families in this category earning an
income below the level that would provide them economic self-sufficiency.
Chart 14:

71
The Incidence of Family Economic Self-Sufficiency DeficitsAmong Seven Different Types of Families in Massachusetts, 1999
7.1
15.3
22.5
33.6
60.6
80.6
91.7
0.0
10.0
20.0
30.0
40.0
50.0
60.0
70.0
80.0
90.0
100.0
2 Adults, NoChildren;Masters or
Higher
2 Adults, NoChildren;
Some College
2 Adults, 2Children;
Some College
2 Adults, 2Children; HS
Graduate
2 Adults, 2Children; NoHS Diploma
1 Adult, 2Children; HS
Graduate
1 Adult, 2Children; NoHS Diploma
Perc
ent b
elow
SSI
Sta
ndar
d
These examples illustrate the severe difficulties experienced by single parent families and
families headed by persons lacking a high school diploma in achieving an income that will make
them self-sufficient. It should be noted, that while these numbers pertain to the state of
Massachusetts as a whole, this pattern typically prevails for individual counties. In each county,
families with more than one adult and no children present fared substantially better than those
households that had only one adult with children present in the home. Furthermore, families in
each county that have a householder with some post-secondary schooling were frequently much
more successful in achieving economic self-sufficiency than families headed by an individual
who does not have a high school diploma.
The Incidence of Family Economic Self-Sufficiency Deficit Challenges amongUnrelated Persons in Massachusetts in 1999
All of our preceding analyses of Family Economic Self-Sufficiency challenges in
Massachusetts have been focused on family households. This section of the paper is devoted to
an analysis of the degree to which unrelated individuals in Massachusetts were able to achieve
economic self-sufficiency in 1999. The U.S. Census Bureau defines unrelated individuals as a
person living on his/her own or “a person sharing a housing unit, who is not related to the
householder by birth, marriage or adoption, including foster children”. The Census 2000 PUMS

72
data file allows us to identify all unrelated individuals in Massachusetts. In 2000, there were
1.185 million unrelated individuals in Massachusetts, comprising nearly 19 percent of the total
population of the state. The economic self-sufficiency analysis in this section is based upon the
1.170 million unrelated individuals in Massachusetts who were 18 years of age and older at the
time of the 2000 Census. We also have excluded those persons who were enrolled in college at
the time of the Census.66
How did unrelated individuals fare in achieving self-sufficiency incomes in the state of
Massachusetts and individual counties during 1999? In our analysis, we compare the FESS
standard for an unrelated individual with that person’s total personal income in 1999. The
estimated incidence of FESS challenges for unrelated individuals in Massachusetts by county in
1999 are displayed in Table 40. The Family Economic Self-Sufficiency standard for an unrelated
individual in 1999 as estimated by the Women’s Educational and Industrial Union varied across
counties, ranging from lows of $13,651 in Berkshire County and $14,495 in Franklin County to
highs of $19,444 in Middlesex, Norfolk, and Plymouth counties.67
66 In our analysis, we have excluded all those unrelated adults who were enrolled in educational institutions at thetime of the 2000 Census. Including all of college enrolled adults can exaggerate the number of adults with an incomedeficit of concern to policymakers, particularly full-time college students 18 to 24 years of age. Our numbers are,thus, conservative estimates of the number of unrelated individuals with a FESS income deficit.67 The 1999 estimates were imputed by CLMS staff using the FESS standards for 1997 and 2003.

73
Table 40:Family Economic Self-Sufficiency Standards for Unrelated Individuals in Massachusetts by
County, 1999
Source: Women’s Educational and Industrial Union (WEIU), imputed by CLMS.
In 1999, thirty five percent of all unrelated individuals 18 and older in Massachusetts had
a personal income below the Family Economic Self-Sufficiency standard (Chart 15).68 The share
of unrelated individuals not enrolled in college with a personal income below the self-sufficiency
standard varied fairly considerably across counties, ranging from lows of 28 percent in Franklin
County and 32 percent in Barnstable, Dukes, and Nantucket counties to highs of 38 percent in
Hampden County, 40 percent in Hampshire County and nearly 49 percent in Plymouth County.
(Chart 15).
68 If unrelated individuals enrolled in college were included in the analysis, then the incidence of FESS challengeswould have risen to 37.3 percent.
County Self-Sufficiency Standard
Barnstable, Dukes, Nantucket $16,637Berkshire $13,651Bristol $14,900Essex $15,977Franklin $14,495Hampden $14,840Hampshire $14,959Middlesex $19,444Norfolk and Plymouth Counties $19,441Suffolk $18,677Worcester $15,736

74
Chart 15:Percent of Unrelated Adults 18 and Older in Massachusetts with a
Personal Annual Income below the Self-Sufficiency Level by County, 2000
35.2
28.331.8 32.3 33.2 33.8 34.1
35.6 35.8 35.938.4
40.0
48.8
0
10
20
30
40
50
60
Mas
sach
uset
ts
Fran
klin
Bar
nsta
ble,
Duk
es,
and
Nan
tuck
et
Mid
dles
ex
Nor
folk
Esse
x
Ber
kshi
re
Bris
tol
Suff
olk
Wor
cest
er
Ham
pden
Ham
pshi
re
Plym
outh
With the demographic characteristics data on the PUMS files, we were able to generate
estimates of the incidence of Family Economic Self-Sufficiency deficits for an array of age,
gender, race-ethnic, nativity, and educational attainment subgroups of unrelated individuals in
Massachusetts. Chart 16 displays the findings by age group. The Family Economic Self-
Sufficiency deficits among unrelated adults in Massachusetts varied quite widely by age group.
As expected, given the limited work experience and hence earnings of most young adults, the
incidence of income inadequacy challenges was very high among 18-24 year olds (42.4%).69 The
incidence of Self-sufficiency challenges for all unrelated persons fell to only 19% among 25-34
years old, but then rose after that, increasing to 22% for 35-44 years old, to 26% for 45-54 years
old, and 36% for those 55-64 years old. (Chart 16). Among older persons 65 and older, the
incidence of FESS income deficits rose sharply to 57%. It should be noted that the personal
income measure includes nearly all sources of money income, including all forms of government
cash transfers including Social Security retirement income and private pensions. In the absence
69 For 18-24 years old, if we had included those youth enrolled in college, the incidence of FESS challenges for thisparticular age group would have risen to 58.4 percent instead of 42.4 percent.

75
of these cash transfers and private pensions, the incidence of income deficits among older adults
would be even higher in Massachusetts. Limited income from work and property and their
pension incomes keep many of these older individuals out of poverty, but does not allow them to
achieve economic self-sufficiency.
Chart 16:Percent of Unrelated Adults 18 and Older in Massachusetts with a
Total Personal Annual Income below the Self-Sufficiency Level by Age Group, 2000
35.2
42.4
18.6
22.3
26.1
35.7
57.4
0
10
20
30
40
50
60
70
All 18+ 18 to 24 Years 25 to 34 Years 35 to 44 Years 45 to 54 Years 55 to 64 Years 65 Years andOlder
The percent of unrelated individuals in Massachusetts with a personal income below the
self-sufficiency level in 1999 also varied quite substantially by gender and race-ethnic group.
(Chart 17). In Massachusetts, the incidence of Self-sufficiency challenges in 1999 was sharply
higher among unrelated females than among their male peers (40 percent for women versus only
28 percent for men). The incidence of Self-sufficiency challenges among unrelated individuals
also varied substantially across race-ethnic groups, ranging from lows of 33% for Whites and
35% for Asians to highs of 57% for those in “other” races and 59% among Hispanics.70 Many of
these Hispanic unrelated individuals were immigrants with limited formal schooling. Very high
fractions of Hispanic immigrants with limited formal schooling experienced FESS deficits.
70 The “other races” included American Indians, Alaskan Natives, and Hawaiian Islander.

76
Chart 17:Percent of Unrelated Adults in Massachusetts with a Total Personal Annual Income below the
Self-Sufficiency Level, Total and by Gender and Race/Ethnic Group, 2000
35.2
28.4
40.5
33.2
46.8
35.0
59.2
47.0
57.8
0
10
20
30
40
50
60
70
All Male Female White Black Asian Hispanic MixedRace
Other Race
National, state and local research studies have consistently found that an individual
person’s earnings are positively and strongly associated with their years of formal schooling, i.e.,
the higher the educational attainment level, the higher the level of annual earnings. We have
estimated the incidence of Family Economic Self-Sufficiency deficits for all unrelated adults in
Massachusetts by their educational attainment levels. As expected, the findings reveal that the
higher the years of formal schooling completed by an individual, the lower the incidence of FESS
deficiency challenges (Chart 18). In 1999, nearly seventy percent of unrelated adults without a
high school diploma or GED had a personal annual income below the self-sufficiency standard.
The incidence of such FESS deficit challenges for all unrelated persons in Massachusetts
declined steadily and strongly with their formal years of schooling. The incidence of FESS deficit
challenges for those unrelated adults with a high school diploma or a GED was 40% versus only
23% for those with an Associate’s degree, 16% for those with a Bachelor’s degree, and a low of
13% for those with a Master’s or higher degree. Those unrelated individuals who failed to
graduate from high school or obtain a high school equivalency degree were 5.4 times more likely
to experience a FESS deficit than their peers with a Masters or higher degree.

77
Chart 18:Percent of Unrelated Adults 18 and Older in Massachusetts with a Total Personal
Annual Income below the Self-Sufficiency Level by Educational Attainment, 2000
69.9
43.2
30.4
23.3
16.213.1
0
10
20
30
40
50
60
70
80
Less than 12 or 12Years, NoDiploma
HS Graduate Some College Associate Degree Bachelor's Degree Masters or Higher
Given the strong growth in the state’s immigrant population in recent years, we
considered it important to identify how well foreign born, unrelated individuals fared in avoiding
FESS deficits. Findings in Table 41 reveal that foreign-born unrelated persons in Massachusetts
in 1999 experienced a higher incidence of economic self-sufficiency challenges than their native-
born counterparts (50% versus 33%). The pattern of a higher incidence of such problems among
the foreign born was similar across all Massachusetts counties. Foreign-born persons across
Massachusetts counties were 5 percentage points to 29 percentage points more likely than their
native-born counterparts to be unable to achieve economic self-sufficiency during calendar year
1999 (Table 41). In 8 of the 12 counties, a majority of foreign born unrelated individuals
experienced a FESS deficit during calendar year 1999. In contrast, in only one county (Plymouth)
were more than 40 percent of the native born unrelated individuals unable to achieve economic
self-sufficiency.
Table 41:Percent of all Unrelated Adults 18 and Older in Massachusetts with a Personal Annual Income
Below the Self-Sufficiency Level by Nativity Status and by County, 2000(Numbers in Percent)

78
County Foreign-Born Native-Born Difference
Barnstable, Dukes, and Nantucket 36.9 31.4 +5.5Berkshire 55.5 33.2 +22.3Bristol 48.1 34.5 +13.6Essex 52.1 31.6 +20.5Franklin 39.2 27.4 +11.8Hampden 63.1 34.9 +28.2Hampshire 65.2 35.8 +29.4Middlesex 44.1 30.4 +13.7Norfolk 43.8 32.2 +11.6Plymouth 69.0 46.2 +22.7Suffolk 50.4 32.0 +18.4Worcester 48.9 34.8 +14.1Massachusetts, Total 50.0 33.1 +16.9
Source: PUMS 5% Sample, Census 2000, tabulations by Center for Labor Market Studies.
Measuring the Mean and Aggregate Size of Poverty and Family EconomicSelf-Sufficiency Deficits
The preceding sections of this report have presented comprehensive estimates of both the
numbers and demographic/socioeconomic characteristics of families in Massachusetts that were
poor, low income, or unable to achieve economic self-sufficiency in 1999. Besides knowing that
a particular family was poor or unable to achieve economic self-sufficiency, it would be highly
desirable to know how far away they were from achieving an annual income above the federal
government’s poverty line or the Family Economic Self-Sufficiency threshold. The success of
alternative workforce development or income support strategies in reducing the incidence of each
type of income inadequacy challenge will be dependent on the size of these existing deficits and
the effectiveness of the proposed interventions in raising the incomes of families. One cannot
expect to eliminate a large FESS income deficit with a relatively low cost workforce investment
or a marginal change in Earned Income Tax Credits or Child Tax Credits or Child Care Tax
Credits.
For several decades now, the U.S. Census Bureau has provided annual estimates of the
distribution and mean size of the poverty income deficits faced by poor families in the United
States.71 The poverty income deficit is a measure of the absolute size of the difference between
71 See: Joseph Dalaker and Bernadette D. Proctor, Poverty in the United States: 1999, Current Population Reports,Consumer Income, P-60, 210, U.S. Government Printing Office, Washington, D.C., 2000.

79
the poverty income threshold for a given poor family and its annual pre-tax money income.72 For
example, suppose that the poverty income threshold for a four person family was $18,000 and its
reported pre-tax, money income was $12,500. The poverty income deficit for this family would
have been $5,500.
Given the distribution of these poverty income deficits and the number of poor families,
one can calculate both the mean value of these poverty income deficits and the aggregate value of
the poverty income deficits for the entire nation or for a particular state. Findings of the March
2000 CPS work experience and income survey for the U.S. revealed that the mean poverty
income deficit for poor families throughout the nation was $6,687.73 The distribution of these
poverty deficits was characterized by a substantial degree of variability. Approximately 10% of
poor families had a poverty income deficit of less than $1,000 while nearly half had a poverty
income deficit greater than $6,000. The aggregate value of the poverty income deficits for all
poor families was $44.6 billion dollars in 1999. This is the total amount of income that would
have had to be received by poor families to bring each of them up to the poverty line during that
year.
Using the Census 2000 PUMS files for Massachusetts, we have estimated the mean and
aggregate size of the poverty income deficits for all poor families in Massachusetts during 1999.
Estimates of the mean size of these poverty income deficits by family size are displayed in Table
42. The mean poverty income deficit for all poor families was $7,071. The mean sizes of these
deficits varied by family size, becoming increasingly larger as family size increased. The mean
values of these deficits ranged from $5,443 for 2 person families to a high of $17,768 for poor
families containing nine or more persons.74 The aggregate size of these family poverty income
deficits was $761 million.
Table 42:Mean Poverty Income Deficits and Total Poverty Deficits of
Families in Massachusetts by Size of Family, 1999
(A) (B) (C)
72 Given the use of money income measures that exclude the value of key in-kind benefits such as food stamps, rentalsubsidies, Medicaid benefits, and federal and state Earned Income Tax Credits, the sizes of the poverty incomedeficits are somewhat exaggerated. There are alternative poverty income measures and deficits that can be producedby varying the definition of money income to incorporate such in-kind benefits and tax credits.73 See: Joseph Dalaker and Bernadette Proctor, op. cit., “Table E”, p. xvi.74 More than 80 per cent of poor families in Massachusetts during 1999 contained two to four persons. Only one percent of the state’s poor families contained 8 or 9 persons.
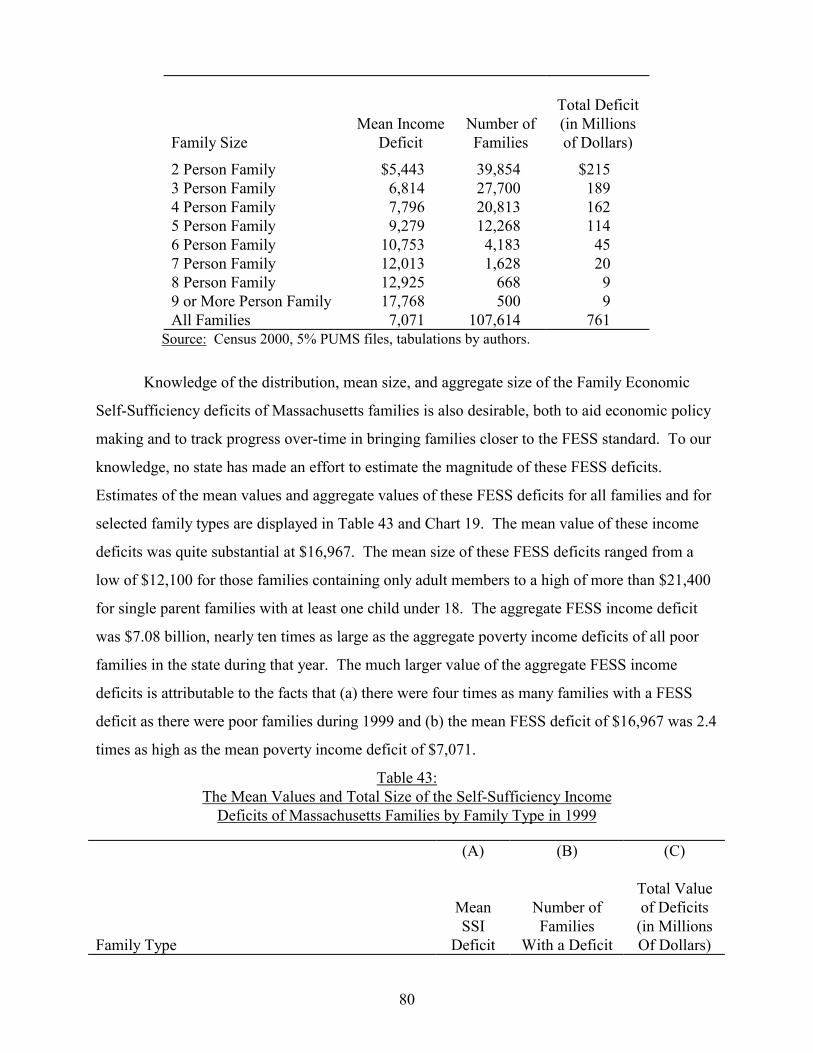
80
Family SizeMean Income
DeficitNumber ofFamilies
Total Deficit(in Millionsof Dollars)
2 Person Family $5,443 39,854 $2153 Person Family 6,814 27,700 1894 Person Family 7,796 20,813 1625 Person Family 9,279 12,268 1146 Person Family 10,753 4,183 457 Person Family 12,013 1,628 208 Person Family 12,925 668 99 or More Person Family 17,768 500 9All Families 7,071 107,614 761
Source: Census 2000, 5% PUMS files, tabulations by authors.
Knowledge of the distribution, mean size, and aggregate size of the Family Economic
Self-Sufficiency deficits of Massachusetts families is also desirable, both to aid economic policy
making and to track progress over-time in bringing families closer to the FESS standard. To our
knowledge, no state has made an effort to estimate the magnitude of these FESS deficits.
Estimates of the mean values and aggregate values of these FESS deficits for all families and for
selected family types are displayed in Table 43 and Chart 19. The mean value of these income
deficits was quite substantial at $16,967. The mean size of these FESS deficits ranged from a
low of $12,100 for those families containing only adult members to a high of more than $21,400
for single parent families with at least one child under 18. The aggregate FESS income deficit
was $7.08 billion, nearly ten times as large as the aggregate poverty income deficits of all poor
families in the state during that year. The much larger value of the aggregate FESS income
deficits is attributable to the facts that (a) there were four times as many families with a FESS
deficit as there were poor families during 1999 and (b) the mean FESS deficit of $16,967 was 2.4
times as high as the mean poverty income deficit of $7,071.
Table 43:The Mean Values and Total Size of the Self-Sufficiency Income
Deficits of Massachusetts Families by Family Type in 1999
Family Type
(A)
MeanSSI
Deficit
(B)
Number ofFamilies
With a Deficit
(C)
Total Valueof Deficits
(in MillionsOf Dollars)

81
Adults Only, No Children $12,099 149,314 $1,807Single Parent Families $21,433 109,767 $2,352Two Adult Families, With One or More Children $17,831 121,455 $2,166Three or More Adults, With One or More Children $20,555 36,787 $756All Families $16,967 417,323 $7,080
Chart 19:Mean FESS Deficit for Families below the Self-Sufficiency
Income Standard in Massachusetts, 1999
$12,099
$21,433
$17,831
$20,555
$0
$5,000
$10,000
$15,000
$20,000
$25,000
Adults Only, No Children Single Parent Families Two Adult Families 3 or More Adults Familes
The mean values of the FESS deficits for families were quite high in all counties of the
state, but they did differ across counties (Chart 2). The mean values of these deficits ranged from
a low of slightly under $11,600 for Franklin County to highs of $18,000 in Plymouth County and
$21,800 in Suffolk County. Not only did families in Plymouth and Suffolk Counties have the
highest incidence of FESS challenges in 1999, but the families experiencing these deficits had
the two highest mean deficits. Thus, reducing the problems of family income inadequacy in
Plymouth and Suffolk Counties will be a far more formidable task than in other counties of the
state where fewer families experience such challenges and incur lower average income deficits
when they do so.
Chart 20:Mean FESS Deficits for Families Below the
Self-Sufficiency Standard in Massachusetts by County, 1999

82
$11,595 $11,965$12,878 $13,425
$14,465 $14,652$16,056
$16,677 $17,109 $17,627 $18,008
$21,803
$0
$5,000
$10,000
$15,000
$20,000
$25,000
Fran
klin
Ber
kshi
re
Bar
nsta
ble,
Duk
es,
and
Nan
tuck
et
Bris
tol
Wor
cest
er
Nor
folk
Cou
nty
Ham
pden
Ham
pshi
re
Esse
x
Mid
dles
ex
Plym
outh
Suff
olk
Cou
nty

83
Summary of Key Findings and Future Research Issues
This research monograph was designed to provide an analysis of key demographic/
socioeconomic traits of Massachusetts families and the incidence of three types of income
inadequacy challenges among Massachusetts families during 1999 and other selected time
periods. The three alternative measures of income inadequacy were the official poverty income
thresholds of the federal government, family measures of “low incomes” based on two times the
poverty income thresholds, and the Family Economic Self-Sufficiency Standards of the Women’s
Educational and Industrial Union and Wider Opportunities for Women. Given these three
measures of income inadequacy, we estimated the number and per cent of Massachusetts families
that were poor, low income, and unable to achieve Economy Self-Sufficiency in 1999. These
estimates were generated for a diverse array of demographic and socioeconomic subgroup of
families across the state and in individual counties. Whenever possible, we compared the
findings for 1999 with those of earlier years (1979, 1989) and in more recent years (2002). A
summary of our main findings is presented below together with a brief set of issues for future
research consideration.
(i) At the time of the 2000 Census, there were approximately 1.584 million family
households residing in the state, an increase of about 12 per cent since 1980. Slightly over three-
fourths (76.4%) of these families were married couple families, 18 per cent were headed by
unmarried women, and the remaining 5.4 per cent were headed by unmarried men. The family
composition of the state in 2000 was essentially identical to that of the nation. Over the past two
decades, however, a declining fraction of the state’s families have been married couples. In
1980, their share of all families was just under 81%, but had declined to 76% in 2000. The
change in the marital composition of the state’s families has had a number of adverse
consequences for the state’s ability to reduce poverty, low income, and economic self-sufficiency
challenges, given the higher rates of income inadequacy challenges among unmarried families,
especially when children are present in the home.
(ii) The educational attainment of the state’s family householders has improved over time
and exceeds the average educational attainment of family householders across the nation. At the
time of the 2000 Census, 85 per cent of the state’s family householders held a high school
diploma or its equivalent, nearly 60 per cent had completed at least one year of post-secondary

84
schooling, and 34 per cent had obtained a Bachelor’s or higher degree. In 1980, only 38 per cent
of the state’s family heads had completed one or more years of college and only slightly more
than 20 per cent had completed four or more years of college.75 In 2000, Massachusetts family
heads were more likely than their U.S. counterparts to have graduated from high school (85.4 vs.
81.2 per cent), completed at least one year of college (59.3 vs. 53.6 per cent), and obtained a
Bachelor’s or higher degree (34.4 vs. 25.4 per cent). The improved educational attainment of
family householders, ceteris paribus, should have strengthened the state’s ability to combat
income inadequacy challenges, given the strong links between the educational attainment of the
family householder and their likelihood of being poor, low income, or unable to achieve
economic self-sufficiency.
(iii) Only a slight majority (50.5 per cent) of the state’s family households in 2000 had
one or more related children under 18 in the home. This share has been quite stable over the past
two decades. Unfortunately, a rising share of the state’s families with related children in the
home were headed by an unmarried woman or man. In 2000, 28 per cent of families with a child
under 18 were single parent families, up from 20 per cent in 1980. The higher share of families
with children headed by an unmarried adult has negative consequences for poverty, low income,
and economic self-sufficiency challenges, given the much higher incidence of income inadequacy
challenges among such families.
(iv) At the time of the 2000 Census, there were 272,000 family households in
Massachusetts that were headed by a foreign born individual. These immigrant families
accounted for 17.2 per cent of all families in the state, up from only 11.6 per cent in 1980. Given
the above average share of immigrant families who lacked a high school diploma, the limited
English-speaking proficiencies of many immigrant adults, and their fewer years of U.S. work
experience, immigrant families are at a considerably higher risk of being poor, low income, or
unable to achieve economic self-sufficiency.
(v) At the time of the 2000 Census, 6.7% of the state’s families were categorized as being
poor on the basis of the federal government’s poverty income thresholds. The Massachusetts
family poverty rate in 1999 was identical to the 6.7% family poverty rate of 1989. While the
state’s poverty rate was several percentage points below that of the nation, no progress was
75 The 1980 Census only collected data on years of schooling completed. It did not ask respondents to reportwhether they actually had received various types of high school diplomas or college degrees.

85
achieved in reducing either the family or person poverty rate over the decade of the 1990s.76 The
slow growth of median real family income over the decade combined with rising family income
inequality brought progress in reducing poverty to a halt. During the past few years, there has
been a modest rise in the poverty rate of both families and persons in Massachusetts as the state’s
labor markets weakened considerably.
(vi) Family poverty rates in Massachusetts at the time of the 2000 Census varied quite
considerably by family type, the presence of children in the home, and the educational attainment
of the family householder. Family poverty rates in Massachusetts ranged from a low of 3 per
cent among married couple families to a high of 22 per cent among families that were headed by
unmarried women. Families with one or more related children in the home were 3.2 times more
likely to be poor than families with no related children under age 18 in the home (10.3% vs.
3.2%). Poverty rates of families also were strongly associated with the educational attainment of
the family householder, ranging from a low of less than 2 per cent for families headed by a
person with a Bachelor’s or higher degree to 8.4% for families headed by a high school graduate
with no post-secondary schooling and to a high of 17% for families with a head who did not
obtain a regular high school diploma or a GED certificate. Strong links between poverty rates
and the educational attainment of the family householder prevailed across all family types,
among families with and without children, and within each race/ethnic and nativity status group
(i.e., immigrant and native born families).
(vii) Family poverty rates in Massachusetts in 1999 varied quite widely across counties
and Local Workforce Investment Board service delivery areas. Poverty rates of families ranged
from lows of 3% in Norfolk and Nantucket Counties to highs of 8% in Hampden and 15% in
Suffolk County. Over the decade, there was growing divergence in family poverty rates across
counties as a number of counties with above average poverty rates at the beginning of the decade
(Bristol, Hampden, and Suffolk) moved somewhat further away from the state average while
counties with below average poverty rates in 1989 (Barnstable, Franklin, Hampshire) moved
further below the state average by the end of the decade.
(viii) At the time of the 2000 Census, nearly 271,000 families in Massachusetts were
estimated to be “low income”, i.e., with money incomes less than two times the poverty line for
families of their given size and age composition. They represented 17.1 per cent of all families 76 The poverty rate for all persons in Massachusetts during 1999 was a higher 9.3 percent, up from 8.9% in 1989.

86
in the state, an incidence two and one-half times as high as the share of poor families. The share
of families with a low income in 1999 was statistically identical to the share of state families that
were low income in 1989 (17.0%). Thus, no progress was made in reducing the incidence of low
income challenges in Massachusetts during the decade of the 1990s. A rise in the incidence of
such challenges in the recessionary early years of the 1990s was offset by a decline from mid-
decade onward. During the recessionary years of 2001-2002, the per cent of state families with
low incomes is estimated to have risen to just under 19 per cent.
(ix) Similar to the findings on the structure of family poverty rates, the per cent of
families with annual incomes below two times the poverty line in 1999 differed considerably
across family types, the presence of children in the home, and the educational attainment,
race/ethnic origin, and nativity status of the family householder. The incidence of low income
challenges ranged from a low of 10% for married couple families to a high of 43 per cent for
families headed by unmarried women. Families with children present in the home were more
than twice as likely to be low income as families without any children under 18 in the home
(23.4% vs. 10.8%). Only 5 to 6 per cent of the state’s families with a householder possessing a
Bachelor’s or higher degree were low income versus 22 per cent of those headed by a high school
graduate and 38 per cent of those headed by an individual lacking a high school diploma or its
equivalent. Families headed by a foreign born person were 2.4 times more likely to be low
income than their native born counterparts.
(x) The share of families experiencing a low income challenge in Massachusetts in 1999
differed quite substantially across counties and local WIB areas. In all but one county of the state
(Norfolk), the incidence of low income challenges was in the double-digits. The per cent of
families with low income challenges varied from lows of 8.5% in Norfolk County and 11.6% in
Middlesex County to highs of 24% in Hampden County and 32% in Suffolk County. The Boston
LWIB was characterized by the highest incidence of low income challenges (33%) while only
8% of families in the Metro South/West LWIB encountered such an income inadequacy problem
in 1999.
(xi) Our third set of measures of family income inadequacy is based on the Family
Economic Self Sufficiency Standards of the Women’s Educational and Industrial Union and
Wider Opportunities for Women. We substantially expanded upon the subset of families for
which income standards were available to include nearly 50 family types in each county of the

87
state in 1999. Our estimates indicate that there were slightly over 417,000 families in
Massachusetts in 1999 with an annual income below the Self-Sufficiency standard, representing
nearly 27 per cent of all family households residing in the state at the time of the 2000 Census.
The number of families with a FESS deficit was four times greater than the number of poor
families in the state.
(xii) The incidence of FESS deficit challenges varied widely across family types, the
educational attainment and nativity status of the family householder, and counties of the state.
Just under 20 per cent of families with only adults (18+) present in the household had a FESS
deficit versus one-fourth of the families with two adults and at least one child present in the
home, and two-thirds of single parent families with a child under 18. The incidence of FESS
deficit challenges varied considerably across families based on the educational attainment of the
householder. A majority (54%) of the families headed by an individual lacking a high school
diploma were unable to achieve an annual income above the FESS standard versus one-third of
the families headed by high school graduates, 11% of those with a head who held a Bachelor’s
degree, and only 8% of those with a Master’s or higher degree. Immigrant families were twice as
likely as families with a native born householder to have a FESS deficit (34% vs. 17%). The
incidence of FESS deficit challenges among families ranged from lows of 18 to 20 per cent in
Franklin and Norfolk Counties to highs of 36 per cent in Plymouth County and 47 per cent in
Suffolk County. For each family type category, the incidence of FESS deficit challenges was
highest in Suffolk County.
(xiii) Nearly 35 per cent of the state’s adults who were living on their own or with others
to whom they were not related had a FESS income deficit during 1999. The incidence of these
income deficits ranged from a low of 18 per cent among 25-34 year olds to highs of 42 per cent
among 18-24 year olds and 57 per cent among the state’s elderly (65 and older). Women were
more likely than men to experience a FESS deficit (40% vs. 28%). Across race/ethnic groups,
the share of unrelated individuals with a FESS deficit varied from lows of 33 to 35 per cent
among Whites and Asians, respectively, to a high of just under 60% among Hispanics. Those
adult persons lacking a high school diploma (70%) faced an extraordinarily high rate of FESS
deficits, an incidence 4 to 5 times higher than that of single adults with a Bachelor’s or higher
academic degree.

88
(xiv) Calculations of the values of the FESS income deficits of families in 1999 yielded a
mean value of nearly $17,000, which was 2.4 times as high as the mean poverty income deficit of
poor families in the state. The mean values of these FESS deficits were lowest for families
containing only adult members ($12,100) and highest for single parent families ($21,400). The
aggregate value of these family FESS deficits was equal to $7.08 billion, nearly 10 times as high
as the aggregate value of the poverty income deficits of families across the entire state.
Further research for this initiative will aim to further improve our insights into the types
of labor market experiences (including industries and occupations of year-round, full-time jobs)
of family householders and spouses that allow them to achieve economic self-sufficiency. Such
applied labor market research is desirable for future workforce development policymaking and
planning. A forthcoming research paper by the authors will examine the annual earnings of full-
time, year-round adult workers in Massachusetts during the 1990s and identify the types of jobs
held by workers with no formal schooling beyond an Associate’s degree that allowed them to
achieve an earnings level that would raise hypothetical families above the low income thresholds
and selected FESS standards.
There are other research activities that could expand upon our understanding of the size
and incidence of income inadequacy problems among the state’s families and the paths by which
families succeed in achieving economic self-sufficiency. First, early this fall, the U.S. Census
Bureau will issue its report on family income and poverty developments in the U.S. and
Massachusetts during calendar year 2003. Findings from that data base will allow us to estimate
the incidence of poverty and low income challenges among Massachusetts families and unrelated
individuals during that year, but the small sample size and lack of county geographic identifiers
will prohibit estimation of FESS deficit challenges among the state’s families during that year.77
Second, the U.S. Census Bureau has recently released public use files from the 2002 American
Community Surveys, a large scale national household survey that uses a questionnaire nearly
identical to the 2000 Census long form questionnaire. Geographic identifiers on this public use
data file are not known at this time. The 2003 ACS interviews should be released later this fall,
77 The CPS public use files for Massachusetts include identifiers for a few large metropolitan areas (Boston,Springfield, Worcester) but not for counties or any cities other than Boston and Springfield. These city samples aretypically quite small and are not necessarily statistically representative of the city.

89
with opportunities to update the estimates of the number of Massachusetts families with a FES
income deficit.
.

90
Appendix A: Comparisons of the U.S. Census Bureau Estimates of theNumber of Family Households in Massachusetts Counties in 2000 with the
Number of Families in each County Based on the PUMA Assignment Model
As noted in the text, the use of the PUMS micro-record data from the 2000 Census to
analyze data for geographic areas required us to aggregate Public Use Micro-data Areas
(PUMAs) to form counties since the PUMS data files do not provide county identifiers for
individuals. PUMA areas contain resident populations of 100,000 or more. These PUMA areas
can consist of parts of large cities (Boston, Springfield), or combinations of cities and towns and
rural areas, and they often cross county boundaries. A PUMA area may cover parts of two or
more counties; thus, decisions must be made as to which county the PUMA should be assigned.
The assignment process used by the authors to assign PUMAS to specific counties in
Massachusetts is summarized in a table at the end of this appendix.
The total number of families assigned to counties by our assignment process was 1.557
million or nearly 99 per cent of all family households in the state at the time of the 2000 Census.
In Table A-1 below, we compare the estimated number of families allocated to each county
through the PUMA assignment process with the estimated number of families in each county
from published Census Bureau estimates. A substantial majority of the matches are quite close.
The two island counties (Dukes and Nantucket) had to be combined with Barnstable County, thus
giving us twelve counties in the state for the matching process. For five of these twelve counties,
the number of families assigned to counties by our allocation process fell within +3% and 10 of
the 12 were within +9%. Only one county (Hampshire) had an allocated number of families that
fell as much as 19% away from the Census Bureau estimate of the number of families in the
county. In absolute terms, the gap between these two estimates was fairly small, only 6,370
families. The gap is due to the fact that part of Hampshire County was assigned to a PUMA that
overlapped with Hampden County and was allocated to Hampden County. The bulk of the
geographic matches appear to be quite close to the U.S. Census Bureau estimates of the number
of family households in each county of the state.

91
Table A-1:Comparisons of Official U.S. Census Bureau Estimates withPUMA Assigned Families in Massachusetts Counties, 2000
County
(A)
Official Estimates
(B)
PUMA Assigned
(C)
PUMA/Official(in %)
Barnstable, Dukes, and Nantucket 66,938 67,299 101Berkshire 35,110 30,922 88Bristol 140,610 127,935 91Essex 185,094 185,808 100Franklin 18,415 20,089 109Hampden 115,773 124,153 107Hampshire 33,819 27,449 81Middlesex 361,076 372,101 103Norfolk 165,858 155,858 94Plymouth 122,421 113,679 93Suffolk 139,159 141,739 102Worcester 192,423 189,621 99Total 1,576,696 1,556,653 99

92
Appendix B: Methodologies for Calculating the Values of Family EconomicSelf-Sufficiency Standards for Family Subgroups
The task of identifying the numbers and demographic/socioeconomic characteristics of
Massachusetts families who were unable to achieve an annual income in excess of the Family
Economic Self-Sufficiency standard is substantially more complex than that of simply identifying
the number of poor and low income families in the state. The added complexity is due to several
factors. First, the federal government’s poverty lines and the low income thresholds do not vary
across states or sub-state areas. Under these thresholds, central city, suburban and rural families
are subject to the same standard though they may live in very different regions and face different
living expenses, especially shelter. In contrast to these poverty thresholds, the FESS standards
do vary across counties of the state, sometimes substantially. Thus, there are 12 different sets of
FESS standards for the state of Massachusetts in 1999.
Second, the federal government calculates separate poverty income thresholds for
families of each size and age composition, varying the poverty lines with the number of children
under 18 in the family. In contrast, the FESS standards vary by the number of family members,
the number of infants, other preschool children, and children over the age of six, including those
up to age 12 and teens separately. However, the FESS standards are only calculated for a sub-set
of all family types in each county. There are many other family types (three or more adults, no
children; one or more adults, three or more children) for whom separate family FESS standards
must be calculated if we are to produce comprehensive estimates of the number and per cent of
families with income below the FESS standard in the state and each county.78 Given our desire
to estimate the incidence of FESS challenges for sub-groups of families in the state and in
individual counties, we have developed a methodology for estimating a FESS standard for nearly
50 types of families in each county of the state. This appendix provides a description of the
specific elements of our estimating methodology with several practical examples of how the
methodology is applied to estimate FESS standards for specific types of families in a given
county.
78 The WEIU previously has attempted to deal with this problem in an indirect manner by estimating a compositeFESS standard for each county based on the weighted average family budgets for three types of families. Thisapproach, however, cannot be used to identify the specific number of families with FESS deficits in any given familysubgroup, a limitation for policymaking purposes.

93
Family Economic Self-Sufficiency Standards for five base group families were designed
by the Women’s Educational and Industrial Union (WEIU). These base group standards were
used to calculate FESS standards for 42 additional types of families with varying characteristics.
These five different base group families include families with the following characteristics:
� One adult only� One adult and one child under six (of pre-school age)� One adult and one child over six� One adult and two children, one over six and one under six (of pre-school age)� Two adults and two children, one over six and one under six (of pre-school age)
To calculate the FESS standards for each of these 42 additional types of families, the
FESS standard of the base group family with the closest characteristics is multiplied by an
equivalency scale to determine the FESS standard for such a family. The equivalence scale
formula that we use was recommended by the National Research Council’s Panel on Poverty and
Family Assistance in their final report to the U.S. Congress in 1995 titled Measuring Poverty: A
New Approach.79 Their formula takes into account the number of adults (18+) and children in
the family and incorporates a weight of 0.7 for children and an economy of scale adjustment
factor of 0.75. The formula is (A + 0.7K)0.75 where A is the number of adults (18+) and K is the
number of children and 0.75 is the economy of scale adjustment factor.
Our income adjustment factors incorporate information on the family characteristics of
both the base group family and the family for whom we are calculating a standard. The formula
for the ratio of the equivalency scales of the two families is as follows:
� �� �� � 75.0
75.0
7.0(7.0
BB KAKA
��
��
79 For more detailed technical discussions of the construction and interpretation of equivalence scales, see: (i)Constance F. Citro and Robert T. Michael, Measuring Poverty: A New Approach, National Academy Press,Washington D.C., 1995; (ii) Michael O’Higgins, Gunther Schmaus, and Geoffrey Stephenson, “Income Distributionand Redistribution: A Micro-data Analysis for Seven Countries,” in Poverty, Inequality and Income Distribution inComparative Perspective, (Editors: Timothy Smeeding, Michael O’Higgins, et al), Urban Institute, Washington D.C.,1990, pp. 20-56; (iii) Timothy M. Smeeding, “Cross-National Comparisons of Inequality and Poverty Position,” inEconomic Inequality and Poverty, (Editor: Lars Osberg), M.E. Sharpe, Armonk, New York, 1991.

94
Where:A: Number of adults in the family for whom we are calculating a standardK: Number of children in the family for whom we are calculating a standardAB: Number of adults in the base group familyKB: Number of children in the base group family
The equivalency scale uses the assumption that a child’s consumption requirements are
only 70 per cent of the consumption of an adult. Therefore, the number of children in both the
numerator and the denominator are multiplied by 0.70. This equivalency scale also recognizes
that families’ consumption behavior operates on an economy of scale. Thus, as the number of
family members increases, the income needed to sustain that family’s consumption standard
increases at a decreasing rate. Therefore, the numerator and denominator are both brought to the
power of 0.75 to reflect the economies of scale in consumption adjustment factor of that family.
Let us start with a relatively simple example, using families in which only adults 18 and
older are present in the household. During 1999, a single adult living in Norfolk/Plymouth
County was estimated to need $19,441 to achieve economic self-sufficiency. We need to
determine the FESS standards for other families in which more than one adult is present in the
family. For families containing two and three adults with no children under 18, we can estimate
the Family Economic Self-Sufficiency standard by applying our equivalence scale formula for
the above two families, using a household with only one adult as the base group.
Family Size Equivalence ScaleValue
Family EconomicSelf-Sufficiency
Standard2 (2)0.75=1.682 $32,7003,5413 (3)0.75=2.280 $44,3165,469
For the family with two adults, the equivalence scale has a value of 1.682, implying that it
needs 68 per cent more income than a one person household to achieve the same level of per
capita consumption. Multiplying the self-sufficiency level income of $19,441 for a one person
household in Norfolk/Plymouth County by 1.682 yields the Family Economic Self-Sufficiency
standard of $32,7003,541 for a two person adult family. For a family containing three adults, the
equivalence scale has a value of 2.280, and the Family Economic Self-Sufficiency standard for
such a family is slightly overunder $44,3005,500.

95
Now, to illustrate a more complex example, we will calculate the Family Economic Self-
Sufficiency standard of a family with children. In this example, the ratio of the equivalency
scales for the two families (our subject family and the base group family) is multiplied by the
base group family’s standard for that county. To determine the ratio of the equivalency scales,
we refer to the previously detailed formula:
� �� �� � 75.0
75.0
7.0(7.0
BB KAKA
��
��
For example, to calculate the self-sufficiency standard for a family with one adult and
three children under the age of 6 in Boston, we use a base group family with one adult and one
child and the variables in the above formula take the following values:
A: 1K: 3AB: 1KB: 1
Now, we will take the ratio of the equivalency scales of this family and the base group
family and then multiply it by the standard of the base group family ($36,202).
� �� �
� �801,56$202,36$569.1202,36$
17.0(137.01
75.0
75.0
����
��
��
The calculations lead to the conclusion that a family with one adult and three children
under the age of 6 in Boston needs a family income of $56,8013,599 in order to achieve
economic self-sufficiency. This same methodology is used to calculate FESS standards for 42
different kinds of families in Boston and eleven Massachusetts counties.

96
Table B-1:Family Economic Self-Sufficiency Standards for Families in Massachusetts Counties by
Family Type and Number of Adults and Children in the Family
Adults, No Children Boston Essex Middlesex Norfolk Plymouth Bristol1 Adult 17,713 15,977 19,444 19,441 19,441 14,9002 Adults 29,790 26,870 32,701 32,696 32,696 25,0593 Adults 40,377 36,420 44,323 44,316 44,316 33,9654 Adults 50,100 45,190 54,996 54,987 54,987 42,1445 Adult 59,227 53,422 65,015 65,005 65,005 49,8216 Adult 67,906 61,250 74,542 74,530 74,530 57,1227 Adults 76,237 68,765 83,687 83,674 83,674 64,130
Single Parent Families (1 Adult Present)1 Kid Under 6 36,202 32,508 39,389 36,079 36,079 28,2091 Kid Over 6 27,376 23,079 26,742 25,675 25,675 21,5422 Kids Under 6 46,875 42,092 51,002 46,716 46,716 36,5262 Kids Over 6 35,447 29,883 34,626 33,245 33,245 27,8932 Kids: 1 Under 1 Over 6 45,865 39,611 46,687 42,313 42,313 34,8513 Kids Under 6 56,795 51,000 61,795 56,602 56,602 44,2553 Kids Over 6 42,949 36,207 41,954 40,280 40,280 33,7963 Kids: 1 Under, 2 Over 6 55,571 47,993 56,567 51,267 51,267 42,2263 Kids: 2 Under, 1 Over 6 55,571 47,993 56,567 51,267 51,267 42,2264 Or More Kids 64,753 55,924 65,914 59,739 59,739 49,204
Married Couple Families (2 Adults Present)1 Kid Under 6 39,182 37,634 43,416 39,934 39,934 33,6471 Kid Over 6 39,182 37,634 43,416 39,934 39,934 33,6472 Kids Under 6 46,577 44,737 51,610 47,471 47,471 39,9982 Kids Over 6 46,577 44,737 51,610 47,471 47,471 39,9982 Kids: 1 Under 1 Over 6 46,577 44,737 51,610 47,471 47,471 39,9983 Kids Under 6 53,599 51,481 59,390 54,627 54,627 46,0273 Kids Over 6 53,599 51,481 59,390 54,627 54,627 46,0273 Kids: 1 Under, 2 Over 6 53,599 51,481 59,390 54,627 54,627 46,0273 Kids: 2 Under, 1 Over 6 53,599 51,481 59,390 54,627 54,627 46,0274 Or More Kids 60,325 57,942 66,843 61,483 61,483 51,803
Families with 3 Adults1 Kid Under 6 49,627 47,666 54,989 50,579 50,579 42,6161 Kid Over 6 49,627 47,666 54,989 50,579 50,579 42,6162 Kids Under 6 56,514 54,281 62,620 57,598 57,598 48,5312 Kids Over 6 56,514 54,281 62,620 57,598 57,598 48,5312 Kids: 1 Under 1 Over 6 56,514 54,281 62,620 57,598 57,598 48,5313 Kids Under 6 63,131 60,637 69,952 64,343 64,343 54,2133 Kids Over 6 63,131 60,637 69,952 64,343 64,343 54,2133 Kids: 1 Under, 2 Over 6 63,131 60,637 69,952 64,343 64,343 54,2133 Kids: 2 Under, 1 Over 6 63,131 60,637 69,952 64,343 64,343 54,2134 Or More Kids 69,524 66,778 77,036 70,859 70,859 59,703

97
Table B-1 (Continued):Family Economic Self-Sufficiency Standards for Families in Massachusetts Counties by
Family Type and Number of Adults and Children in the Family
Families with 4 or More Adults Boston Essex Middlesex Norfolk Plymouth Bristol1 Kid Under 6 59,380 57,034 65,796 60,519 60,519 50,9921 Kid Over 6 59,380 57,034 65,796 60,519 60,519 50,9922 Kids Under 6 65,896 63,293 73,016 67,161 67,161 56,5882 Kids Over 6 65,896 63,293 73,016 67,161 67,161 56,5882 Kids: 1 Under 1 Over 6 65,896 63,293 73,016 67,161 67,161 56,5883 Kids Under 6 72,204 69,352 80,006 73,590 73,590 62,0043 Kids Over 6 72,204 69,352 80,006 73,590 73,590 62,0043 Kids: 1 Under, 2 Over 6 72,204 69,352 80,006 73,590 73,590 62,0043 Kids: 2 Under, 1 Over 6 72,204 69,352 80,006 73,590 73,590 62,0044 Or More Kids 78,333 75,239 86,797 79,837 79,837 67,268
In bold is a base group

98
Table B-1 (Continued):Family Economic Self-Sufficiency Standards for Families in MassachusettsCounties by Family Type and Number of Adults and Children in the Family
Adults, No Children BaDuNan* Worcester Hampden Hampshire Franklin Berkshire Suffolk1 Adult 16,637 15,736 14,840 14,959 14,495 13,651 18,5772 Adults 27,980 26,465 24,958 25,158 24,378 22,958 31,2433 Adults 37,924 35,870 33,828 34,099 33,041 31,118 42,3464 Adults 47,057 44,508 41,974 42,310 40,998 38,611 52,5445 Adult 55,629 52,616 49,621 50,018 48,467 45,645 62,1166 Adult 63,781 60,326 56,891 57,348 55,569 52,333 71,2187 Adults 71,606 67,728 63,871 64,384 62,386 58,754 79,955
Single Parent Families (1 Adult Present)1 Kid Under 6 33,606 30,707 29,209 29,401 29,355 26,830 37,1511 Kid Over 6 21,647 21,313 20,014 20,133 20,013 18,497 25,7232 Kid Under 6 43,514 39,760 37,821 38,069 38,010 34,740 48,1042 Kid Over 6 28,029 27,597 25,915 26,069 25,913 23,950 33,3072 Kids: 1 Under 1 Over 6 38,616 36,285 34,384 34,575 34,873 31,677 44,1963 Kids Under 6 52,722 48,174 45,824 46,125 46,053 42,092 58,2843 Kids Over 6 33,961 33,437 31,399 31,585 31,397 29,019 40,3553 Kids: 1 Under, 2 Over 6 46,788 43,964 41,660 41,892 42,253 38,380 53,5493 Kids: 2 Under, 1 Over 6 46,788 43,964 41,660 41,892 42,253 38,380 53,5494 Or More Kids 54,519 51,228 48,544 48,814 49,235 44,722 62,397
Married Couple Families (2 Adults Present)1 Kid Under 6 36,761 34,821 33,208 33,359 33,598 30,926 40,8191 Kid Over 6 36,761 34,821 33,208 33,359 33,598 30,926 40,8192 Kid Under 6 43,699 41,393 39,476 39,655 39,940 36,763 48,5232 Kid Over 6 43,699 41,393 39,476 39,655 39,940 36,763 48,5232 Kids: 1 Under 1 Over 6 43,699 41,393 39,476 39,655 39,940 36,763 48,5233 Kids Under 6 50,287 47,632 45,426 45,632 45,960 42,305 55,8383 Kids Over 6 50,287 47,632 45,426 45,632 45,960 42,305 55,8383 Kids: 1 Under, 2 Over 6 50,287 47,632 45,426 45,632 45,960 42,305 55,8383 Kids: 2 Under, 1 Over 6 50,287 47,632 45,426 45,632 45,960 42,305 55,8384 Or More Kids 56,598 53,610 51,127 51,359 51,728 47,614 62,845
Families with 3 Adults1 Kid Under 6 46,561 44,103 42,060 42,251 42,555 39,170 51,7001 Kid Over 6 46,561 44,103 42,060 42,251 42,555 39,170 51,7002 Kid Under 6 53,022 50,223 47,897 48,114 48,460 44,606 58,8752 Kid Over 6 53,022 50,223 47,897 48,114 48,460 44,606 58,8752 Kids: 1 Under 1 Over 6 53,022 50,223 47,897 48,114 48,460 44,606 58,8753 Kids Under 6 59,230 56,104 53,506 53,748 54,134 49,829 65,7683 Kids Over 6 59,230 56,104 53,506 53,748 54,134 49,829 65,7683 Kids: 1 Under, 2 Over 6 59,230 56,104 53,506 53,748 54,134 49,829 65,7683 Kids: 2 Under, 1 Over 6 59,230 56,104 53,506 53,748 54,134 49,829 65,7684 Or More Kids 65,229 61,785 58,924 59,191 59,617 54,875 72,429

99
Table B-1 (Continued):Family Economic Self-Sufficiency Standards for Families in Massachusetts Counties by
Family Type and Number of Adults and Children in the Family
Families with 4 or More Adults BaDuNan* Worcester Hampden Hampshire Franklin Berkshire Suffolk1 Kid Under 6 55,711 52,770 50,326 50,554 50,918 46,868 61,8611 Kid Over 6 55,711 52,770 50,326 50,554 50,918 46,868 61,8612 Kid Under 6 61,825 58,561 55,849 56,102 56,506 52,011 68,6492 Kid Over 6 61,825 58,561 55,849 56,102 56,506 52,011 68,6492 Kids: 1 Under 1 Over 6 61,825 58,561 55,849 56,102 56,506 52,011 68,6493 Kids Under 6 67,743 64,167 61,195 61,473 61,915 56,990 75,2213 Kids Over 6 67,743 64,167 61,195 61,473 61,915 56,990 75,2213 Kids: 1 Under, 2 Over 6 67,743 64,167 61,195 61,473 61,915 56,990 75,2213 Kids: 2 Under, 1 Over 6 67,743 64,167 61,195 61,473 61,915 56,990 75,2214 Or More Kids 73,493 69,614 66,390 66,691 67,170 61,828 81,606
In bold is a base group *BaDuNan represents Barnstable, Duke and Nantucket Counties

100
Appendix C: A Graphical Portrait of the Incidence of Poverty, Low Income,and Family Economic Self-Sufficiency Challenges among Families in
Massachusetts Counties in 1999
Income inadequacy challenges of families can be defined and measured from a variety of
different perspectives. In the main body of this monograph, we presented estimates of the
incidence of income inadequacy challenges among Massachusetts families from three different
vantage points: the official poverty lines of the federal government, twice the poverty line as a
proxy for low incomes, and the Family Economic Self-Sufficiency Standards of the Women’s
Educational and Industrial Union. To our knowledge, this is the first time that any study has ever
attempted to estimate the number and per cent of families in a given state that experienced each
of the three types of income inadequacy challenges.
In the body of the text, we presented estimates of the per cent of families in each county
of the state that experienced poverty, low income, and Family Economic Self-Sufficiency
challenges during calendar year 1999. Given the increasingly higher family income levels used
to define these challenges as we progress from the poverty income thresholds to the FESS
thresholds, the fraction of families experiencing these income inadequacy challenges in each
county of the state rises. The key research question is the following: “How much higher is the
incidence of Family Economic Self-Sufficiency deficits than low income or poverty challenges
among families in each county?” In this appendix, we provide a set of bar graphs that
specifically answer this key research question for each county.
For each county of the state, we provide a graphical display of the per cent of family
households that were estimated to be poor, low income, or unable to achieve an annual income
equal to the Self-Sufficiency standard for a family of its given size and age composition in
calendar year 1999.80 These findings allow us to identify for the first time the incidence of such
income inadequacy challenges for each of these three income standards. For the state as whole,
the share of families experiencing these challenges in 1999 ranged from a low of less than 7 per
cent for the poverty challenge, to 17 per cent for low income challenges, to a high of 26 per cent
for FESS income deficit challenges. There were nearly four times as many families experiencing
a FESS income deficit as there were poor families in the state during 1999.

101
To illustrate the size of the relative differences between the poverty rates of families by
county in 1999 and the share of families with a FESS deficit in the same counties, we constructed
the following table. For each county, we present estimates of the poverty rate of families in
calendar year 1999 and the share of families in the same county who were unable to achieve the
Family Economic Self-Sufficiency Standard. The ratio of the incidence of income inadequacy
challenges based on the FESS standards to the family poverty rate is displayed under Column C.
For each of the twelve counties, the share of families unable to achieve economic self-sufficiency
during calendar year 1999 was a substantial multiple of the per cent of families with an income
below the official poverty line. The size of these multiples ranged from lows of 2.4 in Hampden
County and 2.8 in Franklin County to highs of 6.9 in Norfolk County and 7.3 in Plymouth
County. The latter results indicate that families in Norfolk and Plymouth counties found it much
more difficult to achieve Economic Self-Sufficiency than to escape from poverty in 1999.
Table C-1:The Poverty Rate and the Incidence of Family Economic Self-Sufficiency
Deficits among Massachusetts Families by County in 1999(in %)
County
(A)
PovertyRate
(B)
Self-SufficiencyIncome Deficits
(C )
Col. B/Col. A
Barnstable, Dukes, Nantucket 4.7 24.5 5.2Berkshire 6.5 22.7 3.5Bristol 7.8 21.4 3.0Essex 6.6 24.2 3.7Franklin 6.5 17.9 2.8Hampden 11.4 27.8 2.4Hampshire 5.1 33.8 6.6Middlesex 4.3 25.0 5.8Norfolk 2.9 20.1 6.9Plymouth 4.9 36.0 7.3Suffolk 14.9 46.8 3.1Worcester 6.3 22.3 3.5
During the decade of the 1990s, the state failed to make any progress in reducing the
incidence of poverty or low income challenges among the state’s families, and both poverty and
low income challenges have increased since 2000. While similar estimates of Family Economic
80 The counties of Barnstable, Dukes, and Nantucket were combined for purposes of this analysis. The PUMS datafiles from the 2000 Census do not allow us to separately identify residents of Dukes and Nantucket Counties fromthose of Barnstable County.

102
Self-Sufficiency deficits for 1989 are not available at this time, it is quite likely, given the rising
relative costs of housing and child care over the 1990s, that there was no progress in reducing the
incidence of FESS deficits among families over the past decade. Given the economic declines
throughout the state since 2000, it is very likely that the number of families experiencing a FESS
deficit challenges have increased since 1999. Clearly, a major challenge for the state in the
current decade is to formulate a comprehensive set of economic development, workforce
development, and social support programs that will facilitate a sustained reduction in poverty and
low income challenges and reduce Family Economic Self-Sufficiency deficits in the years ahead.

103
Comparisons of the Per Cent of Families that Were Poor, Low Income, orUnable to Achieve Economic Self-Sufficiency in Selected Counties, 1999
4.7
6.5
14.7
20.6
24.5
22.7
0
5
10
15
20
25
30
Barnstable, Dukes, and Nantucket Berkshire
PoorLow IncomeUnable to Achieve Economic Self-Sufficiency
Comparisons of the Per Cent of Families that Were Poor, Low Income, orUnable to Achieve Economic Self-Sufficiency in Selected Counties, 1999
7.86.6
21.9
16.8
21.4
24.2
0
5
10
15
20
25
30
Bristol Essex
PoorLow Income
Unable to Achieve Economic Self-Sufficiency

104
Comparisons of the Per Cent of Families that Were Poor, Low Income, orUnable to Achieve Economic Self-Sufficiency in Selected Counties, 1999
6.5
11.4
18.9
24.0
17.9
27.8
0
5
10
15
20
25
30
Franklin Hampden
PoorLow IncomeUnable to Achieve Economic Self-Sufficiency
Comparisons of the Per Cent of Families that Were Poor, Low Income, orUnable to Achieve Economic Self-Sufficiency in Selected Counties, 1999
5.1 4.3
12.711.6
33.8
25.0
0
5
10
15
20
25
30
35
40
Hampshire Middlesex
PoorLow IncomeUnable to Achieve Economic Self-Sufficiency

105
Comparisons of the Per Cent of Families that Were Poor, Low Income, orUnable to Achieve Economic Self-Sufficiency in Selected Counties, 1999
2.94.9
8.5
13.8
20.1
36.0
0
5
10
15
20
25
30
35
40
Norfolk Plymouth
PoorLow IncomeUnable to Achieve Economic Self-Sufficiency
Comparisons of the Per Cent of Families that Were Poor, Low Income, orUnable to Achieve Economic Self-Sufficiency in Selected Counties, 1999
14.9
6.3
32.1
18.2
46.8
22.3
0
5
10
15
20
25
30
35
40
45
50
Suffolk Worcester
PoorLow IncomeUnable to Achieve Economic Self-Sufficiency
106
Appendix D: Estimates of the Per Cent of Families in Massachusetts with aFamily Income below the Family Economic Self-Sufficiency Standard by
County and Type of Family, 1999
We have estimated the number and per cent of families in each of the counties of
Massachusetts with incomes below the self-sufficiency standard. These estimates are provided
for all families and for four different types of families cross-classified by the nativity status of the
family householder in each of the12 counties. The four family types are the following:
� Two or more adults, no children under 18
� One adult, one or more children under 18
� Two adults, one or more children under 18
� Three or more adults, one or more children under 18.
Estimates for 96 subsets of families in Massachusetts are displayed in Table D1.
The labels of the table should be interpreted as follows:
Mean = Per cent of families with an income below the Family Economic Self-Sufficiency
standard in 1999.
Sum = Number of families with a family income below the Family Economic Self-
Sufficiency standard in 1999
Total = Total Number of families in that subgroup in 1999.

107
Table D1:Number and Per Cent of Families in Massachusetts
With a Family Income below the Family Economic Self-Sufficiency Standard by County, 1999
Native Born Foreign Born TotalBoston City Mean Sum Count Mean Sum Count Mean Sum CountAdults, No Children 0.229 8,352 36,409 0.423 7,825 18,504 0.295 16,177 54,9131 Adult, One or More Children Under 18 0.772 9,649 12,498 0.869 6,850 7,881 0.810 16,499 20,3792 Adults with One or More Children Under 18 0.363 5,553 15,312 0.608 8,326 13,689 0.479 13,879 29,0013 or More Adults with One or More Children
Under 180.487 2,361 4,853 0.581 4,701 8,094 0.545 7,062 12,947
Total 0.375 25,915 69,072 0.575 27,702 48,168 0.457 53,617 117,240Barnstable, Dukes, and Nantucket CountiesAdults, No Children 0.177 6,676 37,657 0.237 518 2,185 0.181 7,194 39,8421 Adult, One or More Children Under 18 0.567 2,938 5,185 0.627 232 370 0.571 3,170 5,5552 Adults with One or More Children Under 18 0.261 4,548 17,436 0.457 561 1,227 0.274 5,109 18,6633 or More Adults with One or More Children
Under 180.280 865 3,085 0.881 126 143 0.307 991 3,228
Total 0.237 15,027 63,363 0.366 1,437 3,925 0.245 16,464 67,288Berkshire CountyAdults, No Children 0.143 2,282 15,940 0.154 88 572 0.144 2,370 16,5121 Adult, One or More Children Under 18 0.608 2,335 3,839 0.776 118 152 0.615 2,453 3,9912 Adults with One or More Children Under 18 0.206 1,732 8,415 0.439 144 328 0.215 1,876 8,7433 or More Adults with One or More Children
Under 180.164 262 1,601 0.840 42 50 0.184 304 1,651
Total 0.222 6,611 29,795 0.356 392 1,102 0.227 7,003 30,897Bristol CountyAdults, No Children 0.152 8,221 54,076 0.255 1,741 6,839 0.164 9,962 60,9151 Adult, One or More Children Under 18 0.586 7,011 11,960 0.743 889 1,197 0.600 7,900 13,1572 Adults with One or More Children Under 18 0.260 1,406 5,400 0.167 6,306 37,831 0.178 7,712 43,2313 or More Adults with One or More Children
Under 180.140 1,202 8,607 0.298 627 2,107 0.171 1,829 10,714
Total 0.223 17,840 80,043 0.199 9,563 47,974 0.214 27,403 128,017Essex CountyAdults, No Children 0.139 10,899 78,543 0.332 3,731 11,236 0.163 14,630 89,7791 Adult, One or More Children Under 18 0.612 8,476 13,857 0.850 4,742 5,582 0.680 13,218 19,4392 Adults with One or More Children Under 18 0.154 7,784 50,591 0.513 5,262 10,258 0.214 13,046 60,8493 or More Adults with One or More Children
Under 180.137 1,489 10,853 0.530 2,657 5,016 0.261 4,146 15,869
Total 0.186 28,648 153,844 0.511 16,392 32,092 0.242 45,040 185,936Franklin CountyAdults, No Children 0.096 901 9,341 0.368 324 880 0.120 1,225 10,2211 Adult, One or More Children Under 18 0.423 826 1,953 0.212 24 113 0.411 850 2,0662 Adults with One or More Children Under 18 0.154 826 5,353 0.351 286 815 0.180 1,112 6,1683 or More Adults with One or More Children
Under 180.152 189 1,243 0.526 223 424 0.247 412 1,667
Total 0.153 2,742 17,890 0.384 857 2,232 0.179 3,599 20,122

108
Table D1 (Continued):Number and Per Cent of Families in Massachusetts
With a Family Income below the Family Economic Self-Sufficiency Standard by County, 1999
Native Born Foreign Born TotalHampden County Mean Sum Count Mean Sum Count Mean Sum CountAdults, No Children 0.134 6,851 51,083 0.333 2,457 7,372 0.159 9,308 58,4551 Adult, One or More Children Under 18 0.643 8,728 13,579 0.842 3,481 4,135 0.689 12,209 17,7142 Adults with One or More Children Under 18 0.205 6,634 32,314 0.545 3,498 6,417 0.262 10,132 38,7313 or More Adults with One or More Children
Under 180.197 1,316 6,694 0.588 1,514 2,576 0.305 2,830 9,270
Total 0.227 23,529 103,670 0.534 10,950 20,500 0.278 34,479 124,170Hampshire CountyAdults, No Children 0.137 1,593 11,647 0.432 790 1,827 0.177 2,383 13,4741 Adult, One or More Children Under 18 0.687 2,156 3,137 0.854 1,189 1,392 0.739 3,345 4,5292 Adults with One or More Children Under 18 0.297 1,800 6,055 0.644 999 1,551 0.368 2,799 7,6063 or More Adults with One or More Children
Under 180.204 216 1,059 0.667 525 787 0.401 741 1,846
Total 0.263 5,765 21,898 0.630 3,503 5,557 0.338 9,268 27,455Middlesex CountyAdults, No Children 0.172 26,855 156,398 0.285 8,929 31,310 0.191 35,784 187,7081 Adult, One or More Children Under 18 0.597 14,777 24,735 0.755 4,755 6,298 0.629 19,532 31,0332 Adults with One or More Children Under 18 0.197 19,691 100,158 0.414 10,223 24,687 0.240 29,914 124,8453 or More Adults with One or More Children
Under 180.220 4,422 20,109 0.412 3,548 8,612 0.277 7,970 28,721
Total 0.218 65,745 301,400 0.387 27,455 70,907 0.250 93,200 372,307Norfolk CountyAdults, No Children 0.169 11,661 68,944 0.244 2,322 9,499 0.178 13,983 78,4431 Adult, One or More Children Under 18 0.563 5,250 9,333 0.614 615 1,002 0.567 5,865 10,3352 Adults with One or More Children Under 18 0.136 6,485 47,592 0.320 2,296 7,166 0.160 8,781 54,7583 or More Adults with One or More Children
Under 180.154 1,496 9,687 0.423 1,165 2,756 0.214 2,661 12,443
Total 0.184 24,892 135,556 0.313 6,398 20,423 0.201 31,290 155,979Plymouth CountyAdults, No Children 0.269 12,509 46,486 0.430 3,385 7,866 0.292 15,894 54,3521 Adult, One or More Children Under 18 0.750 8,342 11,122 0.916 2,466 2,691 0.782 10,808 13,8132 Adults with One or More Children Under 18 0.277 8,250 29,750 0.483 2,737 5,670 0.310 10,987 35,4203 or More Adults with One or More Children
Under 180.233 1,660 7,123 0.536 1,596 2,979 0.322 3,256 10,102
Total 0.326 30,761 94,481 0.530 10,184 19,206 0.360 40,945 113,687Suffolk CountyAdults, No Children 0.251 11,508 45,793 0.461 10,008 21,708 0.319 21,516 67,5011 Adult, One or More Children Under 18 0.742 10,881 14,671 0.855 7,575 8,860 0.784 18,456 23,5312 Adults with One or More Children Under 18 0.382 7,060 18,494 0.647 10,453 16,155 0.505 17,513 34,6493 or More Adults with One or More Children
Under 180.461 2,912 6,312 0.604 5,943 9,836 0.548 8,855 16,148
Total 0.380 32,361 85,270 0.601 33,979 56,559 0.468 66,340 141,829

109
Table D1 (Continued):Number and Per Cent of Families in Massachusetts
With a Family Income below the Family Economic Self-Sufficiency Standard by County, 1999
Native Born Foreign Born TotalWorcester CountyAdults, No Children 0.153 12,690 83,196 0.314 2,375 7,559 0.166 15,065 90,7551 Adult, One or More Children Under 18 0.564 9,762 17,323 0.762 2,199 2,886 0.592 11,961 20,2092 Adults with One or More Children Under 18 0.165 9,590 58,087 0.428 2,884 6,738 0.192 12,474 64,8253 or More Adults with One or More Children
Under 180.163 1,823 11,214 0.380 969 2,550 0.203 2,792 13,764
Total 0.199 33,865 169,820 0.427 8,427 19,733 0.223 42,292 189,553

110
Native Born Foreign Born TotalMassachusetts Mean Sum Count Mean Sum Count Mean Sum CountAdults, No Children 0.171 112,646 659,104 0.337 36,668 108,853 0.194 149,314 767,9571 Adult, One or More Children Under 18 0.623 81,482 130,694 0.816 28,285 34,678 0.664 109,767 165,3722 Adults with One or More Children Under 18 0.200 75,806 379,645 0.384 45,649 118,843 0.244 121,455 498,4883 or More Adults with One or More Children
Under 180.204 17,852 87,587 0.500 18,935 37,836 0.293 36,787 125,423
Total 0.229 287,786 1,257,030 0.431 129,537 300,210 0.268 417,323 1,557,240

111
Appendix E: Estimates of the Mean and Aggregate Size of the FamilyEconomic Self-Sufficiency Deficits of Massachusetts Families by County and
Family Type in 1999
In the main body of this monograph, we presented estimates of the mean size and
aggregate value of the poverty income and FESS income deficits of families in Massachusetts
during 1999. In this Appendix, we provide estimates of the mean size and aggregate values of
the FESS income deficits for all families and for the following four types of families in the city
of Boston and each county of the state during 1999:81
� Families with adult members (18+) only
� Single parent families with one or more related children under 18 in the home
� Families with two adults and one or more children under 18
� Families with three or more adults and one or more children under 18
For each county, we estimated the number of families with a FESS deficit during 1999
and the mean value of those deficits. By multiplying the mean deficit by the number of families
with a deficit, we obtain estimates of the aggregate value of these deficits. These estimates are
first derived for each of the four subsets of families in each county and then aggregated to derive
the aggregate value of these FESS deficits in the county. The values of the aggregate FESS
deficits for the twelve counties are combined to form the estimate for the state. The estimated
aggregate value of these FESS deficits for all families in the state during 1999 was $7.08
billion.82
81 The counties of Barnstable, Dukes, and Nantucket have been combined for this analysis. They cannot beseparately identified on the PUMS public use files.82 This estimate pertains only to family households. It excludes the FESS deficits of unrelated individuals in the stateduring 1999.

112
Table E-1:Mean and Aggregate FESS Income Deficits for Families with Incomes
Below the Family Economic Self-Sufficiency Standard, by Type of Family and County
Boston CityMeanDeficit
Sum ofDeficits
Number ofFamilies with
a DeficitAdults Only, No Children $15,064 $243,683,183 16,177Single Parent Families, One or More Children Under 18 $26,961 $444,821,739 16,4992 Adult Families, One or More Children Under 18 $22,377 $310,567,813 13,8793+ Adult Families, One or More Children Under 18 $24,238 $171,168,744 7,062Total $21,826 $1,170,241,479 53,617EssexAdults Only, No Children $11,216 $164,088,835 14,630Single Parent Families, One or More Children Under 18 $21,490 $284,055,768 13,2182 Adult Families, One or More Children Under 18 $18,001 $234,836,617 13,0463+ Adult Families, One or More Children Under 18 $21,127 $87,594,301 4,146Total $17,109 $770,575,521 45,040MiddlesexAdults Only, No Children $12,950 $463,389,083 35,784Single Parent Families, One or More Children Under 18 $22,819 $445,694,357 19,5322 Adult Families, One or More Children Under 18 $19,052 $569,930,701 29,9143+ Adult Families, One or More Children Under 18 $20,552 $163,795,765 7,970Total $17,627 $1,642,809,906 93,200NorfolkAdults Only, No Children $11,363 $158,892,050 13,983Single Parent Families, One or More Children Under 18 $19,654 $115,269,480 5,8652 Adult Families, One or More Children Under 18 $15,510 $136,189,784 8,7813+ Adult Families, One or More Children Under 18 $18,077 $48,102,345 2,661Total $14,652 $458,453,660 31,290PlymouthAdults Only, No Children $13,808 $219,462,503 15,894Single Parent Families, One or More Children Under 18 $23,357 $252,437,640 10,8082 Adult Families, One or More Children Under 18 $18,447 $202,674,663 10,9873+ Adult Families, One or More Children Under 18 $19,276 $62,762,598 3,256Total $18,008 $737,337,403 40,945BristolAdults Only, No Children $9,620 $95,836,603 9,962Single Parent Families, One or More Children Under 18 $17,309 $136,737,157 7,9002 Adult Families, One or More Children Under 18 $13,965 $107,701,353 7,7123+ Adult Families, One or More Children Under 18 $15,091 $27,600,900 1,829Total $13,425 $367,876,013 27,403

113
Table E-1 (Continued):Mean and Aggregate FESS Income Deficits for Families with Incomes
Below the Family Economic Self-Sufficiency Standard, by Type of Family and County
Barnstable, Dukes and NantucketMeanDeficit
Sum ofDeficit
Number ofFamilies with
a DeficitAdults Only, No Children $9,783 $70,380,170 7,194Single Parent Families, One or More Children Under 18 $17,937 $56,859,459 3,1702 Adult Families, One or More Children Under 18 $13,849 $70,754,007 5,1093+ Adult Families, One or More Children Under 18 $14,158 $14,030,567 991Total $12,878 $212,024,203 16,464WorcesterAdults Only, No Children $10,213 $153,852,890 15,065Single Parent Families, One or More Children Under 18 $18,508 $221,370,376 11,9612 Adult Families, One or More Children Under 18 $15,428 $192,451,701 12,4743+ Adult Families, One or More Children Under 18 $15,785 $44,070,679 2,792Total $14,465 $611,745,645 42,292HampdenAdults Only, No Children $9,626 $89,600,575 9,308Single Parent Families, One or More Children Under 18 $19,742 $241,026,081 12,2092 Adult Families, One or More Children Under 18 $16,545 $167,633,469 10,1323+ Adult Families, One or More Children Under 18 $19,558 $55,348,276 2,830Total $16,056 $553,608,401 34,479HampshireAdults Only, No Children $9,192 $21,905,153 2,383Single Parent Families, One or More Children Under 18 $22,095 $73,907,144 3,3452 Adult Families, One or More Children Under 18 $16,478 $46,122,856 2,7993+ Adult Families, One or More Children Under 18 $17,036 $12,623,965 741Total $16,677 $154,559,117 9,268FranklinAdults Only, No Children $10,098 $12,370,203 1,225Single Parent Families, One or More Children Under 18 $12,756 $10,842,285 8502 Adult Families, One or More Children Under 18 $11,918 $13,253,214 1,1123+ Adult Families, One or More Children Under 18 $12,780 $5,265,498 412Total $11,595 $41,731,200 3,599BerkshireAdults Only, No Children $7,422 $17,589,953 2,370Single Parent Families, One or More Children Under 18 $15,127 $37,105,942 2,4532 Adult Families, One or More Children Under 18 $13,383 $25,106,196 1,8763+ Adult Families, One or More Children Under 18 $13,127 $3,990,557 304Total $11,965 $83,792,648 7,003

114
Table E-1 (Continued):Mean and Aggregate FESS Income Deficits for Families with Incomes
Below the Family Economic Self-Sufficiency Standard, by Type of Family and County
SuffolkMeanDeficit
Sum ofDeficit
Number ofFamilies with
a DeficitAdults Only, No Children $15,762 $339,131,700 21,516Single Parent Families, One or More Children Under 18 $25,862 $477,314,380 18,4562 Adult Families, One or More Children Under 18 $22,782 $398,974,404 17,5133+ Adult Families, One or More Children Under 18 $26,085 $230,982,369 8,855Total $21,803 $1,446,402,853 66,340MassachusettsAdults Only, No Children $12,099 $1,806,499,716 149,314Single Parent Families, One or More Children Under 18 $21,433 $2,352,620,069 109,7672 Adult Families, One or More Children Under 18 $17,831 $2,165,628,965 121,4553+ Adult Families, One or More Children Under 18 $20,555 $756,167,818 36,787Total $16,967 $7,080,916,569 417,323