treasure coast economic development … portal/formatted ceds-six...treasure coast economic...
TRANSCRIPT
TREASURE COAST
ECONOMIC DEVELOPMENT
DISTRICT
Comprehensive Economic
Development Strategy
2012 - 2017
August 13, 2012
This document was prepared under a financial assistance award (04-83-06494)
from the U.S. Economic Development Administration
Treasure Coast Regional Planning Council
421 SW Camden Avenue
Stuart, Florida 34994
(772) 221-4060
Email: [email protected]
Website: www.tcrpc.org
Comprehensive Economic Development Strategy 2012 -2017 – Draft 08-13-2012
Treasure Coast Regional Planning Council
2
Table of Contents
Acknowledgements………………………………………………………………….
3
Preface ………………………………………………………………………………
4
Executive Summary………………………………………………………………….
5
Introduction ………………………………………………………………………….
10
STRATEGY REPORT A. Background
Part I: Economic Profile …………………………………………………………..
a. Overview
b. Demographic Trends
c. Employment, Income and Wage Trends
d. Industry Trends
13
Part II: Sustainability……………………………………………………………….
a. Overview
b. Quality of Place and Economic Development
c. Infrastructure
d. Climate Change and Energy
e. Environment
33
Part III: Cluster Industry Profile…………………………………………………..
a. Overview
b. Cluster Identification and Analysis
48
Part IV: Measuring Regional Innovation…………………………………………..
55
Part V: Regional SWOT Analysis………………………………………………….
62
B. CEDS Goals and Objectives…………………………………………………….
63
C. Community and Private Sector Participation………………………………….
65
D. Strategic Projects, Programs, and Activities…………………………………..
66
E. Action Plan ……………………………………………………………………… 70
TECHNICAL APPENDIX
A. Detailed Cluster Analysis……………………………………………………….
72
B. Performance Measures …………………………………………………………
83
C. Past, Present and Projected Future Economic Development Investments…..
84
D. Integrating the CEDS with State and Regional Economic Development
Priorities……………………………………………………………………………..
84
E. Map Series………………………………………………………………………..
85
F. Other (TBD)……………………………………………………………………… 90
G. Bibliography……………………………………………………………………...
Comprehensive Economic Development Strategy 2012 -2017 – Draft 08-13-2012
Treasure Coast Regional Planning Council
3
ACKNOWLEDGEMENTS
The Treasure Coast Regional Planning Council would like to thank the members of the Comprehensive
Economic Development Strategy (CEDS) Committee for their input during the preparation of this
document.
A special thanks also to _________________ for their support during the preparation of this document.
Further information on this economic development plan may be obtained by contacting Mr. Greg Vaday,
Economic Development Coordinator, Treasure Coast Regional Planning Council at (772) 221-4060 or
email [email protected].
Contributing Committee Members
PALM BEACH COUNTY
Members Sherry Howard
Gary Hines
Tony Brown
Seabron Smith
Paul Skyers
Steve Craig
Alternates Doug Saenz
Carol Thompson
INDIAN RIVER COUNTY
Members Mark Mathes
Rich Stringer
Helene Caseltine
Randy Riley
Glenn Heran
MARTIN COUNTY
Members Tammy Simoneau
Anthony Parkinson
Tim Dougher
Pauline Becker
Linda Hake
Alternates Debbie Lewandowski
Ed Maxwell
Tobin Overdorf
Kathie Smith
Melissa Corbett
ST. LUCIE COUNTY
Members Derrik Moore
Teri Pinney
Michael Corbit
Harold Smyth
Nate Bray
Alternates Howard Fein
Larry Pelton
Comprehensive Economic Development Strategy 2012 -2017 – Draft 08-13-2012
Treasure Coast Regional Planning Council
4
PREFACE
THE TREASURE COAST REGIONAL PLANNING COUNCIL, in partnership with its
local governments, businesses, nonprofit and community leadership, has developed this
Comprehensive Economic Development Strategy (CEDS) to help the Region achieve long-term
economic sustainability and regional competitiveness.
This CEDS was developed in cooperation with a standing committee comprised of organizations,
business leaders and individuals from throughout the Treasure Coast Region committed to
helping develop a sustainable regional economy. The year-long CEDS strategy development
process began with an in-depth economic analysis of the Region. This was followed by several
months of meetings to identify the salient strengths and weaknesses in the Region’s economy
and opportunities and threats that needed to be addressed to move forward. The net result of this
planning process was not only the preparation of this regional economic development strategy,
but the creation of an important regional collaborative mechanism to engage the Region’s
leadership.
The partners that have helped to create this strategy document recognize the Region’s long-term
sustainability and quality of life are tied into the larger global economy and the Region’s
economy must be focused on expanding economic diversity and enhancing innovation. This
became evident as the community’s leadership recognized how the Region’s most dynamic
industrial sectors – agriculture, tourism, construction, emerging life science, and research and
development clusters are affected not only by local economic conditions but national and
international economic trends as well. The deleveraging effects of the Great Recession have
significantly dampened per capita income, small business lending and labor mobility to the
detriment of the Region’s economic growth prospects. Simply put, the Region needs to lay the
foundations for a regionally competitive economy that produces the high demand goods and
services the world wants.
Comprehensive Economic Development Strategy 2012 -2017 – Draft 08-13-2012
Treasure Coast Regional Planning Council
5
EXECUTIVE SUMMARY
The Treasure Coast Region is well known for its beautiful Atlantic beaches and its high quality
of life. From Boca Raton in the south, the Region stretches 100 miles north to the Sebastian
Inlet, and from the Atlantic Ocean west to Lake Okeechobee. While recognized for its upscale
communities along the ocean, the Region’s population is primarily located in historic mainland
cities such as Boca Raton, Delray Beach, West Palm Beach, Riviera Beach, Stuart, Fort Pierce,
and Vero Beach, and in rapidly growing “suburban” communities such as Port St. Lucie, Jupiter,
Palm Beach Gardens, and Sebastian.
Although the Region houses a permanent population of 1.9 million and devotes over one million
acres to agricultural uses, it also contains a significant number of important natural resources.
Examples include the Loxahatchee National Wildlife Refuge, Lake Okeechobee, Loxahatchee
National Wild and Scenic River, the J.W. Corbett Wildlife Management Area, Indian River
Lagoon, Lake Worth Lagoon, St. Lucie River, Savannas (the largest remaining coastal
freshwater wetland on the Atlantic Coast) and St. John’s Marsh.
Robust population growth in the 1990s and the mid 2000s was the primary engine of regional
economic growth. During the period of 1990 to 2006, the Region’s average annual rate of
population growth was 2.5 percent, outpacing statewide growth of about 2.1 percent and
significantly outpacing national growth of about 1.1 percent. Equally important was the pace of
employment growth which mirrored the rate of population growth, averaging 2.5 percent per
year. The Region’s engine fueled heavily by tourism, agriculture, and the development of new
communities to meet the needs of a rapidly expanding population coupled with increasing
consumer demand for goods and services seemed a trend that would continue apace for quite
some time.
During this period of rapid population and employment growth, the Region’s leadership took
important steps to define and enhance emerging industry clusters such as aerospace/engineering,
aquaculture and marine-related industries. Significantly, in November 2003, then Governor Jeb
Bush signed into law a historic piece of legislation that laid the framework for the Scripps
Research Institute to expand its world-renowned scientific research and endeavors into Florida.
Scripps Florida, which began operations in Jupiter in 2005, became an important milestone on
the road to putting Florida and the Treasure Coast Region at the forefront of biomedical research
and development. Since the advent of Scripps, life science research institutes such as Torrey
Pines Institute for Molecular Studies, Max Planck Florida Institute and the Vaccine and Gene
Therapy Institute of Florida have significantly influenced and lead the growth and development
of the life sciences cluster in the Treasure Coast Region.
When TCRPC released its Comprehensive Economic Development Strategy 2007-2012
population and employment growth rates were expected to trend moderately lower than the high-
growth rate period of the previous ten years, landing somewhere around 2.0 percent. That CEDS
noted …. “This level of population growth should translate into healthy growth in the Region’s
local cluster industries such as retail trade, professional and business services and education and
health services…”
Comprehensive Economic Development Strategy 2012 -2017 – Draft 08-13-2012
Treasure Coast Regional Planning Council
6
By the time the national recession officially began in December 2007, the relative strength of the
Region’s economy began to show softness as reflected by increases in the year over year
unemployment rate in all four of the Region’s counties and a decline for the first time since the
year 2000 in the median sales price for existing single family homes. By 2010, the Region’s
unemployment rate stood at 12.2% with St. Lucie and Indian River Counties experiencing the
highest rates of unemployment at 14.1% and 14.0% respectively.
Against the backdrop of the Great Recession and looking ahead over the next five years (2012 to
2017), this CEDS Plan attempts to gauge the existing health of the Region’s economy and its
future outlook. The analysis of data presented in the plan, along with findings from in-depth
discussions about Regional strengths, weaknesses, opportunities and threats reveals a Region
with a unique set of attributes – its industries, cities and towns and related quality of life/place,
climate, geography, talent, diversity and resources (both financial and intellectual); its growth
prospects and its innovative capacity.
All of these attributes can be effectively harnessed to put the Region on the path to economic
sustainability provided the Region’s collective leadership makes strategic investments and policy
decisions to shore up the Region’s economic base, its educational foundations, its multi-faceted
infrastructure network and most importantly, its skill base to take advantage of new and
emerging economic opportunities nationally and abroad. In terms of the growth prospect
attribute, average annual population growth rates over the coming decade (2010 to 2020) are
projected to decrease to 1.1 from a high of 1.9 percent over the previous decade (2000 to 2010).
Ethnically, the Region’s population is expected to become increasingly diverse with Hispanics
making up almost 22 percent of the population by 2030 from about 17.5 percent in 2010. The
Region’s employment growth is expected to outpace the level for the state and the nation.
However, this strong employment growth will be tempered by growth in lower wage sectors of
the economy. Currently, almost 45 percent of the Region’s employment base earns wages that
are lower than the Region’s average annual wage of $43,237. In 2007, approximately one third
of all jobs in the Region paid wages lower than the annual average wage.
The CEDS examines the Region’s physical attributes or infrastructure attributes and suggests it
is critically important for the Region to develop, expand and maintain its multi-modal
transportation systems and telecommunications infrastructure to support its economy and allow it
to link directly to global markets and opportunities. The Region’s two deepwater ports, its
twelve airports (1 commercial, 11 general aviation), its freight and passenger rail system and its
roadway transportation networks all need to become more closely integrated to serve the needs
of growing a diverse economy and to deliver the goods and services produced by the Region’s
economy to a broader world market.
From a cluster industry perspective, the Region exhibits relative specialization in three industry
clusters – Arts, Entertainment, Recreation and Visitor Industries (a foundational cluster in many
ways), Life Sciences and Business and Financial Services. Continued strong growth is projected
for the former two clusters. They are classified as “Star” clusters with Business and Financial
Services projected to transition to a “Mature” cluster. As previously mentioned, the Region also
has a number of emerging industry clusters including aerospace/engineering (incorporated in the Defense
& Security cluster); marine-related industries (incorporated in the Transportation Equipment
Manufacturing subcluster) and aquaculture (incorporated in the Agribusiness, Food Processing and
Technology cluster).
Comprehensive Economic Development Strategy 2012 -2017 – Draft 08-13-2012
Treasure Coast Regional Planning Council
7
In terms of innovative capacity, this plan introduces a new web-based tool for comparing a
region’s innovation performance with that of the United States, a state or other regions. The
Innovation Index comprises two broad categories: inputs to innovation, which measure
innovation capacity, and outputs of innovation, which measure the results. The key for any
region’s economy is to translate its inputs – human capital and venture capital, for example, into
productive outcomes. The Treasure Coast Region scores ahead of the State of Florida with an
Innovation Index of 90.4 versus 86.5 but falls behind the nation by 10 percent and the State of
California by about 13 percent. It appears the Region’s lower levels of productivity affects its
overall innovation index score.
The Treasure Coast Region faces important challenges. As it slowly emerges from the negative
effects of the economic downturn and national recession – it needs to turn into a dynamic
economy. The current economy, long focused on tourism, agriculture and construction, must
now respond to the global challenge and compete in an increasingly interconnected world. The
current depression in the residential construction and tourism sectors, however temporary it may
be, highlights the importance of developing a dynamic economy to promote Regional economic
sustainability. If the Region’s leaders are truly concerned about economic sustainability and
facilitating the required transformation of the Region’s economy into one that is entrepreneurial
and innovative, that is dynamic– then regional collaboration and commitment is essential.
The Treasure Coast Region has taken important initial steps to develop an innovative economy,
but much more needs to be done. The key to the transformation is to focus on entrepreneurship
and innovation as the engine of regional competitiveness. The Region needs to re-energize its
educational foundations to ensure the future workforce can compete in a networked world and
find meaningful career opportunities and pathways. The Region’s leadership must focus not only
on smart growth, but should adopt a new paradigm of regional competitiveness. Finally, the
Region needs to form strong and sustainable networks to speed the process of innovation.
Without these actions the Region’s future is uncertain.
The TCRPC Comprehensive Economic Development Strategy 2012-2017 Plan serves as a
framework of ideas and a broad-based program of action to promote the long-term economic
sustainability of the Treasure Coast Region. It presents a comprehensive overview of our
Region’s economy illustrating significant trends in employment, wages, income and industry.
The plan examines the Region’s existing and emerging cluster industries, its economic assets and
the internal and external forces affecting its economy.
The CEDS suggests a comprehensive regional economic development strategy that is founded
upon the following vision for the Region:
The Treasure Coast Region:
Is comprised of vibrant communities with a true quality of place;
Is one of North America’s most dynamic economic regions;
Rewards innovation by starting, growing and attracting entrepreneurial firms;
Is Florida’s leading center for scientific research and development;
Provides economic opportunities to its residents;
Values its open spaces and unique natural environments; and
Has communities that are diverse, safe and prosperous.
Comprehensive Economic Development Strategy 2012 -2017 – Draft 08-13-2012
Treasure Coast Regional Planning Council
8
Implementing the vision for the Region rests upon three sets of strategic priorities:
1. Framework
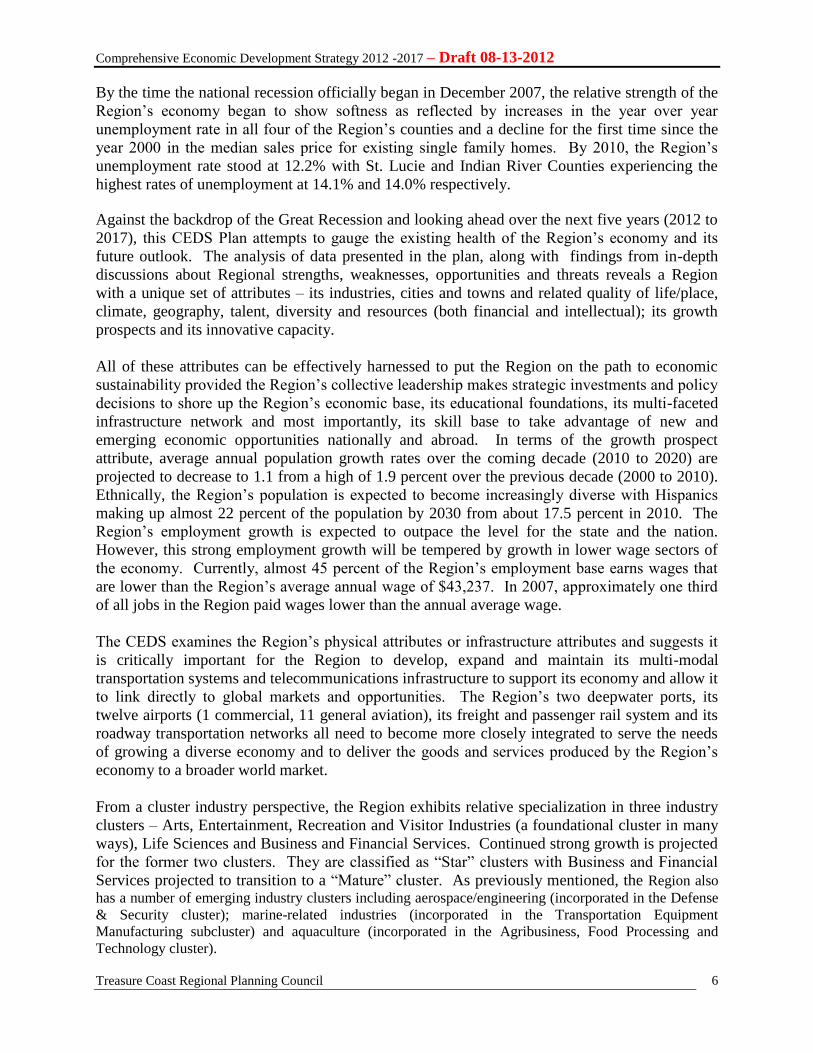
SIX PILLARS of FLORIDA’S
FUTURE ECONOMY:
The Six Pillars program is designed to be a framework
serving as “an organizing force for strategic planning at
local, regional and state levels” to bring together
“fragmented viewpoints into a common and consistent
conversation.” The Six Pillars are:
Talent Supply and Education
Innovation and Economic Development
Infrastructure and Growth Leadership
Business Climate and Competitiveness
Civic and Governance Systems
Quality of Life and Quality Places
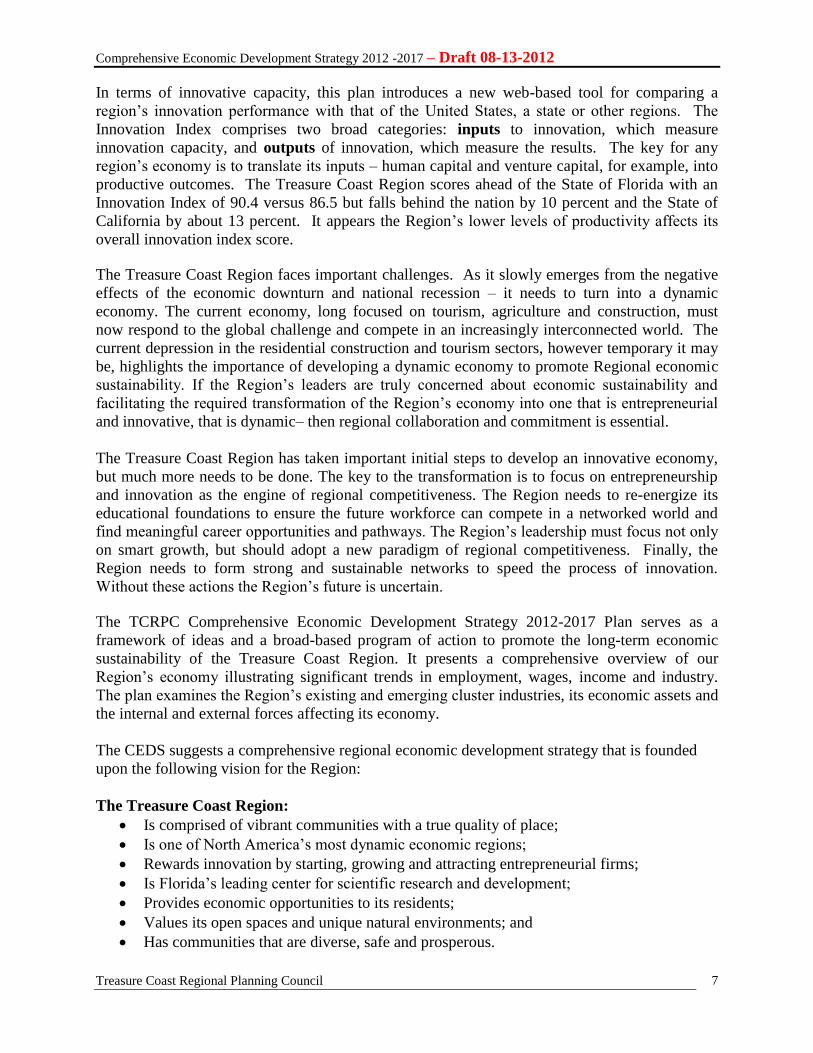
2. Cluster Industry Focus
To make the Region economically
competitive the collective leadership
needs to focus on the Region’s economic
drivers – its clusters.
An advanced economic development
framework that focuses on innovation
and high-quality job creation is cluster-
based economic development. In his
book, The Competitive Advantage of
Nations, Dr. Michael Porter, a noted Harvard economist, concludes that a nation’s most
successful industries are those that consist of related groups of firms rather than single,
isolated companies. Nations (and Regions within nations) succeed not in isolated industries,
but in clusters of industries connected through vertical and horizontal relationships. A nation’s
economy contains a mix of clusters, whose makeup and sources of competitive advantage (or
disadvantage) reflect the state of the economy’s development.
The National Governors Association publication, Cluster-Based Strategies for Growing State
Economies, describes the increasing importance of cluster strategies to help accelerate
regional competitiveness.
Comprehensive Economic Development Strategy 2012 -2017 – Draft 08-13-2012
Treasure Coast Regional Planning Council
9
3. A Regional Jobs Agenda
Sustainable economic growth and prosperity for the Treasure Coast Region requires the
development and implementation of nothing less than a regional jobs agenda. Such a regional
jobs agenda is not simply a return to pre-recession levels of employment because of
improving economic conditions but a completely new priority to establish a regional jobs
agenda by the collective leadership of the Region. McKinsey Global Institute, in its report,
An Economy That Works: Job Creation and America’s Future suggests that “…while a robust
economic recovery provides a foundation for job growth, a cyclical rebound in GDP growth
alone is unlikely to put enough Americans back to work. Job creation must become a national
priority, not a by-product of other policy decisions…failure to reverse the anemic job growth
of the past decade and to accelerate job creation in the years to come will have serious
consequences for the future of the economy and the American people. For the United States
to remain a high-income, globally competitive nation, it will need to set the conditions for
demand-driven growth and job creation.” The report suggests progress on four dimensions is
needed:
Skill: Ensuring that Americans acquire the skills that match employer needs.
Share: Helping American workers win “market share” in an expanded global
economy.
Spark: Encouraging innovation, new company creation, and the scaling up of
new industries in the United States.
Speed: Removing impediments to investment and job creation.
Comprehensive Economic Development Strategy 2012 -2017 – Draft 08-13-2012
Treasure Coast Regional Planning Council
10
INTRODUCTION
The CEDS is designed to guide the economic growth of the Treasure Coast Region. It is the
result of an ongoing, participatory planning process that addresses the economic problems and
potential of the Region. The strategy reflects local economic development needs and priorities
and recommends a regional approach to achieving sustainable economic development.
Ultimately, the CEDS planning process helps create livable wage jobs, fosters the growth of a
competitive regional economy, and secures the Region’s long-term sustainability.
A CEDS is required to qualify for U.S. Economic Development Administration (EDA)
assistance under its public works, economic adjustment, and most planning programs, and is a
prerequisite for designation by EDA as an Economic Development District (EDD). In December
of 1998, Council prepared its first CEDS in order to obtain designation as an EDD. In 2000, the
TCRPC produced its second planning strategy – “Treasure Coast 2010.” In 2004, Council
published “Go Treasure Coast 2004-2014.” In 2007, TCRPC released Comprehensive Economic
Development Strategy 2007-2012. This document is the fifth version of the CEDS plan and
importantly is developed in cooperation and collaboration with economic development planning
efforts going on simultaneously statewide with other regional planning councils, the State of
Florida, the workforce development boards, and other statewide economic development
stakeholders.
This CEDS planning effort is aligned with and is being conducted in concert with statewide and
regional economic development planning efforts as follows:
Florida’s 2012-2017 Statewide Strategic Plan for Economic
Development
The Florida Department of Economic Opportunity (DEO)
Division of Strategic Business Development, as outlined in
Florida Statutes, 20.60, is required to create a five year
statewide strategic plan designed to help guide the future of Florida’s economy. DEO is
developing the strategic plan in close coordination with Enterprise Florida, Workforce Florida,
local governments, local and regional economic development organizations, the business
community, educational institutions as well as other local, state and federal entities. The
framework adopted for the planning effort is the Six Pillars of Florida’s Economy developed by
the Florida Chamber Foundation.
Earlier this year (February and March) DEO held regional forums across the state in conjunction
with all eleven regional planning councils to gather insights related to the creation of Florida’s
2012-2017 Statewide Strategic Plan for Economic Development. The purpose of the forums was
to review and prioritize goals, objectives and strategies for implementation by state government
that would assist Florida’s regions with economic development and job creation. The Treasure
Coast centered regional forum was held on March 5, 2012 in Stuart and had participation from
over 115 people representing local governments, local and regional economic development
organizations, community economic development entities, workforce development boards, the
business community, educational institutions and others attended the event. TCRPC staff
presented participants an overview of the 2012 CEDS Plan at the event.
Comprehensive Economic Development Strategy 2012 -2017 – Draft 08-13-2012
Treasure Coast Regional Planning Council
11
Seven50
Seven50 (“seven counties, 50 years”) is a blueprint for
growing a more prosperous, more desirable Southeast
Florida during the next 50 years and beyond. The plan is
being developed to help ensure socially inclusive
communities, a vibrant and resilient economy, and
stewardship of the fragile ecosystem in what is quickly
becoming one of the world’s most important mega-regions.
Spearheaded by the South Florida and Treasure Coast Regional Planning Councils and the
Southeast Florida Regional Partnership (SFRP), a unique collaboration of more than 200 public,
private, and civic stakeholders, Seven50 is mapping the strategy for the best-possible quality of
life for the more than six million residents of Monroe, Miami-Dade, Broward, Palm Beach,
Martin, St. Lucie and Indian River counties.
The plan is being devised through a series of public summits, workshops, online outreach and
high-impact studies led by the region’s top thinkers. Seven50 has been made possible by a grant
from the U.S. Department of Housing & Urban Development’s Sustainable Communities
Initiative.
The Florida Eight
The Florida Eight initiative provides regional
teams with a variety of facilitation services
and resources to build their regional capacity
for economic development, talent
development, job retention and international
business opportunities. Through Workforce
Florida’s investment—and consistent with its
mission to strengthen the state’s business climate through talent development— this initiative
provides research, marketing and other resources to up to eight regional teams as they establish
and implement business development plans.
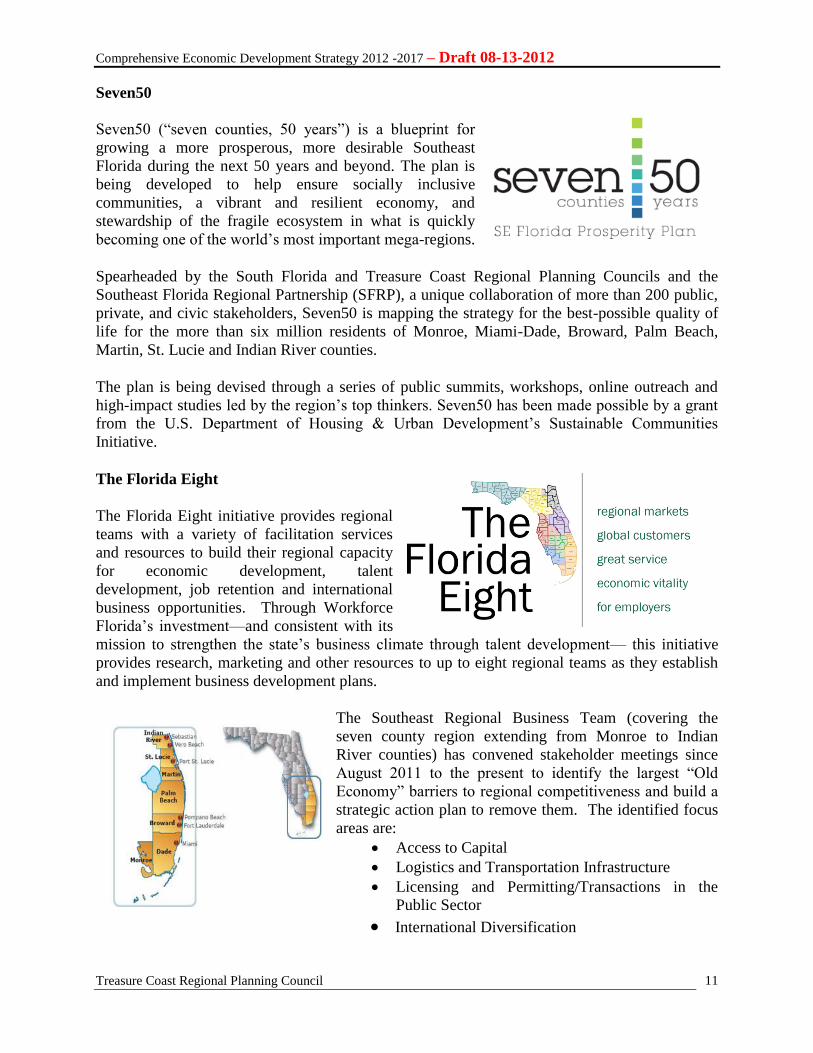
The Southeast Regional Business Team (covering the
seven county region extending from Monroe to Indian
River counties) has convened stakeholder meetings since
August 2011 to the present to identify the largest “Old
Economy” barriers to regional competitiveness and build a
strategic action plan to remove them. The identified focus
areas are:
Access to Capital
Logistics and Transportation Infrastructure
Licensing and Permitting/Transactions in the
Public Sector
International Diversification
Comprehensive Economic Development Strategy 2012 -2017 – Draft 08-13-2012
Treasure Coast Regional Planning Council
12
STRATEGY REPORT
Comprehensive Economic Development Strategy 2012 -2017 – Draft 08-13-2012
Treasure Coast Regional Planning Council
13
A. BACKGROUND
PART I: ECONOMIC PROFILE
a. Overview
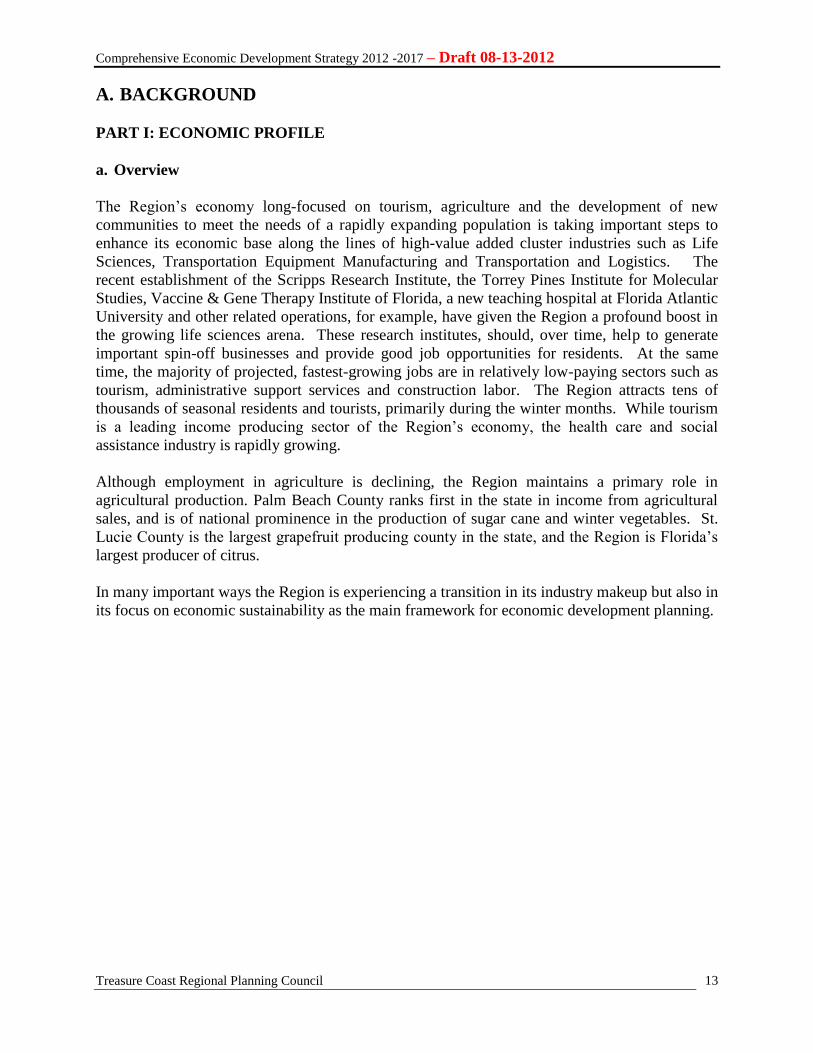
The Region’s economy long-focused on tourism, agriculture and the development of new
communities to meet the needs of a rapidly expanding population is taking important steps to
enhance its economic base along the lines of high-value added cluster industries such as Life
Sciences, Transportation Equipment Manufacturing and Transportation and Logistics. The
recent establishment of the Scripps Research Institute, the Torrey Pines Institute for Molecular
Studies, Vaccine & Gene Therapy Institute of Florida, a new teaching hospital at Florida Atlantic
University and other related operations, for example, have given the Region a profound boost in
the growing life sciences arena. These research institutes, should, over time, help to generate
important spin-off businesses and provide good job opportunities for residents. At the same
time, the majority of projected, fastest-growing jobs are in relatively low-paying sectors such as
tourism, administrative support services and construction labor. The Region attracts tens of
thousands of seasonal residents and tourists, primarily during the winter months. While tourism
is a leading income producing sector of the Region’s economy, the health care and social
assistance industry is rapidly growing.
Although employment in agriculture is declining, the Region maintains a primary role in
agricultural production. Palm Beach County ranks first in the state in income from agricultural
sales, and is of national prominence in the production of sugar cane and winter vegetables. St.
Lucie County is the largest grapefruit producing county in the state, and the Region is Florida’s
largest producer of citrus.
In many important ways the Region is experiencing a transition in its industry makeup but also in
its focus on economic sustainability as the main framework for economic development planning.
Comprehensive Economic Development Strategy 2012 -2017 – Draft 08-13-2012
Treasure Coast Regional Planning Council
14
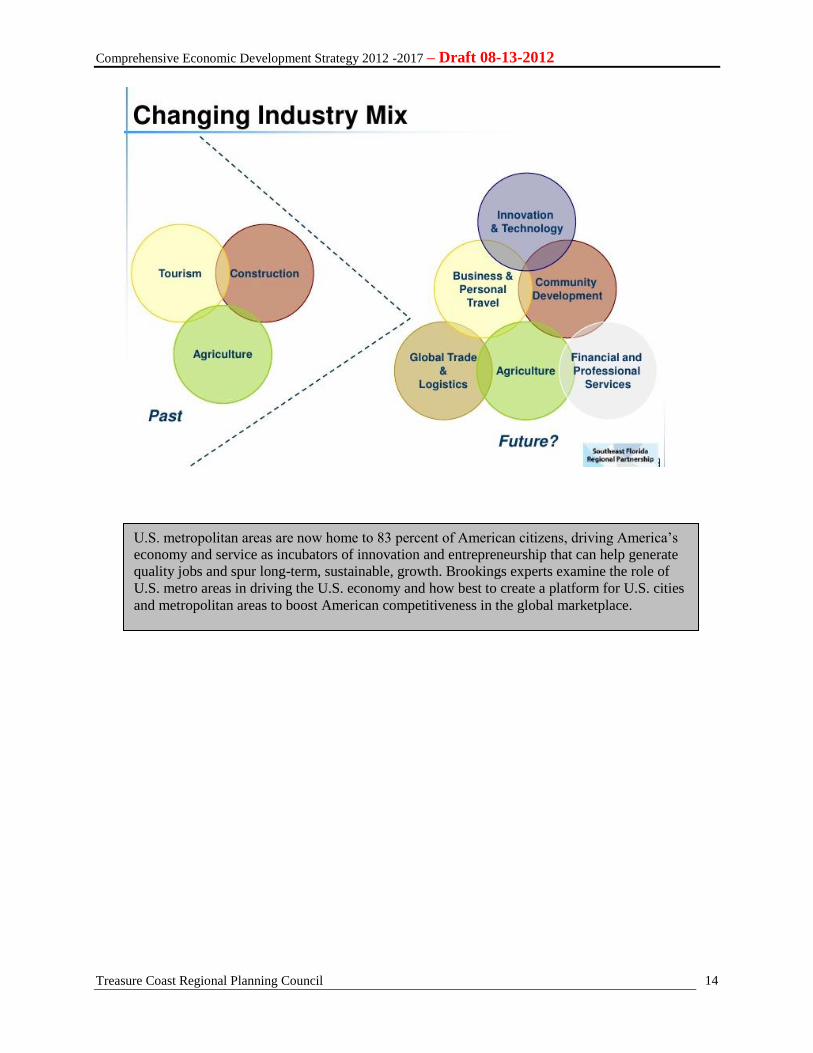
U.S. metropolitan areas are now home to 83 percent of American citizens, driving America’s
economy and service as incubators of innovation and entrepreneurship that can help generate
quality jobs and spur long-term, sustainable, growth. Brookings experts examine the role of
U.S. metro areas in driving the U.S. economy and how best to create a platform for U.S. cities
and metropolitan areas to boost American competitiveness in the global marketplace.
Comprehensive Economic Development Strategy 2012 -2017 – Draft 08-13-2012
Treasure Coast Regional Planning Council
15
b. Demographic Trends
Population
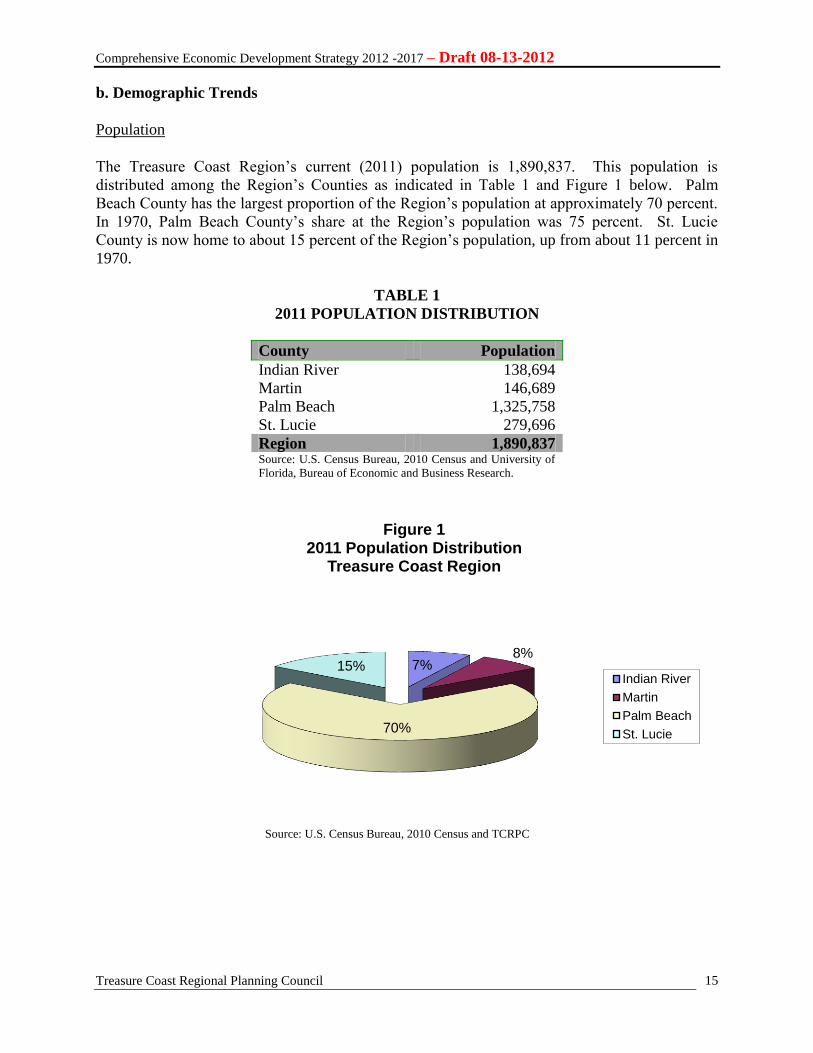
The Treasure Coast Region’s current (2011) population is 1,890,837. This population is
distributed among the Region’s Counties as indicated in Table 1 and Figure 1 below. Palm
Beach County has the largest proportion of the Region’s population at approximately 70 percent.
In 1970, Palm Beach County’s share at the Region’s population was 75 percent. St. Lucie
County is now home to about 15 percent of the Region’s population, up from about 11 percent in
1970.
TABLE 1
2011 POPULATION DISTRIBUTION
7% 8%
70%
15%
Figure 1 2011 Population Distribution
Treasure Coast Region
Indian River
Martin
Palm Beach
St. Lucie
County Population
Indian River 138,694
Martin 146,689
Palm Beach 1,325,758
St. Lucie 279,696
Region 1,890,837 Source: U.S. Census Bureau, 2010 Census and University of
Florida, Bureau of Economic and Business Research.
Source: U.S. Census Bureau, 2010 Census and TCRPC
Comprehensive Economic Development Strategy 2012 -2017 – Draft 08-13-2012
Treasure Coast Regional Planning Council
16
The Region contains a large number of municipalities (50 in 2010), 38 of which are in Palm
Beach County. Owing to its phenomenal growth over the last forty years, the Region’s largest
city would clearly be Port St. Lucie. Data for the Treasure Coast Region show that the five most
populous incorporated places and their 2010 Census counts are Port St. Lucie, 164,603; West
Palm Beach, 99,919; Boca Raton, 84,392; Boynton Beach, 68,217; and Delray Beach, 60,522.
Port St. Lucie grew by 85.4 percent since the 2000 Census. West Palm Beach grew by 21.7
percent, Boca Raton grew by 12.9 percent, Boynton Beach increased by 13.0 percent, and Delray
Beach grew by 0.8 percent.
Population Growth Trends
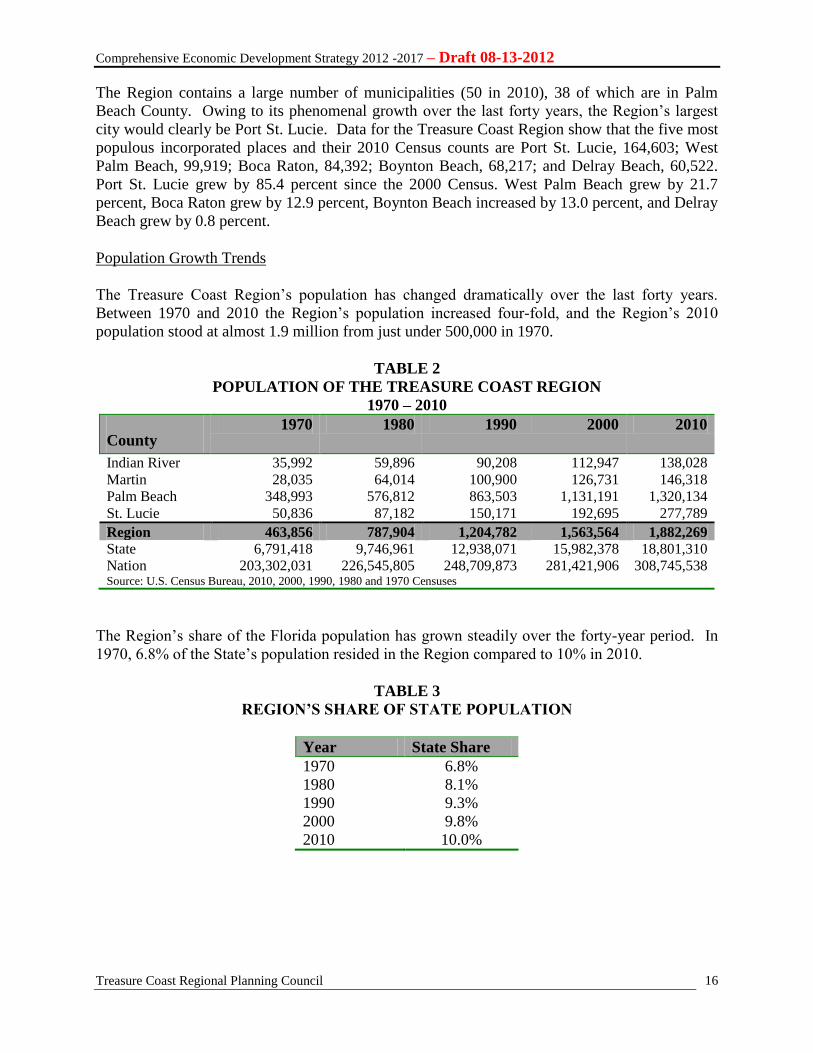
The Treasure Coast Region’s population has changed dramatically over the last forty years.
Between 1970 and 2010 the Region’s population increased four-fold, and the Region’s 2010
population stood at almost 1.9 million from just under 500,000 in 1970.
TABLE 2
POPULATION OF THE TREASURE COAST REGION
1970 – 2010
County 1970 1980 1990 2000 2010
Indian River 35,992 59,896 90,208 112,947 138,028
Martin 28,035 64,014 100,900 126,731 146,318
Palm Beach 348,993 576,812 863,503 1,131,191 1,320,134
St. Lucie 50,836 87,182 150,171 192,695 277,789
Region 463,856 787,904 1,204,782 1,563,564 1,882,269
State 6,791,418 9,746,961 12,938,071 15,982,378 18,801,310
Nation 203,302,031 226,545,805 248,709,873 281,421,906 308,745,538 Source: U.S. Census Bureau, 2010, 2000, 1990, 1980 and 1970 Censuses
The Region’s share of the Florida population has grown steadily over the forty-year period. In
1970, 6.8% of the State’s population resided in the Region compared to 10% in 2010.
TABLE 3
REGION’S SHARE OF STATE POPULATION
Year State Share
1970 6.8%
1980 8.1%
1990 9.3%
2000 9.8%
2010 10.0%
Comprehensive Economic Development Strategy 2012 -2017 – Draft 08-13-2012
Treasure Coast Regional Planning Council
17
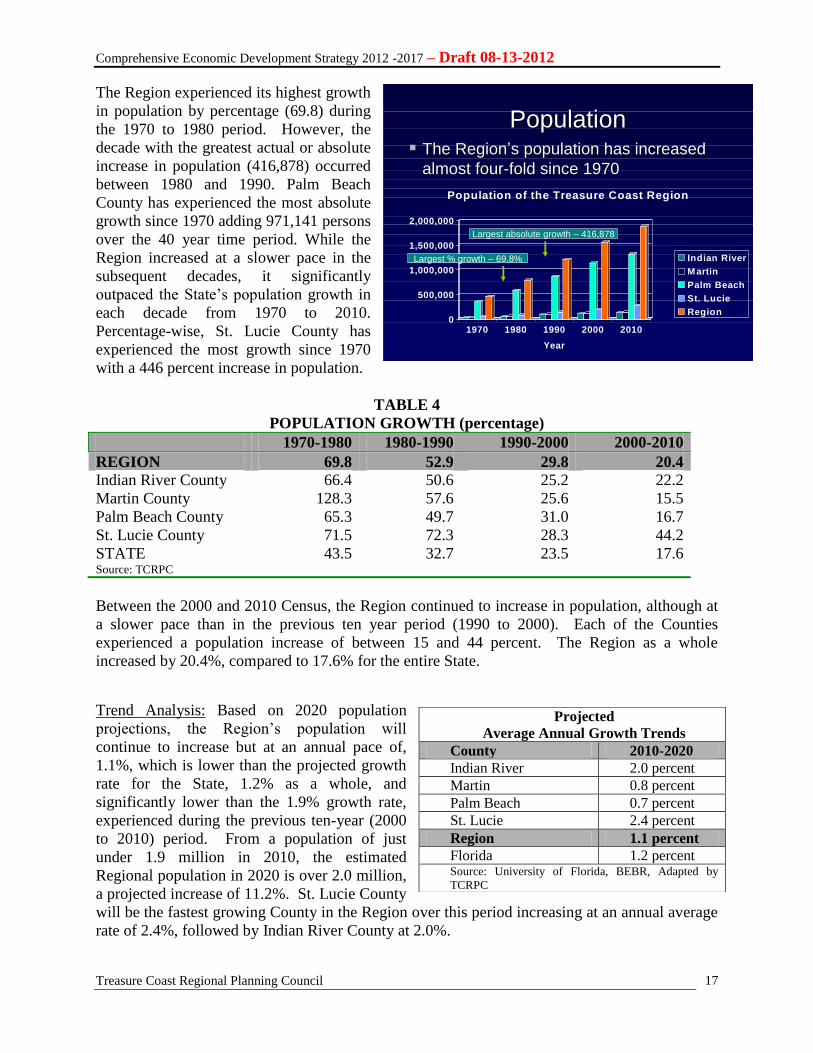
The Region experienced its highest growth
in population by percentage (69.8) during
the 1970 to 1980 period. However, the
decade with the greatest actual or absolute
increase in population (416,878) occurred
between 1980 and 1990. Palm Beach
County has experienced the most absolute
growth since 1970 adding 971,141 persons
over the 40 year time period. While the
Region increased at a slower pace in the
subsequent decades, it significantly
outpaced the State’s population growth in
each decade from 1970 to 2010.
Percentage-wise, St. Lucie County has
experienced the most growth since 1970
with a 446 percent increase in population.
TABLE 4
POPULATION GROWTH (percentage)
1970-1980 1980-1990 1990-2000 2000-2010
REGION 69.8 52.9 29.8 20.4
Indian River County 66.4 50.6 25.2 22.2
Martin County 128.3 57.6 25.6 15.5
Palm Beach County 65.3 49.7 31.0 16.7
St. Lucie County 71.5 72.3 28.3 44.2
STATE 43.5 32.7 23.5 17.6 Source: TCRPC
Between the 2000 and 2010 Census, the Region continued to increase in population, although at
a slower pace than in the previous ten year period (1990 to 2000). Each of the Counties
experienced a population increase of between 15 and 44 percent. The Region as a whole
increased by 20.4%, compared to 17.6% for the entire State.
Trend Analysis: Based on 2020 population
projections, the Region’s population will
continue to increase but at an annual pace of,
1.1%, which is lower than the projected growth
rate for the State, 1.2% as a whole, and
significantly lower than the 1.9% growth rate,
experienced during the previous ten-year (2000
to 2010) period. From a population of just
under 1.9 million in 2010, the estimated
Regional population in 2020 is over 2.0 million,
a projected increase of 11.2%. St. Lucie County
will be the fastest growing County in the Region over this period increasing at an annual average
rate of 2.4%, followed by Indian River County at 2.0%.
Projected
Average Annual Growth Trends
County 2010-2020
Indian River 2.0 percent
Martin 0.8 percent
Palm Beach 0.7 percent
St. Lucie 2.4 percent
Region 1.1 percent
Florida 1.2 percent Source: University of Florida, BEBR, Adapted by
TCRPC
PopulationPopulation The RegionThe Region’’s population has increased s population has increased
almost fouralmost four--fold since 1970fold since 1970
0
500,000
1,000,000
1,500,000
2,000,000
1970 1980 1990 2000 2010
Year
Population of the Treasure Coast Region
Indian River
Martin
Palm Beach
St. Lucie
Region
Largest % growth – 69.8%
Largest absolute growth – 416,878
Comprehensive Economic Development Strategy 2012 -2017 – Draft 08-13-2012
Treasure Coast Regional Planning Council
18
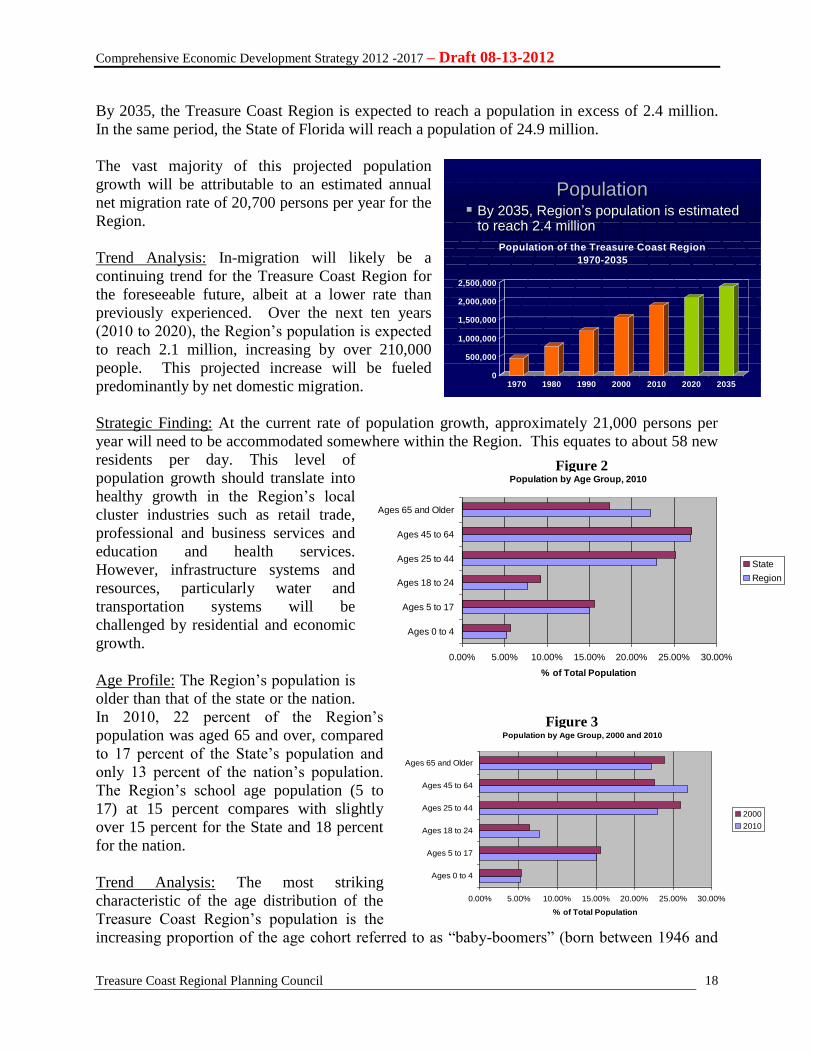
By 2035, the Treasure Coast Region is expected to reach a population in excess of 2.4 million.
In the same period, the State of Florida will reach a population of 24.9 million.
The vast majority of this projected population
growth will be attributable to an estimated annual
net migration rate of 20,700 persons per year for the
Region.
Trend Analysis: In-migration will likely be a
continuing trend for the Treasure Coast Region for
the foreseeable future, albeit at a lower rate than
previously experienced. Over the next ten years
(2010 to 2020), the Region’s population is expected
to reach 2.1 million, increasing by over 210,000
people. This projected increase will be fueled
predominantly by net domestic migration.
Strategic Finding: At the current rate of population growth, approximately 21,000 persons per
year will need to be accommodated somewhere within the Region. This equates to about 58 new
residents per day. This level of
population growth should translate into
healthy growth in the Region’s local
cluster industries such as retail trade,
professional and business services and
education and health services.
However, infrastructure systems and
resources, particularly water and
transportation systems will be
challenged by residential and economic
growth.
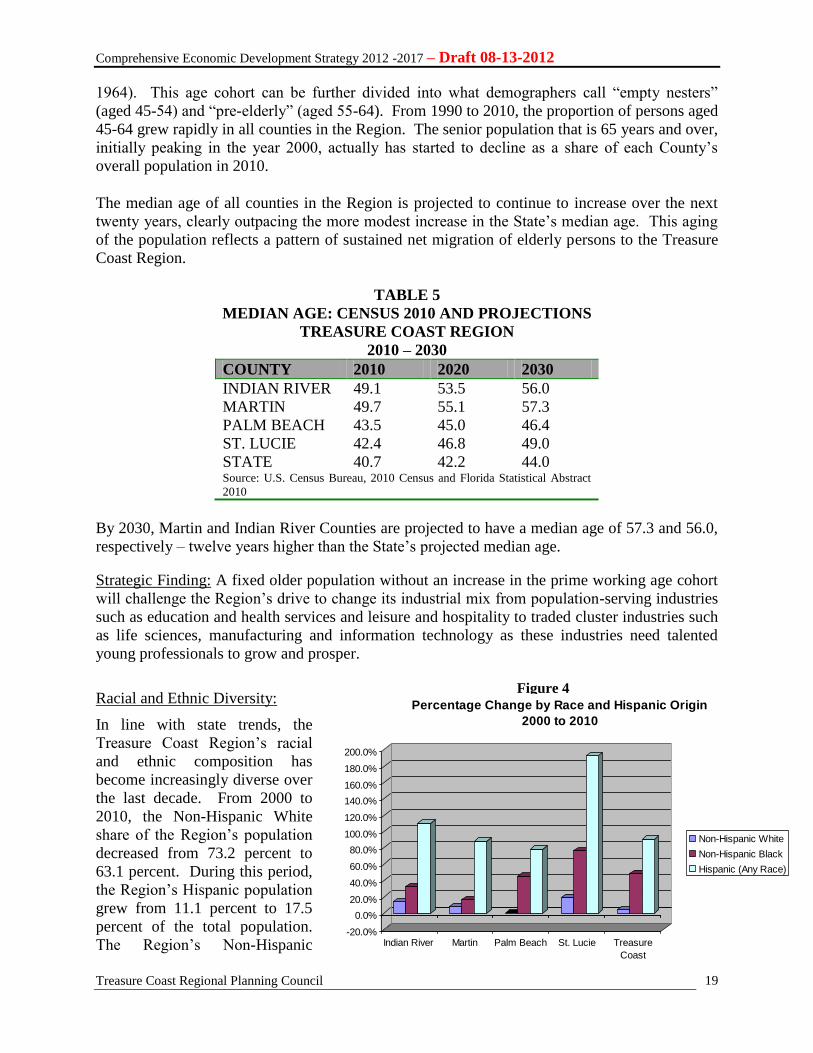
Age Profile: The Region’s population is
older than that of the state or the nation.
In 2010, 22 percent of the Region’s
population was aged 65 and over, compared
to 17 percent of the State’s population and
only 13 percent of the nation’s population.
The Region’s school age population (5 to
17) at 15 percent compares with slightly
over 15 percent for the State and 18 percent
for the nation.
Trend Analysis: The most striking
characteristic of the age distribution of the
Treasure Coast Region’s population is the
increasing proportion of the age cohort referred to as “baby-boomers” (born between 1946 and
PopulationPopulation By 2035, RegionBy 2035, Region’’s population is estimated s population is estimated
to reach 2.4 millionto reach 2.4 million
0
500,000
1,000,000
1,500,000
2,000,000
2,500,000
1970 1980 1990 2000 2010 2020 2035
Population of the Treasure Coast Region
1970-2035
Population by Age Group, 2010
0.00% 5.00% 10.00% 15.00% 20.00% 25.00% 30.00%
Ages 0 to 4
Ages 5 to 17
Ages 18 to 24
Ages 25 to 44
Ages 45 to 64
Ages 65 and Older
% of Total Population
State
Region
Population by Age Group, 2000 and 2010
0.00% 5.00% 10.00% 15.00% 20.00% 25.00% 30.00%
Ages 0 to 4
Ages 5 to 17
Ages 18 to 24
Ages 25 to 44
Ages 45 to 64
Ages 65 and Older
% of Total Population
2000
2010
Figure 2
Figure 3
Comprehensive Economic Development Strategy 2012 -2017 – Draft 08-13-2012
Treasure Coast Regional Planning Council
19
1964). This age cohort can be further divided into what demographers call “empty nesters”
(aged 45-54) and “pre-elderly” (aged 55-64). From 1990 to 2010, the proportion of persons aged
45-64 grew rapidly in all counties in the Region. The senior population that is 65 years and over,
initially peaking in the year 2000, actually has started to decline as a share of each County’s
overall population in 2010.
The median age of all counties in the Region is projected to continue to increase over the next
twenty years, clearly outpacing the more modest increase in the State’s median age. This aging
of the population reflects a pattern of sustained net migration of elderly persons to the Treasure
Coast Region.
TABLE 5
MEDIAN AGE: CENSUS 2010 AND PROJECTIONS
TREASURE COAST REGION
2010 – 2030
COUNTY 2010 2020 2030
INDIAN RIVER 49.1 53.5 56.0
MARTIN 49.7 55.1 57.3
PALM BEACH 43.5 45.0 46.4
ST. LUCIE 42.4 46.8 49.0
STATE 40.7 42.2 44.0 Source: U.S. Census Bureau, 2010 Census and Florida Statistical Abstract
2010
By 2030, Martin and Indian River Counties are projected to have a median age of 57.3 and 56.0,
respectively – twelve years higher than the State’s projected median age.
Strategic Finding: A fixed older population without an increase in the prime working age cohort
will challenge the Region’s drive to change its industrial mix from population-serving industries
such as education and health services and leisure and hospitality to traded cluster industries such
as life sciences, manufacturing and information technology as these industries need talented
young professionals to grow and prosper.
Racial and Ethnic Diversity:
In line with state trends, the
Treasure Coast Region’s racial
and ethnic composition has
become increasingly diverse over
the last decade. From 2000 to
2010, the Non-Hispanic White
share of the Region’s population
decreased from 73.2 percent to
63.1 percent. During this period,
the Region’s Hispanic population
grew from 11.1 percent to 17.5
percent of the total population.
The Region’s Non-Hispanic -20.0%
0.0%
20.0%
40.0%
60.0%
80.0%
100.0%
120.0%
140.0%
160.0%
180.0%
200.0%
Indian River Martin Palm Beach St. Lucie Treasure
Coast
Percentage Change by Race and Hispanic Origin
2000 to 2010
Non-Hispanic White
Non-Hispanic Black
Hispanic (Any Race)
Figure 4

Comprehensive Economic Development Strategy 2012 -2017 – Draft 08-13-2012
Treasure Coast Regional Planning Council
20
Black population has also continued to grow in size since 2000 reaching 15.5 percent in 2010
versus 12.6 percent.
Palm Beach County experienced the largest rise in Hispanic population in absolute terms
growing from 140,675 to 250,823, an increase of 110,148 or 78.3 percent. St. Lucie County
experienced the highest percentage increase in its Hispanic population, just over 102 percent.
Trend Analysis: By 2030, population projections prepared by the Bureau of Economic and
Business Research at the University of Florida suggest that the Hispanic portion of the
population will reach almost 22 percent and the proportion of the Non-Hispanic White
population to fall to 60.1 percent, down from 63.1 percent in 2010. The Non-Hispanic Black
population is also projected to increase over the next twenty year period but only slightly. By
2030, the Non-Hispanic Black population will reach about 15.8 percent of the Region’s
population up from 15.5 percent in 2010.
Strategic Finding: The increasing diversity of the Region’s population, as evidenced by the
actual and projected rise of the Hispanic population from 11 percent in 2000 to just over 17
percent in 2010, and eventual rise to almost 22 percent presents new opportunities and
challenges for the Region’s educational system. Additionally, social and cultural amenities and
opportunities within the Region’s cities will need to reflect this growing diversity. An
increasingly diverse population will also provide fertile ground for new business opportunities.
Educational Attainment: In
2010, approximately 86.5
percent of the Region’s
population 25 years and over
had a high school degree or
higher and 29.1 percent had
earned a bachelor’s degree or
higher. Nationally, 85.6 percent
of the population had a high
school degree or higher and 28.2
percent had earned a bachelor’s
degree or higher. Within the
Region, Palm Beach County had
the highest proportion of its
population earning a bachelor’s
degree or higher at 31.8 percent
and St. Lucie County had the
lowest proportion of its
population with a bachelor’s degree or higher at 16.6 percent.
Strategic Finding: The Treasure Coast Region has a slightly higher proportion of its population
over 25 years of age that earned a bachelor’s degree or higher than the state or the nation. This
should be considered an opportunity to expand upon. However, there are marked differences in
educational attainment within the Region that need to be addressed. The Region needs to do
what it can to recruit a graduate program university with a robust research and development
0% 20% 40% 60% 80% 100% 120%
Indian River
Martin
Palm Beach
St. Lucie
Treasure Coast
US
State
Educational Attainment by % of Population 25
Years and Over, 2010
High School or less High School Graduate
Some College or Associate's Degree Bachelor's Degree
Graduate or professional degree
Figure 5
Comprehensive Economic Development Strategy 2012 -2017 – Draft 08-13-2012
Treasure Coast Regional Planning Council
21
capability that is internationally acclaimed and recognized. This will help to attract talented
young professionals to the Treasure Coast Region.
Comprehensive Economic Development Strategy 2012 -2017 – Draft 08-13-2012
Treasure Coast Regional Planning Council
22
c. Employment, Income and Wage Trends
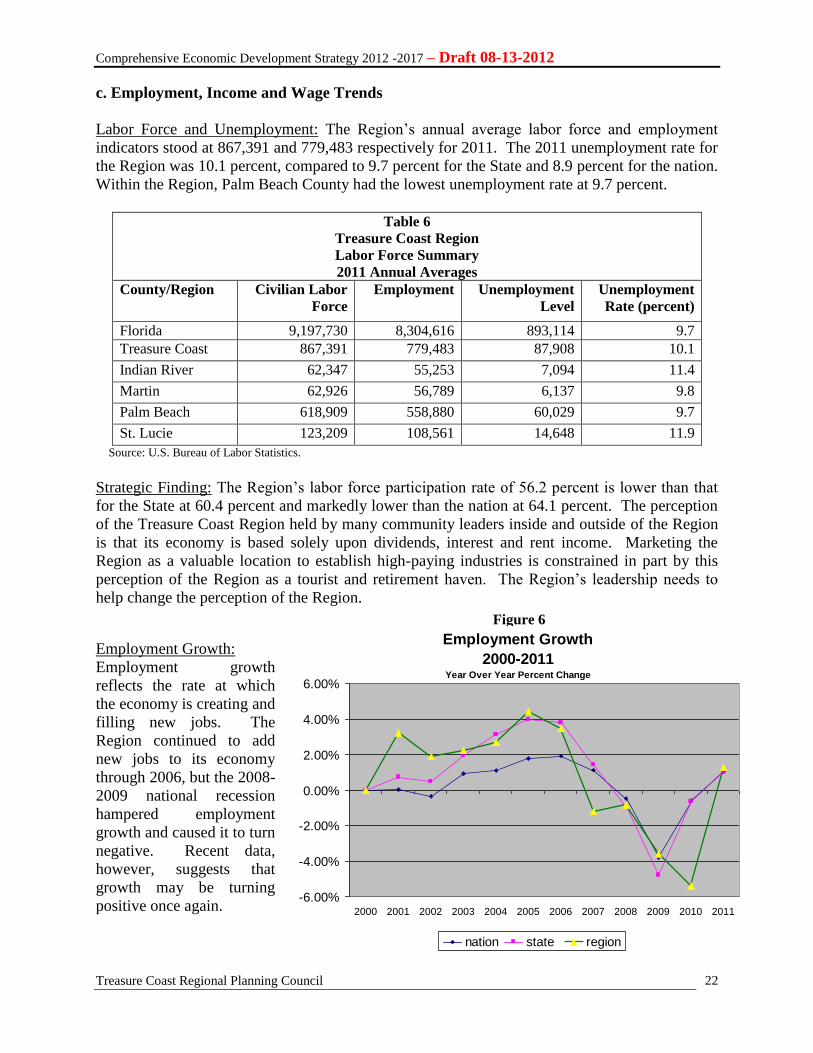
Labor Force and Unemployment: The Region’s annual average labor force and employment
indicators stood at 867,391 and 779,483 respectively for 2011. The 2011 unemployment rate for
the Region was 10.1 percent, compared to 9.7 percent for the State and 8.9 percent for the nation.
Within the Region, Palm Beach County had the lowest unemployment rate at 9.7 percent.
Table 6
Treasure Coast Region
Labor Force Summary
2011 Annual Averages
County/Region Civilian Labor
Force
Employment Unemployment
Level
Unemployment
Rate (percent)
Florida 9,197,730 8,304,616 893,114 9.7
Treasure Coast 867,391 779,483 87,908 10.1
Indian River 62,347 55,253 7,094 11.4
Martin 62,926 56,789 6,137 9.8
Palm Beach 618,909 558,880 60,029 9.7
St. Lucie 123,209 108,561 14,648 11.9
Source: U.S. Bureau of Labor Statistics.
Strategic Finding: The Region’s labor force participation rate of 56.2 percent is lower than that
for the State at 60.4 percent and markedly lower than the nation at 64.1 percent. The perception
of the Treasure Coast Region held by many community leaders inside and outside of the Region
is that its economy is based solely upon dividends, interest and rent income. Marketing the
Region as a valuable location to establish high-paying industries is constrained in part by this
perception of the Region as a tourist and retirement haven. The Region’s leadership needs to
help change the perception of the Region.
Employment Growth: Employment growth
reflects the rate at which
the economy is creating and
filling new jobs. The
Region continued to add
new jobs to its economy
through 2006, but the 2008-
2009 national recession
hampered employment
growth and caused it to turn
negative. Recent data,
however, suggests that
growth may be turning
positive once again.
Employment Growth
2000-2011Year Over Year Percent Change
-6.00%
-4.00%
-2.00%
0.00%
2.00%
4.00%
6.00%
2000 2001 2002 2003 2004 2005 2006 2007 2008 2009 2010 2011
nation state region
Figure 6
Comprehensive Economic Development Strategy 2012 -2017 – Draft 08-13-2012
Treasure Coast Regional Planning Council
23
Why is This Important?
Employment growth is an indicator of expansion in the economy and represents an increase in
the economic opportunities available to the citizens of the region. Employment growth is
generally tracked as a percentage change year over year.
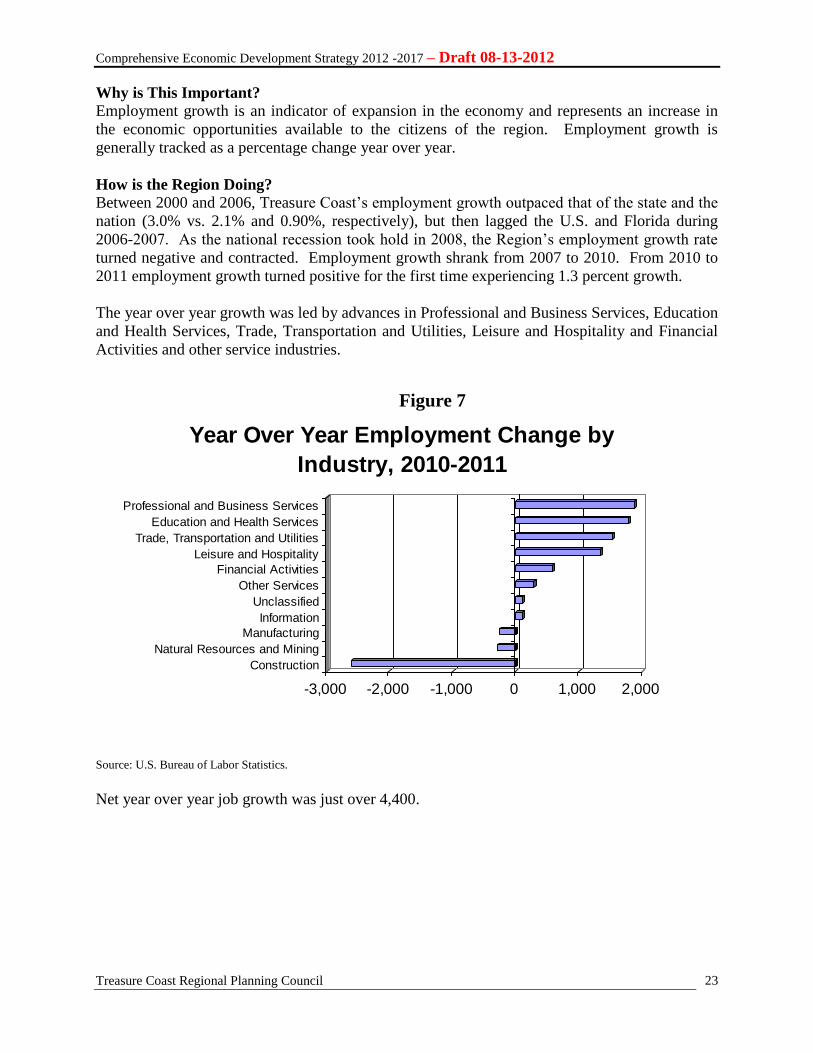
How is the Region Doing?
Between 2000 and 2006, Treasure Coast’s employment growth outpaced that of the state and the
nation (3.0% vs. 2.1% and 0.90%, respectively), but then lagged the U.S. and Florida during
2006-2007. As the national recession took hold in 2008, the Region’s employment growth rate
turned negative and contracted. Employment growth shrank from 2007 to 2010. From 2010 to
2011 employment growth turned positive for the first time experiencing 1.3 percent growth.
The year over year growth was led by advances in Professional and Business Services, Education
and Health Services, Trade, Transportation and Utilities, Leisure and Hospitality and Financial
Activities and other service industries.
Source: U.S. Bureau of Labor Statistics.
Net year over year job growth was just over 4,400.
-3,000 -2,000 -1,000 0 1,000 2,000
Construction
Natural Resources and Mining
Manufacturing
Information
Unclassified
Other Services
Financial Activities
Leisure and Hospitality
Trade, Transportation and Utilities
Education and Health Services
Professional and Business Services
Year Over Year Employment Change by
Industry, 2010-2011
Figure 7
Comprehensive Economic Development Strategy 2012 -2017 – Draft 08-13-2012
Treasure Coast Regional Planning Council
24
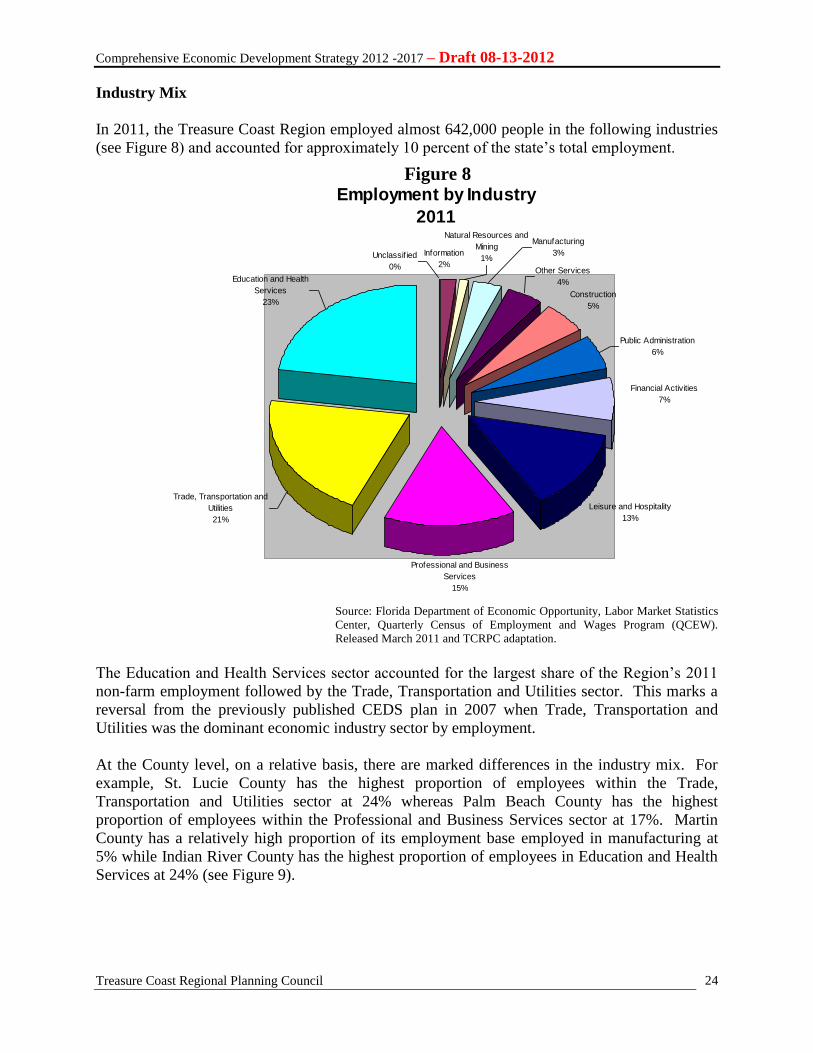
Industry Mix
In 2011, the Treasure Coast Region employed almost 642,000 people in the following industries
(see Figure 8) and accounted for approximately 10 percent of the state’s total employment.
Source: Florida Department of Economic Opportunity, Labor Market Statistics
Center, Quarterly Census of Employment and Wages Program (QCEW).
Released March 2011 and TCRPC adaptation.
The Education and Health Services sector accounted for the largest share of the Region’s 2011
non-farm employment followed by the Trade, Transportation and Utilities sector. This marks a
reversal from the previously published CEDS plan in 2007 when Trade, Transportation and
Utilities was the dominant economic industry sector by employment.
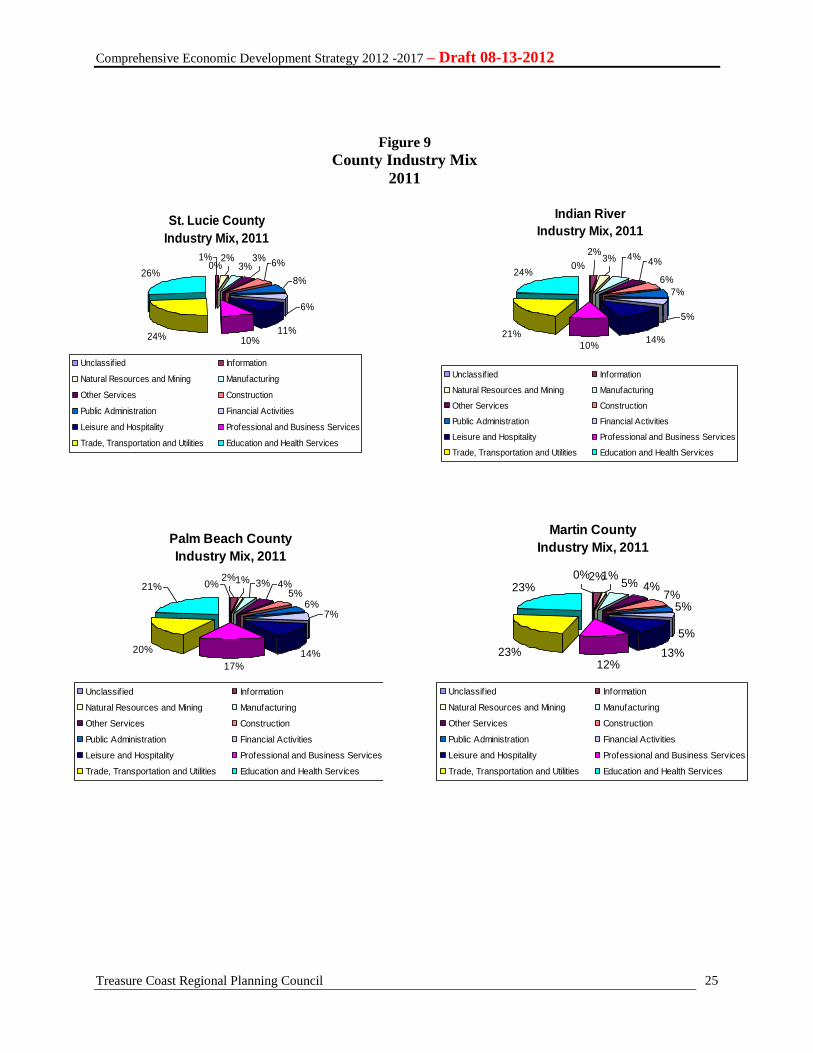
At the County level, on a relative basis, there are marked differences in the industry mix. For
example, St. Lucie County has the highest proportion of employees within the Trade,
Transportation and Utilities sector at 24% whereas Palm Beach County has the highest
proportion of employees within the Professional and Business Services sector at 17%. Martin
County has a relatively high proportion of its employment base employed in manufacturing at
5% while Indian River County has the highest proportion of employees in Education and Health
Services at 24% (see Figure 9).
Employment by Industry
2011
Construction
5%
Leisure and Hospitality
13%
Other Services
4%
Financial Activities
7%
Public Administration
6%
Information
2%
Natural Resources and
Mining
1%Unclassif ied
0%
Manufacturing
3%
Education and Health
Services
23%
Trade, Transportation and
Utilities
21%
Professional and Business
Services
15%
Figure 8
Comprehensive Economic Development Strategy 2012 -2017 – Draft 08-13-2012
Treasure Coast Regional Planning Council
25
Figure 9 County Industry Mix
2011
Palm Beach County
Industry Mix, 2011
5%6%
14%
17%
20%
21%2%
4%3%
7%
1%0%
Unclassif ied Information
Natural Resources and Mining Manufacturing
Other Services Construction
Public Administration Financial Activities
Leisure and Hospitality Professional and Business Services
Trade, Transportation and Utilities Education and Health Services
Martin County
Industry Mix, 2011
5% 4%7%
5%
5%
13%12%
23%
23%2%1%0%
Unclassif ied Information
Natural Resources and Mining Manufacturing
Other Services Construction
Public Administration Financial Activities
Leisure and Hospitality Professional and Business Services
Trade, Transportation and Utilities Education and Health Services
St. Lucie County
Industry Mix, 2011
0% 3%
11%10%24%
26%
3%6%
8%
6%
2%1%
Unclassif ied Information
Natural Resources and Mining Manufacturing
Other Services Construction
Public Administration Financial Activities
Leisure and Hospitality Professional and Business Services
Trade, Transportation and Utilities Education and Health Services
Indian River
Industry Mix, 2011
6%
7%
14%10%
21%
24%0%
5%
4%4%3%
2%
Unclassif ied Information
Natural Resources and Mining Manufacturing
Other Services Construction
Public Administration Financial Activities
Leisure and Hospitality Professional and Business Services
Trade, Transportation and Utilities Education and Health Services
Comprehensive Economic Development Strategy 2012 -2017 – Draft 08-13-2012
Treasure Coast Regional Planning Council
26
Table 7
Employment by Wages and Industry
2011
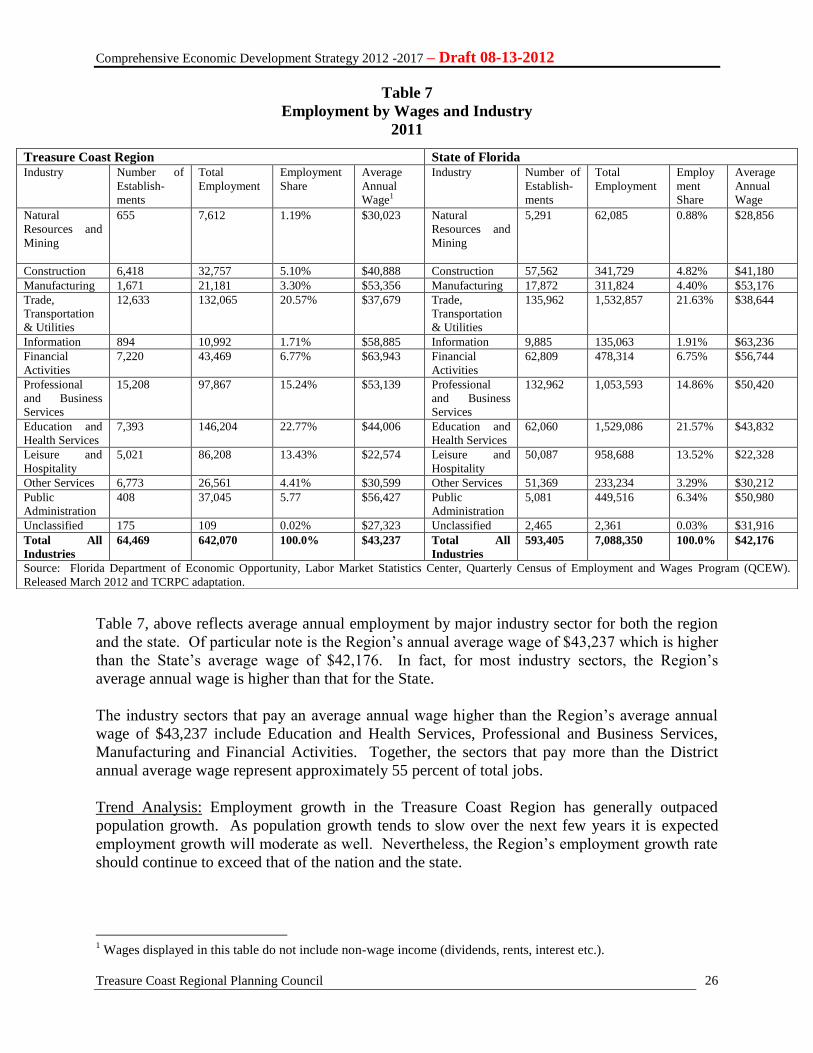
Table 7, above reflects average annual employment by major industry sector for both the region
and the state. Of particular note is the Region’s annual average wage of $43,237 which is higher
than the State’s average wage of $42,176. In fact, for most industry sectors, the Region’s
average annual wage is higher than that for the State.
The industry sectors that pay an average annual wage higher than the Region’s average annual
wage of $43,237 include Education and Health Services, Professional and Business Services,
Manufacturing and Financial Activities. Together, the sectors that pay more than the District
annual average wage represent approximately 55 percent of total jobs.
Trend Analysis: Employment growth in the Treasure Coast Region has generally outpaced
population growth. As population growth tends to slow over the next few years it is expected
employment growth will moderate as well. Nevertheless, the Region’s employment growth rate
should continue to exceed that of the nation and the state.
1 Wages displayed in this table do not include non-wage income (dividends, rents, interest etc.).
Treasure Coast Region State of Florida Industry Number of
Establish-
ments
Total
Employment
Employment
Share
Average
Annual
Wage1
Industry Number of
Establish-
ments
Total
Employment
Employ
ment
Share
Average
Annual
Wage
Natural
Resources and
Mining
655 7,612 1.19% $30,023 Natural
Resources and
Mining
5,291 62,085 0.88% $28,856
Construction 6,418 32,757 5.10% $40,888 Construction 57,562 341,729 4.82% $41,180
Manufacturing 1,671 21,181 3.30% $53,356 Manufacturing 17,872 311,824 4.40% $53,176
Trade,
Transportation
& Utilities
12,633 132,065 20.57% $37,679 Trade,
Transportation
& Utilities
135,962 1,532,857 21.63% $38,644
Information 894 10,992 1.71% $58,885 Information 9,885 135,063 1.91% $63,236
Financial
Activities
7,220 43,469 6.77% $63,943 Financial
Activities
62,809 478,314 6.75% $56,744
Professional
and Business
Services
15,208 97,867 15.24% $53,139 Professional
and Business
Services
132,962 1,053,593 14.86% $50,420
Education and
Health Services
7,393 146,204 22.77% $44,006 Education and
Health Services
62,060 1,529,086 21.57% $43,832
Leisure and
Hospitality
5,021 86,208 13.43% $22,574 Leisure and
Hospitality
50,087 958,688 13.52% $22,328
Other Services 6,773 26,561 4.41% $30,599 Other Services 51,369 233,234 3.29% $30,212
Public
Administration
408 37,045 5.77 $56,427 Public
Administration
5,081 449,516 6.34% $50,980
Unclassified 175 109 0.02% $27,323 Unclassified 2,465 2,361 0.03% $31,916
Total All
Industries
64,469 642,070 100.0% $43,237 Total All
Industries
593,405 7,088,350 100.0% $42,176
Source: Florida Department of Economic Opportunity, Labor Market Statistics Center, Quarterly Census of Employment and Wages Program (QCEW).
Released March 2012 and TCRPC adaptation.
Comprehensive Economic Development Strategy 2012 -2017 – Draft 08-13-2012
Treasure Coast Regional Planning Council
27
Strategic Finding: Almost 45 percent of the Region’s employment base earns wages that are
lower than the Region’s average annual wage of $43,237. This is a marked increase in lower
wage growth since publication of the previous CEDS plan in 2007. In 2007, one third of all jobs
paid wages lower than the annual average wage. Continued growth in low wage industry sectors
and a relative decline of job growth in the Information and Manufacturing industry sectors
suggest the Region needs to continue to focus on advancing the growth of high-wage, high-value
added sectors and reshaping the educational system to produce more engineers, scientists and
other skilled professionals.
Wages and Compensation
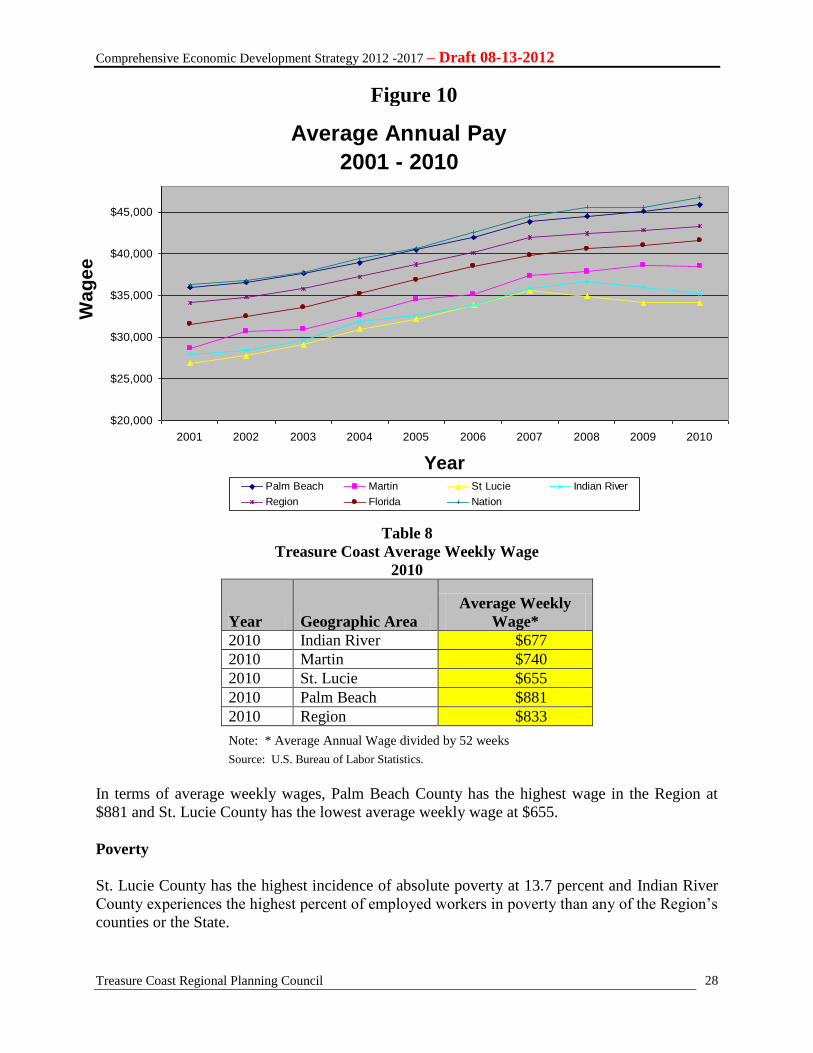
In 2010, the average annual wage in the Treasure Coast Region was approximately $43,300.
Average annual wages for the Treasure Coast Region have continued to outpace the average
wage levels for the State (Figure 10). However, average annual pay in the Region has been 6 to
7 percent below national wage levels. There are marked differences in wage levels within the
Region with Palm Beach County experiencing the highest and St. Lucie the lowest average
annual wages.
As illustrated in Figure 10, the Region’s average annual pay is likely to grow modestly and is
affected by the differences in wage levels within the four counties. Moreover, the continued
growth in relatively lower paying industry sectors brings down the Region’s average annual
wage as well. In a web-based report, Florida’s Job Structure, The University of Florida, Bureau
of Economic and Business Research maintains that Florida’s dependence on retirees, growth and
tourism has heavily contributed to its disproportionate share of relatively low skill jobs. Florida
is generally long on low skill jobs and short on high skill jobs.
Generally, Florida is over-represented in most types of service, leisure and hospitality, retail
trade and construction jobs. The State is under-represented in manufacturing and government
jobs which generally pay high wages. Long-term, medium-term and short-term (15 year, 5 year
and 1 year) state trends accentuate this pattern of disproportionate job growth in low wage
industry jobs with a declining share of high wage jobs.
Comprehensive Economic Development Strategy 2012 -2017 – Draft 08-13-2012
Treasure Coast Regional Planning Council
28
Trend Analysis: Interpolating from the trends illustrated in Figure x suggest that wage
differences between the Region’s counties will likely exist for the foreseeable future.
Strategic Finding: The Treasure Coast Region continues to experience lower average wages per
job as compared to the nation. Even as Palm Beach County’s average wage per job tracks that of
the U.S. average wage ($46,751), wages in Martin, Indian River and St. Lucie Counties in 2010
were 82 percent, 75 percent and 73 percent, respectively of the nation’s average annual wage.
Table 8
Treasure Coast Average Weekly Wage
2010
Year Geographic Area
Average Weekly
Wage*
2010 Indian River $677
2010 Martin $740
2010 St. Lucie $655
2010 Palm Beach $881
2010 Region $833
Note: * Average Annual Wage divided by 52 weeks
Source: U.S. Bureau of Labor Statistics.
In terms of average weekly wages, Palm Beach County has the highest wage in the Region at
$881 and St. Lucie County has the lowest average weekly wage at $655.
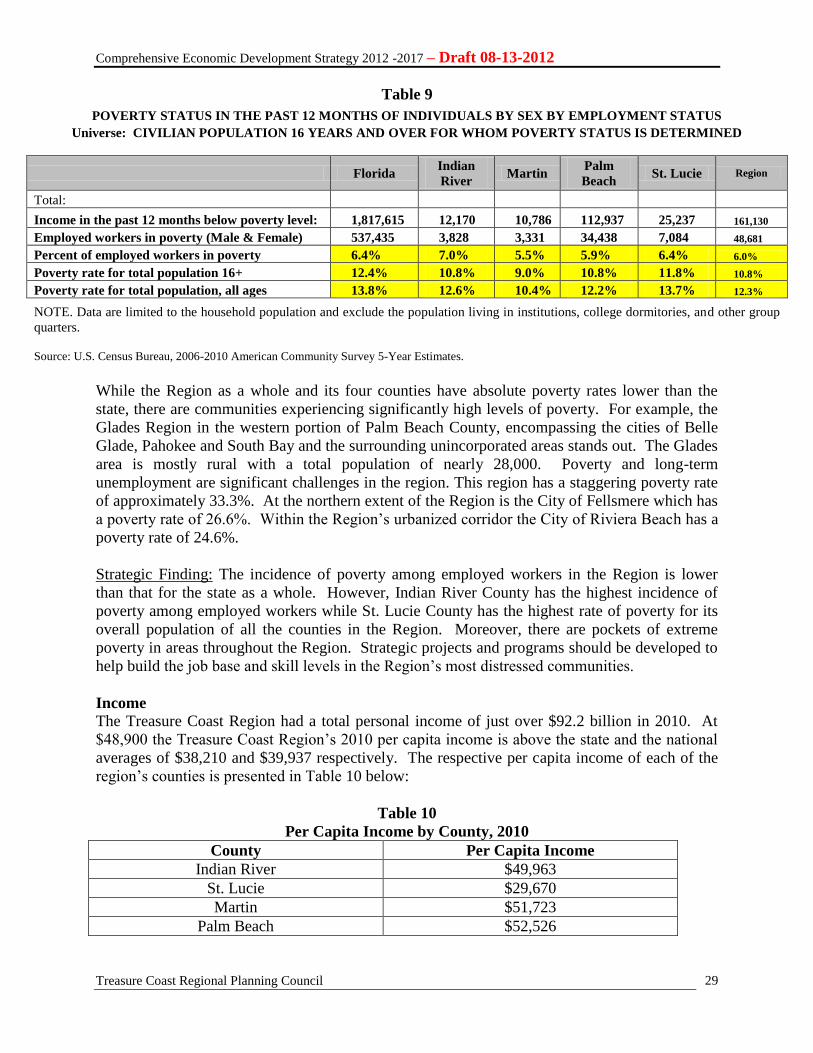
Poverty
St. Lucie County has the highest incidence of absolute poverty at 13.7 percent and Indian River
County experiences the highest percent of employed workers in poverty than any of the Region’s
counties or the State.
Average Annual Pay
2001 - 2010
$20,000
$25,000
$30,000
$35,000
$40,000
$45,000
2001 2002 2003 2004 2005 2006 2007 2008 2009 2010
Year
Wa
ge
e
Palm Beach Martin St Lucie Indian River
Region Florida Nation
Figure 10
Comprehensive Economic Development Strategy 2012 -2017 – Draft 08-13-2012
Treasure Coast Regional Planning Council
29
Table 9
POVERTY STATUS IN THE PAST 12 MONTHS OF INDIVIDUALS BY SEX BY EMPLOYMENT STATUS
Universe: CIVILIAN POPULATION 16 YEARS AND OVER FOR WHOM POVERTY STATUS IS DETERMINED
Florida Indian
River Martin
Palm
Beach St. Lucie Region
Total:
Income in the past 12 months below poverty level: 1,817,615 12,170 10,786 112,937 25,237 161,130
Employed workers in poverty (Male & Female) 537,435 3,828 3,331 34,438 7,084 48,681
Percent of employed workers in poverty 6.4% 7.0% 5.5% 5.9% 6.4% 6.0%
Poverty rate for total population 16+ 12.4% 10.8% 9.0% 10.8% 11.8% 10.8%
Poverty rate for total population, all ages 13.8% 12.6% 10.4% 12.2% 13.7% 12.3%
NOTE. Data are limited to the household population and exclude the population living in institutions, college dormitories, and other group
quarters.
Source: U.S. Census Bureau, 2006-2010 American Community Survey 5-Year Estimates.
While the Region as a whole and its four counties have absolute poverty rates lower than the
state, there are communities experiencing significantly high levels of poverty. For example, the
Glades Region in the western portion of Palm Beach County, encompassing the cities of Belle
Glade, Pahokee and South Bay and the surrounding unincorporated areas stands out. The Glades
area is mostly rural with a total population of nearly 28,000. Poverty and long-term
unemployment are significant challenges in the region. This region has a staggering poverty rate
of approximately 33.3%. At the northern extent of the Region is the City of Fellsmere which has
a poverty rate of 26.6%. Within the Region’s urbanized corridor the City of Riviera Beach has a
poverty rate of 24.6%.
Strategic Finding: The incidence of poverty among employed workers in the Region is lower
than that for the state as a whole. However, Indian River County has the highest incidence of
poverty among employed workers while St. Lucie County has the highest rate of poverty for its
overall population of all the counties in the Region. Moreover, there are pockets of extreme
poverty in areas throughout the Region. Strategic projects and programs should be developed to
help build the job base and skill levels in the Region’s most distressed communities.
Income The Treasure Coast Region had a total personal income of just over $92.2 billion in 2010. At
$48,900 the Treasure Coast Region’s 2010 per capita income is above the state and the national
averages of $38,210 and $39,937 respectively. The respective per capita income of each of the
region’s counties is presented in Table 10 below:
Table 10
Per Capita Income by County, 2010
County Per Capita Income
Indian River $49,963
St. Lucie $29,670
Martin $51,723
Palm Beach $52,526
Comprehensive Economic Development Strategy 2012 -2017 – Draft 08-13-2012
Treasure Coast Regional Planning Council
30
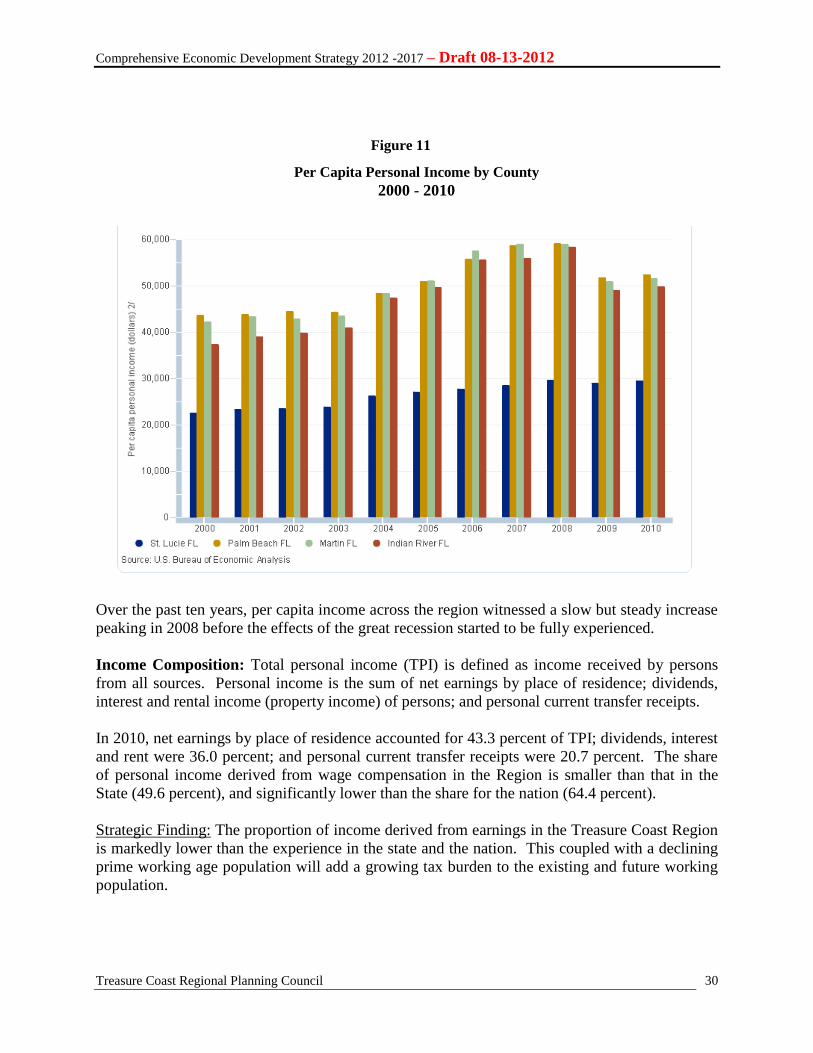
Over the past ten years, per capita income across the region witnessed a slow but steady increase
peaking in 2008 before the effects of the great recession started to be fully experienced.
Income Composition: Total personal income (TPI) is defined as income received by persons
from all sources. Personal income is the sum of net earnings by place of residence; dividends,
interest and rental income (property income) of persons; and personal current transfer receipts.
In 2010, net earnings by place of residence accounted for 43.3 percent of TPI; dividends, interest
and rent were 36.0 percent; and personal current transfer receipts were 20.7 percent. The share
of personal income derived from wage compensation in the Region is smaller than that in the
State (49.6 percent), and significantly lower than the share for the nation (64.4 percent).
Strategic Finding: The proportion of income derived from earnings in the Treasure Coast Region
is markedly lower than the experience in the state and the nation. This coupled with a declining
prime working age population will add a growing tax burden to the existing and future working
population.
Per Capita Personal Income by County
2000 - 2010
Figure 11
Comprehensive Economic Development Strategy 2012 -2017 – Draft 08-13-2012
Treasure Coast Regional Planning Council
31
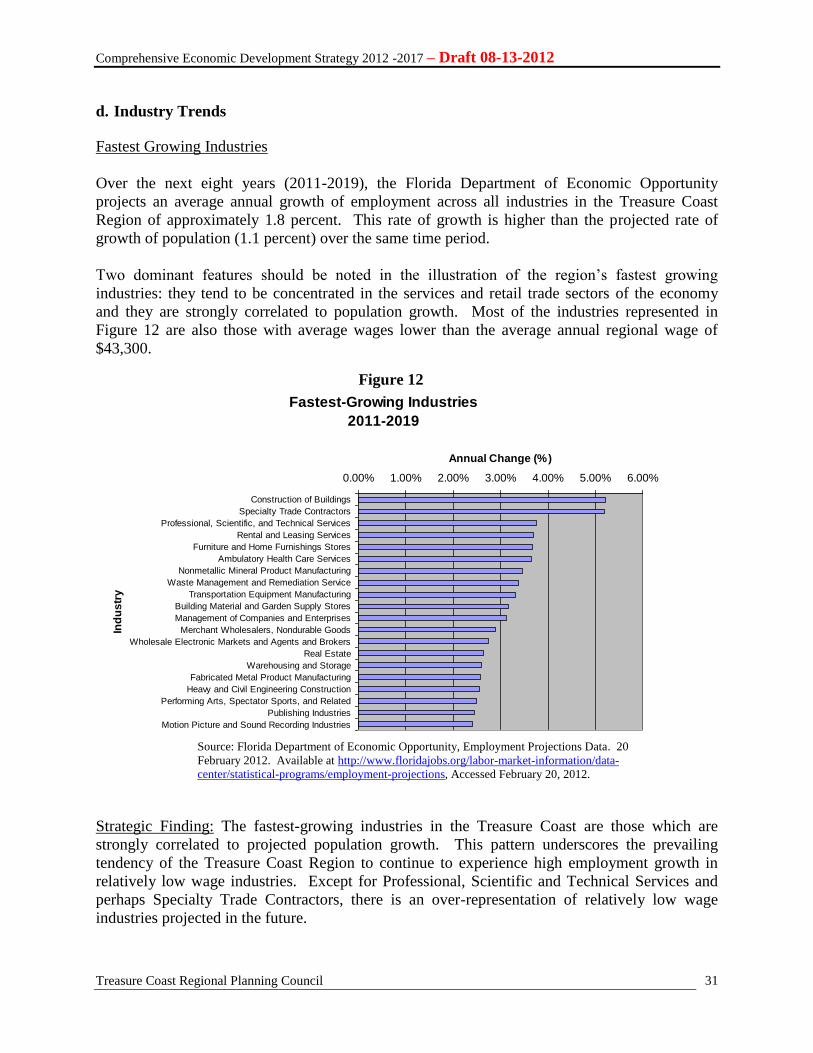
d. Industry Trends
Fastest Growing Industries
Over the next eight years (2011-2019), the Florida Department of Economic Opportunity
projects an average annual growth of employment across all industries in the Treasure Coast
Region of approximately 1.8 percent. This rate of growth is higher than the projected rate of
growth of population (1.1 percent) over the same time period.
Two dominant features should be noted in the illustration of the region’s fastest growing
industries: they tend to be concentrated in the services and retail trade sectors of the economy
and they are strongly correlated to population growth. Most of the industries represented in
Figure 12 are also those with average wages lower than the average annual regional wage of
$43,300.
Strategic Finding: The fastest-growing industries in the Treasure Coast are those which are
strongly correlated to projected population growth. This pattern underscores the prevailing
tendency of the Treasure Coast Region to continue to experience high employment growth in
relatively low wage industries. Except for Professional, Scientific and Technical Services and
perhaps Specialty Trade Contractors, there is an over-representation of relatively low wage
industries projected in the future.
Fastest-Growing Industries
2011-2019
0.00% 1.00% 2.00% 3.00% 4.00% 5.00% 6.00%
Construction of Buildings
Specialty Trade Contractors
Professional, Scientific, and Technical Services
Rental and Leasing Services
Furniture and Home Furnishings Stores
Ambulatory Health Care Services
Nonmetallic Mineral Product Manufacturing
Waste Management and Remediation Service
Transportation Equipment Manufacturing
Building Material and Garden Supply Stores
Management of Companies and Enterprises
Merchant Wholesalers, Nondurable Goods
Wholesale Electronic Markets and Agents and Brokers
Real Estate
Warehousing and Storage
Fabricated Metal Product Manufacturing
Heavy and Civil Engineering Construction
Performing Arts, Spectator Sports, and Related
Publishing Industries
Motion Picture and Sound Recording Industries
Ind
us
try
Annual Change (%)
Figure 12
Source: Florida Department of Economic Opportunity, Employment Projections Data. 20
February 2012. Available at http://www.floridajobs.org/labor-market-information/data-
center/statistical-programs/employment-projections, Accessed February 20, 2012.
Comprehensive Economic Development Strategy 2012 -2017 – Draft 08-13-2012
Treasure Coast Regional Planning Council
32
Workforce Development Trends
One of the primary means of enhancing the innovative capacity of the Region is to ensure its
workforce has the requisite skills and knowledge base to work in the various targeted industry
clusters and to be adaptable to changing economic opportunities. The Region’s two workforce
development boards – Workforce Alliance (Region 21) and Workforce Solutions (Region 20)
closely monitor the local economy and work closely with local economic development agencies
to identify changes in industry growth and skill demands and make the necessary adjustments to
programs and services to continue meeting the needs of employers and jobseekers.
Through their partnerships with educational and economic development organizations, the
workforce boards ensure that the workforce services provided are consistent with the economic
development goals of the region and workforce funding sources are used to support the
recruitment and training needs outlined in local economic development projects. Their
partnerships with the Region’s varied educational institutions assist in developing a pipeline of
future workers with the requisite skills needed to adapt to a changing global marketplace.
In its publication, State Workforce
Investment Plan 2011-2012 Workforce
Florida, Inc. discusses the State’s skills
gaps and makes the argument that to
…Florida employers have indicated that basic
interpersonal and critical thinking skills are the biggest
gaps in the current workforce.
State Workforce Investment Plan 2011-2012
Workforce Florida, Inc.
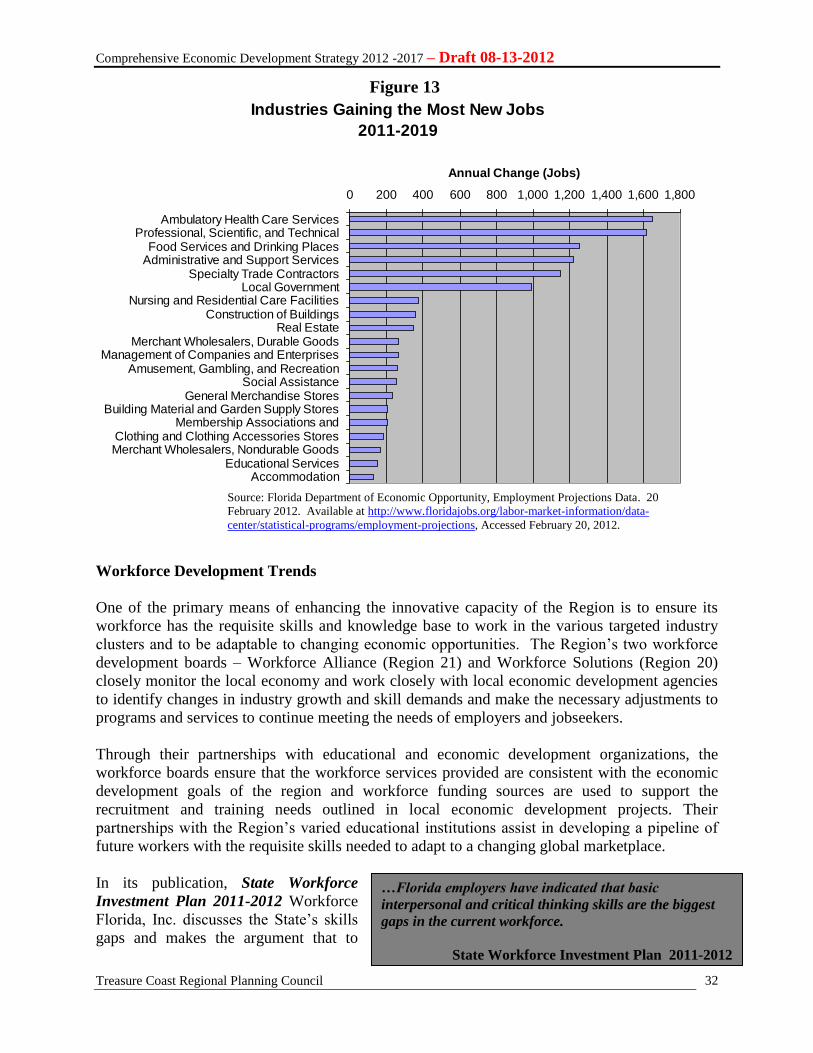
Industries Gaining the Most New Jobs
2011-2019
0 200 400 600 800 1,000 1,200 1,400 1,600 1,800
Ambulatory Health Care ServicesProfessional, Scientific, and Technical
Food Services and Drinking PlacesAdministrative and Support Services
Specialty Trade ContractorsLocal Government
Nursing and Residential Care FacilitiesConstruction of Buildings
Real EstateMerchant Wholesalers, Durable Goods
Management of Companies and EnterprisesAmusement, Gambling, and Recreation
Social AssistanceGeneral Merchandise Stores
Building Material and Garden Supply StoresMembership Associations and
Clothing and Clothing Accessories StoresMerchant Wholesalers, Nondurable Goods
Educational ServicesAccommodation
Annual Change (Jobs)
Figure 13
Source: Florida Department of Economic Opportunity, Employment Projections Data. 20
February 2012. Available at http://www.floridajobs.org/labor-market-information/data-
center/statistical-programs/employment-projections, Accessed February 20, 2012.
Comprehensive Economic Development Strategy 2012 -2017 – Draft 08-13-2012
Treasure Coast Regional Planning Council
33
compete in the national and global economies workers need basic skills like reading, writing,
math, speaking and listening. Additionally, thinking skills such as creativity, logical reasoning,
decision-making, problem-solving and visualization will need to be incorporated in the
curriculum throughout Florida’s educational system. Armed with these sets of skills combined
with technical and computer proficiency will help to assure Florida’s ability to compete in the
global marketplace.
In this region, the life sciences industry is extremely broad in scope and encompasses basic and
applied research and development, medical device design and manufacturing, medical testing
and diagnostics, pharmaceutical research and manufacturing, marine science, environmental
monitoring and testing, biohazard abatement, veterinary research and health care services.
Workers with specific science-based skills sets are needed, as are support personnel with skills in
marketing, finance, human resources, security, information technology and bioinformatics. The
life sciences industry also requires services and suppliers of equipment, chemicals, contract
research, business management and financial services.
Strategic Finding: Building a talented and creative regional workforce requires close cooperation
between the business, education and economic development communities. These partnerships
need to be strengthened and supported to enable the workforce development boards to develop a
pipeline of future workers and to upgrade the skills of the existing workforce. Helping existing
and future workers develop the skill sets required for future jobs, especially in the emerging life
sciences and research and development clusters will help the Region develop its innovation
economy.

Comprehensive Economic Development Strategy 2012 -2017 – Draft 08-13-2012
Treasure Coast Regional Planning Council
34
PART II: SUSTAINABILITY
a. Overview
Economic sustainability is closely tied to the concept of creating livable regions. Livable regions
are comprised of vibrant communities that are diverse, safe and prosperous. A livable region
should offer its residents a wide variety of choices to live, work, play and visit. These choices
will include urban, suburban and rural living options; a wide range of quality employment
options and locations; high quality schooling, dynamic artistic and cultural and environmental
amenities with a true quality of place.
This section frames the concept of economic sustainability through a discussion of the
importance of qualify of life/place considerations, the importance of having well developed
infrastructure systems, an understanding of how climate change may affect the Region’s
economy and the necessity to preserve and enhance the Region’s natural environment.
b. Quality of Life, Quality of Place and Economic Development
Increasingly, economic activity is centering in metropolitan area across the country and across
the world. Place factors prominently in business and industry location decisions as does quality
of life considerations. The Treasure Coast Region as a whole is perceived as having an excellent
quality of life. While this topic is subjective to a certain degree, there are commonly used criteria
to describe quality of life components. These include the natural environment, recreation,
culture, safety, education, housing and health services.
The large amounts of open space, strong efforts to expand educational and cultural facilities,
public safety programs, and increasing health-related services, suggest that maintaining the
quality of life is a high priority in the Region. The perception of an area having a good quality of
life is critical for many businesses when determining whether or not to invest in an area. Studies
indicate that cultural and natural assets form the basis for economic development in
communities. The greatest attractions for economic growth are quality of life, natural
environment, historic legacy and cultural context. These qualities and the character of a city
influence a wide range of business and residential location decisions and can serve as either a
dampener or catalyst for tourism and other economic and cultural activities. In relocation
decisions, businesses place increasingly more value on quality of life considerations. Continuous
investment in infrastructure as well as in various amenities (museums, theaters, sports,
entertainment, recreation) are necessary to maintain a competitive posture. The arts, culture, and
historic resources are big factors in a city’s quality of life and provide it with something more
tangible - a leveraging tool. If a community wants to attract capital and investment, it must be
prepared to call attention to its diversity, identity, and individuality. In addition, a continued
effort should be made to maintain, improve and/or expand these amenities to sustain a quality of
life that is enjoyed by the Region's residents and found attractive to outside businesses.
The Region’s Strategic Regional Policy Plan suggests that renovating and creating new locations
for economic development and businesses in existing cities, towns, and villages should be of
highest priority. While it is likely that land outside these central locations will be sought for
Comprehensive Economic Development Strategy 2012 -2017 – Draft 08-13-2012
Treasure Coast Regional Planning Council
35
economic development, well-defined cities, towns, and villages provide fertile ground for
business and commerce because of good transportation networks, dense infrastructure, close
proximity of neighborhoods (employees) to workplace, high density of customers and support
businesses, and proximity to cultural, recreational, and educational opportunities.
Moreover, as Brookings points out in its report, Global MetroMonitor 2011, … “Economic
activity concentrates in metropolitan areas through interactions on the ground among businesses,
people, and governments. By locating in metropolitan areas, businesses benefit from large labor
markets, public infrastructure, and deep pools of consumers. Firms also profit from close
proximity, which spurs specialization, innovation, higher productivity, and ultimately economic
growth. As a result, metropolitan areas have the unique economic advantage in which area
population growth results in more than a proportional growth of output, patents, bank deposits,
and other wealth creation and innovation
factors…”
c. Infrastructure
The lifestyle enjoyed by a community and its
ability to attract and sustain economic
development is predicated on the quality of its
public facilities and infrastructure. Indeed, as
regions across the country and world are
interconnected in a globally competitive economy
it is critical for the Treasure Coast Region to
develop, expand and maintain multi-modal
transportation systems and telecommunication
infrastructure to support a prosperous and
globally competitive economy.
The World Economic Forum in its Global
Competitiveness Report 2011-2012 makes the
distinct point … “Extensive and efficient
infrastructure is critical for ensuring the effective
functioning of the economy, as it is an important
factor determining the location of economic
activity and the kinds of activities or sectors that
can develop in a particular instance…the quality
and extensiveness of infrastructure networks
significantly impact economic growth and reduce
income inequalities and poverty in a variety of
ways. A well-developed transport and
communications infrastructure network is a
prerequisite for the access of less-developed
communities to core economic activities and
services…”
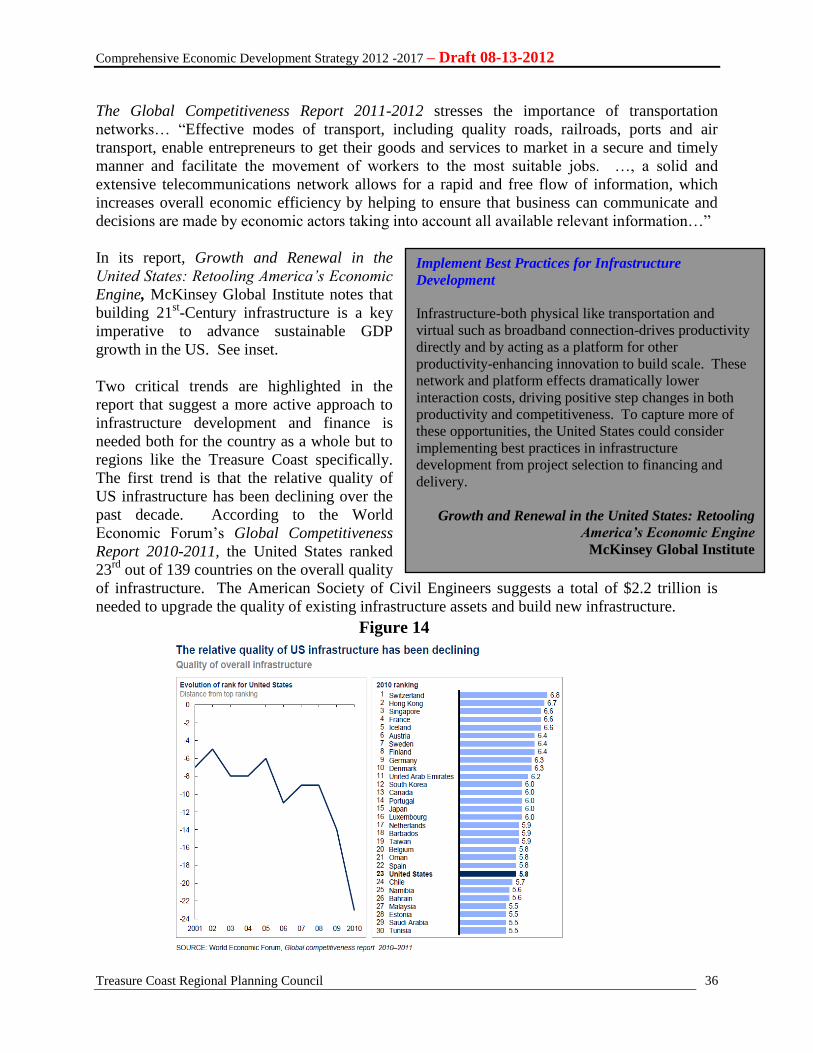
Comprehensive Economic Development Strategy 2012 -2017 – Draft 08-13-2012
Treasure Coast Regional Planning Council
36
The Global Competitiveness Report 2011-2012 stresses the importance of transportation
networks… “Effective modes of transport, including quality roads, railroads, ports and air
transport, enable entrepreneurs to get their goods and services to market in a secure and timely
manner and facilitate the movement of workers to the most suitable jobs. …, a solid and
extensive telecommunications network allows for a rapid and free flow of information, which
increases overall economic efficiency by helping to ensure that business can communicate and
decisions are made by economic actors taking into account all available relevant information…”
In its report, Growth and Renewal in the
United States: Retooling America’s Economic
Engine, McKinsey Global Institute notes that
building 21st-Century infrastructure is a key
imperative to advance sustainable GDP
growth in the US. See inset.
Two critical trends are highlighted in the
report that suggest a more active approach to
infrastructure development and finance is
needed both for the country as a whole but to
regions like the Treasure Coast specifically.
The first trend is that the relative quality of
US infrastructure has been declining over the
past decade. According to the World
Economic Forum’s Global Competitiveness
Report 2010-2011, the United States ranked
23rd
out of 139 countries on the overall quality
of infrastructure. The American Society of Civil Engineers suggests a total of $2.2 trillion is
needed to upgrade the quality of existing infrastructure assets and build new infrastructure.
Implement Best Practices for Infrastructure
Development
Infrastructure-both physical like transportation and
virtual such as broadband connection-drives productivity
directly and by acting as a platform for other
productivity-enhancing innovation to build scale. These
network and platform effects dramatically lower
interaction costs, driving positive step changes in both
productivity and competitiveness. To capture more of
these opportunities, the United States could consider
implementing best practices in infrastructure
development from project selection to financing and
delivery.
Growth and Renewal in the United States: Retooling
America’s Economic Engine
McKinsey Global Institute
Figure 14 Figure 14
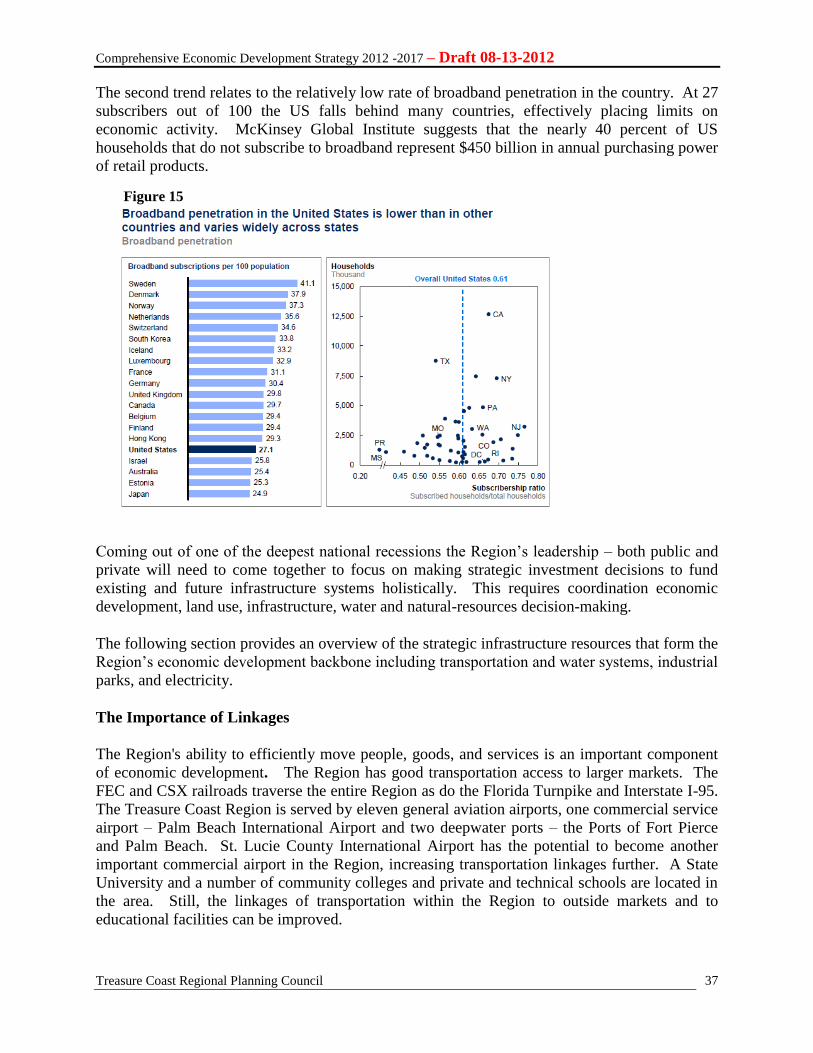
Comprehensive Economic Development Strategy 2012 -2017 – Draft 08-13-2012
Treasure Coast Regional Planning Council
37
The second trend relates to the relatively low rate of broadband penetration in the country. At 27
subscribers out of 100 the US falls behind many countries, effectively placing limits on
economic activity. McKinsey Global Institute suggests that the nearly 40 percent of US
households that do not subscribe to broadband represent $450 billion in annual purchasing power
of retail products.
Coming out of one of the deepest national recessions the Region’s leadership – both public and
private will need to come together to focus on making strategic investment decisions to fund
existing and future infrastructure systems holistically. This requires coordination economic
development, land use, infrastructure, water and natural-resources decision-making.
The following section provides an overview of the strategic infrastructure resources that form the
Region’s economic development backbone including transportation and water systems, industrial
parks, and electricity.
The Importance of Linkages
The Region's ability to efficiently move people, goods, and services is an important component
of economic development. The Region has good transportation access to larger markets. The
FEC and CSX railroads traverse the entire Region as do the Florida Turnpike and Interstate I-95.
The Treasure Coast Region is served by eleven general aviation airports, one commercial service
airport – Palm Beach International Airport and two deepwater ports – the Ports of Fort Pierce
and Palm Beach. St. Lucie County International Airport has the potential to become another
important commercial airport in the Region, increasing transportation linkages further. A State
University and a number of community colleges and private and technical schools are located in
the area. Still, the linkages of transportation within the Region to outside markets and to
educational facilities can be improved.
Figure 15
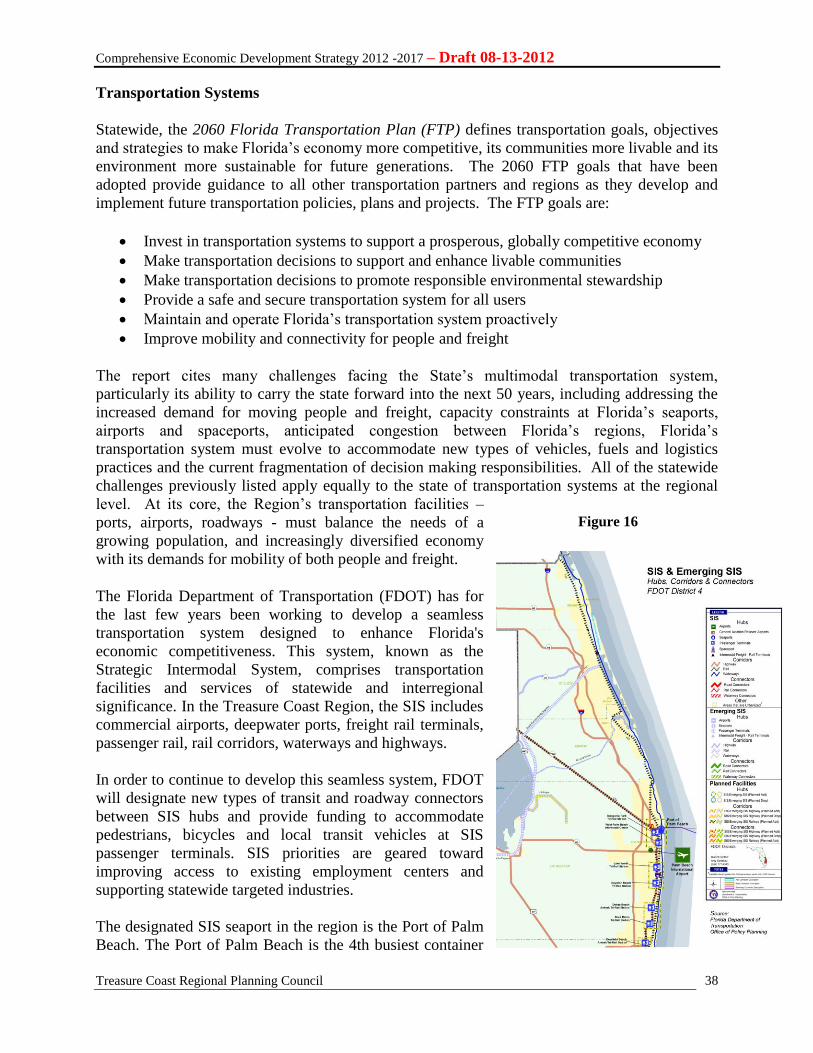
Comprehensive Economic Development Strategy 2012 -2017 – Draft 08-13-2012
Treasure Coast Regional Planning Council
38
Transportation Systems
Statewide, the 2060 Florida Transportation Plan (FTP) defines transportation goals, objectives
and strategies to make Florida’s economy more competitive, its communities more livable and its
environment more sustainable for future generations. The 2060 FTP goals that have been
adopted provide guidance to all other transportation partners and regions as they develop and
implement future transportation policies, plans and projects. The FTP goals are:
Invest in transportation systems to support a prosperous, globally competitive economy
Make transportation decisions to support and enhance livable communities
Make transportation decisions to promote responsible environmental stewardship
Provide a safe and secure transportation system for all users
Maintain and operate Florida’s transportation system proactively
Improve mobility and connectivity for people and freight
The report cites many challenges facing the State’s multimodal transportation system,
particularly its ability to carry the state forward into the next 50 years, including addressing the
increased demand for moving people and freight, capacity constraints at Florida’s seaports,
airports and spaceports, anticipated congestion between Florida’s regions, Florida’s
transportation system must evolve to accommodate new types of vehicles, fuels and logistics
practices and the current fragmentation of decision making responsibilities. All of the statewide
challenges previously listed apply equally to the state of transportation systems at the regional
level. At its core, the Region’s transportation facilities –
ports, airports, roadways - must balance the needs of a
growing population, and increasingly diversified economy
with its demands for mobility of both people and freight.
The Florida Department of Transportation (FDOT) has for
the last few years been working to develop a seamless
transportation system designed to enhance Florida's
economic competitiveness. This system, known as the
Strategic Intermodal System, comprises transportation
facilities and services of statewide and interregional
significance. In the Treasure Coast Region, the SIS includes
commercial airports, deepwater ports, freight rail terminals,
passenger rail, rail corridors, waterways and highways.
In order to continue to develop this seamless system, FDOT
will designate new types of transit and roadway connectors
between SIS hubs and provide funding to accommodate
pedestrians, bicycles and local transit vehicles at SIS
passenger terminals. SIS priorities are geared toward
improving access to existing employment centers and
supporting statewide targeted industries.
The designated SIS seaport in the region is the Port of Palm
Beach. The Port of Palm Beach is the 4th busiest container
Figure 16
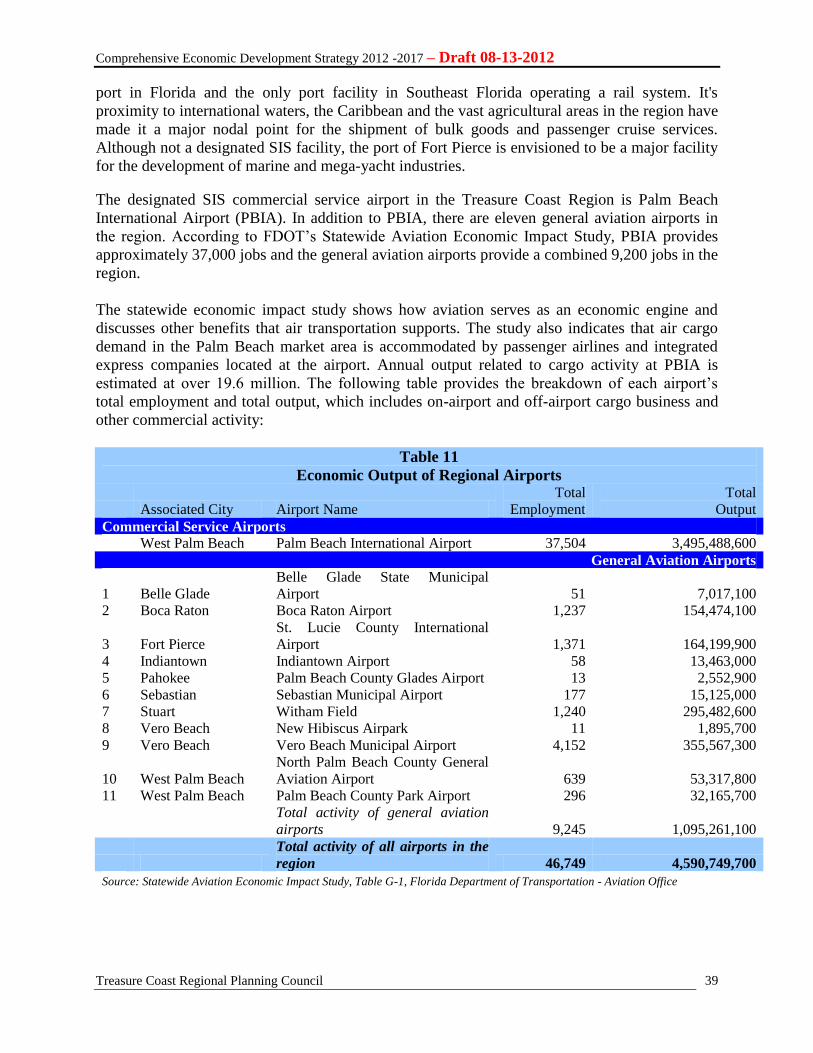
Comprehensive Economic Development Strategy 2012 -2017 – Draft 08-13-2012
Treasure Coast Regional Planning Council
39
port in Florida and the only port facility in Southeast Florida operating a rail system. It's
proximity to international waters, the Caribbean and the vast agricultural areas in the region have
made it a major nodal point for the shipment of bulk goods and passenger cruise services.
Although not a designated SIS facility, the port of Fort Pierce is envisioned to be a major facility
for the development of marine and mega-yacht industries.
The designated SIS commercial service airport in the Treasure Coast Region is Palm Beach
International Airport (PBIA). In addition to PBIA, there are eleven general aviation airports in
the region. According to FDOT’s Statewide Aviation Economic Impact Study, PBIA provides
approximately 37,000 jobs and the general aviation airports provide a combined 9,200 jobs in the
region.
The statewide economic impact study shows how aviation serves as an economic engine and
discusses other benefits that air transportation supports. The study also indicates that air cargo
demand in the Palm Beach market area is accommodated by passenger airlines and integrated
express companies located at the airport. Annual output related to cargo activity at PBIA is
estimated at over 19.6 million. The following table provides the breakdown of each airport’s
total employment and total output, which includes on-airport and off-airport cargo business and
other commercial activity:
Table 11
Economic Output of Regional Airports
Associated City Airport Name
Total
Employment
Total
Output
Commercial Service Airports
West Palm Beach Palm Beach International Airport 37,504 3,495,488,600
General Aviation Airports
1 Belle Glade
Belle Glade State Municipal
Airport 51 7,017,100
2 Boca Raton Boca Raton Airport 1,237 154,474,100
3 Fort Pierce
St. Lucie County International
Airport 1,371 164,199,900
4 Indiantown Indiantown Airport 58 13,463,000
5 Pahokee Palm Beach County Glades Airport 13 2,552,900
6 Sebastian Sebastian Municipal Airport 177 15,125,000
7 Stuart Witham Field 1,240 295,482,600
8 Vero Beach New Hibiscus Airpark 11 1,895,700
9 Vero Beach Vero Beach Municipal Airport 4,152 355,567,300
10 West Palm Beach
North Palm Beach County General
Aviation Airport 639 53,317,800
11 West Palm Beach Palm Beach County Park Airport 296 32,165,700
Total activity of general aviation
airports 9,245 1,095,261,100
Total activity of all airports in the
region 46,749 4,590,749,700
Source: Statewide Aviation Economic Impact Study, Table G-1, Florida Department of Transportation - Aviation Office

Comprehensive Economic Development Strategy 2012 -2017 – Draft 08-13-2012
Treasure Coast Regional Planning Council
40
Intermodal Logistics Center
The Port of Palm Beach, located in the City of Riviera Beach, has taken a comprehensive look at
its long term growth potential. Currently, the port is a landlocked facility without adequate
physical expansion opportunities. To address this situation, the Port has developed the concept
for an inland port facility in western Palm Beach County. The facility would serve the Port as a
direct extension of its waterside terminal.
The Inland port would also help ease intermodal freight movement by shifting it westward from
the increasingly congested South Florida highway and rail corridors. The project would also
build additional rail connections to alleviate a good portion of the freight traffic to the west and
create an inland cargo terminal to provide a distribution hub. The inland port would likely
become an SIS facility and therefore would receive accelerated funding from state and federal
sources for both rail and roadway improvements that would improve access to the site.
At least two potential locations for
inland ports have been identified for the
Treasure Coast Region. One potential
location is in western Palm Beach
County and another site has been
identified in western St. Lucie County.
The potential western Palm Beach
County inland port, according to the
Martin/St. Lucie 2035 Regional Long
Range Transportation Plan, would be
located on an 850 acre site owned by
Florida Crystals Corporation located
between Belle Glade and South Bay.
Recently, Florida Crystals Corporation
and IDI, one of the largest privately
held logistics real estate companies in
North America, have entered into a
strategic alliance for the planning and
marketing of the South Florida
Intermodal Logistics Center (SFILC) in
western Palm Beach County.
Previously, Florida Crystals’ 850-acre site had received certain approvals from Palm Beach
County to allow the industrial and warehouse uses related to the development of an intermodal
logistics center on the site.
An alternative site under consideration is located in St. Lucie County at what was previously
known as the Treasure Coast Intermodal Campus. The Florida Inland Port is seeking to build a
cargo distribution center on 4,000 acres in western St. Lucie County.
Figure 17
Potential Inland Port
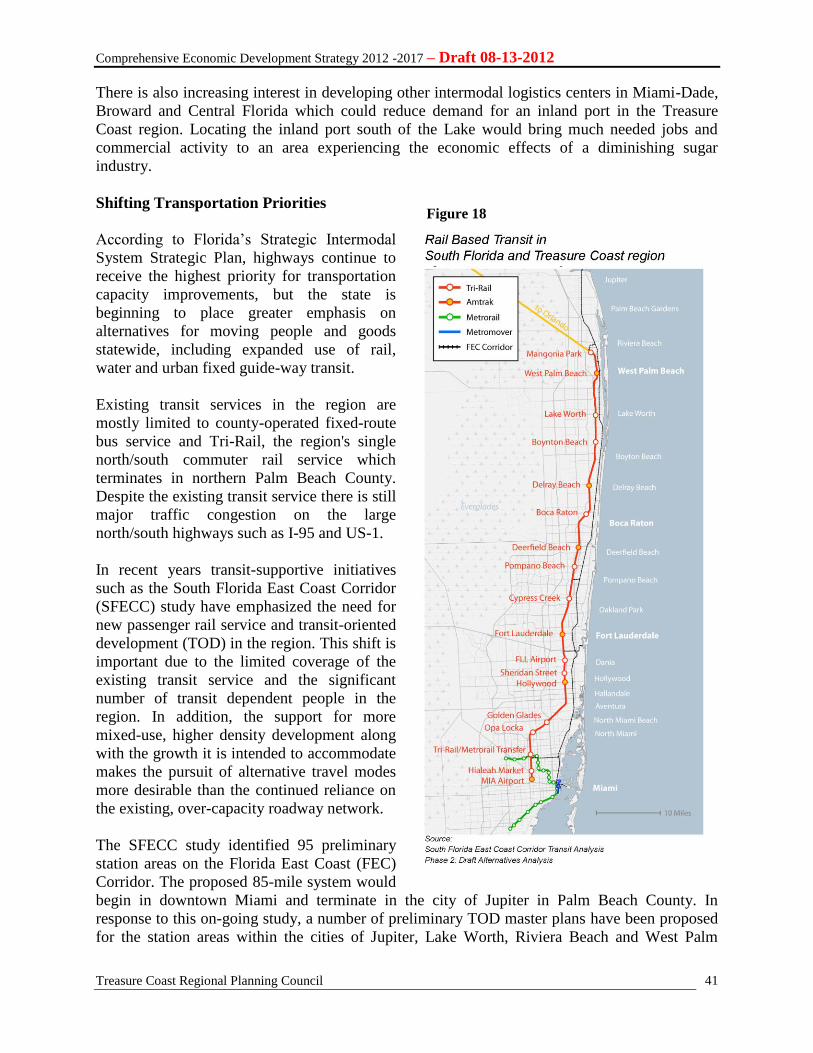
Comprehensive Economic Development Strategy 2012 -2017 – Draft 08-13-2012
Treasure Coast Regional Planning Council
41
Figure 18
There is also increasing interest in developing other intermodal logistics centers in Miami-Dade,
Broward and Central Florida which could reduce demand for an inland port in the Treasure
Coast region. Locating the inland port south of the Lake would bring much needed jobs and
commercial activity to an area experiencing the economic effects of a diminishing sugar
industry.
Shifting Transportation Priorities
According to Florida’s Strategic Intermodal
System Strategic Plan, highways continue to
receive the highest priority for transportation
capacity improvements, but the state is
beginning to place greater emphasis on
alternatives for moving people and goods
statewide, including expanded use of rail,
water and urban fixed guide-way transit.
Existing transit services in the region are
mostly limited to county-operated fixed-route
bus service and Tri-Rail, the region's single
north/south commuter rail service which
terminates in northern Palm Beach County.
Despite the existing transit service there is still
major traffic congestion on the large
north/south highways such as I-95 and US-1.
In recent years transit-supportive initiatives
such as the South Florida East Coast Corridor
(SFECC) study have emphasized the need for
new passenger rail service and transit-oriented
development (TOD) in the region. This shift is
important due to the limited coverage of the
existing transit service and the significant
number of transit dependent people in the
region. In addition, the support for more
mixed-use, higher density development along
with the growth it is intended to accommodate
makes the pursuit of alternative travel modes
more desirable than the continued reliance on
the existing, over-capacity roadway network.
The SFECC study identified 95 preliminary
station areas on the Florida East Coast (FEC)
Corridor. The proposed 85-mile system would
begin in downtown Miami and terminate in the city of Jupiter in Palm Beach County. In
response to this on-going study, a number of preliminary TOD master plans have been proposed
for the station areas within the cities of Jupiter, Lake Worth, Riviera Beach and West Palm

Comprehensive Economic Development Strategy 2012 -2017 – Draft 08-13-2012
Treasure Coast Regional Planning Council
42
Beach. The recommended preliminary development programs for these master plans generally
calls for mixed-use development around the stations which include residential, office and retail
uses.
In March 2012, the South Florida Regional Transportation Authority announced its Fast Start
plan to bring passenger service to the FEC railway corridor in a 3-5 year time frame. The Fast
Start plan proposes a new, limited FEC regional service between Jupiter and Miami in addition
to the current Tri-Rail service.
The other form of passenger rail service in the Region is Amtrak, which operates long-distance
service through Florida on the CSX tracks. Since 2000, there has been active discussion
regarding potential expansion of Amtrak on the FEC Corridor from Jacksonville to West Palm
Beach, with service interconnecting in West Palm Beach to the CSX Corridor and continuing
south on the CSX into Miami. The project remains a long-term opportunity to expand the
Region’s passenger rail network, and if operational agreements to initiate service are
accomplished, 2015 is likely the earliest date for service to begin operation.
Strategic Finding: Maintenance of the Region's existing roadway network and enhancement
of airside, waterside, rail, mass transit and distribution infrastructure are needed to increase the
mobility and efficiency of the movement of people and goods. Moreover, an enhanced and
dependable communications infrastructure network promotes the rapid and free flow of
information which is increasingly important in an inter-connected world. Continued
improvement is needed in order to enhance the Region's attractiveness and competitive edge for
economic development.
Water Systems
Florida’s water management districts are
charged with the goal of ensuring an
adequate supply of water to protect
natural systems and to meet all existing
and projected reasonable beneficial uses,
while sustaining water resources for
future generations. The water
management districts are responsible for
the development of comprehensive
water supply plans customized to each
region that are key to identifying and
understanding current and future water
needs.
Additionally, to meet the growing demand for potable water and ensure that resources are
available, the State of Florida requires all local governments to submit:
10-year Water Supply Facilities Work Plan
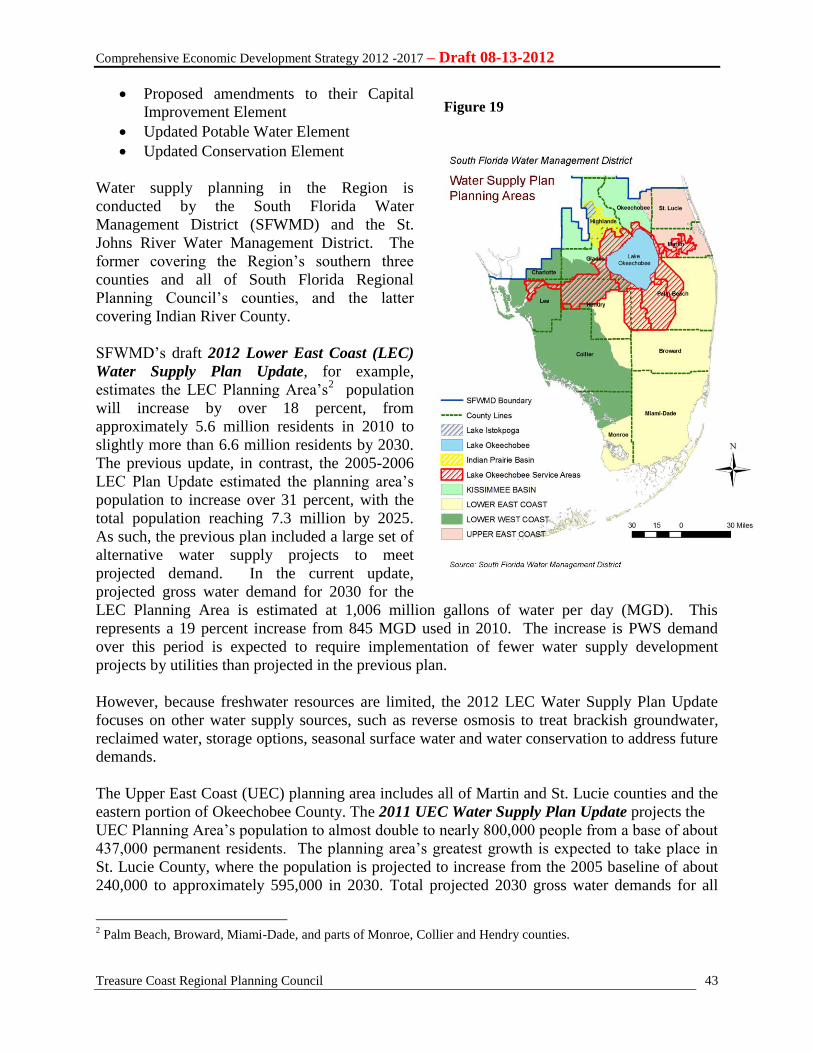
Comprehensive Economic Development Strategy 2012 -2017 – Draft 08-13-2012
Treasure Coast Regional Planning Council
43
Proposed amendments to their Capital
Improvement Element
Updated Potable Water Element
Updated Conservation Element
Water supply planning in the Region is
conducted by the South Florida Water
Management District (SFWMD) and the St.
Johns River Water Management District. The
former covering the Region’s southern three
counties and all of South Florida Regional
Planning Council’s counties, and the latter
covering Indian River County.
SFWMD’s draft 2012 Lower East Coast (LEC)
Water Supply Plan Update, for example,
estimates the LEC Planning Area’s2 population
will increase by over 18 percent, from
approximately 5.6 million residents in 2010 to
slightly more than 6.6 million residents by 2030.
The previous update, in contrast, the 2005-2006
LEC Plan Update estimated the planning area’s
population to increase over 31 percent, with the
total population reaching 7.3 million by 2025.
As such, the previous plan included a large set of
alternative water supply projects to meet
projected demand. In the current update,
projected gross water demand for 2030 for the
LEC Planning Area is estimated at 1,006 million gallons of water per day (MGD). This
represents a 19 percent increase from 845 MGD used in 2010. The increase is PWS demand
over this period is expected to require implementation of fewer water supply development
projects by utilities than projected in the previous plan.
However, because freshwater resources are limited, the 2012 LEC Water Supply Plan Update
focuses on other water supply sources, such as reverse osmosis to treat brackish groundwater,
reclaimed water, storage options, seasonal surface water and water conservation to address future
demands.
The Upper East Coast (UEC) planning area includes all of Martin and St. Lucie counties and the
eastern portion of Okeechobee County. The 2011 UEC Water Supply Plan Update projects the
UEC Planning Area’s population to almost double to nearly 800,000 people from a base of about
437,000 permanent residents. The planning area’s greatest growth is expected to take place in
St. Lucie County, where the population is projected to increase from the 2005 baseline of about
240,000 to approximately 595,000 in 2030. Total projected 2030 gross water demands for all
2 Palm Beach, Broward, Miami-Dade, and parts of Monroe, Collier and Hendry counties.
Figure 19
Comprehensive Economic Development Strategy 2012 -2017 – Draft 08-13-2012
Treasure Coast Regional Planning Council
44
water use categories are an estimated 320-340 MGD. In addition, the public water supply gross
demands are expected to more than double from the 2005 baseline of 45 million gallons per day
to 96 million gallons per day by 2030. To meet the future water demand, the Plan Update
advocates continued diversification of water supply sources, such as increased use of the Upper
Floridian aquifer and reclaimed water, as well as increased emphasis on water conservation
measures.
Strategic Finding: Existing demand and environmental constraints will continue to limit
development of traditional water supply sources pushing the need for alternative water supplies
or nontraditional sources including seawater or brackish water, surface water captured during
wet-weather flows, new storage capacity and reclaimed water.
Electricity
Electrical energy is supplied to Treasure Coast residents primarily by investor-owned private
utilities and publicly-run utilities. Florida Power & Light Company (FPL), an investor-owned
utility provides electricity to all of the Region’s four counties. FPL currently provides electricity
to 4.5 million homes and businesses in Florida. Municipal electric utilities in the Region include
facilities located in Vero Beach, Fort Pierce and Lake Worth – all members of the Florida
Municipal Power Agency (FMPA).
Both public and private utilities use a mix of fuels to generate electricity. In 2010, FPL’s
electricity was generated by a fuel mix of 58.4 percent natural gas, 20 percent nuclear, 12.8
percent purchased power, 3.8 percent oil and 5 percent coal. Each year every electric utility in
the State of Florida produces a ten year site plan that includes an estimate of future electric
power generating needs. The purpose of the ten year site plan is to disclose the general location
of proposed power plant sites and facilitate coordinated planning efforts. The Florida Public
Service Commission requests Council review of ten year site plans produced by both private and
public utilities. Most recently, Council reviewed a ten year site plan prepared by FPL.
The 2012 FPL Ten Year Power Plant Site Plan indicates that after demand side management efforts and
significant energy efficiency contributions from the federal appliance and lighting efficiency standards are
factored in, FPL will still require additional capacity from conventional power plants to meet future
electrical demand. FPL is proposing to add a total of 250 megawatts of summer capacity to its system
from 2012 to 2021. FPL plans to obtain additional electricity through: 1) power purchases from
qualifying facilities, utilities and other entities; 2) upgrades to existing facilities; 3) returning inactive
reserve units to active status; and 4) modernization of existing facilities.
Strategic Finding: Maintaining and growing a reliable and consistent supply of energy is critical
to the Region’s economic competitiveness and sustainability. To help meet this goal the Region
needs to decrease its vulnerability to fuel price increases and supply interruptions related to the
energy industry. Electrical utilities need to diversify their fuel types in order to accomplish this
goal. The Region and State of Florida should focus on developing new programs to:
1. Reduce the reliance on fossil fuels as future energy sources;
2. Increase conservation activities to offset the need to construct new power plants; and
3. Increase the reliance of clean alternative energy systems to produce electricity.
Comprehensive Economic Development Strategy 2012 -2017 – Draft 08-13-2012
Treasure Coast Regional Planning Council
45
d. Climate Change and Energy
The regional economy and quality of life are highly dependent on tourism, recreation, and
agriculture. However, there are concerns that global climate change may significantly affect the
Region’s major industries. At the state level, these concerns have been described in Florida’s
Energy & Climate Change Action Plan, which was produced by the Governor’s Action Team on
Energy & Climate Change in 2008 following the guidance provided in Executive Order 07-128
by Florida Governor Charlie Crist. The Action Plan provides a framework for a coordinated
effort to secure Florida’s energy future, reduce greenhouse gas emissions, and heavily support
and sustain strategic economic development in the emerging “green tech” sector.
At the regional level, the Southeast Florida Regional Climate Change Compact represents a joint
commitment of Broward, Miami-Dade, Palm Beach and Monroe counties to partner in mitigating
the causes and adapting to the consequences of climate change. The Compact was formalized in
2009 when elected officials came together to discuss challenges and strategies for responding to
the impacts of climate change. The Compact outlines an on-going collaborative effort to foster
sustainability and climate resilience at a regional scale. Efforts are currently under way to expand
the Southeast Florida Regional Climate Change Compact to include Indian River, Martin, and
St. Lucie counties.
Foremost among the concerns related to climate change is the potential impact of sea level rise on the
coastal counties. As part of an ongoing program evaluating global climate change, the US
Environmental Protection Agency (EPA) initiated a nationwide project promoting planning for
and awareness of sea level rise. Council participated in this program and in 2005 completed the
report, Sea Level Rise in the Treasure Coast Region. The report contains maps of the Treasure
Coast Region that distinguish the shores that are likely to be protected from erosion, inundation,
and flooding, from those areas where natural shoreline retreat is likely to take place. The report is
designed to support the EPA’s national effort encouraging the long-term thinking required to
deal with the issues associated with sea level rise. The ultimate goal of the project is to diminish
losses to life and property from coastal hazards, such as erosion and inundation, and to ensure the
long-term survival of coastal wetlands.
The study followed the general approach of other sea level rise planning studies sponsored by the
EPA. The statewide approach for identifying likelihood of land use protection characterized all
uplands from 0 to 10 feet in elevation and within 1000 feet of shoreline into the following four
general categories: protection almost certain; protection reasonably likely; protection unlikely;
and no protection. Application of the state-wide approach in the Region resulted in the
identification of 119,157 acres (83.3%) of uplands and 23,927 acres (16.7%) of wetlands in the
study area. Regionally, the “Protection Almost Certain” category accounted for 77.0% of the
uplands in the study area. This was followed by “Protection Reasonably Likely” (6.7%),
“Protection Unlikely” (10.7%), and “No Protection” (5.6%). A clear regional trend exists,
reflecting an increase in the number of acres in the “Protection Almost Certain” category when
moving north to south from Indian River County to Palm Beach County. A total of 34
municipalities in the four counties of the Treasure Coast Region are likely to be impacted by sea
level rise in the future. The report encourages local government planners and citizens to consider

Comprehensive Economic Development Strategy 2012 -2017 – Draft 08-13-2012
Treasure Coast Regional Planning Council
46
the problem of sea level rise. This project represents the first step in planning for sea level rise in
the Treasure Coast Region.
Council has long been an advocate of good energy planning. In 1999, Council adopted an energy
planning guide, Energy Planning in the Twenty-First Century, A Guide for Florida Communities.
The document, which was updated in 2009, includes major sections dealing with coordinated
energy planning, reduced impacts from power generating facilities, reduced impacts from
electric power lines, energy efficiency and conservation, greater use of solar and other renewable
energy resources, sustainable communities, energy efficient buildings, energy efficient
transportation systems and a new regional economy based on renewable resources. The energy-
planning guide includes a comprehensive set of energy-related goals, strategies and policies. The
guide also encourages companies that produce renewable resource and energy efficient products,
such as photovoltaic systems and solar water heaters, to establish manufacturing facilities in the
region. The guide is intended to enhance awareness of energy issues and lead to a cleaner
environment, more sustainable forms and patterns of development, and a higher quality of life.
e. Environment
Everglades Restoration Critical to Region’s Future
The Treasure Coast Region is a region of abundant resources and a highly desirable quality life.
The quality of life enjoyed in the Region depends on the conservation of the natural environment
and the countryside. While much of the Region still remains as countryside, at least 80 percent
of the Region’s natural environment has been altered or lost. The main threat to remaining
natural systems and the countryside is not growth, but sprawling suburban growth which due to
its inefficient development form has required ever-increasing acreage to deliver an acceptable
quality of life. Therefore, the solution to environmental problems is found in part in the form of
development. Public and private sectors need to encourage a more system-wide approach to
protect complete natural systems and to address the inadequacies of existing land use planning
and development strategies to protect complete natural systems. Efforts need to be made to
promote patterns of development that preserve and manage complete natural systems as a
network of greenways and wildlife corridors connecting natural preserves and prevent sprawl.
The quality of life and the Region’s environment and economy also are intimately tied to the
proper and prudent management of its water resources. Sectors competing for limited water
resources within the Region include: natural systems; agriculture; and domestic, municipal, and
industrial users. Future increases in needs of these users will cause competition to increase
between all sectors for existing water supplies, and will necessitate more efficient use of water.
The Region’s water resources should be managed to provide for all recognized needs on a
sustainable basis. The stakes involved in water management are huge: Florida Bay, the
Everglades, Lake Okeechobee, the Region’s estuaries and wildlife, and the health of the
Region’s economy.
The Everglades ecosystem requires special attention because of its large size, economic and
environmental importance, and the State’s commitment to protect this system is part of creating a
Comprehensive Economic Development Strategy 2012 -2017 – Draft 08-13-2012
Treasure Coast Regional Planning Council
47
Sustainable South Florida. The Everglades ecosystem is a massive watershed spreading over
9,000 square miles in southern Florida. This system includes a series of interconnected fresh
water rivers, lakes, marshes, prairies, forests and estuaries that stretch from the Kissimmee River
Basin, Lake Okeechobee, the Everglades, Big Cypress Swamp and the estuaries of Florida Bay
and the Ten Thousand Islands. This system occurs in all or part of 16 counties. Within the
Treasure Coast Region, portions of St. Lucie, Martin, and Palm Beach Counties are located
within the Everglades ecosystem.
Both the economy and natural resources of South Florida depend on the health of the Everglades
ecosystem. Approximately 6 million residents and 17 million visitors yearly depend on this
system for domestic, agricultural, and industrial water supply; as well as for income and
recreation. Furthermore, thousands of plant and animal species, many of which are endangered
and potentially endangered, depend on the clean, free-flowing water and expansive natural areas
of the Everglades ecosystems for survival.
Historically, water flowed slowly through the Everglades ecosystem through the chain of lakes in
the Kissimmee River Basin, into Lake Okeechobee, and then southward through the Everglades
proper, and into Florida Bay. The Everglades once covered about 4 million acres and was
characterized as a slowly moving sheet of freshwater drifting southward.
During the last 100 years, drainage of lakes, swamps, and marshes and alteration of the flow of
water has resulted in the permanent loss of over half the original Everglades. The drainage was
primarily to make the area more suitable for urban and agricultural development. Channelization
of the Kissimmee River destroyed over 40,000 acres of wetlands, and diminished fish and
wildlife habitat. Agricultural runoff and water diversion degraded Lake Okeechobee and the
Everglades. Roads, canals, levees, and water control structures have disrupted water flow to the
Everglades, Big Cypress Swamp, Florida Bay and Ten Thousand Islands estuaries. Within the
Treasure Coast Region, much of what was originally Everglades wetlands south and southeast of
Lake Okeechobee has been converted to the production of sugar cane.
In order to correct the problems with the existing water management system affecting the
Everglades, the US Army Corps of Engineers (COE) and SFWMD released the Central and
Southern Florida (C&SF) Project Comprehensive Review Study in 1999. The primary goals of
this project, known as the Restudy, were to restore natural ecosystems, increase regional water
supplies, improve water quality, and maintain flood protection in the project area. The resulting
plan is known as the Comprehensive Everglades Restoration Plan (CERP). The plan contains
more than 50 projects designed to work in concert with many other ongoing and planned
environmental restoration projects of the Federal Government, State of Florida, and local
partners. Major components of the plan include the creation of approximately 181,000 acres of
new reservoirs, 35,600 acres of stormwater treatment areas, and more than 300 underground
water storage wells. These components will greatly increase water storage and greatly increase
the water supply for natural systems, urban and agricultural needs. In addition, the components
of the plan are designed to restore more natural flows to waterbodies, improve water quality, and
restore natural hydroperiods. The most recent estimates indicate that CERP will cost an
estimated $10.5 billion and will take 30 years to construct and implement. Completion of CERP
will require a continued commitment to fund the project by the U.S. Congress and State of
Florida.

Comprehensive Economic Development Strategy 2012 -2017 – Draft 08-13-2012
Treasure Coast Regional Planning Council
48
One of the first components of CERP to be implemented in the Treasure Coast Region is known
as the Indian River Lagoon – South Feasibility Study. The purpose of this project is to
investigate structural and operational changes to the C&SF project to improve the quality of the
environment, protect the aquifer, and help to conserve urban and agricultural water supplies. The
study examines alternative surface water management options in the South Indian River Lagoon
watershed in Martin and St. Lucie Counties. The report focuses on alternative plans that benefit
the receiving bodies of water by improving water deliveries and water quality. The report also
identifies an adaptive implementation strategy based on monitoring, evaluation, refinement and
modeling. This strategy recognizes that after each component of the project is constructed and
tested, feedback based on new insights gained on the response of the system may require that
adjustments be made to the project.
In 2004, the Final Integrated Project Implementation Report and Environmental Impact
Statement for the Indian River Lagoon – South project was released. The recommended plan
includes building and operating approximately 12,000 acres of above ground storage reservoirs,
9,000 acres of manmade wetlands, restoring natural hydrology on approximately 90,000 acres of
natural areas including 53,000 acres of restored wetlands, and muck removal and habitat
restoration inside the estuaries. The recommended plan is expected to provide significant
restoration of degraded areas in the southern Indian River Lagoon and will have a positive
impact on other water-related needs of the region including increased water supplies, improved
water quality, and the maintenance of flood protection. The total initial cost of the recommended
plan for the Indian River Lagoon – South project is estimated to be $1.3 billion.
The Indian River Lagoon - South project represents an opportunity to restore impacted natural
systems, maintain a healthy environment, and balance the need to provide water for natural
systems and urban and agricultural uses in Martin and St. Lucie counties. Other parts of the
Region eagerly await the completion of other CERP projects, including the Indian River
Lagoon – North project, which includes parts of Indian River County, and the North Palm Beach
County – Part 1 project, which includes the Loxahatchee River watershed and northern Palm
Beach County. Implementation of these plans will help to protect and restore the environment
and build a strong economy in the Region.
Comprehensive Economic Development Strategy 2012 -2017 – Draft 08-13-2012
Treasure Coast Regional Planning Council
49
PART III: CLUSTER INDUSTRY PROFILE
a. Overview
Clusters are the economic drivers of a region because they produce goods and services that are
sold outside of the region, generating income that fuels the rest of the regional economy.
Economic developers recognize that without these economic drivers, a region would only
circulate money already in the local economy, losing economic momentum over time. By
identifying industry clusters and focusing on meeting their needs, a region can attract wealth and
increase prosperity for all residents. Focus on the region’s cluster industries can help a region
adapt to economic change. If regional leaders, planners, educational, financial and business
institutions understand the issues facing key regional clusters, they will be in a better position to
respond to cluster needs.
What is a Cluster?
The Council on Competitiveness defines an industry cluster as a group of firms, related
economic actors, and institutions that are located near one another and that draw productive
advantage from their mutual proximity and connections. Industry clusters are the key to
understanding the performance of regional economies and the competitiveness of individual
firms. The economic performance of the Treasure Coast Region is dependent, in large part on its
industrial composition and its industry clusters.
The Brookings Institute makes the case, in its monograph Job Creation on a Budget: How
Regional Industry Clusters Can Add Jobs, Bolster Entrepreneurship, and Spark Innovation, that
properly designed cluster strategies are a low-cost way to stimulate innovation, new-firm start-
ups, and job creation by helping to link and align the many factors that influence firm and
regional growth. Further, Brookings suggests that states should:
Develop and use data and rigorous analysis to identify industry clusters, target
policy and track performance
Establish a modest grants program to address discrete gaps in cluster performance
Reorient existing economic development programs, policies and initiatives to
support clusters
b. Cluster Identification and Analysis
The Region’s industry clusters are examined through the use of two analyses: Location
Quotients3 and Shift-Share Analysis
4. In this study, we adopt the set of seventeen (17)
3 A location quotient (LQ) compares the fraction of the region’s employment in a particular industry cluster to the
fraction of the nation’s employment in the same industry cluster. An LQ equal to one indicates the region employs
the same fraction of its workforce in the industry as does the nation as a whole. When the LQ exceeds 1.0, the
region is said to “specialize” in that particular industry cluster. 4 Shift-share analysis is a method to account for the competitiveness of a region’s industries and to analyze the local
economic base. Shift-share analysis attempts to explain the changes (employment) in the region’s economy that is
attributable to growth of the national economy, a mix of faster or slower than average growing industries and the
competitive nature of the local industries.
Comprehensive Economic Development Strategy 2012 -2017 – Draft 08-13-2012
Treasure Coast Regional Planning Council
50
benchmark industry cluster definitions developed by the Indiana Business Research Center
(IBRC) with the Center for Regional Development at Purdue University under a grant from the
U.S. Economic Development Administration to provide, a set of industry clusters and associated
data that can be readily accessed by regions and economic development districts across America.
The research team at the “Innovation in American Region’s” website has identified the following
seventeen industry clusters that TCRPC examined:
The 17 Clusters and Six Subclusters
1. Advanced Materials
2. Agribusiness, Food Processing and Technology
3. Apparel and Textiles
4. Arts, Entertainment, Recreation and Visitor Industries
5. Biomedical/Biotechnical (Life Sciences)
6. Business and Financial Services
7. Chemicals and Chemical-Based Products
8. Defense and Security
9. Education and Knowledge Creation
10. Energy (Fossil and Renewable)
11. Forest and Wood Products
12. Glass and Ceramics
13. Information Technology and Telecommunications
14. Transportation and Logistics
15. Manufacturing Supercluster
1. Primary Metals
2. Fabricated Metal Products
3. Machinery
4. Computer and Electronic Products
5. Electrical Equipment, Appliance and Components
6. Transportation Equipment
16. Mining
17. Printing and Publishing
The manufacturing supercluster was subsequently disaggregated into six more-specialized sub-
clusters. The aggregated industry cluster definitions are provided in Appendix x.
The Region’s industry clusters were evaluated in the following manner:
Number of employees
Number of establishments
Location quotient in 2010
Change in location quotient, 2005-2010
Figure 20 illustrates the 17 clusters’ employment size, LQ and change in LQ. Bubbles in the
chart fall into one of four quadrants: Stars, Mature, Emerging and Transforming.
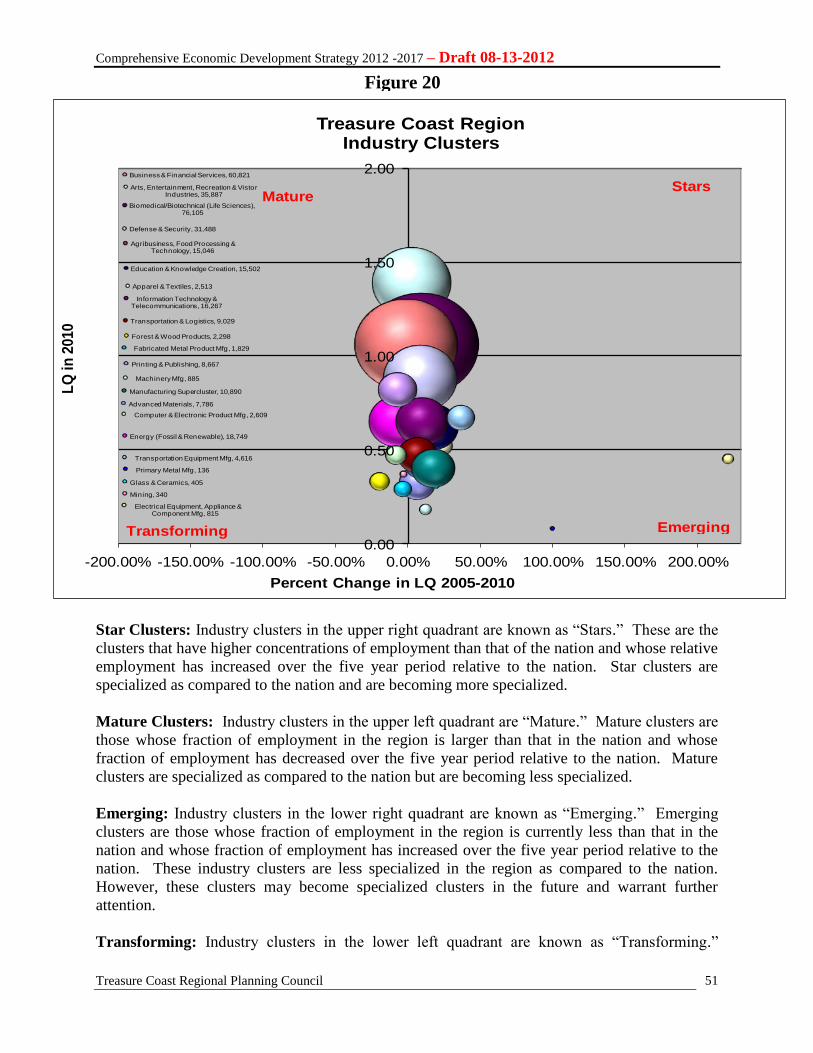
Comprehensive Economic Development Strategy 2012 -2017 – Draft 08-13-2012
Treasure Coast Regional Planning Council
51
Star Clusters: Industry clusters in the upper right quadrant are known as “Stars.” These are the
clusters that have higher concentrations of employment than that of the nation and whose relative
employment has increased over the five year period relative to the nation. Star clusters are
specialized as compared to the nation and are becoming more specialized.
Mature Clusters: Industry clusters in the upper left quadrant are “Mature.” Mature clusters are
those whose fraction of employment in the region is larger than that in the nation and whose
fraction of employment has decreased over the five year period relative to the nation. Mature
clusters are specialized as compared to the nation but are becoming less specialized.
Emerging: Industry clusters in the lower right quadrant are known as “Emerging.” Emerging
clusters are those whose fraction of employment in the region is currently less than that in the
nation and whose fraction of employment has increased over the five year period relative to the
nation. These industry clusters are less specialized in the region as compared to the nation.
However, these clusters may become specialized clusters in the future and warrant further
attention.
Transforming: Industry clusters in the lower left quadrant are known as “Transforming.”
Advanced Materials, 7,786
Agribusiness, Food Processing & Technology, 15,046
Apparel & Textiles, 2,513
Arts, Entertainment, Recreation & Vistor Industries, 35,887
Biomedical/Biotechnical (Life Sciences), 76,105
Business & Financial Services, 60,821
Defense & Security, 31,488
Education & Knowledge Creation, 15,502
Energy (Fossil & Renewable), 18,749
Forest & Wood Products, 2,298
Glass & Ceramics, 405
Information Technology & Telecommunications, 16,267
Transportation & Logistics, 9,029
Manufacturing Supercluster, 10,890
Primary Metal Mfg, 136
Fabricated Metal Product Mfg, 1,829
Machinery Mfg, 885
Computer & Electronic Product Mfg, 2,609
Electrical Equipment, Appliance & Component Mfg, 815
Transportation Equipment Mfg, 4,616
Mining, 340
Printing & Publishing, 8,667
0.00
0.50
1.00
1.50
2.00
-200.00% -150.00% -100.00% -50.00% 0.00% 50.00% 100.00% 150.00% 200.00%
LQ
in
2010
Percent Change in LQ 2005-2010
Treasure Coast Region Industry Clusters
Stars
Emerging
Mature
Transforming
Figure 20
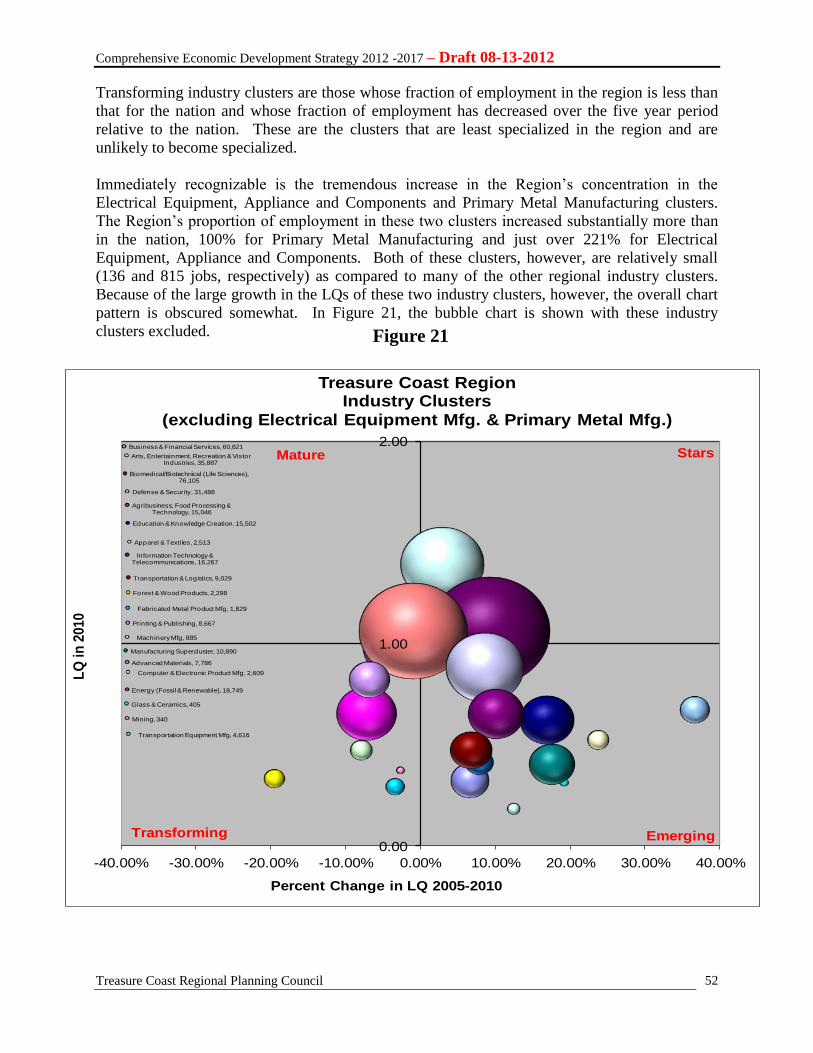
Comprehensive Economic Development Strategy 2012 -2017 – Draft 08-13-2012
Treasure Coast Regional Planning Council
52
Transforming industry clusters are those whose fraction of employment in the region is less than
that for the nation and whose fraction of employment has decreased over the five year period
relative to the nation. These are the clusters that are least specialized in the region and are
unlikely to become specialized.
Immediately recognizable is the tremendous increase in the Region’s concentration in the
Electrical Equipment, Appliance and Components and Primary Metal Manufacturing clusters.
The Region’s proportion of employment in these two clusters increased substantially more than
in the nation, 100% for Primary Metal Manufacturing and just over 221% for Electrical
Equipment, Appliance and Components. Both of these clusters, however, are relatively small
(136 and 815 jobs, respectively) as compared to many of the other regional industry clusters.
Because of the large growth in the LQs of these two industry clusters, however, the overall chart
pattern is obscured somewhat. In Figure 21, the bubble chart is shown with these industry
clusters excluded.
Figure 21
Advanced Materials, 7,786
Agribusiness, Food Processing & Technology, 15,046
Apparel & Textiles, 2,513
Arts, Entertainment, Recreation & Vistor Industries, 35,887
Biomedical/Biotechnical (Life Sciences), 76,105
Business & Financial Services, 60,821
Defense & Security, 31,488
Education & Knowledge Creation, 15,502
Energy (Fossil & Renewable), 18,749
Forest & Wood Products, 2,298
Glass & Ceramics, 405
Information Technology & Telecommunications, 16,267
Transportation & Logistics, 9,029
Manufacturing Supercluster, 10,890
Fabricated Metal Product Mfg, 1,829
Machinery Mfg, 885
Computer & Electronic Product Mfg, 2,609
Transportation Equipment Mfg, 4,616
Mining, 340
Printing & Publishing, 8,667
0.00
1.00
2.00
-40.00% -30.00% -20.00% -10.00% 0.00% 10.00% 20.00% 30.00% 40.00%
LQ
in
2010
Percent Change in LQ 2005-2010
Treasure Coast Region Industry Clusters
(excluding Electrical Equipment Mfg. & Primary Metal Mfg.)
Stars
Emerging
Mature
Transforming
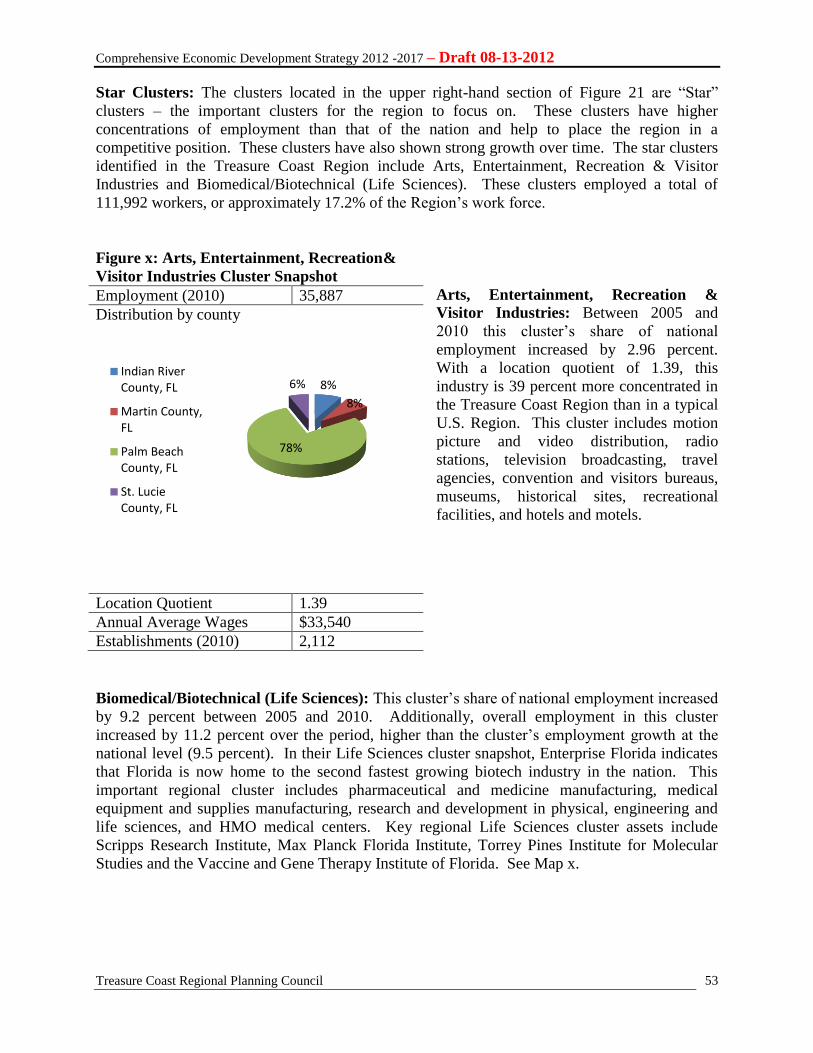
Comprehensive Economic Development Strategy 2012 -2017 – Draft 08-13-2012
Treasure Coast Regional Planning Council
53
Star Clusters: The clusters located in the upper right-hand section of Figure 21 are “Star”
clusters – the important clusters for the region to focus on. These clusters have higher
concentrations of employment than that of the nation and help to place the region in a
competitive position. These clusters have also shown strong growth over time. The star clusters
identified in the Treasure Coast Region include Arts, Entertainment, Recreation & Visitor
Industries and Biomedical/Biotechnical (Life Sciences). These clusters employed a total of
111,992 workers, or approximately 17.2% of the Region’s work force.
Figure x: Arts, Entertainment, Recreation&
Visitor Industries Cluster Snapshot
Arts, Entertainment, Recreation &
Visitor Industries: Between 2005 and
2010 this cluster’s share of national
employment increased by 2.96 percent.
With a location quotient of 1.39, this
industry is 39 percent more concentrated in
the Treasure Coast Region than in a typical
U.S. Region. This cluster includes motion
picture and video distribution, radio
stations, television broadcasting, travel
agencies, convention and visitors bureaus,
museums, historical sites, recreational
facilities, and hotels and motels.
Biomedical/Biotechnical (Life Sciences): This cluster’s share of national employment increased
by 9.2 percent between 2005 and 2010. Additionally, overall employment in this cluster
increased by 11.2 percent over the period, higher than the cluster’s employment growth at the
national level (9.5 percent). In their Life Sciences cluster snapshot, Enterprise Florida indicates
that Florida is now home to the second fastest growing biotech industry in the nation. This
important regional cluster includes pharmaceutical and medicine manufacturing, medical
equipment and supplies manufacturing, research and development in physical, engineering and
life sciences, and HMO medical centers. Key regional Life Sciences cluster assets include
Scripps Research Institute, Max Planck Florida Institute, Torrey Pines Institute for Molecular
Studies and the Vaccine and Gene Therapy Institute of Florida. See Map x.
Employment (2010) 35,887
Distribution by county
Location Quotient 1.39
Annual Average Wages $33,540
Establishments (2010) 2,112
8%
8%
78%
6% Indian RiverCounty, FL
Martin County,FL
Palm BeachCounty, FL
St. LucieCounty, FL
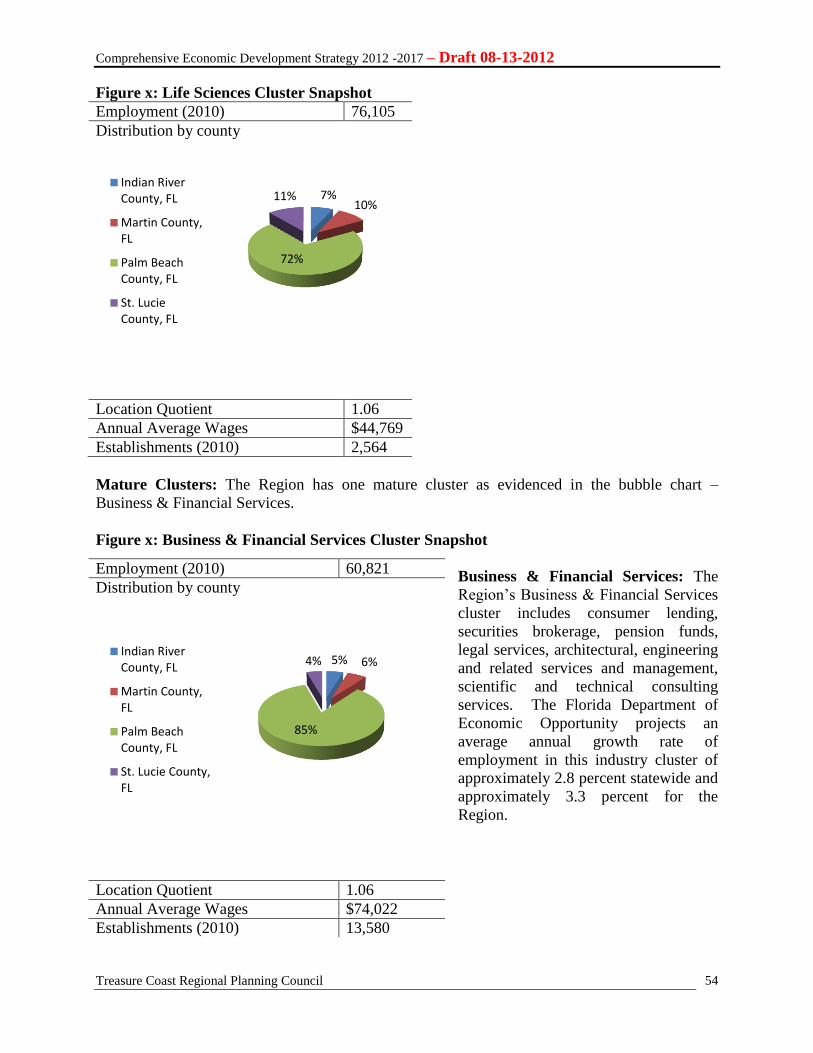
Comprehensive Economic Development Strategy 2012 -2017 – Draft 08-13-2012
Treasure Coast Regional Planning Council
54
Figure x: Life Sciences Cluster Snapshot
Employment (2010) 76,105
Distribution by county
Location Quotient 1.06
Annual Average Wages $44,769
Establishments (2010) 2,564
Mature Clusters: The Region has one mature cluster as evidenced in the bubble chart –
Business & Financial Services.
Figure x: Business & Financial Services Cluster Snapshot
Business & Financial Services: The
Region’s Business & Financial Services
cluster includes consumer lending,
securities brokerage, pension funds,
legal services, architectural, engineering
and related services and management,
scientific and technical consulting
services. The Florida Department of
Economic Opportunity projects an
average annual growth rate of
employment in this industry cluster of
approximately 2.8 percent statewide and
approximately 3.3 percent for the
Region.
7% 10%
72%
11% Indian RiverCounty, FL
Martin County,FL
Palm BeachCounty, FL
St. LucieCounty, FL
Employment (2010) 60,821
Distribution by county
Location Quotient 1.06
Annual Average Wages $74,022
Establishments (2010) 13,580
5% 6%
85%
4% Indian RiverCounty, FL
Martin County,FL
Palm BeachCounty, FL
St. Lucie County,FL
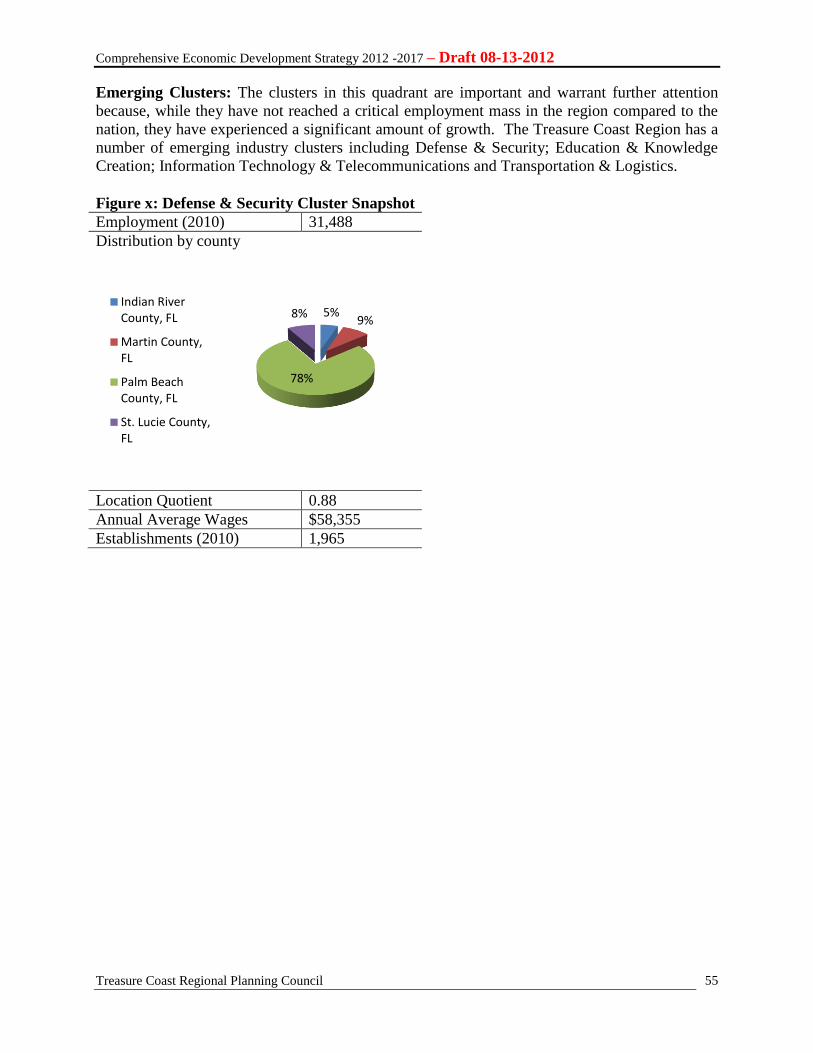
Comprehensive Economic Development Strategy 2012 -2017 – Draft 08-13-2012
Treasure Coast Regional Planning Council
55
Emerging Clusters: The clusters in this quadrant are important and warrant further attention
because, while they have not reached a critical employment mass in the region compared to the
nation, they have experienced a significant amount of growth. The Treasure Coast Region has a
number of emerging industry clusters including Defense & Security; Education & Knowledge
Creation; Information Technology & Telecommunications and Transportation & Logistics.
Figure x: Defense & Security Cluster Snapshot
Employment (2010) 31,488
Distribution by county
Location Quotient 0.88
Annual Average Wages $58,355
Establishments (2010) 1,965
5% 9%
78%
8% Indian RiverCounty, FL
Martin County,FL
Palm BeachCounty, FL
St. Lucie County,FL
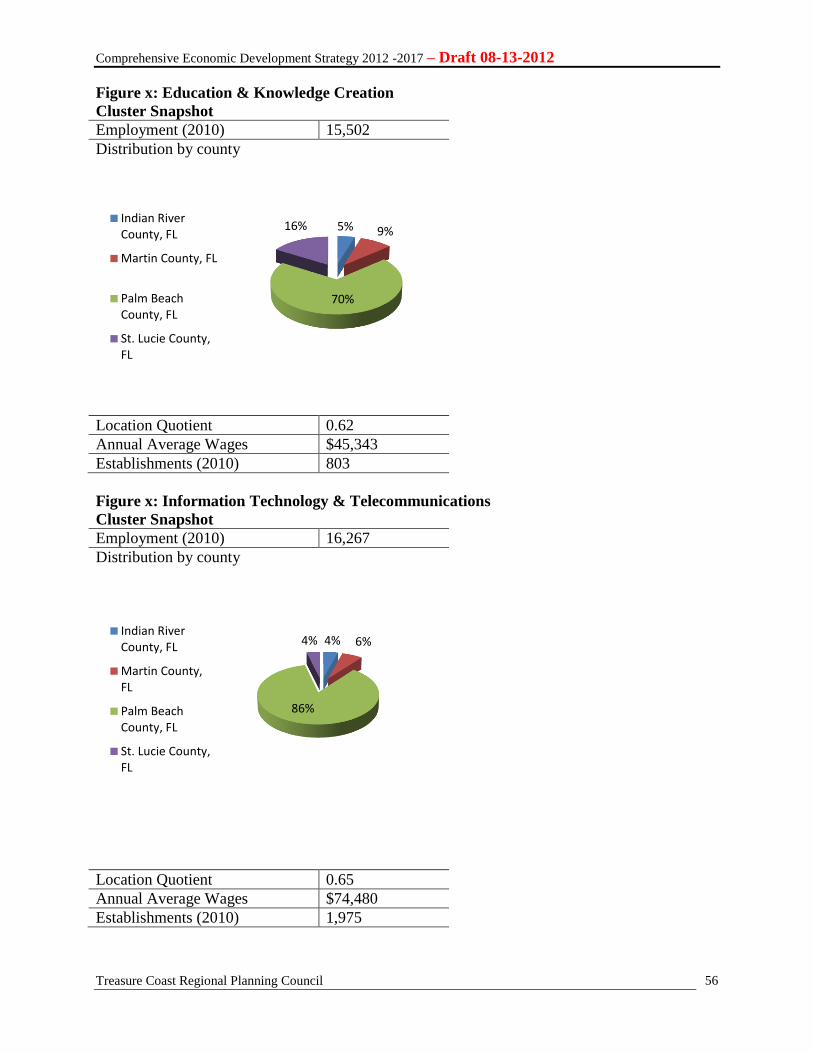
Comprehensive Economic Development Strategy 2012 -2017 – Draft 08-13-2012
Treasure Coast Regional Planning Council
56
Figure x: Education & Knowledge Creation
Cluster Snapshot
Employment (2010) 15,502
Distribution by county
Location Quotient 0.62
Annual Average Wages $45,343
Establishments (2010) 803
Figure x: Information Technology & Telecommunications
Cluster Snapshot
Employment (2010) 16,267
Distribution by county
Location Quotient 0.65
Annual Average Wages $74,480
Establishments (2010) 1,975
5% 9%
70%
16% Indian RiverCounty, FL
Martin County, FL
Palm BeachCounty, FL
St. Lucie County,FL
4% 6%
86%
4% Indian RiverCounty, FL
Martin County,FL
Palm BeachCounty, FL
St. Lucie County,FL
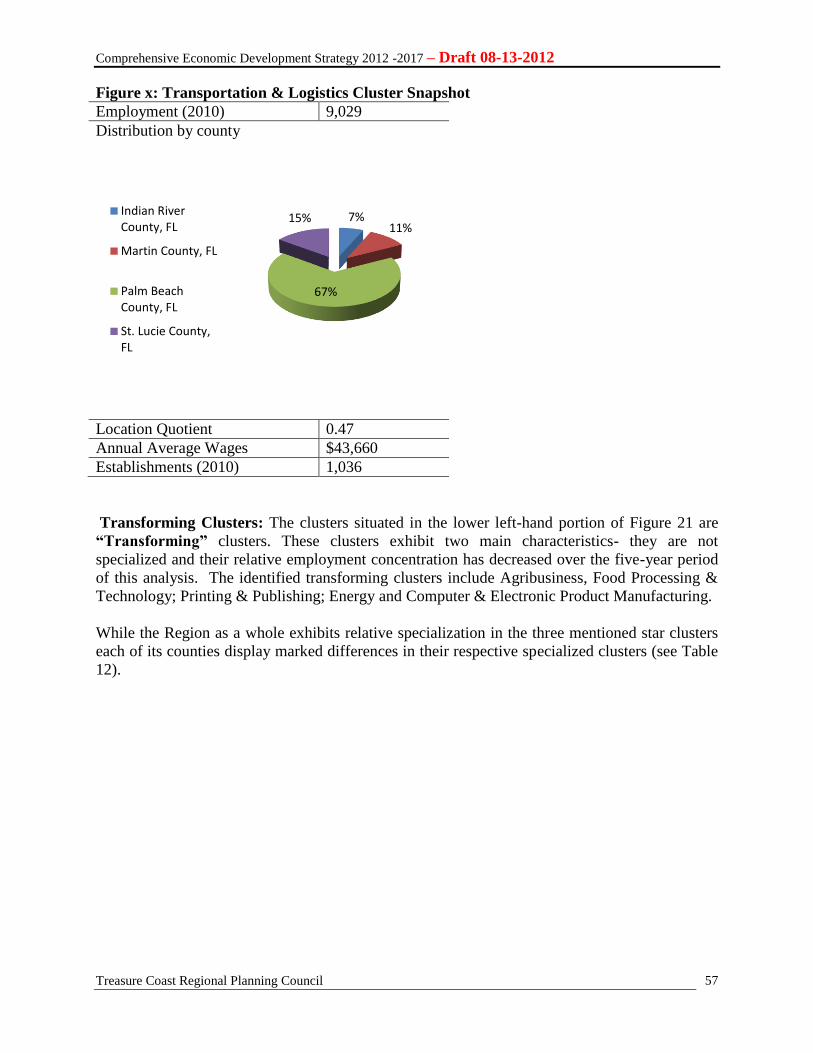
Comprehensive Economic Development Strategy 2012 -2017 – Draft 08-13-2012
Treasure Coast Regional Planning Council
57
Figure x: Transportation & Logistics Cluster Snapshot
Employment (2010) 9,029
Distribution by county
Location Quotient 0.47
Annual Average Wages $43,660
Establishments (2010) 1,036
Transforming Clusters: The clusters situated in the lower left-hand portion of Figure 21 are
“Transforming” clusters. These clusters exhibit two main characteristics- they are not
specialized and their relative employment concentration has decreased over the five-year period
of this analysis. The identified transforming clusters include Agribusiness, Food Processing &
Technology; Printing & Publishing; Energy and Computer & Electronic Product Manufacturing.
While the Region as a whole exhibits relative specialization in the three mentioned star clusters
each of its counties display marked differences in their respective specialized clusters (see Table
12).
7% 11%
67%
15% Indian RiverCounty, FL
Martin County, FL
Palm BeachCounty, FL
St. Lucie County,FL

Comprehensive Economic Development Strategy 2012 -2017 – Draft 08-13-2012
Treasure Coast Regional Planning Council
58
Industry ClustersIndustry ClustersClusters
Region Palm Beach Martin St. Lucie Indian River
Advanced Materials
Agribusiness, Food Process and Technology 1.9 2.5
Apparel and Textiles
Arts, Entertainment, Recreation and Visitor
Industries
1.4 1.4 1.2 1.6
Biomedical/Biotechnical (Life Sciences) 1.1 1.0 1.2 1.2 1.1
Business and Financial Services 1.1 1.2
Chemicals and Chemical-Based Products
Defense and Security
Education and Knowledge Creation 1.0
Energy (Fossil and Renewable)
Forest and Wood Products
Glass and Ceramics
Information Technology and
Telecommunications
Transportation & Logistics
Manufacturing Supercluster
Computer and Electronic Product Mfg
Electric Equip, Appliance and Component Mfg 1.7
Fabricated Metal Product Mfg
Machinery Mfg
Primary Metal MFG
Transportation Equipment Mfg 1.3 1.3
Mining 1.1
Printing and Publishing
Table 12
Specialized Clusters in the Treasure Coast Region and Counties
(LQ greater than 1 in 2010)
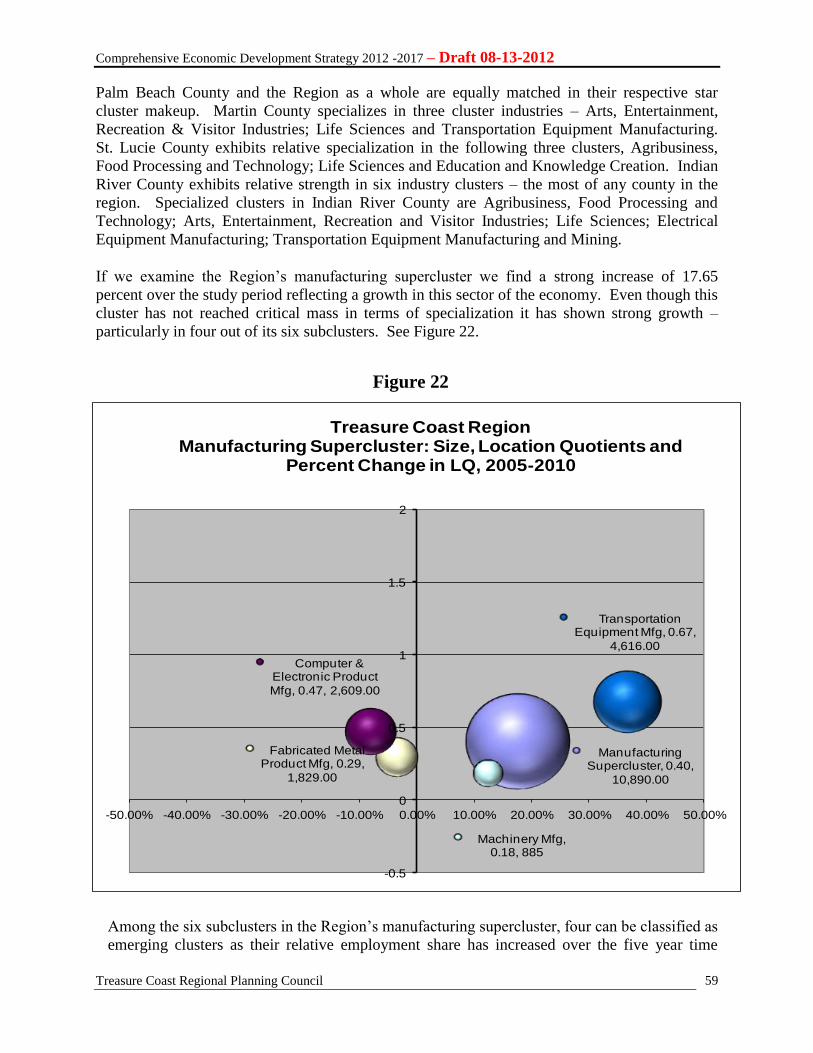
Comprehensive Economic Development Strategy 2012 -2017 – Draft 08-13-2012
Treasure Coast Regional Planning Council
59
Palm Beach County and the Region as a whole are equally matched in their respective star
cluster makeup. Martin County specializes in three cluster industries – Arts, Entertainment,
Recreation & Visitor Industries; Life Sciences and Transportation Equipment Manufacturing.
St. Lucie County exhibits relative specialization in the following three clusters, Agribusiness,
Food Processing and Technology; Life Sciences and Education and Knowledge Creation. Indian
River County exhibits relative strength in six industry clusters – the most of any county in the
region. Specialized clusters in Indian River County are Agribusiness, Food Processing and
Technology; Arts, Entertainment, Recreation and Visitor Industries; Life Sciences; Electrical
Equipment Manufacturing; Transportation Equipment Manufacturing and Mining.
If we examine the Region’s manufacturing supercluster we find a strong increase of 17.65
percent over the study period reflecting a growth in this sector of the economy. Even though this
cluster has not reached critical mass in terms of specialization it has shown strong growth –
particularly in four out of its six subclusters. See Figure 22.
Among the six subclusters in the Region’s manufacturing supercluster, four can be classified as
emerging clusters as their relative employment share has increased over the five year time
Manufacturing Supercluster, 0.40,
10,890.00
Fabricated Metal Product Mfg, 0.29,
1,829.00
Machinery Mfg, 0.18, 885
Computer & Electronic Product
Mfg, 0.47, 2,609.00
Transportation Equipment Mfg, 0.67,
4,616.00
-0.5
0
0.5
1
1.5
2
-50.00% -40.00% -30.00% -20.00% -10.00% 0.00% 10.00% 20.00% 30.00% 40.00% 50.00%
Treasure Coast RegionManufacturing Supercluster: Size, Location Quotients and
Percent Change in LQ, 2005-2010
Figure 22
Comprehensive Economic Development Strategy 2012 -2017 – Draft 08-13-2012
Treasure Coast Regional Planning Council
60
period of 2005 to 2010, are not yet specialized but may become so over time. These are
Transportation Equipment, Machinery, Primary Metal, and Electrical Equipment, Appliance
and Components Manufacturing. These subclusters warrant further attention from a research
and policy standpoint.
Comprehensive Economic Development Strategy 2012 -2017 – Draft 08-13-2012
Treasure Coast Regional Planning Council
61
PART IV: MEASURING REGIONAL INNOVATION
This section introduces a newly released Innovation Index (www.statsamerica.org/innovation),
funded in part by the U.S. Economic Development Administration. The index provides
policymakers and economic development practitioners a unique web-based tool for exploring
regional innovation performance and comparing that with the United States, a state or other
regions.5 The index includes both inputs and outputs together as a composite indicator of
innovation capacity and output potential. Inputs are those factors, influences or conditions that
promote innovation. Inputs are divided into two sub-indexes: human capital and economic
dynamics.
Human Capital: Human capital inputs are those characteristics that describe the ability of the
population and labor force to innovate. Regions with high levels of human capital are those with
enhanced knowledge that can be measured by high educational attainment, growth in younger
age brackets of the workforce and a sizeable number of innovation-related occupations and jobs
relative to the overall labor force.
Economic Dynamics: This component measures local resources and business conditions
available to region entrepreneurs and businesses that encourage innovation close to home.
Outputs are the direct outcomes and economic improvements that result from inputs. They are
divided into two sub-indices: productivity and employment and economic well-being.
Productivity and Employment: These variables measure economic growth, regional
desirability or direct outcomes of innovative activity. The variables in this index suggest the
extent to which local and regional economies are thriving and attracting workers seeking certain
jobs.
Economic Well-Being: Innovative economies improve economic well-being for residents
because they earn more and have an increasing standard of living. Areas with decreasing
poverty rates, increasing employment, positive net migration and improvements in personal
income signal a more desirable location to live and point to an increase in economic well-being.
Figure 23 illustrates the measures in each sub-index along with each sub-indices’ weight in the
calculation of the overall index.
5 This research was supported by a grant from the U.S. Economic Development Administration and done in
collaboration with Purdue Center for Regional Development, Strategic Development Group, Inc., the Rural Policy
Research Institute, and Economic Modeling Specialists, Inc.

Comprehensive Economic Development Strategy 2012 -2017 – Draft 08-13-2012
Treasure Coast Regional Planning Council
62
Figure 23: Indicators and Weights Used to Calculate the Innovation Index

Comprehensive Economic Development Strategy 2012 -2017 – Draft 08-13-2012
Treasure Coast Regional Planning Council
63
The Region’s overall Innovation Index score is illustrated in Figure 24 and benchmarked against
three comparison regions.
With an overall index score of 90.5 the Region is slightly ahead of the State but falls behind the
nation and the benchmark state of California. Looking closer, we can compare each region’s
score on the four sub-indices that make up the overall index – Human Capital, Economic
Dynamics, Productivity and Employment and Economic Well-Being (see Figure 25 and Table
13).
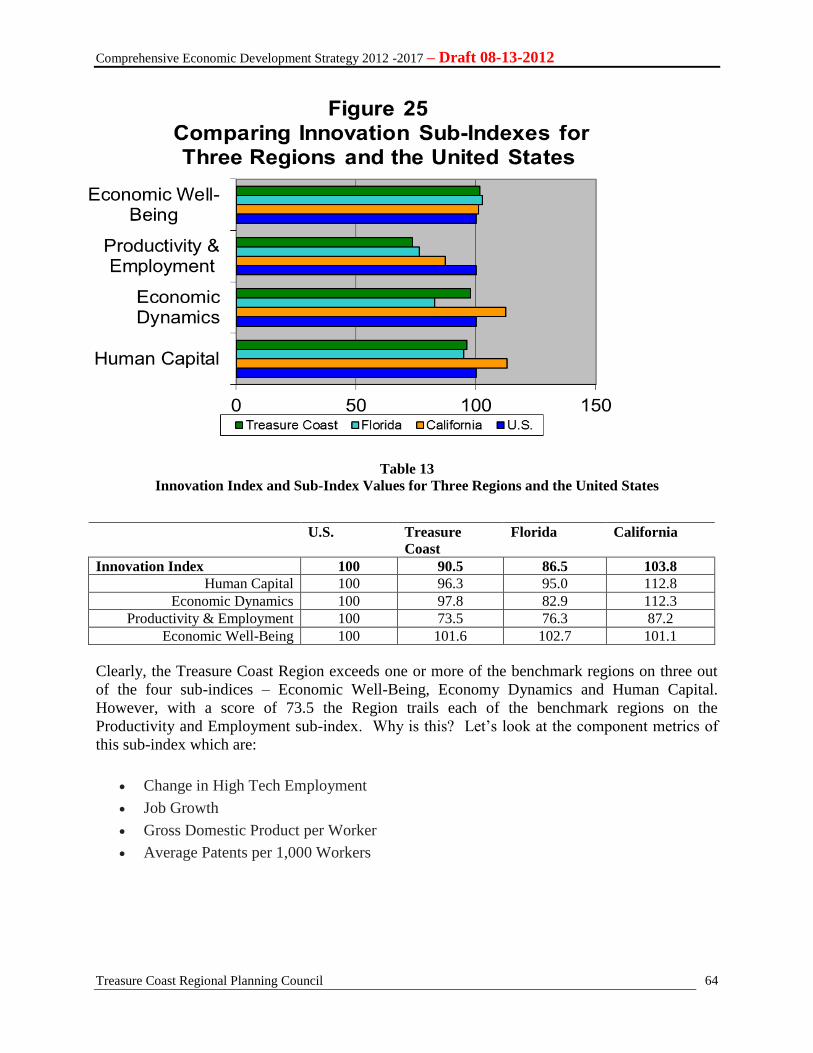
Comprehensive Economic Development Strategy 2012 -2017 – Draft 08-13-2012
Treasure Coast Regional Planning Council
64
Table 13
Innovation Index and Sub-Index Values for Three Regions and the United States
Clearly, the Treasure Coast Region exceeds one or more of the benchmark regions on three out
of the four sub-indices – Economic Well-Being, Economy Dynamics and Human Capital.
However, with a score of 73.5 the Region trails each of the benchmark regions on the
Productivity and Employment sub-index. Why is this? Let’s look at the component metrics of
this sub-index which are:
Change in High Tech Employment
Job Growth
Gross Domestic Product per Worker
Average Patents per 1,000 Workers
U.S. Treasure
Coast
Florida California
Innovation Index 100 90.5 86.5 103.8
Human Capital 100 96.3 95.0 112.8
Economic Dynamics 100 97.8 82.9 112.3
Productivity & Employment 100 73.5 76.3 87.2
Economic Well-Being 100 101.6 102.7 101.1
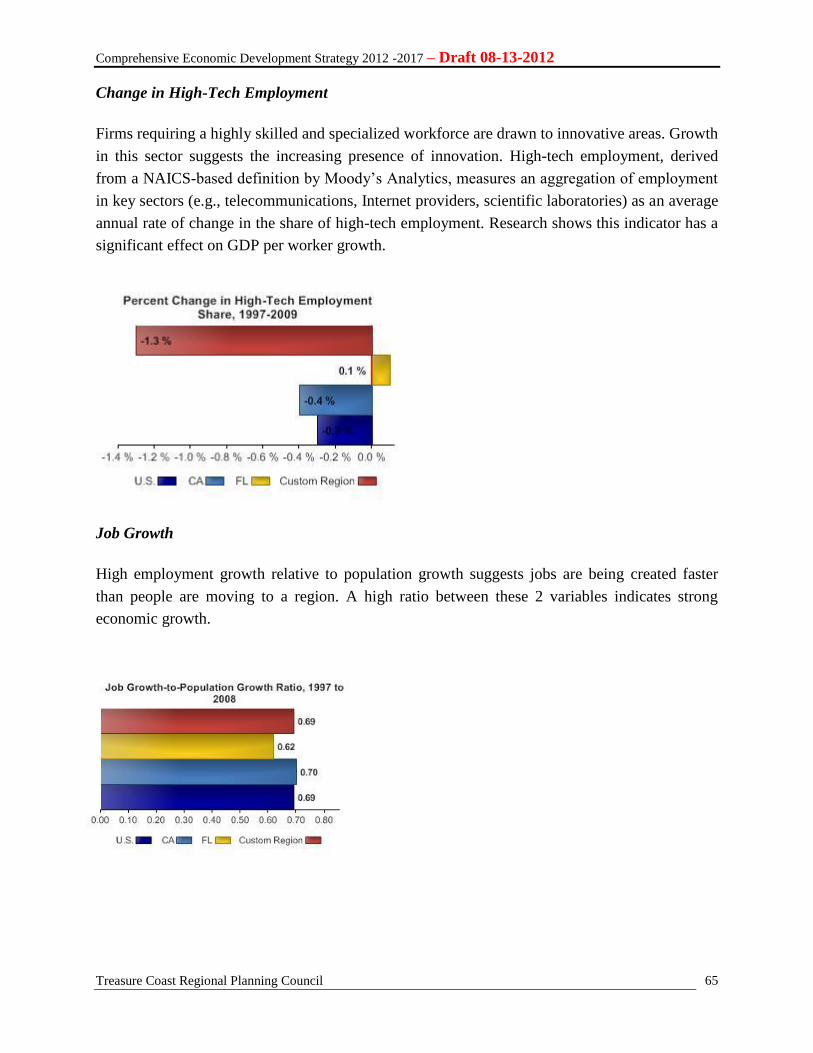
Comprehensive Economic Development Strategy 2012 -2017 – Draft 08-13-2012
Treasure Coast Regional Planning Council
65
Change in High-Tech Employment
Firms requiring a highly skilled and specialized workforce are drawn to innovative areas. Growth
in this sector suggests the increasing presence of innovation. High-tech employment, derived
from a NAICS-based definition by Moody’s Analytics, measures an aggregation of employment
in key sectors (e.g., telecommunications, Internet providers, scientific laboratories) as an average
annual rate of change in the share of high-tech employment. Research shows this indicator has a
significant effect on GDP per worker growth.
Job Growth
High employment growth relative to population growth suggests jobs are being created faster
than people are moving to a region. A high ratio between these 2 variables indicates strong
economic growth.
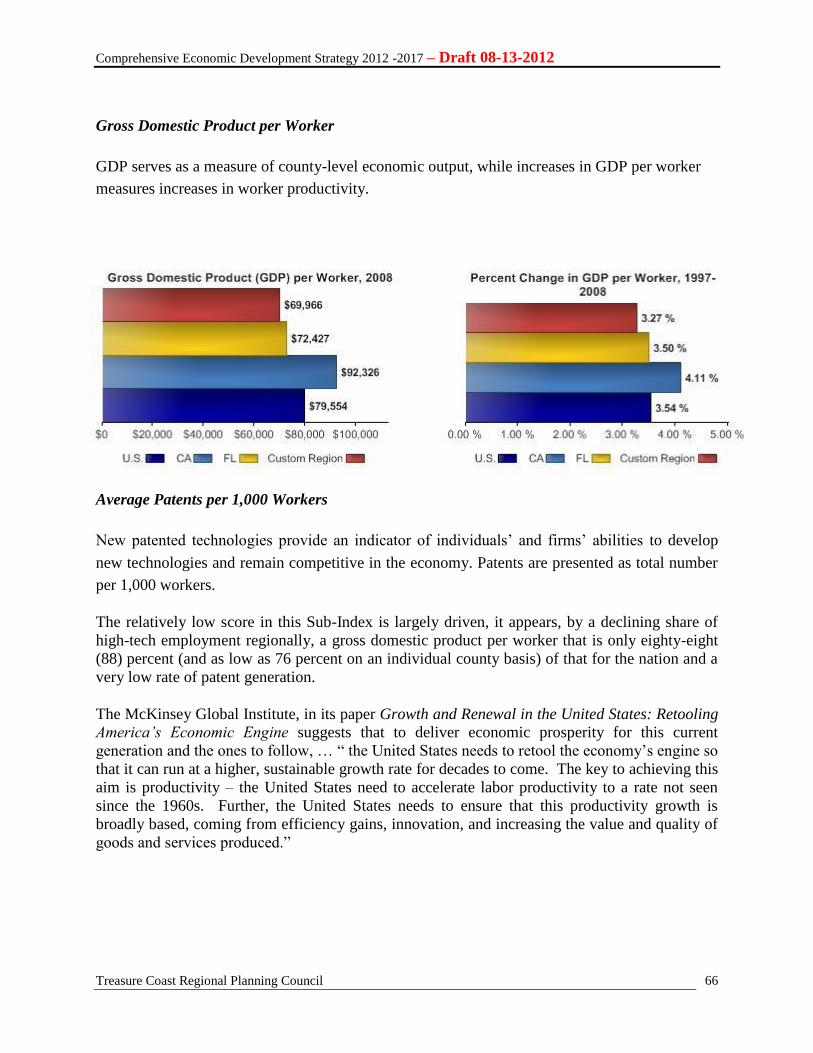
Comprehensive Economic Development Strategy 2012 -2017 – Draft 08-13-2012
Treasure Coast Regional Planning Council
66
Gross Domestic Product per Worker
GDP serves as a measure of county-level economic output, while increases in GDP per worker
measures increases in worker productivity.
Average Patents per 1,000 Workers
New patented technologies provide an indicator of individuals’ and firms’ abilities to develop
new technologies and remain competitive in the economy. Patents are presented as total number
per 1,000 workers.
The relatively low score in this Sub-Index is largely driven, it appears, by a declining share of
high-tech employment regionally, a gross domestic product per worker that is only eighty-eight
(88) percent (and as low as 76 percent on an individual county basis) of that for the nation and a
very low rate of patent generation.
The McKinsey Global Institute, in its paper Growth and Renewal in the United States: Retooling
America’s Economic Engine suggests that to deliver economic prosperity for this current
generation and the ones to follow, … “ the United States needs to retool the economy’s engine so
that it can run at a higher, sustainable growth rate for decades to come. The key to achieving this
aim is productivity – the United States need to accelerate labor productivity to a rate not seen
since the 1960s. Further, the United States needs to ensure that this productivity growth is
broadly based, coming from efficiency gains, innovation, and increasing the value and quality of
goods and services produced.”

Comprehensive Economic Development Strategy 2012 -2017 – Draft 08-13-2012
Treasure Coast Regional Planning Council
67
PART V: REGIONAL SWOT ANALYSIS
This section provides a graphical representation of the strengths, weaknesses, opportunities and
threats affecting the regional economy. The analysis was performed by members of the CEDS
Committee during the period of February through March of 2012. A summary of some of the
salient findings is presented below. The full analysis is provided in Appendix X.
Strengths
1. Moderating rate of population growth
2. Increasing rate of job growth projected
3. High regard for quality of life/quality of place issues
4. Steady rate of small business growth
Weaknesses
1. Lack of economic diversity
2. Venture capital and entrepreneurial network
lacking
3. Skills mismatch to industry needs
4. Lack of capital to support small business
growth
Opportunities
1. Emerging research / development clusters
2. Ports and export capability, globalization
3. Regional partnerships emerging – workforce development, education, economic
development, finance
4. Growing, culturally diverse population
Threats
1. Infrastructure systems and resources stretched by residential and economic growth
2. Federal disinvestment for local priorities
3. Job growth concentrated in low-wage sectors
4. Lack of support for entrepreneurship and weak understanding of process
In the simplified visual representation in Figure 26, the findings from the regional SWOT
Analysis are illustrated and points are allocated to each “issue” identified under each category –
Strengths, Weaknesses, Opportunities, Threats. Clearly, the number of issues reflected under the
Weaknesses category outweigh the issues represented in the other three categories. The issues
reflect structural economic weaknesses such as lack of economic diversity, a skills mismatch to
industry needs and a lack of an efficient and effective entrepreneurial network to assist emerging
entrepreneurs and existing small business develop and expand their businesses. Interestingly,
external threats to the region’s economy represent the smallest share of issues in the analysis
suggesting the possibility that if the Region could collaborate to remove the structural
impediments or weaknesses in the economy the regional economy could be greatly strengthened
and advanced into a more productive state.
0.00%
5.00%
10.00%
15.00%
20.00%
25.00%
30.00%
35.00%
1
Figure x
Regional SWOT Analysis Visualization
Strengths Weaknesses Opportunities Threats
Figure 26
Regional SWOT analysis Visualization
Comprehensive Economic Development Strategy 2012 -2017 – Draft 08-13-2012
Treasure Coast Regional Planning Council
68
B. CEDS GOALS AND OBJECTIVES
The CEDS must contain a section setting forth goals and objectives necessary to solve the
economic problems, or capitalize on the resources, of the region. Any strategic project, program,
or activity identified in the CEDS should work to fulfill these goals and objectives.
Goals are broad, primary regional expectations.
Objectives are more specific than goals, clearly measurable, and stated in realistic terms
considering what can be accomplished over the five (5) year time frame of the CEDS.
1. Talent Supply & Education - Goals
Goal One: Support a highly skilled and educated workforce, creating economic opportunity for the
Region’s citizens.
Objective One: Create an additional 5,000 jobs in the target industries due to business retention
and expansion as measured by the data collection system by January 2017.
Objective Two: Raise the Region’s average annual wage to that of the nation by January 2017.
Objective Three: Recruit 2,500 new jobs in the target industries by January 2017 at a
sustainable annual wage.
Implementing Strategies
Strategy One: Cultivate education/business partnerships to encourage and develop
education/training support programs that will benefit existing and new businesses
and employees.
Strategy Two: Coordinate with local school boards, community colleges, universities and
workforce development boards on workforce development activities.
Strategy Three: Support and promote the development of a new four-year educational institution
in the Treasure Coast District.
Strategy Four: Support Local school boards, community colleges, universities workforce
development boards and non-profit organizations by forecasting regional
educational needs.
Strategy Five: Promote the provision of adequate workforce housing throughout the Region to
alleviate long commutes to industrial and commercial job sites.
2. Innovation & Economic Development - Goals
Goal One: Develop an innovative and sustainable regional economy by supporting the growth and
development of emerging industry clusters such as Life Sciences and Manufacturing.
Objective One: Increase the relative specialization of two or more of the Region’s emerging
cluster industries such as Defense & Security and Transportation Equipment Manufacturing to
allow these industries to transition from “Emerging” to “Star” cluster status by January 2017.
Comprehensive Economic Development Strategy 2012 -2017 – Draft 08-13-2012
Treasure Coast Regional Planning Council
69
Implementing Strategies
Strategy One: Identify locations for and encourage the development of industry clusters in the
Region.
Strategy Two: Encourage and support industry cluster research and development activities.
Strategy Three: Research, develop and disseminate information that will facilitate economic
development efforts.
3. Infrastructure & Growth Leadership - Goals
Goal One: Enhance physical infrastructure which encourages sustainable business growth.
Objective One: Improve methods for including economic development criteria into regional
infrastructure evaluation programs.
Objective Two: Complete grant applications for strategic regional physical infrastructure
improvements.
Implementing Strategies
Strategy One: Work with local governments to maintain and improve the region’s physical
infrastructure to support the needs of established and emerging industry clusters.
Strategy Two: Assist local governments in upgrading or expanding their infrastructure facilities
by identifying potential funding sources and supporting funding applications.
Strategy Three: Coordinate with local governments and local and regional utility providers in
determining the need for advanced infrastructure facilities and identification of
potential funding sources.
Strategy Four: Identify industrial and commercial sites in the Region that have adequate
infrastructure capacity for future development.
Strategy Five: Coordinate with local economic development organizations to develop new
inventories of commercial and industrial sites with adequate infrastructure.
4. Business Climate & Competitiveness - Goals
Goal One: Establish an entrepreneurial culture that fosters and supports the creation of new firms
by focusing on economic drivers that generate new and sustainable wealth for our communities.
Objective One: Grow and support the development of one hundred (100) high-valued
entrepreneurial businesses within the Region’s targeted industries by January 2017.
Objective Two: Gather and maintain annual baseline data on the key economic indicators of the
region’s industry clusters.
Objective Three: Increase the Region’s high-tech employment share of total employment from
approximately 3.6 percent to 5.0 percent by January 2017.
Comprehensive Economic Development Strategy 2012 -2017 – Draft 08-13-2012
Treasure Coast Regional Planning Council
70
Implementing Strategies
Strategy One: Educate the public about entrepreneurship and its benefits to the Region.
Strategy Two: Increase availability of financing to entrepreneurs and small and minority-owned
businesses.
Strategy Three: Better connect venture capital and angel capital networks across the Region with
Treasure Coast entrepreneurs.
5. Civic & Governance Systems - Goals
Goal One: Adopt a clear economic vision for the Treasure Coast Region and promote collaboration
between business, political and community leaders to achieve it.
Implementing Strategies
Strategy One: Provide local governments with high-quality research and information about
economic development principles, especially their costs and benefits, to help
them make the best-informed decisions possible.
Strategy Two: Work with the Region’s economic development organizations to develop a
coordinated communications and marketing campaign that effectively promotes
the Treasure Coast Region for business expansion and recruitment.
6. Quality of Life & Quality Places - Goals
Goal One: Promote the development of vibrant and thriving communities with a true quality of
place and a high quality of life for all the region’s residents.
Implementing Strategies
Strategy One: Create and sustain affordable, vibrant, healthy and safe communities that attract
workers, businesses, residents and visitors.
Strategy Two: Encourage the creation, expansion and protection of the region’s natural
environment and cultural amenities for residents, businesses and visitors alike.
C. COMMUNITY AND PRIVATE SECTOR PARTICIPATION
This CEDS was developed by a standing committee comprised of public and private sector
organizations, business leaders and individuals from throughout the Treasure Coast Region
committed to helping develop a sustainable regional economy. The year-long CEDS strategy
development process began with an in-depth economic analysis of the Region. This was
followed by several months of meetings to identify the salient strengths and weaknesses in the
Region’s economy and opportunities and threats that needed to be addressed to move forward.
In August, 2012 the public was invited to review and submit comments on the draft CEDS.
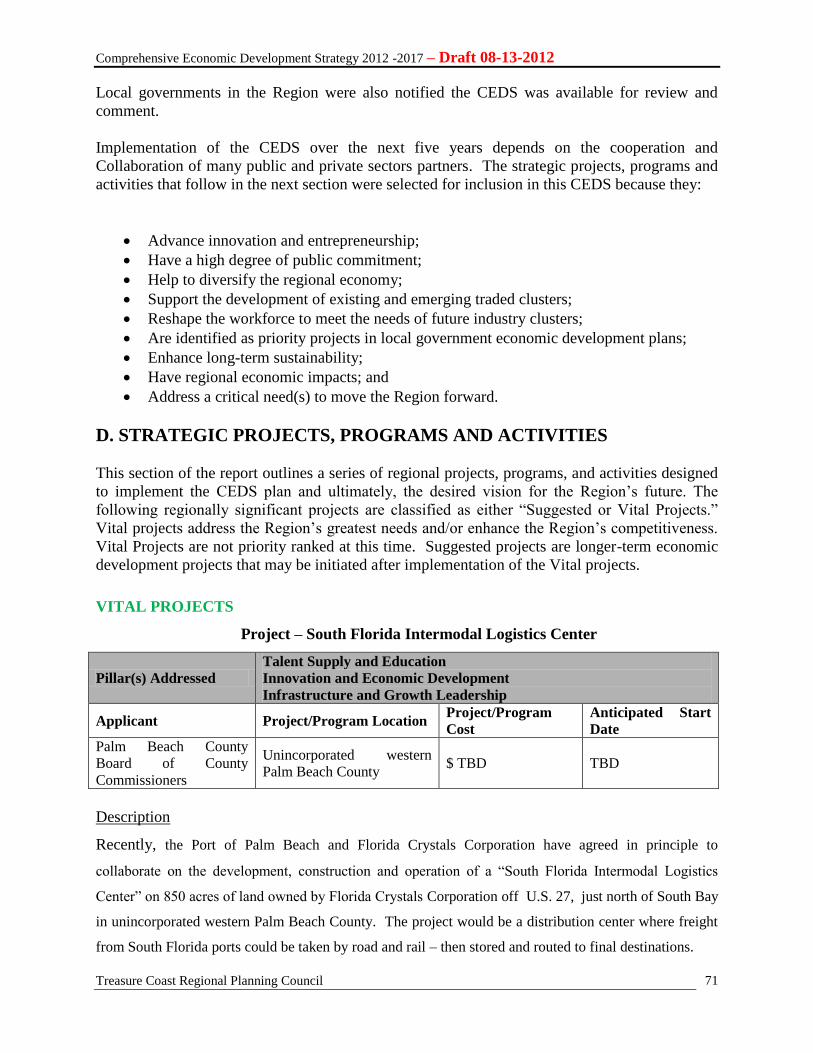
Comprehensive Economic Development Strategy 2012 -2017 – Draft 08-13-2012
Treasure Coast Regional Planning Council
71
Local governments in the Region were also notified the CEDS was available for review and
comment.
Implementation of the CEDS over the next five years depends on the cooperation and
Collaboration of many public and private sectors partners. The strategic projects, programs and
activities that follow in the next section were selected for inclusion in this CEDS because they:
Advance innovation and entrepreneurship;
Have a high degree of public commitment;
Help to diversify the regional economy;
Support the development of existing and emerging traded clusters;
Reshape the workforce to meet the needs of future industry clusters;
Are identified as priority projects in local government economic development plans;
Enhance long-term sustainability;
Have regional economic impacts; and
Address a critical need(s) to move the Region forward.
D. STRATEGIC PROJECTS, PROGRAMS AND ACTIVITIES
This section of the report outlines a series of regional projects, programs, and activities designed
to implement the CEDS plan and ultimately, the desired vision for the Region’s future. The
following regionally significant projects are classified as either “Suggested or Vital Projects.”
Vital projects address the Region’s greatest needs and/or enhance the Region’s competitiveness.
Vital Projects are not priority ranked at this time. Suggested projects are longer-term economic
development projects that may be initiated after implementation of the Vital projects.
VITAL PROJECTS
Project – South Florida Intermodal Logistics Center
Pillar(s) Addressed
Talent Supply and Education
Innovation and Economic Development
Infrastructure and Growth Leadership
Applicant Project/Program Location Project/Program
Cost
Anticipated Start
Date
Palm Beach County
Board of County
Commissioners
Unincorporated western
Palm Beach County $ TBD TBD
Description
Recently, the Port of Palm Beach and Florida Crystals Corporation have agreed in principle to
collaborate on the development, construction and operation of a “South Florida Intermodal Logistics
Center” on 850 acres of land owned by Florida Crystals Corporation off U.S. 27, just north of South Bay
in unincorporated western Palm Beach County. The project would be a distribution center where freight
from South Florida ports could be taken by road and rail – then stored and routed to final destinations.
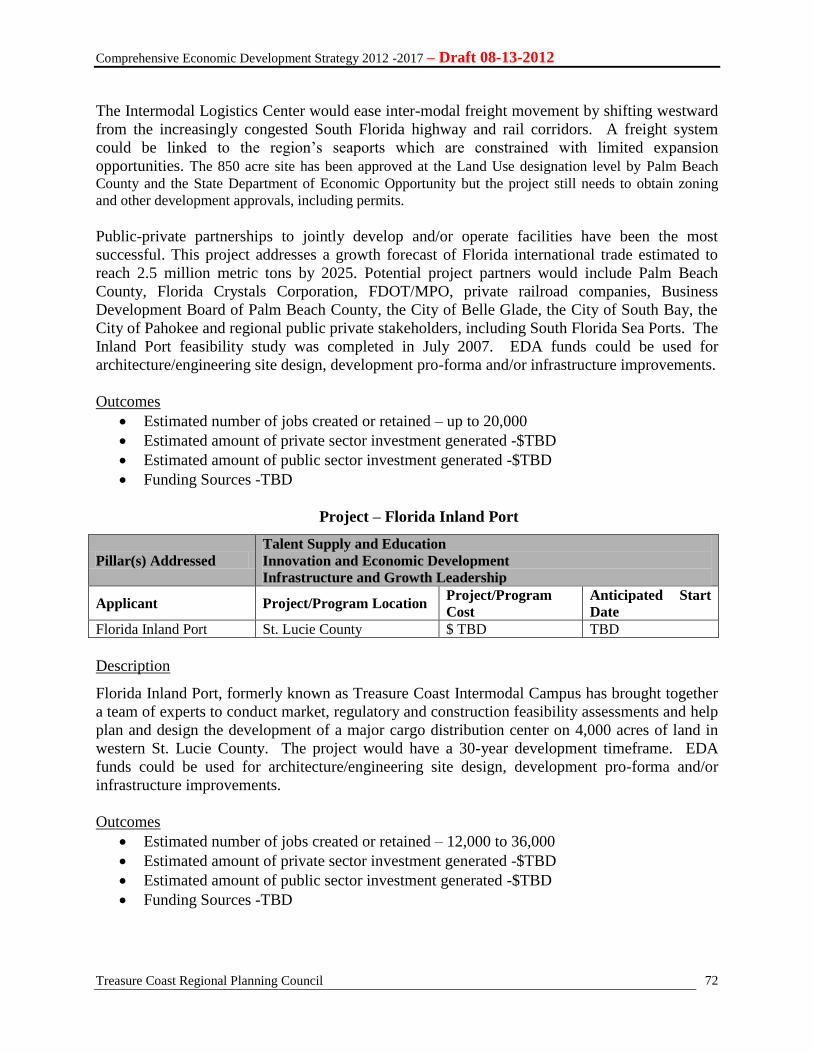
Comprehensive Economic Development Strategy 2012 -2017 – Draft 08-13-2012
Treasure Coast Regional Planning Council
72
The Intermodal Logistics Center would ease inter-modal freight movement by shifting westward
from the increasingly congested South Florida highway and rail corridors. A freight system
could be linked to the region’s seaports which are constrained with limited expansion
opportunities. The 850 acre site has been approved at the Land Use designation level by Palm Beach
County and the State Department of Economic Opportunity but the project still needs to obtain zoning
and other development approvals, including permits.
Public-private partnerships to jointly develop and/or operate facilities have been the most
successful. This project addresses a growth forecast of Florida international trade estimated to
reach 2.5 million metric tons by 2025. Potential project partners would include Palm Beach
County, Florida Crystals Corporation, FDOT/MPO, private railroad companies, Business
Development Board of Palm Beach County, the City of Belle Glade, the City of South Bay, the
City of Pahokee and regional public private stakeholders, including South Florida Sea Ports. The
Inland Port feasibility study was completed in July 2007. EDA funds could be used for
architecture/engineering site design, development pro-forma and/or infrastructure improvements.
Outcomes
Estimated number of jobs created or retained – up to 20,000
Estimated amount of private sector investment generated -$TBD
Estimated amount of public sector investment generated -$TBD
Funding Sources -TBD
Project – Florida Inland Port
Pillar(s) Addressed
Talent Supply and Education
Innovation and Economic Development
Infrastructure and Growth Leadership
Applicant Project/Program Location Project/Program
Cost
Anticipated Start
Date
Florida Inland Port St. Lucie County $ TBD TBD
Description
Florida Inland Port, formerly known as Treasure Coast Intermodal Campus has brought together
a team of experts to conduct market, regulatory and construction feasibility assessments and help
plan and design the development of a major cargo distribution center on 4,000 acres of land in
western St. Lucie County. The project would have a 30-year development timeframe. EDA
funds could be used for architecture/engineering site design, development pro-forma and/or
infrastructure improvements.
Outcomes
Estimated number of jobs created or retained – 12,000 to 36,000
Estimated amount of private sector investment generated -$TBD
Estimated amount of public sector investment generated -$TBD
Funding Sources -TBD
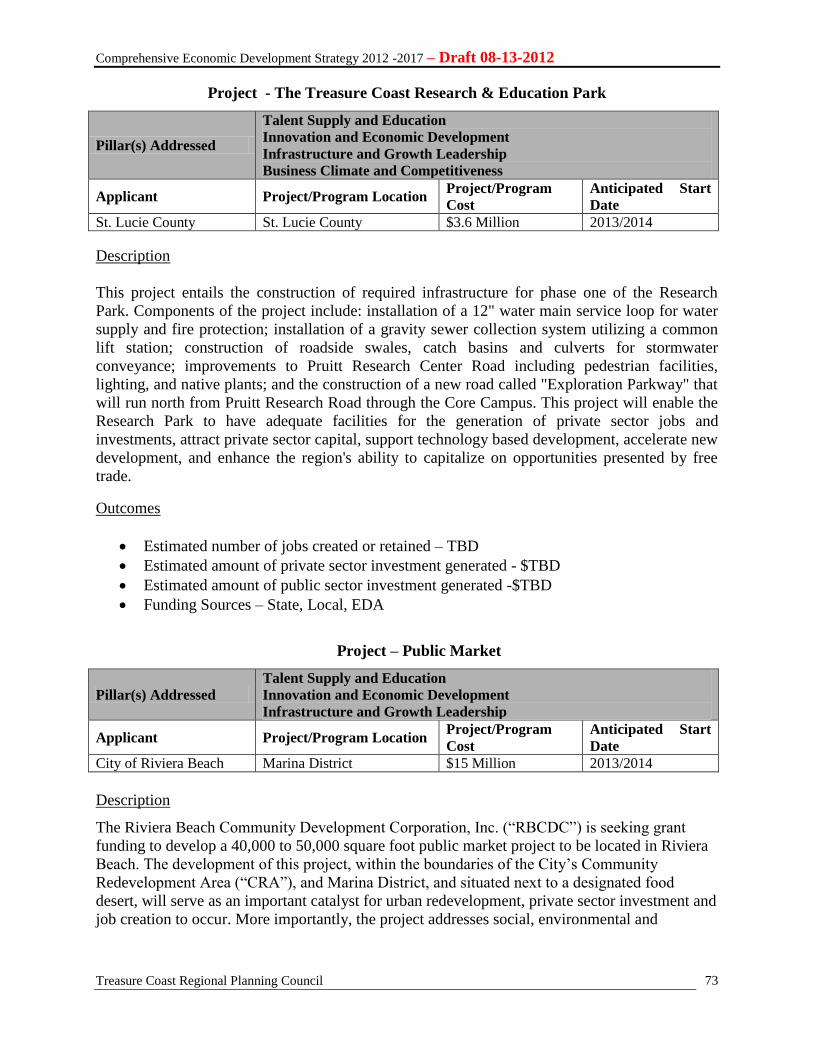
Comprehensive Economic Development Strategy 2012 -2017 – Draft 08-13-2012
Treasure Coast Regional Planning Council
73
Project - The Treasure Coast Research & Education Park
Pillar(s) Addressed
Talent Supply and Education
Innovation and Economic Development
Infrastructure and Growth Leadership
Business Climate and Competitiveness
Applicant Project/Program Location Project/Program
Cost
Anticipated Start
Date
St. Lucie County St. Lucie County $3.6 Million 2013/2014
Description
This project entails the construction of required infrastructure for phase one of the Research
Park. Components of the project include: installation of a 12" water main service loop for water
supply and fire protection; installation of a gravity sewer collection system utilizing a common
lift station; construction of roadside swales, catch basins and culverts for stormwater
conveyance; improvements to Pruitt Research Center Road including pedestrian facilities,
lighting, and native plants; and the construction of a new road called "Exploration Parkway" that
will run north from Pruitt Research Road through the Core Campus. This project will enable the
Research Park to have adequate facilities for the generation of private sector jobs and
investments, attract private sector capital, support technology based development, accelerate new
development, and enhance the region's ability to capitalize on opportunities presented by free
trade.
Outcomes
Estimated number of jobs created or retained – TBD
Estimated amount of private sector investment generated - $TBD
Estimated amount of public sector investment generated -$TBD
Funding Sources – State, Local, EDA
Project – Public Market
Pillar(s) Addressed
Talent Supply and Education
Innovation and Economic Development
Infrastructure and Growth Leadership
Applicant Project/Program Location Project/Program
Cost
Anticipated Start
Date
City of Riviera Beach Marina District $15 Million 2013/2014
Description
The Riviera Beach Community Development Corporation, Inc. (“RBCDC”) is seeking grant
funding to develop a 40,000 to 50,000 square foot public market project to be located in Riviera
Beach. The development of this project, within the boundaries of the City’s Community
Redevelopment Area (“CRA”), and Marina District, and situated next to a designated food
desert, will serve as an important catalyst for urban redevelopment, private sector investment and
job creation to occur. More importantly, the project addresses social, environmental and
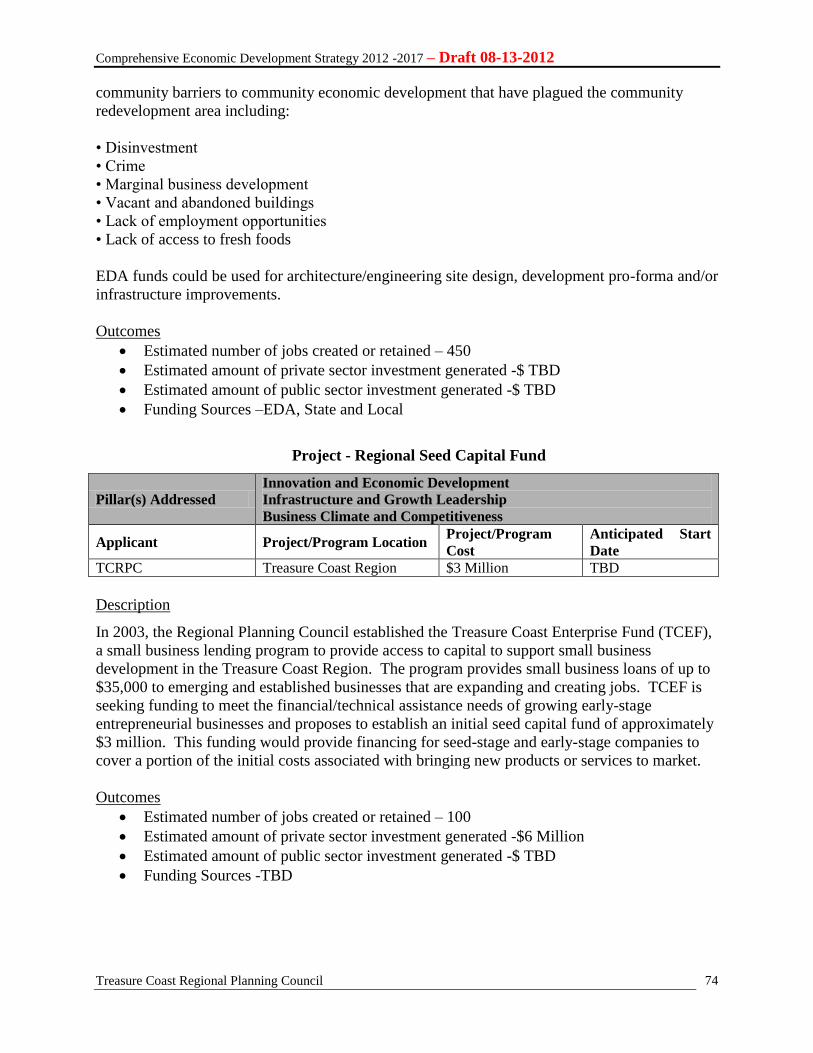
Comprehensive Economic Development Strategy 2012 -2017 – Draft 08-13-2012
Treasure Coast Regional Planning Council
74
community barriers to community economic development that have plagued the community
redevelopment area including:
• Disinvestment
• Crime
• Marginal business development
• Vacant and abandoned buildings
• Lack of employment opportunities
• Lack of access to fresh foods
EDA funds could be used for architecture/engineering site design, development pro-forma and/or
infrastructure improvements.
Outcomes
Estimated number of jobs created or retained – 450
Estimated amount of private sector investment generated -$ TBD
Estimated amount of public sector investment generated -$ TBD
Funding Sources –EDA, State and Local
Project - Regional Seed Capital Fund
Pillar(s) Addressed
Innovation and Economic Development
Infrastructure and Growth Leadership
Business Climate and Competitiveness
Applicant Project/Program Location Project/Program
Cost
Anticipated Start
Date
TCRPC Treasure Coast Region $3 Million TBD
Description
In 2003, the Regional Planning Council established the Treasure Coast Enterprise Fund (TCEF),
a small business lending program to provide access to capital to support small business
development in the Treasure Coast Region. The program provides small business loans of up to
$35,000 to emerging and established businesses that are expanding and creating jobs. TCEF is
seeking funding to meet the financial/technical assistance needs of growing early-stage
entrepreneurial businesses and proposes to establish an initial seed capital fund of approximately
$3 million. This funding would provide financing for seed-stage and early-stage companies to
cover a portion of the initial costs associated with bringing new products or services to market.
Outcomes
Estimated number of jobs created or retained – 100
Estimated amount of private sector investment generated -$6 Million
Estimated amount of public sector investment generated -$ TBD
Funding Sources -TBD
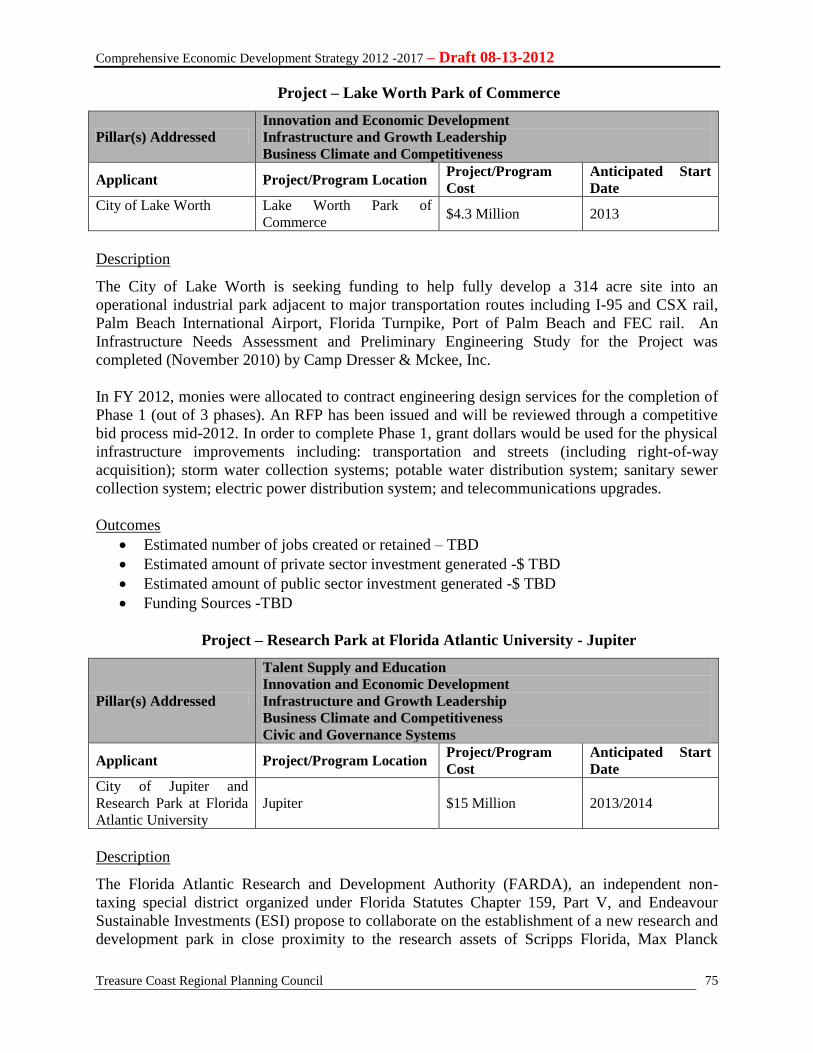
Comprehensive Economic Development Strategy 2012 -2017 – Draft 08-13-2012
Treasure Coast Regional Planning Council
75
Project – Lake Worth Park of Commerce
Pillar(s) Addressed
Innovation and Economic Development
Infrastructure and Growth Leadership
Business Climate and Competitiveness
Applicant Project/Program Location Project/Program
Cost
Anticipated Start
Date
City of Lake Worth Lake Worth Park of
Commerce $4.3 Million 2013
Description
The City of Lake Worth is seeking funding to help fully develop a 314 acre site into an
operational industrial park adjacent to major transportation routes including I-95 and CSX rail,
Palm Beach International Airport, Florida Turnpike, Port of Palm Beach and FEC rail. An
Infrastructure Needs Assessment and Preliminary Engineering Study for the Project was
completed (November 2010) by Camp Dresser & Mckee, Inc.
In FY 2012, monies were allocated to contract engineering design services for the completion of
Phase 1 (out of 3 phases). An RFP has been issued and will be reviewed through a competitive
bid process mid-2012. In order to complete Phase 1, grant dollars would be used for the physical
infrastructure improvements including: transportation and streets (including right-of-way
acquisition); storm water collection systems; potable water distribution system; sanitary sewer
collection system; electric power distribution system; and telecommunications upgrades.
Outcomes
Estimated number of jobs created or retained – TBD
Estimated amount of private sector investment generated -$ TBD
Estimated amount of public sector investment generated -$ TBD
Funding Sources -TBD
Project – Research Park at Florida Atlantic University - Jupiter
Pillar(s) Addressed
Talent Supply and Education
Innovation and Economic Development
Infrastructure and Growth Leadership
Business Climate and Competitiveness
Civic and Governance Systems
Applicant Project/Program Location Project/Program
Cost
Anticipated Start
Date
City of Jupiter and
Research Park at Florida
Atlantic University
Jupiter $15 Million 2013/2014
Description
The Florida Atlantic Research and Development Authority (FARDA), an independent non-
taxing special district organized under Florida Statutes Chapter 159, Part V, and Endeavour
Sustainable Investments (ESI) propose to collaborate on the establishment of a new research and
development park in close proximity to the research assets of Scripps Florida, Max Planck
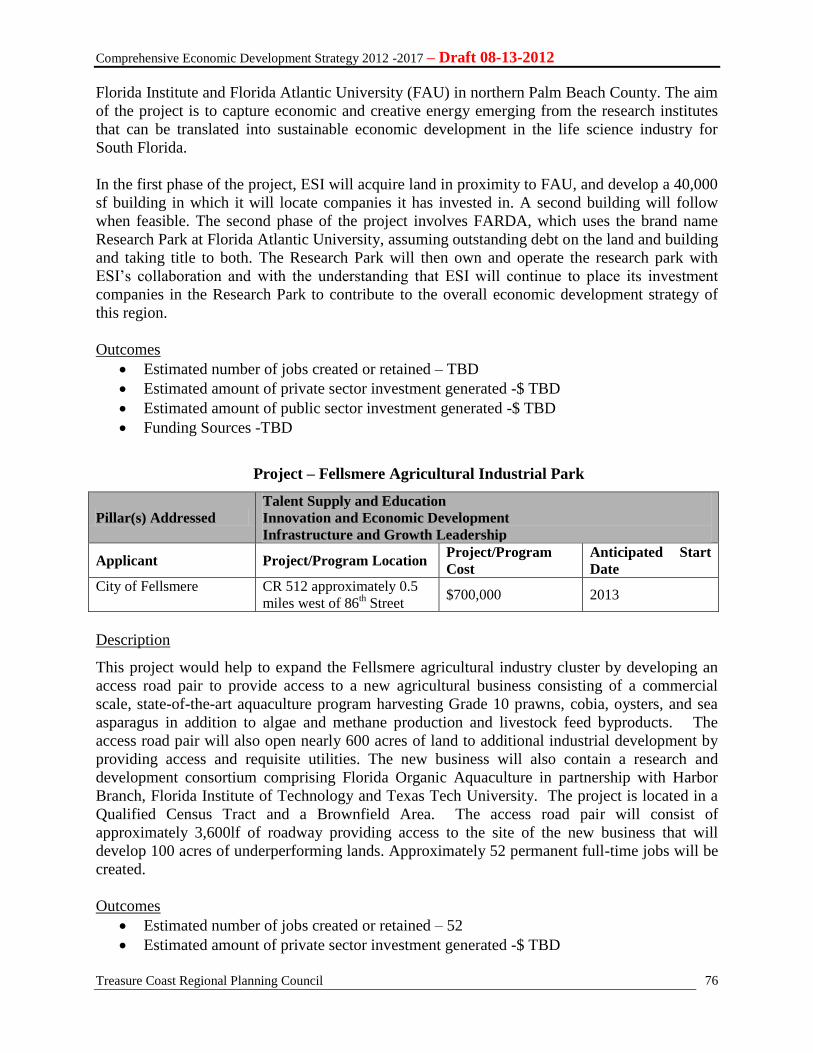
Comprehensive Economic Development Strategy 2012 -2017 – Draft 08-13-2012
Treasure Coast Regional Planning Council
76
Florida Institute and Florida Atlantic University (FAU) in northern Palm Beach County. The aim
of the project is to capture economic and creative energy emerging from the research institutes
that can be translated into sustainable economic development in the life science industry for
South Florida.
In the first phase of the project, ESI will acquire land in proximity to FAU, and develop a 40,000
sf building in which it will locate companies it has invested in. A second building will follow
when feasible. The second phase of the project involves FARDA, which uses the brand name
Research Park at Florida Atlantic University, assuming outstanding debt on the land and building
and taking title to both. The Research Park will then own and operate the research park with
ESI’s collaboration and with the understanding that ESI will continue to place its investment
companies in the Research Park to contribute to the overall economic development strategy of
this region.
Outcomes
Estimated number of jobs created or retained – TBD
Estimated amount of private sector investment generated -$ TBD
Estimated amount of public sector investment generated -$ TBD
Funding Sources -TBD
Project – Fellsmere Agricultural Industrial Park
Pillar(s) Addressed
Talent Supply and Education
Innovation and Economic Development
Infrastructure and Growth Leadership
Applicant Project/Program Location Project/Program
Cost
Anticipated Start
Date
City of Fellsmere CR 512 approximately 0.5
miles west of 86th Street
$700,000 2013
Description
This project would help to expand the Fellsmere agricultural industry cluster by developing an
access road pair to provide access to a new agricultural business consisting of a commercial
scale, state-of-the-art aquaculture program harvesting Grade 10 prawns, cobia, oysters, and sea
asparagus in addition to algae and methane production and livestock feed byproducts. The
access road pair will also open nearly 600 acres of land to additional industrial development by
providing access and requisite utilities. The new business will also contain a research and
development consortium comprising Florida Organic Aquaculture in partnership with Harbor
Branch, Florida Institute of Technology and Texas Tech University. The project is located in a
Qualified Census Tract and a Brownfield Area. The access road pair will consist of
approximately 3,600lf of roadway providing access to the site of the new business that will
develop 100 acres of underperforming lands. Approximately 52 permanent full-time jobs will be
created.
Outcomes
Estimated number of jobs created or retained – 52
Estimated amount of private sector investment generated -$ TBD
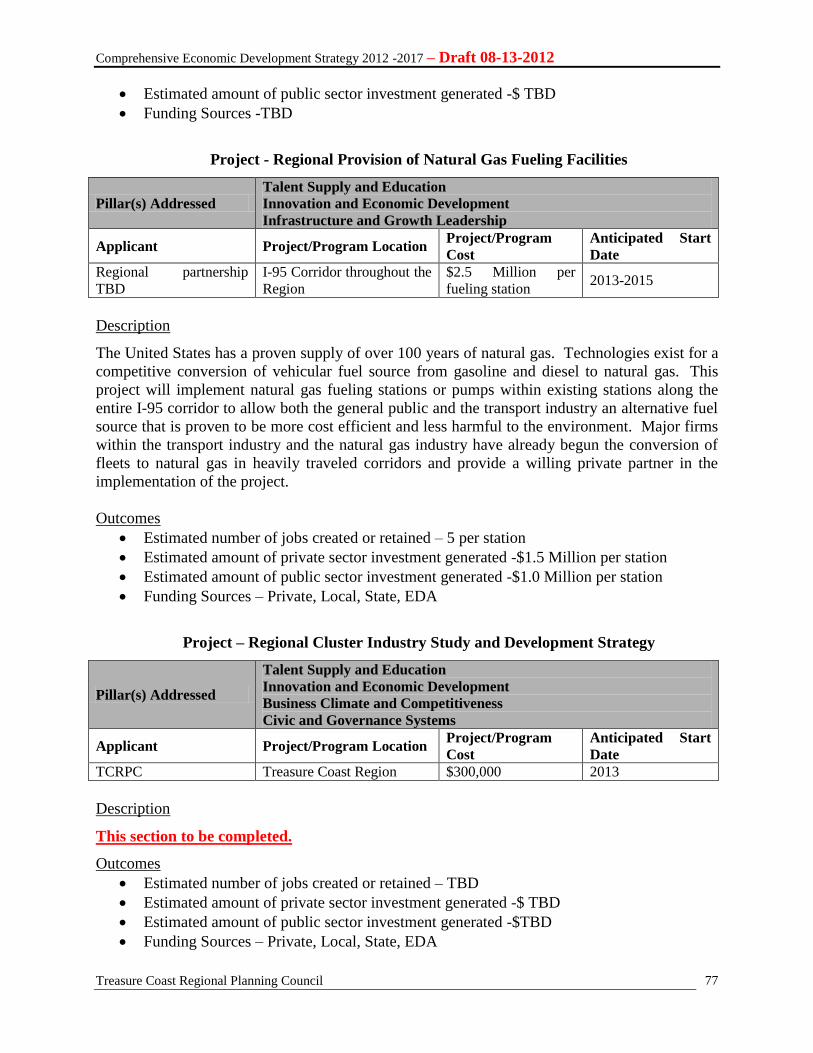
Comprehensive Economic Development Strategy 2012 -2017 – Draft 08-13-2012
Treasure Coast Regional Planning Council
77
Estimated amount of public sector investment generated -$ TBD
Funding Sources -TBD
Project - Regional Provision of Natural Gas Fueling Facilities
Pillar(s) Addressed
Talent Supply and Education
Innovation and Economic Development
Infrastructure and Growth Leadership
Applicant Project/Program Location Project/Program
Cost
Anticipated Start
Date
Regional partnership
TBD
I-95 Corridor throughout the
Region
$2.5 Million per
fueling station 2013-2015
Description
The United States has a proven supply of over 100 years of natural gas. Technologies exist for a
competitive conversion of vehicular fuel source from gasoline and diesel to natural gas. This
project will implement natural gas fueling stations or pumps within existing stations along the
entire I-95 corridor to allow both the general public and the transport industry an alternative fuel
source that is proven to be more cost efficient and less harmful to the environment. Major firms
within the transport industry and the natural gas industry have already begun the conversion of
fleets to natural gas in heavily traveled corridors and provide a willing private partner in the
implementation of the project.
Outcomes
Estimated number of jobs created or retained – 5 per station
Estimated amount of private sector investment generated -$1.5 Million per station
Estimated amount of public sector investment generated -$1.0 Million per station
Funding Sources – Private, Local, State, EDA
Project – Regional Cluster Industry Study and Development Strategy
Pillar(s) Addressed
Talent Supply and Education
Innovation and Economic Development
Business Climate and Competitiveness
Civic and Governance Systems
Applicant Project/Program Location Project/Program
Cost
Anticipated Start
Date
TCRPC Treasure Coast Region $300,000 2013
Description
This section to be completed.
Outcomes
Estimated number of jobs created or retained – TBD
Estimated amount of private sector investment generated -$ TBD
Estimated amount of public sector investment generated -$TBD
Funding Sources – Private, Local, State, EDA
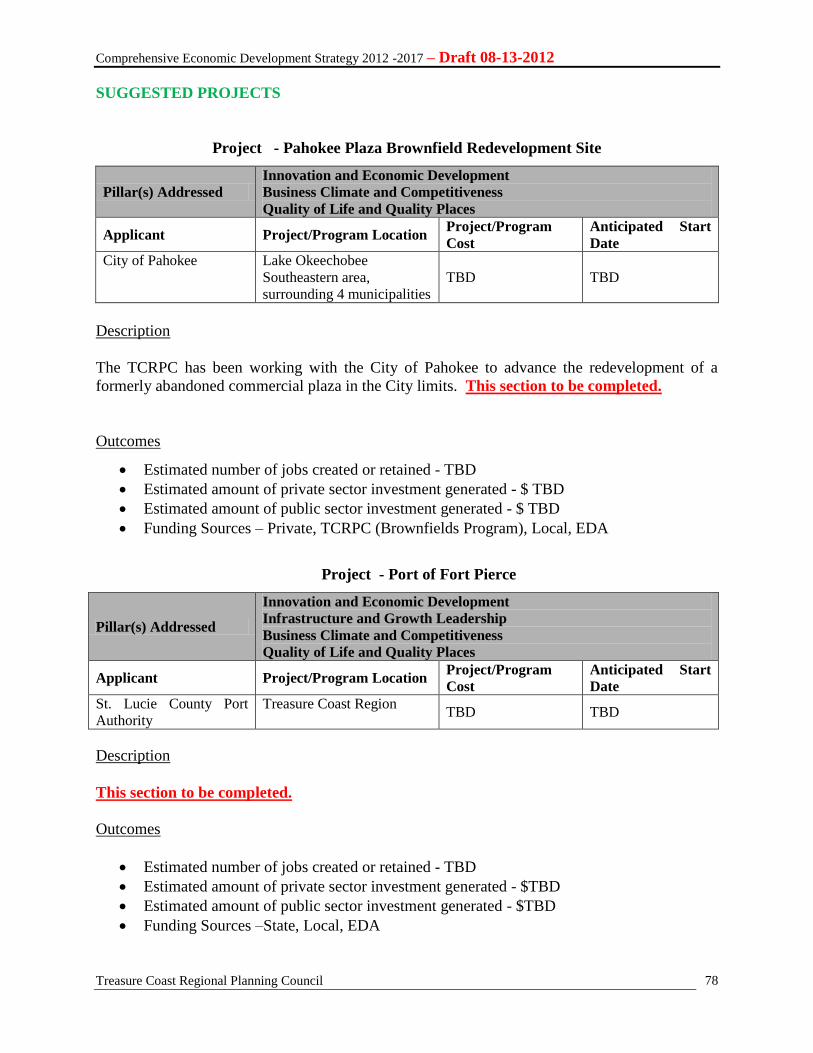
Comprehensive Economic Development Strategy 2012 -2017 – Draft 08-13-2012
Treasure Coast Regional Planning Council
78
SUGGESTED PROJECTS
Project - Pahokee Plaza Brownfield Redevelopment Site
Pillar(s) Addressed
Innovation and Economic Development
Business Climate and Competitiveness
Quality of Life and Quality Places
Applicant Project/Program Location Project/Program
Cost
Anticipated Start
Date
City of Pahokee Lake Okeechobee
Southeastern area,
surrounding 4 municipalities
TBD TBD
Description
The TCRPC has been working with the City of Pahokee to advance the redevelopment of a
formerly abandoned commercial plaza in the City limits. This section to be completed.
Outcomes
Estimated number of jobs created or retained - TBD
Estimated amount of private sector investment generated - $ TBD
Estimated amount of public sector investment generated - $ TBD
Funding Sources – Private, TCRPC (Brownfields Program), Local, EDA
Project - Port of Fort Pierce
Pillar(s) Addressed
Innovation and Economic Development
Infrastructure and Growth Leadership
Business Climate and Competitiveness
Quality of Life and Quality Places
Applicant Project/Program Location Project/Program
Cost
Anticipated Start
Date
St. Lucie County Port
Authority
Treasure Coast Region TBD TBD
Description
This section to be completed.
Outcomes
Estimated number of jobs created or retained - TBD
Estimated amount of private sector investment generated - $TBD
Estimated amount of public sector investment generated - $TBD
Funding Sources –State, Local, EDA
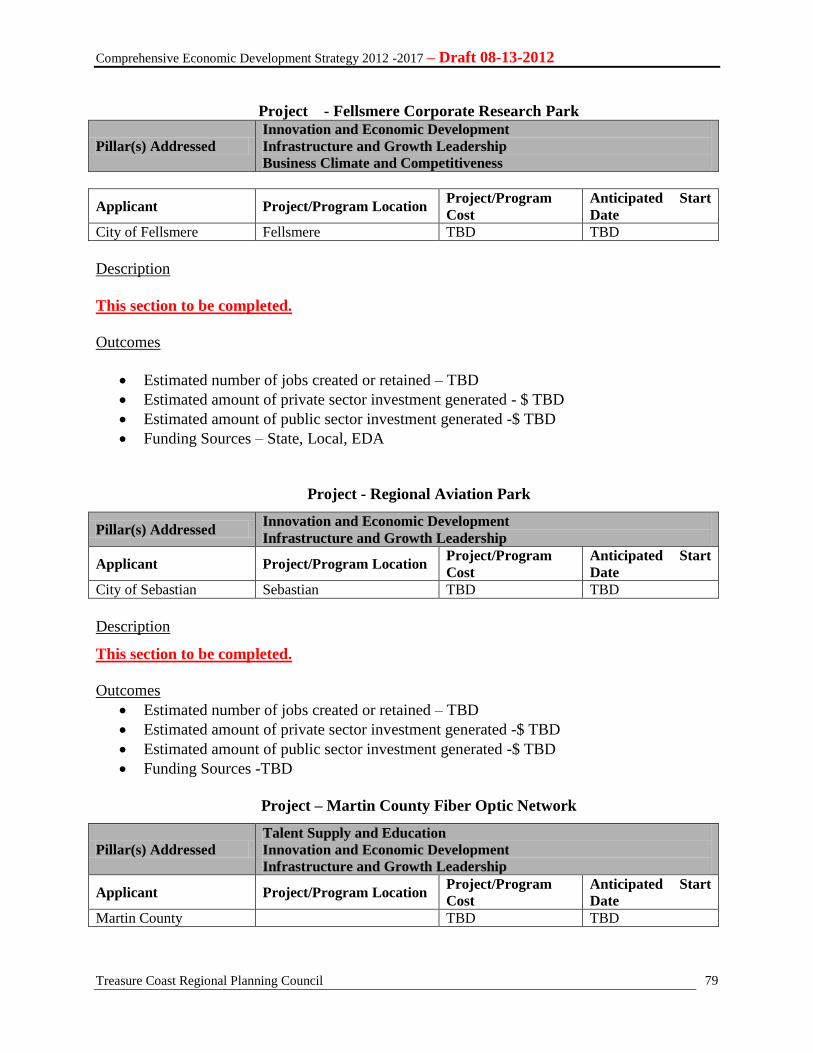
Comprehensive Economic Development Strategy 2012 -2017 – Draft 08-13-2012
Treasure Coast Regional Planning Council
79
Project - Fellsmere Corporate Research Park
Pillar(s) Addressed
Innovation and Economic Development
Infrastructure and Growth Leadership
Business Climate and Competitiveness
Applicant Project/Program Location Project/Program
Cost
Anticipated Start
Date
City of Fellsmere Fellsmere TBD TBD
Description
This section to be completed.
Outcomes
Estimated number of jobs created or retained – TBD
Estimated amount of private sector investment generated - $ TBD
Estimated amount of public sector investment generated -$ TBD
Funding Sources – State, Local, EDA
Project - Regional Aviation Park
Pillar(s) Addressed Innovation and Economic Development
Infrastructure and Growth Leadership
Applicant Project/Program Location Project/Program
Cost
Anticipated Start
Date
City of Sebastian Sebastian TBD TBD
Description
This section to be completed.
Outcomes
Estimated number of jobs created or retained – TBD
Estimated amount of private sector investment generated -$ TBD
Estimated amount of public sector investment generated -$ TBD
Funding Sources -TBD
Project – Martin County Fiber Optic Network
Pillar(s) Addressed
Talent Supply and Education
Innovation and Economic Development
Infrastructure and Growth Leadership
Applicant Project/Program Location Project/Program
Cost
Anticipated Start
Date
Martin County TBD TBD
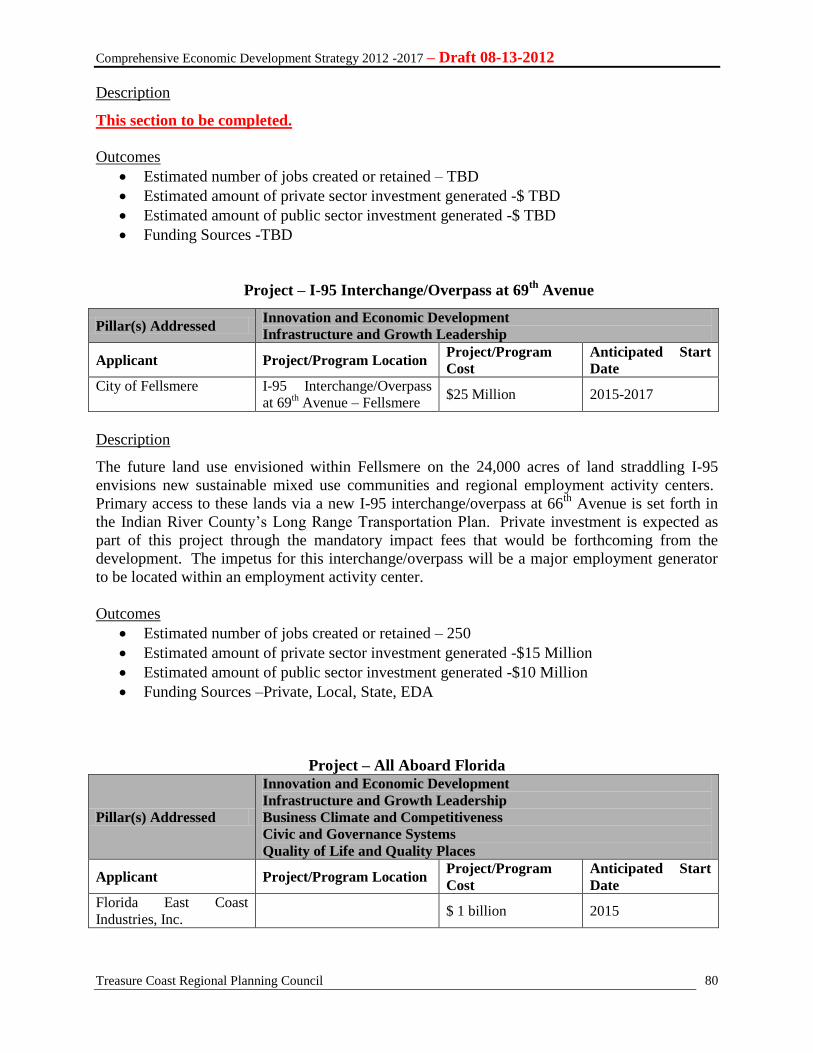
Comprehensive Economic Development Strategy 2012 -2017 – Draft 08-13-2012
Treasure Coast Regional Planning Council
80
Description
This section to be completed.
Outcomes
Estimated number of jobs created or retained – TBD
Estimated amount of private sector investment generated -$ TBD
Estimated amount of public sector investment generated -$ TBD
Funding Sources -TBD
Project – I-95 Interchange/Overpass at 69th
Avenue
Pillar(s) Addressed Innovation and Economic Development
Infrastructure and Growth Leadership
Applicant Project/Program Location Project/Program
Cost
Anticipated Start
Date
City of Fellsmere I-95 Interchange/Overpass
at 69th Avenue – Fellsmere
$25 Million 2015-2017
Description
The future land use envisioned within Fellsmere on the 24,000 acres of land straddling I-95
envisions new sustainable mixed use communities and regional employment activity centers.
Primary access to these lands via a new I-95 interchange/overpass at 66th
Avenue is set forth in
the Indian River County’s Long Range Transportation Plan. Private investment is expected as
part of this project through the mandatory impact fees that would be forthcoming from the
development. The impetus for this interchange/overpass will be a major employment generator
to be located within an employment activity center.
Outcomes
Estimated number of jobs created or retained – 250
Estimated amount of private sector investment generated -$15 Million
Estimated amount of public sector investment generated -$10 Million
Funding Sources –Private, Local, State, EDA
Project – All Aboard Florida
Pillar(s) Addressed
Innovation and Economic Development
Infrastructure and Growth Leadership
Business Climate and Competitiveness
Civic and Governance Systems
Quality of Life and Quality Places
Applicant Project/Program Location Project/Program
Cost
Anticipated Start
Date
Florida East Coast
Industries, Inc. $ 1 billion 2015
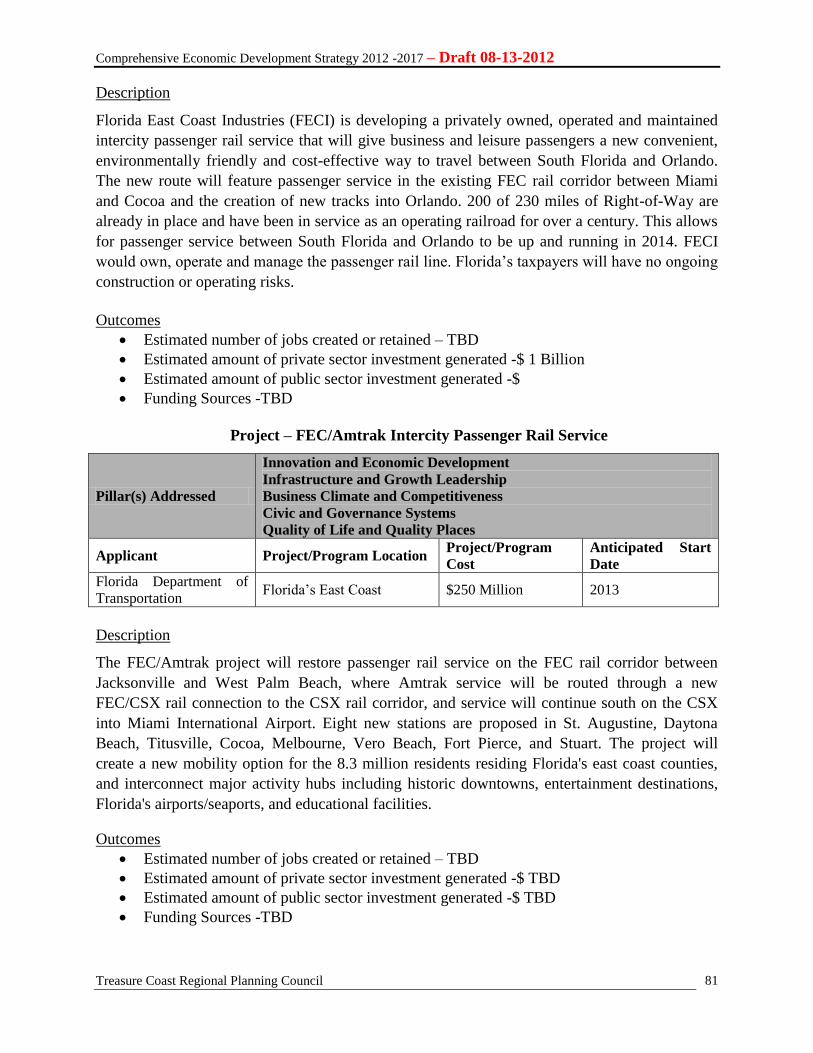
Comprehensive Economic Development Strategy 2012 -2017 – Draft 08-13-2012
Treasure Coast Regional Planning Council
81
Description
Florida East Coast Industries (FECI) is developing a privately owned, operated and maintained
intercity passenger rail service that will give business and leisure passengers a new convenient,
environmentally friendly and cost-effective way to travel between South Florida and Orlando.
The new route will feature passenger service in the existing FEC rail corridor between Miami
and Cocoa and the creation of new tracks into Orlando. 200 of 230 miles of Right-of-Way are
already in place and have been in service as an operating railroad for over a century. This allows
for passenger service between South Florida and Orlando to be up and running in 2014. FECI
would own, operate and manage the passenger rail line. Florida’s taxpayers will have no ongoing
construction or operating risks.
Outcomes
Estimated number of jobs created or retained – TBD
Estimated amount of private sector investment generated -$ 1 Billion
Estimated amount of public sector investment generated -$
Funding Sources -TBD
Project – FEC/Amtrak Intercity Passenger Rail Service
Pillar(s) Addressed
Innovation and Economic Development
Infrastructure and Growth Leadership
Business Climate and Competitiveness
Civic and Governance Systems
Quality of Life and Quality Places
Applicant Project/Program Location Project/Program
Cost
Anticipated Start
Date
Florida Department of
Transportation Florida’s East Coast $250 Million 2013
Description
The FEC/Amtrak project will restore passenger rail service on the FEC rail corridor between
Jacksonville and West Palm Beach, where Amtrak service will be routed through a new
FEC/CSX rail connection to the CSX rail corridor, and service will continue south on the CSX
into Miami International Airport. Eight new stations are proposed in St. Augustine, Daytona
Beach, Titusville, Cocoa, Melbourne, Vero Beach, Fort Pierce, and Stuart. The project will
create a new mobility option for the 8.3 million residents residing Florida's east coast counties,
and interconnect major activity hubs including historic downtowns, entertainment destinations,
Florida's airports/seaports, and educational facilities.
Outcomes
Estimated number of jobs created or retained – TBD
Estimated amount of private sector investment generated -$ TBD
Estimated amount of public sector investment generated -$ TBD
Funding Sources -TBD
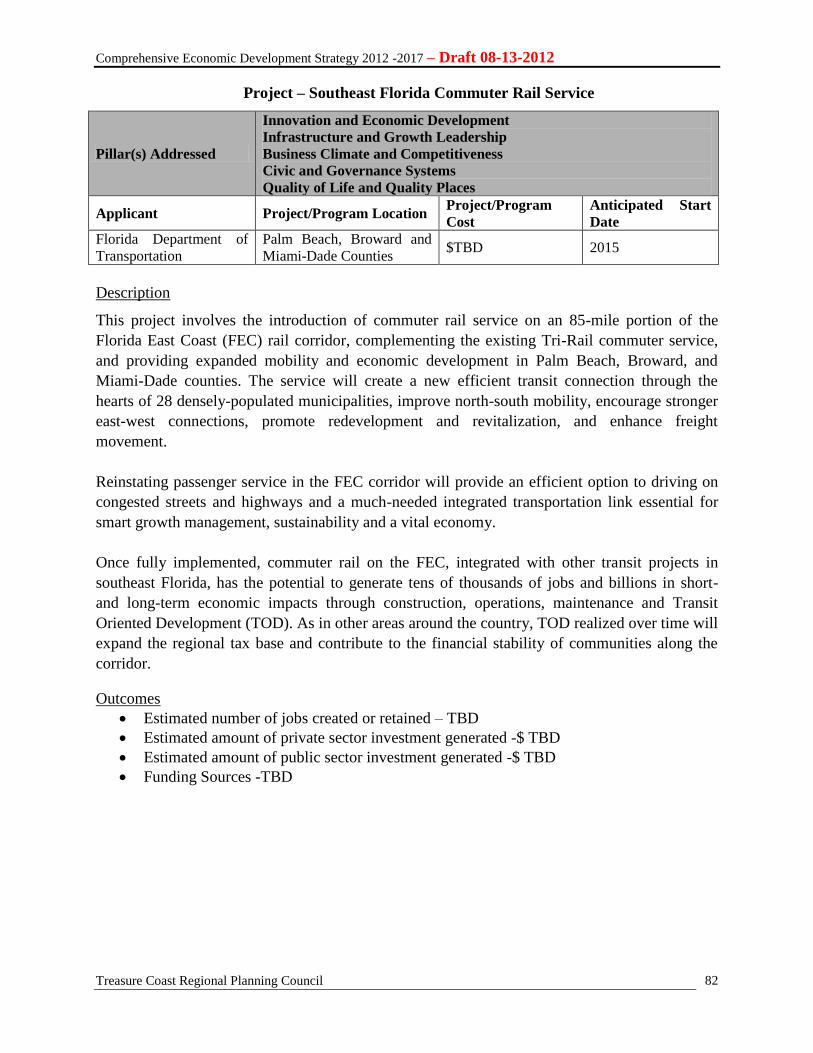
Comprehensive Economic Development Strategy 2012 -2017 – Draft 08-13-2012
Treasure Coast Regional Planning Council
82
Project – Southeast Florida Commuter Rail Service
Pillar(s) Addressed
Innovation and Economic Development
Infrastructure and Growth Leadership
Business Climate and Competitiveness
Civic and Governance Systems
Quality of Life and Quality Places
Applicant Project/Program Location Project/Program
Cost
Anticipated Start
Date
Florida Department of
Transportation
Palm Beach, Broward and
Miami-Dade Counties $TBD 2015
Description
This project involves the introduction of commuter rail service on an 85-mile portion of the
Florida East Coast (FEC) rail corridor, complementing the existing Tri-Rail commuter service,
and providing expanded mobility and economic development in Palm Beach, Broward, and
Miami-Dade counties. The service will create a new efficient transit connection through the
hearts of 28 densely-populated municipalities, improve north-south mobility, encourage stronger
east-west connections, promote redevelopment and revitalization, and enhance freight
movement.
Reinstating passenger service in the FEC corridor will provide an efficient option to driving on
congested streets and highways and a much-needed integrated transportation link essential for
smart growth management, sustainability and a vital economy.
Once fully implemented, commuter rail on the FEC, integrated with other transit projects in
southeast Florida, has the potential to generate tens of thousands of jobs and billions in short-
and long-term economic impacts through construction, operations, maintenance and Transit
Oriented Development (TOD). As in other areas around the country, TOD realized over time will
expand the regional tax base and contribute to the financial stability of communities along the
corridor.
Outcomes
Estimated number of jobs created or retained – TBD
Estimated amount of private sector investment generated -$ TBD
Estimated amount of public sector investment generated -$ TBD
Funding Sources -TBD
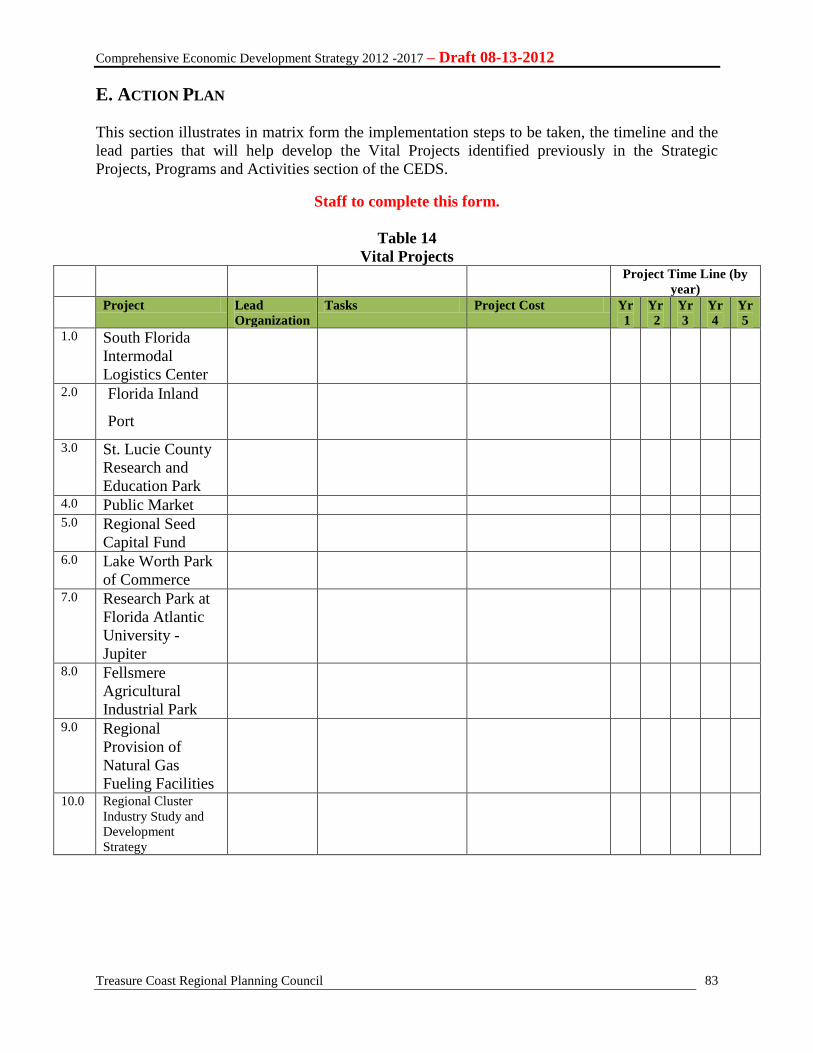
Comprehensive Economic Development Strategy 2012 -2017 – Draft 08-13-2012
Treasure Coast Regional Planning Council
83
E. ACTION PLAN
This section illustrates in matrix form the implementation steps to be taken, the timeline and the
lead parties that will help develop the Vital Projects identified previously in the Strategic
Projects, Programs and Activities section of the CEDS.
Staff to complete this form.
Table 14
Vital Projects Project Time Line (by
year)
Project Lead
Organization
Tasks Project Cost Yr
1
Yr
2
Yr
3
Yr
4
Yr
5
1.0 South Florida
Intermodal
Logistics Center
2.0 Florida Inland
Port
3.0 St. Lucie County
Research and
Education Park
4.0 Public Market
5.0 Regional Seed
Capital Fund
6.0 Lake Worth Park
of Commerce
7.0 Research Park at
Florida Atlantic
University -
Jupiter
8.0 Fellsmere
Agricultural
Industrial Park
9.0 Regional
Provision of
Natural Gas
Fueling Facilities
10.0 Regional Cluster
Industry Study and
Development
Strategy
Comprehensive Economic Development Strategy 2012 -2017 – Draft 08-13-2012
Treasure Coast Regional Planning Council
84
TECHNICAL APPENDIX
Comprehensive Economic Development Strategy 2012 -2017 – Draft 08-13-2012
Treasure Coast Regional Planning Council
85
A. DETAILED CLUSTER ANALYSIS
The Region’s industry clusters are examined through the use of two analyses: Location Quotients
and Shift-Share Analysis. In this study, we adopt the set of seventeen (17) benchmark industry
cluster definitions developed by the Indiana Business Research Center (IBRC) with the Center
for Regional Development at Purdue University under a grant from the U.S. Economic
Development Administration to provide, a set of industry clusters and associated data that can be
readily accessed by regions and economic development districts across America. The research
team at the “Innovation in American Region’s” website has identified the following seventeen
industry clusters that TCRPC staff will examine:
The 17 Clusters and Six Subclusters
1. Advanced Materials
2. Agribusiness, Food Processing and Technology
3. Apparel and Textiles
4. Arts, Entertainment, Recreation and Visitor Industries
5. Biomedical/Biotechnical (Life Sciences)
6. Business and Financial Services
7. Chemicals and Chemical-Based Products
8. Defense and Security
9. Education and Knowledge Creation
10. Energy (Fossil and Renewable)
11. Forest and Wood Products
12. Glass and Ceramics
13. Information Technology and Telecommunications
14. Transportation and Logistics
15. Manufacturing Supercluster
1. Primary Metals
2. Fabricated Metal Products
3. Machinery
4. Computer and Electronic Products
5. Electrical Equipment, Appliance and Components
6. Transportation Equipment
16. Mining
17. Printing and Publishing
The manufacturing supercluster was subsequently disaggregated into six more-specialized sub-
clusters.
The aggregated industry cluster definitions are provided at the end of this section.
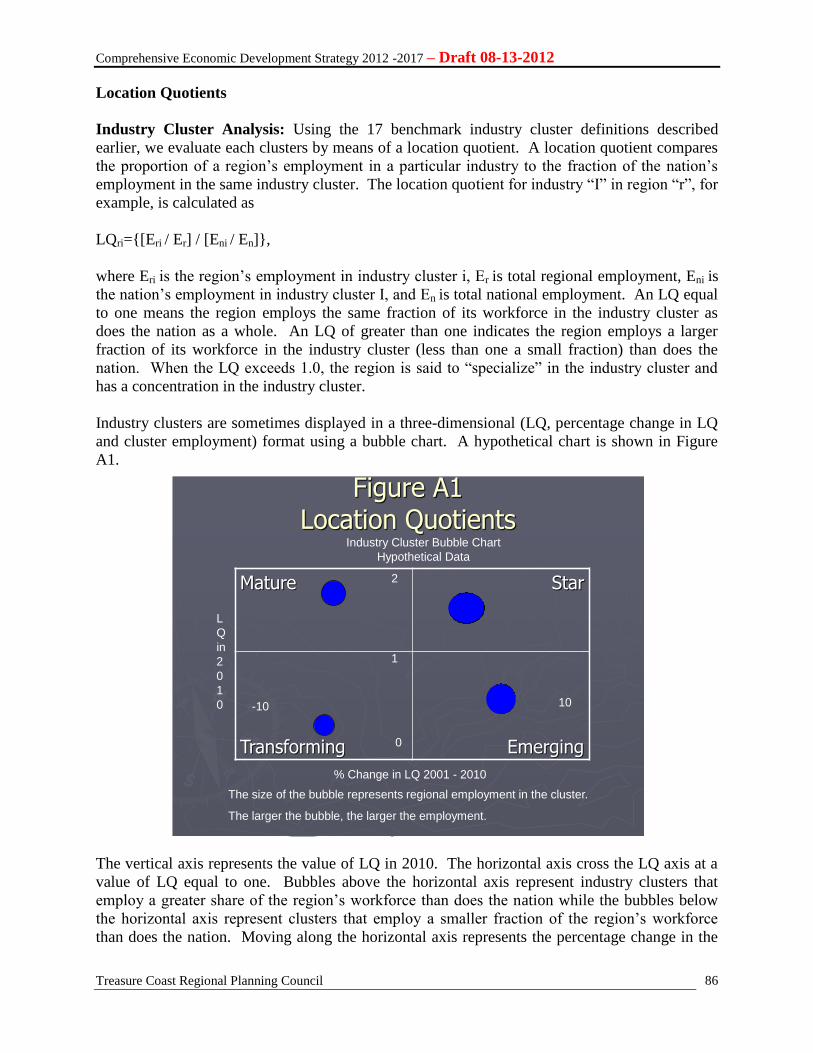
Comprehensive Economic Development Strategy 2012 -2017 – Draft 08-13-2012
Treasure Coast Regional Planning Council
86
Location Quotients
Industry Cluster Analysis: Using the 17 benchmark industry cluster definitions described
earlier, we evaluate each clusters by means of a location quotient. A location quotient compares
the proportion of a region’s employment in a particular industry to the fraction of the nation’s
employment in the same industry cluster. The location quotient for industry “I” in region “r”, for
example, is calculated as
LQri={[Eri / Er] / [Eni / En]},
where Eri is the region’s employment in industry cluster i, Er is total regional employment, Eni is
the nation’s employment in industry cluster I, and En is total national employment. An LQ equal
to one means the region employs the same fraction of its workforce in the industry cluster as
does the nation as a whole. An LQ of greater than one indicates the region employs a larger
fraction of its workforce in the industry cluster (less than one a small fraction) than does the
nation. When the LQ exceeds 1.0, the region is said to “specialize” in the industry cluster and
has a concentration in the industry cluster.
Industry clusters are sometimes displayed in a three-dimensional (LQ, percentage change in LQ
and cluster employment) format using a bubble chart. A hypothetical chart is shown in Figure
A1.
The vertical axis represents the value of LQ in 2010. The horizontal axis cross the LQ axis at a
value of LQ equal to one. Bubbles above the horizontal axis represent industry clusters that
employ a greater share of the region’s workforce than does the nation while the bubbles below
the horizontal axis represent clusters that employ a smaller fraction of the region’s workforce
than does the nation. Moving along the horizontal axis represents the percentage change in the
Figure A1Location Quotients
Mature Star
Transforming Emerging
L
Q
in
2
0
1
0
% Change in LQ 2001 - 2010
Industry Cluster Bubble Chart
Hypothetical Data
-10 10
2
1
0
The size of the bubble represents regional employment in the cluster.
The larger the bubble, the larger the employment.
Comprehensive Economic Development Strategy 2012 -2017 – Draft 08-13-2012
Treasure Coast Regional Planning Council
87
value of the LQ from 2005 to 2010. Bubbles lying to the right of the vertical axis represent
industry clusters that have increased their relative share of employment, while those to the left of
the vertical axis have decreased their relative share of employment. The size of the bubble
represents regional employment in a particular cluster.
Bubbles in the chart fall into one of four quadrants: Star, Mature, Emerging and Transforming.
Star Clusters: Industry clusters in the upper right quadrant are known as “Stars”. These are the
clusters that have higher concentrations of employment than that of the nation and whose relative
employment has increased over the five year period relative to the nation. Star clusters are
specialized as compared to the nation and are becoming more specialized.
Mature Clusters: Industry clusters in the upper left quadrant are “Mature”. Mature clusters are
those whose fraction of employment in the region is larger than that in the nation and whose
fraction of employment has decreased over the five year period relative to the nation. Mature
clusters are specialized as compared to the nation but are becoming less specialized.
Emerging: Industry clusters in the lower right quadrant are known as “Emerging”. Emerging
clusters are those whose fraction of employment in the region is currently less than that in the
nation and whose fraction of employment has increased over the five year period relative to the
nation. These industry clusters are less specialized in the region as compared to the nation.
However, these clusters may become specialized clusters in the future and warrant further
attention.
Transforming: Industry clusters in the lower left quadrant are known as “Transforming”.
Transforming industry clusters are those whose fraction of employment in the region is less than
that for the nation and whose fraction of employment has decreased over the five year period
relative to the nation. These are the clusters that are least specialized in the region and are
unlikely to become specialized.
Figure A2 displays the Treasure Coast Region’s industry clusters.
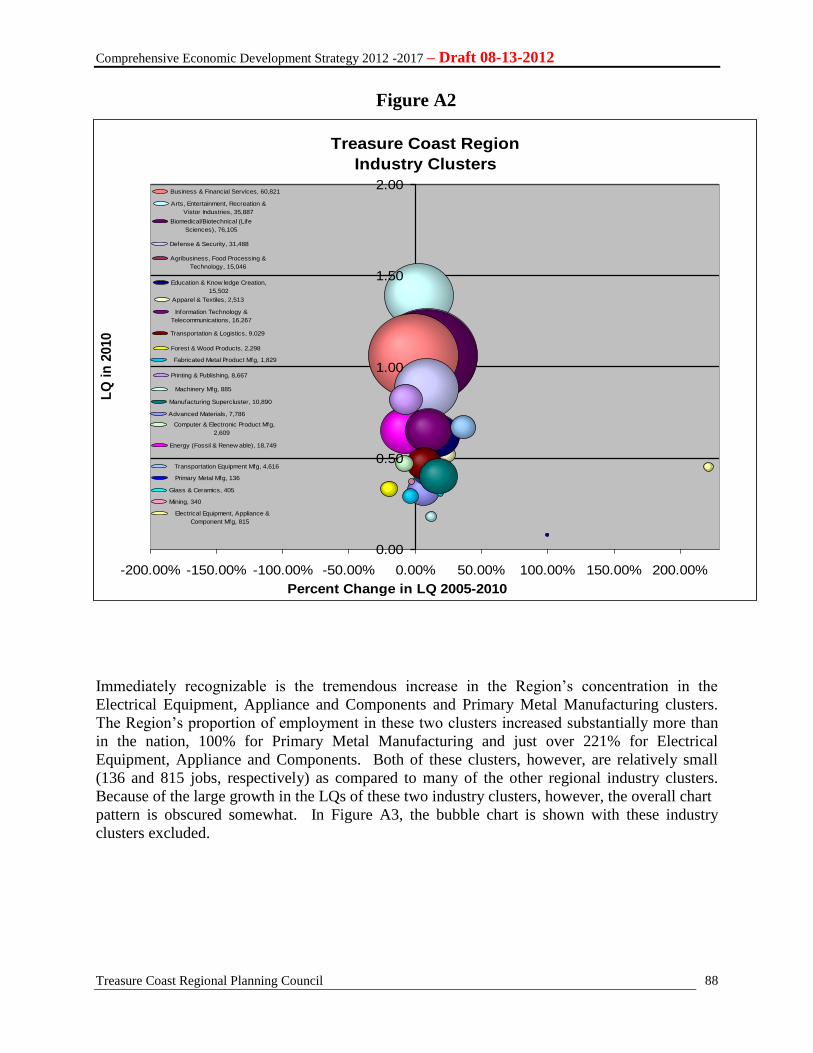
Comprehensive Economic Development Strategy 2012 -2017 – Draft 08-13-2012
Treasure Coast Regional Planning Council
88
Immediately recognizable is the tremendous increase in the Region’s concentration in the
Electrical Equipment, Appliance and Components and Primary Metal Manufacturing clusters.
The Region’s proportion of employment in these two clusters increased substantially more than
in the nation, 100% for Primary Metal Manufacturing and just over 221% for Electrical
Equipment, Appliance and Components. Both of these clusters, however, are relatively small
(136 and 815 jobs, respectively) as compared to many of the other regional industry clusters.
Because of the large growth in the LQs of these two industry clusters, however, the overall chart
pattern is obscured somewhat. In Figure A3, the bubble chart is shown with these industry
clusters excluded.
Treasure Coast Region
Industry Clusters
Advanced Materials, 7,786
Agribusiness, Food Processing &
Technology, 15,046
Apparel & Textiles, 2,513
Arts, Entertainment, Recreation &
Vistor Industries, 35,887
Biomedical/Biotechnical (Life
Sciences), 76,105
Business & Financial Services, 60,821
Defense & Security, 31,488
Education & Know ledge Creation,
15,502
Energy (Fossil & Renew able), 18,749
Forest & Wood Products, 2,298
Glass & Ceramics, 405
Information Technology &
Telecommunications, 16,267
Transportation & Logistics, 9,029
Manufacturing Supercluster, 10,890
Primary Metal Mfg, 136
Fabricated Metal Product Mfg, 1,829
Machinery Mfg, 885
Computer & Electronic Product Mfg,
2,609
Electrical Equipment, Appliance &
Component Mfg, 815
Transportation Equipment Mfg, 4,616
Mining, 340
Printing & Publishing, 8,667
0.00
0.50
1.00
1.50
2.00
-200.00% -150.00% -100.00% -50.00% 0.00% 50.00% 100.00% 150.00% 200.00%
Percent Change in LQ 2005-2010
LQ
in
2010
Figure A2

Comprehensive Economic Development Strategy 2012 -2017 – Draft 08-13-2012
Treasure Coast Regional Planning Council
89
Treasure Coast Region
Industry Clusters
(excluding Electrical Equipment Mfg. & Primary Metal Mfg.)
Advanced Materials, 7,786
Agribusiness, Food Processing &
Technology, 15,046
Apparel & Textiles, 2,513
Arts, Entertainment, Recreation &
Vistor Industries, 35,887
Biomedical/Biotechnical (Life
Sciences), 76,105
Business & Financial Services, 60,821
Defense & Security, 31,488
Education & Know ledge Creation,
15,502
Energy (Fossil & Renew able), 18,749
Forest & Wood Products, 2,298
Glass & Ceramics, 405
Information Technology &
Telecommunications, 16,267
Transportation & Logistics, 9,029
Manufacturing Supercluster, 10,890
Fabricated Metal Product Mfg, 1,829
Machinery Mfg, 885
Computer & Electronic Product Mfg,
2,609
Mining, 340
Printing & Publishing, 8,667
0.00
1.00
2.00
-30.00% -20.00% -10.00% 0.00% 10.00% 20.00% 30.00%
Percent Change in LQ 2005-2010
LQ
in
2010
Figure A3
Comprehensive Economic Development Strategy 2012 -2017 – Draft 08-13-2012
Treasure Coast Regional Planning Council
90
Star Clusters
The clusters located in the upper right-hand section of Figure A3 are “Star” clusters – the
important clusters for the region to focus on. These clusters have higher concentrations of
employment than that of the nation and help to place the region in a competitive position. These
clusters have also shown strong growth over time. The star clusters identified in the Treasure
Coast Region include Arts, Entertainment, Recreation & Visitor Industries and
Biomedical/Biotechnical (Life Sciences). These clusters employed a total of 111,992 workers,
or approximately 17.2% of the Region’s work force.
Arts, Entertainment, Recreation & Visitor Industries: Between 2005 and 2010 this
cluster’s share of national employment increased by 2.96 percent. With a location quotient of
1.39, this industry is 39 percent more concentrated in the Treasure Coast Region than in a typical
U.S. Region. This cluster includes motion picture and video distribution, radio stations,
television broadcasting, travel agencies, convention and visitors bureaus, museums, historical
sites, recreational facilities, and hotels and motels.
Number of Employees: 35,887
Average Wage: $33,540
Biomedical/Biotechnical (Life Sciences): This cluster’s share of national employment
increased by 9.2 percent between 2005 and 2010. Additionally, overall employment in this
cluster increased by 11.2 percent over the period, higher than the cluster’s employment growth at
the national level (9.5 percent). In their Life Sciences cluster snapshot, Enterprise Florida
indicates that Florida is now home to the second fastest growing biotech industry in the nation.
This important regional cluster includes pharmaceutical and medicine manufacturing, medical
equipment and supplies manufacturing, research and development in physical, engineering and
life sciences, and HMO medical centers. Key regional Life Sciences cluster assets include
Scripps Research Institute, Max Planck Florida Institute, Torrey Pines Institute for Molecular
Studies, Vaccine and Gene Therapy Institute of Florida and the Mann Research Center. See Map
x.
Number of Employees: 76,105
Average Wage: $44,769
Mature Clusters: The Region has one mature cluster as evidenced in the bubble chart –
Business & Financial Services.
Business & Financial Services: The Region’s Business & Financial Services cluster includes
consumer lending, securities brokerage, pension funds, legal services, architectural, engineering
and related services and management, scientific and technical consulting services. The Florida
Department of Economic Opportunity projects an average annual growth rate of employment in
this industry cluster of approximately 2.8 percent statewide and approximately 3.3 percent for
the Region.
Number of Employees: 60,821
Average Wage: $74,022
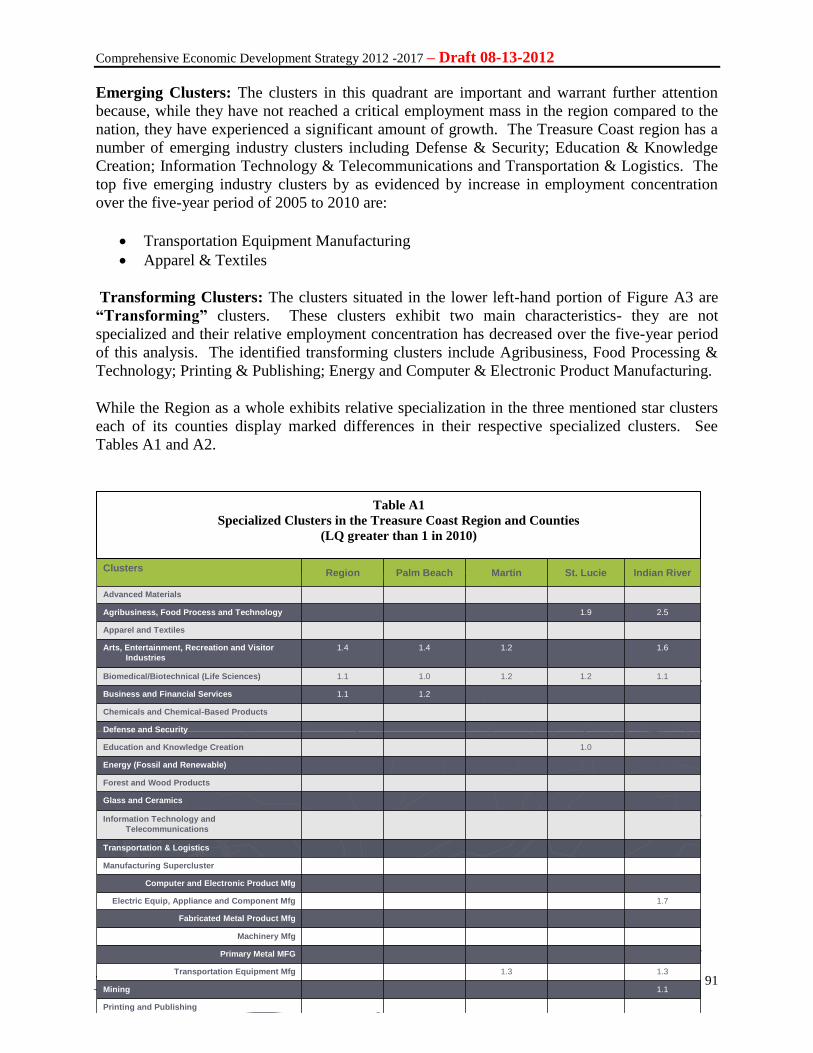
Comprehensive Economic Development Strategy 2012 -2017 – Draft 08-13-2012
Treasure Coast Regional Planning Council
91
Emerging Clusters: The clusters in this quadrant are important and warrant further attention
because, while they have not reached a critical employment mass in the region compared to the
nation, they have experienced a significant amount of growth. The Treasure Coast region has a
number of emerging industry clusters including Defense & Security; Education & Knowledge
Creation; Information Technology & Telecommunications and Transportation & Logistics. The
top five emerging industry clusters by as evidenced by increase in employment concentration
over the five-year period of 2005 to 2010 are:
Transportation Equipment Manufacturing
Apparel & Textiles
Transforming Clusters: The clusters situated in the lower left-hand portion of Figure A3 are
“Transforming” clusters. These clusters exhibit two main characteristics- they are not
specialized and their relative employment concentration has decreased over the five-year period
of this analysis. The identified transforming clusters include Agribusiness, Food Processing &
Technology; Printing & Publishing; Energy and Computer & Electronic Product Manufacturing.
While the Region as a whole exhibits relative specialization in the three mentioned star clusters
each of its counties display marked differences in their respective specialized clusters. See
Tables A1 and A2.
Industry ClustersIndustry ClustersClusters
Region Palm Beach Martin St. Lucie Indian River
Advanced Materials
Agribusiness, Food Process and Technology 1.9 2.5
Apparel and Textiles
Arts, Entertainment, Recreation and Visitor
Industries
1.4 1.4 1.2 1.6
Biomedical/Biotechnical (Life Sciences) 1.1 1.0 1.2 1.2 1.1
Business and Financial Services 1.1 1.2
Chemicals and Chemical-Based Products
Defense and Security
Education and Knowledge Creation 1.0
Energy (Fossil and Renewable)
Forest and Wood Products
Glass and Ceramics
Information Technology and
Telecommunications
Transportation & Logistics
Manufacturing Supercluster
Computer and Electronic Product Mfg
Electric Equip, Appliance and Component Mfg 1.7
Fabricated Metal Product Mfg
Machinery Mfg
Primary Metal MFG
Transportation Equipment Mfg 1.3 1.3
Mining 1.1
Printing and Publishing
Table A1
Specialized Clusters in the Treasure Coast Region and Counties
(LQ greater than 1 in 2010)
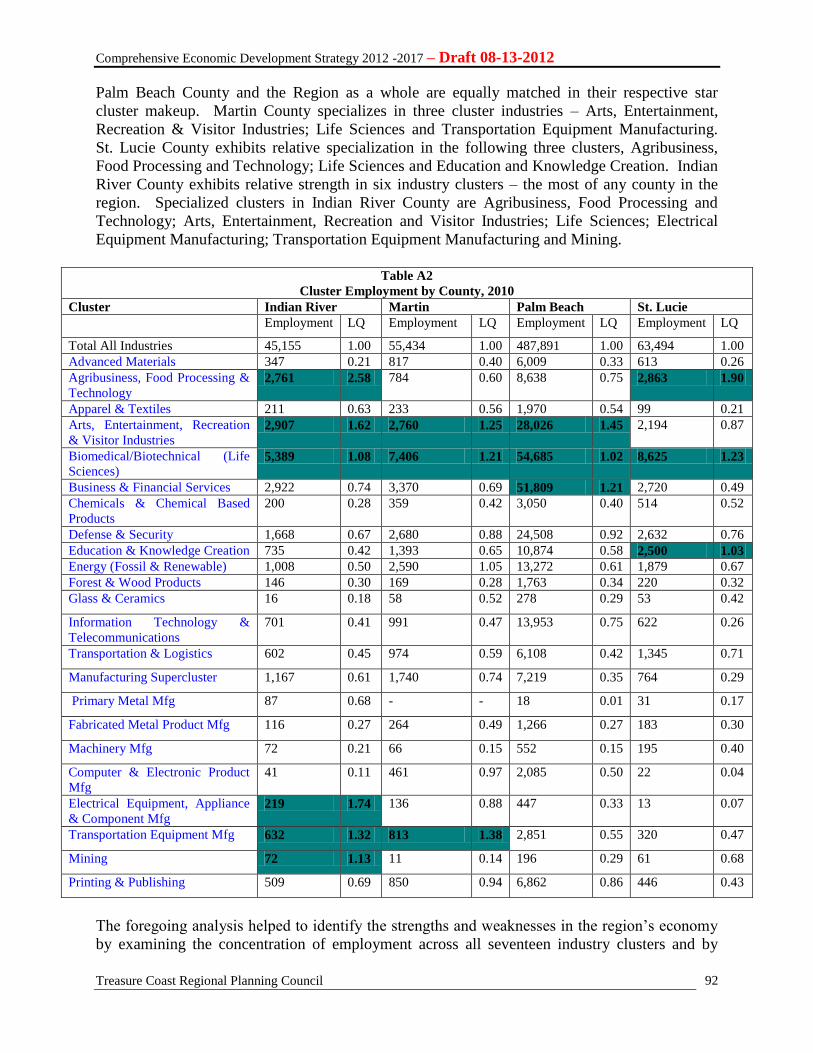
Comprehensive Economic Development Strategy 2012 -2017 – Draft 08-13-2012
Treasure Coast Regional Planning Council
92
Palm Beach County and the Region as a whole are equally matched in their respective star
cluster makeup. Martin County specializes in three cluster industries – Arts, Entertainment,
Recreation & Visitor Industries; Life Sciences and Transportation Equipment Manufacturing.
St. Lucie County exhibits relative specialization in the following three clusters, Agribusiness,
Food Processing and Technology; Life Sciences and Education and Knowledge Creation. Indian
River County exhibits relative strength in six industry clusters – the most of any county in the
region. Specialized clusters in Indian River County are Agribusiness, Food Processing and
Technology; Arts, Entertainment, Recreation and Visitor Industries; Life Sciences; Electrical
Equipment Manufacturing; Transportation Equipment Manufacturing and Mining.
Table A2
Cluster Employment by County, 2010
Cluster Indian River Martin Palm Beach St. Lucie
Employment LQ Employment LQ Employment LQ Employment LQ
Total All Industries 45,155 1.00 55,434 1.00 487,891 1.00 63,494 1.00
Advanced Materials 347 0.21 817 0.40 6,009 0.33 613 0.26
Agribusiness, Food Processing &
Technology 2,761 2.58 784 0.60 8,638 0.75 2,863 1.90
Apparel & Textiles 211 0.63 233 0.56 1,970 0.54 99 0.21
Arts, Entertainment, Recreation
& Visitor Industries 2,907 1.62 2,760 1.25 28,026 1.45 2,194 0.87
Biomedical/Biotechnical (Life
Sciences) 5,389 1.08 7,406 1.21 54,685 1.02 8,625 1.23
Business & Financial Services 2,922 0.74 3,370 0.69 51,809 1.21 2,720 0.49
Chemicals & Chemical Based
Products
200 0.28 359 0.42 3,050 0.40 514 0.52
Defense & Security 1,668 0.67 2,680 0.88 24,508 0.92 2,632 0.76
Education & Knowledge Creation 735 0.42 1,393 0.65 10,874 0.58 2,500 1.03
Energy (Fossil & Renewable) 1,008 0.50 2,590 1.05 13,272 0.61 1,879 0.67
Forest & Wood Products 146 0.30 169 0.28 1,763 0.34 220 0.32
Glass & Ceramics 16 0.18 58 0.52 278 0.29 53 0.42
Information Technology &
Telecommunications
701 0.41 991 0.47 13,953 0.75 622 0.26
Transportation & Logistics 602 0.45 974 0.59 6,108 0.42 1,345 0.71
Manufacturing Supercluster 1,167 0.61 1,740 0.74 7,219 0.35 764 0.29
Primary Metal Mfg 87 0.68 - - 18 0.01 31 0.17
Fabricated Metal Product Mfg 116 0.27 264 0.49 1,266 0.27 183 0.30
Machinery Mfg 72 0.21 66 0.15 552 0.15 195 0.40
Computer & Electronic Product
Mfg
41 0.11 461 0.97 2,085 0.50 22 0.04
Electrical Equipment, Appliance
& Component Mfg 219 1.74 136 0.88 447 0.33 13 0.07
Transportation Equipment Mfg 632 1.32 813 1.38 2,851 0.55 320 0.47
Mining 72 1.13 11 0.14 196 0.29 61 0.68
Printing & Publishing 509 0.69 850 0.94 6,862 0.86 446 0.43
The foregoing analysis helped to identify the strengths and weaknesses in the region’s economy
by examining the concentration of employment across all seventeen industry clusters and by
Comprehensive Economic Development Strategy 2012 -2017 – Draft 08-13-2012
Treasure Coast Regional Planning Council
93
seeing how certain clusters have become more or less specialized over time. The next part of the
analysis attempts to explain how the region’s economic performance differs from the nation as a
whole. This is known as shift-share analysis.
Shift-Share Analysis
Shift-share analysis attempts to explain the changes (employment) in the region’s economy by
deconstructing the actual changes into its three sources: a national growth effect, industrial mix
effect and regional competitiveness effect.
National Growth Effect – The share of regional job growth that can be attributed to the
growth of the national economy.
Industrial Mix Effect – The share of regional industry job growth explained by the
growth of the industry cluster at the national level. To calculate this number, the national
growth rate of the total economy is subtracted from the national growth rate of the
specific industry, and this growth percentage is applied to the regional jobs in that
industry.
Regional Competitiveness Effect – The regional share effect represents the share of
regional job growth that is left after accounting for the national growth and industrial mix
effects. It explains how much of the change in a given industry cluster is due to the
unique set of resources and jobs skills, essentially the region’s competitive advantage that
cannot be explained by national trends in that industry cluster or the economy as a whole.
A positive value indicates the region has a competitive advantage in the industry cluster,
while a negative value indicates a competitive disadvantage.
Table A3 illustrates the shift-share analysis for the Treasure Coast Region. The region’s industry
clusters are organized in the table by their position in the bubble charts in Figures A2 and A3.
Take the Life Sciences industry cluster for example. In 2005 this cluster’s regional employment
level was 68,417. Employment in this cluster increased from 68,417 in 2005 to 76,105 in 2010.
As illustrated in Table x, this change in employment can be deconstructed as follows:
National employment decreased by 2.8% over the period. If the region’s cluster were
to behave like the nation as a whole, 1,943 jobs would have been lost (i.e. -2.8
percent times the cluster’s base employment of 68,417 equals -1,943). This is the
national share effect.
Employment in this industry cluster increased by 9.5% over the period of 2005 to
2010. If the region’s cluster performed like the industry cluster at the national level,
6,527 jobs would have been added (i.e. 9.5% - 2.8% times the cluster’s base
employment of 68,417 equals 4,584, this is the industry cluster share.
The regional share is calculated to produce 5,047 jobs. This is the residual effect
after netting out the national and industry cluster share effects. The positive regional
share indicates that the regional economy enjoys a competitive advantage in the
Biomedical / Biotechnology (Life Sciences) cluster.
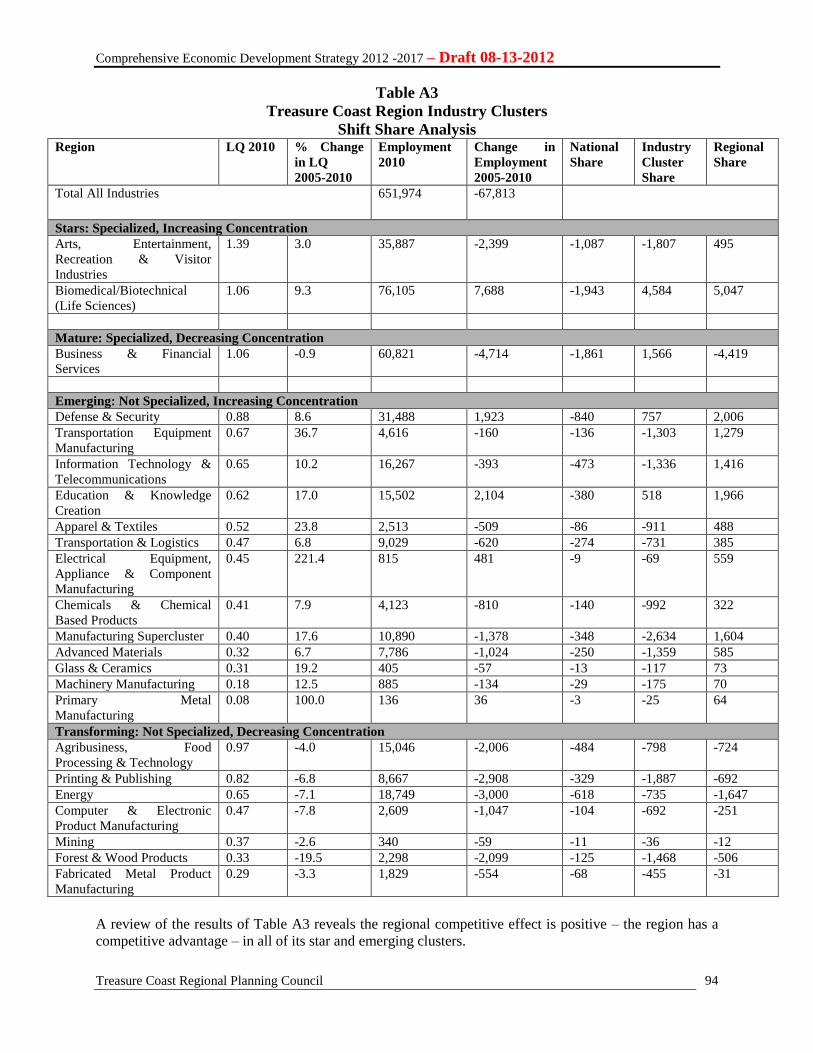
Comprehensive Economic Development Strategy 2012 -2017 – Draft 08-13-2012
Treasure Coast Regional Planning Council
94
Table A3
Treasure Coast Region Industry Clusters
Shift Share Analysis Region LQ 2010 % Change
in LQ
2005-2010
Employment
2010
Change in
Employment
2005-2010
National
Share
Industry
Cluster
Share
Regional
Share
Total All Industries 651,974 -67,813
Stars: Specialized, Increasing Concentration
Arts, Entertainment,
Recreation & Visitor
Industries
1.39 3.0 35,887 -2,399 -1,087 -1,807 495
Biomedical/Biotechnical
(Life Sciences)
1.06 9.3 76,105 7,688 -1,943 4,584 5,047
Mature: Specialized, Decreasing Concentration
Business & Financial
Services
1.06 -0.9 60,821 -4,714 -1,861 1,566 -4,419
Emerging: Not Specialized, Increasing Concentration
Defense & Security 0.88 8.6 31,488 1,923 -840 757 2,006
Transportation Equipment
Manufacturing
0.67 36.7 4,616 -160 -136 -1,303 1,279
Information Technology &
Telecommunications
0.65 10.2 16,267 -393 -473 -1,336 1,416
Education & Knowledge
Creation
0.62 17.0 15,502 2,104 -380 518 1,966
Apparel & Textiles 0.52 23.8 2,513 -509 -86 -911 488
Transportation & Logistics 0.47 6.8 9,029 -620 -274 -731 385
Electrical Equipment,
Appliance & Component
Manufacturing
0.45 221.4 815 481 -9 -69 559
Chemicals & Chemical
Based Products
0.41 7.9 4,123 -810 -140 -992 322
Manufacturing Supercluster 0.40 17.6 10,890 -1,378 -348 -2,634 1,604
Advanced Materials 0.32 6.7 7,786 -1,024 -250 -1,359 585
Glass & Ceramics 0.31 19.2 405 -57 -13 -117 73
Machinery Manufacturing 0.18 12.5 885 -134 -29 -175 70
Primary Metal
Manufacturing
0.08 100.0 136 36 -3 -25 64
Transforming: Not Specialized, Decreasing Concentration
Agribusiness, Food
Processing & Technology
0.97 -4.0 15,046 -2,006 -484 -798 -724
Printing & Publishing 0.82 -6.8 8,667 -2,908 -329 -1,887 -692
Energy 0.65 -7.1 18,749 -3,000 -618 -735 -1,647
Computer & Electronic
Product Manufacturing
0.47 -7.8 2,609 -1,047 -104 -692 -251
Mining 0.37 -2.6 340 -59 -11 -36 -12
Forest & Wood Products 0.33 -19.5 2,298 -2,099 -125 -1,468 -506
Fabricated Metal Product
Manufacturing
0.29 -3.3 1,829 -554 -68 -455 -31
A review of the results of Table A3 reveals the regional competitive effect is positive – the region has a
competitive advantage – in all of its star and emerging clusters.

Comprehensive Economic Development Strategy 2012 -2017 – Draft 08-13-2012
Treasure Coast Regional Planning Council
95
DETAILED CLUSTER DEFINITIONS TO BE INSERTED HERE.
Comprehensive Economic Development Strategy 2012 -2017 – Draft 08-13-2012
Treasure Coast Regional Planning Council
96
B. PERFORMANCE MEASURES
This section introduces a set of metrics by which the Regional Planning Council can chart the
successful implementation of the CEDS.
An important component in the successful implementation of this Comprehensive Economic
Development Strategy is to measure progress towards achieving our Vision of regional economic
sustainability. This requires a set of metrics by which the Regional Planning Council can chart
the progress of the Region’s economy. The following metrics can be used to measure progress
towards the successful implementation of the CEDS Plan:
1. Number of Jobs Created After Implementation of the CEDS
a. Total Employment in Initial Year
b. Total Employment in Subsequent Years
2. Number and Types of Public Sector Investments Undertaken in the Region
a. EDA Sponsored Investments
b. Significant State and Local Investments
3. Number of Jobs Retained in the Region
a. Number of Jobs Retained as a Result of Federal Investments
b. Number of Jobs Retained as a Result of Select State and Local Investments
4. Amount of Private Sector Investment in the Region After Implementation of the CEDS
5. Changes in the Economic Environment of the Region (Changes to Taxes & Fees, New
Incentive Programs, etc.)
Additionally, as part of the Florida Regional Councils Association’s efforts to coordinate and
maintain consistency with the State in its development of the 2012-2017 Statewide Strategic
Plan for Economic Development, all CEDS Plans statewide have incorporated the following “Six
Pillars” metrics:
A detailed supplement with tables and illustrations for the following metrics will be
provided.
1. Talent Supply & Education
a. Average Annual Wage
b. High School Graduation Rates
c. 8th Grade Math Performance
2. Innovation & Economic Development
Comprehensive Economic Development Strategy 2012 -2017 – Draft 08-13-2012
Treasure Coast Regional Planning Council
97
a. Gross Domestic Product
b. Bed Tax Collections
c. Trade Exports and Imports
3. Infrastructure & Growth Leadership
a. Population Counts, Estimates and Projections
b. Building Permits
c. Vehicle Miles Traveled per Lane Mile
4. Business Climate & Competitiveness
a. Average Annual Unemployment Rates
b. Employment by Industry
c. Wages by Industry
5. Civic & Governance Systems
a. Millage Rates
b. Registered Nonprofit Organizations
c. Voter Participation
6. Quality of Life & Quality Places
a. Per Capita Income
b. House Purchase Price and Cost Index
c. Persons Living in Poverty
C. PAST, PRESENT AND PROJECTED FUTURE ECONOMIC
DEVELOPMENT INVESTMENTS
This section to be completed.
a. Recent Economic Development Investments
b. Current Economic Development Investments
c. Anticipated Economic Development Investments
D. INTEGRATING THE CEDS WITH STATE AND REGIONAL
ECONOMIC DEVELOPMENT PRIORITIES
This section to be completed.
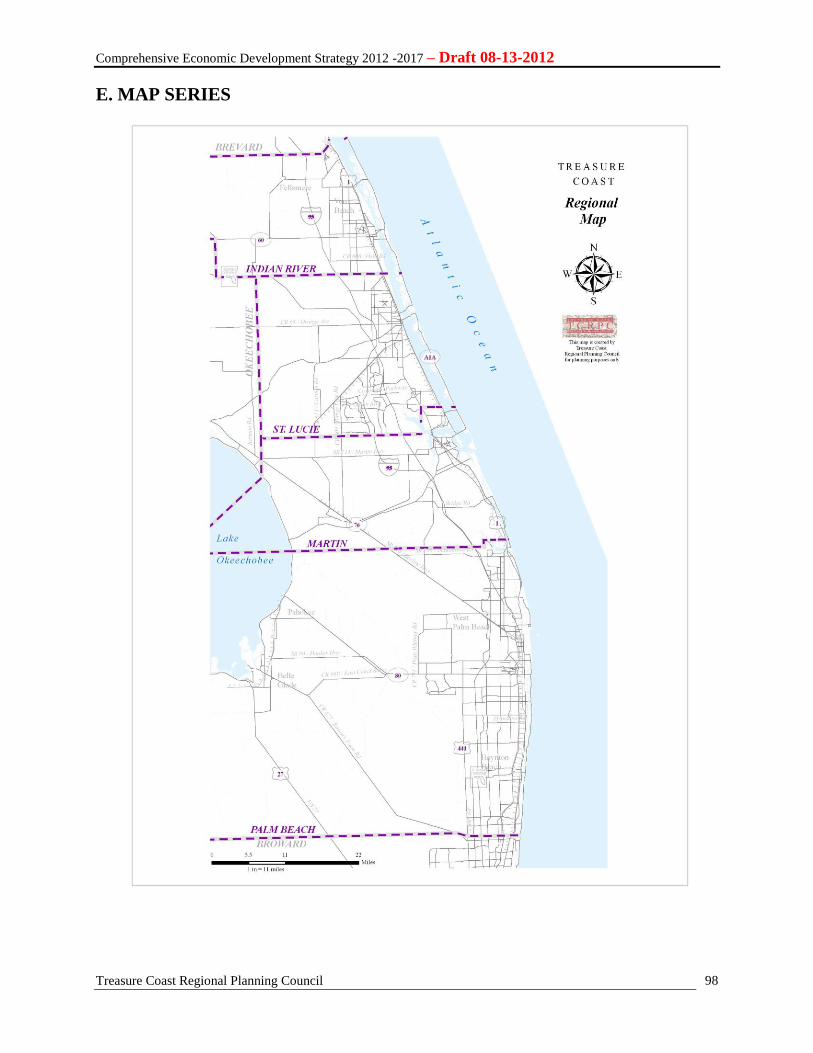
Comprehensive Economic Development Strategy 2012 -2017 – Draft 08-13-2012
Treasure Coast Regional Planning Council
98
E. MAP SERIES
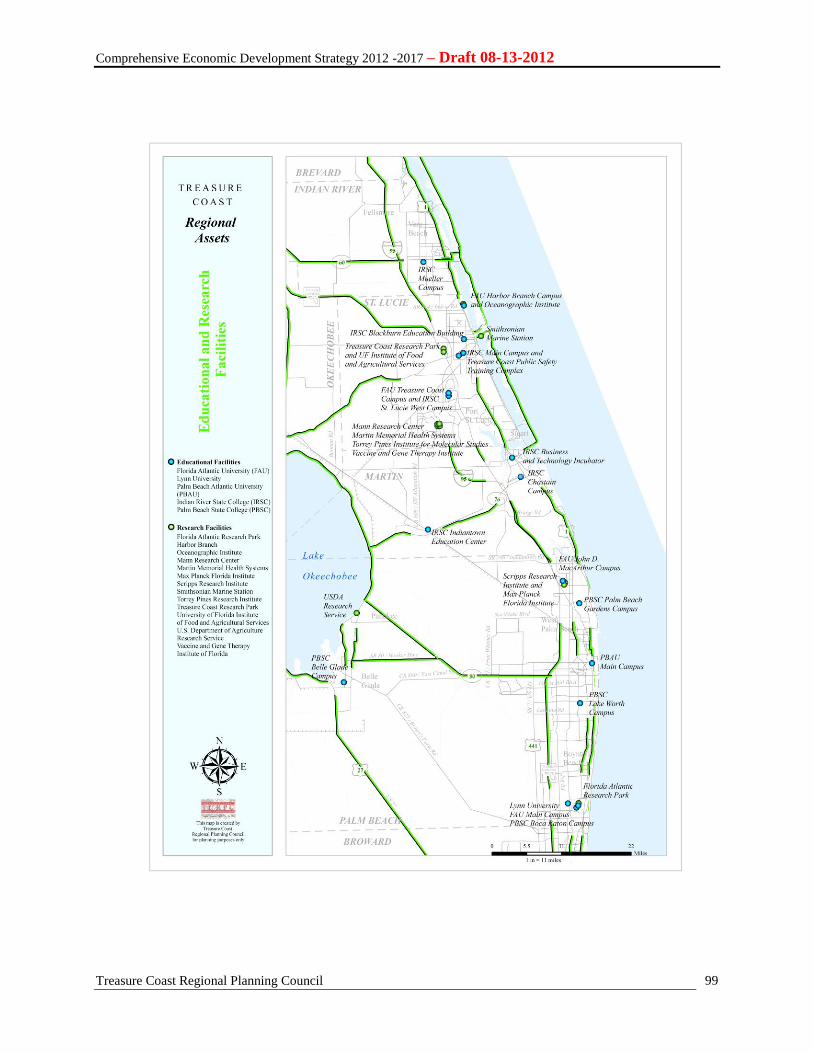
Comprehensive Economic Development Strategy 2012 -2017 – Draft 08-13-2012
Treasure Coast Regional Planning Council
99
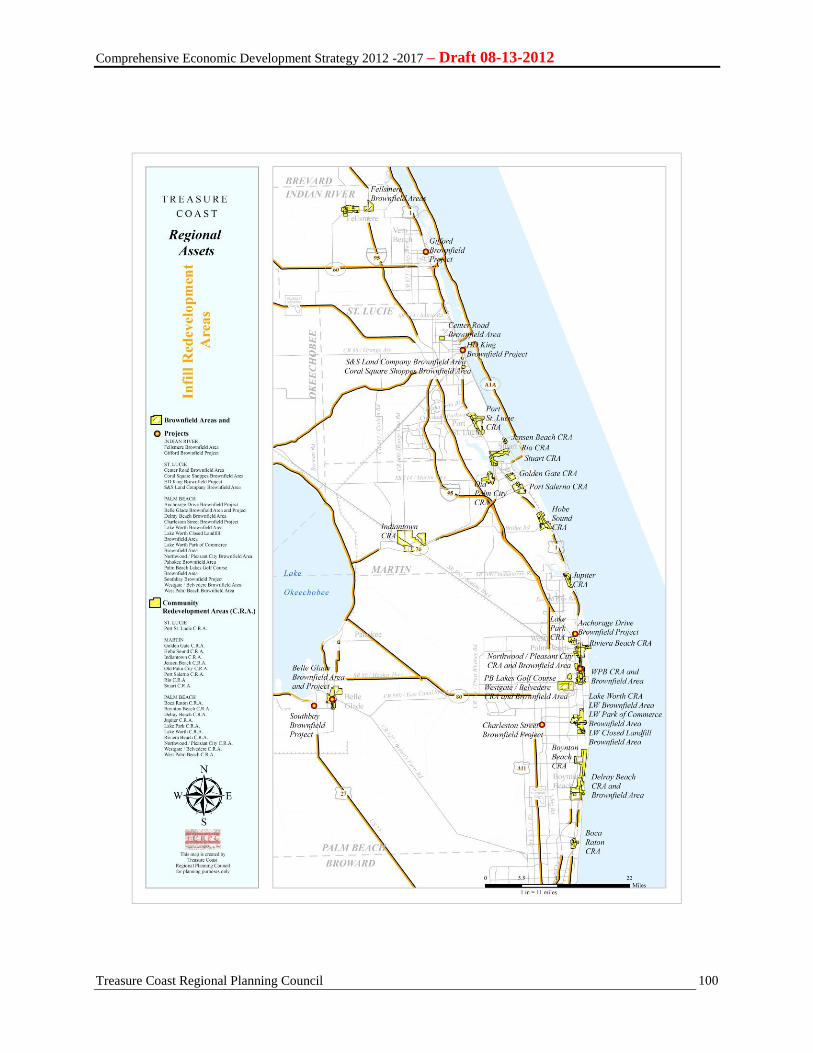
Comprehensive Economic Development Strategy 2012 -2017 – Draft 08-13-2012
Treasure Coast Regional Planning Council
100
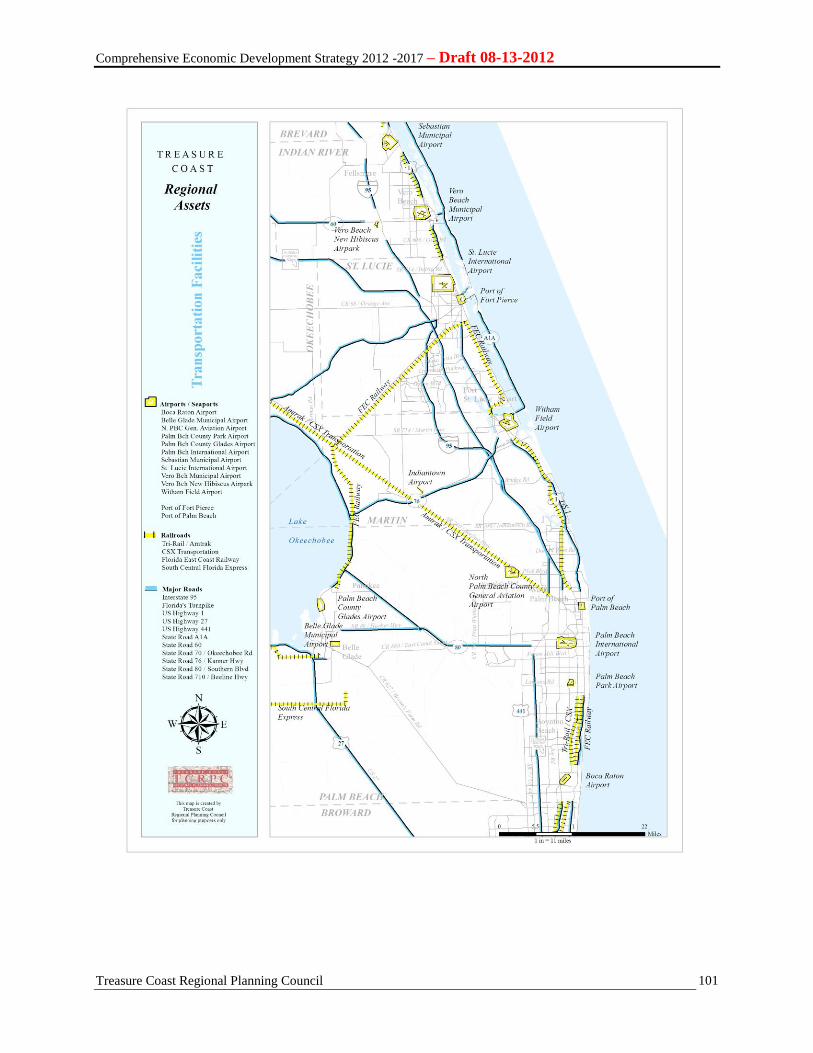
Comprehensive Economic Development Strategy 2012 -2017 – Draft 08-13-2012
Treasure Coast Regional Planning Council
101
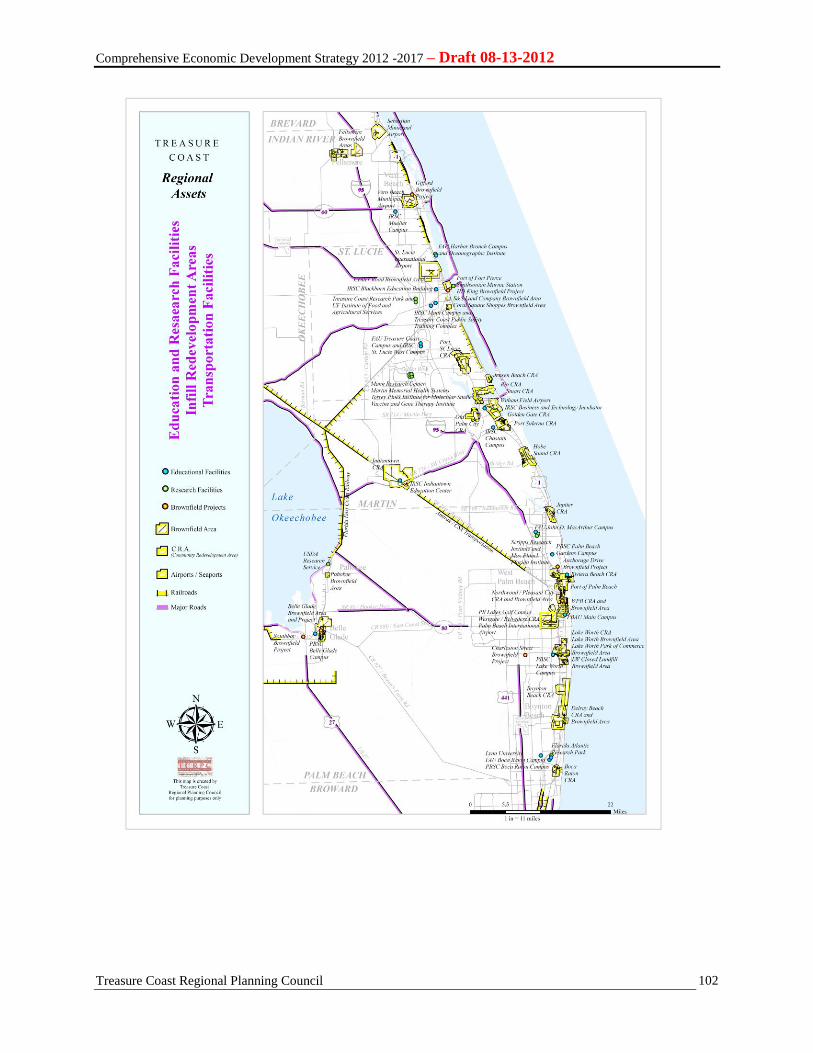
Comprehensive Economic Development Strategy 2012 -2017 – Draft 08-13-2012
Treasure Coast Regional Planning Council
102
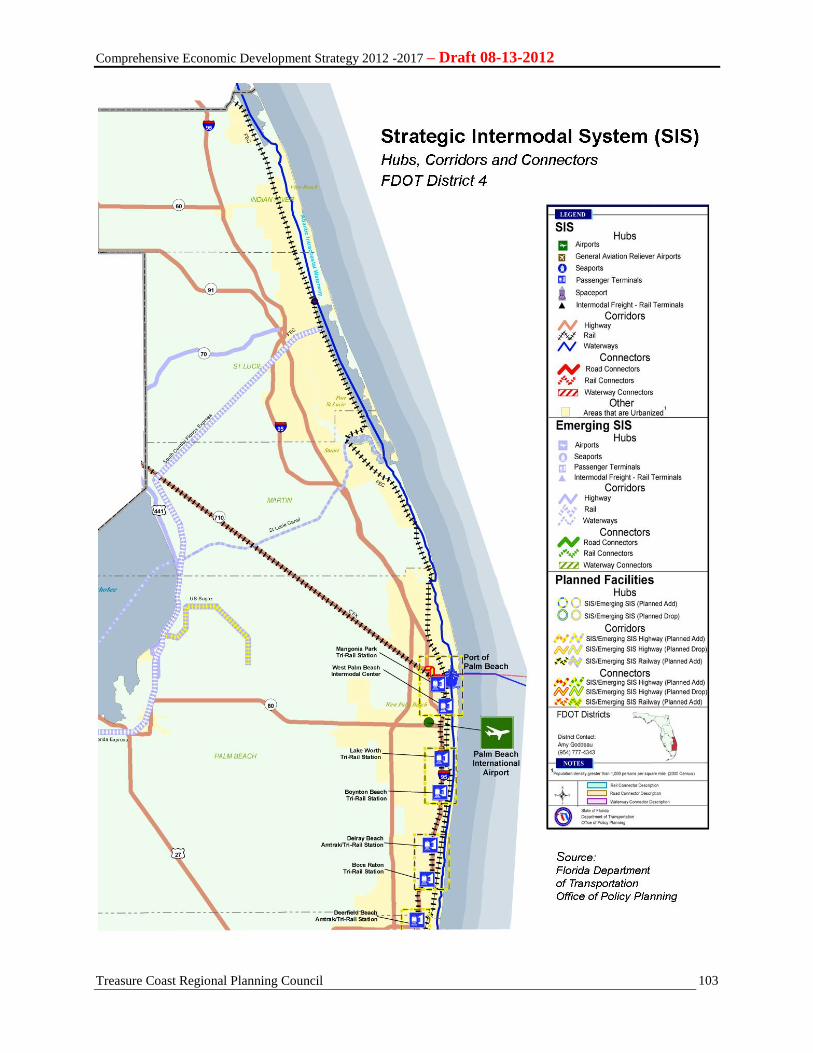
Comprehensive Economic Development Strategy 2012 -2017 – Draft 08-13-2012
Treasure Coast Regional Planning Council
103

Comprehensive Economic Development Strategy 2012 -2017 – Draft 08-13-2012
Treasure Coast Regional Planning Council
104
F. OTHER (TBD)