treasury bulletin - fraser · capitalmovements 88...
TRANSCRIPT


J UN ?,6 1972
TREASURY DEPARTIVIENT
AC4245


THE DEPARTMENT OF THE TREASURYFISCAL SERVICE, BUREAU OF ACCOUNTS
OFFICE OF THE COMMISSIONERWASHINGTON, D.C. 20226
OFFICIAL BUSINESS
POSTAGE AND FEES PAID
U.S. TREASURY DEPARTMENT
BUYAND
HOLDUNITEDS TAT E S
SAVINGS
BONDS

August 1968
!»«»! !«!•!! "•
iiiiiiiinnniiiinnnnnnn"^«"iiHn:'«:*ar!««r!PNi«f itn»»««aat>-a>M.pp,..'*ffft*«tM!
^— —'—
—
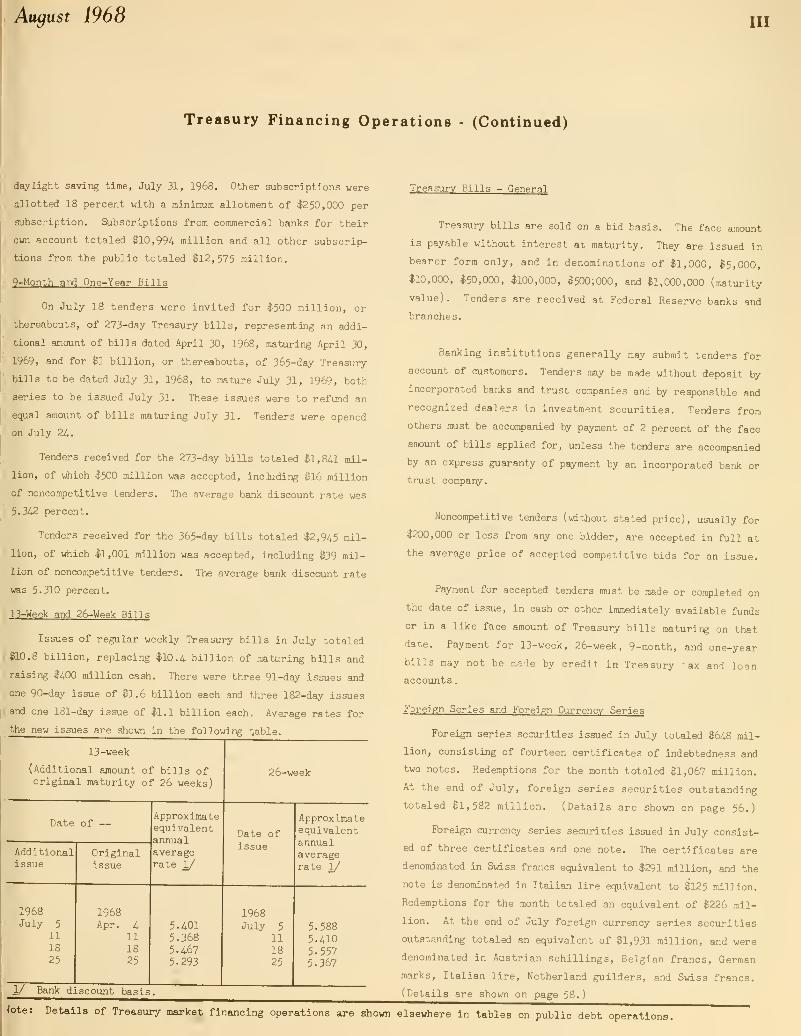
The Treasury Bulletin is for sale by theSuperintendent of Documents,
U.S. Government Printing Office, Washington, D.C. 20402Subscription per year $8.50 domestic, $11.00 foreign.
Single copy price varies.
August 1968
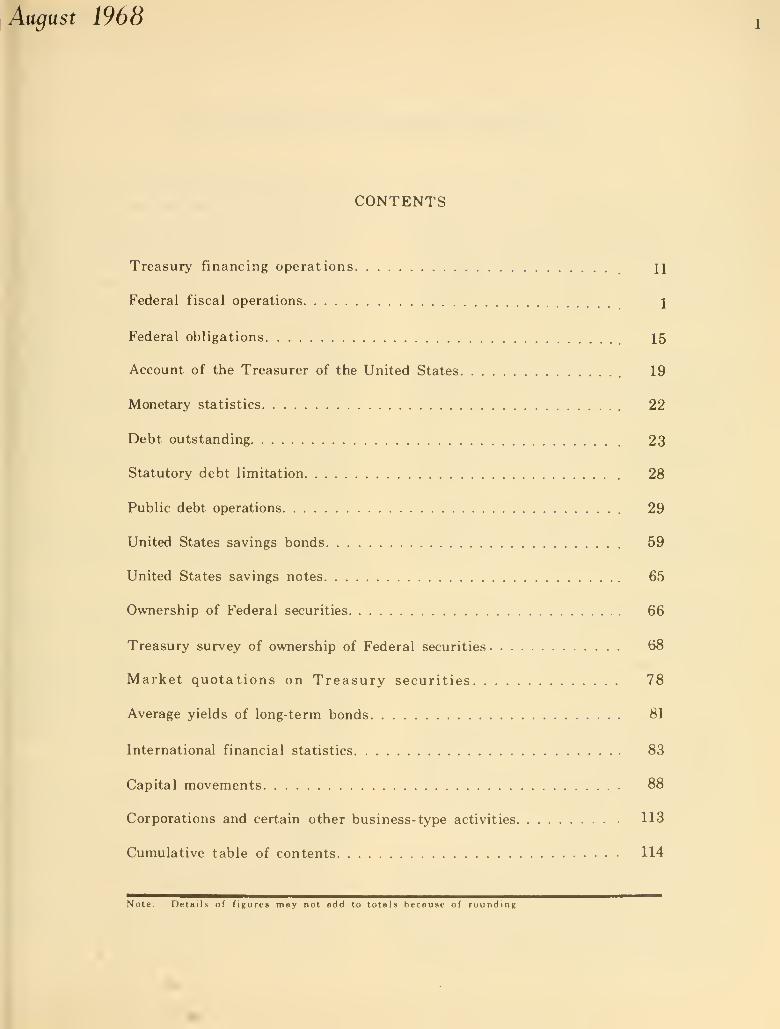
CONTENTS
Treasury financing operations H
Federal fiscal operations 1
Federal obligations 15
Account of the Treasurer of the United States 19
Monetary statistics 22
Debt outstanding 23
Statutory debt limitation 28
Public debt operations 29
United States savings bonds 59
United States savings notes. 65
Ownership of Federal securities 66
Treasury survey of ownership of Federal securities 68
Market quotations on Treasury securities 78
Average yields of long-term bonds 81
International financial statistics 83
Capital movements 88
Corporations and certain other business-type activities 113
Cumulative table of contents 114
Note: Details of figures may not add to totals because of rounding
II Treasury BaUetin
Treasury Financing Operations
August Financing
On July 31 the Treasury announced an offering for cash of
$5.1 billion, or thereabouts, to the public of 5-5/8 percent
Treasury Notes of Series B-1974., dated August 15, 1968, due
August 15, 197A, at 99.62, to yield about 5.70 percent. An
additional amount was to be allotted to Federal Reserve banks
and Government investment accounts. The proceeds were to be
used to pay off in cash |8,576 million of 4--V4- percent notes
and 3-3A percent bonds maturing August 15, 1968, and to raise
new cash. The subscription books were open only on Monday,
August 5. Subscriptions from the public totaled $23,569 mil-
lion of which $5,474 million was accepted. Federal Reserve
banks and Government investment accounts were allotted $4,811
million.
Interest is payable on the new notes semiannually on
February 15 and August 15. The notes are not subject to call
for redemption prior to maturity. Bearer notes, with interest
coupons attached, and notes registered as to principal and
interest were authorized to be issued in denominations of
$1,000, $5,000, $10,000, $100,000, $1,000,000, $100,000,000,
and $500,000,000.
Subscriptions were received subject to allotment and were
payable in cash or in Treasury securities maturing August 15,
1968, which were accepted at par, in payment or exchange, in
whole or in part. Payment was required to be made or complet-
ed on or before August 15, 1968. Payment by credit in Treas-
ury tax and loan accounts was permitted for 50 percent of the
amount of notes allotted.
Coupons dated August 15, 1968, on the maturing securities
in bearer form submitted in payment for the new notes, were to
be detached by holders and cashed when due. In the case of
registered securities submitted in payment, the final interest
due on August 15, 1968, was paid by Issuance of interest
checks in regular course to holders of record on July 15, 1968,
the date the transfer books closed.
Commercial banks could submit subscriptions for account
of their customers provided the names of the customers were
set forth in such subscriptions. Others than commercial banks
were not permitted to enter subscriptions except for their own
account. Commercial banks' subscriptions for their own ac-
count, were restricted in each case to an amount not exceeding
50 percent of the combined capital (not including capital
notes or debentures), surplus, and undivided profits of the
subscribing bank.
Subscriptions were received without deposit from banking
institutions for their own account. Federally-insured savings
and loan associations. States, political subdivisions or in-
strumentalities thereof, public pension and retirement and
other public funds, international organizations in which the
United States holds membership, foreign central banks and for-
eign States, and dealers v4io make primary markets in Government
securities and report daily to the Federal Reserve Bank of New
York their positions with respect to Government securities and
borrowings thereon. All other subscriptions were required to
be accompanied by payment of 10 percent (in cash or in the
maturing securities, which were accepted at par) of the amount
of notes applied for, not subject to withdrawal until after
allotment.
All subscribers were required to agree not to purchase or
to sell, or to make any agreements with respect to the pur-
chase or sale or other disposition of the notes subscribed for
at a specific rate or price, until after midnight August 5)
1968.
Commercial banks in submitting subscriptions were requir-
ed to certify that they had no beneficial interest in any of
the subscriptions they entered for the account of their cus-
tomers, and that their customers had no beneficial interest in
the banks' subscriptions for their own account. They were re-
quired to certify also that they had not made unsecured loans,
or loans collateralized in whole or in part by the notes sub-
scribed for, to cover amounts required to be paid when sub-
scriptions were entered.
As provided in the offering circular, the Treasury allot-
ted in full all subscriptions for $250,000 or less and all
subscriptions, $122 million, from States, political subdivi-
sions or instrumentalities thereof, public pension and retire-
ment and other public funds, international organizations in
which the United States holds membership, and foreign central
banks and foreign States where a statement was submitted cer-
tifying that the amount of the subscription did not exceed the
amount of Treasury securities maturing August 15, 1968, owned
or contracted for purchase for value at 4:00 p.m.. Eastern
August 1968 III
Treasury Financing Operations - (Continued)
daylight saving time, July 31, 1968. Other subscriptions were
allotted 18 percent with a minimum allotment of $250,000 per
subscription. Subscriptions from commercial banks for their
own account totaled $10,994. million and all other subscrip-
tions from the public totaled $12,575 million.
9-Month and One-Year Bills
On July 18 tenders were invited for $500 million, or
thereabouts, of 273-day Treasury bills, representing an addi-
tional amount of bills dated April 30, 1968, maturing April 30,
1969, and for $1 billion, or thereabouts, of 365-day Treasury
bills to be dated July 31, 1968, to mature July 31, 1969, both
series to be issued July 31. These issues were to refund an
equal amount of bills maturing July 31. Tenders were opened
on July 2/^.
Tenders received for the 273-day bills totaled $1,8-41 mil-
lion, of which $500 million was accepted, including $16 million
of noncompetitive tenders. The average bank discount rate was
5.3^2 percent.
Tenders received for the 365-day bills totaled $2,9/t5 mil-
lion, of which $1,001 million was accepted, including $39 mil-
lion of noncompetitive tenders. The average bank discount rate
was 5.310 percent.
13-Week and 26-Week Bills
Issues of regular weekly Treasury bills in July totaled
I $10.8 billion, replacing $10.4- billion of maturing bills and
raising $400 million cash. There were three 91-day issues and
one 90-day issue of $1.6 billion each and three 182-day issues
I and one 181-day issue of $1.1 billion each. Average rates for
: the new issues are shown in the following table.
13-week
(Additional amount of bills oforiginal maturity of 26 weeks)
Date of —
Additionalissue
1968July 5
11
1825
Originalissue
1968Apr. 4
11
1825
Approximateequivalentannualaveragerate 1/
26-week
5.4015.3685.4.67
5.293
1/ Bank discount basis.
Date ofissue
1968July 5
11
1825
Approximateequivalentannualaveragerate 1/
5.5885.4105.5575.367
Treasury Bills - General
Treasury bills are sold on a bid basis. The face amount
is payable without interest at maturity. They are issued in
bearer form only, and in denominations of $1,000, $5,000,
$10,000, $50,000, $100,000, $500;000, and $1,000,000 (maturity
value). Tenders are received at Federal Reserve banks and
branches.
Banking institutions generally may submit tenders for
account of customers. Tenders may be made without deposit by
incorporated banks and trust companies and by responsible and
recognized dealers in investment securities. Tenders from
others must be accompanied by payment of 2 percent of the face
amount of bills applied for, unless the tenders are accompanied
by an express guaranty of payment by an incorporated bank or
trust company.
Noncompetitive tenders (without stated price), usually for
$200,000 or less from any one bidder, are accepted in full at
the average price of accepted competitive bids for an issue.
Payment for accepted tenders must be made or completed on
the date of issue, in cash or other immediately available funds
or in a like face amount of Treasury bills maturing on that
date. Payment for 13-week, 26-week, 9-month, and one-year
bills may not be made by credit in Treasury tax and loan
accounts
.
Foreign Series and Foreign Currency Series
Foreign series securities issued in July totaled $648 mil-
lion, consisting of fourteen certificates of indebtedness and
two notes. Redemptions for the month totaled $1,067 million.
At the end of July, foreign series securities outstanding
totaled $1,582 million. (Details are shown on page 56.)
Foreign currency series securities issued in July consist-
ed of three certificates and one note. The certificates are
denominated in Swiss francs equivalent to $291 million, and the
note is denominated in Italian lire equivalent to $125 million.
Redemptions for the month totaled an equivalent of $226 mil-
lion. At the end of July foreign currency series securities
outstanding totaled an equivalent of $1,931 million, and were
denominated in Austrian schillings, Belgian francs, German
marks, Italian lire, Netherland guilders, and Swiss francs.
(Details are shown on page 58.)
Jote: Details of Treasury market financing operations are shown elsewhere in tables on public debt operations.

Am^ust 1968
.FEDERAL FISCAL OPERATIONS.
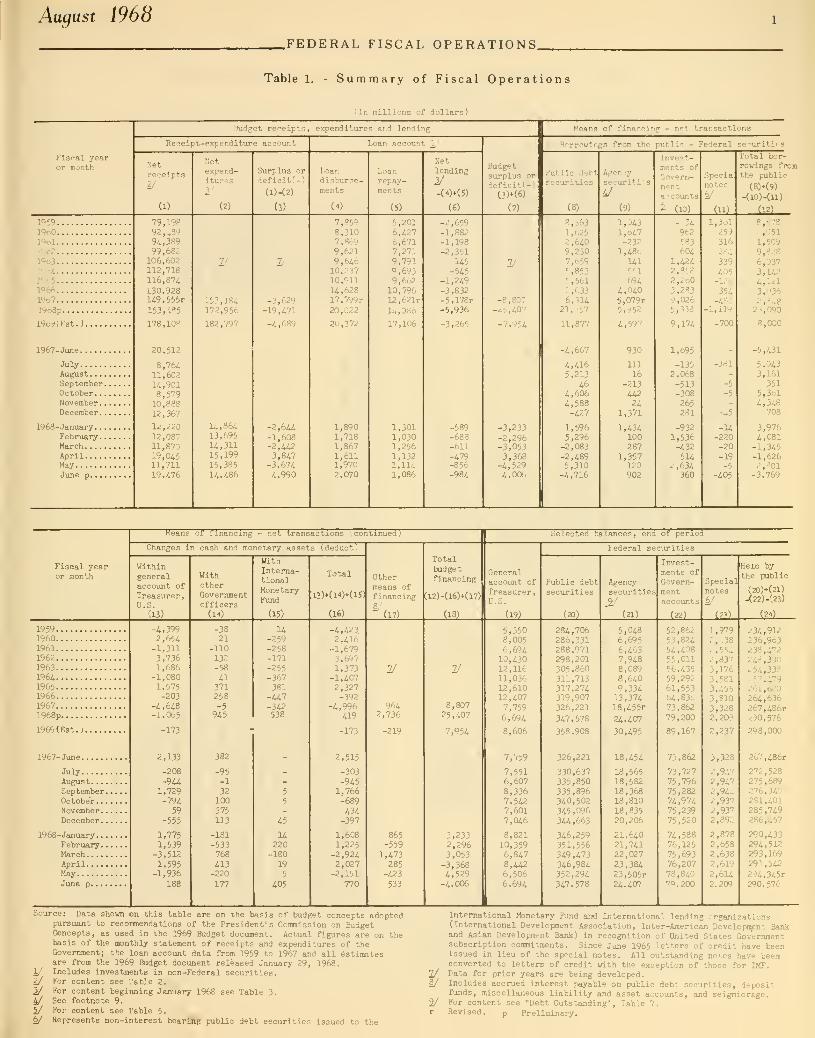
Table 1. - Summary of Fiscal Operations
(In millions of dollars)
Fisnal yearor month
budget re'-'eipts, expenditures ar.d lendii-ig
Receipt-expenditure account
Netreceipts2/
(1)
Ketexpend-itures
(2)
Surplus ordeficit(-)
(l)-(2)
(3)
Loan account !
Loandisburse-ments
(4)
Loanrepay-ments
(5)
Net
lending
2/
(6)
Budgetsurplus or
deficit(-)
(3W6)
(7)
of financing - net transactions
Borrowings from the public Federal se -uritit-^s
Public d=btseciiritie
(8)
Agencysecurities
4/
(9)
Invept-ments ofGovern-menta -'counts
^ (10)
Specialnotes
_liil
Total bor-rowings fromthe public
(8)*(9)
-(lo)-(ll)
1959196019oli'-62
19o31"'^4
l<;'-5
19661967
19o8p
1969(Est.)
1967-June
JulyAugust . .
.
SeptemberOctober.
.
November.December.
1968-January.
.
February.March— .
April. . .
.
MayJune p. .
.
79,1J-'
92, ^-'-'
99, b?-
106, 60i
112,718ll6,87i
130.928U9,555r153,4?;
178,108
20,512
8,76411,602
U,9018,57910,88812,367
12,22012,08711,87019,04511,711
19.476
153,184172,956
182,797
14,86413,695
U,31115,19915,38514,486
7/
629
,471
-4,689
-2,644-1,608-2,4423,847
-3,6744,990
7,85'-
8,3107,8699,6219,64610,23710,91114,62817,799r
20,022
20,372
1,8901,7181,8671,6111,9702,070
5,2016,4276,6717,271
9,7919,6939,66210,79612,621rl4,08o
17,106
1,3011,0301,2561,1321,1141,086
-2,659-1,882-1,198-2,351
145-545
-1,249-3,832-5,178r-5,936
-3,265
-589-688-611
-479-856-984
2/
-8,807-25,407
-7,954
-3,233-2,296-3,0533,368
-4,5294,006
8,5631,625
2,6409,2307,659
S8535,5612,6336,314
21,357
11,877
-4,667
4,4165,213
464,6064,588-427
1,5965,296
-2,083-2,4895,310
-4,716
1,0431,647-232
1,4861415'1
694
4,0405,079r5,952
4,597
930
11116
-213
44224
1,371
1,434100287
1,357120902
-f34962583604
1,4242,8582,2o03,2839,0265,338
9,174
1,W5
-1352,068-513-308
265281
-932
1,536-432
5U2,634
360
1,361259316284
339405-126
354-482
1, ilv
-700
-3dl
-5
-5
-45
-U-220-20-19-5
-405
8,5782,0511,5099,8286,0373,1424,1213,0362,84823,090
8,000
-5,431
5,0433,161
3515,3614,348
708
3,9764,081
-1,345-1,6262,801-3,769
Fiscal yearor month
Means ol' financing - net transactions f, continued
)
Changes in cash and monetary assets (deduct)
Withingeneralaccount ofTreasurer,U.S.
(13)
WithotherGovernmentofficers
(14)
WithInterna-tionalMonetaryFund
(15)
Total
13)*(14)+(15)
(16)
Othermeans of
financing8''
"(17)
Totalbudgetfinancing
Cl2)-(16)*(17)
(18)
Selected balances, end of period
Generalaccount of
Treasurer,U.S.
(19)
Federal securities
Public debtsecurities
(20)
Agencysecurities
.a'
(21)
Invest-ments of
Govern-mentaccounts
(22)
Specialnotes4''
(23)
HeiQ bythe public
(20)+(2l)
(22)-C23)
(24)
1959196019611962
196319641965196619671968p
1969(Est.;
1967- June
JulyAugust. .
.
SeptemberOctober.
.
November.December.
1968- Janxiary.
.
February.March. . .
.
April. . .
.
MayJune p. .
.
-4,3992,654
-1,3113,7361,686
-1,0801,575-203
-4,648-1,065
-173
2,133
-208
-9441,729-794
59
-555
1,775
1,539-3,512
1,595-1,936
188
-3821
-110
132-58
41371258-5
945
332
14-259-258-171-255-367381
-447-342538
-95
.FEDERAL FISCAL OPERATIONS,
Treasury Bulletin
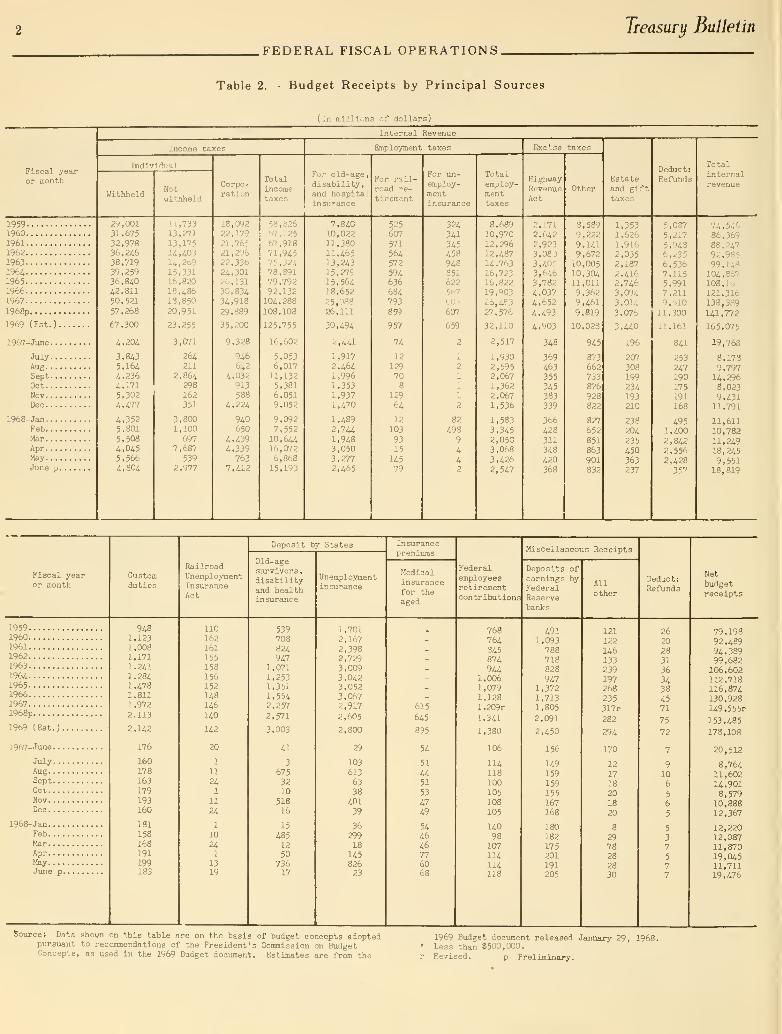
Table 2. - Budget Receipts by Principal Sources
(In millions of dollars)
Fiscal yearor month
Internal Revenue
Income taxes
Individual
Net
withheld
Corpo-ration
Totalincometaxes
Employment taxes
For old-age,disability,and hospitalinsurance
For rail-road re-
tirement
For un-employ-mentinsurance
Total
employ-menttaxes
Excise taxes
HighwayRevenueAct
Estateand gifttaxes
Deduct:
Refunds
Totalinternalrevenue
1959I9601961196219631964196519661967
1968p
1969 (Est.).
1967-June.
.
July.
.
AugSept.
.
OctNov. .
.
Dec
1968-Jan...
Feb. .
.
Mar. .
.
Apr ...
May. .
.
June p,
29,00131,67532,97836,2-16
38,71939,25936,84042,81150,521
57,268
67,300
4,20/4
3,8435,1644,2364,1715,3024,477
4,3525,801
5,5084,0455,5664,804
11,73313,27113,17514,40314,26915,33116,82018,48618,850
20,951
23,255
3,071
264211
2,864298162351
3,8001,100
6977,687
5392,977
18,09222,17921,76521,29622,33624,30126,13130,83434,918
29,889
35,200
9,328
946642
4,032913588
4,224
940650
4,4394,339
7637,412
58,326'37,125
67,91871,94575,32478,89179,79292,132104,288108,108
125,755
16,602
5,0536,01711,1325,3816,0519,052
9,0927,55210,64416,0726,86815,193
7,84010,02211,38011,46513,24315,27915,56418,65225,08826,111
30,494
2,441
1,917
2,4641,9961,3531,9371,470
1,4892,7441,9483,0503,2772.465
525607
571
564572
594636684793
859
957
74
12
129708
129
64
12
103
9315
14579
324341
345458948851622567
6o:>
507
659
1
2
1
1
1
2
82
498
8,68910,97012,29612,48714,76316,72316,82219,903
26,48327,576
32,110
2,517
1,9302,5952,0671,3622,0671,536
1,5833,3452,05c3,0683,4262,547
2,171
2,6422,9233, 08 J
3,40,'
3,6463,7824,0374,652
4,493
4.903
348
369463
355345383
339
366428311348420368
8,5399,2229,1419,67210,00510,30411,0119,3629,4619,819
10,028
945
873662733876928822
827
652851863901832
1,3531.626
1,9162,0352,1872.4162,7463,0943,014
3,076
3,440
196
207
308199
234193
210
238
204
235450363237
5.087
5,217
5,9485,2356,5367,1155.9917.2119.510
11,300
11.161
841
253
247190
175191168
4951,4002,8422,5562,428
357
74,54586,36988,24792,98599,14s104,867108, luJ
121,316138,389
141,772
165,075
19,768
8,1789,79714,2968,023
9,43111,791
11,61110,78211,24918,2459,551
18, 819
Fiscal yearor month
Customduties
RailroadUnemploymentInsuranceA,n
Deposit by States
Old-agesurvivors,disabilityand healthinsurance
Unemploymentinsurance
Insurancepremiums
Medicalinsurancefor theaged
Federalemployeesretirementcontribution!
Miscellaneous Receipts
Deposits ofearnings byFederalReservebanks
Allother
Deduct:Refunds
Netbudgetreceipts
1959196019611962196319641965196619671968p
1969 (Est.).
1967-June . .
.
July. .
.
AugSept. .
.
OctNov. . .
.
Dec
1968-JanFebMar. . .
.
Apr . . .
.
MayJune p.
9481,1231,0081,1711,2411,2841,4781.811
1,972
2,113
2,142
176
160178163
179
193160
181
158168191199183
161
155158
156152148145
140
142
20
1
11
241
11
24
1
10
241
1319
539708824947
1,0711,2531,3511,5542,257
2,571
3,003
a3
6753210
51816
15
48512
50
73617
1,7012,1672,3982,7293,0093,0423,0523,0672,917
2,605
2,800
29
10361363
38401
39
3629918
14582623
615
645
895
54
51
4451
53
4749
54
4646776068
768764845874944
1,0061,0791,128l,209r
1,3a1,380
106
114118100105108
105
14098107114114118
4911,093788718828
9471,3721,7131,805
2,091
2,450
156
149159
159155167168
180182
175201191205
121122146133239197268
235317r
282
294
170
12
1718
2018
20
8
2978282830
2620
28
31
36
3438
4571
75
72
9
106
5
6
5
5
3
7
5
7
7
79,19892,48994,38999,682106,602112,718116,874130,928149,555r
153,485
178,108
20,512
8,76411,60214,9018,579
10,88812,367
12,22012,08711,87019,04511,71119,476
Source; Data shown on this table are on the basis of budget concepts adoptedpursuant to recommendations of the President's Commission on BudgetConcepts, as used in the 1969 Budget document. Estimates are from the
1969 Budget document released January 29, 1968.Less than $500,000.Revised. p Preliminary.
August 1968
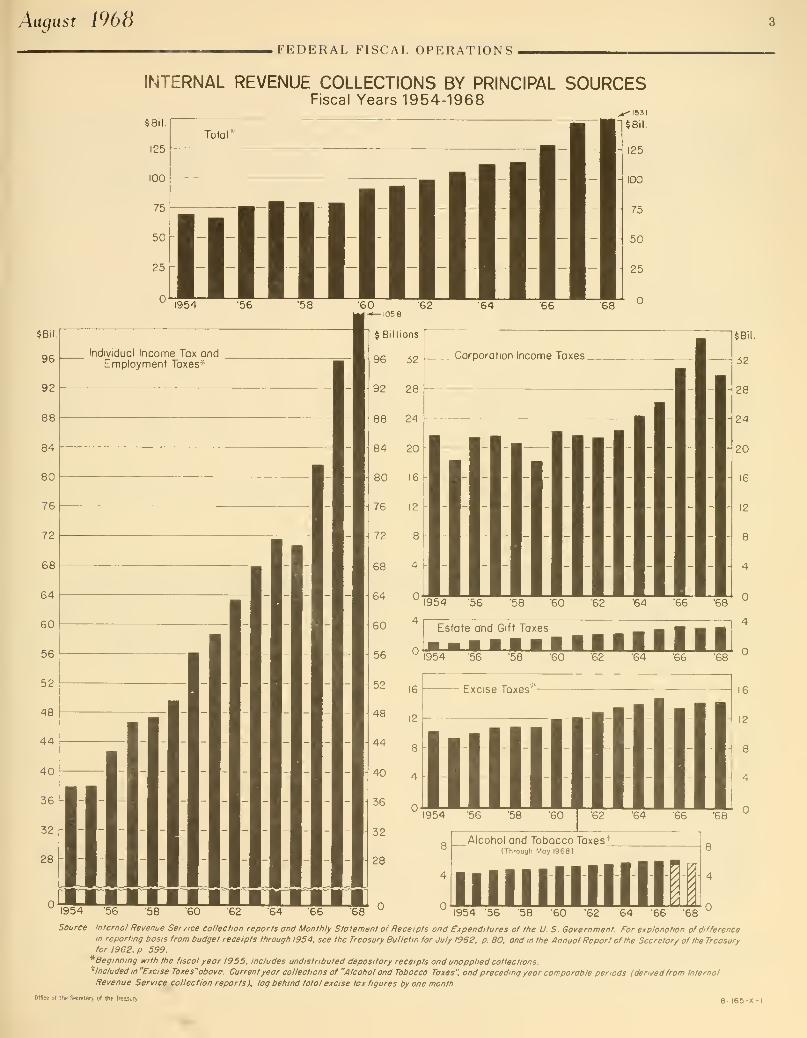
FEDERAL FISCAL OPERATIONS
INTERNAL REVENUE COLLECTIONS BY PRINCIPAL SOURCESFiscal Years 1954-1968
4Bil.
125
100
75
50
25
Treasury Bulletin
.FEDERAL FISCAL OPERATIONS.
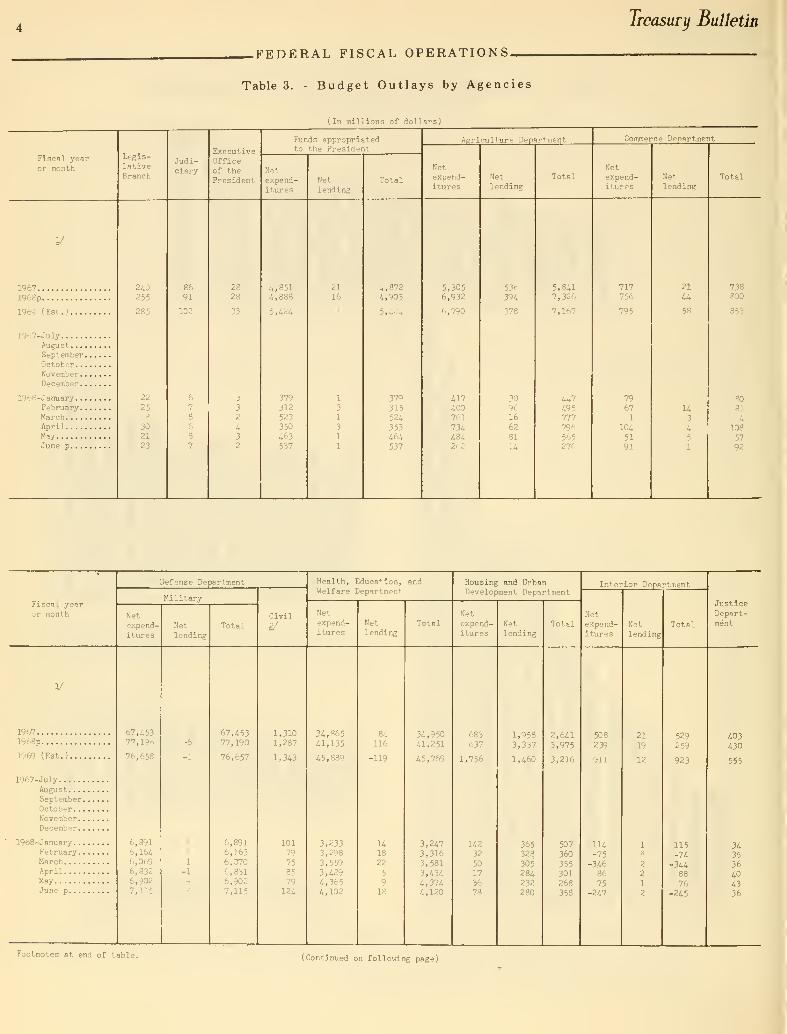
Table 3. - Budget Outlays by Agencies
(In millions of dollars)
August 1968.FEDERAL FISCAL OPERATIONS
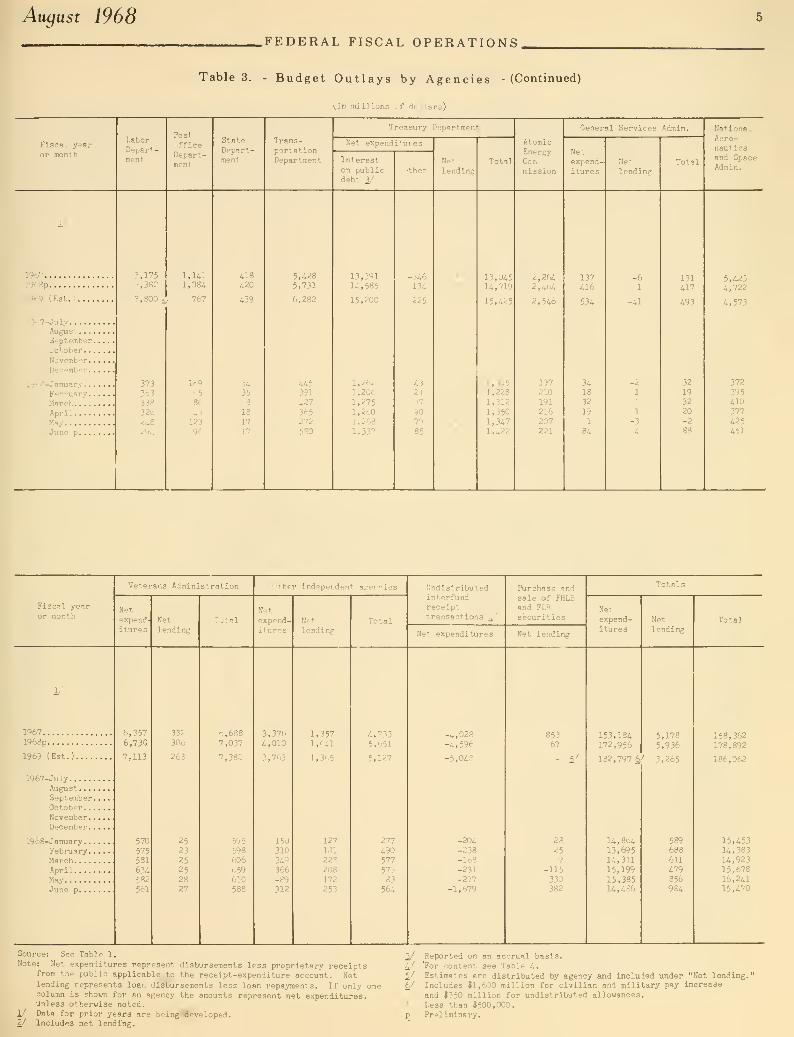
Table 3. - Budget Outlays by Agencies - (Continued)
(In millions of dollars)

Treasury Bulletin
FEDERAL FISCAL OPERATIONS.
Table 4. - Undistributed Interfund Receipt Transactions
August 1968FEDERAL FISCAL OPERATIONS
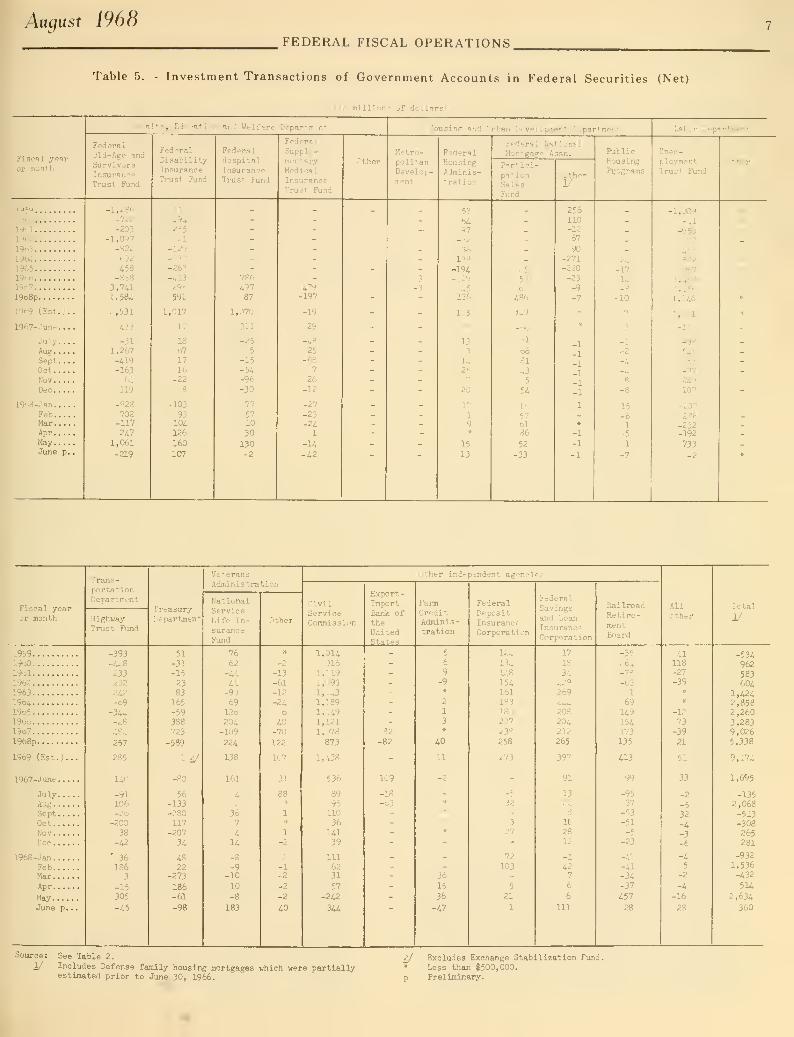
Table 5. - Investment Transactions of Government Accounts in Federal Securities (Net)
(In millions of dollars)
.FEDERAL FISCAL OPERATIONS.
Treasury Bulletin
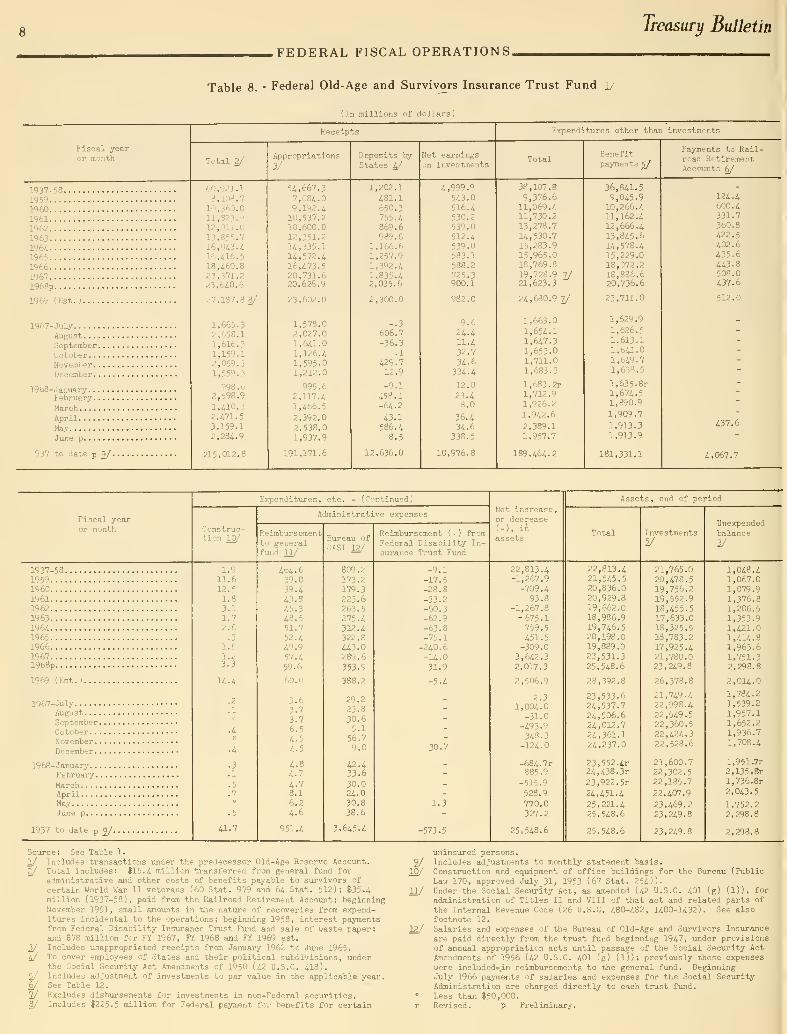
Table 8. - Federal Old-Age and Survivors Insurance Trust Fund 1/
{In millions of dollars)
Fiscal yearor month
1937-53
1959196019611962
196319641965196619671968p
1969 (Est.)
1967-JulyAugustSeptember ....
OctoberNovemberDecember
1968-JanuaryFebruary
MarchApril
MayJune p
1937 to date p ?/.
Receipts
Total 2/
60,921.18,108.710,360.011,823.912,011.013,855.716,043.416,416.518,460.823,371.223,640.6
27,187.8 8/
1,665.32,658.11,616.31,159.12,059.31,559.3
998.62,598.9
1,410.32,471.5
3,159.12,284.9
215,012.8
Appropriations1^
54,667.3
7,084.09,192.410,537.210,600.012,351.2u, 335.114,572.416,473.520,731.620,626.9
23,602.0
1,578.02,027.01,641.01,126.41,595.01,212.0
995.62,117.41,466.5
2,392.02,538.0
Deposits by
States 4/
1,202.1
481.1650.3755.4869.6989.6
1,166.61,257.91,392.41,835.42,035.6
2,300.0
-.3606.7-36.3
.1
429.712.9
-9.1
458.1-64.2
43.1586.4
8.5
12,636.0
Net earningson investments
4,999.9543.0516.4530.2539.0512.4539.0583.1588.2725.3900.1
982.0
9.624.411.432.734.6
334.4
12.0
23.48.0
36.434.6
338.5
10,976.8
Expenditures other than investments
38,107.8
9,376.611,069.411,730.213,278.7
U,530.715,283.915,965.018,769.819,728.9 7/a, 623.
3
24,680.9 7/
1,663.0
1,654.11,647.31,653.01,711.01,683.3
1,683. 2r1,712.9
1,926.2
1,942.6
2.389.11,957.7
189,464.2
Benefitpayments ^
36,841.59,045.910,266.411,162.412,606.413,845.6U,578.415,229.018,072.218,886.620,736.6
23,711.0
1,629.9
1,626.51,613.1l,6a.01,649.71,633.5
l,635.8r1,674.51,890.9
1,909.7
1,913.31,913.9
181,331.1
Payments to Rail-road RetirementAccounts 6/
124.4600.4331.7360.8422.5402.6435.6443.8508.0437.6
512.0
437.6
4,067.7
Fiscal yearor month
Ej:penditures, etc. - (Continued)
Construc-tion 10/
Ailministrative expenses
Reimbursementto generalfund ly
Bureau ofOASI 12/
Reimbursement (-) fromFederal Disability In-surance Trust Fund
Assets, end of period
Net increase,
August 1968
FEDERAL FISCAL OPERATIONS,
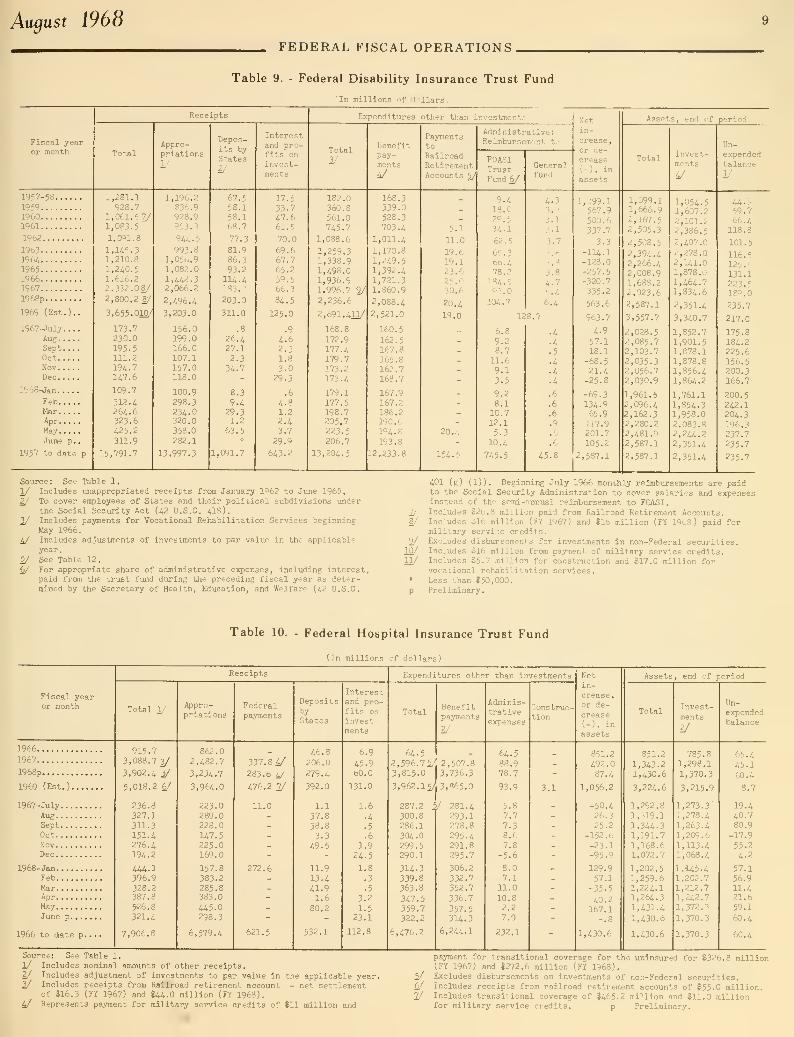
Table 9. - Federal Disability Insurance Trust Fund
tin millions of dollars)
10
FEDERAL FISCAL OPERATIONS
Treasury Bulletin
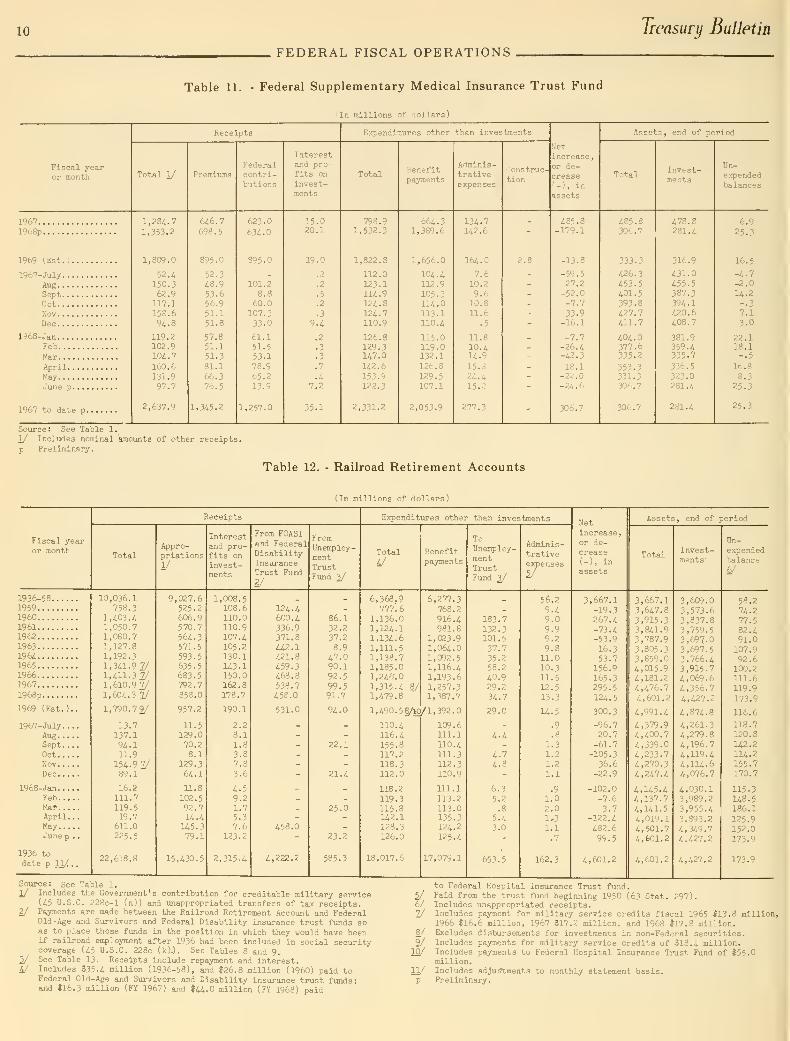
Table 11. - Federal Supplementary Medical Insurance Trust Fund
(In millions of dollars)
Fiscal yearor month
Receipts
Total 1/ PremiumsFederalcontri-butions
Interestand pro-fits on
invest-ments
Expenditures other than investments
Benefitpayments
Adminis-trativeexpenses
Construc-
tion
Netincrease,or de-crease(-), in
assets
Assets, end of period
TotalInvest-ments
Un-expendedbalances
1967.
.
1968p.
1969 IKst. J.
1967-July. .
.
AugSept. .
.
OctNov ....
Dec
1968-JanFeb
Mar ....
April.
.
MayJune p.
1967 to date p.
1,28^.7
1,353.2
1,809.0
52.
i
150.362.9
117.1158.6
9i.3
119.2102.9
104.7
160.6131.9
97.7
2,637.9
646.7
698.5
895.0
52.343.953.656.951.151.8
57.851.1
51.3
81.166.3
70.5
1,3U5.Z
623.0
634.0
395.0
101.28.8
60.0107.333.0
61.151.553.1
73.
9
o5.213.9
1,257.0
15.020.1
1<^.0
^2
.2
.5
.2
.3
9.4
.2
.3
.3
.7
35.1
798.91,532.3
1,822.8
112.0123.1114.9124.8124.7110.9
126.3129.3147.0142.6
153.9122.3
2,331.2
664.31,389.6
1,656.0
104.4112.9
105.3114.0113.1110.4
115.0119.0132.1
126.8
129.5107.1
2,053.9
134.7142.6
164.0
7.610.2
9.610.811.6
11.810.414.9
15.8
24.415.2
435.8-179.1
-13.8
-59.527.2
-52.0-7.7
33.9-16.1
-7.7-26.4-42.3
IS.l-22.0-24.6
30':'. 7
435.8306.7
333.3
426.3453.5401.5393.3427.7411.7
404.0377.6335.2
353.3331.330t..7
300.7
478.8231.4
316.9
431.0455.5387.3394.1420.64O8.7
381.9359.4335.7
336.5323.0281.4
231.4
Source: See Table 1.
1/ Includes nominal amounts of other receipts.
p Preliminary.
6.9
25.3
16.5
-4.7-2.0
U.2-.3
7.13.0
22.118.1-.5
16.8
8.325.3
25.3
Table 12. - Railroad Retirement Accounts
(In millions of dollars)
Auqust 1968FEDERAL FISCAL OPERATIONS
11
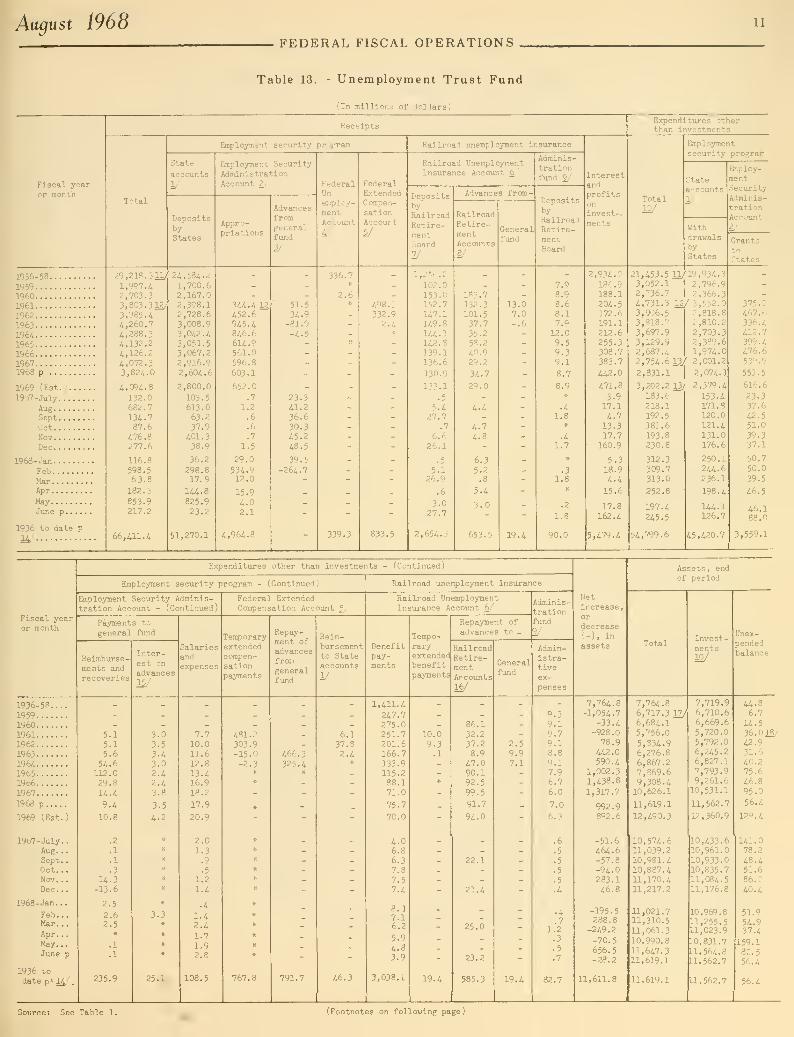
Table 13. - Unemployment Trust Fund
12
FEDERAL FISCAL OPERATIONS,
Treasury Bulletin
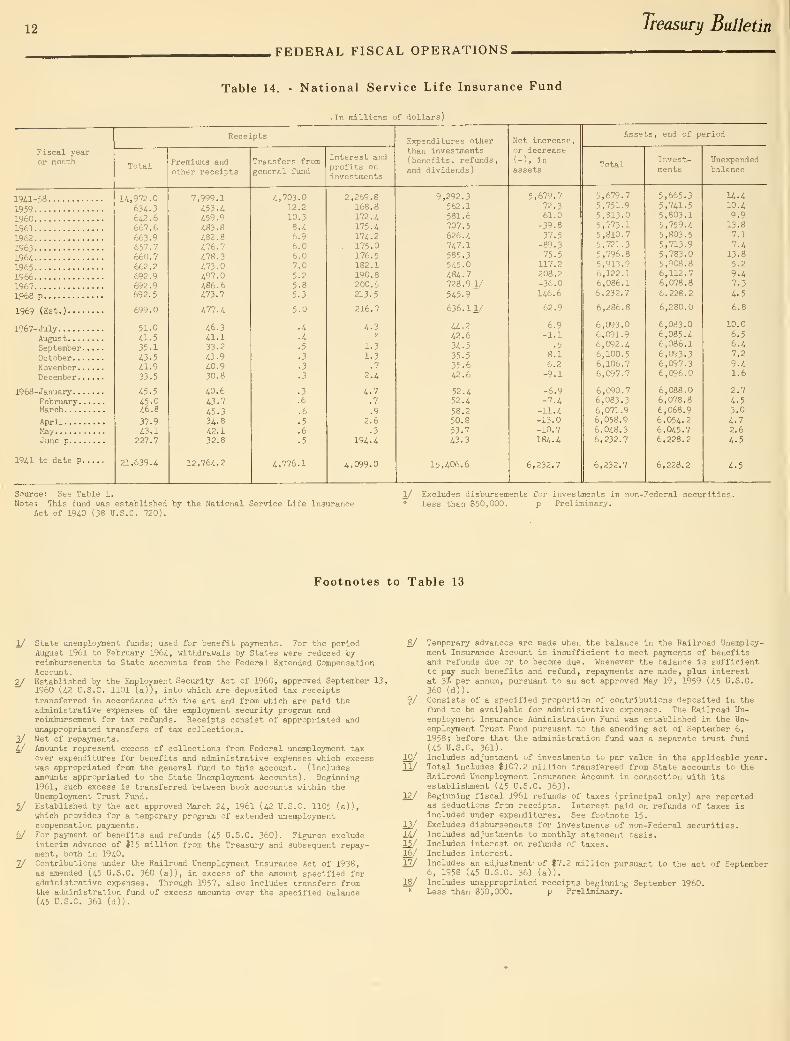
Table 14. - National Service Life Insurance Fund
(In millions of dollars)
Aiiqust 1968 13
FEDERAL FISCAL OPERATIONS.
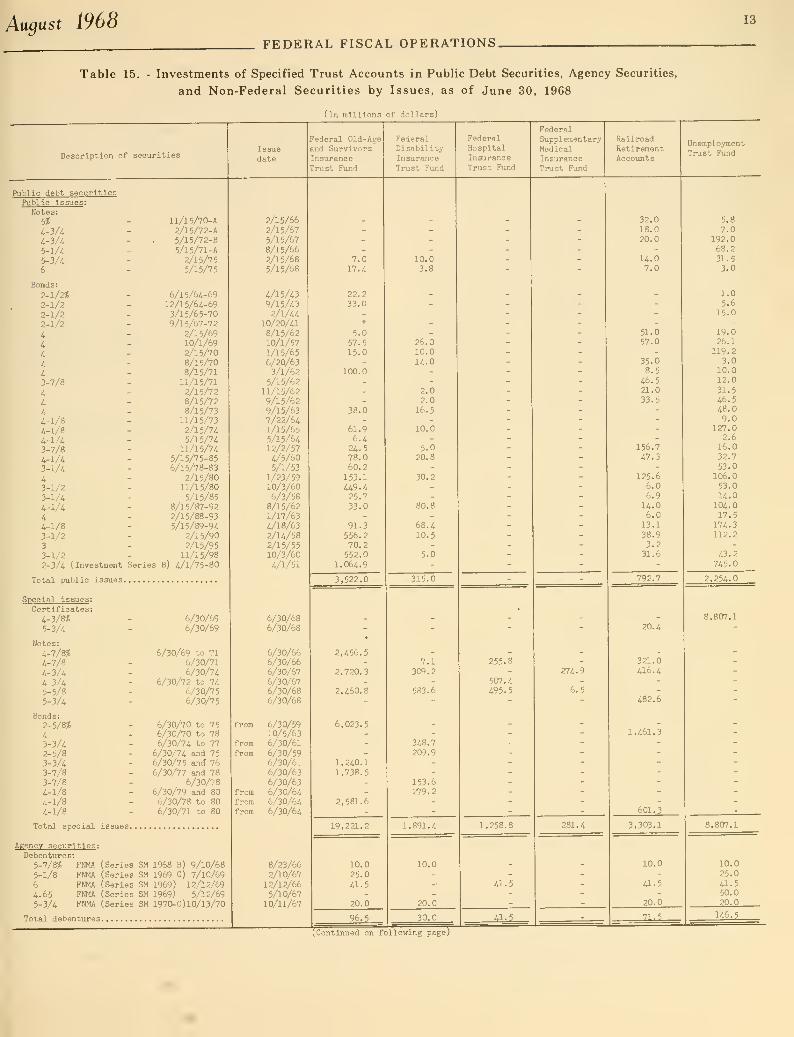
Table 15. - Investments of Specified Trust Accounts in Public Debt Securities, Agency Securities,
and Non-Federal Securities by Issues, as of June 30, 1968
(In millions of dollars)

14 Treasury Bulletin
.FEDERAL FISCAL OPERATIONS
Table 15. - Investments of Specified Trust Accounts in Public Debt Securities, Agency Securities,
and Non-Federal Securities by Issues, as of June 30, 1968 - (Continued)
(In millions of dollars)
Description of securities

Auqust 1968 15
FEDERAL OBLIGATIONS.
"Obligations" are the basis on which the use of funds is
controlled in the Federal Government. They are recorded at the
I -;int at which the Government makes a firm commitment to
quire goods or services and are the first of the four key
vents—order, delivery, payment, consumption—which charac-
terize the acquisition and use of resources. In general, they
insist of orders placed, contracts awarded, services received
and similar transactions requiring the disbursement of money.
The obligational stage of Government transactions is a
strategic point in gauging the impact of the Government's
operations on the national economy, since it frequently repre-
sents for business firms the Government commitment which
stimulates business investment, including inventory purchases
and employment of labor. Disbursements may not occur for
months after the Government places its order but the order
itself usually causes immediate pressure on the private
economy.
Obligations are classified according to a uniform set
of categories which are based upon the nature of the trans-
action without regard to its ultimate purpose. All payments
for salaries and wages, for example, are reported as personnel
compensation, whether the personal services are used in current
operations or in the construction of capi-tal items.
Federal agencies and firms often do business with one
another; in doing so, the "buying" agency records obligations,
and the "performing" agency records reimbursements. In
Tatle 1, obligations that are incurred within the Government
are distinguished from those incurred outside the Government.
Tables 2, 3, and 4 show on]y those incurred outside.
Obligation data for the administrative budget fund
accounts were first published in the September 1967 Treasury
Bulletin and the trust fund accounts were first published
in the October 1967 Bulletin. Beginning with the April 1968
Bulletin, the data are on the basis of the budget concepts
adopted pursuant to the recommendations of the President's
Commission on Budget Concepts.

16 Treasury Bulletin
FEDERAL OBLIGATIONS
Table 1. - Gross Obligations Incurred Within and Outside the Federal Government
by Object Class, May 31, 1968
(In millions of dollars)
Object class
Personal services and benefits
Personnel compensation
Personnel benefitsBenefits for former personnel
Contractual services and supplies
Travel and transportation of persons
Transportation of things
Rent, communications, and utilities
Printing and reproductionOther servicesSupplies and materials
Acquisition of capital assetsEquipmentLands and structuresInvestments and loans
Grants and fixed chargesGrants, subsidies, and contributions
Insurance claims and indemnitiesInterest and dividendsRefunds
OtherUndistributed U. 3, obligationsObligations incurred abroadUnvouchered
Gross obligations incurred 1/
Outside
30,612
2,3352,186
1,201
3,2991,669
19219,15621,614
11,5432,791
21,812
22,10035,65413,068
867
2605,901
17
196,274
Gross obligations incurred
566
2,360670172
5,1557,768
2,164237
795
1,1631,781
28,470
30,612
4,8232,186
1,767
5,6592,339364
24,31029,382
13,7073,02922,607
23,11635,65415,202
867
1,4247,682
17
224,745
Source: Reports on Obligations, Standard Forms 225, from agencies.1/ For Federal Budget presentation a concept of "net obligations
incuried" is generally used. This concept eliminates transactionswithin the Government and revenue and reimbursements from the publicwhich by statute may be used by Government agencies without appro-priation action by the Congress. Summary figiires on this basisfollow. (This data is on the basis of Reports on Obligations
received from the agencies prior to reports submitttd for Budgetpresentation and therefore may differ somewhat from the Budget
document.
)
Gross obligations incurred (as above) $224,745Advances, reimbursements, other income, etc.... S2.011Net obligations inciirred . . 172,733
Less than $500,000.
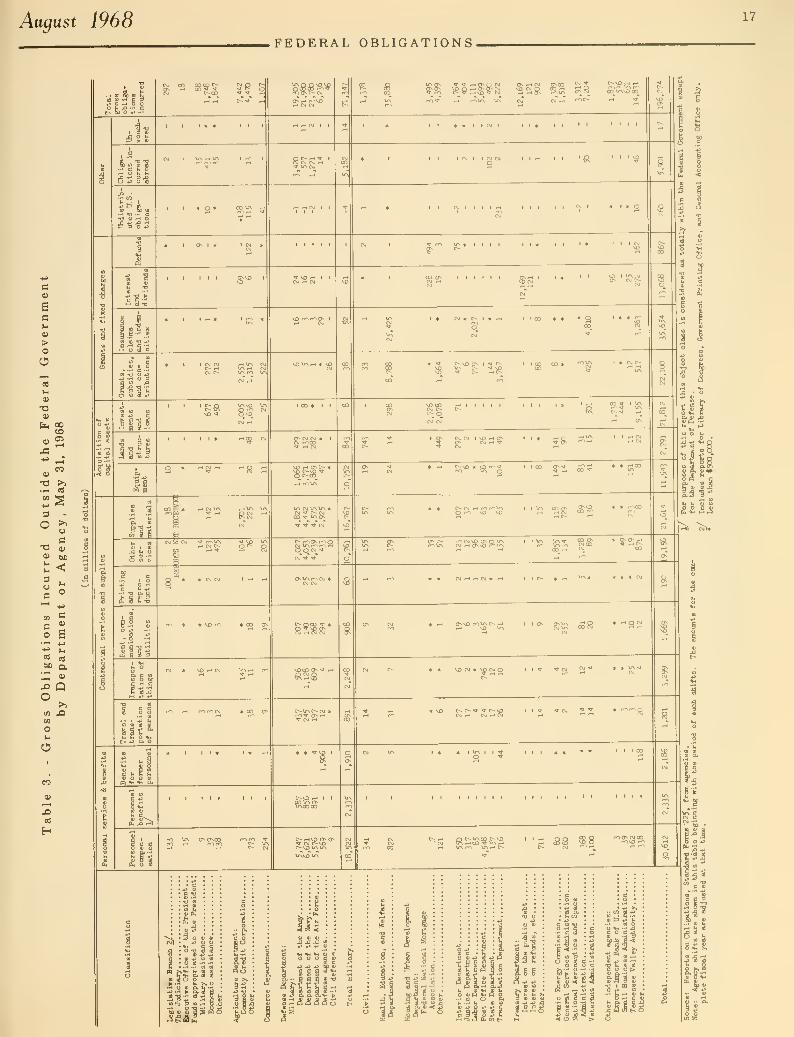
Table 2. - Gross Obligations Incurred Outside the Federal Government by Major Function
and Major Object Class, May 31, 1968
(In millions of dollars)
August 1968FEDERAL OBLIGATIONS.
17
a
ac
>OO
V

18
FEDERAL OBLIGATIONS-.
Treasury Bulletin
c
Scu
>oO
u
August 1968 19
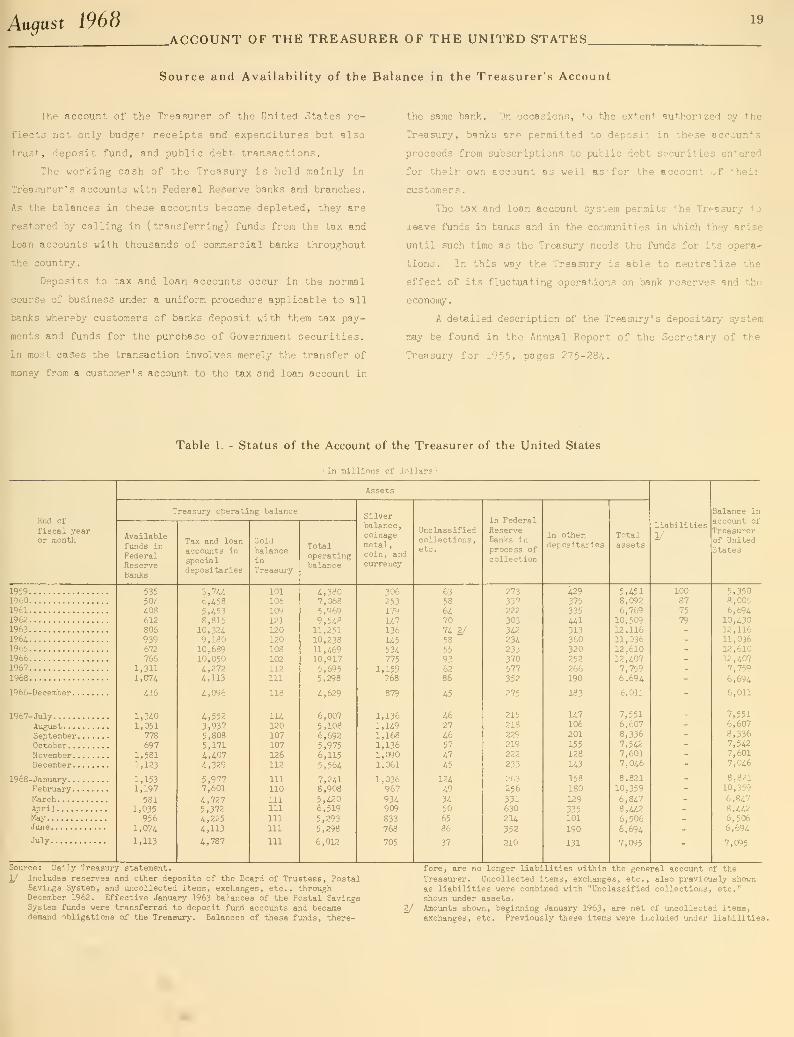
.ACCOUNT OF THE TREASURER OF THE UNITED STATES.
Source and Availability of the Balance in the Treasurer's Account
The account of the Treasurer of the United States re-
flects not only budget receipts and expenditures but also
trust, deposit fund, and public debt transactions.
The working cash of the Treasury is held mainly in
Treasurer's accounts with Federal Reserve banks and branches.
As the balances in these accounts become depleted, they are
restored by calling in ( transferring) funds from the tax and
loan accounts with thousands of commercial banks throughout
the country.
Deposits to tax and loan accounts occur in the normal
course of business under a uniform procedure applicable to all
banks whereby customers of banks deposit with them tax pay-
ments and funds for the purchase of Government securities.
In most cases the transaction involves merely the transfer of
money from a customer's account to the tax and loan account in
the same bank. On occasions, to the extent authorized by the
Treasury, banks are permitted to deposit in these accounts
proceeds from subscriptions to public debt securities entered
for their own account as well as -for the account of theii-
customers.
The tax and loan account system permits the Treasury to
leave funds in banks and in the communities in which they arise
until such time as the Treasury needs the funds for its opera-
tions. In this way the Treasury is able to neutralize the
effect of its fluctuating operations on bank reserves and the
econoiny.
A detailed description of the Treasury's depositary system
may be found in the Annual Report of the Secretary of the
Treasury for 1955, pages 275-28^.
Table 1. - Status of the Account of the Treasurer of the United States
(In millions of dollars)
End of
fiscal yearor month
Treasury operating balance
Availablefiinds in
FederalReserveBariks
Tax and loanaccounts in
specialdepositaries
GoldbalanceinTreasury
Totaloperatingbalance
Silverbalance,coinagemetal,coin, andcurrency
Unclassifiedcollections,etc.
In FederalReserveBanks in
process ofcollection
In other,
depositariesTotalassets
Liabilities
1/
Balance inaccount ofTreasurerof UnitedStates
1959196019611962
19631964196519661967
1968
1966-December.
1967-JuayAugust. . .
.
September
.
October. .
.
November.
.
December.
.
1968-January. .
.
February.
.
MarchAprilMayJune
July.
53550/
i08612806
939672766
1,3111,07-1
il6
l,3i01,051
778
6971,5811,123
1,1531,197
5811,035956
1,074
1,113
3,7446,4585,4538,815
10,3249,18010,68910,0504,2724,113
4,096
4,5523,9375, 80S
5,171
4,4074,329
5,9777,601
4,7275,3724,225
4,113
4,787
101106109121120120108
102112111
118
lU120107107126112
111
110
111111
111
111
111
4,3807,0685,9699,54811,25110,23811,46910,9175,6955,298
4,629
6,0075,1086,692
5,9756,115
5,564
7,2418,9085,4206,519
5,2935,298
6,012
306253179
U7136U5534775
1,159768
87?
1,1361,1491,1681,1361,0901,061
1,036967
934909
833768
705
63
58
6470
74 2/58
55
936286
45
4627
4657
47
45
124
49
3450
65
86
37
273
337222
303342234233370577352
275
215218229219222
233
263256
3316302U352
210
429375
335441313360320252266190
183
U7106201
155128
143
158180
129
335101
190
131
5,4518,0926,769
10,50912,11611,03612,61012,4077,7596,694
6,011
7,5516,6078,3367,5427,6017,046
8,82110,359
6,8478,4426,506
6,694
7,095
10087
75
7)
5,3508,0056,694
10,43012,11611,03612,61012,4077,759
6,694
6,011
7,5516,6078,3367,5427,6017,046
8,82110,359
6,8478,4426,5066,694
7,095
Source: Daily Treasury statement.
1/ Includes reserves and other deposits of the Board of Trustees, PostalSavings System, and uncollected items, exchanges, etc., throughDecember 1962. Effective January 1963 balances of the Postal SavingsSystem funds were transferred to deposit fund accounts and becamedemand obligations of the Treasury. Balances of these funds, there-
2/
fore, are no longer liabilities within the general account of the
Treasurer. Uncollected items, exchanges, etc., also previously shoxmas liabilities were combined with "Unclassified collections, etc."shown under assets.Amounts shown, beginning January 1963, are net of uncollected items,exchanges, etc. Previously these items were included under liabilities.

20
-ACCOUNT OF THE TREASURER OF THE UNITED STATES.Treasury Bulletin
Table 2. - Analysis of Changes in Tax and Loan Account Balances
(In millions of dollars)
Fiscal yearor month
Proceeds from sales of securities 1/
Savingsbondsandsavingsnotes 2/
Retire-mentplan andtax andlossbonds 2/
Taxantici-pationsecurities
Withheld
,
excise,and cor-poration 4/
Income (by
specialarrange-ment) 5j^
Totalcredits
With-drawals End o;'
period
During period
ligh Low Average
19591960196119621963
19U1965196619671968
1967- JulyAugust . . .
.
September.October. .
.
November .
.
December.
.
1968-January. .
.
February.
.
MarchAprilMay
June
July
2.668X , o7Q
2,7872,7252,6992,7602,6352,70i2,7832,673
222
232208
21A213201
272
2^1221
200
230
7,5817,78^7,6135,8982,963
2,3i07,368
7,6i39,538
3,212
2,470
3,853
13,16i7,9201,7883,7743,8302,0U
1,6271,1739,576
2,369
3,131
29,19033,05934,51137,51941,26743,58042,47548,47870,52490,791
5,5036,111^'
, 164
5,2045,8919,278
7,367
11,605
8,299
5,9196,0539,1426,5216,8359,92112,59814,5229,257
58,52057,49655,84256,43857,59558,27760,05074,69991,382
112,583
9,5818 712
^^3728,6306,1049,479
8,40410,97010,188
8,60910,722
11,812
12,383
62,99454,78256,34753,07656,08559,42158,54075,33897,160
112,741
9,3009,3287,5019,2676,8689,557
6,7579,34513,061
7,96411,869
11,924
11,709
3,7U6,4585,4538,815
10,3249,18010,68910,0504,272
4,113
4,5523,9375,8085,1714,4074,329
5,9777,6014,7275,372
4,2254,113
4,787
8,0556,4587,6538,889
10,32410,25710,87211,2749,9798,004.
5,8974,2306,3166,6704,7115,542
5,9778,0047,342
5,372
5,966
6,975
6,401
912
1,3901,161
1,5312,5351,5771,844447710
1,029
2,3601,7291,5282,8963,4791,266
1,6113,2123,3051,029
4,225
1,886
1,551
3,6334,1034,1514,4575,3254,7475,4314,3243,775
4,191
4,6913,1913,5815,4184,2223,368
3,8165,6364,7552,7665,146
3,697
4,486
Source: Office of Fiscal Assistant Secretary; figures are on basis of
telegraphic reports.
1/ Special depositaries are permitted to make payment in the form of adeposit credit for the purchase price of U.S. Government securitiespurchased by them for their own account, or for the accoiint of theircustomers who enter subscriptions through them, when this method ofpayment is permitted under the terms of the circulars inviting sub-scriptions to the issues.
2/ United States savings notes first offered for sale as of May 1, 1967.
2/ Retirement plan bonds first offered for sale as of January 1, 1963;
tax and loss bonds first issued in March 1968.2^/ Taxes eligible for credit consist of those deposited by taxpayers in
the depositary banks, as follows: Withheld income taxes beginning
March 1948; taxes on employers and employees under the Federal Insur-ance Contributions Act beginning January 1950, and under the RailroadRetirement Tax Act beginning July 1951; a number of excise taxesbeginning July 1953; estimated corporation income taxes beginningApril 1967; and to all corporation income taxes due on or afterMarch 15, 1968.Under a special procedure begun in March 1951, authorization was givenduring certain periods for income tax payments, or a portion of them,made by checks of $10,000 or more drawn on a special depositary bank,to be credited to the tax and loan account in that bank. This procedurewas discontinued in April 1967.Less than $500,000.

August 1968 21
.ACCOUNT OF THE TREASURER OF THE UNITED STATES
Table 3. - Summary of Cash Transactions through the Account of the Treasurer
of the United States
(In millions of dollars)
Fiscal yearor month
Net cash transactions other than borri-'wint.'
Deposits and withdrawals (budgetand other accounts)
Cashdepo::it5'
Cash with-drawals 1/
Excess of deposits,or withdrawals (-)
Clearingaccounts
2/
Total nettransactions
Plus: Net cash borrow-ing, or repayment of
borrowing (-)
Equals : Treasurer '
s
account balance, in-crease, or decrease (-)
19 ^9
1960196119621963
1964196;1966196?1968
1967- JulyAugust. . .
.
September.October. .
.
November .
.
December.
.
IS68-January. .
.
February.
.
MarchAprilMayJune
July
^1,61?
loj.giilU,45i121, 56i
125,464141,CK-5
163,036165,086
10,23213,23814,7879,45912,23212,130
13,284
l':,7i'
13,79614,103
19,597
1 3,'"'12
93,73693,81797,774112,188118,477124,047126,395U2,191164,591184,581
13,87318,41113,19716,08516,52912,289
14,558
17,51615,001
14,61418,46614,042
17,686
-12,124
1,044-877
-6,278-4,023-2,485
-931-1,095-1,555
-19,495
-3,641-5,122
1,590-6,627-4,248
-159
-1,274
-3,133-2,255
4,182-4,363
5,555
-3,784
-30i,
309-510
1,25''
1,03'-
-1,491-584
-1,075654
-2,095
-1,930993-397
493183
-581
-284
785
313-594-94
-932
725
-12,430
1,353-1,387-5,018-2,984-3,975-1,515-2,171
-901
-21,590
-5,621-4,129
1,193-6,134-4,065
-740
-1,558
-2,348-1,942
3,589-4,457
4,623
-3,060
8,032
1,30176
8,7554,6702,8953,0891,968
-3,74720,525
5,4133,186
5365,3404,124
185
3,3333,886
-1,570-1,9942,521
-4,435
3,461
-4,399
2,654-1,3113,7361,686
-1,0801,575-203
-4,648-1,065
-208-9441,729-794
59
-555
1,775
1,539-3,512
1,595-1,936
188
401
Source: Actual figures are based on the daily Treasury statement. Figxiresin the first four columns of this table may differ somewhat from thoseoriginally publisheti in the daily Treasury statement because of sub-sequent reclassification of certain transactions.
X/ Beginning with the February 1963 Bulletin, figures have been revised,as shown in daily Treasury statements beginning January 2, 1963, toexclude transactions of clearing accounts.
2/ Previously included \jnder cash withdrawals. See footnote 1.
Table 4. - Gold Assets and Liabilities of the Treasury
(In millions of dollars)
End of calendar year or month Gold assets 1/
Liabilities:Gold certificates
,
etc. 2,/
Balance of gold in

22
.MONETARY STATISTICS,
Treasury Bulletin
Table 1. - Money in Circulation
August 1968DEBT OUTSTANDING
23
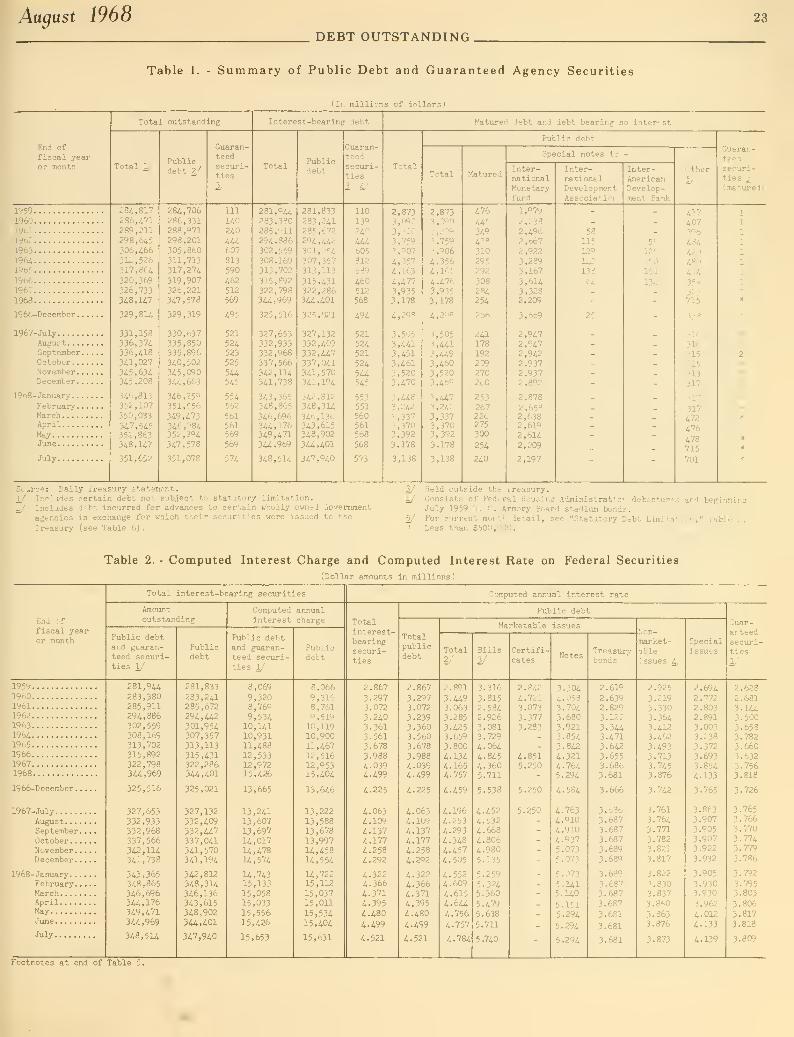
Table 1. - Summary of Public Debt and Guaranteed Agency Securities
(In millions of dollars)
End offiscal yearor month
Total outstanding
Total 1/Publicdebt Z^
Guaran-teedsecuri-ties1/'
Interest-bearing debt
Publicdebt
Guaran-teedsecuri-ties
1/4/
Matijred debt and debt bearing no interest
Public debt
Special notes to
Inter-nationalMonetaryfund
Inter-nationalDevelopmentAssociation
Inter-AmericanDevelop-ment Bank
Other
i/'
Guaran-teedsecuri-ties 2/^
(matured)
1959
196019611962
1963
196i1965
19661967
1968
1966-Deceraber .
.
1967-JulyAugust. . .
.
September.October. .
.
November .
.
December.
.
1968-January..
.
February.
.
MarchAprilMayJune
July
iS.i,817
286,471289,211298, 6i5306,466312,526317,854
320,369326,733348,147
329,814
331,158336,374336,418341,027345,634345,208
346,813352,107350,033347,545352,863348,147
351,652
284,706286,331288,971298,201305,860311,713317,274
319,907326,221347,578
329,319
330,637335,850335,896340,502345,090344,663
346,259351,556349,473346,984352,294347,578
351,078
111
140240
444607
813590
462512569
495
521524
523525
544545
554552
561561569
569
574
281,944283,380285,911294,886302,559308,169313,702
315,892322,7983U,969
325,516
327,653332,933332,968337,566342,114341,738
343,365348,865
346,6963U,176349,471344,969
348,514
281,833283,241285,672294,442301,954307,357313,113
315,431322,286344,401
325,021
327,132332,409332,U7337,041341,570341,194
342,312348,314
346,136343,615348,902344,401
347,940
110
139
240
444605812589460'
512568
494
521524521524
544545
553551560561568568
573
2,8733,0903,3003,7593,907
4,3574,163
4,4773,9353,178
4,298
3,5053,4a3,4513,4613,5203,470
3,4483,242
3,3373,3703,3923.178
3,138
2,8733,0903,2993,7593,9064,3564,161
4,4763,9353,178
4,298
3,5053,4413,U93,4603,5203,469
3,U73,242
3,3373,3703,3923,178
3,138
476
445349438310295292
308284254
?.bh
241178
192209270260
253267226275300
254
240
1,979
2,2382,4962,6672,9223,2893,167
3,6143,3282,209
3,669
2,9472,9472,9422,9372,9372,892
2,878
2,6582,6382,6192,6142,209
2,197
58
115
129
142133
64
25
55
125
150
150
132
417407396
434420480414
359123
715
333
31631o
315
n5313
317
31"
317472
476
478715
701
• Source: Daily Treasury statement. 3/1/ Includes certain debt not subject to statutory limitatio.n. ^
Includes debt incurred for advances to certain wholly owned Government
agencies in exchange for which their securities were issued to the 5/Treasury (see Table 6)
.
*
Held outside the Treasury.Consists of Federal Housing Administration debentures and beginningJuly 1959 D. C. Armory Board stadium bonds.For current month detail, see "Statutory Debt Limitation," Table 2.Less than $500,000.
Table 2. - Computed Interest Charge and Computed Interest Rate on Federal Securities
(Dollar amounts in millions)
End of
fiscal yearor month
Total interest-bearing securities
Amountoutstanding
Public debtand guaran-teed securi-ties 1/
Publicdebt
Computed annualinterest charge
Public debtand guaran-teed securi-ties 1/
Publicdebt
Computed annual interest rate
Totalinterest-bearingsecuri-ties
Public debt
Totalpublicdebt
Marketable issues
Total2/
Bills
2/
Certifi-
catesTreasurybonds
Non-market-ableissues 4/
Specialissues
Guar-anteedsecuri-ties
1/
1959196019611962
196319641965196619671968
1966-December.
.
1967-JulyAugust. . .
.
September
.
October. .
.
November.
.
December.
.
1968-January—February.
.
MarchAprilMayJune
July
281,944283,380285,911294,886302,559308,169313,702315,892322,798344,969
325,516
327,653332,933332,968337,566342,114341,738
343,365348,865346,696344,176349,4713U,969
348,514
281,833
283,241285,672294,442301,954307,357313,113315,431322,286344,401
325,021
327,132332,409332,447337,0413a, 570341,194
342,812348,3U346,136343,615348,902
3U,401
347,940
8,00''
9,3208,7699,53410,14110,93111,48812,53312,972: 5,426
13,665
13,24113,60713,69714,01714,478U,574
U,74315,13315,05815,03315,55615,426
15,653
8,066
9,3168,7619,51910,11910,90011,46712,51612,95315,404
13,646
13,22213,58813,67813,997U,458U,554
14,72215,112
15,03715,011
15,53415,404
15,631
2.867
3.2973.0723.2403.3613.5613.6783.9884.0394.499
4.225
4.0634.1094.1374.1774.2584.292
4.3224.3654.3714.3954.480
4.499
4.521
2.867
3.2973.0723.2393.3603.5503.6783.9884.0394.499
4.225
4.0634.1094.1374.1774.2584.292
4.3224.3664.3714,3954.480
4.499
4.521
2.891
3.4493.0633.285
3.4253.5593.8004.1344.1654.757
4.459
4-1964.2534.2934.3484.4574.505
4-5524.6094.6154.644
4.756
4.757
4.784
3. 316
3.8152.5842.9263.0813.7294.0544-8454-3505-711
5.538
4.4524.5324.6684.8064.9805.135
5.2595.3245.360
5.479
5.638
5.711
5.740
2.842
4.7213.0733.3773.283
4.8515.250
5.250
5.250
3.3044.0533.7043.6803.9213.8543.8424.3214.7645.294
4.584
4.7634.9104.9104.9375.0735.073
5.073
5.U15.U05.1515.294
5.294
5.294
2.619
2.6392.8293-1223.3443.4713.6423.6553.6863.681
3.666
3.6863.6873.6873.6873.6893.689
3.689
3.6873-6873.687
3.681
3.681
3.681
2.925
3.2193.3303.3643.4123.4623.4933.7133.7453.876
3.742
3.7613.7643.7713.7823.8213.817
3.822
3.8303.8373.850
3.8633.876
3.873
2.6942.7722.8032.8913.0033.2383.3723.6933.8544.133
3.765
3.8633.9073.9053.9073.922
3.932
3.905
3.9303.930
3.962
4.0124.133
4.139
2.628
2.6813.1443.5003.6583.7823.6603.6323.7563.818
3.726
3.7653.7663.7703.7743.779
3.786
3.792
3.7953.803
3.8063.8173.818
3. 809
Footnotes at end of Table 5.

24
DEBT OUTSTANDING,Treasury Bulletin
Table 3. - Interest-Bearing Public Debt
(in millions of dollars)
End offiscal yearor month
Totalinterest-bearingpublicdebt
Totalpublic
Publ ic issues
I4arketable
TotalCertif-icates
Treasurybonds 2^
onmarketable
Total savingsbonds
Treasurybonds,invest-mentseries
Depos-itarybonds
Foreignseriessecuri-ties 2/
Foreigncurrencyseriessecuri-ties 2/
other
4/
Specialissues
1959196019611962
1963
196/1
1965196619671968
1966-December .
.
1967-July
August. , .
.
September
.
October . .
.
November .
.
December.
.
1968-January. .
.
February.
.
MarchAprilMayJune
July
281,833
283,2il285,672
29i,U2301,954307,357313,113315, i31322,2863U,401
325,021
327,132
332,409332,U7337,041341,570341,194
342,812
348,314346,136343,615348,902344,401
347,940
237,078
238,342240,629249,503257,153
260,729264,463264,311266,131284,874
273,028
270,924274,100274,707279,874284,198283,960
286,882291,072289,425286,658289,746284,874
289,055
178,027
183,845187,148196,072
203,508
206,489208,695209,127210,672226,592
218,025
214,968
218,258218,637223,271226,081226,476
229,285233,273231,651228,718231,761226,592
230,977
32,017
33,41536,72342,03647,230
50,74053,66554,92958,53564,440
64,684
62,844
63,34463,74668,85469,45369,870
72,706
72,90571,30068,58969,58764,440
68,858
33,84317,650
13,33813,54722 , lb9
1,6525,610
5,919
5,611
27,314
51,48356,25765,46452,145
67,28452,54950,64949,10871,073
48,271
49,119
57,54957,55357,10461,36061,362'
61,36566,71966,72766,53471,07071,073
71,075
84,85381,29780,83075,025
81,96488,464102,481101,89797,41891,079
99,151
97,39497,36497,33897,31395,26895,244
95,21493,64993,62393,59691,10491,079
59,050
54,49753,48153,43153,645
54,24055,76855,18355,45958,282
55,003
55,955
55,84256,07056,60358,118
57,484
57,59757,79957,77457,93957,98558,282
91.044 58,078
50,503
47,54447,5U47,607
48,31449,29950,04350,53751,21351,712
50,752
51,32351,37651,41351,51051,58851,581
51,58951,62951,64251,64851,69351,712
51.732
8,3656,7835,8304,727
3,921
3,5463,2562,6922,5892,516
2,656
2,5772,5712,5682,5602,5592,555
2,5532,5522,5452,5272,5172,516
2,514
183170
117138
103
103
59
444530
45
46
4646
444444
31
3131
31
3130
30
860
648
3921,132817624
2,001
593
894742923
1,2262,5871,944
1,8521,9951,8441,8761,8662,001
1,582
75
630832
1,137957890
1,740
860
1,016
1,0151,015
1,1391,2001,200
1,3901,3901,4901,6151,6151,740
1,931
19
25
29
68
14113797282
96
100
92104
123
141160
182201221242
263282
289
44,756
44,89945,04344,93944,80146,62748,65051,12056,15559,526
51,993
56,209
58,30957,73957,16757,37257,234
55,93057,24256,71156,957
59,15659,526
58,885
Source: Daily Treasury statement.
1/ Includes $50 million of Panama Canal bonds for fiscal years 1959-60.
2/ Consists of certificates of indebtedness. Treasury notes beginning
January 1963, and Treasury bonds beginning September 1964, sold to
foreign governments for U. 3. dollars.
2/ Consists of the dollar equivalent of Treasury certificates of indebted-
ness ; Treasury bonds beginning October 19b2 ; and Treasury notes beginning
November 1966 issued and payable in designated foreign currencies.
V Includes Treasury bonds. Rural Electrification Administration series
beginning July 1960; retirement plan bonds beginning January 1963;
Treasury certificates beginning June 1963; Treasury bonds beginning
January 1964; and U. S. savings notes beginning May 1967.
Table 4. - Maturity Distribution and Average Length of Marketable Interest-Bearing Public Debt 1/
(In millions of dollars)
End of
fiscal yearor month
Amountoutstanding
Maturity classes
Within1 year
1 - 5
years5 - 10years
10 - 20years
20 yearsand over
Average
August 1968DEBT OUTSTANDING.
25
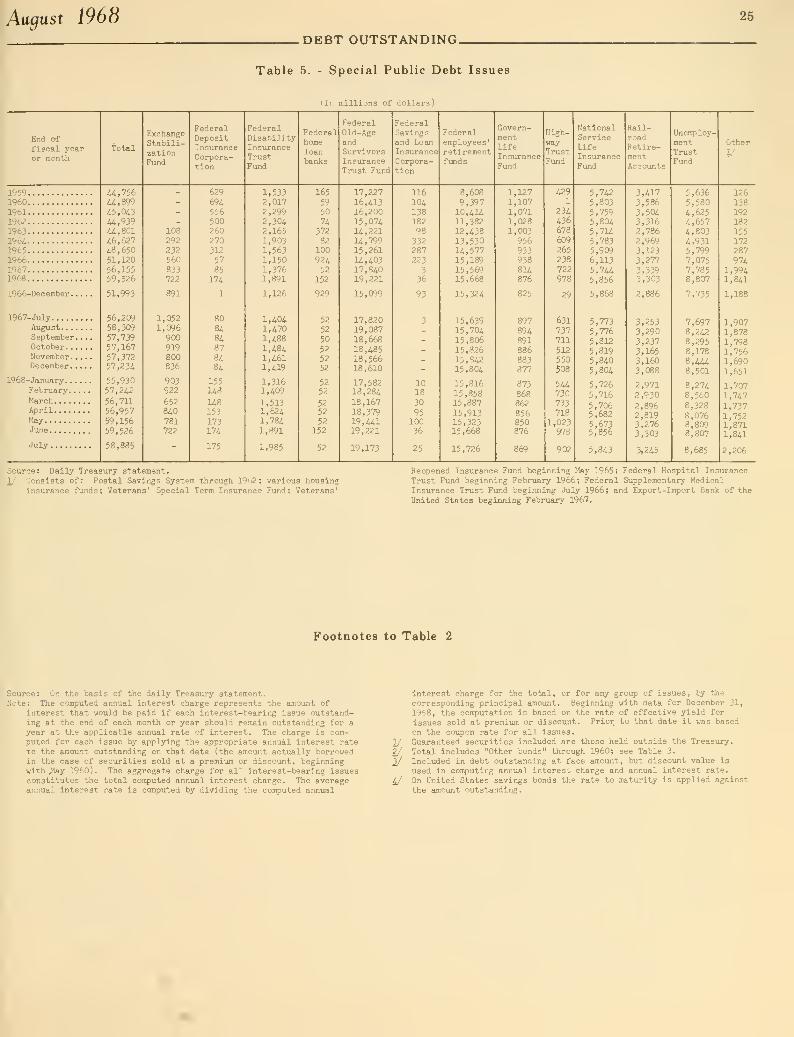
Table 5. - Special Public Debt Issues
Un millions of dollars)
End offiscal yearor month
ExchangeStabili-zationFund
FederalDepositInsuranceCorpora-tion
FederalDisabilityInsuranceTrustFund
Federalhomeloanbanks
FederalOld-AgeandSurvivorsInsuranceTrust Fund
FederalSavingsand LoanInsuranceCorporation
Federalemployees'retirementfunds
Govern-mentLifeInsuranceFund
High-wayTrustFund
NationalServiceLifeInsuranceFund
Rail-roadRetire-mentAccounts
Unen5>loy-
mentTrustFund
Other
1/
1959196019611962
196319641965196619671968
1966-Deceraber .
.
1967-JulyAugust. . ,
.
September.October. .
.
November.
.
December.
.
1968-January. .
.
February.
.
MarchAprilMayJune
July
,756,899
,0i3
,939,801
,627650
,120
,155,526
993
56,20958,30957,73957,16757,37257,23a
55,930
57,2i256,71156,95759,15659,526
58,885
108292232560
833722
891
1,0521,096900919800836
903922
6528^0781722
6296945565002602703125785
174
80
84
8487
8484
155148
148153
173174
175
1,5332,0172,2992,3042,1651,9031,5631,1501,3761,891
1,126
1,4041,4701,488
1,4841,4611,419
1,3161,409
1,5131,6241,784
1,891
1,985
165
59
50
7437282
10092452
152
929
52
52
50
52
5252
5252
5252
52
152
52
17,22716,41316,20015,074U,221U,79915,261U,40317,84019,221
15,099
17,82019,08718,66818,48518,56618,610
17,58218,28418,16718,37919,44119,221
19,173
116104
13818298332287223
36
93
1018
3095
10036
25
8,608
9,39710,41411,38212,43813,530U,57715,18915,56915,668
15,324
15,63915,70415,80615,82615,84215,804
15,81615,85815,88715,91315,32315,668
15,726
1,1271,107
1,0711,0281,003956933938814876
825
897894891886883877
873
868862
856850876
4291
234436678609265238
722978
29
631737711512
550508
544730733718
1,023978
902
5,7425,8035,7595,8045,7U5,7835,9096,1135,7445,856
5,868
5,7735,7765,8125,8195,8405,804
5,7265,716
5,7065,682
5,6735,856
5,843
3,a73,5863,5043,3162,7862,9693,1233,277
3,3393,303
2,886
3,2533,2903,2373,1653,1603,088
2,9712,930
2,8962,8193,2763,303
3,245
5,6365,5804,6254,6574,8034,9315,7997,0757,7858,807
7,735
7,6978,2428,2958,178
8,4U8,501
8,2748,5608,3288,0768,8098,807
8,685
126
138192182
155172287974
1,9941,8a
1,188
1,9071,8781,7981,7561,6901,651
1,7071,7471,7371,7521,8711,841
2,206
Source: Daily Treasury statement.
1/ Consists of: Postal Savings System through 1962: various housinginsurance fiinds; Veterans' Special Term Insurance Fund; Veterans'
Reopened Insilrance Fund beginning May 1965; Federal Hospital InsuranceTrust Fund beginning February 1966; Federal Supplementary MedicalInsurance Trust Fund beginning July 1966; and Export-Import Bank of the
United States beginning February 1967.
Footnotes to Table 2
Source: On the basis of the daily Treasury statement.Note: The computed annual interest charge represents the ainount of
interest that would be paid if each interest-bearing issue outstand-ing at the end of each month or year should remain outstanding for ayear at the applicable annual rate of interest. The charge is com-puted for each issue by applying the appropriate annual interest rateto the ainount outstanding on that date (the ainount actually borrowedin the case of securities sold at a premium or discount, beginningwith .May I960). The aggregate charge for all interest-bearing issuesconstitutes the total computed annual interest charge. The averageannual interest rate is computed by dividing the computed annual
interest charge for the total, or for any group of issues, by the
corresponding principal amount. Beginning with data for December 31,
1958, the computation is based on the rate of effective yield for
issues sold at premium or discount. Prior to that date it was based
on the coupon rate for all issues.
1/ Guaranteed securities included are those held outside the Treasury.
2/ Total includes "Other bonds" through 1960; see Table 3.
^ Included in debt outstanding at face amount, but discount value is
used in computing annual interest charge and annual interest rate.
4/ On United States savings bonds the rate to maturity is applied against
the amount outstanding.
26
DEBT OUTSTANDINGTreasury Bulletin
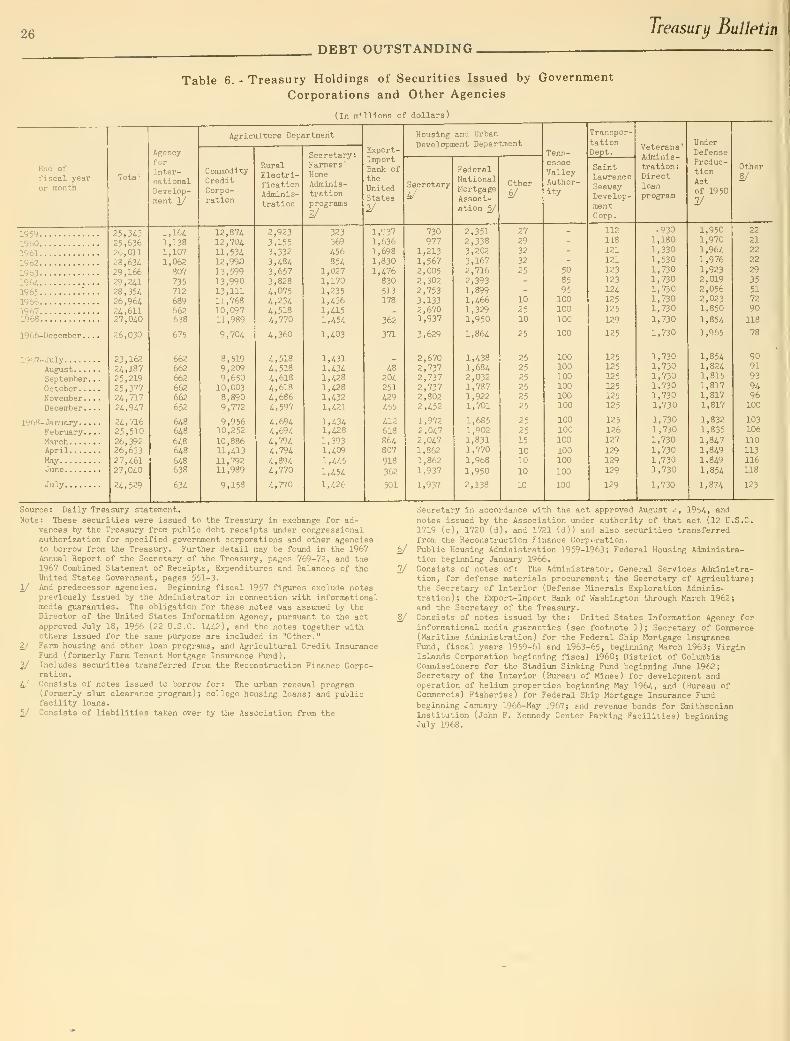
Table 6. - Treasury Holdings of Securities Issued by Government
Corporations and Other Agencies
(In millions of dollars)
Knd of
fiscal year
or month
195919bO19611962
1963
196A1965 "196619671968
1966-Deceraber.
.
1967-JulyAugust. . .
.
September
,
October. .
.
November.
.
December.
.
1968-January . .
.
February.
.
MarchAprilMayJune
July
25,34325,6362d, Oil
28,63-1
29,16629,2il
28,35i26,96424,61127,040
26,030
23,16224,18725,21925,37724,71724,947
24, 716
25,51026,39226,633
27,46127,040
24, 529
AgencyforInter-nationalLievelop-
ment 1/
1,1641,1381,1071,062
807
735712
689662638
675
662662662662
662
652
648648
648648
648638
634
Agriculture Department
CommodityCreditCorpo-ration
12,87412,70411,53412,99J3
13,59913,99013,11111,76810,09711,989
9,704
8,5199,2099,65010,0038,8909,772
9,95610,252
10,88611,413
11,79211,989
9,153
RuralElectri-ficationAdminis-tration
2,9233,1553,3323,4843,6573,8284,0754,2344,5184,770
4,360
4,5184,5184,6184,6184,6864,597
4,6944,6944,7944,794
4,8944,770
4,770
Secretary:Farmers
'
HomeAdminis-trationprograms
2/
323369
456854
1,0271,1701,2351,4361,4151,454
1,403
1,4311,4341,4281,4281,4321,421
1,4341,428
1,3931,409
1,U51,454
l,42t.
Export-ImportBank oftheUnitedStates
2/
1,9371,6361,^81,8301,476830513178
362
371
48204251429
455
412618864807
918
362
501
Housing and Urban
Development Department
Secretary
730977
1,2131,5672,0052,3022,7533,1332,6701,937
3,629
2,6702,7372,7372,7372,8022,452
1,972
2,0i72,0471,862
1,862
1,937
1,937
FederalNationalMortgageAssoci-ation ^
2,3512,3383,2023,1672,7162,3931,8991,4661,3291,950
1,864
1,4381,6842,0321,7871,9221,701
1,6851,9021,8311,770
1,968
1,950
2,138
Other
6/
2729
32
32
25
10
2510
25
25
25
25
2525
25
25
25
15
1010
10
Tenn-esseeValleyAuthor-ity
50
85
95100100
100
100
100100100100100100
100
100100
100100
100
100
Transpor-
tationDept.
SaintLawrenceSeawayDevelop-mentCorp.
112
118121
121
123123
124125
125
129
125
125125
125125
125125
125
126127
129129
129
129
Veterans'Adminis-tration:Directloanprogram
9301,1801,3301,5301,7301,7301,7301,7301,730
1,730
1,730
1,7301,7301,7301,7301,7301,730
1,7301,7301,7301,7301,7301,730
1,730
UnderDefenseProduc-tionActof 1950
2/
1,9501,9701,9641,9761,9232,0192,0562,0231,850
1,854
1,965
1,8541,8241,8151,8171,8171,817
1,832
1,835
1,8471,8491,849
1,854
1,874
Other8/
22
2122
22
29
3551
72
90
118
909193
9496100
103106
110113116118
123
Source: Daily Treasury statement.
Note : These securities were issued to the Treasury in exchange for ad-vances by the Treasury from public debt receipts under congressionalauthorization for specified government corporations and other agenciesto borrow from the Treasury. Further detail may be found in the 1967Annual Report of the Secretary of the Treasury, pages 769-72, and the1967 Combined Statement of Receipts, Expenditures and Balances of theUnited States Government, pages 551-3.
1/ And predecessor agencies. Beginning fiscal 1957 figures exclude notespreviously issued by the Administrator in connection with informationalmedia giiaranties. The obligation for these notes was assumed by theDirector of the United States Information Agency, pursuant to the actapproved July 18, 1956 (22 U.S.C. 1442), and the notes together withothers issued for the same purpose are included in "Other."
2/ Farm housing and other loan programs, and Agricultural Credit InsuranceFund (formerly Farm Tenant Mortgage Insurance Fund).
^ Includes securities transferred from the Reconstruction Finance Corpo-ration.
4/^ Consists of notes issued to borrow for: The urban reneiral program(formerly slum clearance program); college housing loans; and publicfacility loans.
^ Consists of liabilities taken over by the Association from the
Secretary in accordance with the act approved August 2, 1954, and
notes issued by the Association \inder authority of that act (12 U.S.C.1719 (c), 1720 (d), and 1721 (d)) and also securities transferredfrom the Reconstruction Finance Corporation.
6/ Public Housing Administration 1959-1963; Federal Housing Administra-tion beginning January 1966.
7/ Consists of notes of: The Administrator, General Services Administra-tion, for defense materials procurement; the Secretary of Agriculture;the Secretary of Interior (Defense Minerals Exploration Adminis-tration); the Export-Import Bank of Washington through March 1962;and the Secretary of the Treasury.
8/ Consists of notes issued by the: United States Information Agency forinformational media guaranties (see footnote 1); Secretary of Commerce(Maritime Administration) for the Federal Ship Mortgage InsuranceFimd, fiscal years 1959-61 and 1963-65, beginning March 1963; VirginIslands Corporation beginning fiscal 1960; District of ColumbiaCommissioners for the Stadium Sinking Fund beginning June 1962
;
Secretary of the Interior (Bureau of Mines) for development andoperation of helium properties beginning May 1964, and (Bureau ofCommercial Fisheries ) for Federal Ship Mortgage Insiirance Fundbeginning January 1966-May 1967; and revenue bonds for SmithsonianInstitution (John F. Kennedy Center Parking Facilities) beginningJuly 1968.

August 196827
.DEBT OUTSTANDING,
Table 7. - Interest-Bearing Securities Issued by Government Agencies
(l:. millions of dollars)
End offiscal yearor month
iotal
DefenseDepartment
Familyhousingmortgages
Housing and Urban Development Tepartrent
FederalHousingAdministration
Federal National Mortgage Assoc i -^tir'n
ParticipationSales Fund
Secondarymarketoperations
Other
Other indcfpendert agencies
Export-ImportBank of the
UnitedStates
Farm CreditAdministration
Banks for
cooperatives
19591960196119621963
1964196519661967
1968p
1967-June
JulyAugust. . .
.
September.October. .
.
November .
.
December.
.
1968-January. .
.
February.
.
MarchAprilMayJune p. . . .
5,0486,6956,4637,9488,0898,6409,33413,37418,455r
24,407
18,455r
13, 56!^
18,58218,36818,81018,83520,206
21,64021,74122,02723,38423,505r
24.407
1,0451,4971,8532,1512,2342,2472,1812,1092,036r
1,951
2,036r
2,0332,0272,0212,0152,0072,001
1,9951,9881,9821,976l,971r1,951
110
139220
424586793570
441492548
492
501
504503505524525
534531541541549548
3002,1104,8307,900
4,830
4,7954,7954,7954,7954,7655,740
6,9906,9906,9907,9707,9707,900
1,2902,2852,1992,5581,961
1,6991,7973,2694,079
5,887
4,079
4,0704,0503,9274,4334,5434,919
5,0875,1495,4825,6505,6485.887
797797
300520827
1,0221,385-'^,164
2,571
2,164
2,1612,1332,0662,0541,9651,975
1,9671,8421,7001,8551,8872,571
315
3'A387467469525709881
1,072
1,244
1,072
1,102
1,1241,1241,1671,2271,^83
1,2831,3571,3941,3591,3121,2a
28 Treasurij Bulletin
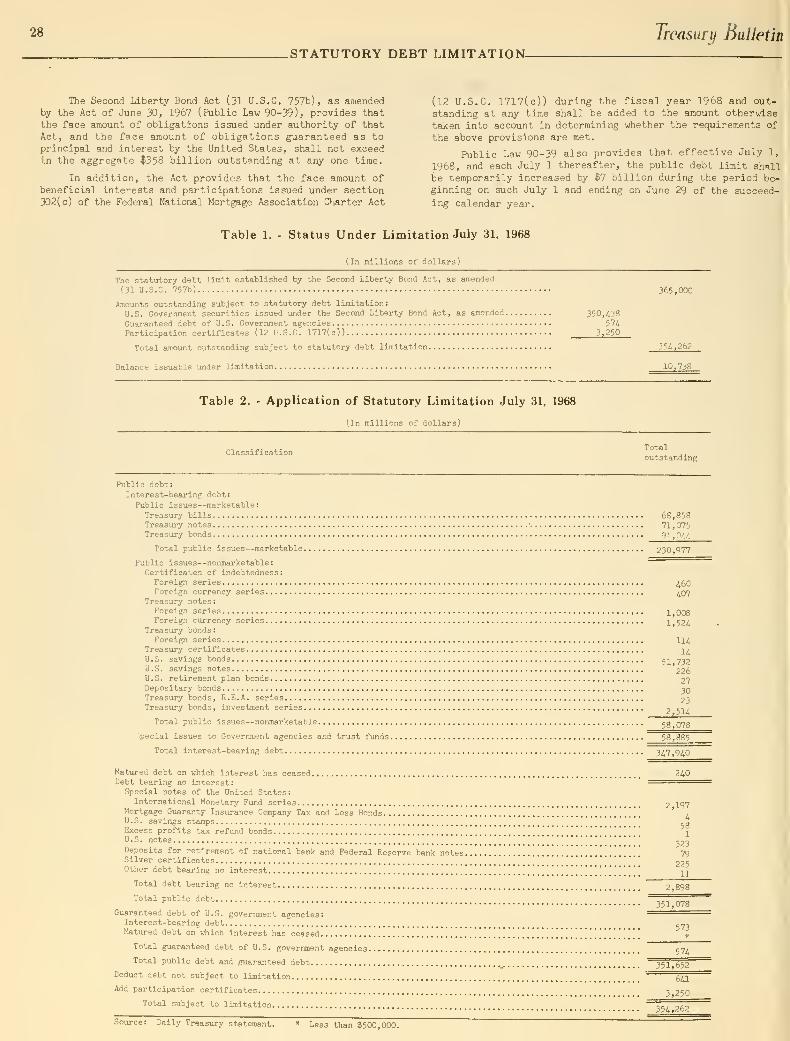
.STATUTORY DEBT LIMITATION-
The Second Liberty Bond Act (31 U.S.C. 757b), as amendedby the Act of June 30, 1967 (Public Law 90-39), provides that
the face amount of obligations Issued under authority of thatAct, and the face amount of obligations guaranteed as toprincipal and interest by the United States, shall not exceedin the aggregate $358 billion outstanding at any one time.
In addition, the Act provides that the face amount ofbeneficial Interests and participations Issued under section302(c) of the Federal National Mortgage Association Charter Act
(12 U.S.C. 1717(c)) during the fiscal year 1968 and out-
standing at any time shall be added to the amount otherwise
taken into account in determining whether the requirements of
the above provisions are met.
Public Law 90-39 also provides that effective July 1,
1968, and each July 1 thereafter, the public debt limit shill
be temporarily increased by #7 billion dxiring the period be-ginning on such July 1 and ending on June 29 of the succeed-ing calendar year.
Table 1. - Status Under Limitation July 31, 1968
(In millions of dollars)
The statutory debt limit established by the Second Liberty Bond Act, as amended
(31 U.S.C. 757b)
Amounts outstanding subject to statutory debt limitation:
U.S. Government securities issued under the Second Liberty Bond Act, as amended.
Guaranteed debt of U.S. Government agenciesParticipation certificates (12 U.S.C. 1717(c))
Total amount outstanding subject to statutory debt limitation
Balance issuable under limitation
350,438574
3,250
365,000
1U,7J8
Table 2. - Application of Statutory Limitation July 31, 1968
(In millions of dollars)
ClassificationTotaloutstanding
Public debt:
Interest-bearing debt:
Public issues—marketable:Treasury bills 68,858Treasury notes 71 , 075Treasury bonds 91,0.V,
Total public issues—marketable 230 ,977
Public issues—nonmarketable
:
'
Certificates of indebtedness:Foreign series ^60Foreign currency series ^07
Treasury notes:Foreign series ^ 008Foreign currency series
2. 524Treasury bonds:Foreign series 114
Treasury certificates]^/
U.S. savings bonds52^ Y^2
U.S. savings notes 226U.S. retirement plan bonds 27Depositary bonds 3qTreasury bonds, R.E.A. series 23Treasury bonds , investment series
2 51 /
Total public issues—nonmarketable eg Qng
Special issues to Government agencies and trust funds 58^885
Total interest-bearing debt 3^7 q^Q
Matured debt on which interest has ceased 240Debt bearing no interest: '
^=Special notes of the United States:
International Monetary Fund series 2 197Mortgage Guaranty Insurance Company Tax and Loss Bonds '
/U.S. savings stamps ............[ KgExcess profits tax refund bonds .1.. ..... ..... . .......... .....[ 1U.S. notes ^2iDeposits for retirement of national bank and Federal Reserve bank notes 79Silver certificates 225Other debt bearing no interest
'
-1
1
Total debt bearing no interest 2 898
Total public debt IsToTs"Giiaranteed debt of U.S. government agencies:
Interest-bearing debt cr^-.
Matured debt on which interest has ceased ^^
Total guaranteed debt of U.S. government agencies .7/
Total public debt and guaranteed debt 351 6?2~
Deduct debt not subject to limitation oO~Add participation certificates
3 250Total subject to limitation
354 262~
Source: Daily Treasury statement. * Less than $500,000.
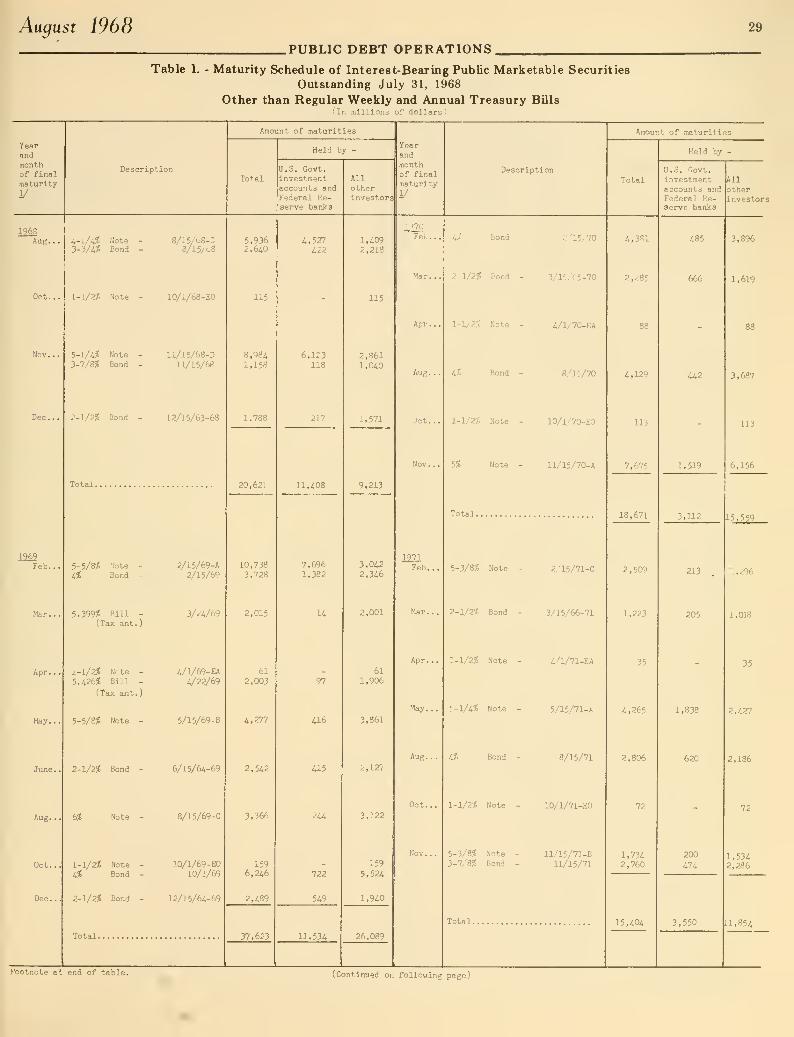
August 1968 29
.PUBLIC DEBT OPERATIONS.Table 1. - Maturity Schedule of Interest-Bearing Public Marketable Securities
Outstanding July 31, 1968
Other than Regular Weekly and Annual Treasury BUls
30 Treasury Bulletin
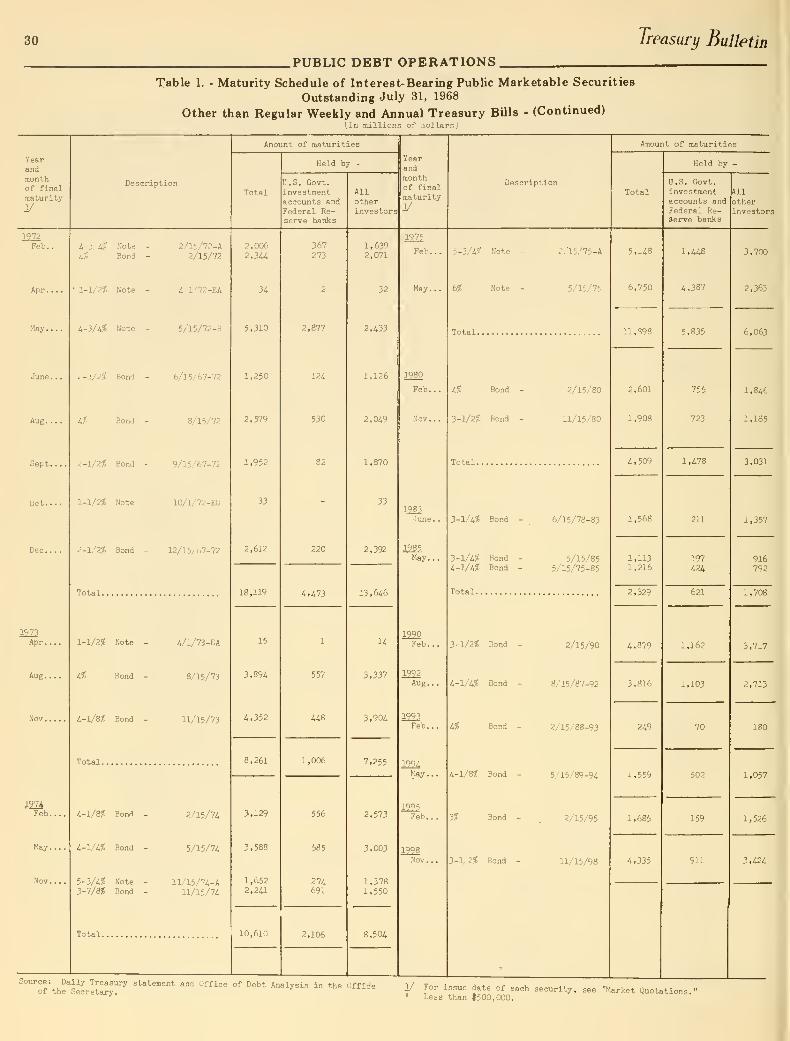
.PUBLIC DEBT OPERATIONS.Table 1. - Maturity Schedule of Interest-Bearing Public Marketable Securities
Outstanding July 31, 1968
Other than Regular Weekly and Annual Treasury Bills • (Continued)(,lii millions of aollars)
August 1968.PUBLIC DEBT OPERATIONS,
31
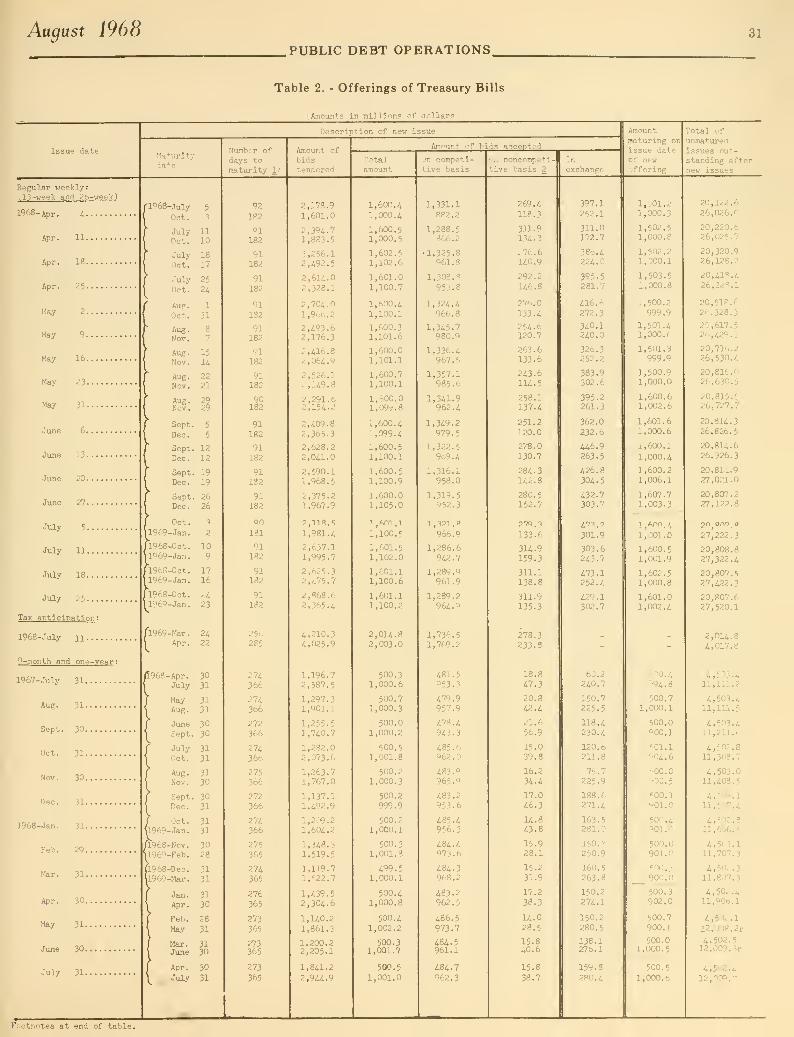
Table 2. - Offerings of Treasury Bills
(Amounts in millions of dollars)
Issue date
Description of new issue
MaturityNumber of
days tomaturity 1/
Amount of
bidstendered
Totalamount
Amount of bids accepted
On competi-tive basis
On noncompeti-l Intive basis 2^' 11 exchange
Amountmaturing on
issue dateof newoffering
Total of
unmaturedissues out-standing afternew issues
Regular weekly
:
(13-week and 26-week)
1968- Apr. 4
Apr. 11
Apr. 18
Apr. 25
May 2
May 9
May 16
May 23
May 31
June 6
June 13
June 20
June 27
July 5
July 11
July 18
July 25
Tax anticipation :
1968-July 11
9-month and one-year :
1967- July 31
Aug. 31
Sept. 30
Oct. 31
Nov. 30
Deo. 31
1968-Jan. 31
Feb. 29
Mar. 31
Apr. 30
May 31
June 30
July 31
•1968-July
Oct.
July 11
Oct. 10
July 18
Oct. 17
July 25
Oct. 2A
Aug.
Oct.
Aug.Nov.
1
31
8
7
Aug . 15
Nov. UAug. 22
Nov. 21
2929
Aug.Nov.
Sept.
Dec.
Sept. 12
Deo. 12
Sept. 19
Dec. 19
Sept. 26
Dec
.
26
2
10
Oct.
1969-Jan.
'l968-0ct.
1°69-Jan. 9
1968-Oct. 171969-Jan. 16
1968-Oct.1969-Jan.
2423
(1969-Mar . 24Apr. 22
l968-Apr. 30July 31
31
31MayAug.
June 30Sept. 30
July 31Oct. 31
Aug. 31Nov. 30
Sept. 30Dec. 31
Oct. 311969-Jan. 31
fi968-Nov. 301969-Feb. 28
fi968-Dec. 31|1969-Mar. 31
Jan. 31
Apr. 30
Feb. 28
May 31
Mar. 31June 30
Apr. 30
July 31
92
1S2
91182
91182
91182
91
182
91182
91182
91182
90182
91182
91182
91182
91182
00
181
91182
91182
91182
256285
274366
274366
272
366
274366
275366
272366
274366
275365
274365
276365
273365
273365
273
365
2,178.91,601.0
2,394.71,883.5
3,256.12,492.5
2,614.02,328.1
2,704.01,966.2
2,493.62,176.3
2,416.82,064.9
2,526.:2,149.8
2,291.62,154-2
2,409.82,365-3
2,628.22,041.0
2,590.11,968.5
2,375-21,967-9
1,981.4
2,637.11,995-7
2,625-32,475.7
2,868.62,365.4
4,210.34,025.9
1,196.72,587.5
1,297.31,901.1
1,255-51,740.7
1,282.02,073.6
1,263.71,767-0
1,137.11,492.9
1,209.21,604.2
1,348.31,519-5
1,119.71,522.7
1,439-52,304-6
1,140.21,861.3
1,200.22,205.1
1,841.2
2,9U.9
1,600.41,000.4
1,600.51,000.5
1,602.51,102.6
1,601.01,100.7
1,600.41,100.1
1,600.31,101.6
1,600.01,101.1
1,600.71,100.1
1,600.01,099-8
1,600.4
1,099.4
1,600.51,100.1
1,600.51,100.9
1,600.01,105.0
1 ,601 .1
1,100.5
1,601.51,102.0
1,601.11,100.6
1,601.11,100.2
2,014.82,003.0
500.31,000.6
500.71,000.3
500.01,000.2
500.51,001.8
500.21,000.3
500.2999.9
500.21,000.1
500.31,001.8
499-51,000.1
500.41,000.8
500.41,002.2
500.31,001.7
500,5
1,001.0
1,331.1882.2
1,288-5866.2
1,325-8961-8
1,308.8953.8
1,324-4966.8
1,345.7980.9
1,336.4967.5
1,357.1985-6
1,341-9962.4
1,349.2979.5
1,322.5969.4
1,316.1958.0
1,319.5952.3
1 ,3?T .8
966.9
1,286.6942.7
1,289.9961.9
1,289.2964.9
1,736.51,769.2
481-5953.3
4V9.9957.9
478.4943.3
485.6962.0
483-9965-9
483-2953-6
485-4956-3
484-4973-6
484-3968.2
483.2962.5
486.5973.7
484.5961.1
484.7
962.3
118.3
311-9134.3
:76-6140.9
292.2
146.8
276.0
133.4
254-6120.7
263.6133-6
243-6lU-5
258-1137-4
251-2120.0
278.0130.7
284-3142-8
280.
5
152.7
27Q.3
133-6
314.9159.3
311.1138.8
311.9135.3
278.3233.8
18.8
47.3
20.842.4
21.656.9
15-039-8
16.2
34-4
17-046-3
14-843-8
15-928-1
15-2
31-9
17-2
38-3
U-028.5
15.840.6
15.8
38.7
397.1
252.1
311.0172.7
386.4224.0
395.5281.7
416.6272.3
340.1240.0
326.3252.2
383.9302.6
395.2261.3
362.0232.6
446.9263-5
426.8304.5
432.7303.7
301.9
303.6243.7
473.1252.4
42^.1302.7
60.2240.7
150.7225.5
118.4230.4
120.6211.8
75.7225.9
188.6271.4
163.5281.0
150.3250.9
160.5263.8
150.2274.1
150.2280.5
138.1276.1
159-8280. i
1,501.21,000.3
1,502.51,000.8
1,502.21,000.1
1,503.51,000.8
1,500.2
999.9
1,501.41,000.6
1,501.3999.9
1,500.91,000.0
1,600.61,002.6
1,601.61,000.6
1,600.1
1,000.4
1,600.21,006-1
1,607-71,003.3
1,600./.
1,001.0
1,600.51,001.9
1,602.51,000.8
1,601.01,002.4
500.4994.8
500.71,000.1
500.0900.1
501.1904.6
500.0903.5
500.1901.0
500.4901.0
500.0901.0
500.3
900.0
500.3902.0
500.7900.1
500.01,000.5
500.5
1,000.6
20,122.626,026.0
20,220.626,025.7
20,320.926,128.2
20,418.426,228.1
20,518.626.328.3
20,617.526,429.3
20,716.226,530.4
20,816.026.630.5
20. 815. -5
26,727.7
20,814.326,826.5
20,814-626,926-3
20,814-927,021-0
20,807.227,122.8
27,222.3
20,808.827,322.4
20,807.527,422.3
20,807.627,520.1
2,014.84,017.8
4,503.411,111.2
4,503.411,111.5
4,503.411,211.6
4,502.811,308.7
4,503.011,408.5
4,503.111,507.4
4,502.811,606.5
4,503.111,707.3
4,502.311,807.3
4,502.411,906.1
4,502.1
l2,008.2r
4,502.512,009. 3r
4,502.412,009.7
Footnotes at end of table.
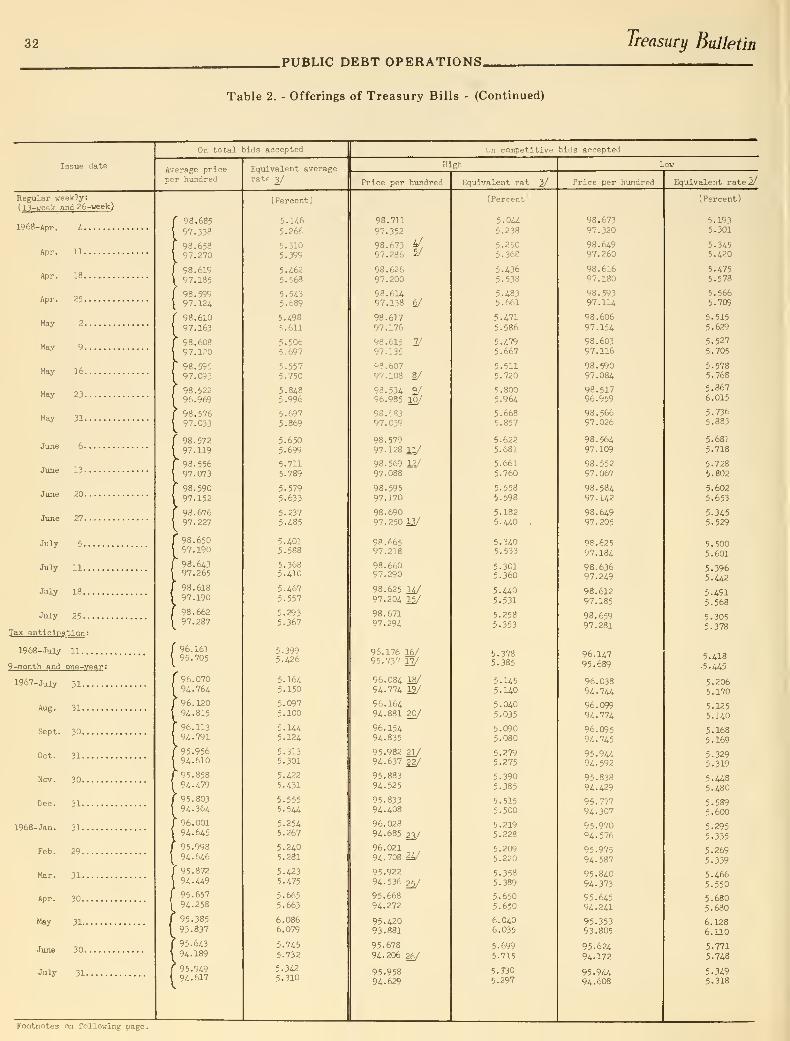
32 Treasury Bulletin
.PUBLIC DEBT OPERATIONS.
Table 2. - Offerings of Treasury Bills - (Continued)
Issue date
Regular weekly:
( n-ueek and26-ueelc )
1968-Apr. A
Apr. 11
Apr. 18
Apr. 25
May 2
May 9
May 16
May 23
May 31
June 6
June 13
June 20
June 27
July 5
July 11
July 18
July 25
Tax anticipation :
1968-July 11
9-it'onth and one-year :
1967-July 31
Aug. 31
Sept. 30
Oct. 31
Nov. 30 ,
Dec. 31
1968-Jan. 31
Feb. 29 ,
Mar. 31
Apr. 30
May 31
June 30
July 31
On total bids accepted jn competitive bids accepted
Average price
per hundred
98.685
97.338
98.65897.270
98.61997.185
98.59997.12i
98.61097.163
98.60897.120
98.59597.093
98.52296.969
98.57697.033
98.57297.119
98.55697.073
98.59097.152
98.67697.227
98.65097.190
98.64397.265
98.61897.190
98.66297.287
96.16195.705
96.070
9i.764
96.120
9i.815
'96.113
94.791
95.95694.610
"95.858
94.479
95.80394.364
96.00194.645
95.99894.646
'
95.87294.449
95.65794.258
95.38593.837
' 95.64394.189
' 95.94994.617
Equivalent averagerate 2/
(Percent)
5.U65.266
5.3105.399
5.4625.568
5.5435.689
5.i985.611
5. 5065.697
.557
,750
5.8485-996
,697
,869
5.6505.699
5.711
5.789
5.5795.633
5.2375.485
5.4015.588
5.3685.410
5.4675.557
5.2935.367
5.3995.426
5.1645.150
5.0975.100
5.1445.124
5.3135.301
5.4225.431
5.5555.5U
5.2545.267
5.2405.281
5.4235.475
,665
,663
6.0866.079
5.745
5.732
5.3425.310
Price per hundred
Footnotes on following page.
4/5/
6/
2/
8/
98.711
97.352
98.67397.286
98.62697.200
98.61497.138
98.61797.176
98.61597.135
98.60797.108
93.534 2/96.985 13/
98.58397.039
98.57997.128 11/
98.569 12/
97.088
98.59597.170
98.69097.250 li/
98.66597.218
98.66097.290
98.625 U/97.204 ly98.67197.294
96.176 16/95.737 17/
96.084 18/94.774 23/
96.16494.881 20/
96.15494.835
95.982 21/94.637 22/
95.88394.525
95.83394. 408
96.02894.685
22,/
96.02194.708 U/95.92294.536 gy95.66894.272
95.42093.881
95.67894.206 26/
95.95894.629
Equivalent rat 2/
(Percent)
5.0445.238
5.2505.368
5.4365.538
5.4835.661
5.i715.586
5.4795.667
5.5115.720
S.3005.964
5.6685.857
5.6225.681
5.661
5.760
5.5585.598
5.1825.440
5.3405.533
5.3015.360
5.4405.531
5.2585.353
5.3785.385
5.U55.140
5.0405.035
5.0905.080
5.2795.275
5.3905.385
5.5155.500
5.2195.228
5.2095.220
5.3585.389
5.6505.6?0
6.0406.035
5.699
5.715
5.?305.297
Low
Price per hundred
98.67397.320
98.64997.260
98.61697.180
98.59397. lU98.606
97.154
98.60397.116
98.59097.084
98.51796.959
98.56697.026
98. 56497.109
98.55297.067
98.58497.142
98.64997.205
98.62597.184
98.63697.249
98.61297.185
98.65997.281
96.14795.689
96.03894.744
96.09994.774
96.09594.745
95.94494.592
95.83894.429
95.77794.307
95.97094.576
95.97594.587
95.84094.373
95.64594.241
95.35393.805
95.62494-172
95.94^94.608
Equivalent rate 1/
(Percent)
5.1935.301
5.3455.420
5-4755.578
5.5665.709
5.5155.629
5.5275.705
5.5785.768
5.8676.015
5.7365.883
5.631
5.718
5.7285.802
5.6025.653
5.3455.529
5.5005.601
5.396
5.U2
5.4915.568
5.3055.378
5.4185.445
5.2065.170
5.125
5.U0
,168
,169
5.3295.319
5.4485. 480
5.5895.600
5.2955.335
5.269
5.339
5.4665.550
5.6805.680
6.1286.110
5.7715.743
5.3495. 318
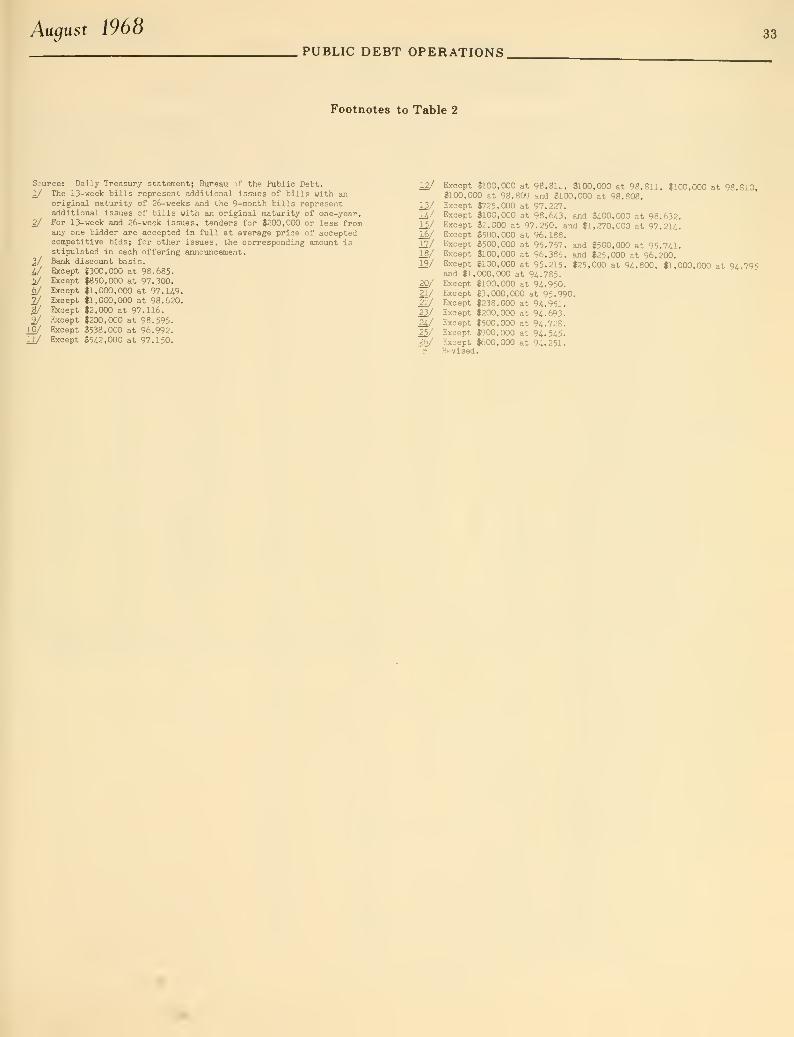
August 1968 33
PUBLIC DEBT OPERATIONS.
Footnotes to Table 2
Source: Daily Treasury statement; Bureau of the Public Debt.
1/ The 13-week bills represent additional issues of bills with anoriginal maturity of 26-weeks and the 9-month bills representadditional issues of bills with an original maturity of one-year.For 13-week and 26-week issues, tenders for $200,000 or less fromany one bidder are accepted in full at average price of acceptedcompetitive bids; for other issues, the corresponding amount isstipulated in each offering announcement.Bank discount basis.Except $300,000 at 98.685.Except $850,000 at 97.300.Except $1,000,000 at 97. U9.Except $1,000,000 at 98.620.Except $2,000 at 97.116.Except $200,000 at 98.595.Except $533,000 at 96.992.Except $5/12,000 at 97.150.
2/
2/
i/6/
2/8/
2/iS/11/
12/ Except $100,000 at 98.812, $100,000 at 98.811, $100,000 at 98.810,$100,000 at 98.809 and $100,000 at 98.808.
12/ Except $725,000 at 97.227.14/ Except $100,000 at 98.6^3, and $^00,000 at 98.632.15/ Except $2,000 at 97.250, and $1,270,000 at 97.214.16/ Except $500,000 at 96.188.17/ Except $500,000 at 95.757, and $500,000 at 95.7/11.18/ Except $100,000 at 96.385, and $25,000 at 96.200.12/ Except $100,000 at 95.215, $25,000 at 94.800, $1,000,000 at 94.795
and $1,000,000 at 94.785.20/ Except $100,000 at 94.950.a/ Except $3,000,000 at 95.990.22/ Except $238,000 at 94.951.23/ Except $200,000 at 94.693.24/ Except $500,000 at 94.728.25/ Except $900,000 at 94.545.26/ Except $600,000 at 94.251.r Revised.
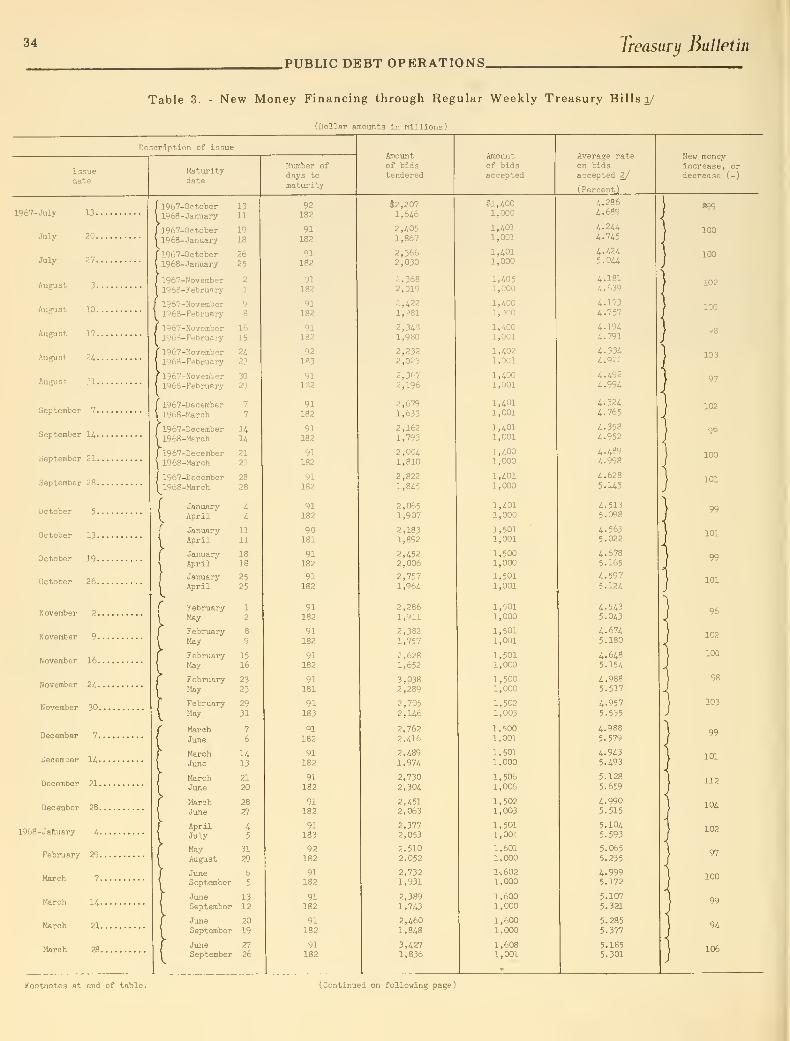
34
.PUBLIC DEBT OPERATIONS.Treasury Bulletin
Table 3. - New Money Financing through Regular Weekly Treasury Bills 1/
{Dollar amounts in millions)
Description of issue
Issuedate
1967-July 13.
July 20.
July 27.
August 3.
August 10.
August 17.
August 2^.
August 31.
September 7.
September li.
September 21.
September 28.
October 5.
October 13.
October 19.
October 26.
November 2.
November 9.
November 16,
November 2<i.
November 30.
December 7.
December 14.
December 21.
December 23.
1968-Jafiuary i.
February 29.
March 7
March 14
March 21
March 28
Maturitydate
1967-October 13
1968-January 11
1967-October1968-January
'1967-Ootober1968-January
' 1967-November1968-February
1967-Noveraber
1968-February
' I'-)(j7-November
1968-February
1967-December1968-March
1967-December1968-March
1967-December1968-March
1967-December1968-March
19
18
2625
2
1
98
1967-November 161'->6S-February 15
2423
1967-November 30
1968-February 29
7
7
14
U21
21
28
28
JanuaryApril
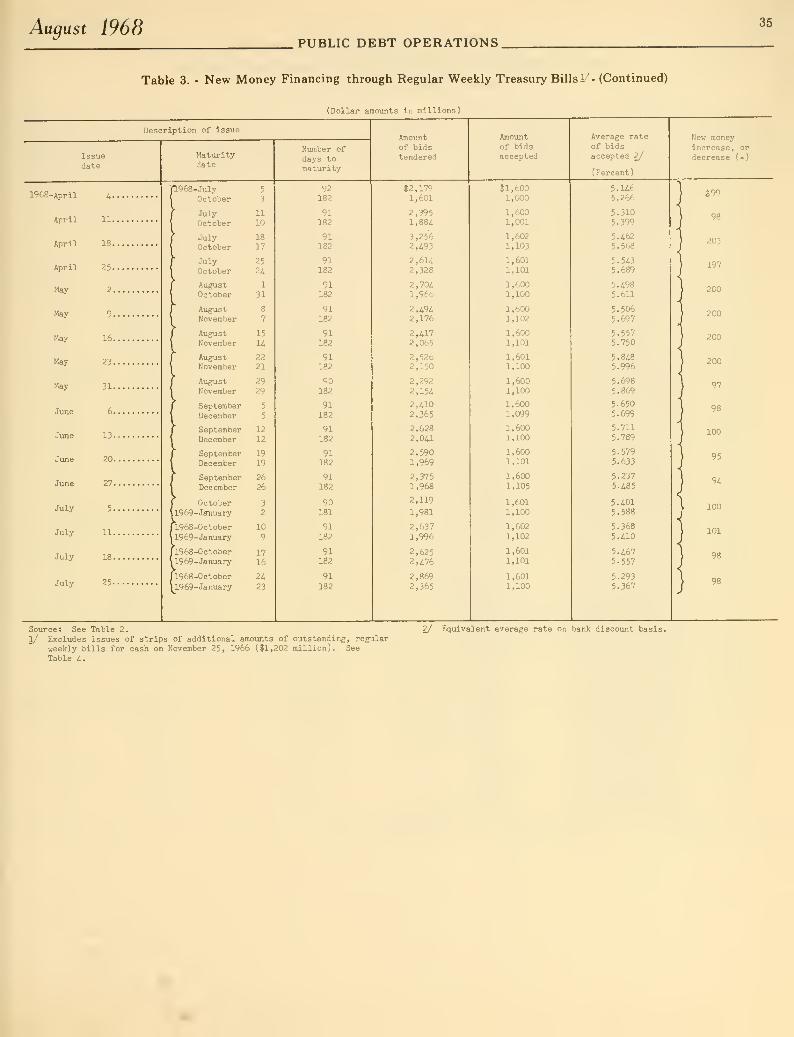
August 1968 35
PUBLIC DEBT OPERATIONS.
Table 3. - New Money Financing through Regular Weekly Treasury Bills i- (Continued)
(Dollar amounts in millions)
Description of issue
Issuedate
1968-April
April
April
April
May-
May
May
May
May
June
June
June
June
July
July
July
July
4.
11.
18.
25.
2,
9.
16,
23.
31.
6
13
20
27
5.
11.
18,
25.
Maturitydate
1968-JulyOctober
JulyOctober
JulyOctober
JulyOctober
AugustOctober
AugustNovember
AugustNovember
AugustNovember
AugustNovember
SeptemberDecember
SeptemberDecember
SeptemberDecember
SeptemberDecember
October
\ 1969-Jffnuary
fi968-October
\1969-January
ri968-0ctober1 1969-January
Il968-October
\1969-Jan\iary
5
3
11
10
18
17
25
2i
1
31
15
U22
21
29
29
5
5
12
12
19
19
26
26
3
2
10
9
1716
23
Number of
days tomaturity
182
91182
91182
91182
91182
91182
91182
91182
90182
91182
91182
91182
91182
90181
91182
91182
91182
Amountof bidstendered
$2,1V91,601
2,3951,884
3,2562,493
2,6142,328
2,7041,966
2,4942,176
2,4172,065
2,5262,150
2,2922,154
2,4102,365
2,6282,041
2,5901,969
2,3751,968
2,119
1,981
2,6371,996
2,6252.476
2,8692,365
Amountof bidsaccepted
Jl,6001,000
1,6001,001
1,6021,103
1,6011,101
1,6001,100
1,6001,102
1,6001,101
1,6011,100
1,6001,100
1,6001,099
1,6001,100
1,6001,101
1,6001,105
1,6011,100
1,6021,102
1,6011,101
1,6011,100
Average rateof bidsaccepted 2/
(Percent)
5.1465.266
5.3105.399
5.4625.568
5.5435.689
5.4985.611
5.5065.697
5.5575.750
5.8485.996
5.6985.869
5.6505.699
5.7115.789
5.5795.633
5.2375.485
5.4015.588
5.3685.410
5.4675-557
5.2935.367
New moneyincrease, or
decrease (-)
J 99
98
203
197
200
200
200
200
97
98
100
95
94
100
101
98
98
Source: See Table 2.
1/ Excludes issues of strips of additional amounts of outstanding, regularweekly bills for cash on November 25, 1966 ($1,202 million). See
Table 4.
2/ Equivalent average rate on bank discount basis.
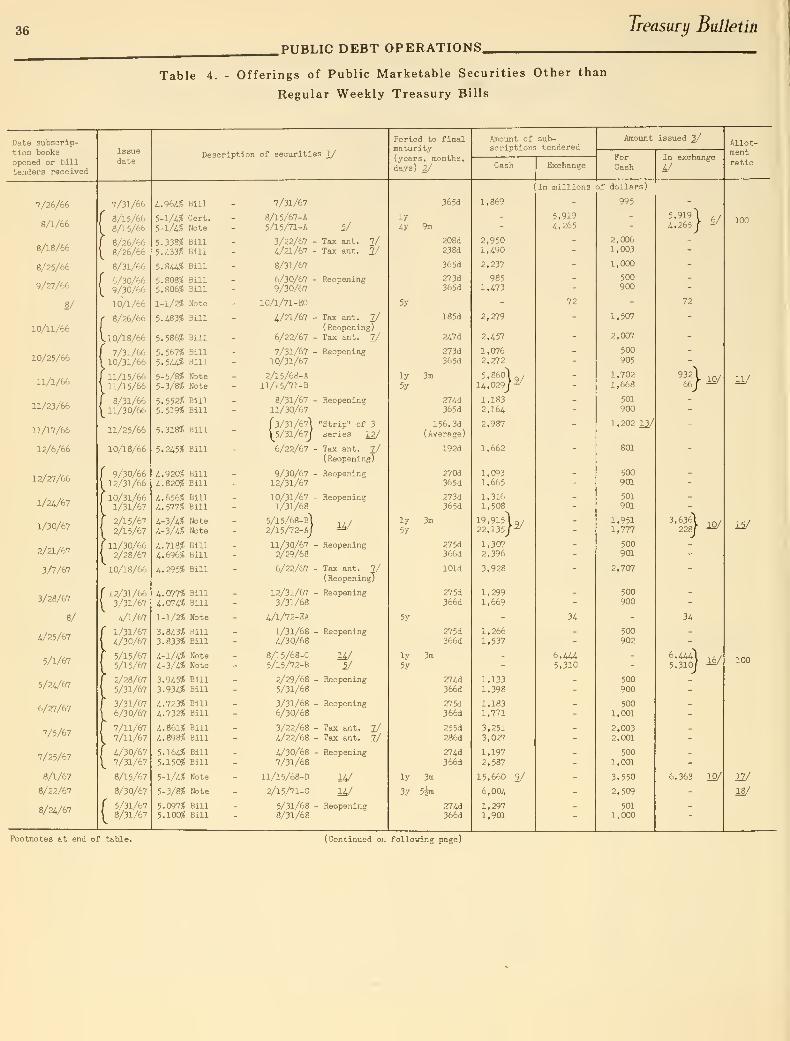
36 Treasury Bulletin
PUBLIC DEBT OPERATIONS.
Table 4. - Offerings of Public Marketable Securities Other than
Regular Weekly Treasury Bills
Date subscrip-
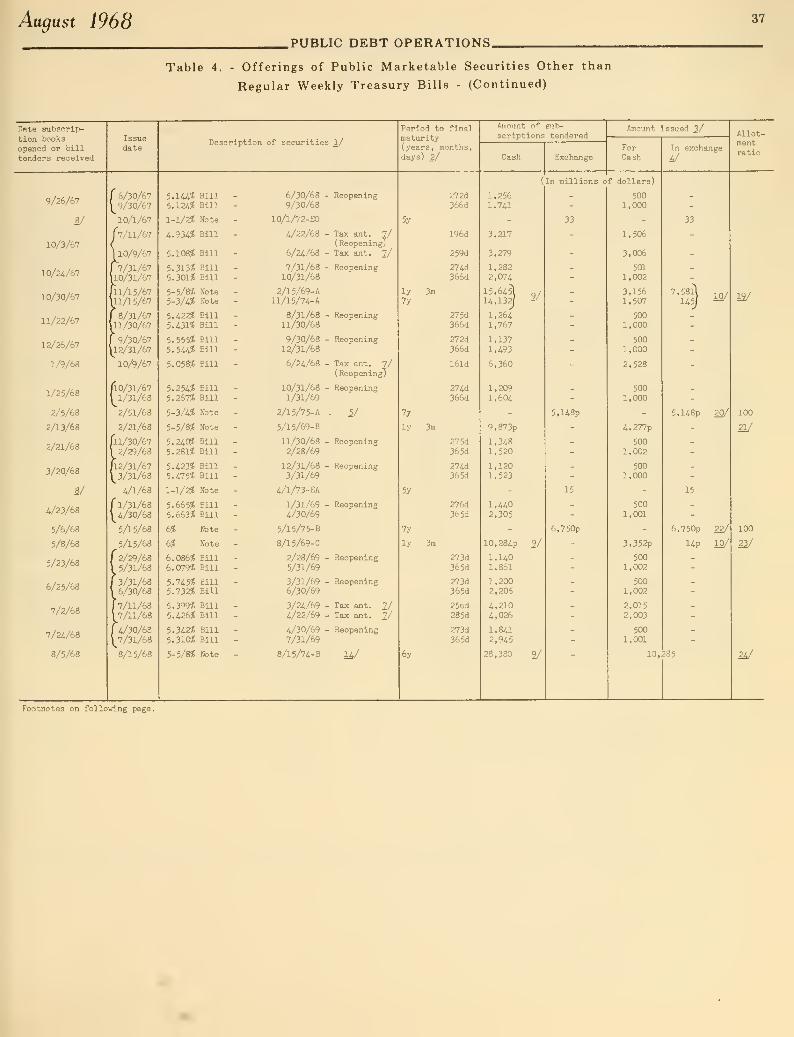
August 1968.PUBLIC DEBT OPERATIONS.
Table 4. - Offerings of Public Marketable Securities Other than
Regular Weekly Treasury Bills - (Continued)
37
Date subscrip-
38
PUBLIC DEBT OPERATIONS.
Treasury Bulletin
Footnotes to Table 4
2/
2/
A/y6/
2/
8/
2/
10/
Source: Bureau of the Public Debt.
1/ Bonds, notes, and certificates of indebtedness issued at par except
those bearing footnote 1^. For bill issues, always sold at auction,
the rate shovm is the equivalent average rate (bank discoiint basis)
on accepted bids. For details of bill offerings, see Table 2.
On September 3, 1963, the Treasury began the monthly issuance of one-
year bills to mature on the last day of each month and, in addition,
on September 30, 1966, it began the monthly issuance of bills to
mature in nine months.
From date of additional issue in case of a reopening.
In reopenings, the amount issued is in addition to the amount of
original offering.
For securities exchanged for the new issues, see Table 8.
For exchange value of securities eligible tcr be exchanged see Table
5 or 6.
Includes $A«'i31 million of the 5-lA% certificates and $1,519 millionof the '^-1/iS notes allotted to Federal Reserve banks and Governmentinvestment accounts.
Tax anticipation bill, acceptable at face value in payment of income
taxes due on the 15th of the month in which the bills mature.Exchange offering available to owners of nonmarketable 2-'i/lS Treasurybonds. Investment Series B-1975-80, dated April 1, 1951- For furtherinformation on the original offering see Treasury Bulletin for April
1951. page A-1. Amounts shown are as of July 31, 1968.
Payment for subscriptions allotted could be made in cash or in Treasurybonds, notes, or certificates of indebtedness maturing on theissue date of the new security.
Consists of allotments paid for with Treasury bonds, notes, or certif-icates of indebtedness maturing on issue date of new security •
Subscriptions from States, political subdivisions or instrumentalitiesthereof, public pension and retirement and other public funds, inter-national organizations in which the United States holds membership,foreign central banks and foreign states, Government investment accountsand the Federal Reserve banks, totaling $9-i3 million for the 5-5/8^notes and $75 million for the 5-3/8% notes, were allotted in full where,as provided in the offering circulars, the subscriber made the requiredcertification of ownership of securities maturing November 15, 1966.Subscriptions subject to allotment totaled $^,918 million for the 5-5/8%notes which were allotted 30 percent, and $13,954- million for the 5-3/8%notes which were allotted 10 percent; subscriptions for $100,000 or lesswere allotted in full, and subscriptions for more than $100,000 wereallotted not less than $100,000.Sale of a "strip" of Treasury bills, consisting of an additional $400million of three series of outstanding one-year Treasury bills maturingMarch 31, April 30, and May 31, 1967.Issued for cash and in exchange for Treasury bills maturing November 25)1966.
Price at which issued appears in either Table 5 or 6.
Subscriptions from States, political subdivisions or instrumentalitiesthereof, public pension and retirement and other public funds, inter-
national organizations in which the United States holds membership,foreign central banks and foreign states. Government investment account.^and the Federal Reserve banks, totaling $3,675 million for the notesof Series B-1968 and tllS million for the notes of Series A-1972, wereallotted in full where, as provided in the offering circulars, thesubscriber made the required certification of ownership of securitiesmaturing Febiuary 15, 1967. Subscriptions subject to allotment totaled
12/
12/
11/
$l6,2/.0 million for the notes of Series b-1968, those up to and includ-
ing $100,000 were allotted in full, all others were allotted 10 percentbut in no case less that $100,000, and $21,887 million for the notesof Series A-1972, those up to and including $50,000 were allotted in
full, all ethers were allotted 7 percent but in no case less than$50,000.
16/ Includes U.,00 million cf the ^-l/^% notes and $2,576 million of the4-3/4-% notes allotted to Federal Reserve banks and Government invest-ment accounts.
17/ Subscriptions from States, political subdivisions. or instrumentalitiesthereof, public pension and retirraent and other public funds, inter-national organizations in which the United States holds membership,foreign central banks and foreign states, Government investment accountsand the Federal Reserve banks, totaling $6,3-^.0 million, were allottedin full where, as provided in the offering circular, the subscribermade the required certification of ownership of securities maturingAugust 15t 1967. Subscriptions subject to allotment totaled $9,320million: those up to and including $100,000 were allotted in full;
all others were allotted 35 percent but in no case less that $100,000.18/ Subscriptions for $100,000 or less were allotted in full. Subscrip-
tions for more than $100,000 were allotted 38 percent but in no caseless than $100,000.
12/ Subscriptions from States, political subdivisions or instrumentalitiesthereof, public pension and retirement and other public funds, inter-
national organizations in which the United States holds membership,
foreign central banks and foreign states. Government investment accountsand the Federal Reserve banks, totaling $7,575 million for the notesof Series A-1969 and $14-9 million for the notes of Series A-1974, wereallotted in full where, as provided in the offering circulars, the
subscriber made the required certification of ownership of securitiesmaturing November 15, 1967. Subscriptions subject to allotment totaled$8,070 million for the notes of Series A-1969 which were allotted 36percent, and $13,98ii. mill ion for the notes of Series A-1974. which wereallotted 7-1/2 percent; subscriptions for $100,000 or less were allottedin full, and subscriptions for more that $100,000 were allotted notless than $100,000.
20/ Includes $1,280 million allotted to Federal Reserve banks and Govern-ment investment accounts.
21 / Subscriptions for $200,000 or less were allotted in full. Subscriptionsfor more than $200,000 were allotted 39 percent but in no case lessthan $200,000.
22/ Includes $3,993 million exchanged by Federal Reserve banks and Govern-ment investment accounts,
22/ Subscriptions for $100,000 or less were allotted in full. Subscriptionsfor more than $100,000 were allotted 28 percent but in no case lessthan $100,000.
2A/ As provided in the offering circular subscriptions were allotted in full(l) for States, political subdivisions or instrumentalities thereof,piblic pension and retirement and other public funds, internationalorganizations in which the United States holds membership, and foreigncentral banks and foreign states where the subscriber certified thatit owned securities maturing August 15, 1968, these totaled $122million (2) for Federal Resei^re banks and Government investmentaccounts, these totaled $4,811 million and (3) those for $250,000or less. All other subscriptions were allotted 18 percent but inno case less than $250,000. The total of all subscriptions fromthe public was $23,569 million,
p Preliminary.
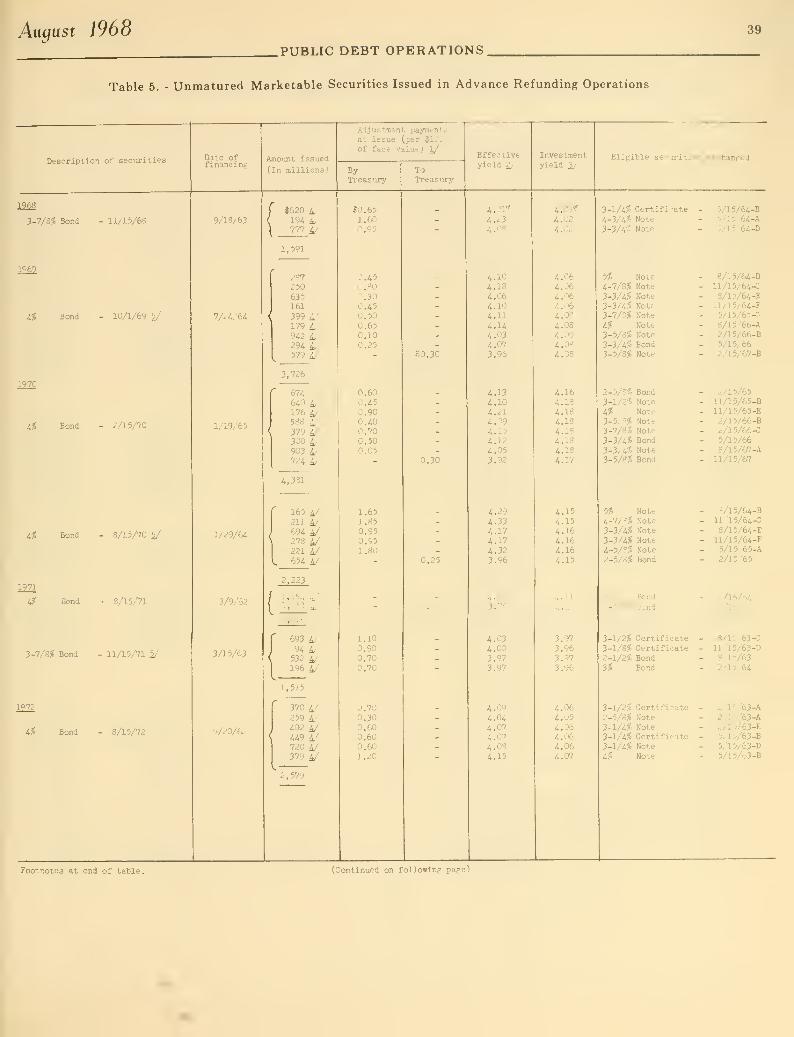
August 1968 39
.PUBLIC DEBT OPERATIONS.
Table 5. - Unmatured Marketable Securities Issued in Advance Refunding Operations
Description of securities
1968
3-7/S% Bond - 11/15/6S
196'
i.% Bond - 10/1/69 V
1970
tfl Bond - 2/15/70
i% Bond - 8/15/70 5/
1971
iS Bond
3-7/8?6 Bond
8/15A1
11/15/71 5/
1972
i% Bond - 8/15/72
Bite offinancing
Amount issued
(In millions)
9/18/63
7/24/64
1/19/65
1/29/64
3/9/62
3/15/63
9/20/62
$620 A/194 A/777 4/
1,591
287250635161
399 4/179 4/942 4/294 4/579 4/
3,726
674640 4/176 4/588 4/379 4/300 4/903 4/724 4/
4,331
165 4/211 4/694 4/278 4/221 4/654 4/
2,223
1,154 ^l,o51 4/
^,806
693 4/94 4/532 4/196 4/
1,515
370 4/259 4/402 4/449 4/720 4/379 4/
2,579
Adjustment paymentsat issue (per $100of face value) 1/
ByTreasury
ToTreasury
80.651.600.95
0.450.800.300.450.500.650.100.25
0.600.450.900.400.700.500.05
1.651.850.950.951.80
1.10
0.900.700.70
0.700.300.600.600.601.20
$0.30
Effectiveyield 2/
0.30
0.25
4.01*
4.234.0.'^
4.104.184.064.104.114.144.034.073.96
4.134.104.214.094.154.124.053.92
4.294.334.174.174.323.96
4.034.033.973.97
4.094.044.074.074. 01
4.1^
Investmentyield 2/
4.02?4.024.02
4.054.064.064.064.034.084.094.084.08
4.164.184.184.184.184.184.134.17
4.154.154.164.164.164.15
3.973.963.973.96
4.064.054.064.064.064.07
Eligible securities exchanged
3-1/4? Certificate4-3/4? Note3-3/4? Note
5? Note4-7/8? Note
3-3/4? Note
3-3/4? Note3-7/8? Note
4? Note3-5/8? Note
3-3/4? Bond3-5/8? Note
2-5/8? Bond3-1/2? Note
4? Note3-5/8? Note
3-7/8? Note
3-3/4? Bond
3-3/4? Note3-5/8? Bond
5? Note4-7/8? Note
3-3/4? Note3-3/4? Note
4-5/8? Note2-5/8? Bond
Bond
5/8? Bond
3-1/2? Certificate3-1/8? Certificate2-1/2? Bond
3? Bond
3-1/2? Certificate2-5/8? Note
3-1/4? Note3-1/4? Certificate3-1/4? Note
4? Note
5/15/64-B5/15/64-A5/15/64-D
8/15/64-B11/15/64-C8/1 5/64 -E11/15/64-F5/15/65-C
8/1 5/66-A2/15/66-B5/15/662/15/67-B
2/15/6511/15/65-B11/15/65-E2/15/66-B2/15/66-C5/15/668/1 5/67-A
11/15/67
8/15/64-B11/15/64-C3/15/64-E11/15/64-F5/15/65-A2/15/65
2/15/642/15/'-.5
8/15/63-C11/15/63-D8/15/632/15/64
2/15/63-A2/15/63-A2/15/63-E5/15/63-B5/15/63-D5/15/63-B
Footnotes at end of table. (Continued on following page)
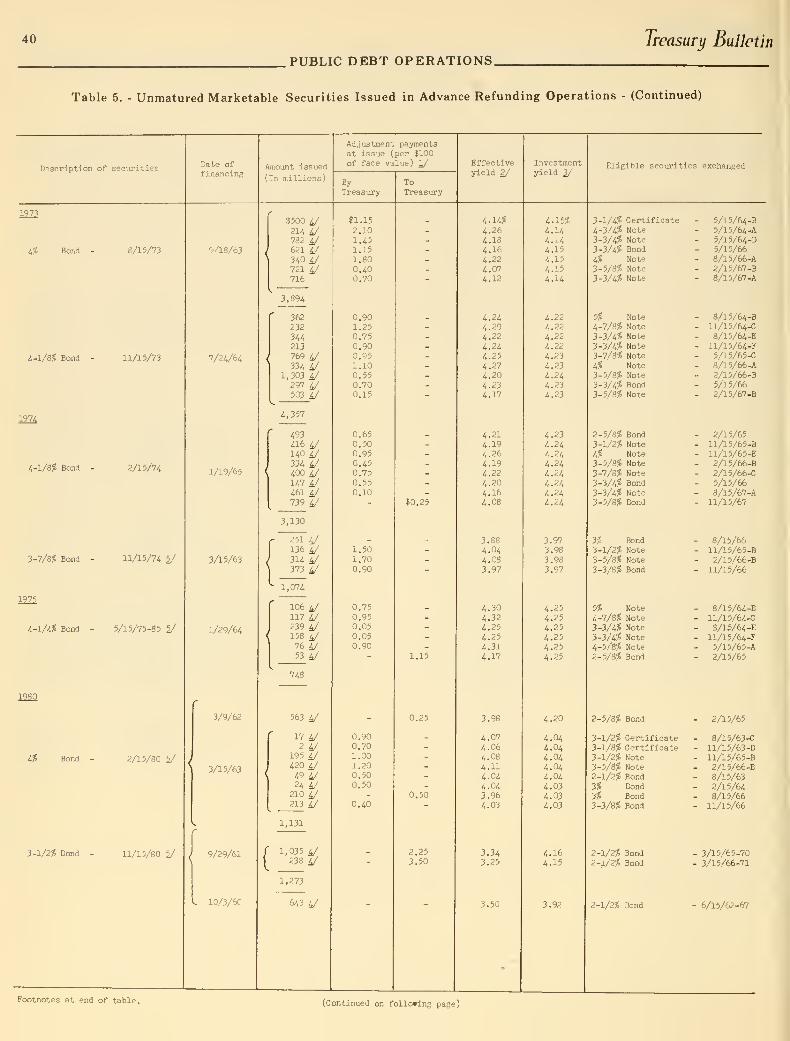
40 Treasury Bulletin
PUBLIC DEBT OPERATIONS.
Table 5. - Unmatured Marketable Securities Issued in Advance Refunding Operations - (Continued)
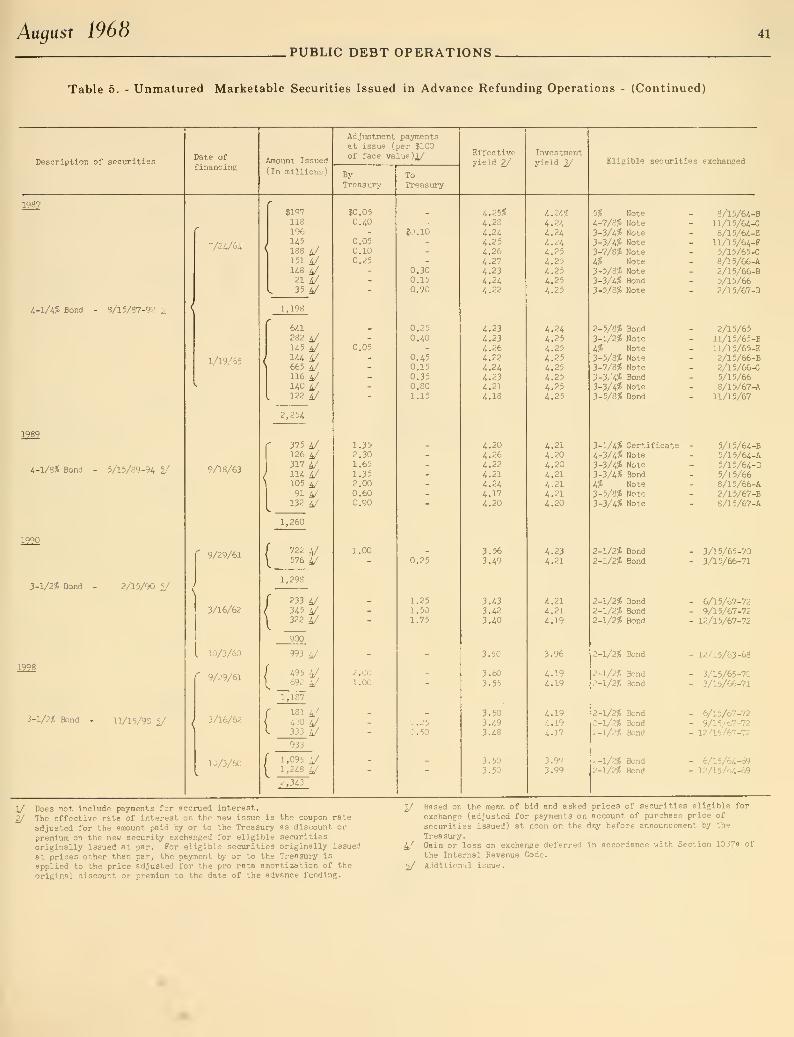
August 1968 41
PUBLIC DEBT OPERATIONS.
Table 5. - Unmatured Marketable Securities Issued in Advance Refunding Operations - (Continued)

42 Treasury Bulletin
.PUBLIC DEBT OPERATIONS.
Table 6. - Unmatured Marketable Securities Issued at a Premium or Discount
Other than Advance Refunding Operations
Description of securities
1968
A-lM% Note
i-l/U% Note
1969
IS Bond
iS Bond
1970

Auqust 1968 43
PUBLIC DEBT OPERATIONS.
Table 6. - Unmatured Marketable Securities Issued at a Premium or Discount
Other than Advance Refunding Operations - (Continued)

44
PUBLIC DEBT OPERATIONS.Treasury Bulletin
Table 7. - Allotments by Investor Classes on Subscriptions for Public Marketable Securities
Part A. - Other than Treasury Bills i/
(In millions of dollars)
Issues
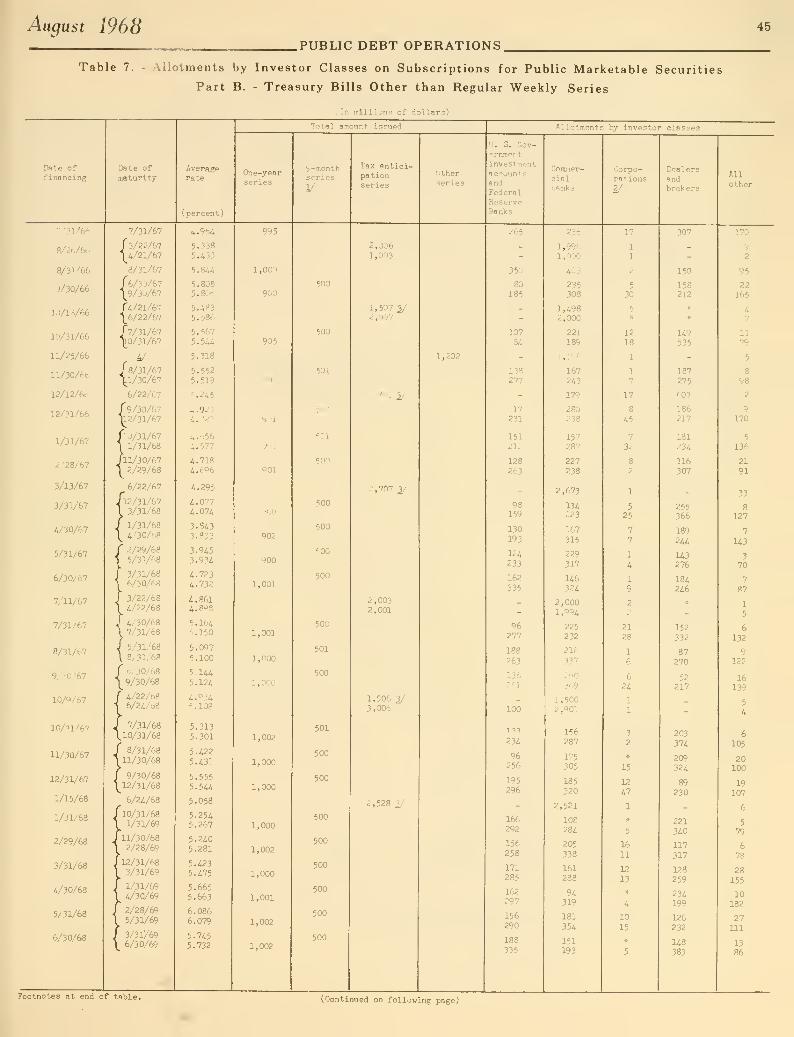
Aagust 1968 45
.PUBLIC DEBT OPERATIONS.
Table 7. - Allotments by Investor Classes on Subscriptions for Public Marketable Securities
Part B. - Treasury Bills Other than Regular Weekly Series
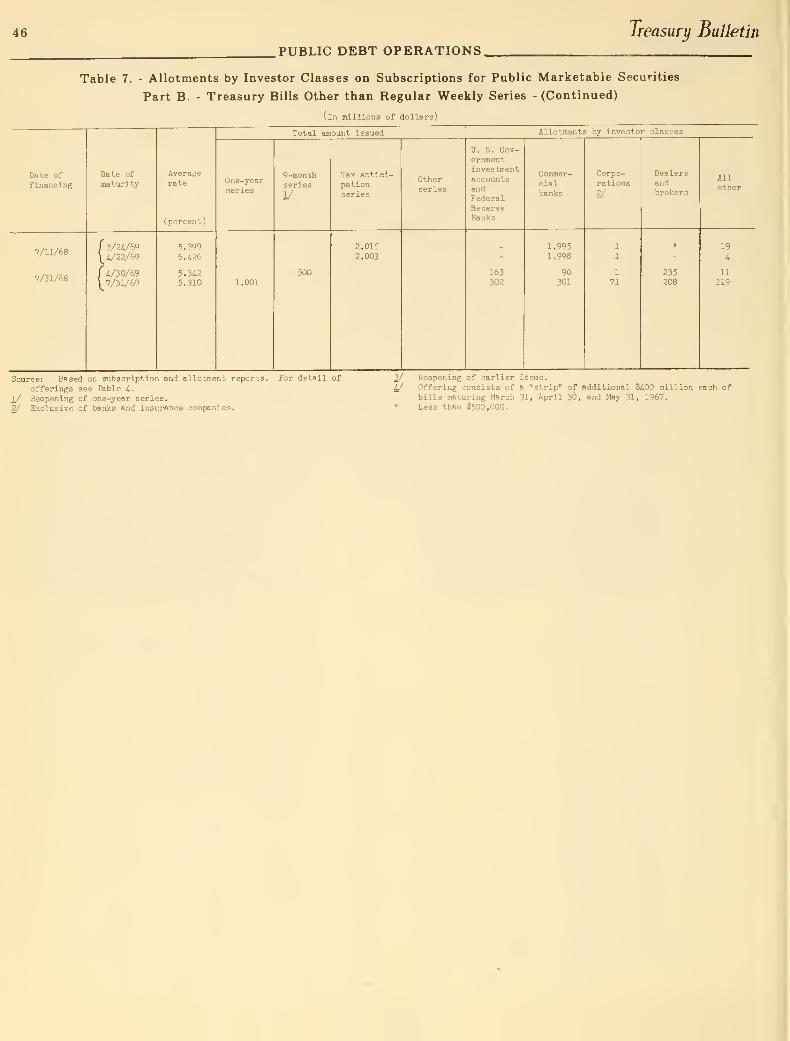
46 Treasury Bulletin
PUBLIC DEBT OPERATIONS.
Table 7. - Allotments by Investor Classes on Subscriptions for Public Marketable Securities
Part B. - Treasury Bills Other than Regular Weekly Series - (Continued)
(in millions of dollars)
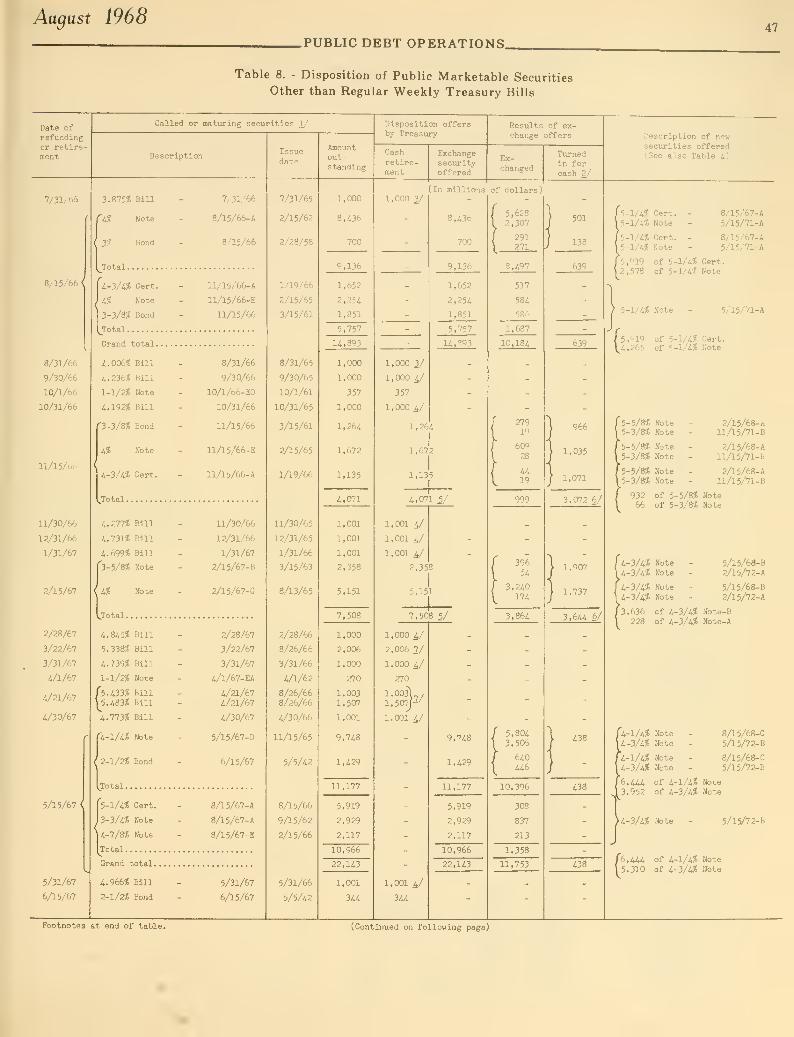
August 1968
.PUBLIC DEBT OPERATIONS.47
Table 8. - Disposition of Public Marketable Securities
Other than Regular Weekly Treasury Bills
Date ofrefundingor retire-ment
7/31/66
8/15/66 <
8/31/66
9/30/66
10/1/66
10/31/66
11/1 5/b6
11/30/66
12/31/66
1/31/67
2/15/67
2/28/67
3/22/67
3/31/67
4/1/67
4/21/67
4/30/67
5/15/67 <
5/31/67
6/15/67
Galled or maturing securities 1/'
Description
3.87556 Bill
^A% Note
3?
Total.
Bond
4-3/4/S Cert.
i.% Note
3-3/8? Bond
Total
Grand total.
4. 006? Bill
4.236? Bill
1-1/2? Note
4.192? Bill
f3-3/3% Bond
4? Note
4-3/4? Cert.
Jotal
.
4.277? Bill
4.731? Bill
4.699? Bill
r3-5/8? Note
4?
iTotal.
Note
4.845? Bill
5.338? Bill
4.739? Bill
1-1/2? Note
r5.433? Bill
1^5.483? Bill
4.773? Bill
r4-l/4? Note
2-1/2? Bond
7/31/66
8/15/66-A
8/15/66
11/15/66-A
11/15/66-E
11/15/66
8/31/66
9/30/66
10/1/66-EG
10/31/66
11/15/66
11/15/66-E
11/15/66-A
11/30/66
12/31/66
1/31/67
2/1 5/67-
B
2/15/67-C
2/28/67
3/22/67
3/31/67
4/1/67-EA
4/21/674/21/67
4/30/67
5/15/67-D
6/15/67
Ijotal
r5-l/4? Cert. - 8/15/67-A
1 3-3/4? Note - 8/15/67-A
14-7/8? Note - 8/15/67-E
[lotal
Grand total
4.966? Bill - 5/31/67
2-1/2? Bond - 6/15/67
Issuedate
7/31/65
2/15/62
2/28/58
1/19/66
2/15/65
3/15/61
8/31/65
9/30/65
10/1/61
10/31/65
3/15/61
2/15/65
1/19/66
11/30/65
12/31/65
1/31/66
3/15/63
8/13/65
2/28/66
8/26/66
3/31/66
4/1/62
8/26/668/26/66
4/30/66
11/15/65
5/5/42
8/15/66
9/15/62
2/15/66
5/31/66
5/5/42
Amountout-standing
1,000
8,436
700
9,136
1,652
2,254
1,851
5,757
14, 8*^3
1,000
1,000
357
1,000
1,264
1,672
1.135
4,071
1,001
1,001
1,001
2,358
5,151
7,508
1,000
2,006
1,000
270
1,0031,507
1,001
9,748
1,429
11,177
5,919
2,929
2,117
10,966
22,143
1,001
344
Disposition offersby Treasury
Cash
retire-ment
Exchangesecurityoffered
Results of ex-change offers
Ex-changed
Turnedin for
cash 2/
1,000 2/
(in millions of dollars)
8,436
9,136
1,652
2,254
1,851
5,757
14,893
1,000 3/
1 , 000 V357
1 , 000 i/
1,264
I
1,672
1,135I
-r4,071 i/
1,001 V1,001 i/
1,001 V2,358
I
5.151
7,508 i/
1 , 000 i/
2,006 7/
1.000 V270
loos'1,507
1.001 V7/
1,001 V344
9,748
1.429
11,177
5,919
2,929
2,117
10,966
22,143
5,6282,307
291271
3,497
517
584
586
1,687
10,184
27919
60928
4419
999
396
54
3,240174
3,864
5.3043,506
640446
10,396
308
837
213
1.358
11,753
501
138
639
639
966
1.035
1,071
3.072 6/
3,6a 6/
438
438
438
Description of newsecurities offered(See also Table 4)
(5-1/4% Cert. -
15-1/4? Note
15-1/4? Cert. -
I5-1/4? Note
8/15/67-A5/15/71-A
8/15/67-A5/15/71-A
I 5,919
I2,578
of 5-1/4? Cert,of 5-1/4? Note
5-1/4? Note 5/15/71-A
5,9191 4,265
of 5-1/4? Cert,of 5-1/4? Note
5-5/8? Note5-3/8? Note
5-5/8? Note5-3/3? Note
I 5-5/8? Note15-3/8? Note
2/1 5/68- ii
11/15/71-B
2/15/68-A11/15/71-B
2/15/68-All/15/71-B
932 of 5-5/8? Note66 of 5-3/8? Note
' 4-3/4? Note
14-3/4? Note
4-3/4? Note
4-3/4? Note
(3,636228
5/15/68-B2/15/72-A
5/15/68-B2/15/72-A
cf 4-3/4? Note-Bof 4-3/4? Note-A
4-1/4?4-3/4?

48
PUBLIC DEBT OPERATIONS.Treasury Bulletin
Table 8. - Disposition of Public Marketable Securities
Other than Regular Weekly Bills - (Continued)
Date of
refundingor retire-ment
Called or matiiring securities 1/
DescriptionIssuedate
Amountout-standing
Disposition offersby Treasury
Cashretire-ment
Exchangesecurityoffered
Results of ex-change offers
Ex-
changed
Turnedin forcash 2/
Description of newsecurities offered{See also Table ^4)
6/22/67
6/30/67
7/31/67
8/15/67
8/31/67
9/30/67
10/1/67
10/31/67
11/15/67
11/30/67
12/31/67
1/31/68
2/15/68 ,
5.586i6 Bill5.2«$ Bill4.295* Bill
/i.697iC Bill
< 5.808? Bill
UsbiS Bill\5.ibl% Bill
rS.SU? Bill
)^5.552? Bill
h.&Ob% Bill
U.920? Bill
1-1/2% Note
h.iUS Bill
U.656? Bill
Pi-7/8* Note
[3-5/8* Bond
Total
2/29/68
3/22/68
3/31/68
4/1/68
5/15/68
5/31/68
6/30/68
7/31/68
8/15/68
fs.SW* Bill
U.718* Bill
U.S2Q% Bill\4.077* Bill
1^.577% Bill
\3.843* Bill
5-5/8% Note
-1//S Note13-3/4% Bond
5-1/4% Note
I3-7/8% Bond
(Total
Grand total.
A. 696% Bill
1^3.945% Bill
4.861% Bill
r4.074% Bill
U.723% Bill
1-1/2% Note
3.833% Bill5.164% Bill
4-3/4% Note
^3-7/8% Bond
Total
3.934% Bill5.097% Bill
14-732% Bill
^5.144% Bill
^5.150% Bill
^5.313% Bill
'4-1/4% Note
3-3/4% Bond
6/22/676/22/676/22/67
6/30/676/30/67
7/31/677/31/67
8/15/67-A
8/15/67-A
8/15/67-E
8/31/678/31/67
9/30/679/30/67
10/1/67-EO
10/31/6710/31/67
11/15/67-F
11/15/67
11/30/6711/30/67
12/31/6712/31/67
1/31/681/31/68
2/15/68-A
8/15/68-C8/15/68
11/15/68-D11/15/68
2/29/682/29/68
3/22/68
3/31/683/31/68
4/1/68-EA
4/30/684/30/68
5/15/68-B5/15/68
5/31/685/31/68
6/30/686/30/68
7/31/687/31/68
8/15/68-C8/15/68
10/18/6610/18/6610/18/66
6/30/666/30/66
7/31/667/31/66
8/15/66
9/15/62
2/15/66
8/31/668/31/66
9/30/669/30/66
10/1/62
10/31/6610/31/66
5/15/66
3/15/61
11/30/6611/30/66
12/31/6612/31/66
1/31/671/31/67
11/15/66
5/15/674/18/628/15/679/15/63
2/28/672/28/67
7/11/67
3/31/673/31/67
4/1/63
4/30/674/30/67
2/15/676/23/60
5/31/675/31/67
6/30/676/30/67
7/31/677/31/67
5/15/674/18/62
2,007801
2,707
1,001500
995500
5,610
2,094
1,904
9,608
1,000501
900500
457
905501
8,135
2,019
10,154
900500
901500
901500
2,635
6,4443,7479,9131,591
21,695
24,331
901500
2,003
900500
900500
5,5872,460
8,047
900501
1,001500
1,001
501
5,9362,640
8,576
(In millions of dollars)
2,00'7l
801)7/2,7C7|
l,O0l\V
500J
995"!^
500_/
5,610
I
2,094I
1,904
9,608 ^i,ooo"l
5OIJ
'^°°^4y500jl^
457
905501:}.
3,135
2,019I
10,154 i/
2,003^7/
900)
^50(
212
900I
500
°00l ,
501^/
l,00l"l
500J
1,001
501
2,635
6,4443,7479,9131,591
21,o95
::.;,331
5,5872,460
3,047
'V
5.9362,640
3,576 y±
4,621
420
1,322
6,363
6,929105
652*
40
T,726
2,171p
507pl,lC7p
929p433p
;:,977p
5,148p
5,047pl,699p
6,747p
989
1,674
582
5-1/4% Note 11/15/68-D
3,245 6/
1,101
1,326
2,427 6/
5-5/8% Note
.5-3/4% Note
5-5/8% Note5-3/4% Note
2/15/69-A11/15/74-A
2/15/69-A11/15/74-A
7,581145
of 5-5/8% Noteof 5-3/4% Note
464p
) 5-3/4% Note
464p
2/15/75-A
540p761p
5/15/75-B
l,300p 8/
1 5-5/8* Note 8/15/74-B
n.a. 6/
Footnotes on following page.

August 1968 49
PUBLIC DEBT OPERATIONS.
Footnotes to Table 8
Source: Daily Treasury Statement; Bureau of the Public Debt.
X/ Original call and maturity dates are used.
2/ All by investors other than Federal Reserve banks.
_2/ Rolled over into one-year bills (see Table 4).
4/ Rolled over into 9-raonth and one-year bills under new programbeginning September 30, 1966 (see Table ^)
.
%f Holders of the maturing notes, bonds, or certificates were not offeredpreemptive rights to exchange their holdings, but were permittedto present them in payment or exchange, in whole or in part, for thenew securities of/ered.
y Excess of maturing securities over allotments of new securities paidfor with the maturing securities.
if Tax anticipation issue; for detail of offerings beginning July 1966,see Table 4; for amounts redeemed for taxes and for cash see "Note"below.
y Of this amount, IS million of the k-'i/IS notes and $6 million of the3-l/Z% bonds were submitted in payment for subscriptions allottedfor 656 Treasury Notes of Series C-1969 which were offered on a cashbasis. Holders of the maturing securities were not offered preemptiverights to exchange their holdings for the notes of Series C-1969.For detail of offering see Table 4..
p Preliminary, n. a. Not available.
Note: Information on retirement of tax anticipation issues referred toin footnote 7, in millions of dollars:
Date ofretirement
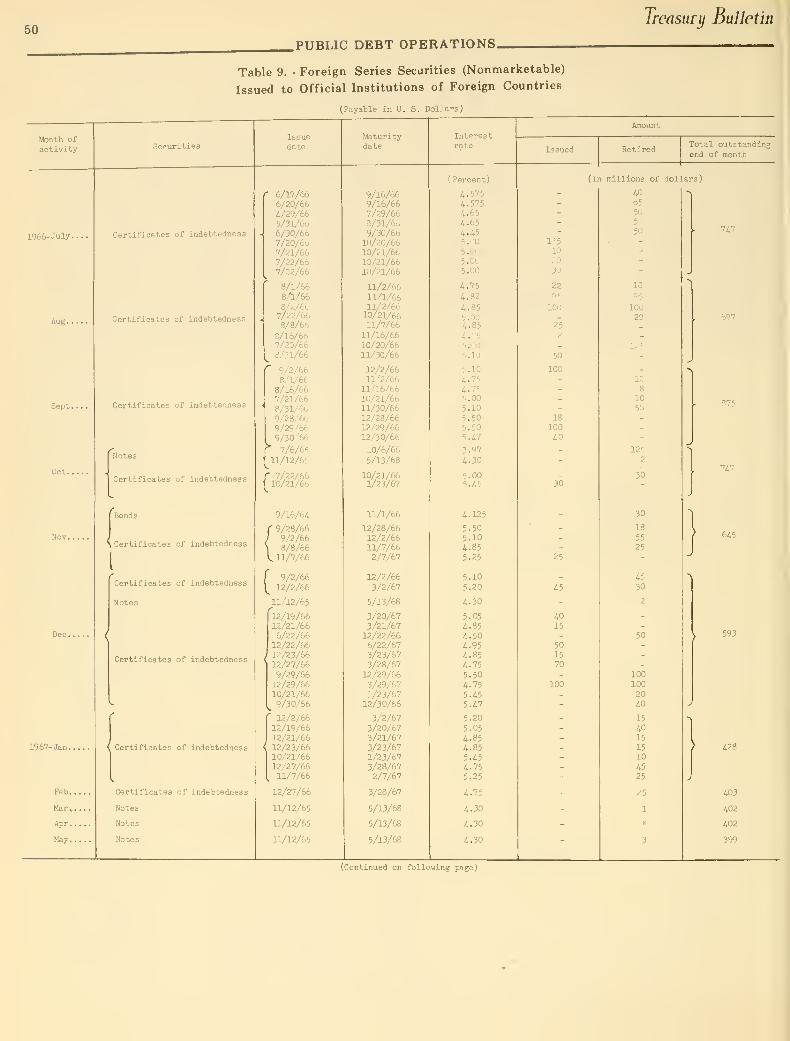
50Treasury Bulletin
PUBLIC DEBT OPERATIONS.
Table 9. - Foreign Series Securities (Nonmarketable)
Issued to Official Institutions of Foreign Countries
(Payable in U. S. Dollars)
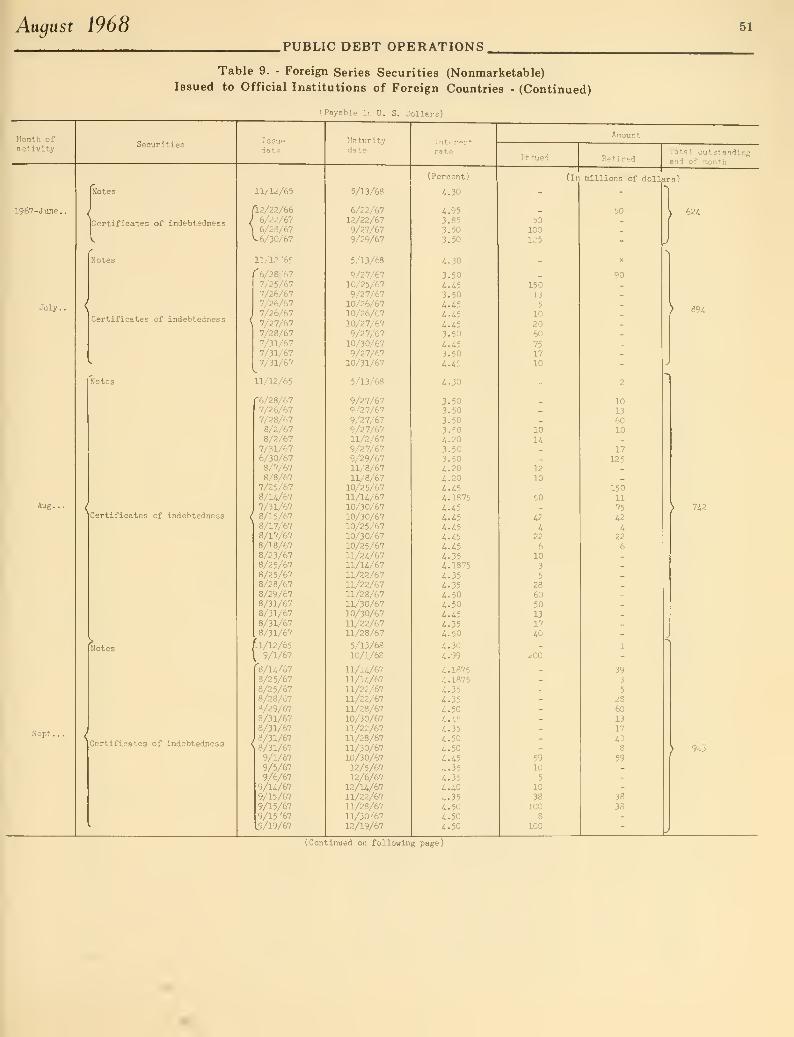
August 1968 51
.PUBLIC DEBT OPERATIONS
Table 9. - Foreign Series Securities (Nonmarketable)Issued to Official Institutions of Foreign Countries - (Continued)
(Payable in U. S. Dollars)
Month 0-'
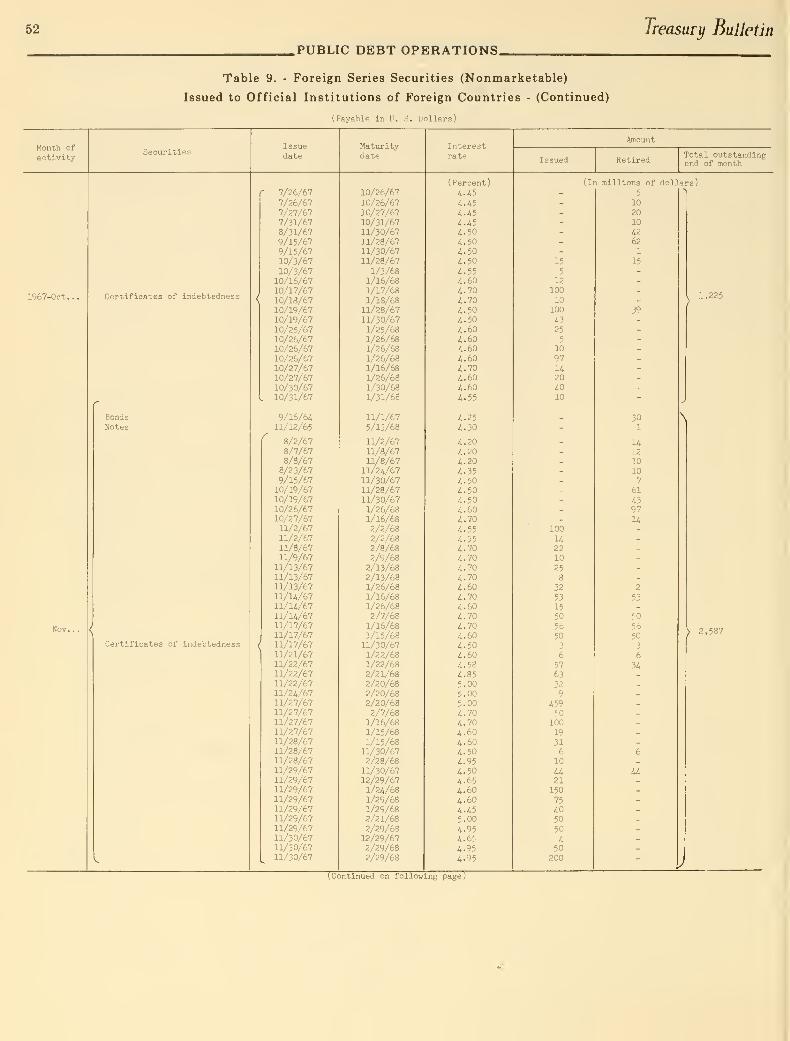
52 Treasury Bulletin
.PUBLIC DEBT OPERATIONS.
Table 9. - Foreign Series Securities (Nonmarketable)
Issued to Official Institutions of Foreign Countries - (Continued)
(Payable in U. S. Dollars)

August 1968 53
.PUBLIC DEBT OPERATIONS.Table 9. - Foreign Series Securities (Nonmarketable)
I«!sued to Official Institutions of Foreign Countries - (Continued)
(Payable in U. Z. Dollars)

54 Treasury Bulletin
.PUBLIC DEBT OPERATIONS.
Table 9. - Foreign Series Securities (Nonmarketable)
Issued to Official Institutions of Foreign Countries - (Continued)
(Payable In U.S. Dollars)

August 1968 55
.PUBLIC DEBT OPERATIONS
Table 9. - Foreign Series Securities (Nonmarketable)
Issued to Official Institutions of Foreign Countries - (Continued)
(Payable in U.S. Dollars)

56 Treasury Bulletin
.PUBLIC DEBT OPERATIONS.
Table 9. - Foreign Series Securities (Nonmarketable)
Issued to Official Institutions of Foreign Countries - (Continued)
(Payable in U. S. Dollars)

August 1968 57
.PUBLIC DEBT OPERATIONS.
Table 10. - Foreign Currency Series Securities (Nonmarketable)
Issued to Official Institutions of Foreign Countries
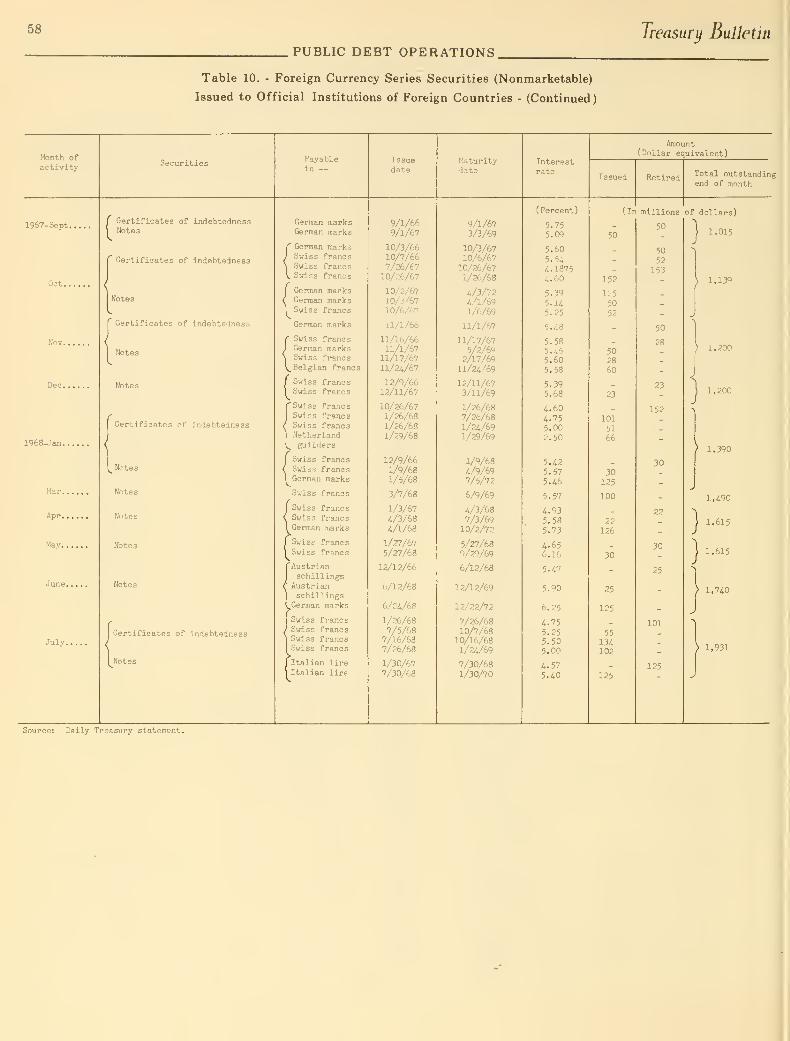
58
PUBLIC DEBT OPERATIONS.
Table 10. - Foreign Currency Series Securities (Nonmarketable)
Issued to Official Institutions of Foreign Countries - (Continued)
Treasury Bulletin
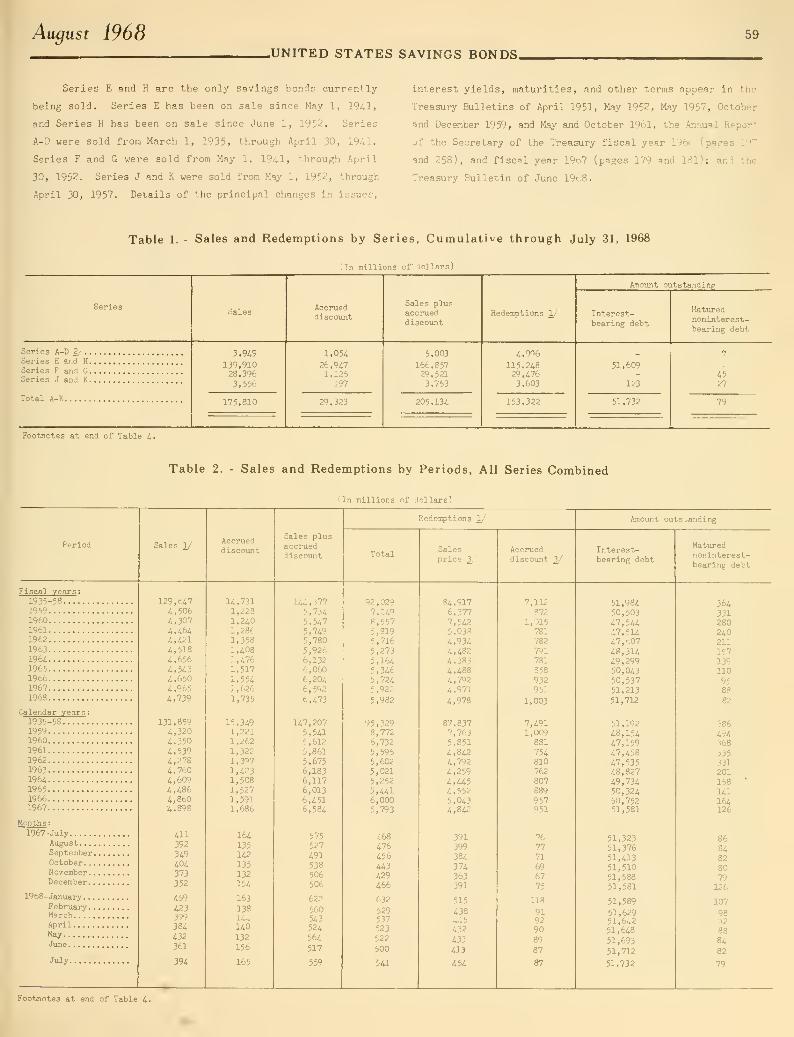
August 1968 59
.UNITED STATES SAVINGS BONDS.
Series E and H are the only savings bonds currently
being sold. Series E has been on sale since May 1, 1941,
and Series H has been on sale since June 1, 1952. Series
A-D were sold from March 1, 1935, through April 30, ig/tl.
Series F and G were sold from May 1, 19'+1, through April
30, 1952. Series J and K were sold from May 1, 1952, through
April 30, 1957. Details of the principal changes in issues,
interest yields, maturities, and other terms appear in the
Treasury Bulletins of April 1951, May 1952, May 1957, October
and December 1959, and May and October 1961, the Annual Report
of the Secretary of the Treasury fiscal year 1966 (pages 197
and 258), and fiscal year 1967 (pages 179 and 181); and the
Treasury Bulletin of June 1968.
Table 1. - Sales and Redemptions by Series, Cumulative through July 31, 1968
Footnotes at end of Table 4.
(In millions of dollars)
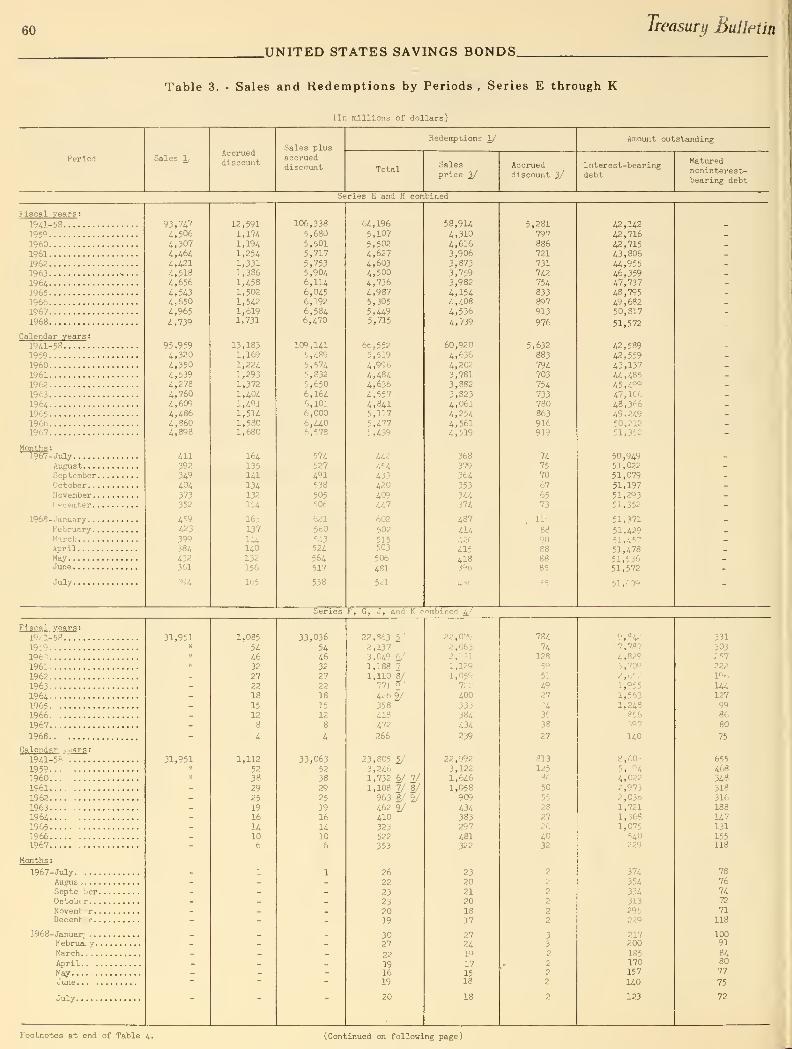
60 Treasury Bulletin
.UNITED STATES SAVINGS BONDS.
Table 3. - Sales and Redemptions by Periods , Series E through K
(In millions of dollars)
Sales V Accrueddiscount
Sales plusaccrueddiscount
Redemptions 1/
TotalSalesprice ^
Accrueddiscount ^
Amount outstanding
Interest-bearingdebt
Maturednoninterest-bearing debt
Series E and H combined
fiscal years :
19a-531959
I96019611962
1963196^1965196619671968
Calendar years :
1941-531959196019611962
19631964196519661967
Months :
1967- JulyAugust . . .
.
September.October. .
.
November.
,
December.
.
1968-January. .
.
February .
.
MarchAprilMayJune
July 394
93,747
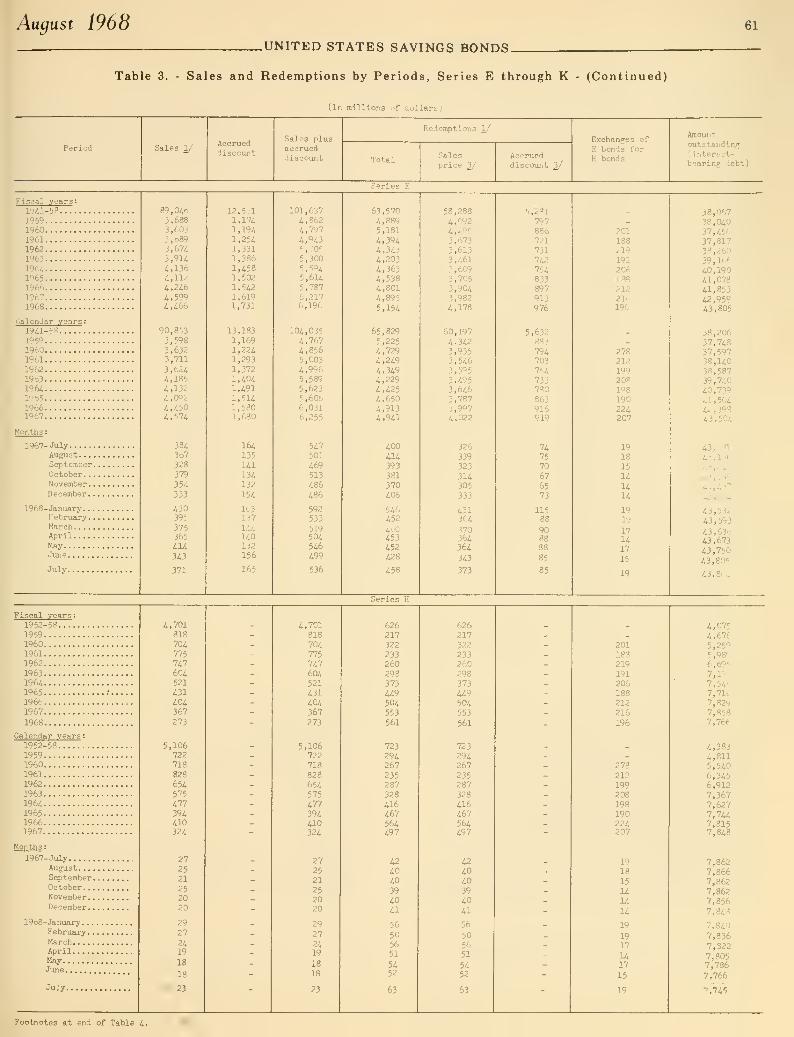
August 1968.UNITED STATES SAVINGS BONDS.
61
Table 3. - Sales and Redemptions by Periods, Series E through K - (Continued)
( In millions of dollars
)
Sales 1/Accrueddiscount
Sales plusaccrueddiscount Total
Redemptions 1
Salesprice 2/
Accrueddiscount 2/
Exchanges of
E bonds for
H bonds
Amountoutstanding(interest-bearing debt)
Fiscal years :
Ka-'j?195919601961
19621963
196i1965196619671968
Calendar years :
19a-5S195919601Q61
19621963
19641"65
19661967
Months :
1967- JulyAugust . . , ,
September,
October. .
,
November .
,
December.
.
1968-January. .
.
February.
.
MarchAprilMayJune
July
89,0463,6883,6033,6893, bit.
3,9U4,1364,11^4,2464,5994,466
90,8533,5983,6323,7113,6244,1854,1324,0924,4504,574
384367328
379
354333
430395
375365
4U343
371 165
12,591

62
.UNITED STATES SAVINGS BONDS.
Treasury Bulletin
Table 4. - Redemptions of Matured and Unmatured Savings Bonds
fin millions of dollars)
Period Total 1/ Series E
and HOther Total
Series E
and HOther
Unclassified10/
Fiscal years :
1951-52
1953195419551956195719581959 ,.
.
196019611962
196319641965196619671968
Calendar years :
1951-52
1953
195i19551956195719581959196019611962
19631964196519661967
Months ;
1967- JulyAugust. . .
.
September
.
October. .
.
November.
.
December.
.
1968-January. .
.
February.
.
MarchAprilMayJune
July
11,2465,6216,5157,2517,8468,9588,5447,2498,5575,8195,7165,2735,1645,3465,7245,922
5,982
10,725
6,U96,9857,3018,2649,6307,2558,7726,732
5,5955,6025,0215,252
5,4416,0005,793
468476456443429
466
632529537523522500
541
1,6101,7612,7473,9414,2634,1153,7303,6214,1262,6732,5932,2502,0572,1842,2532,471
2,548
1,7872,3133,1714,2304,2464,1563,3934,7013,0332,5552,3872,0432,1712,1482,4722,386
200170
237114
203
199
173250272190279
261
254
7401,1281,4871,8261,9171,9711,9061,9962,3041,7331,6681,5931,7541,9381,9732,059
2,289
1,2221,3281,5002,0471,8912,0841,6912,4331,9441,6331,6561,6171,8891,9322,0802,041
176
U7223106
183
159
156218242174258
248
231
369
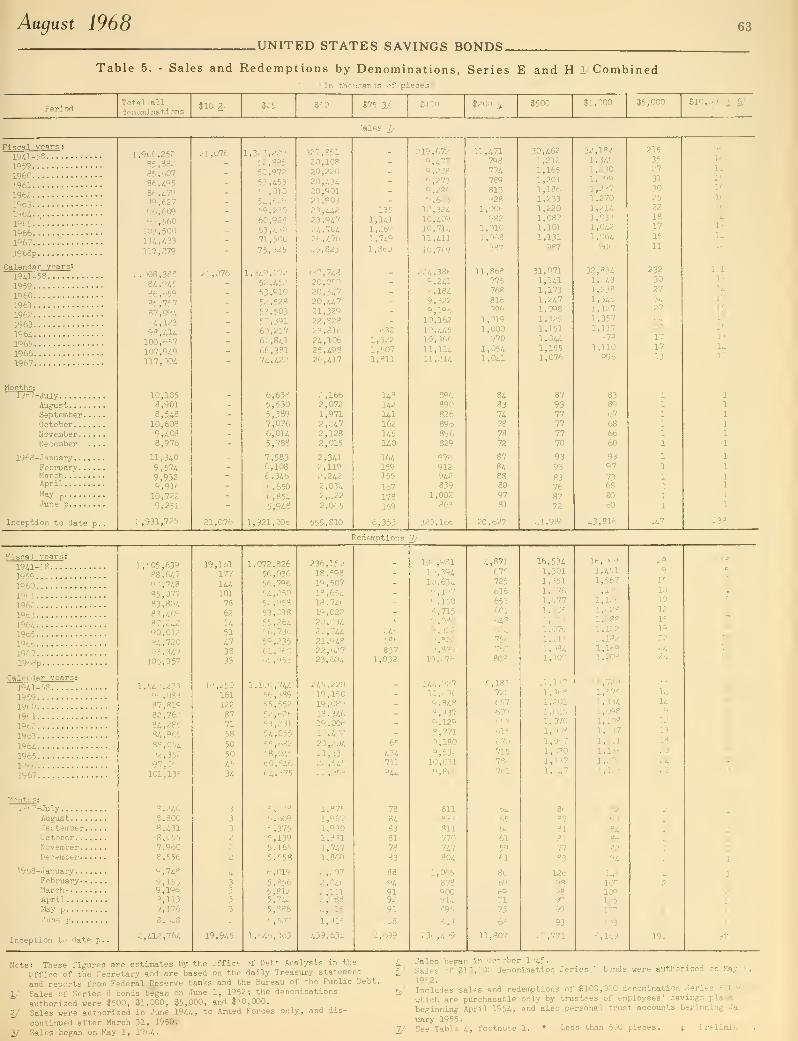
Aagust 1968 63
.UNITED STATES SAVINGS BONDS.
Table 5. - Sales and Redemptions by Denominations, Series E and H i Combinedfin thousands of pieces)
PeriodTotal alldenominations
$10 2/ $25 $75 2/ $100 $200 4/ $500 1,000 $5,000 $10,000 y 6/
.;ales 7/
Fiscal years :
1941-58
195919601961196219631964196519661967
1968p
Calendar years :
1941-58
1959196019611962
19631964196519661967
Months :
VWf-JxayAugustSeptember. . .
.
OctoberNovemberDecember
1968-JanuaryFebruaryMarchApril
l^ayp
June p
Inception to date p.
1,966,25285,88285,60786,49586,47989,62796,60999,560103,500114,433117,279
2,008,38884,94586,65985,75787,09494,12398,4U100,657107,949117,004
10,1058,9018,548
10,6039,40s8,976
11,340
9,5749,9329,91610,722
9,251
2,931,725
21,076
21,076
21,076
1,323,^2952,89552,972
53,45353,01054,62959,23060,92863,43071,506
75,925
1,349,07252,45253,91052,52853,50357,39160,217
61,8a66,38174,422
6,6385,5305,3897,0766,0145,788
7,5836,1086,346
6,6506,8545,948
1,921,206
327,85120,10820,22020,43420,90121,90323,44223,94724,70426,476
25,823
337,74820,05020,34720,44721,32922,82823,81624,10625,49826,417
2,1662,0721,9712,2472,1282,015
2,3412,1192,2422,0342,4222,065
555,810
13?
1,1411,4691,749
1,860
6321,3221,6071,811
148142L41162
145140
164159155
167
178159
6,353
219,6729,4779,2089,273°,?86
l-,3--4
10,40910,71411,411
10,769
224,3869,2a9,1849,3229,19610,162
10,44510,36611,11411,214
896890826896896829
976912942839
1,002863
320,166
11,471798
774789813
1,30';,
9821,0101,068987
11,868775768816799
1,0191,000970
1,0541,041
8483
7478
78
72
87
848880
9781
20,627
30,4621,2121,1651,2011,1861,2331,2201,0871,1011,131987
31,0711,1411,1731,2471,0981,3251,1511,0441,1551,076
87
9377
77
7770
9393
83768772
41,986
32,1821,3401,2301,299l,2'i7
1,2701,2U1,0331,0421,064906
32,8341,2431,2381,3461,1271,3571,117978
1,110996
8389
67
68
6660
9397716880
60
43,816
215
352731
30
18
17
15
11
2323027
3427
24201717
13
447
16
11
1516
1616
14
13
14
1:
101
13
12
17
1517
15
13
U13
1
1
1
1
1
1
1
1
11
1
1
238

64
.UNITED STATES SAVINGS BONDS.Treasury Bulletin
Table 6. - Sales by States, Series E and H^ Combined
(In thousands of dollars at Issue price)
State
AlabamaAlaska
Arizona
ArkansasCaliforniaColorado
ConnecticutDelawareDistrict of Columbia
FloridaGeorgiaHawaii
IdahoIllinoisIndiana
IowaKansasKentucky
LouisianaMaineMaryland
MassachusettsMichiganMinnesota
MississippiMissouriMontana
NebraskaNevadaNew Hampshire
New JerseyNew MexicoNew York
North CarolinaNorth DakotaOhio
OklahomaOregonPennsylvania
Rhode IslandSouth CarolinaSouth Dakota
TennesseeTexasUtah
VermontVirginiaWashington
West VirginiaWisconsinWyoming
Canal ZonePuerto RicoVirgin Islands
Undistributed andadjustment to dailyTreasury statement..
Total
Inception
throughJune 1968
2/
i.sii.'^gs
69,065 2/523,808
755,1909,395,8551,022,178
2,161,62940/i,340
l,i20,927
1,889,073l,i81,546497,927
313,55710,967,8743,874,568
3,692,8722,155,1461,510,863
1,286,834504,551
1,816,928
3,828,2357,770,2592,477,579
714,5053,909,791
642,428
2,171,159170,377314,080
5,235,710340,151
15,424,326
1,509,450642,301
8,644,545
1,659,7621,237,528
11,615,263
584,868768,991789,071
1,384,5594,696,854
541,972
169,4802,268,364
2,129,899
1,389,0723,019,935249,530
86,45779,5814,836
5,988,936 V
1967
July
139,516,580
3,256221
1,902
1,33324,0612,451
6,2741,5563,125
6,2134,4001,005
628
26,74610,690
6,6613,4833,962
3,4461,5266,505
10,33519,4754,490
1,21812,1091,111
3,597478939
15,4131,076
42,451
3,8551,098
23,991
3,8632,34333,737
1,6872,001
1,3U
3,32810,1431,847
4307,637
3,739
3,5938,098396
25620027
64,967
Aug.
410,686
3,411287
1 ,804
1,35326,7602,388
6,5901,6102,559
6,9064,1091,156
48927,24811,114
7,5594,4164,028
3,1671,3066,935
10,69225,0275,100
1,12611,491
986
4,775673
759
16,0211,312
43,635
3,668929
25,861
4,0752,173
34,928
1,3812,0031,333
3,76611,7051,736
3946,067
3,676
3,8147,404
360
115
34856
29,699
Sept.
392,283
3,301303
1,448
1,28724,5122,222
5,6031,4053,462
6,0663,6431,218
42722,9219,895
6,1314,0143,803
2,6621,032
6,575
9,15620,2374,000
1,16410,333
839
3,906507641
14,939898
38,863
3,6318U
22,456
3,7711,760
33,172
1,2001,9251,400
3,1359,9891,639
3726,770
3,250
3,3956,571400
32619919
25,727
Oct.
349,364
2,923729
1,591
1,27126,5082,231
5,7871,8585,657
6,4064,4311,247
48424,62310,549
6,3843,8793,492
2,9421,1735,243
9,92724,3494,769
1,15812,2911,054
3,932529
1,194
14,8261,130
41,622
3,676911
24,444
3,9982,06433,227
1,4972,1001,330
3,56310,7421,585
4086,210
3,048
3,2416,991
374
24121023
57,549
Nov.
403,621
3,048260
1,499
1,262
24,8582,340
6,971
1,5744,109
6,7523,9091,407
388
23,38910,039
6,3323,8323,687
2,8371,1517,437
9,43321,2834,500
1,01610,752
985
4,317421797
15,387937
42,424
3,862955
22,462
3,8422,02231,766
1,3981,8991,373
3,48511,9731,439
401
5,745
3,472
3,6746,286
434
422322
33
36,790
Dec.
373,388
2,81b296
1,424
1,52424,4322,099
5,3971,3362,210
6,3753,7511,025
365
23,1609,827
6,4303,615
3,453
2,52^910
6,335
9,84119,9513,855
98310,466
932
3,733472
615
14,47999b
41,419
3,572849
22,450
4,1321,827
31,562
1,0671,7951,248
3,3229,7691,523
3256,310
3,U9
3,5726,226
384
29428025
31,315
1968
Jan.
352,340
3,703304
1,893
1,71331,0472,351
6,8681,8944,404
7,4514,6661,248
55731,16811,529
9,2975,1164,192
3,4811,3227,204
11,63525,6555,176
1,35713,3531,208
4,'884
749968
17,4741,128
45,539
4,281965
27,953
4,2533,143
38,031
1,8272,0801,664
4,21312,6001,662
4887,710
4,359
3,9107,805406
111
4:^9
41
60,233
,698
3,403282
1,717
1,73627,5382,505
6,0911,7643,413
8,5794,6631,021
63126,21110,442
7,890-
4,9244,380
3,5581,2777,541
10,97526,2235,138
1,44111,9831,119
4,404289906
15,9971,152
45,925
4,2861,122
24,514
4,2912,256
37,639
1,4532,0011,738
4,07211,9671,617
399
6,634
3,893
3,8756,979
490
536
38423
47,299
Mar.
422,586
2,939231
1,474
1,45826,6832,681
6,2931,7073,638
6,3914,246
652
44824,290^,752
6,6304,0193,650
2,7501,0957,168
9,94825,5274,126
1,08410,712
926
3,531326680
15,9281,064
38,029
3,850920
23,689
3,8532,15533,895
1,4141,7621,385
3,01211,1231,418
4487,528
3,552
3,4046,590
356
26427433
57,829
April
398,830
3,064301
1,869
1,43025,8282,457
6,004630
2,128
6,7894,3301,434
40026,17110,043
6,7073,2393,896
3,0361,1117,140
10,05428,172
4,695
1,21310,7771,002
3,396551766
15,531911
43,080
4,127861
22,264
3,6952,366
35,175
1,4302,1061,406
3,59011,7431,671
4077,180
3,765
3,5536,753
345
27726829
32,832
Hay
384,007
3,075
1911,7d5
1,37127,3882,148
6,4142,6653,320
7,3314,0851,461
528
24,8119,747
5,2113,3983,646
2,8841,0726,8^4
10,76425,7274,512
1,1279,541
920
2,900676797
15,3451,204
45,090
3,933805
23,530
3,7142,156
34,563
1,4721,8611,134
3,75212,2751,560
4457,102
3,572
3,7266,487
338
277
23021
81,260
432,221
Source: Daily Treasury statement and reports from Federal Reserve banks.
1/ Sales of Series H began June 1, 1952.2/ Figures include exchanges of minor amounts of Series F and J bonds for
Series H bonds beginning January 1960: however they exclude exchanges ofSeries E bonds for Series H bonds.
^ Excludes data for period April 1947 through December 1956, when reports4/
were not available. In previous issues of the Bulletin, data forperiod May 19.^1 through March 194-7 were included in "Other possessions,and data for calendar years 1957 and 1953 were included in "Adjustmentto daily Treasmy statement."Includes a small amount for other possessions.
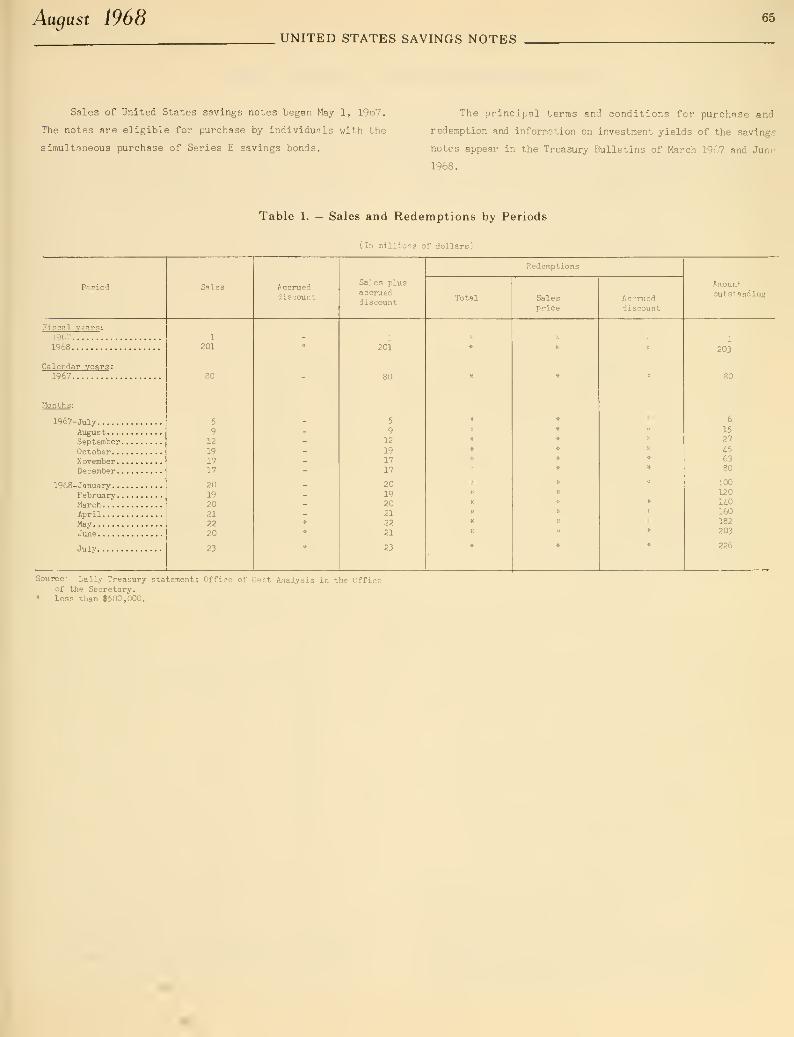
August 1968 65
UNITED STATES SAVINGS NOTES
Sales of United States savings notes began May 1, 19b7.
The notes are eligible for purchase by individuals with the
simultaneous purchase of Series E savings bonds.
The principal terras and conditions for purchase and
redemption and information on investment yields of the savings
notes appear in the Treasury Bulletins of b4arch 1967 and June
1968.
Table 1. — Sales and Redemptions by Periods
(In millions of dollars)
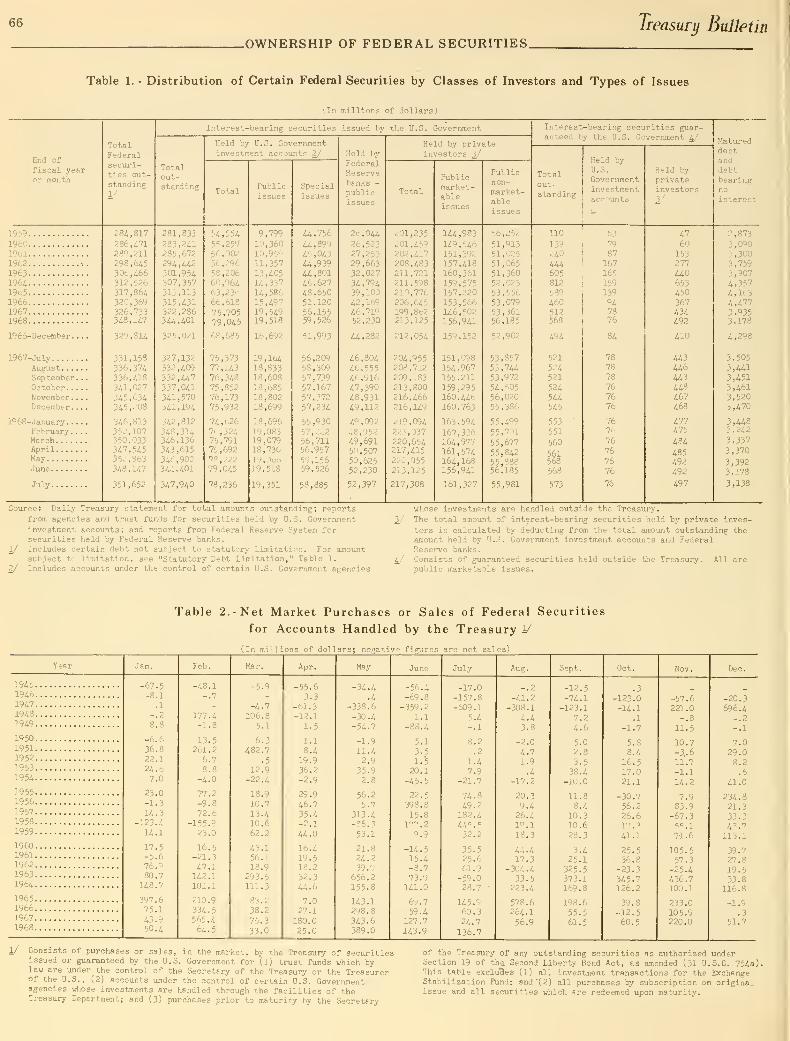
66
.OWNERSHIP OF FEDERAL SECURITIES.Treasury Bulletin
Table 1. - Distribution of Certain Federal Securities by Classes of Investors and Types of Issues
(In millions of dollars)
End of
fiscal yearor month
TotalFederalsecuri-ties out-
standing
1/
1 -terest-bvarini? c-'-.-i^urities issued by the U.S. Government
Totalout-standing
iield by U.S. Governmentinvestment accounts 2/
TotalPublicissues
Specialissues
Held byFederalReservebanks -
public
Held by privateinvestors J_/
Public-
market-ableissues
Publicnon-
market-ableissues
Interest-bearing securities guar-anteed by the U.S. Government 4/
Totalout-standing
Held by
U.S.
Governmentinvestmentaccounts
Held by
privateinvestors
2/
Matureddebtand
debtbearingno
interest
1959
1960196119621963
196i1965196619671968
1966-December.
.
1967-JulyAugust ....
September.October. .
.
November .
.
December.
.
1968-January. .
.
February .
.
MarchAprilMayJune
July
284,817
286,471289,211298,645306,466312,526317,864320,369326,733348,147
329,814
331,158336,374336,418341,027345,634345,208
346,813352,107350,033347,545352,863348,147
351,652
281,833
283,241285,672294,442301,954307,357313,113315,431322,286344,401
325,021
327,132332,409332,447337,041341,570341,194
342,812348,314346,136343,615348,902344,401
347,940
54,554
55,25956,00256,29658,20660,96463,23666,618
75,70579,045
68,685
75,37377,14376,34875,85276,17375,932
74,62676,32475,79175,69278,22279,045
78,236
9,799
10,36010,95911,35713,40514,337U,58615,49719,54919,518
16,692
19,16418,83318,60818,68518,80218,699
18,69619,08319,07918,736
19,06619,518
19,351
44,756
U,89945,043U,93944,80146,62748,65051,12056,15559,526
51,993
56,20958,30957,73957,16757,37257,234
55,93057,24256,71156,95759,15659,526
58,885
26,044
26,52327,25329,66332,02734,79439,10042,16946,71952,230
44,282
46,80446,55546,91647,39048,93149,112
49,09248,95249,69150,50750,62552,230
52,397
201,235
201,459202,417208,483211,721211,598210,776206,645199,862213,125
212,054
204,955208,712209,183213,800216,466216,U9219,094223,037220,654217,415220,055213,125
217,308
144,983
U9,546151,392157,418160,361159,575157,220153,566146,502156,941
159,152
151,098154,967155,211
159,295160,446160,763
163,594
167,336164,977161,574164,168156,941
161,327
56,252
51,91351,02551,06551,36052,02353,55653,07953,36156,185
52,902
110
139240
4U605812
589460512568
494
53,857

August 1968.OWNERSHIP OF FEDERAL SECURITIES.
67
Table 3. - Estimated Ownership of Federal Securities
{Par values 1/ in billions of dollars)
End of
month
TotalFederalsecuritiesoutstand-ing 2/
Held by banks
Commer-cialbanks
FederalReserveBanks
U. S.
Govern-ment in-vestmentaccoxints
Held by private nonbank investors
Individuals 4/
Savings bonds
SeriesE and H
Otherseries i,'
secu-rities
Insurancecompanies
Mutualsav-ingsbanks
Corpora-tions 6/
i^tate
andlocalgovern-ments
Foreignand inter-
national
1/
Other mis-cellaneousinvestors
1939-Dec
1946-Feb. 2/--Dec
1950-JuneDec
1951-JuneDec
1952-JuneDec
1953-JuneDeo
1954-JuneDec
1955-JuneDec
1956-JuneDec
1957-JuneDec
1958-JuneDeo
1959-JuneDec
1960-JuneDec
1961-JuneDec
1962-JuneDec
1963-JuneDec
196i-JuneDec
1965-JuneDec
1966-JuneJuly
AugSeptOctNovDec
1967-JanFebMarAprMayJuneJulyAugSeptOctNovDeo
1968-JanFebMarAprMay
June p, .
.
279.8259.5
257.
i
256.7
255.3259.5
259.2
267.
i
266.1275.2
271.3278.8
27i.i280.8
272.8276.7
270.6275.0
276.4283.0
28i.8290.9
286.5
290.
i
289.2296.5
298.6
30i.0
306.
5
310.1
312.5318.7
3i7.9321.4
320. i319.8324.9325.3327.4329.9329.8
329.4330.1331.5328.3331.4326.7331.2336.4336.4341.0345.6345.2
346.8352.1350.0
347.5
352.9348.1
15.9
93.874.5
65.661.8
58.461.6
61.163.4
58.863.7
63.669.2
63.562.0
57.3
59.5
56.2
59.5
65.367.5
61.560.3
55.362.1
62.567.2
65.267.2
64.464.3
60.264.0
58.360.8
54.853.855.054.855.355.557.5
57.857.458.157.2
56.455.558.360.261.163.663.563.9
63.163.962.2
60.0
60.959.2
2.5
22.923.3
18.320.8
.13.0
23.8
22.924.7
24.725.9
25.024.9
23.624.8
23.824.9
23.024.2
25.426.3
26.026.6
26.527.4
27.328.9
29.730.8
32.033.6
34.837.0
39.140.8
42.242.442.542.943.043.944.3
43.544.044.945.546.146.746.846.646.947.448.949.1
49.149.049.7
50.550.6
52.2
6.5
28.030.9
37.839.2
41.042.3
44.345.9
47.648.3
49.349.6
50.551.7
53.554.0
55.655.2
55.954.4
54.653.7
55.355.1
56.154.5
56.5
55.6
58.458.0
61.160.6
63.461.9
66.766.469.369.268.0
68.968.8
68.269.670.770.474.675.875.577.2
76.475.976.2
76.0
74.776.475.9
75.8
78.379.1
135.1130.7
135.6134.9
132.9131.8
130.8133.4
135.0137.3
133.3135.1
136.7142.3
138.3138.2
135.9136.1
129.9134.8
142.6150.3
U9.3H5.8
U3.3U5.9
U7.3150.4
151.7154.3
156.4157.1
157.1158.0
156.7157.2153.1158.4161.1161.6159.3
159.9159.2157.3155.2154.3
U3.7150.6152.4152.0154.1157.0156.2
160.0162.8162.3161.3
163.1157.6
10.1
64.164.2
67.466.3
65.464.6
64.865.2
64.8
64.863.5
65.265.0
66.665.9
66.364.9
64.463.7
66.369.4
69.766.1
64.665.9
65.766.0
66.168.2
68.869.8
70.972.1
73.173.473.974.775.475.374.6
74.974.674.072.771.970.970.871.472.573. 2r
73. 9r
74. Or
74. 5r
75. 2r
75. Or75.2
75.474.8
30.8
30.3
34.534.5
34.534.7
34.935.3
36.036.7
37.538.2
39.340.1
40.941.4
41.541.6
42.142.5
42.642.4
42.542.9
43.644.2
44.645.1
46.046.7
47.347.9
48.348.8
49.249.349.449.449.549.749.8
49.850.050.150.2
50.350.450.550.650.650.750.850.9
50.951.0
51.051.0
51.1
51.1
1.9
12.5
13.9
15.415.1
14.614.4
14.113.8
13.212.7
12.111.7
10.910.2
9.48.7
7.66.6
5.95.2
4.5
3.5
3.12.7
2.52.2
2.01.8
1.51.4
1.21.0
.9
.8
.6
.6
.5
.5
.4
.4
.4
.3
.3
.3
.3
.2
.2
.2
.2
.2
.2
.2
.2
.1
.1
.1
.1
.1
,1
20.820.1
17.616.7
16.315.5
15.716.0
16.815.4
15.213.6
15.014.8
16.315.8
17.216.7
16.416.0
19.323.5
24.120.5
ia.6
19.5
19.019.2
18.620.1
20.320.8
21.622.5
23.323.524.024.825.425.324.5
24.724.323.722.321.420.420.220.721.722. 3r22 .9r
23. Or
23. 5r
24. Ir23. 8r24.1
24.3
23.7
Source: Office of Debt Analysis in the Office of the Secretary.1/ United States savings bonds, Series A-F and J, are included at
current redemption value.2/ Securities issued or guaranteed by the U. S. Government, excluding
guaranteed securities held by the Treasury.
2/ Consists of commercial banks, trust companies, and stock savingsbanks in the United States and in Territories and island possessions.Figures exclude securities held in trust departments.
6.3
24.424.9
19.818.7
17.116.5
15.716.0
16.0
15.9
15.415.3
15.014.6
13.613.2
12.712.5
12.212.7
:i2.6
12.5
12.011.9
11.411.4
11.411.5
11.011.3
10.911.1
10.
b
10.4
9.79.79.79.79.69.79.6
9.5
9.39.29.09.08.78.78.78.78.88.7
8.7
8.5
8.2
3.1
11.1
11.8
11.610.9
10.29.8
9.69.5
9.59.2
9.1
8.7
8.5
8.48.0
7.97.6
7.47.3
7.36.9
6.66.3
6.36.1
6.36.1
6.1
5.8
6.0
5.7
5.85.,
5.15.05.05.04.84.84.7
4.54.64.54.34.34.24.24.24.24.1i.P
4.2
4.14.24.24.1
4.1
4.0
2.2
19.9
15.3
18.419.7
20.120.7
18.8
19.9
18.621.5
16.519.1
18.623.2
17.318.7
16.117.7
14.118.1
1°.3
21.4
19.518.7
18.518.5
18.2
13.6
18.718.7
18.918.2
15.315.8
14.2
14.3
U.513.8
U.916.0
U.9
U.714.7U.l12.913.611.1
11.912.410.711.6r13. Or
12. 2r
13. 4r
14. 8r
14. 2r13.7
15.8
13.2
.4
6.76.3
8.78.8
9.49.6
10.411.1
12.012.7
13.9
14.4
U.715.4
16.116.3
16.816.6
16.316.5
16.918.0
18.818.7
19.319.0
20.120.1
21.521.1
22.521.2
24.1
24.525.125.025.225.2
25.125.0
24.825.025.125.225.125.024.725.124.924.624.525.1
25. 6r26. 4r27. Or26.8
26.7
26.5
2.42.1
3.5
4.3
4.24.3
4.75.3
5.75.9
6.06.3
6.S
7.5
7.9
7.8
7.67.6
6.57.7
10.112.0
12.313.0
12.713.4
U.l15.3
15.815.9
15.616.7
15.7io.7
15.415.3
15.415.215.2
15.4
U.5
14.0U.l14.515.015.0
U.7U.4U.3U.7U.816.215.
8
15.415.21'. .7r
14.714.0
13.0
4/ Includes partnerships and personal trust accounts.^ Discontinued series. See savings bonds tables.6/ Exclusive of banks and insurance companies.
2/ Consists of the investments of foreign balances and internationalaccounts in the United States.
8/ Consists of savings and loan associations, nonprofit institutions,corporate pension trust funds, and dealers and brokers.
2/ Immediate postwar debt peak. p Preliminary. r Revised.
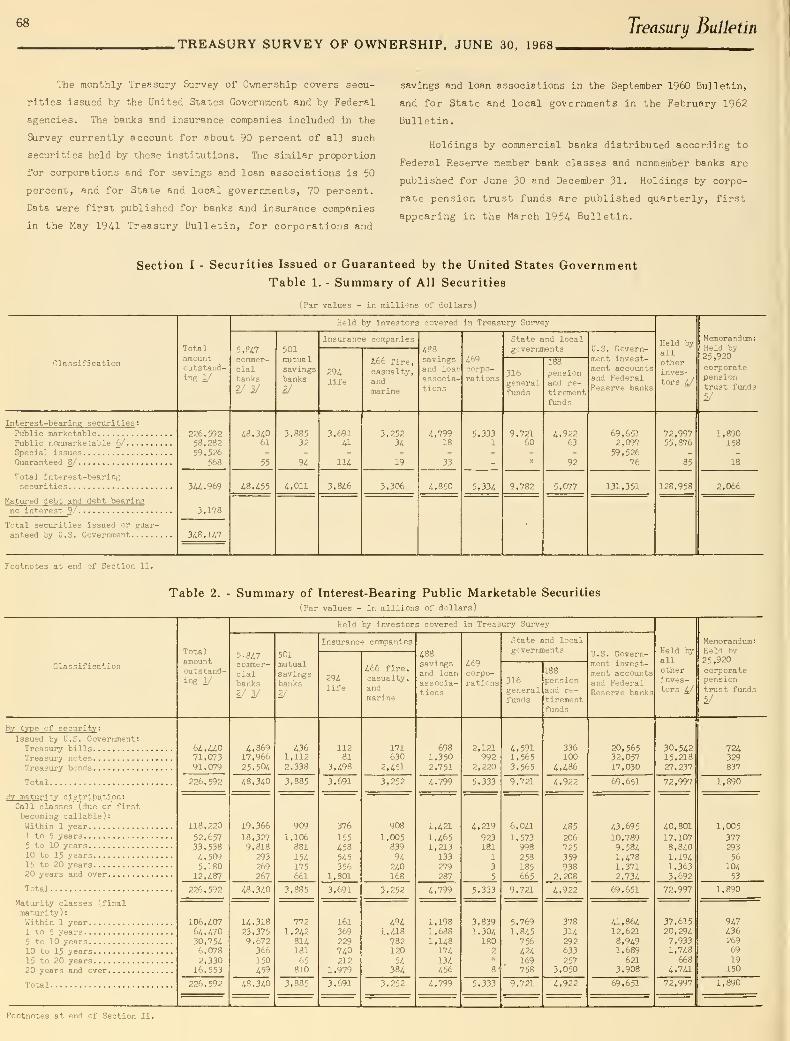
68
.TREASURY SURVEY OF OWNERSHIP, JUNE 30, 1968.
Treasury Bulletin
The monthly Treasury Survey of Ownership covers secu-
rities issued by the United States Government and by Federal
agencies. The banks and insurance companies included in the
Survey currently account for about 90 percent of all such
securities held by these institutions. The similar proportion
for corporations and for savings and loan associations Is 50
percent, and for State and local governments, 70 percent.
Data were first published for banks and insurance companies
in the May 1941 Treasury Bulletin, for corporations and
savings and loan associations in the September I960 Bulletin,
and for State and local governments in the February 1962
Bulletin.
Holdings by commercial banks distributed according to
Federal Reserve member bank classes and nonmember banks are
published for June 30 and December 31. Holdings by corpo-
rate pension trust funds are published quarterly, first
appearing in the March 1954 Bulletin.
Section I - Securities Issued or Guaranteed by the United States GovernmentTable 1. - Summary of All Securities
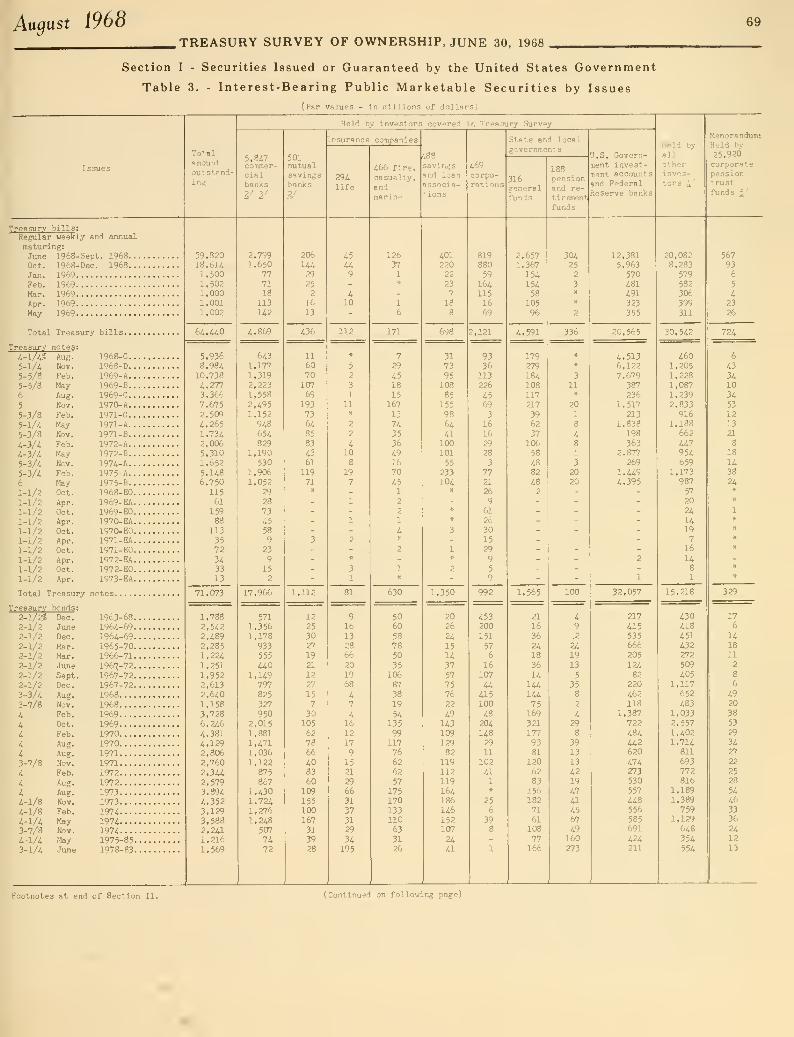
Aagust 1968.TREASURY SURVEY OF OWNERSHIP, JUNE 30, 1968
69
Section I - Securities Issued or Guaranteed by the United States Government
Table 3. - Interest-Bearing Public Marketable Securities by Issues
(Par values - in millions of dollars)
Totalamountoutstpnd-ing
Held by investors covered in Treasury Survey
5.847commer-cialbanks
2/2/
Insurance companies
501mutualsavingsbanks2;'
294life
^66 fire,
casualty,andmarine
^88savingsand loanassocia-tions
/.69
corpo-rations
State and localgovernments
316generalfunds
188pensionand re-tiresnenti'
funds
U.S. Govern-ment invest-ment accountsand FederalReserve banks
911
Otherinves-tors 4/
Memorandum;Held by
25,920corporatepensiontrustfunds 5/
Treasury bills :
Regular weekly and annual
maturing:June 1968-Sept. 1968.
.
Oct. 1968-Dec. 1968..
Jan. 1969Feb. 1969Mar. 1969Apr. 1969May 1969
Total Treasury bills. .
.
Treasury notes :
l-l/A% Aug. 1968-C..
5-lA Nov. 1968-D.
.
5-5/8 Feb. 1969-A.
.
5-5/8 May 1969-B.
.
6 Aug. 1969-C..
5 Nov. 1970-A..
5-3/8 Feb. 1971-C..
5-l/.i May 1971-A.
.
5-3/8 Nov. 1971-B.
.
4-3/4 Feb. 1972-A.
.
4-3/4 May 1972-B.
.
5-3/4 Ncv. 1974-A.
.
5-3/4 Feb. 1975-A.
.
6 Hay 1975-B.
.
1-1/2 Oct. 1968-EO.
1-1/2 Apr. 1969-EA.1-1/2 Oct. 1969-EO.1-1/2 Apr. 1970-EA.
1-1/2 Oct. 1970-EO.1-1/2 Apr. 1971-EA.
1-1/2 Oct. 1971-EO.
1-1/2 Apr. 1972-EA.1-1/2 Oct. 1972-EO.1-1/2 Apr. 1973-EA.
Total Treasury notes
Treasury bonds :
2-1/2^ Dec. 1963-68.2-1/2 June 1964-69.2-1/2 Dec. 1964-69.2-1/2 Mar. 1965-70.2-1/2 Mar. 1966-71.2-1/2 June 1967-72.2-1/2 Sept. 1967-72.2-1/2 Dec. 1967-72.
3-3/4 Aug. 1968. . .
.
3-7/8 Nov. 19684 Feb. 1969
4 Oct. 19694 Feb. 19704 Aug. 1970
4 Aug. 1971....3-7/8 Nov. 1971
4 Feb. 1972
4 Aug. 1972. . .
.
4 Aug. 19734-1/8 Nov. 19734-1/8 Feb. 19744-1/4 May 1974. . .
.
3-7/8 Nov. 19744-1/4 Hay 1975-85.3-1/4 June 1978-83.
39.82018.6141,5001.5021,0001,0011,002
64.440
5,9368.984
10,7384,2773,3667.6752.5094.2651.7342,0065.3101.6525.1486.750
11561
15988
113
3572
343313
71.073
1.7882.5422.4892,2851.2241.2511,9522.6132.6401.1583.7286,2464.3814.1292,8062,7602,3442,5793.8944.3523.1293.5882.2411.2161.569
2,7991,650
777118
113
142
4.8
6431,1771.3192,2231,5582,4951,152948654829
1,190530
1,9061.052
29
28
73
i558
923
9152
17.966
571
1,3561,178933555440
1,149797825
327
9502.0151,8811,4711,0361,122
875867
1.4301.7241,2761.248
507
7472
206
14429
25
2
16
13
436
11
6070
107
69
193
736485
83
4361
11971
1.112
12
25
3027
1921
12
27
15
7
30105627866
408360
109
15510016731
3928
45449
410
112
5
2
3
1
11»
2
2
4108
197
1
1
2
81
916
132866
20
1968
47
4161217
915a2966
31
3731
29
34195
12637
1
7
29
4518
15167
13
7435
36
491670
451
2
2
1
4
630
5060
58
7850
3510687
3819
54135
9911776
6262
57
1751701331106331
26
40122022
23
7
18
698
31
73
9510885
155
9864
41
100101
55
233104
1,350
2026
24
15
14
37
57
757622
4914310912982
119112119164186146152107
24
a
81988059
16411516
69
9336
113226
4569
3
16
1629
28
3
7721
26
96126
301529
95
9
992
453200151
576
16107
4441510048204
1482911
102
a1
256
39
2.6571,367
15415458
10596
4,591
179279
184108117217
396237
10658
4882
482
1.565
21
16
36
2418
36
1414414475169321177
9381
1206283
15618271
61
10877166
304252
3
336
3
11
20
1
8
48
1
3
2020
100
49.2
2419
13
5
358
2
429
8
3913
134219
47a456749
160273
12,3815,963
570481491323
355
20.565
4.5136,1227,679
387
2361.517a3
1.838198363
2.877269
1.4494.395
32,057
217
a5535666205
12482
220462118.387722484U2620
474273530
557448556585691
424211
20,0828,283
579582306
399311
30,542
4601,2051,2281,0871.2392.833916
1.188662
447954659
1.17398757
20
2414197
16
14
15.218
430418451
432272
509
4051.117
652483
1.0332.5571.4021.714
811
693772816
1.1891.389759
1,129648354554
567936
5
423
26
724
6
43
34103453
1213a8
18
143824
329
141811
2
8
6
49203853
29
3427
22
2528
5446
3336241213
Footnotes at end of Section II. (Continued on following page)
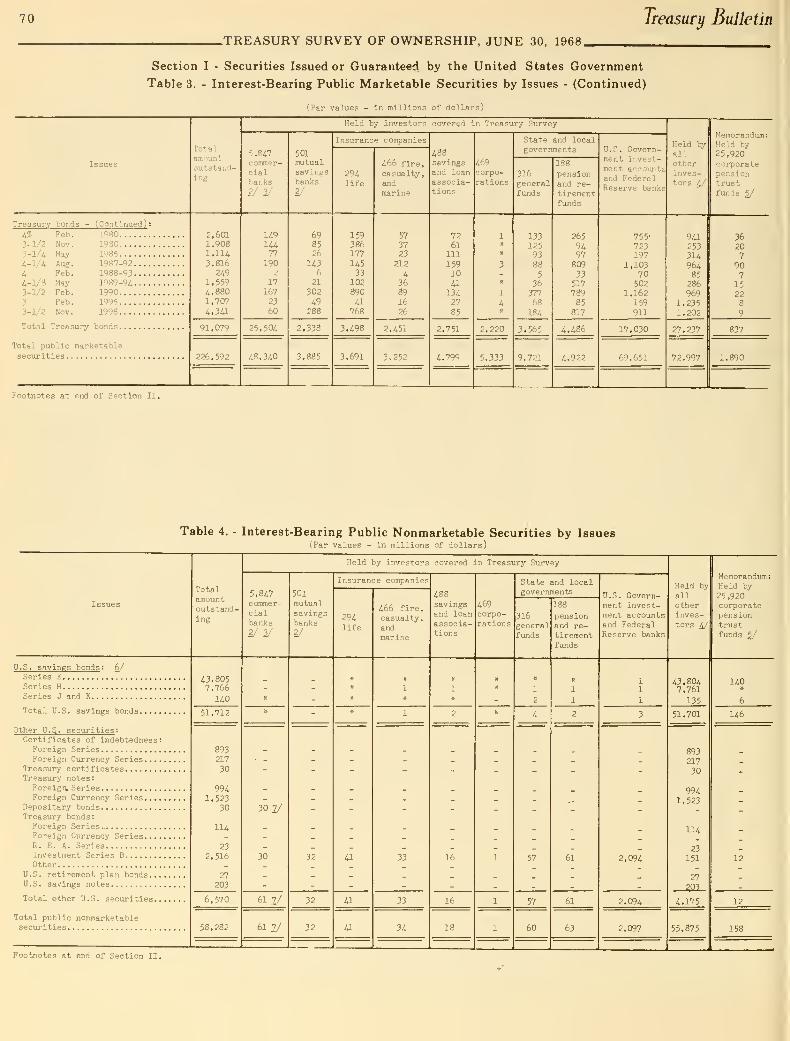
70 Treasury Bulletin
.TREASURY SURVEY OF OWNERSHIP, JUNE 30, 1968.
Section I - Securities Issued or Guaranteed by the United States Government
Table 3. - Interest-Bearing Public Marketable Securities by Issues - (Continued)
(Par values - in millions of dollars)
Issues
Totalamountoutstand-ing
Held by investors covered in Treasury Survey
5,Si?commer-cialbanks
501mutualsavingsbanks2,'
Insurance companies
29ilife
^ho fire,
casualty,andmarine
488savingsand loanassocia-tions
corpo-rations
State and localgovernments
316generalfunds
188
pensionand re-tirementfunds
U.S. Govern-ment invest-ment accountand FederalReserve banks
Held by
allotherinves-tors ^
Memorandum:Held by25,920corporatepensiontrustfunds ^
Treasury bonds - (Continued)
i,% Feb. 19803-1/2 Nov. 1980
3-lA May 1985
i-lA Aug. 1987-92...
A Feb. 1988-93...4-1/8 May 1989-94...3-1/2 Feb. 1990
3 Feb. 19953-1/2 Nov. 1998
Total Treasujy bonds
Total public marketablesecurities
601908,1U,816249559880707
,341
91,079
226,592
14914477
190
17
167
23
60
25.504
48,340
698526
1436
21
302
49283
2.338
3.885
159386177
14533
102
890
a768
3,498
3,691
57
3723
212
4368916
26
2,451
3,25?
7261
111
1591041
13427
85
2.751
4.799
2,220
5.333
1331259388
5
36
37768
184
3,565
9.721
265
9497809
33517
78985
817
4,486
4.922
755'
723197
1,10370502
1,162159
911
941253314
96485
286969
1,2351.202
17.030 27.237
69.651 72.997
36207
907
1522
837
1,890
Footnotes at end of Section II.
Table 4. Interest-Bearing Public Nonmarketable Securities by Issues(Par values - in millions of dollars)
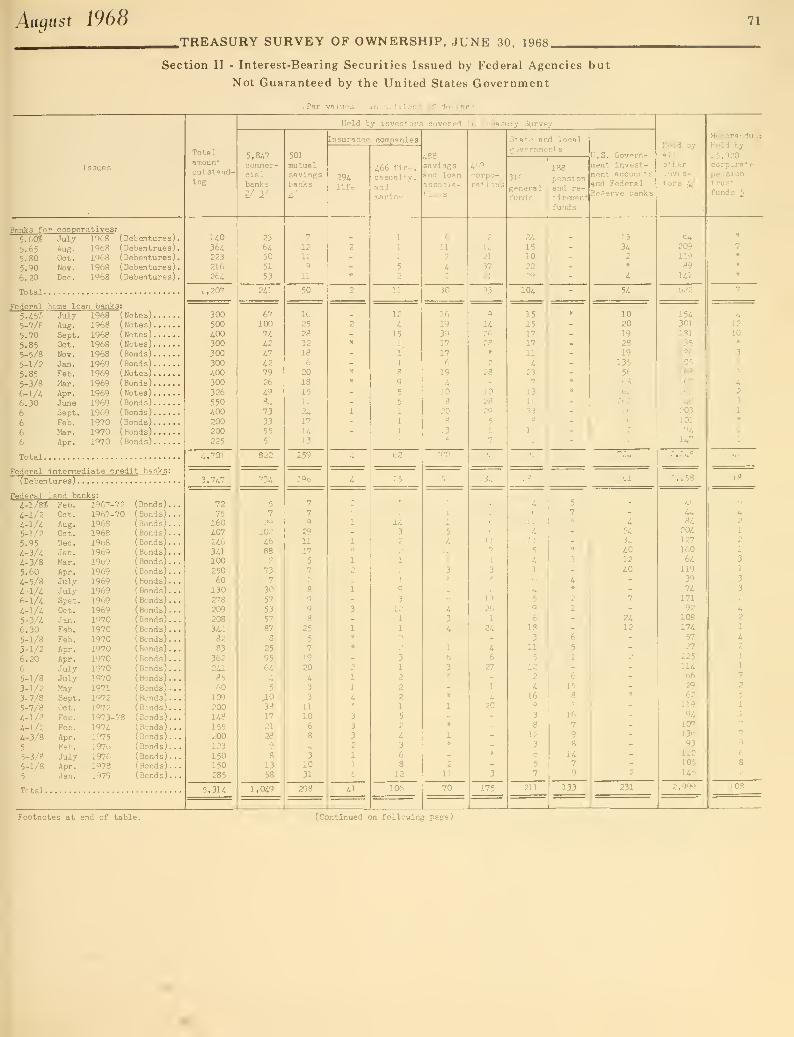
Aaqust 1968 71
.^TREASURY SURVEY OF OWNERSHIP, JUNE 30, iQfl«
Section II - Interest-Bearing Securities Issued by Federal Agencies but
Not Guaranteed by the United States Government
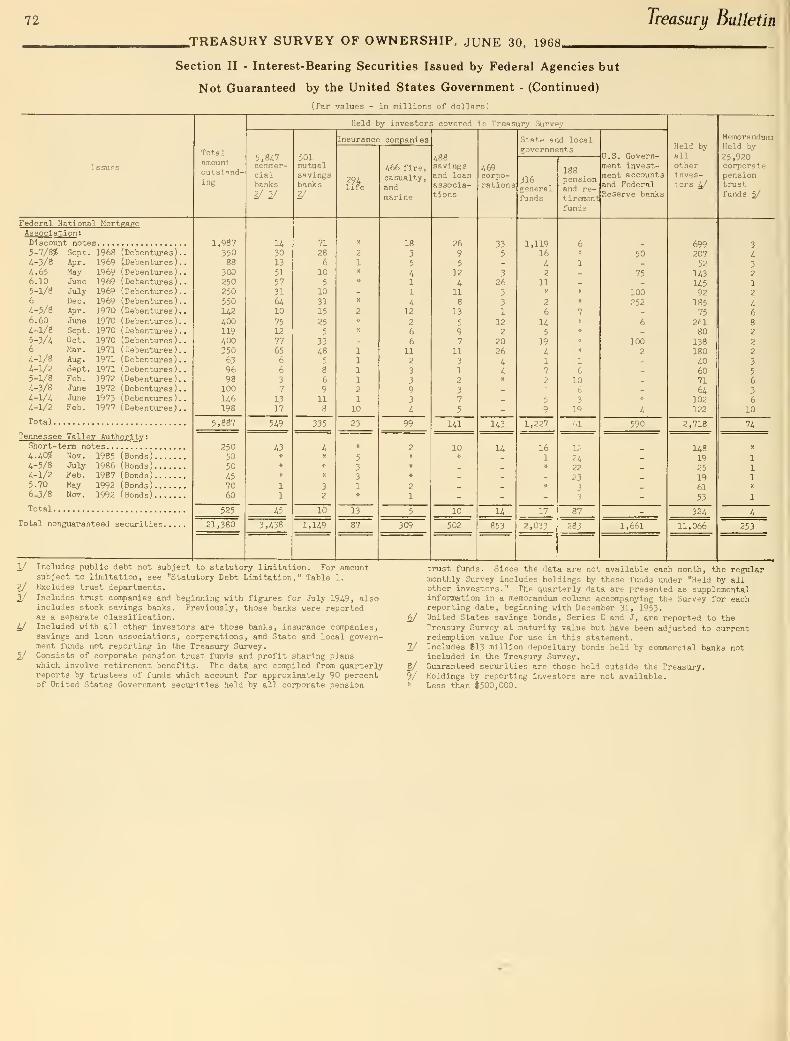
72 Treasury Bulletin
.TREASURY SURVEY OF OWNERSHIP, JUNE 30, 1968.
Section II - Interest-Bearing Securities Issued by Federal Agencies but
Not Guaranteed by the United States Government - (Continued)
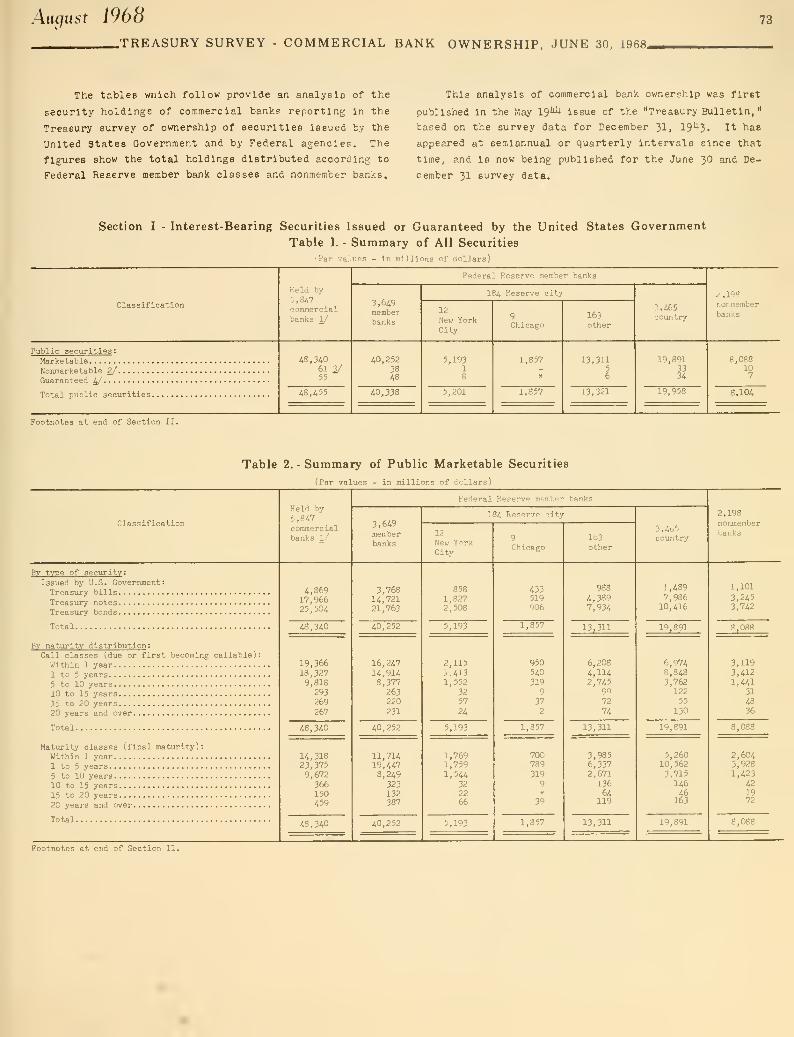
August 1968
TREASURY SURVEY - COMMERCIAL BANK OWNERSHIP, JUNE 30. 1968^
73
The tables wnlch follow provide an analysis of the
security holdings of commercial banks reporting In the
Treasury survey of ownership of securities Issued by the
United States Government and by Federal agencies. The
flsTires show the total holdings distributed according to
Federal Reserve member bank classes and nonmemcer banks.
This analysis of commercial bank ownership was first
published In the May 194M- issue of the "Treasury Bulletin, *
based on the survey data for December 31, 19'+3. It has
appeared at semiannual or quarterly Intervals since that
time, and Is now being published for the June 30 and De-
cember 31 survey data.
Section I - Interest-Bearing Securities Issued or Guaranteed by the United States Government
Table 1. - Summary of All Securities
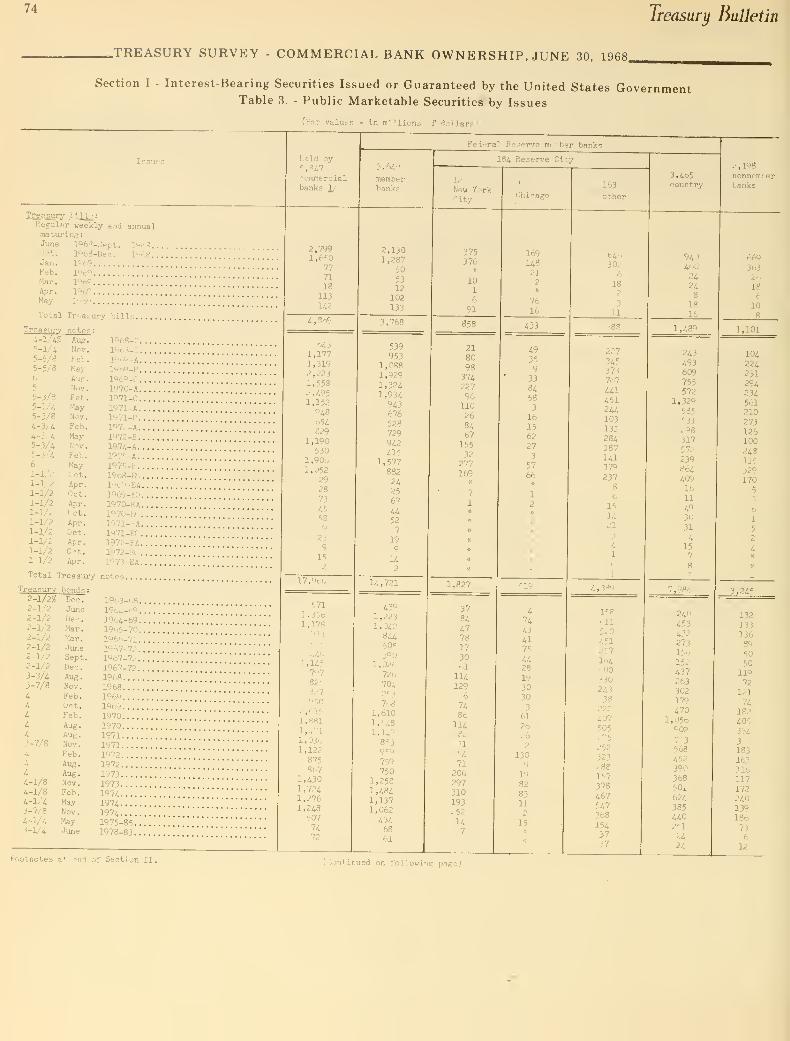
74Treasury Bulletin
.TREASURY SURVEY - COMMERCIAL BANK OWNERSHIP, JUNE 30 1968
Section I - Interest-Bearing Securities Issued or GuaTanteed by the United States GovernmentTable 3. - Public Marketable Securities by Issues
(Par values - In millions of dollars)
Iss
Treasury b,111_^
:
Regul'ir ueekly and annualmatui'ing:
June 1965-Sept. 1963..1968-Deo. 1968..196919691969lOc"
1969
Oct.
Jan.Feb.Mar.
Apr.Hay
Total Treasury bills
Treasury notes :
5-lA5-5/85-5/86
5
5-3/85-1/45-3/8
4-3/i
5-3/45-3/461-1/^1-1/21-1/21-1/21-1/21-1/21-1/21-1/21-1/21-1/2
Aug.
Nov.
Feb.MayAug.
Nov.Feb.
MayNov.Feb.
MayNov.Feb.
MayOct.Apr.
Oct.
Apr.Oct.
Apr.Oct.Apr.
Oct.
Apr.
196S-C.
1968-D.
,
1969-A.
.
1969-B..1969-C.1970-A.
.
1971-C..1971-A..1971-B..197:.-A.
.
1972-B .
.
1974-A.
.
1975-A.
.
1975-B.
.
1968-EO.1969-EA.1969-EO
.
1970-EA.1970-EO.1971-KA.1971-EG.1972-EA.1972-EO
.
1973-EA.
Total Treasury notes.
Treasury2-1/2^2-1/22-1/22-1/22-1/22-1/22-1/22-1/2
3-3/43-7/8
44444
3-7/8
4444-1/84-1/84-1/43-7/84-1/43-1/4
bondsDec.
JuneDec.
Mar.
Mar.JuneSept.
Dec.
Aug.Nov.
Feb.Oct.Feb.
Aug.
Aug.
Nov.
Feb.Aug.
Aug.
Nov.Feb.
MayNov.
MayJ\ine
1963-68.1964-69
.
1964-69.1965-70.1966-71.1967-72.1967-72.1967-72.19681968196919691970197019711971197219721973
19731974197419741975-85..1978-83..
Held hy'".,847
commercialbanks 1/
2,799i,6';o
777118
113
142
4,8o9
64 3
1,1771,3192,223l.'.SS
2,4^51,1'^?
•148
ii54
826
1,1905,(0
l,QOu1,0S.7
?9,•8
7J
4-J
17,96(.
571
1,3561,178^33
4401,145
7978253:"'
7
'.I'l:"
l,,^ftl
1,,711,0361,122
8758h7
1,430l,7,-'4
1,2761,248
507
7472
3,649
memberhanks
2,1301,287
50
5312
102
133
3,768
1,0881,Q29
,3241,9 V.
943676528729
94241;
1,577882
2425
67
4452
7
19
9
14
14,721
4391,2231,042844505390
1,026726
704253768
1,6101,5481,147
853959759750
1,258
1,4841,1371,062
4346861
Federal Re.-erve mt";iibar banks
184 Reserve Cloy
12
New Yorkrity
375376
%
101
6
91
858
21809837422796110268467
15532
277169
»
7
1
1,827
3784477817
3061
114129
6
7486
11482
n
71
206297310193252147
169
14821
2
7616
433
35
9
33
8458
3
16
156227
3
5766
1
2
474
4341
75
4428
19
3030
3
61
26262
130
9
1982
83112
15
Footnotes a» --nd of Section II.
163
other
646302
6
182
3
11
-88
227
345373767
441451244103
131284187141379
2373
6
15
1421
3
41
4,3:-!
15?
oil520
451257I64500
33024338
.'22
407505275252323288157378467547368
1543737
3,465country
9404' .0
24248
1816
1,489
243
493609755572
1,329585
531236317572
239864409lb11
493031
415
7
7,98i;.
240453
156152437263302179470
1,05690?
763568
452390368501
6243854402512424
2 , 198nonmemberbanks
66Q
36326186
10
8_
1,101
104
224231294234561210273126100
248115
329170
5
3
6
1
5
2
4
3,245
132
13313689
5050
11°
72
121
74
182
405
334
3
183
163116117172
240139186
736
12
(Continued on following page)
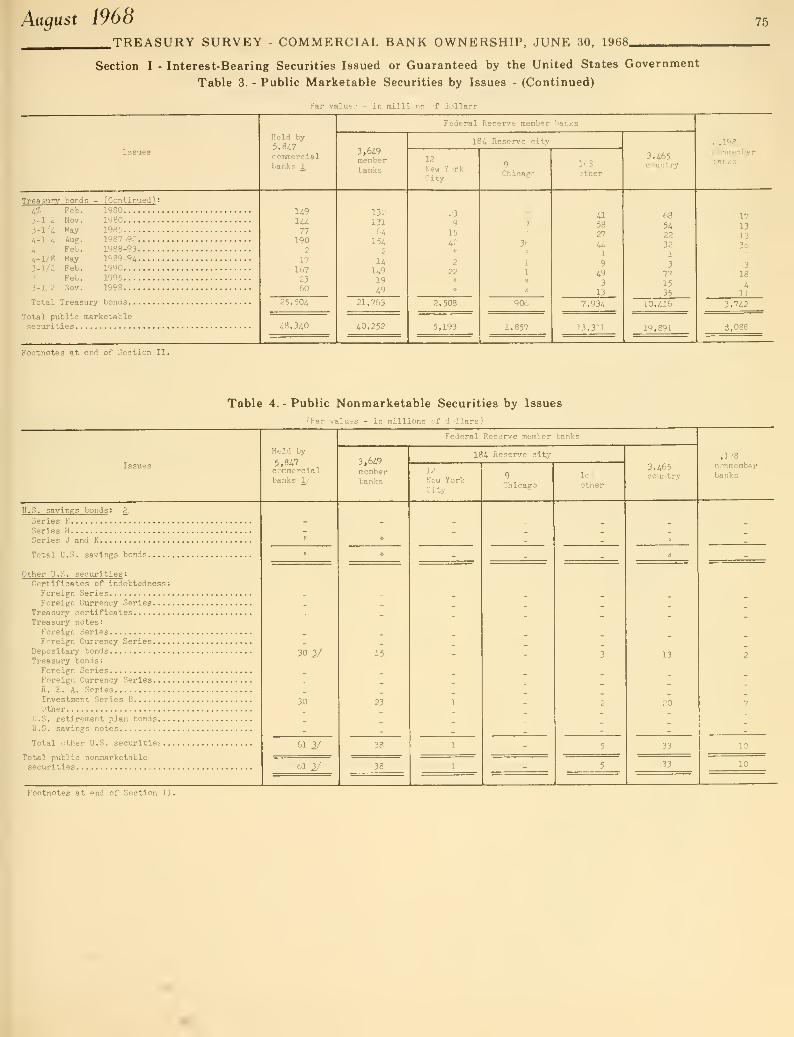
Aagust 1968 75
TREASURY SURVEY - COMMERCIAL BANK OWNERSHIP, JUNE 30, 1968.
Section I - Interest-Bearing Securities Issued or Guaranteed by the United States Government
Table 3. - Public Marketable Securities by Issues - (Continued)
t Par values - in millions of dollars)
Issues
Treasury bonds - (Continued) :
1% Feb. 19803-1/2 Nov. 1980
i-l/i. May 1985
4-1/i Aug. 1987-9?
i Feb. 1988-934-1/8 May 1989-943-1/2 Feb. 1990
3 Feb. 19953-1/2 Nov. 1998
Total Treasury bonds
Total public marketablesecurities
Footnotes at end of Section II
.
Held by
5.847commercialbanks 1/
149
14477190
2
171672360
25,504
48.340
Federal Reserve member banks
3,649memberbanks
13213164
1542
141491949
21.7d3
40,252
184 Reserve city
12
New YorkCity
23
9
15
42
2
22
2.50S
5,193
Chi^Qfr'*
36
90n
i ,857
163other
41
58
27
441
949
3
13
7,934
13.311
3.465countrv
68
5422321
3
77
15
35
10,416
19,891
.-',193
nonmember
17
13
1336S
3
18
411
3.742
Table 4. - Public Nonmarketable Securities by Issues
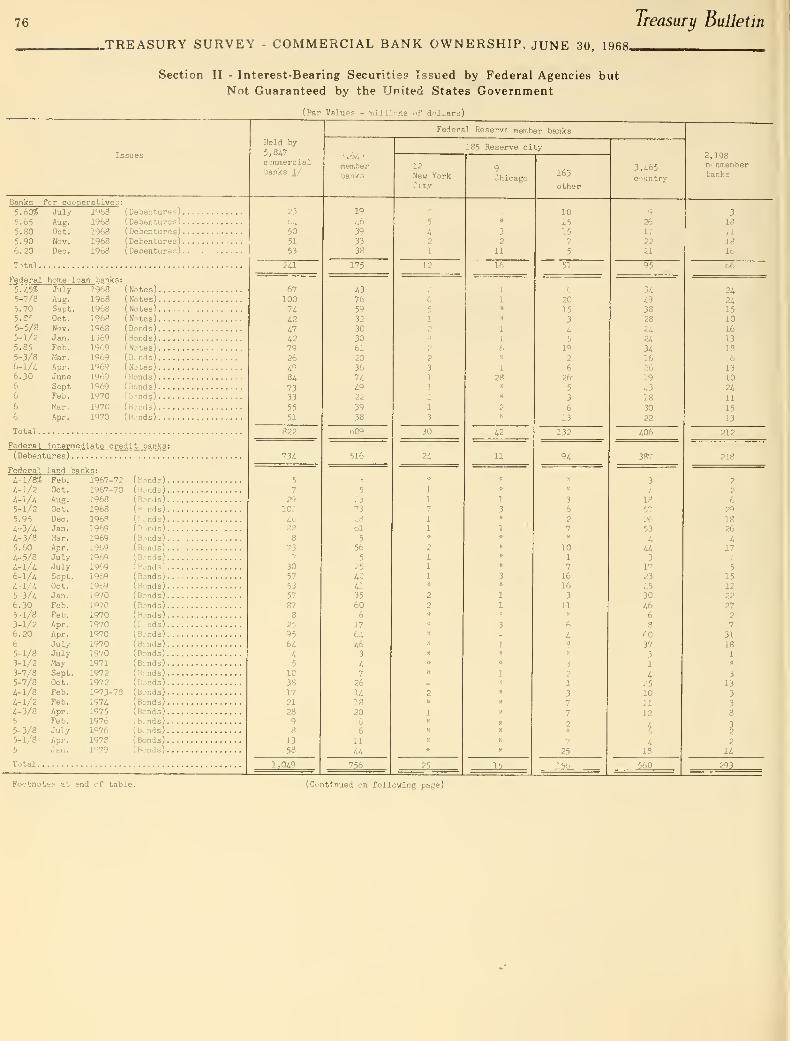
76 Treasury Bulletin
.TREASURY SURVEY - COMMERCIAL BANK OWNERSHIP, JUNE 30, 1968.
Section II - Interest-Bearing Securities Issued by Federal Agencies but
Not Guaranteed by the United States Government
(Par Values - millions of dollars)
Issues
Banks fcr cooperatives5.60
5.655.805.906.20
Total.
JulyAug.
Oct.
Nov.
Dec.
19681968196819681968
(Debentures)
.
(Debentures).(Debentures)
.
(Debentures)
.
(Debentures)
.
Federal home loan banks:
5.15%5-7/8
5.705.8'
5-5/85-1/25.855-3/8
6-1/i6.306
6
6
6
Total
.
JulyAug.
Sept.
Oct.
Nov.
Jan.
Feb.
Mar.
Apr.
Jxine
SeptFeb.
Mar.
Apr.
196819681968196819681969
196919691969196919691970
1970
1970
(Notes).
(Notes).(Notes).
(Notes).(Bonds).
(Bonds).(Notes).
(Bends).(Notes).(Bonds).
(Bonds),(bonds)
.
(Bonds).
(Bonds).
Federal intermediate credit banks :
(Debentures)
Federal land banks:
i-l/8«i-1/2A-l/A5-1/2
5.954-3/44-3/85.604-5/84-1/46-1/44-1/45-3/46.305-1/83-1/26.206
5-1/83-1/23-7/85-7/84-1/84-1/24-3/85
5-3/S5-1/8
5
Feb.
Oct.
Aug.
Oct.
Dec.Jan.
Mar.
Apr.
JulyJulySept.
Oct.
Jan.
Feb.
Feb.
Apr.
Apr.
JulyJulyMaySept.
Oct.
Feb.
Feb.
Apr.Feb.
JulyApr.
Jan.
1967-721967-70196819681968196919691969196919691969196919701970197019701970197019701971
197219721973-78
197419751976197619781979
(Bonds).
(Bonds).(Bonds).(Rends).
(Bonds).(Bonds).
(Bonds).(Bonds).(Bonds).(Bonds).(Bonds).(Bonds).(Bonds).
(Bonds).(Bonds),(bonds).(Bonds).
(Bonds).(Bonds).(Bonds).
(Bonds).(Bonds).(Bonds).
(Bonds).(Bonds).(Bonds).(Binds).(Bonds).
(Bonds).
Total.
Held by
5,847commercialbanks 1
/
50
51
53
241
67
100744247427926
49
84
7333
55
51
5
7
29
10246
73
3057
53
57
87
8
25
956445
10381721
28
98
13
5S
1 . 049
3.649
memberbanks
19
46
39
3338
4376
59
32
303061
20
36
744922
39
33
i
5
23
732861
5
56
5
25
4241
3560o
17
64463
4
7
26
1418
2066
11
U756
Federal Reserve meir,ber banks
185 Reserve city
12
New YorkCity
2^
9Chicago
3
11
1
1
6
1
28
J^
163
other
10
15
15
7
b
20
15
3
45
19
2
626-
5
3
6
13
132
3
6
2
7
101
716
16
3
11
6
4
_i5b.
3,465country
26
17
<?5
34
49
3828
2424
341626
19
4318
30
22
40'.
38-
3
4
18
57
26
53
4U3
17
23
2530
4668
60
37
31
42510
11
12
45
418
560
2,198nonmemberbanks
3
18
il
1816
24
241510
16
1318
6
13
10
24
11
15
2
?
6
29
1826
417
1
5
15
12
22
27
2
7
31
18
1n
3
13
3
3
8
32
2
14
Footnotes at end of table. (CLintinued on following page)
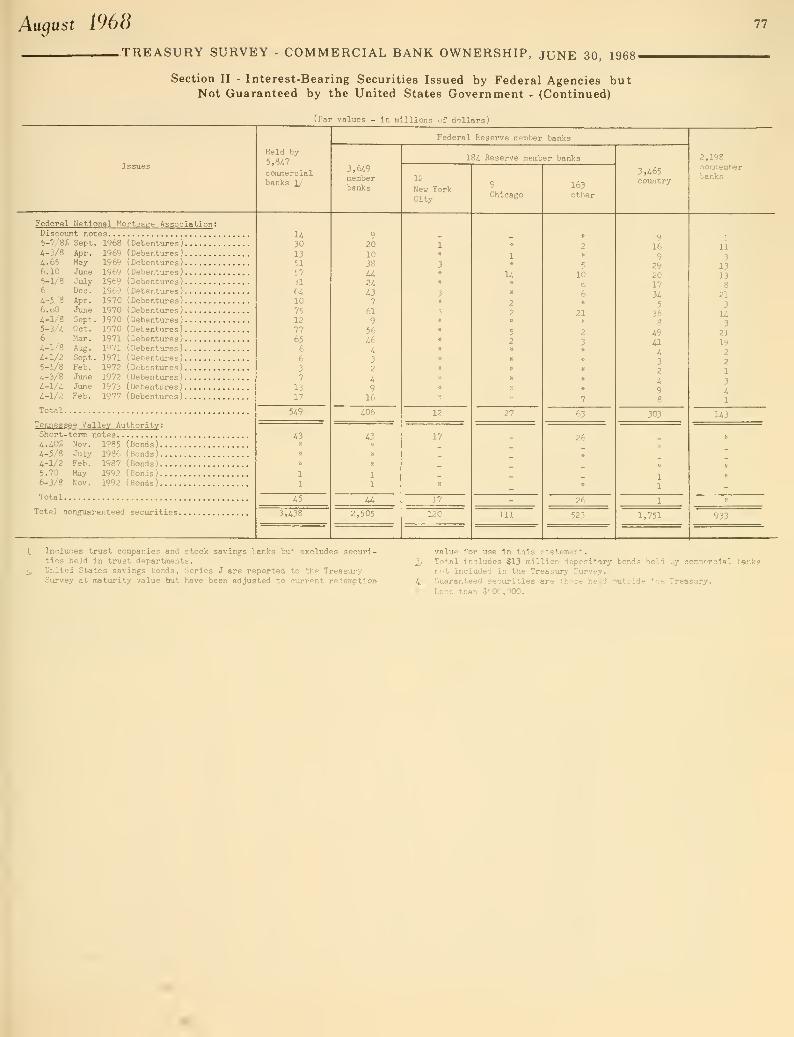
August 1968
.TREASURY SURVEY - COMMERCIAL BANK OWNERSHIP, JUNE 30, 1968-
Section II - Interest-Bearing Securities Issued by Federal Agencies butNot Guaranteed by the United States Government - (Continued)
(r&r values - in millions of dollars)
h' Includes trust corapanies and stock savings banks but excludes securi-ties held in trust departments.
^ United States savings bonds. Series J are reported to the TreasurySurvey at maturity value but have been adjusted to current redemption
77
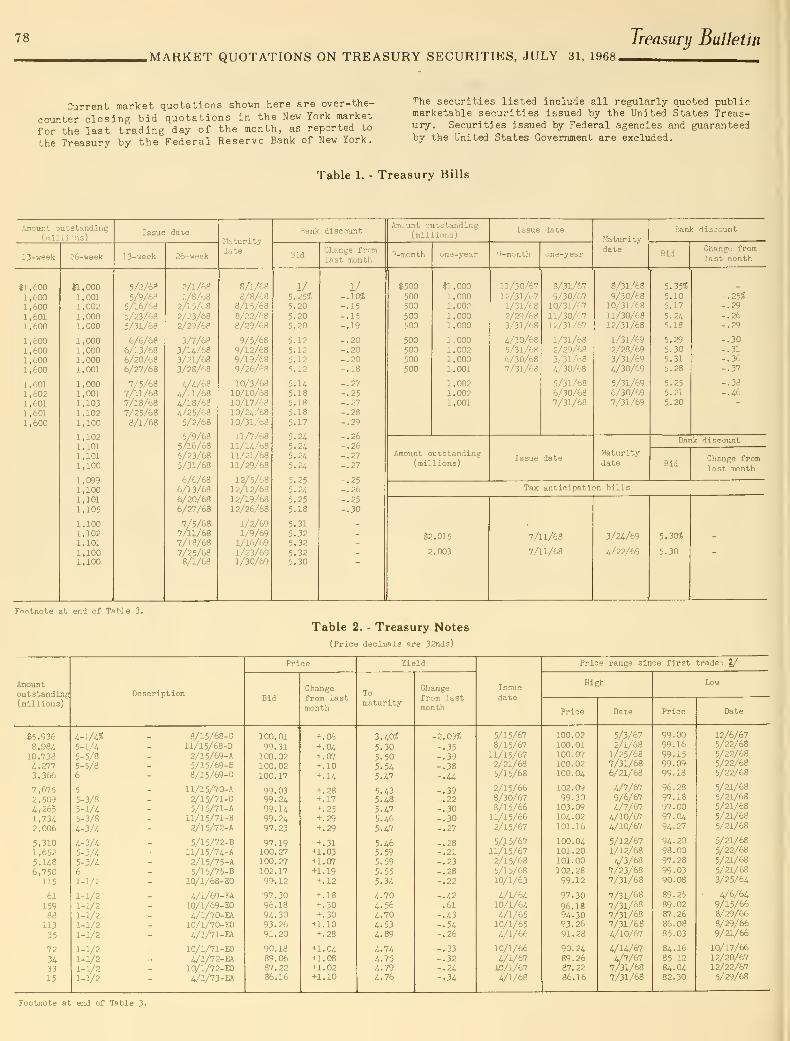
78
.MARKET QUOTATIONS ON TREASURY SECURITIES, JULY 31, 1968.
Treasurij Bulletin
Current market quotations shovm here are over-the-
counter closing bid quotations in the New York market
for the last trading day of the month, as reported to
the Treasury by the Federal Reserve Bank of New York.
The securities listed include all regularly quoted publicmarketable securities issued by the United States Treas-ury. Securities issued by Federal agencies and guaranteedby the United States Government are excluded.
Table 1. - Treasury Bills
Amount outstanding(miili ^ns)
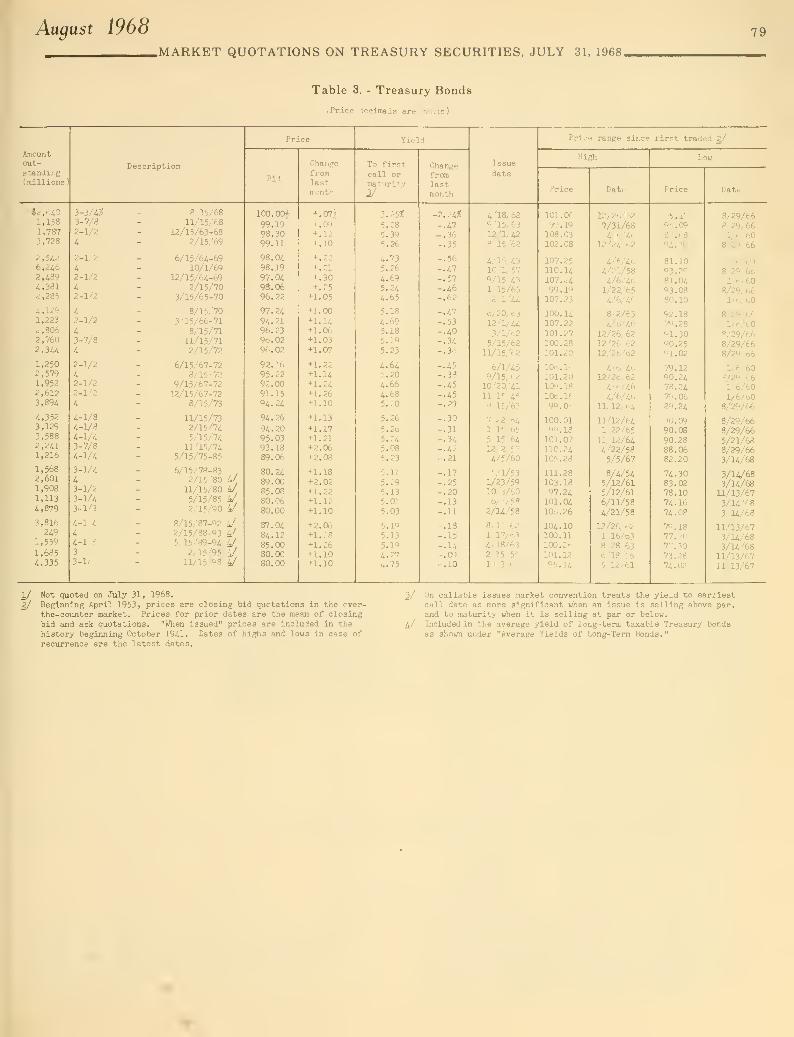
August 1968 79
.MARKET QUOTATIONS ON TREASURY SECURITIES, JULY 31, 1968.
Table 3. - Treasury Bonds
(Price decimals are 320^3)

80 Treasury Bulletin
MARKET QUOTATIONS ON TREASURY SECURITIES, JULY 31. 1968

August 1968AVERAGE YIELDS OF LONG -TERM BONDS
81
Table 1. -Average Yields of Treasury and Corporate Bonds by Periods
(Percent per annum)
-rea^^ury
bonds 1/
Moody ' s Aa
corporatebonds
Treasurybonds 1/
Moody's Aaa
corporat'-
bonds
Treasurybonds 1
'
Moody' s Aga
corporatebonds
Ar;nu^.l series - calendar year averages of monthly series
IV-W19i519i619i719i8194919501951
2.4-8
2.372.192.25
2.U2.312.322.57
2.622.532.612.822.662.622.86
IV 5 3
195419551956
195719581959
.55
.84
.03
.47
434.08
2.961
,
202 , 903.063.3fc
3.89
4.38
19601<=61
1962
19631964196519'30
14d7
4.02
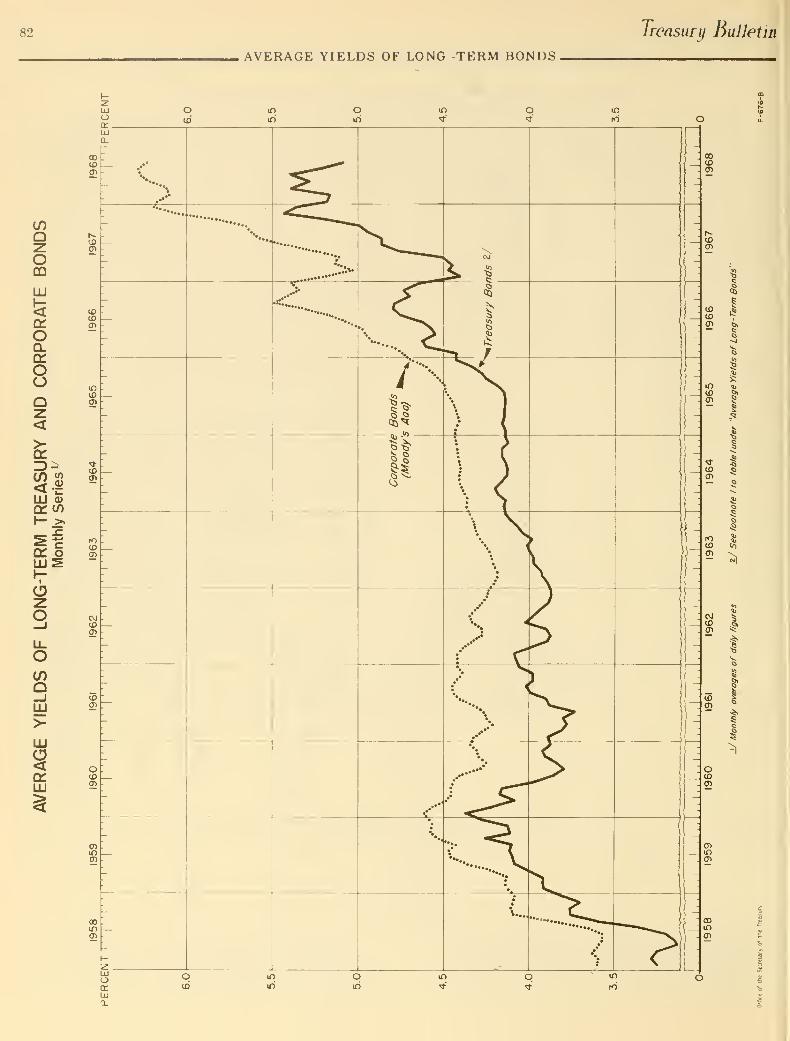
82 Treasury Bulletin
AVERAGE YIELDS OF LONG -TERM BONDS,
ooQQ
LU
OHoa.(X.
8
(/)Q_iUJ>-
UJ
LU
3
Q

August 1968 83
INTERNATIONAL FINANCIAL STATISTICS.
The tables in this section are designed to provide data
on United States reserve assets and liabilities and other
statistics related to the United States balance of payments and
international financial position. A number of changes were
introduced in the May 1967 Bulletin to increase the usefulness
of this section.
Table 1 has been revised to include in the reserve assets
of the United States its reserve position in the International
Monetary Fund. In accordance with Fund policies the United
States has the right to draw foreign currencies equivalent to
this amount virtually automatically if needed. (Under appro-
priate conditions the United States could draw additional
amounts equal to the United States quota of $5,160 million.)
This revised presentation corresponds to the treatment of
United States monetary reserves in the United States balance of
payments accounts.
Table 2 brings together the various statistical components
of the liabilities which enter into the United States balance
of payments calculated on the liquidity basis. The inclusion
of the United States reserve position in the International
Monetary Fund in Table 1 requires that the "holdings of
dollars" of the Fund be excluded from the data on liabilities
to foreigners, in order to avoid double counting. For further
explanation of this change in the liabilities statistics, see
headnote to "Capital Movements" section.
Table 3 (formerly Table 5), presenting an area breakdown
of United States liquid liabilities to official institutions
of foreign countries, has been revised to include holdings of
convertible nonmarketable United States Government securities
with an original maturity of more than one year.
Table <V (formerly Table 2) is virtually unchanged and
shows United States Treasury nonmarketable bonds and notes
issued to official institutions of foreign countries.
Table 5 sets forth the factors which affect the United
States position in the International Monetary Fund.
Table 6 (formerly Table 3) presents United States net
monetary gold transactions with foreign countries and inter-
national and regional organizations. The former Table U,
which presented the estimated gold reserves and dollar holdings
of foreign countries and international institutions, was
discontinued in the May 1967 Bulletin.
Table 1. - U.S. Reserve Assets: Gold Stock, Holdings of Convertible Foreign Currencies,
and Reserve Position in the International Monetary Fund
', In millions of dollars)
End of
calendar yearor month
Totalreserveassets
Gold E'_ock 1/
Total
2/
Cunvert-ible
foreigncurrencies
1/
Reserveposition in
InternationalMonetary Fund
V
1959.1960.
1961.
1962.
1963.
1964.
1965.
1966.1967.
Iv67-JulyAugust. . . .
Septemoer.
October. .
.
November.
.
December.
.
1968-January..
.
February.
.
MarchAprilMayJune
July.
24,83222,54021,50419,35918,75317,22016,84316,672
15,45014,882U,830
14,224
U,60514,64914,92715,43814,830
14,62014,790
13,92613,84014,348
U.063
14,366
22,85720,58219,50717,80416,94716,05715,59615,47113,806 y13,23512,065
13,13613,07513,07713,03912,965
12,065
12,00311,900
10,703
10,54710,468
10.681
10,676
22,7R1
20,53..
19,45617,76716,88915,97815,51315,38813,733 y13,15911,982
13,10813,00813,00612,90512,90811,982
11,98411,882
10,484
10,484
10,38410,367
10,367
116
99212
432781
1,321
2,345
719
1,1621,2001,5092,092
2,345
2,1762,235
2,746
2,804
3,3862,479
2,773
1,997
1,5551,6901,0641,035769863 y326420
369368372379
381
420
441655
477
489
494
903
917
1/ Includes gold sold to the United States by the International Monetary ^Fund with the right of repurchase, and gold deposited by the Interna-tional Monetary Fund to mitigate the impact on the U.S. gold stock offoreign purchases for the purpose of making gold subscriptions to theFund under quota increases. For corresponding liabilities see Table 2.
2/ Includes gold in Exchange Stabilization Fund, which is not included in yTreasury gold figures shown in daily Treasury statement. See "Accountof the Treasurer of the United States," Table 4.
y Includes holdings of Treasury and Federal Reserve System.
In accordance with Fund policies the United States has the right to
draw foreign currencies equivalent to its reserve position in theFund virtually automatically if needed. Under appropriate conditionsthe United States could draw additional amounts equal to the UnitedStates quota. See Table 5.
Reserve position includes, and gold stock excludes, $259 million goldsubscription to the Fund in June 1965 for a U.S. quota increase whichbecame effective on February 23, 1966. In figures published by the
Fund from June 1965 through January 1966, this gold subscription wasincluded in the U.S. gold stock and excluded from the reserve position.

84
INTERNATIONAL FINANCIAL STATISTICSTreasury Bulletin
Table 2. - U.S. Liquid Liabilities to Foreigners
(In millions of dollars)
End ofcalendar yearor month
Totalliquidliabil-itiesto allfor-eigners
Liabilities to InternationalMonetary Fund arising fromgold transactions
Golddeposit1/
Goldinvest-ment
Liabilities to foreign countries
Official institutions ^Short-
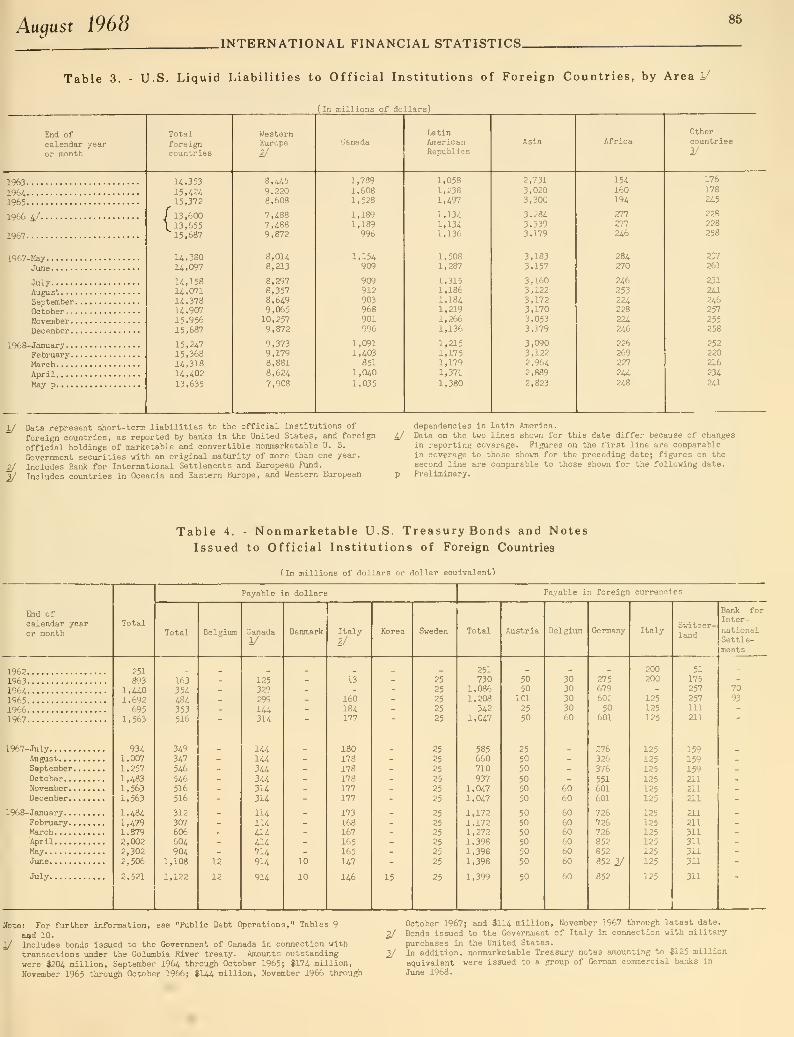
August 1968.INTERNATIONAL FINANCIAL STATISTICS.
85
Table 3. - U.S. Liquid Liabilities to Official Institutions of Foreign Countries, by Area 1/
(in millions of dollars)
End of
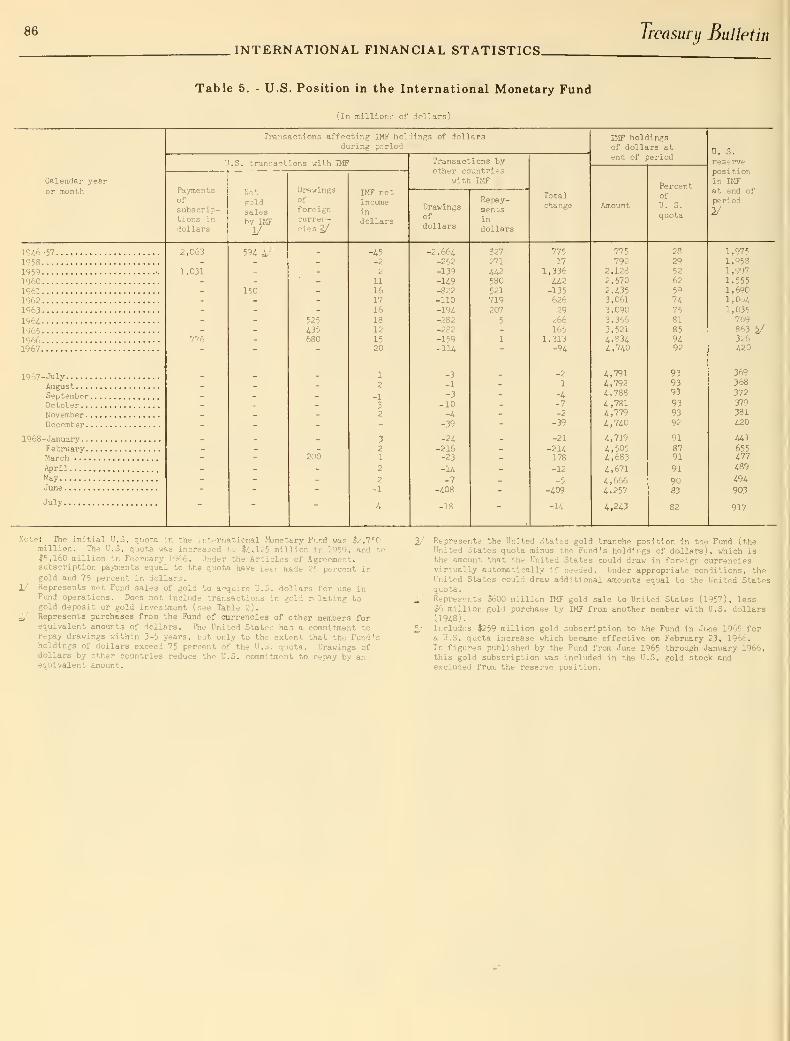
86
INTERNATIONAL FINANCIAL STATISTICS.Treasury Bulletin
Table 5. - U.S. Position in the International Monetary Fund
(In millions of dollars)
Calendar yearor month
Transactions affecting IMF holdings of dollarsduring period
U.S. transactions with IMF
Paymentii
of
subscrip-tions in
dollars
i^et
goldsalesby IMF1/
Drawingsof
foreigncurren-cies 2/
IMF netincome
dollars
Transactions by'"t'>i> r countries
with IMF
Drawingsofdollars
Repay-mentsin
dollars
Totalchange
IMF holdingsof dollars atend of period
Percentof
U. S.
quota
U. S.
reservepositionin IMFat end ofperiod
2/
19i6-5V19531959I960196119621963
196i1965
19661967
1967-JulyAugust. . .
SeptemberOctober.
.
November.December.
1968-January.
.
February.March . . .
.
AprilMayJune
July
1.031
S'-' ' '
150
525
i35680
-i5-2
2
111617
16
18
12
1520
2,664-252-139
-U9-822-110
-19i-282-232
-159-lU
-3
-1
-3
-10-A
-39
-2A-216-23
-U-7
-i08
-!
827271
U2580521719207
5
77517
1,336
1X2-135626
29266165
1,313-9i
-2
1
-k-7-2
-39
-21
-214178
-12
-5
-409
775
7922,1282,5702,4353,061
3,0903,3563,5214,8344,740
4,791i,7924,788
4,7814,7794,740
4,719
4,5054,683
4,671
4,6664,257
4,243
28
29
5262
59747581
85
9492
939393
939392
91
8791
91
9083
1,9751,95s1,9971,5551,6901,064
1,035769863 2J326420
369368
372379
381420
441
655Lrn489
494
903
917
Note: The initial U.S. quota in the International Monetary Fund was $2,750million. The U.S. quota was increased to $4,125 million in 1959, and to$5,160 million in February 1966. Under the Articles of Agreement,subscription payments equal to the quota have beeri made 25 percent ingold and 75 percent in dollars.
1/ Represents net Fund sales of gold to acquire U.S. dollars for use inFund operations. Does not include transactions in gold relating togold deposit or gold investment (see Table 2).
2/ Represents purchases from the Fund of currencies of other members forequivalent amounts of dollars. The United States has a commitment torepay drawings within 3-5 years, but only to the extent that the Fund'sholdings of dollars exceed 75 percent of the U.S. quota. Drawings ofdollars by other countries reduce the U.S. commitment to repay by anequivalent amount.
y Represents the United States gold tranche position in the Fund (theUnited States quota minus the Fund's holdings of dollars), which isthe amount that the United States could draw in foreign currenciesvirtually automatically if needed. Under appropriate conditions, theUnited States could draw additional amounts equal to the United Statesquota.
J Represents $600 million IMF gold sale to United States (1957), less$6 million gold purchase by IMF from another member with U.S. dollars(1948).
V Includes $259 million gold subscription to the Fund in Jixie 1965 fora U.S. quota increase which became effective on February 23, 1966.In figures published by the Fund from June 1965 through January 1966,this gold subscription was included in the U.S. gold stock andexcluded from the reserve position.
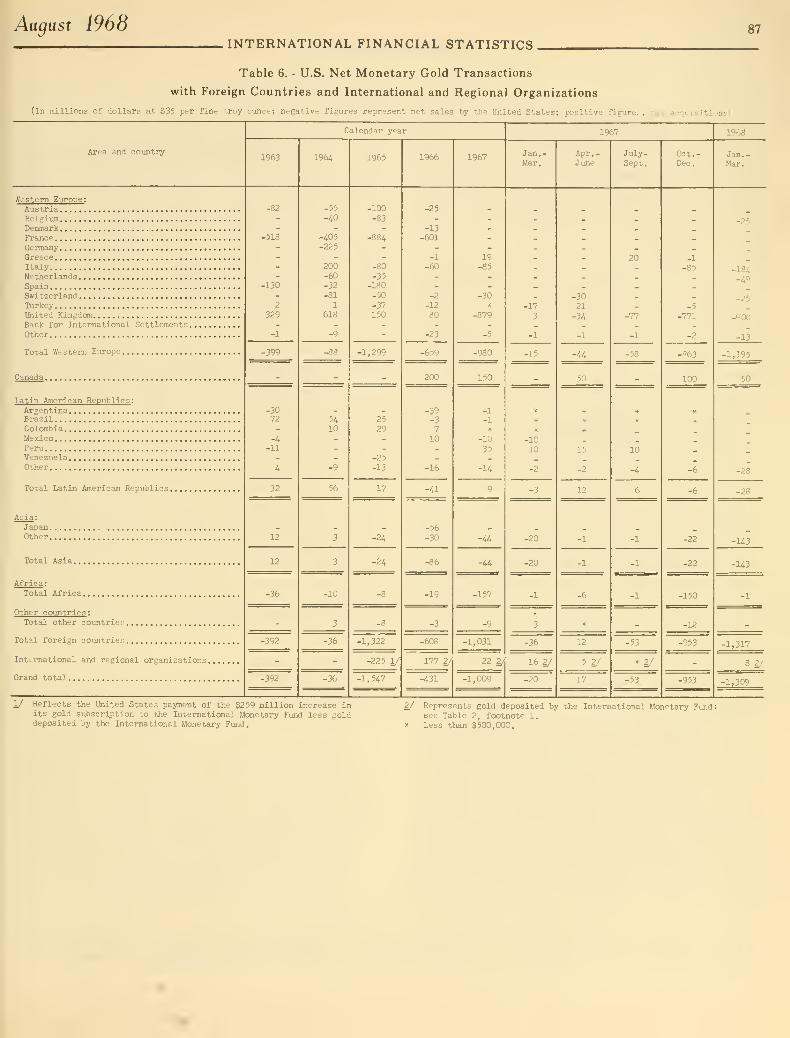
August 1968 87INTERNATIONAL FINANCIAL STATISTICS,
Table 6. - U.S. Net Monetary Gold Transactions
with Foreign Countries and International and Regional Organizations
(In millions of dollars at, $35 per fine troy ounce; negative figures represent net sales by the United States; positive figures, net acquisitions)

88 Treasury Bulletin
.CAPITAL MOVEMENTS.
Background
Data relating to capital movements between the United
States and foreign countries have been collected since 1935,
pursuant to Executive Order 656O of January 15, 193^, Execu-
tive Order 10033 of February 8, 1949, and Treasury regulations
promulgated thereunder. Information on the principal types of
data and the principal countries is published monthly in the
"Treasury Bulletin." Reports by banks, bankers, securities
brokers and dealers, and nonbanking business concerns in the
United States are made initially to the Federal Reserve Banks,
which forward consolidated figures to the Treasury. Thesestatistics are consolidated by the Treasury and published as
promptly as possible.
The reporting forms and instructions used in the collec-
tion of the statistics have been revised a number of times.
The most recent general revision became effective with reports
covering data as of May 31, 1963.1/ A detailed descriptionof the content of the statistics, including the changes insti-
tuted in 1963, appeared in the July 1963 issue of the "Treasury
Bulletin," pages 79-81. As a result of changes in presentationintroduced in that issue, not all breakdowns previouslypublished will be exactly comparable to those now presented.
Basic definitions
The term "foreigner" as used in the Treasury reportscovers all institutions and individuals domiciled outsidethe United States, including United States citizens domiciledabroad and the foreign subsidiaries and offices of UnitedStates banks and business concerns; the central governments,central banks, and other official institutions of foreigncountries, wherever located; and international and regionalorganizations, wherever located.
In general, data are reported opposite the foreigncountry or geographical area in which the foreigner is domi-ciled. Data pertaining to branches or agencies of foreignofficial institutions are reported opposite the country towhich the official institution belongs. Data pertaining tointernational and regional organizations are reported oppositethe classification "International," "European regional,""latin American regional," or "Asian regional," as appropriate,except for the Bank for International Settlemen-^s and theEuropean Fund, which are included in the classification "OtherWestern Europe."
"Short-term" refers to obligations payable on demandor having an original maturity of one year or less, withoutdeduction of any offsets. "Long-term" refers to obligationshaving an original maturity of more than one year, and in-cludes securities having no contractual maturity.
Exclusions
The data published herein do not cover all types ofcapital movements between the United States and foreigncountries. The data reported to and published by the TreasuryDepartment exclude entirely the intercompany capital trans-actions of business enterprises in the United States withtheir own branches and subsidiaries abroad or with their for-eign parent companies; such transactions are reported bybusiness firms to the Department of Commerce. Data on thecapital transactions of the United States Government and onshipments and receipts of United States currency are alsoexcluded from the Treasury reports. Certain capital trans-actions not effected through reporting institutions, such assecurities transactions carried out entirely abroad, are notrecorded in the Treasury reports. Consolidated data on all
types of capital transactions are published by the Departmentof Commerce in its regular reports on the United Statesbalance of payments.
The liabilities data exclude U.S. Treasury letters ofcredit, and nonnegotiable, noninterest-bearing special notesof the United States held by the Inter-American DevelopmentBank and the International Development Association.
Beginning with the May 1967 Bulletin, data on short-termliabilities to foreigners have been revised to exclude theholdings of dollars of the International Monetary Fund derivedfrom payments of the United States subscription and from theexchange transactions and other operations of the Fund.(Liabilities representing the "gold investment" of the Fundcontinue to be included.) This change in the treatment of theFund's "holdings of dollars" is related to the revision of the
table on United States monetary reserve assets (see "Inter-national Financial Statistics" section, Table 1) to include theUnited States reserve position in the International MonetaryFund.
The Fund's "holdings of dollars" do not represent UnitedStates liabilities to foreigners in the same sense as do otherreported liabilities to foreigners. They are more accuratelyviewed as contingent liabilities, since they represent essen-tially the amount of dollars available for drawings from the
Fund by other member countries. Changes in these holdings(arising from United States drawings and repayments of foreigncurrencies, from drawings and repayments of dollars by othercountries, and from other dollar operations of the Fund) giverise to equal and opposite changes in the United States goldtranche position in the Fund, which in the absence of UnitedStates lending to the Fund, is equal to the United Statesreserve position. Since the reserve position is included in
United States reserve assets, it is necessary, in order to
avoid double-counting, to exclude the Fund's "holdings ofdollars" from United States liabilities to foreigners. Thisrevised presentation conforms to the treatment of these itemsin the United States balance of payments and the internationalinvestment position of the United States.
The data on securities transactions and on foreignholdings of U.S. Government bonds and notes exclude non-marketable U.S. Treasury notes, foreign series, and non-marketable U.S. Treasury bonds and notes, foreign currencyseries (see "International Financial Statistics" section.Table A).
Presentation of statistics
Data collected monthly on the Treasury Foreign ExchangeForms are published in three sections. Section I provides a
summary of the principal data by period; Section II presentsdata by country and by period; and Section III shows detailedbreakdowns of the latest available preliminary data.
Beginning with the May 1967 Bulletin, publication of theformer Section I, Table 1, "Net Movements of Banking Fundsand Transactions in Long-Term Securities with Foreigners" wasdiscontinued. Due to numerous breaks in the statisticalseries, the usefulness of this table had become increasinglylimited in recent years. Time series of the significant cate-gories of data reported on the Treasury Foreign Exchange Forms,from which this table was derived, are available elsewhere inthis section.
Section IV presents supplementary data which are reportedless frequently than monthly but which are published monthly.
1/ Copies of the reporting forins and instructions may be obtained from the Office of Balance of Payments Programs, Operations and Statistics, Office ofthe Assistant Secretary for International Affairs, Treasury Department, Washington, D.C. 20220 or' from Federal Reserve Banks.
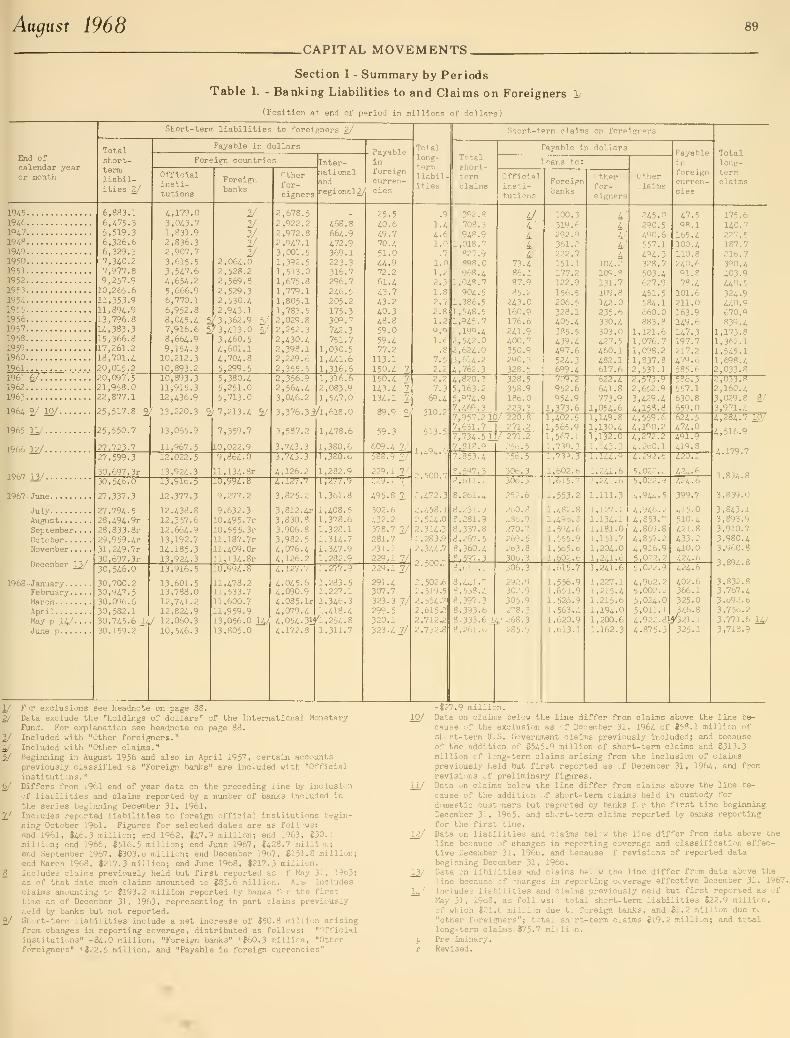
Atufust 1968.CAPITAL MOVEMENTS.
89
Section I - Summary by Periods
Table 1. - Banking Liabilities to and Claims on Foreigners 1/
(Position at end of period in millions of dollars)
End ofcalendar yearor month
WAS.1946.
1947.
1948.
1949.
1950.
1951.
1952.
1953.
1954.
1955.
1956.
1957.
1958.
1959.
1960.
1961.
Short-term liabilities to foreigners 2/
Totalshort-termliabil-ities 2/
1961 6,/.
19621963....
1964 2/ 10/.
1965 IJ/....
1966 12/....
1967 12/
.
1967-June.
JulyAugustSeptember. .
.
OctoberNovember. ...
December 13/
1968-January.
.
February.March. . . .
April. . .
.
tfay p VJJune p . .
.
6,883.16,475.35,519.36,326.66,329.37,340.27,077.89,257.910,265.611,353.911,894.913,796.814,383.315,366.817,261.218,701.420,015.220,097.521,958.022,877.1
Payable in dollars
Foreign countries
Officialinsti-tutions
4,179.03,043.71,831.92,836.32,907.73,615.53,547.64,654.25,666.96,770.16,952.88,045.47,916.68,664.99,154.310,212.310,893 .2
Foreignbanks
10,893.311,915.312,436.9
2/
y2/
2,064.02,528.22,569.82,529.32,530.42,943.1
5/3,362.91/3,413.0
3,460.54,601.14,704.85,299 .5
Otherfor-eigners
Inter-nationalandregional2/
5,380.45,251.05,713.0
25,517.8 2/ 13,220.3 2/7,213.4 2/
25,550.7
27.723.727,599.3
30,697.3r30,546.0
27,337.3
27,794-528,494.9r28,833.Sr29,959.4r31,249.7r30.697.3r30,546.0
30.700.230,947.530,096.630,582.1
13,065.9
11,967.5
7,359.7
10,022.9
12,022.5
13,924.313,916.5
12,377.3
12,438.812,357.612,664.913,192.714.185.313,924.313.916.5
13,601.513.788.012,741.212,824.9
30,745.6 14/ 12,060.330,159.2 n 10,546.3
9,864.0
ll,134.8r
9,277.2
9,632.310,495.7r10,555.3rll,187.7r11, 409. Orll.i34.8r
10,994-8
11,478.211,533.711,600.711,959.913,056.0 Uj13,805.0
2,678,
2,922,2,972,
2,947,3,001,
1,392,
1,513,1,675,
1,779,
1,805.
1,783.2,029.2,252.
2,430.2,398.2,2292,3552,356.2,564.3,046.
468.8664.9472.9369.1223.3316.7296.7246.5205.2175.
309.
742.
751.
1,030.
1,U1,
Payableinforeigncurren-cies
1,316.61,316.62,083-91,547.0
3,376.39/1,618.0
3,587.2
3,743.35,743.3
4,126.24,ia7.7
3,825.2
3,812.4r3,830.33,906.83.982.54,076.44,126.24.127.7
4,045.64.090.94,085. Ir
4,079.44,054-4,172-8
1,478.6
1,380.61,380.6
1,282.91777779"
1,361.8
1,408-51,378.61,328.11,314.71,347.91,282.9
31)^1
] ,277.9
1,283.51,227.11,346.31,418.4,254.8
1,311-7
25-540.649.770.451.0
44-972.261.443.743.240.348.859.059.477.2
113-1150.4
Totallong-termliabil-ities
1.44.':>
1.0
1.8? 7
2
1.2
9.91.6.8
7.52.2
Short-term claims on foreigners
Totalshort-termclaims
'14S.
1 ,018.
150.4 2i143.4 lA134-1 2|
89.9 2/
59.3
609. 4 7/
229.1 7/
495-8 7/'
502-6432-2378-7 7/281.7231.1229.1 7/229.1 7/
291.4307.7323.3 7/299.5320.1
323. 42/
2.27.3
(ft.i.
310.2
513.5
,494.0
2.500.7
.".472.3
2.458.12,524.0
2,314.32.283-9
2,344-7
2,500.7
2.502.62,519.5
2,554.72,615.22,712.2
2,732.8
9681,048904
1,3861,5481,9452,1992,5422,6243,6144,7624,820.5,163.
5,974.7,4tf'.
Payable in dollars
Loans to:
Officialinsti-tutions
4/
4/4'4'-'
73.486.187.9
85.2•'43-0
160.9176.6241.9400.7350.9290.3328.5
Foreignbanks
328.5358.9186.0
223-37,9577,631
.2 10/ 220.8,7 271.2
7,734,
7,818,
511
7,853-4
8.611.1
8.261.4
8,231.98,281.98,337.88,267.58,360.4
597.38,611.1
8, 44].
7
8,538.48,397.38,393.68.333.6 U/ 268.
3
8,261.6] 285.9
271.2
256.5256.5
306.3306.3
252.6
260.8286.9270.7269.5263.8306.3306.3
292.9302.9305.9278.3
6/
7/
8/
2/
100.3
319.6292.9361.2222.7151.1177.2122.9
156.5206.5328.1405.4385.5439.4497.6524.3699.4709.2952.6954.9
1,373.61,402.51,565.91,567.1
730.3
1,739.3
1,602.61,615.7
1,553.2
1,482.81,496.81,594.61,555.91,565.61,602.61.615.7
1,556-91,651-91,526-91,563-41,620.91,613.1
Otherfor-eigners
4/4/
L/4'
104.2109.8131.7109.8142.0235-6330.4303.0427.5460.
1
482.1617.6622.4641.8773.9
1,054. 6
1,149.81,130.41,132.01,143.31.144.9
1,241-61,241-6
1,111.3
1,127-21,134-11,181.01,151.71,204.01.241.61.241.6
1,227-11,215.41,215-61,194-01,200.61,162.3
Otherclaims
245.0290.5490.6557.1494.3328.7503.4627.9
451.5584-1660.0883-8
1,121.61,076.71,098.21,837.82,531.12,573-92,652.93,429.44,158.84,559.64,190.24,272.24,260.14,295.6
5,022.25,022.9
4,944-5
4.946.24,853-74,869-84,857-24,916-95,022.25,022.9
4,962.25,002.25,024-0
Payablein
foreigncurren-cies
47-598.1165.
4
100.4110.8240.691.878.4
101.
211.
163.
149.
147.197.7217.2479.6585.6
Totallong-termclaims
5357r557.1630.8659.0
175.6140.7227.5187.7216.7390.4403.9440.5324-9440.9670.9839.4
1,173.81,362.11,545.11,698.42,033.8
624.5474.0491.9419.84507
424.6424-6
399-7
415.0510.4421.8433.2410.0424-6424-6
402.6366.1325-0
5,011.1 346.8
4,922.813021.14,875-3 325-1
2,033-82,160.43,029.8 8/3,971.44,284.7 10/
4,516.9
4,179.7
3,894.8
3,839.0
3,843.13,893.93.910.73,980.43.960.8
3,894.8
3,832.83,767.43,692.63,756.23,771.6 Uj3,718.9
For exclusions see headnote on page 88.
Data exclude the "holdings of dollars" of the International MonetaryFund. For explanation see headnote on page 88.
Included with "Other foreigners."Included with "Otlier claims."Beginning in August 1956 and also in April 1957, certain accountspreviously classified as "Foreign banks" are included with "Official
institutions,
"
Differs from 1961 end of year data on the preceding line by inclusion
of liabilities and claims reported by a number of banks Included in
the series beginning December 31, 1961.
Includes reported liabilities to foreign official institutions begin-
ning October 1961. Figures for selected dates are as follows:
end 1961. $46.3 million; end 1962, $47.9 million; end 1963, *30.1million; end 1966, $516-5 million; end June 1967, J428.7 million;end September 1967, $303.6 million; end December 1967, $151.8 million;
end March 1968, $217.3 million; end June 1968, $217-3 million.
Includes claims previously held but first reported as of May 31, 1963;as of that date such claijns amounted to $85.6 million. Also includeslaims amounting to $193-2 million reported by banks for the firstLime as of December 31, 1963, representing in part claims previouslyr.eld by banks but not reported-Short-term liabilities include a net increase of $50.8 million arisingfrom changes in reporting coverage, distributed as follows: "Officialinstitutions" -$4-0 million, "Foreign banks" "$60.3 million, "Otherforeigners" +$22-5 million, and "Payable in foreign currencies"
-$27.9 million.10/ Data on claims below the line differ from claims above the line be-
cause of the exclusion as cf December 31. 1964 of $58-1 million ofshort-term U-S. Government claims previously Included; and because
of the addition of $545.9 million of short-term claims and $313-3million of long-term claims arising from the inclusion of claimspreviously held but first reported as cf December 31 » 1964, and from
revisions of preliminary figures.11/ Data on claims below the line differ from claims above the line be-
cause of the addition of short-term claims held in custody for
domestic customers but reported by banks for the first time beginningDecember 31. 1965. and short-term claims reported by banks reporting
for the first time.
12/ Data on liabilities and claims below the line differ from data above the
line because of changes in reporting coverage and classification effec-
tive December 31, 1966, and because of revisions of reported data
beginning December 31, 1966.
13/ Data on libilities and claims below the line differ from data above the
line because of changes in reporting coverage effective December 31, 1967.
14/ Includes liabilities and claims previously held but first reported as of
May 31, 1968, as follows: total short-term liabilities $22.9 million,
of which $21.6 million due to foreign banks, and $1.2 million due to
"other foreigners"; total short- terra claims $19.2 million; and totallong-term claims $75.7 million,
p Preliniinary.
r Revised.

90 Treasury Bulletin
.CAPITAL MOVEMENTS.
Section I - Summary by Periods
Table 2. - Purchases and Sales of Long-Term Domestic Securities by Foreigners 1/
(In millions of dollars; negative figures indicate a net outflow of capital -from the United States)
Calendar yearor month
U.S. Government bonds and notes 2/
Purchases
Net purchases
Foreign countries
Official Other
Interna-tionalandregional
Corporate and other
Bonds 1/
Netpurchases
Purchases Sales Netpurchases
Met
purchaserof
domesticsecurities
1946
19i719i819491950195119521953
195i195519561957195819591960196119621963
196i196519661967
I96S-Jan. -June p
1967-June
JulyAugustSeptember. .
October. . .
.
November. .
.
December. .
.
1968-January. . .
.
February. .
.
MarchAprilMay pJune p
ai.53ii.3282.4430.0
1,236.4673.6533.7646.0800.9
1,341.1883.4666.1
1,223.91,216.91,729.61,743.71,779.91,867.11,149.41 , 077 .
2
680.2585.4
218.7
29.5
11.73'3.7
21.516.251.319.0
43.662.732.714.1
42.523.1
684.2283.3330.3333.6294.3
1,356.6231.4728.0792.7812.1
1,018.3718.3
1,187.6528.0
1,603.01,231.52,507.91,196.21,487.11,153.01,296.0
628.9
562.9
24.1
y^.o
16.67.7
71.28.8
221.6
104.4124.5
5.936.1
20.4
-269.761.5-47.996.4
942.1-683.0302.3-82.08.2
529.0-135.0-52.136.3
688.9126.6512.2
-728.0670.9-337.7-75.8
-615.8-43.5
-344.3
5.4
.1
-19.34.98.6
-19.910.2
-178.0
-a. 8-91.8
8.2-43.5
2.7
-269.7-13.0-55.4
9.4824.2-663.7
292.7-96.7-60.0
561.7-204.9117.0-236.7
523.9-97.9-20.0
-206.6369.1
-58.7-19.6
-245.248.4
-362.8
-6.0
-2.6
-191.4-65.0
-103.0
-2.8
-.5
36.1
95.156.429.5
55.6
3.46.5
4.88.4
-13.810.3
12.723.011.1
8.0-1.92.8
74.57.5
87.0117.9-19.39.6
14.768.3-32.770:0
-169.1273.0I64.9224.5532.2
-521.4301.8
-315.2-151.2-427.0-121.4
-37.1
-3.3
-3.3-19.8
.2
.2
-3.5-.1
.7
.3
.2
-38.8
.4
i/1/2/i/
107.7120.0200.1212.8289.7324.7287.1310.2361.4368.8
442.4316.9307.7255.746O.7675.0
1,577.92,242.6
1,801.6
226.5
252.8
159.4325.9187.9132.3178.3
249.8385.6206.6238.8586.5224.3
1/2/
108.3141.6188.5197.4283.6296.0251.8258.9344.0296.239.-'. 3
416.1359.0246.4284.4636.7
5a.
9
1,929.1
1,021.6
185.1
137.3146.7217.8433.6310.296.4
127.7125.1
174.5207.0214.2173.2
1/
1/-.6
-21.611.715.36.1
28.735.351.317.372.650.1
-99.2-51.3
9.3176.338.3
1,036.0313.5
870.0
41.4
115.512.7108.1
-245.8-177.8
81.9
122.1260.532.131.8
372.451.1
367.6226.1369.7
354.1666.9739.8650.2589.1
1,115.11,561.21,619.51,306.41.397.32,224.41,976.53,067.32,260.22,724.03,076.23,719.94,740.58,029.4
5,772.6
699.7
690.0717.2782.8772.3750.4855.8
893.5641.5882.0
1,049.41,182.51,123.7
43;. 1
376.7514.1375.3664.0619.5649.2533.9980.2433.7363.5163.8453.6861.5774.8744.6
2,149.12,526.53,425.34,133.25,073.87,276.1
4,757.9
1.35.8
602.81-46.0
640a714.2611.4698.2
726.5563.5634.6788.7
1,100.4944.2
-64.5-150.6-144.3-21.2
2.9120.3
1.0
55.2135.0127.5256.0142.6-56.3•362.9
201.732P.7111.1197.5-349.1-413.3-333.3
753.4
1,014.7
63.9
87.271.2142.758.1
139.0i57.7
167.078.0247.3260.882.1179.5
-334.2-89.1
-192.275.2
944.4-584.3314.9-11.5
149.3685.2156.4ia.8-2.7
1,124-4378.4735.7-668.2877.8
-510.'^
-450.886.9
1,023.4
1,540.4
110.7
202.3
64.6255.7
-170.1-58.7249.8
111.1
296.8187.6300.8410.9233.3
1/
2/
For exclusions see headnote on page 88.
Through 194.9, includes transactions in corporate bonds.2/ Through 19^9, included with transactions in U.S. Government bonis
and notes. p Preliminary. ** Less than $50,000.
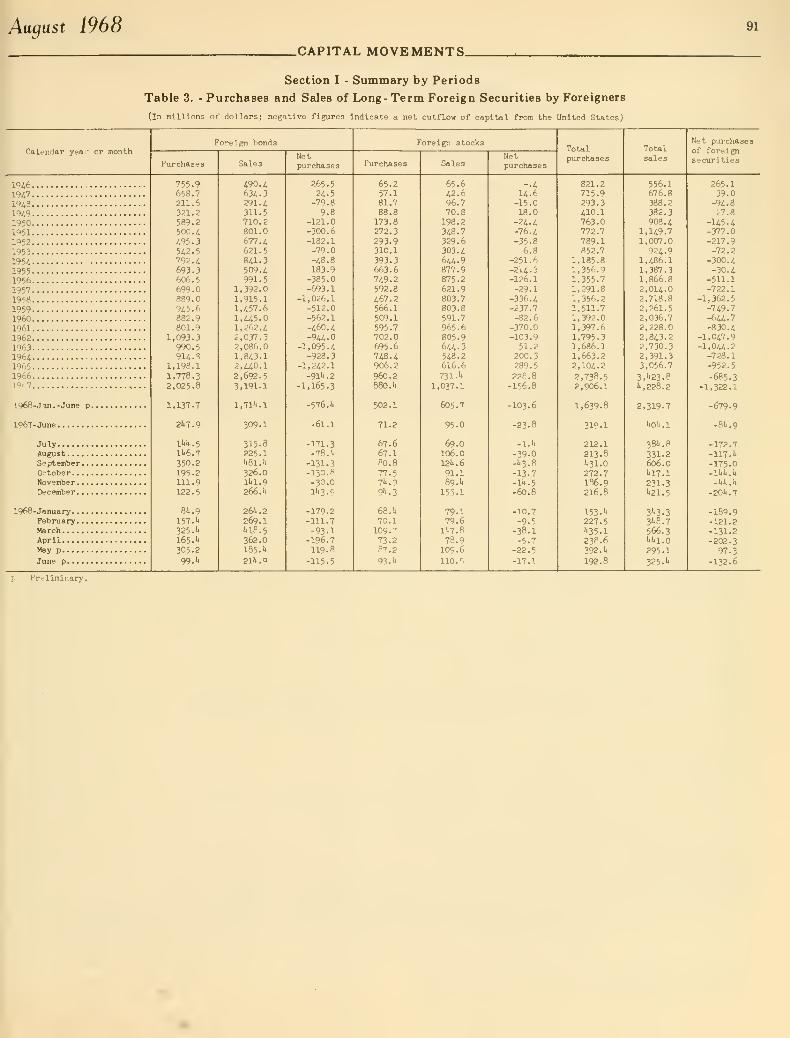
August 1968.CAPITAL MOVEMENTS.
91
Section I - Summary by Periods
Table 3. - Purchases and Sales of Long-Term Foreign Securities by Foreigners
(In millions of dollars; negative figures indicate a net outflow of capital from the United States)
Calendar yea.' or monthForeign bonds
Purchases SalesNetpurchases
Foreign stocks
Purchases SalesNetpurchases
Totalpurchases
Totalsales
Net purchasesof foreignsecurities
19^6
19i719iS
19i919501951195219531954195519561957195819591960196119621963
196i1965196619i 7
1966-Jan.-June p
1967-June
JulyAugustSeptember.
.
October. ...
November . . .
,
December. ...
19^-January. ...
February. . .
,
MarchAprilMay PJune p
p Preliminary.
755.9658.7211.6321.2589.2500.4495.3542.5792.4693.3606.5699.0889.0945.6882.9801.9
1,093.3990.5914.8
1 , 198 .
1
1,778.32,025.8
1,137.7
2'<7.9
I'll.. 5
lUe.T350.2195.2lll.Q122.5
8U.9157.''
325.'*
165.1.
305.2
99.''
490.4634.3291.4311.5710.2801.0677.4621.5841.3509.4991.5
1,392.01,915.11,457.61,445.01,262.42,037.32,086.01,843.12,440.12,692.53,191.1
l,71l'.l
309.1
315.3225.11.81.1*
326.011.1.9
266.1.
261..2
269.11.18.5
362.0185. U
21!.. 9
265.524.5-79.89.8
-121.0-300.6-182.1-79.0-48.8183.9-385.0-693.1
-1,026.1-512.0-562.1-460.
4
-944.0-1,095.4
-928.3-1,242.1
-91I..2
-1,165.3
-576.1.
-61.1
-171.3-78.'.
-131.3-130.8-30.01I.3.9
-179.2-111.7-93.1-196.7119.8
-115.5
65.257.181.788.8173.8272.3
293.9310.1
393.3663.6749.2592.8467.2566.1509.1595.7702.0695.6748.4906.2
960.2880.1.
502.1
71.2
67.667.180.
8
77.57I..9
91.. 3
68.1.
70.1109.773-287.2
03.1.
65.642.696.770.8198.2348.7329.6303.4
6a.9877.9875.2621.9803.7803.8591.7965.6805.9644.3548.2616.6731
A
,037.1
605.7
95.0
69.0106.012U.691.189.1.
155.1
79.179.6
11.7.8
78.9109.6
110.'^
-.414.6-15.018.0
-24.4-76.4-35.8
6.8-251.6-214-3-126.1-29.1
-336.4-237.7-82.6
-370.0-103.9
51.2200.3289.5
228.8-156.8
-103.6
-23.8
-1.1.
-'9.0-1.3.8
-13-7-11..
5
-60.8
-10,
-9.
-38,
-5.
-22,
-17,
821.2715.9293.3410.1763.0772.7789.1852.7
1,185.81,356.91,355.71,291.81,356.21,511.71,392.01,397.61,795.31,686.11,663.22,104.2
2,738.52,906.1
1,639.8
310.1
212.1213.81.31.0
272.71S6.9216.8
153.1*
227.51.35.1
238.6392.1.
192.8
556.1676.8388.2382.3908.4
1,149.71,007.0924.9
1,486.11,387.31,866.82,014.02,718.82,261.52,036.72,228.02,843.22,730.32,391.33,056.7
3,1.23.8l.,228.2
2,319.7
I.OI..I
38I..8
331.2606.01.17.1
231.31.21.5
31.3.3
31.8.7
566.31.1.1.0
295.1
325.1.
265.139.0-94.827.8
-145.4-377.0-217.9-72.2
-300.4-30.4
-511.1-722.1
-1,362.5-749.7
-6u.7-830.4
-1,047.9-1,044.2
-728.1-952.5
-685.3-1,322.1
-679.9
-8U.9
-172.7-117.1.
-175.0-ll.U.1.
-1.I..1.
-201.. 7
-199.9-121.2-131.2-202.3
97.3
-132.6
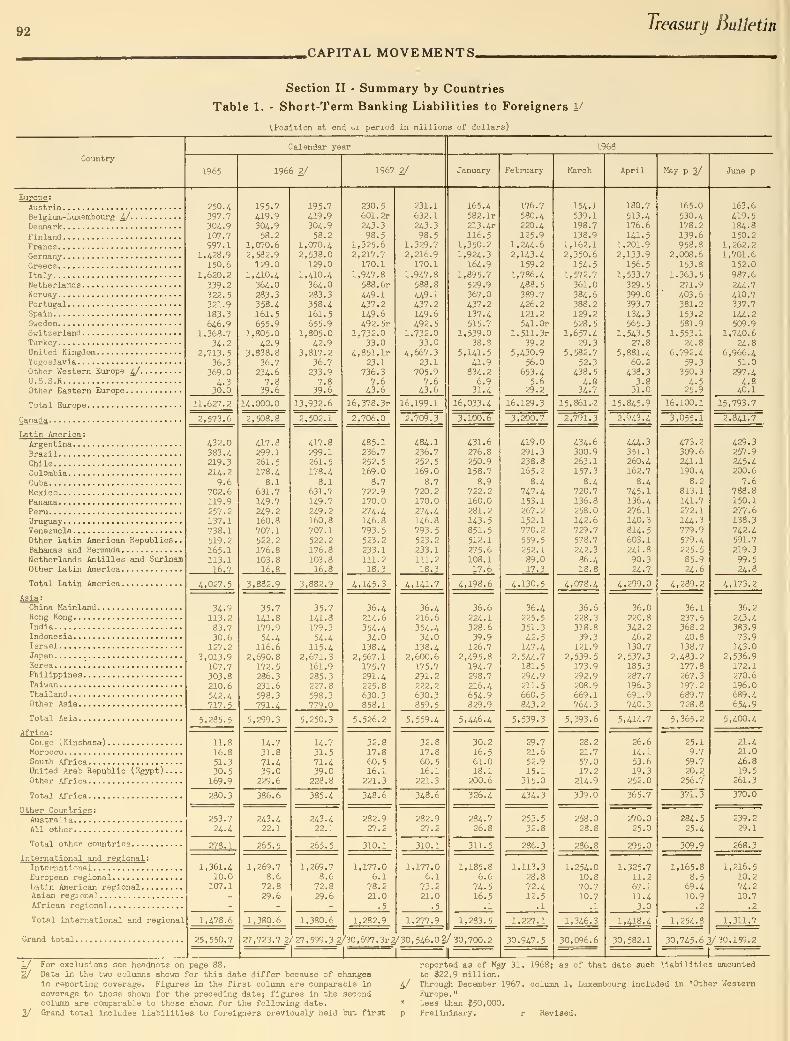
92Treasury Bulletin
.CAPITAL MOVEMENTS.
Section II - Summary by Countries
Table 1. - Short-Term Banking Liabilities to Foreigners 1/
^Position at end v>i period in millions of dollars)

August 1968.CAPITAL MOVEMENTS.
93
Section II - Summary by CountriesTable 2. - Short-Term Banking Claims on Foreigners V
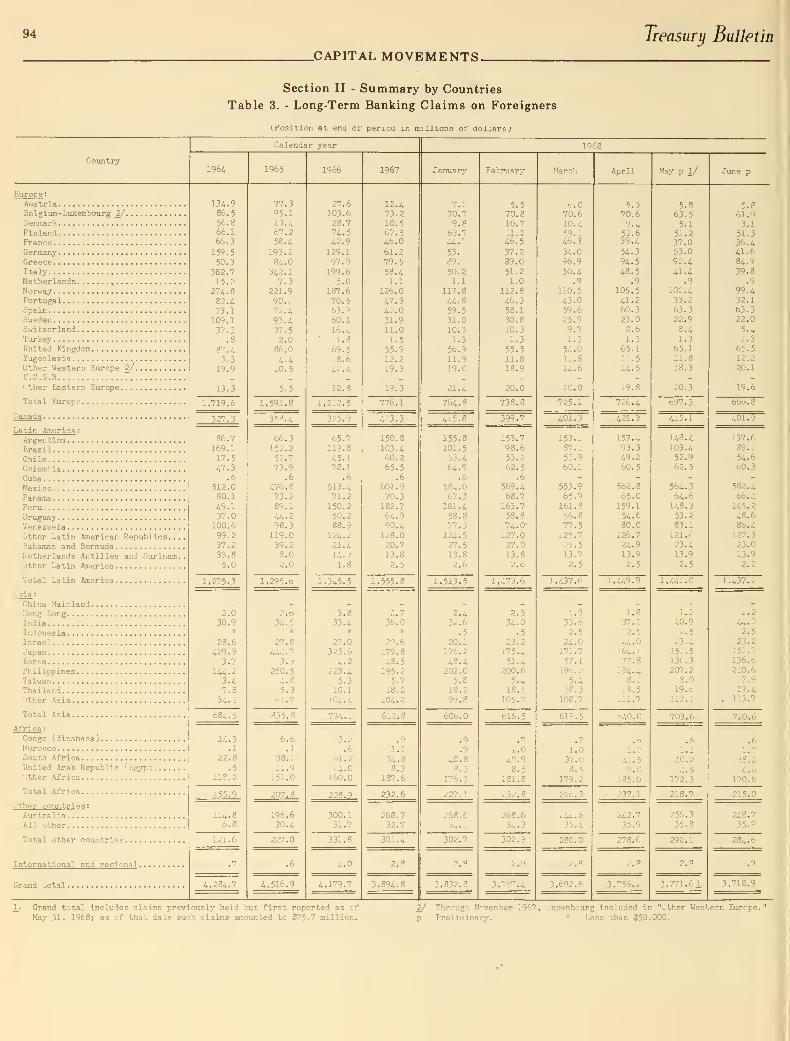
94
.CAPITAL MOVEMENTS-Treasury Bulletin
Section II - Summary by Countries
Table 3. - Long-Term Banking Claims on Foreigners
I, Position at end of period in miiiions of dollars J
Country
Calendar year
1964 1965 1966 1967
l'^68
February Marcfi April May p .1/ June p
Europe :
AustriaBelgium-Luxembourg 2/Derjnark
FinlandFranceGermanyGreeceItalyNetherlands ^
NorwayPortugalSpainSwedenSwitzerlandTurkeyUnited KingdomYugoslaviaOther Western Europe 2/U.S.S.R 7
Other Eastern Europe
Total Europe
Canada
Latin America :
ArgentinaBrazilChileColombiaCubaMexicoPanamaPeruUruguayVenezuelaOther Latin American Republics..Bahamas and BermudaNetherlands Antilles and SurinamOther Latin America
Total Latin America
\sia:China MainlandHong KongIndiaI:.donesia
IsraelJapanKoreaPhilippinesTaiwanThailandOther Asia
Total Asia
Africa :
Congo ( Kinshasa
)
MoroccoSouth AfricaUnited Arab Republic (Egypt)Other Africa
Total Africa
Other countries :
AustraliaAll other
Total other countries
Interna,tlonal and regional ,
Grand total ,
13-i.9
86.556.866.166.3
159.550.3
382.
7
15.227.;. 8
B2.173.1109.1
37.3.8
37.^
3.319.9

Aagust i%8.CAPITAL MOVEMENTS.
95
Section II - Summary by Countries
Table 4. - Net Transactions in U.S. Government Bonds and Notes by Foreigners!^
iTrj thousands c-f iollars: noeative figures indicate net sales by foreigners or a net outflow of capital from the United States)
Coxintry1965
'''ilendqr year
1966 1967
1968throughJune p
January February
1Q68
March April May p
Europe :
AustriaBelgiuro-Luxembourg 2/DenmarkFinlandFranceGermanyGreeceItalyNetherlandsNorwayPortugalSpainSwedenSwitzerlandTurkeyUnited KingdomYugoslavia '.
Other Western Europe 2/U.S.S.ROther Eastern Europe
Total Europe
Canada
Latin America :
ArgentinaBrazilChileColombiaCubaMexicoPanamaPeruUruguayVenezuela. . . -.
Other Latin American Republics...Bahamas and BermudaNetherlands Antilles and Surinam.Other Latin America
Total Latin America
Asia :
China MainlandHong KongIndiaIndonesiaIsraelJapanKoreaPhilippinesTaiwanThailandOther Asia
Total Asia
Africa :
Congo ( Kinshasa
)
MoroccoSouth AfricaUnited Arab Republic (Egypt)Other Africa
Total Africa
Other countries :
AustraliaAll other
Total other countries
International and regional :
InternationalEuropean regionalLatin American regionalAsian regional
Total international and regional.
Grand total
1/ For exclusions see headnote on p
126
-f;^o
-3.''
-24
508
1,11^^
-^8,86622
la-15,719
9,99817
13^,205
78A
-172
85,8^6
-U,280
2^32-6
19
-6^7138-76-28
lU1Q770<^
1,130
1,606
-10
12
11
101
3,98A
-61
1
-2,0^6
16
A8
68o
77
-U8,393
-2,722
-151,115
-75,8^2
-29
-U3-1,101
za-92-20
356-1,301l,9i2
3
429-254
3,768
-205,275
615
-178
-201,339
15,638
-139-6
12
2
270620-29-7
135-219
-1,896-798-62
-2,117
-49-5
-U6-23
-105
25
-216
-51°
1
3
-506
-19-7
-428,682
1,718
-426,964
-615,829
33-203
-867
-35
1,215-63
7,835-268
16-30
-215-22
-1,534
31,8a
189
-88
37,7Q9
23,990
51
-127
582-119
10
34-510-289
lU
-318
-509
11
1«5-2
-12
12,611
12,294
4,186
4,ig6
-81,583
-40,339502
-121,420
-43,471
-1-550-229
1,000-67-4
-2,981-91
-4,613
-958
2,000-367
51,933
-14,167
-41
30,864
-338,681
-105-19
104
-223-1,078
-5
24148119
1,426
365
-262
25
10885
-3
-460
98
2^3
-39, 130
2,220
-37,110
-344,268
-1
-105
91
16-100-501
355
9,480
-U
9,221
-139,045
-19
-229
1617
18-109
1,489
1,183
-131
724
724
-178,048
57
-2,9912
-1,100
15
209
25,485
-17
-41
21,d19
-63,450
-6
158
79
45
-29
43
-3-460
-421
263
263
-41,762
6
-59
-7
-3
420
-37
16
-154
7,872
-12,997
-5,339
-«,625
104
-1,135
17
10-25
1
-1,028
35
10
79
124
-130
168
38
-91,829
-61-50
-7
-902
2,000-32
7,765
=53r
-13
6
-119
-125
20
232
232
8,225
-495-15
1,000-211
-11
-13-2,982
-95
259
-3,200
-639
-6,402
Wei
39-22
81110
1
215
20-10
885
-39,200
403
-38,797
-43,544
,ge 88. 2/ Through 1967, Luxembourg included in "Other Western Europe."
p Preliminary.
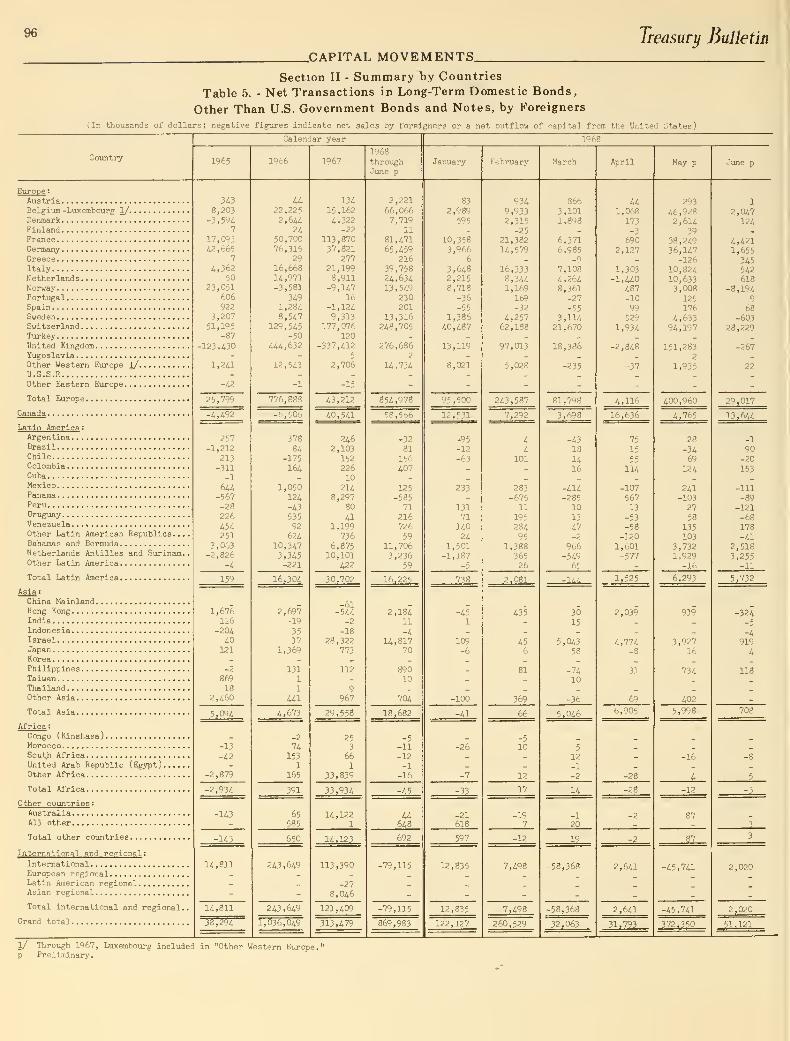
96 Treasury Bulletin
.CAPITAL MOVEMENTS.Section II - Summary by Countries
Table 5. - Net Transactions in Long-Term Domestic Bonds,
Other Than U.S. Government Bonds and Notes, by Foreigners
(In thousands of dollars; negative figures indicate net sales by I'oreigners or a net outflow of capital from the United States)
Country
Calendar year
1965 19o6 I'^Gl
1968throughJune p
1^68
February March April May p
Europe :
AustriaBelgium -LuKembourg l/.
.
DenmarkFinlandFranceGermanyGreeceItalyNetherlandsNorwayPortugalSpainSwedenSwitzerlandTurkeyUnited KingdomYugoslaviaOther Western Europe l/U.S.S.ROther Eastern Europe—Total Europe.
Canada
Latin America :
ArgentinaBrazilChileColombiaCubaMexicoPanamaPeruUruguayVenezuela . . ,<.
Other Latin American Republics—Bahamas and BermudaNetherlands Antilles and Surinam.Other Latin America
Total Latin America.
Asia
:
China MainlandHong KongIndiaIndonesiaIsraelJapanKoreaPhilippinesTaiwanThailandOther Asia
Total Asia.
Africa :
Congo ( Kinshasa
)
MoroccoSouth AfricaUnited Arab Republic (Egypt)Other Africa
Total Africa.
Other countries i
AustraliaAll other
Total other countries.
International and regional :
InternationalEiiropean regionalLatin American regional...Asian regional
Total international and regional.
Grand total
3^3
8,203
-3,59-i7
17,0^3^,o65
7
-^,362
50
23,051606922
3,20751,195
-87
-123,^30
1,2^1
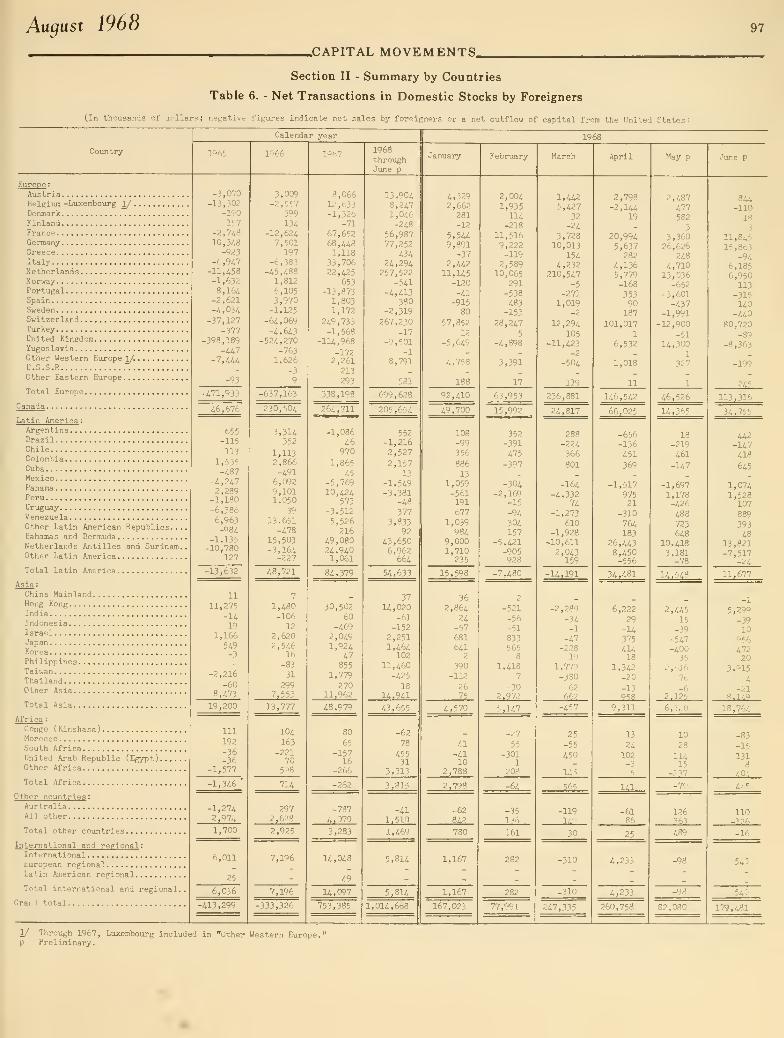
Auqast 1968 97
.CAPITAL MOVEMENTS.
Section II - Summary by Countries
Table 6. - Net Transactions in Domestic Stocks by Foreigners
(In thousands of inllars; negative
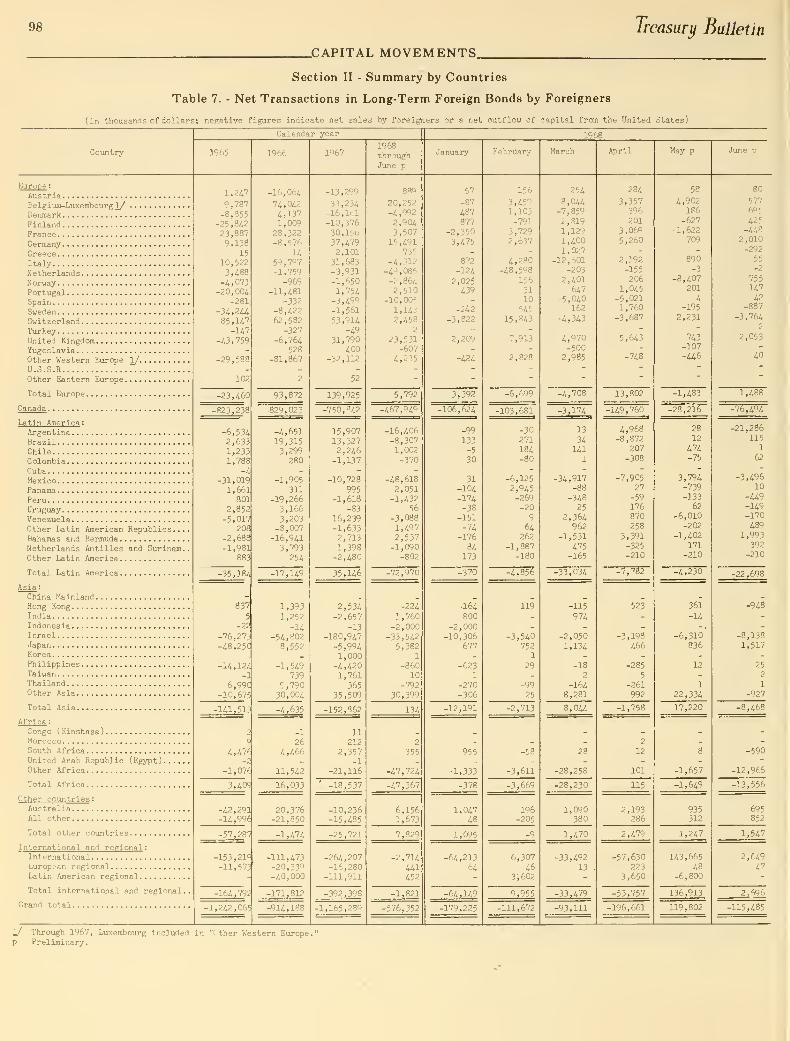
98 Treasury Bulletin
.CAPITAL MOVEMENTS.
Section II - Summary by Countries
Table 7. - Net Transactions in Long-Term Foreign Bonds by Foreigners
(In thousands of dollars
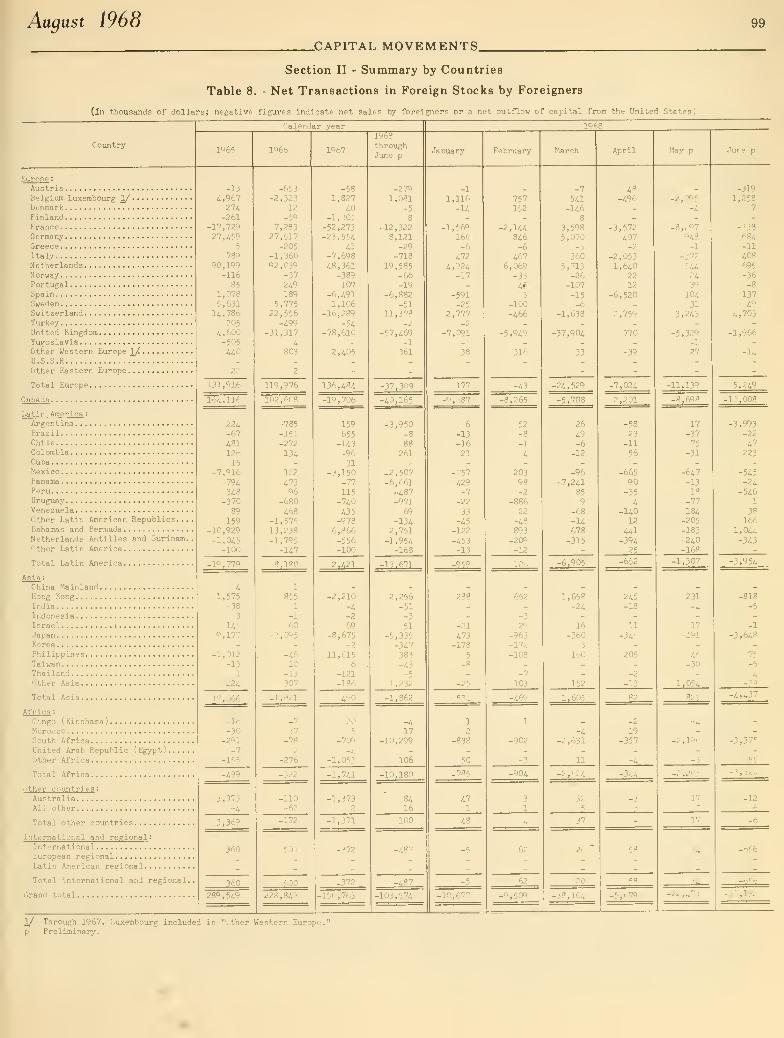
August 1968
.CAPITAL MOVEMENTS.
Section II - Summary by Countries
Table 8. - Net Transactions in Foreign Stocks by Foreigners
(in thousands of dollars; negative figures indicate net sales by foreigners or a net outflow of capital from the United States)
Country
AustriaBelgiuiR-Luxerabourg 1/DenmarkFinlandFranceGermanyGreeceItalyNetherlandsN orwayPortugalSpainSwedenSwitzerlandTurkeyUnited KingdomYugoslaviaOther Western Europe 1/U.S.S.ROther Eastern Europe
Total Exirope
Canada
Latin America :
ArgentinaBrazilChileColombiaCubaMexicoPanamaPeruUruguayVenezuelaOther Latin American Republics...Bahamas and BermudaNetherlands Antilles and Surinam.
Other Latin America
Total Latin America
Asia:China MainlandHong KongIndiaIndonesiaIsrael :
JapanKoreaPhilippinesTaiwanThailandOther Asia
Total Asia
Africa :
Congo ( Kinshasa
)
MoroccoSouth AfricaUnited Arab Republic (Egypt)
Other Africa
Total Africa
Other countries :
AustraliaAll other
Total other countries
International and regional :
InternationalEuropean regionalLatin American regional
Total international and regional
Grand total
I'^'D?
-13
^,96721U-261
-17,729
27,i595
789
90,199-116
85
1,0785,631U,736
205
^,600-505
uo
131,^16
16^,116
-67
^8112615
-7,916
-79i3^8
-370
89
159-10,929-1,045
-100
-l'-S77Q
L1,575
-38
3
1459,177
-1,012-13
1
224
Calendar year
10,Q66_
-16-30
-291-7
-155
-499
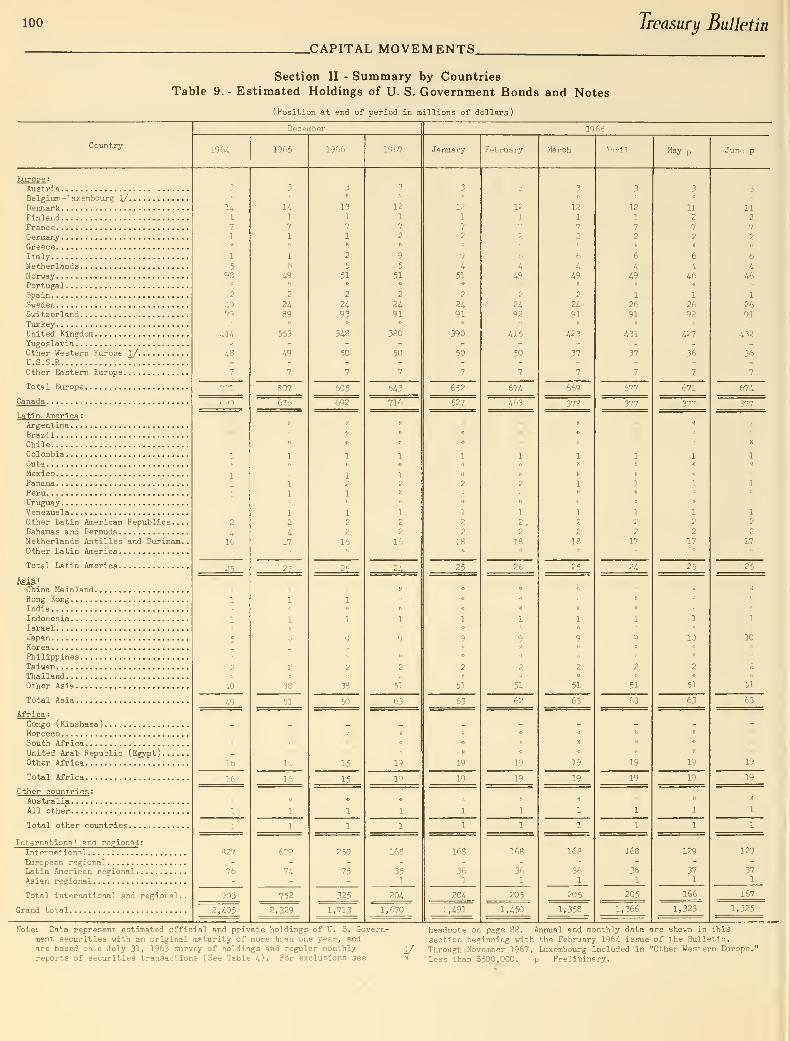
100
.CAPITAL MOVEMENTS.
Treasury Bulletin
Section II - Summary by Countries
Table 9.- Estimated Holdings of U. S. Government Bonds and Notes
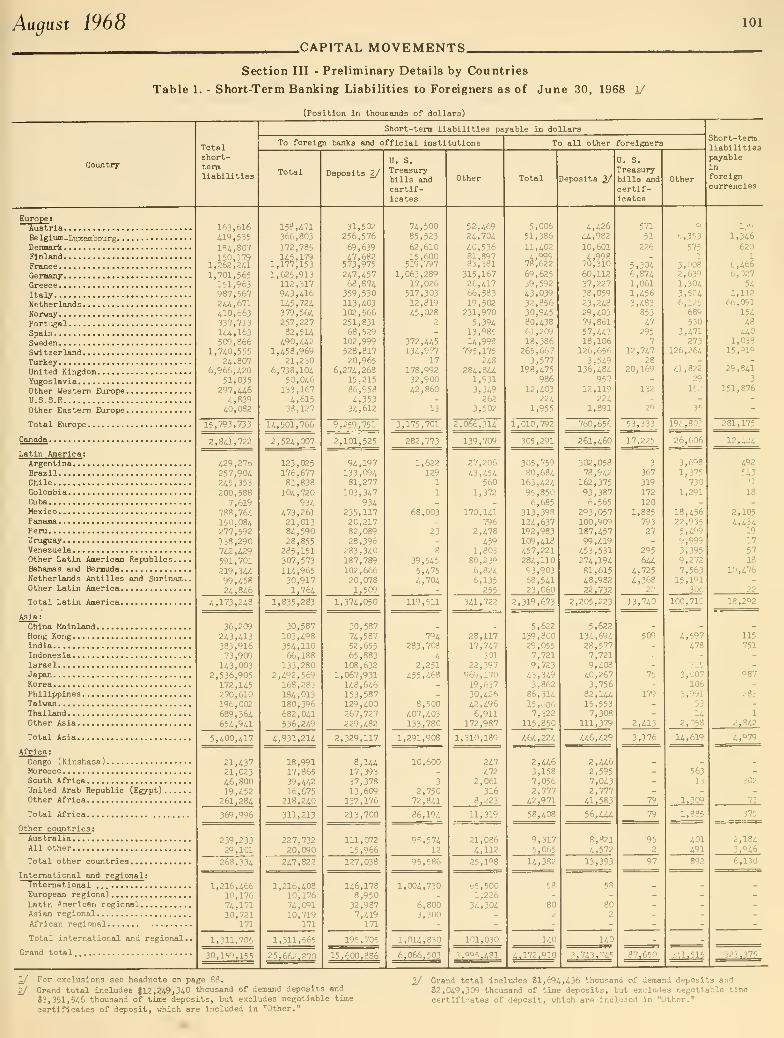
August 1968 101
.CAPITAL MOVEMENTS.
Section III - Preliminary Details by Countries
Table 1. - Short-Term Banking Liabilities to Foreigners as of June 30, 1968 1/
(Position in thousands of dollars)
Countr7
Totalshort-termliabiUties
Short-term liabilities payable in dollars
To foreign banks and official institutions
Deposits 2/
U. S.
Treasurybills andcertif-icates
Other
To all other foreigners
Deposits 2/
U. S.
Treasurybills andcertif-icates
Other
Short-termliabilitiespayablein
foreigncurrencies
Europe :
AustriaBelgium-LuxembourgDenmarkFinlandFranceGermanyGreeceItalyNetherlandsNorwayPortugalSpainSwedenSwitzerlandTurkeyUnited KingdomYugoslaviaOther Western EuropeU.S.S.ROther Eas tern Europe
Total Europe
Canada
Latin America :
ArgentinaBrazilChile ,
ColombiaCubaMexicoPanamaPeru ,
UruguayVenezuelaOther Latin American Republics...Bahamas and BermudaNetherlands Antilles and Surinajn,
Other Latin America
Total Latin America ,
Asia :
China MainlandHong KongIndiaIndonesiaIsraelJapanKoreaPhilippinesTaiwan ,
ThailandOther Asia
Total Asia
Africa :
Congo (Kinshasa)MoroccoSouth AfricaUnited Arab Republic (Egypt)Other Africa
Total Africa
Other countries :
Australia,
All other
Total other countries
International and regional :
InternationalEuropean regionalLatin American regional
,
Asian regional
African regional
Total international and regional
Grand total
163,616a9,53518i,807150,179
1,262,2a1,701,565151,963937,5672U,671/110,663
337,713
1<W,163509,866
1,7^0,5552i,807
6,966,42051,035
297,U64,839iO,082
15,793,733
2,841,722
429,276257,904245,353200,588
7,619788,764150,084277,592138,290742,429591,701219,34499,45824,846
4,173,248
36,209243,U3383,91673,909
143,0032,536,905
172,145270,610196,002689,364654,941
5,400,417
21,43721,02346,80019,452
261,284
369,996
239,23329,101
268,334
1,216,46610,17674,171lo,7r:i
17:
1,311,705
30, 15°, 155
158,471366,803
172,785145,179
1,177,1531,625,913
112,317943,416U5,724379,564257,22782,514
490,4421,458,969
21,2306,738,104
50,046133,1674,61533,127
14,501,766
2,524,007
123,025176,67781,838104,720
934473,26121,01384,59028,855
285,151307,573
1U,96530,9171,764
1,835,283
30,587103,498354,11066,188
133,2802,492,569
168,283184,013180,396682,041536,249
4,931,214
18,99117,865
39,4i216,675
218,240
311,213
227,73220,090
247,822
1,216,40810,17674,09110,719
171
1,311,565
25,662.870
31,502256,576
69,63947,682573,975247,45768,874359,530113, /103
102,566251,83168,529
102,999528,81720,965
6,274,26815,21586,9584,35334,612
9,259,751
2,101,525
94,197133,09481,277
103,347934
235,11720,21782,08928,396
283,340187,789102,66620,0781,509
1,374,050
30,58774,58752,65565,883108,632
1,067,931148,646153,587129,400267,727229,482
2,329,117
8,14417,39337,37813,609
137,176
213,700
111,07215,966
127,038
146,1788,95032,9877,419
171
195,705
15,600,886
1/ For exclusions see headnote on page 88.
2/ Grand total includes $12,249,340 thousand of demand deposits and
$3,351,5i6 thousand of time deposits, but excludes negotiable time
certificates of deposit, which are included in "Other."
74,50085,523
62,61015,600519,797
1,063,28917,026517,30312,81945,028
2
372,445134,977
17178,99232,90042,860
13
3,175,701
282,773
1,622129
1
1
68,003
23
8
39,545
5,4754,704
119,511
794283,708
42,251
455,468
8,500407,403133,780
1,291,9
10,600
3
2,75072,841
86,194
95,57412
95,586
1,004,730
6,8003,300
1,014,830
6,066,503
52,46924,704
40,53681,89783,381
315,16726,41766,58319,502
231,9705,394
13,98514,998
795,175248
284,8U1,931
3,349262
3,502
2,066,314
139,709
27,206
43,454560
1,372
170,141796
2,478459
1,80380,2396,8246,135
255
341,722
28,11717,747
301
22,397969,17019,63730,42642,4966,911
172,987
1,310,189
247472
2,061316
8,223
11,319
21,0864,112
25,1°8
65,5001,226
34,304
101,030
?.°°5.481
5,00651,386
11,4024,99978,622
69,62539,59243,03932,85630,94580,43861,20918,386
265,6673,577
198,475986
12,403224
1,955
1,010,792
305,291
305,75980,684
163,42495,8506,685
313,398124,637192,983109,418457,221284,11093,90368,54123,060
2,319,673
5,622139,80029,0557,7219,72343,3493,862
86,31415,6067,322
115,850
464,224
2,4463,1587,0562,777
42,971
58,408
9,3175,065
14,382
58
140
4,172,910
4,42644,982
10,6014,99870,31060,11237,22738,05923,24829,40379,861
57,44318,106
126,6563,549
136,484957
12,119224
1,891
760,656
261,460
302,05878,942
162,37593,3876,565
293,057100,909187,45799,419453,531274,19481,61548,98222,732
2,205,223
5,622
134,69428,5777,7219,40840,2673,756
82,lU15,5537,308
111,379
446,429
2,4462,5957,0432,777
41,583
56,444
8,8214,572
13,393
58
140
3,743,74?
571
51
226
5,3046,8741,0611,4563,483
85347
2957
12,74728
20, 169
132
29
53,333
17,225
3
367
319172
1201,885
79327
295644
4,7254,368
22
13,740
509
75
179
2,413
3,176
79
79
952
97
87,650
9
6,353
5751
3,0082,6391,3043,5246,125
689
5303,471
273126,264
41,82229
152
35
19 n, 803
26,606
3,6Q8
1,375730
1,291
18,45622,9355,4999,9993,3959,2727,563
15,1'Sl
306
100,710
4,597478
3153,007
106
3,99153
142,058
14,619
563
13
1.309
1,
401491
341.51?
^ Grand total includes $1,69^^., ^36 thousand of demand deposits and
$2,0-i9,309 thousand of time deposits, but excludes negotiable time
certificates of deposit, which are included in "Other."
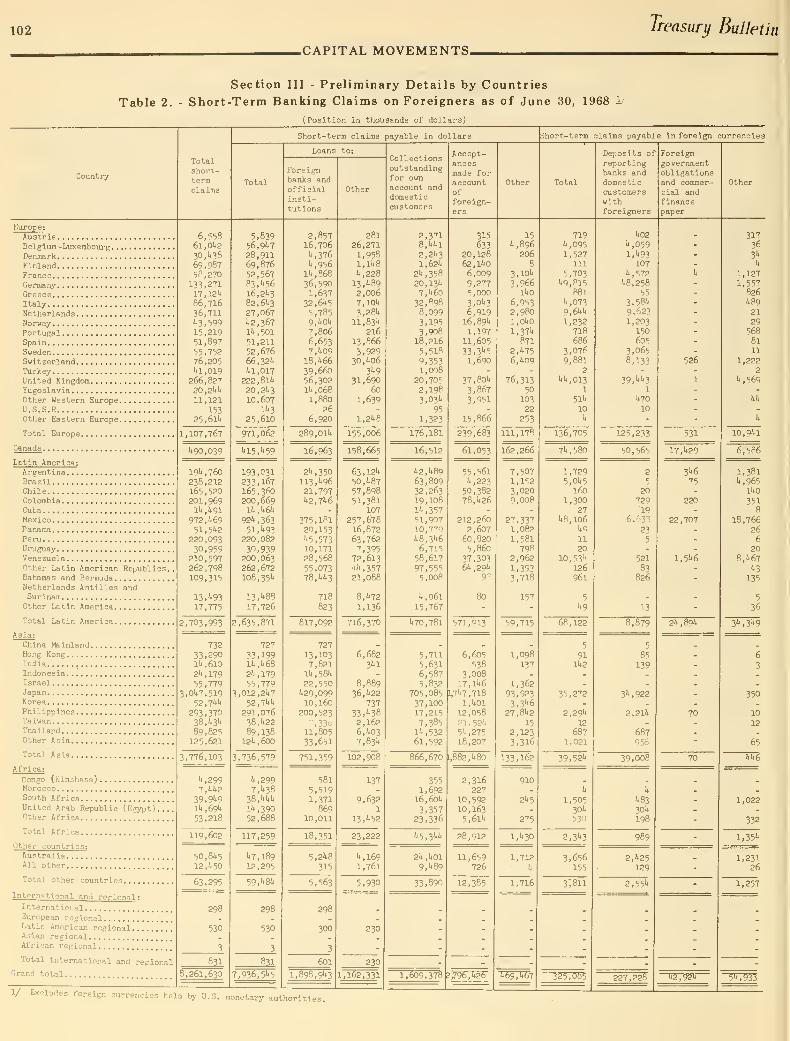
102 Treasury Bulletin
.CAPITAL MOVEMENTS.
Table 2.
Section III - Preliminary Details by Countries
Short-Term Banking Claims on Foreigners as of June 30, 1968 1/
(Position in thousands of dollars}
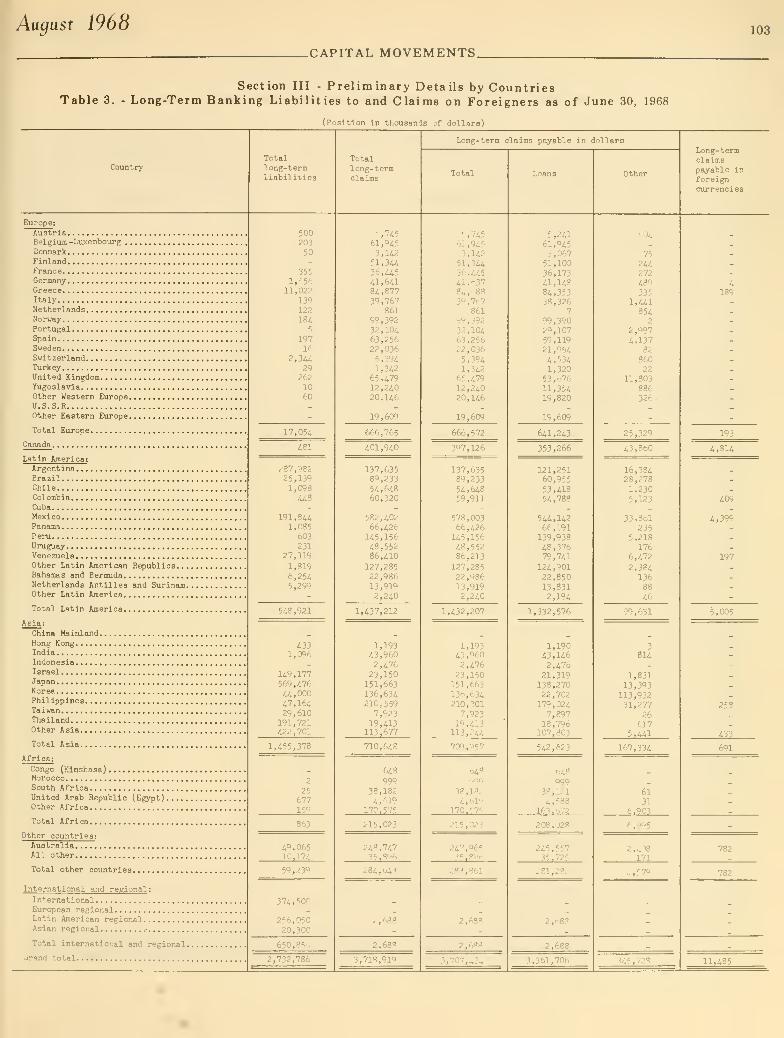
August 1968 103
.CAPITAL MOVEMENTS.
Section III - Preliminary Details by CountriesTable 3. - Long-Term Banking Liabilities to and Claims on Foreigners as of June 30, 1968
(Position in thousands of dollars)
CountryTotallong-termliabilities
Totallong-termclaims
Long-term claims payable in dollars
Loans
Long-termclaimspayable inforeigncurrencies
Europe:
AustriaBelgium -Luxembourg .
.
DenmarkFinlandFranceGermanyGreeceItalyNetherlandsNorwayPortugalSpainSwedenSwitzerlandTurkeyUnited KingdomYugoslaviaOther Western Europe.U.S.S.ROther Eastern Europe.
Total Europe
Canada
Latin Aitieri ca:
ArgentinaBrazilChileColombiaCubaMexi CO
PanamaP eruUruguayVenezuelaOther Latin American Republics...Bahamas and BermudaNetherlands Antilles and Surinam.Other Latin America
Total Latin America
Asia :
China MainlandHong KongIndiaIndonesiaIsraelJapanKoreaPhilippinesTaiwanThailandOther Asia
Total Asia
Africa;
Congo (Kinshasa)MoroccoSouth AfricaUnited Arab Republic (Egypt).Other Africa
Total Africa
Other countries:AustraliaAll other
Total other countries.
International and regional :
InternationalEuropean regionalLatin American regional...Asian regional . .
.
Total international and regional.
Cirand total
50020350
3551,556
11,022
139122iSi
5
19716
2,3U29
26210
60
17,05^
^81
;'37,98^
25,1391,098U8
191,8U1,085
603
23127,119
1,819
6,25^5,299
5^8,921
-i33
1,096
U9,177569,^76^4,000
29,610191,721^22 , 701
1,^^55,378
2
25677159
?63
<i9,06510,17i^
f,0 ,' ~xo
37i,500
256,05020,300
650,850
5,7i561,9i53,U2
51,3U36,asa,6il8i,87739,767
861
99,39232,10A63,25622,0365,39i1,342
65,47912,24020,146
19,609
666,765
401, 9iO
137,63589,23354,64860,320
582,40266,426145,15648,55286,410
127,28522,98613,9192,240
1,437,212
1,19343,9602,47623,150
151,663136,634210,559
7,92319,413
113,677
710,648
648
99938,1824,619
170.575
215,023
248,74735.896
284, u43
2,688
2 68?
5,74561,9453,142
51, 3U36,44541,63784,68839,767
86199,39232,10463,25622,0365,3941,342
65,47912,24020,146
19,609
666,572
397,126
137,63589,23354,64859,911
578,00366,426U5,15648,55286,213
127,28522,98613,9192,240
1,432,207
1,19343,9602,476
23,150151,663136,634210,301
7,9231^',413
113, "'44
709,057
648qQQ
38,1824,61'J
170.575
215,023
247,96535.896
283,861
2,688
5,24161,9453,06751,10036,17341,14884,35338,326
7
99,39029,10759,11921,9544,5341,320
53,67611,35419,820
19,609
641,243
353,266
121,25160,955
53,41854,788
544,14266,191139,93848,37679,741
124,90122,85013,8312,194
1,332,576
1,19043,1462,476
21,319138,27022,702179,0247,897
18,796107,803
542,623
648
99938,1214,588
163.672
208,028
245,55735.725
281,282
2,688
2,688
504
75
244272
489
33;
1,441354
2
2,9974,137
8286022
11,803886326.
16,38428,2781,2305,123
33,861235
5,218176
6,472
2,38413688
i6_
99,631
814
1,831
13,393113,93231,277
26617
5,441
167,334
6131
6.903
6,095
2,408171
2,579
4189
193
4,814
409
4,399
197
5,005
258
Jill.
691
782
782
2,732,786 3,718,91" ,707,43.. ?, 361, 706 345,72 11,485

104Treasury Bulletin
.CAPITAL MOVEMENTS.
Section III - Preliminary Details by Countries
Table 4. - Purchases and Sales of Long-Term Securities by Foreigners DuringJune 1968i/
(In thousands of dollars)

August 1968.CAPITAL MOVEMENTS.
105
Section IV - Supplementary Data by Countries
Table 1. - Short-Term Liabilities to Foreigners Reported by Nonbanking Concerns
(Position at end of period in thoutandK of dollars)
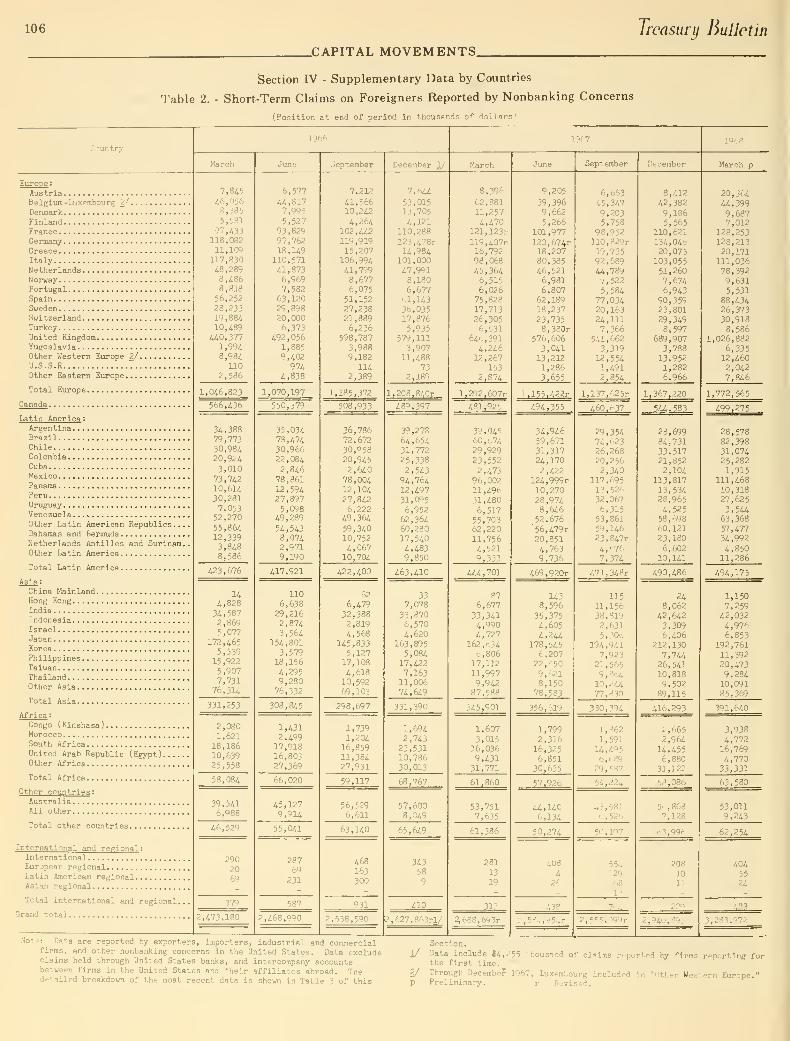
106 Treasury Bulletin
.CAPITAL MOVEMENTS.
Section IV - Supplementary Data by Countries
Table 2. - Short-Term Claims on Foreigners Reported by Nonbanking Concerns
(Position at end of period in thousands of d^llers
'
Country
Europe :
AustriaBelgium-Luxembourg 2/
DenmarkFinlandFranceGermaxiy
GreeceItalyNetherlandsNorwayPortiigal
SpainSwedenSwitzerlandTurkeyUnited KingdomYugoslaviaOther Western Europe 2/U.S.S.ROther Eastern Europe
Total Europe
Canada
Latin America :
ArgentinaBrazilChileColombiaCubaMexicoPanamaPeruUruguayVenezuela , , .<.
Other Latin American Republics....Bahamas and BermudaNetherlands Antilles and Surinam.
.
Other Latin America
Total Latin America
Asia :
China MainlandHong KongIndiaIndonesiaIsraelJapanKoreaPhilippinesTaiwanThailandOther Asia
Total Asia
Africa :
Congo ( Kinshasa
)
MoroccoSouth AfricaUnited Arab Republic (Egypt)Other Africa
Total Africa
Other countries :
AustraliaAll other
Total other countries
International and regional :
InternationalEuropean regionalLatin American regionalAsian regional
Total international and regional...
Grand total
1966
7,8i5
i6,0568,3855,531
97,«3118,08211,109
117,83048,2898,4868,81856,25228,23319,88410,489
440,3771,9948,984
1102,586
1,046,823
566,436
34,38879,77330,98420,9243,010
73,74210,61430,2817,053
52,270
55,86412,3393,8488,586
423,676
144,82834,5872,8695,077
172,465
5,53915,9225,9077,731
76,314
331,253
2,0801,621
18,18610,63925,558
58,084
39,5416,988
46,529
29020
379
2,473,180
6,577
4^,8177,9955,527
93,82997,76218,149
110,571
a, 873
6,9697,582
63,12029,89820,0006,373
492,0561,8859,402974
4,838
1,070,197
550,379
35,03478,47430,96622,084
2,84678,861
12,59427,8975,098
49,289
54,5438,0742,9719,190
417,921
110
6,63829,2162,8743,564
154,8013,579
18,1564,2959,28076,332
308,845
1,4312,49917,91816,80327,369
66,020
45,1279,914
55,041
28769
231
587
2,468,990
oepteraber
7,212
41,56610,242
4,264102,442119,91915,207
106,99441,7998,6776,075
51,15227,23821,8896,236
598,7873,9889,182
1142,389
1,185,372
508,933
36,78672,67230,95820,945
2,64078,00412,10427,8426,222
49,364
59,34010,7524,06710,704
422,400
62
6,47932,3882,8194,568
145,8335,127
17,1084,61810,59269,103
298,697
1,7391,204
16,85911,38427,931
59,117
56,5296,611
63,140
468163300
331
138, "^OQ
December 1/
7, (-44
53,01513,705
4,121110,288
123,478r14,984
101,00047,9918,1806,677
'.1,143
36,03517,8765,935
579,1113,907
11,48873
2,189
l,20a.840r
489,397
39,27864,65431,77225,338
2,54394,76412,49731,095
6,95262,36460,28017,5404,4839,850
463,410
337,078
33,8706,5704,620
163,8955,084
17,4227,163
11,00674,649
331,390
1,6942,743
23,53110,78630,013
68,767
57,6008,049
65,649
34358
9
410
-3rl,''
8,396
62,88111,2574,470
121,123r
119,407r16,79298,06845,3646,5156,02675,82817,71326,3056,531
646,3914,24612,267
1532,874
I,2a2,o07r
481,925
39,04560,67429,92923,5522,473
96,00211,49631,480
6,51755,70362,22011,7564,5219,333
444,701
876,677
33,3414,9904,727
162, 0346,806
17,112
11,9979,94287,588
J45,°01
1,6073,015
16,0369,43131,771
61,860
53,7517,635
61,386
281
13
19
313
Note: Data are reported by exporters, importers, industrial and commercialfirms, and other nonbanking concerns in the United States. Data excludeclaims held through United States banks, and intercompany accountsbetween firms in the United States and their affiliates abroad. Thedetailed breakdown of the most recent data is shown in Table 3 of this.
9,205
39,3969,6625,266
101,977120,674r18,20780,38546,5216,9816,807
62,18918,23723,7358,380r
576,6063,04113,2121,2863,655
l,155,422r
494,355
34,94659,67131,31724,1702,422
124,999r10,27028,9748,64652,676'56,479r
20,8514,7639,736
469,920r
143
8 , 596
35,3754,6054,244
178,5456,207
22,5509,6218,150
78,583
356,619
1,7992,31616,3256,851
30,635
57.926
44,1406,134
50,274
408
426
Sept ember
o,bb3
45,347
9,2035,758
98,952110 , 829r
19,73592 , 689
U,7897,5225,584
77,03420,16324,1117,366
541,6623,319
12,5541,4912,854
l,137,625r
460.637
29,35474,62326,26820,2562,340
117,69513,52632,0676,31553,86159,14623,847r
4,6767,374
471,348r
115
11,15638,8192,6315,306
194,9417,923
21,5659,86410,24477,830
380,3'^4
1,862
1,59114,4956,689
29,587
54,224
43,5316,526
50,107
55412968
13
s.oOLir
8,41242,3829,1865,565
110,621134,04620,075103,05551,2607,6746,943
90,35923,80129,3498,597
689,9073,78813,9521,2826,966
1,367,220
5.'>4,583
28,69984,73133,51721,8522,104
113,81713,53428,9654,52558,69860,12123,180
6,60210,141
490,486
248,062
42,6423,3096,406
212,130
7,74426, 54110,818
9,50239,115
..16,293
2,6652,96414,4556,88031,122
53,086
56 , 868
7,128
63,996
208
10
1:
March p
20,36444,3999,6877,012
128,253128,21320,171111,03678,3929,6315,531
88,43426,37330,9138,586
1,026,8826,33512,4602,0427,846
1,772,565
499,275
28,57882,39831,07425,2821,915
111,46810,31827,6253,544
63,36857,47734,992
4,85011,286
494,175
1,1507,259
42,0324,9766,853
192,76111,39220,4739,28410,09185,369
391,640
3,9384,77216,769
4,77033,331
63,580
53,0119,243
62,254
4045524
Section.
1/ Data include $4,255 thousand of claims reported by firms reporting forthe first time.
2/ Through December 1967, Luxembourg included in "Other Western Europe."p Preliminary. r Revised.
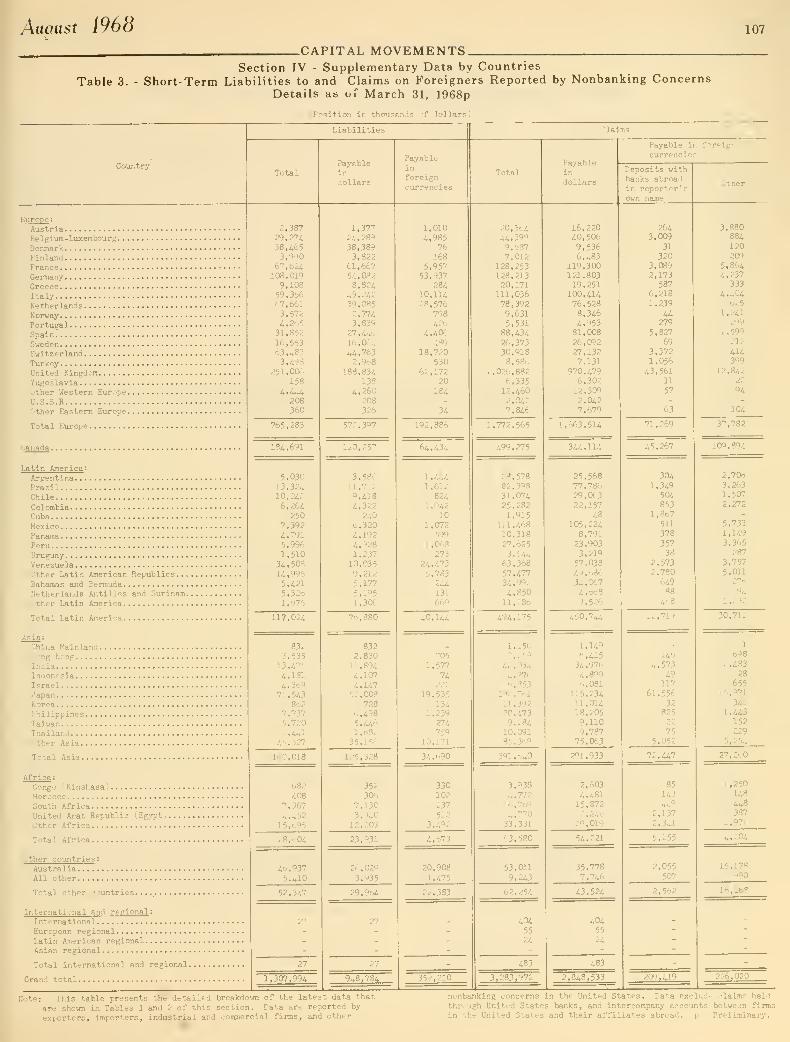
Auoust 1968 107
-CAPITAL MOVEMENTS.Section IV - Supplementary Data by Countries
Table 3. - Short-Term Liabilities to and Claims on Foreigners Reported by Nonbanking ConcernsDetails as oi March 31, 1968p
(Position in thousands of dollars)
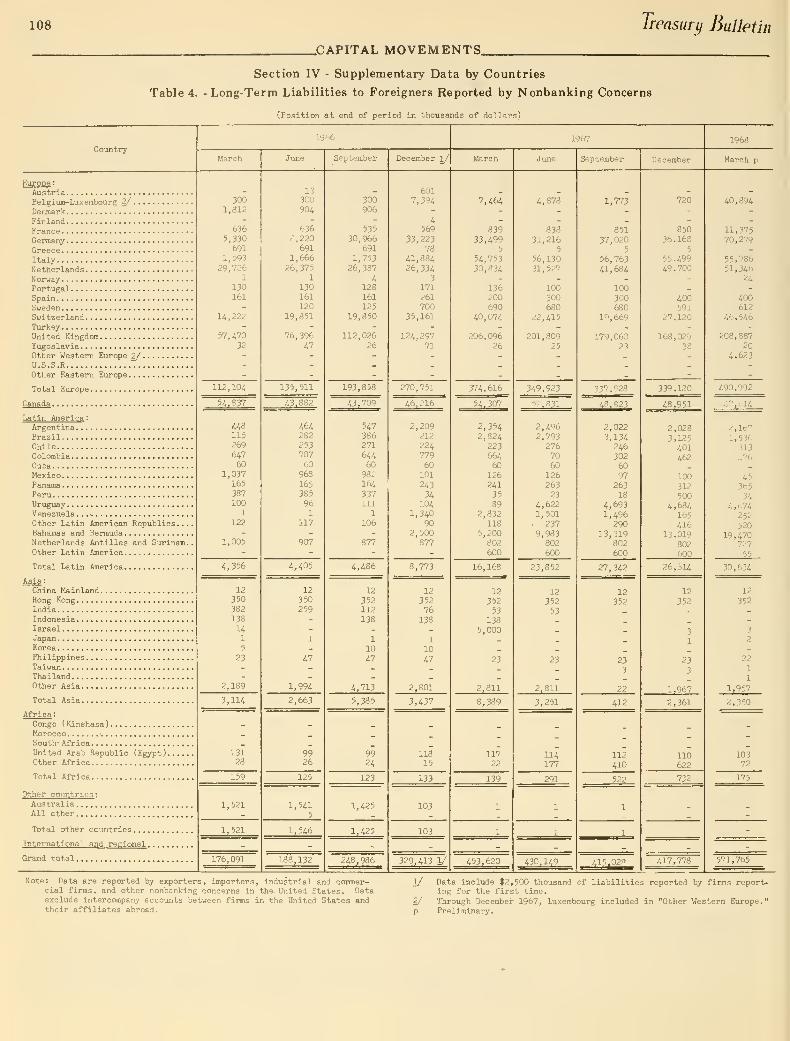
108 Treasury Bulletin
.CAPITAL MOVEMENTS.
Section IV - Supplementary Data by Countries
Table 4. - Long-Term Liabilities to Foreigners Reported by Nonbanking Concerns
(Position at end of period in thousands of dollars)
Country-
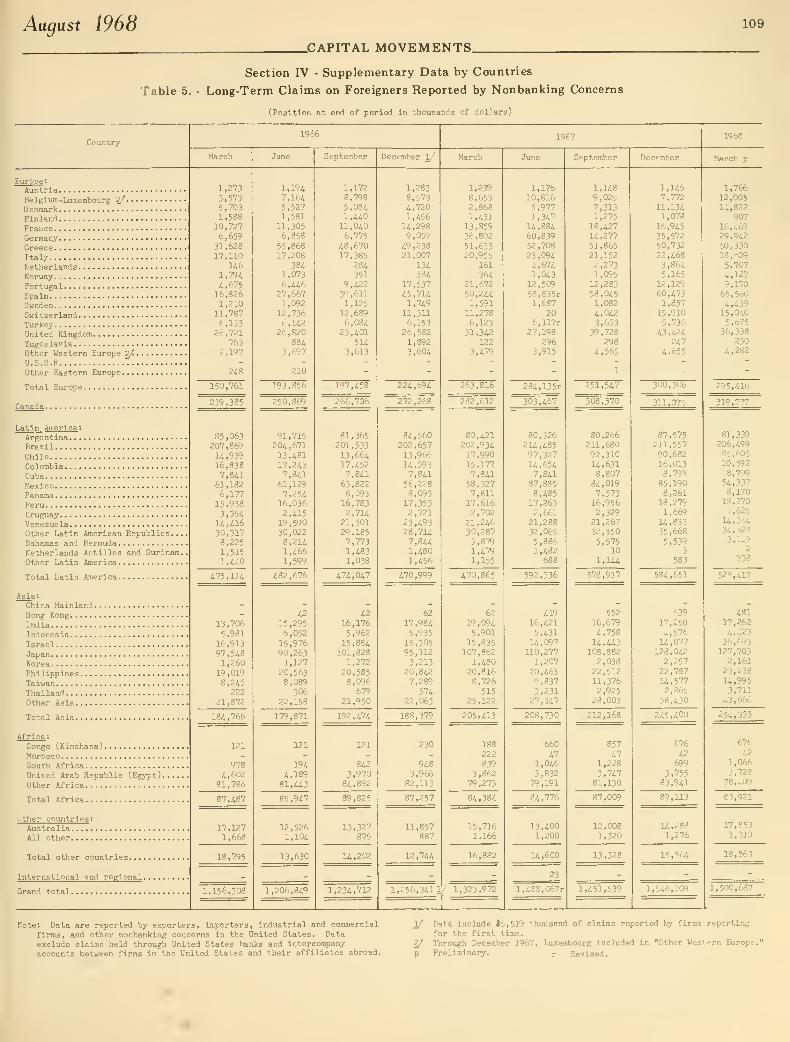
August 1968.CAPITAL MOVEMENTS.
Section IV - Supplementary Data by Countries
Table 5. - Long-Term Claims on Foreigners Reported by Nonbanking Concerns
109
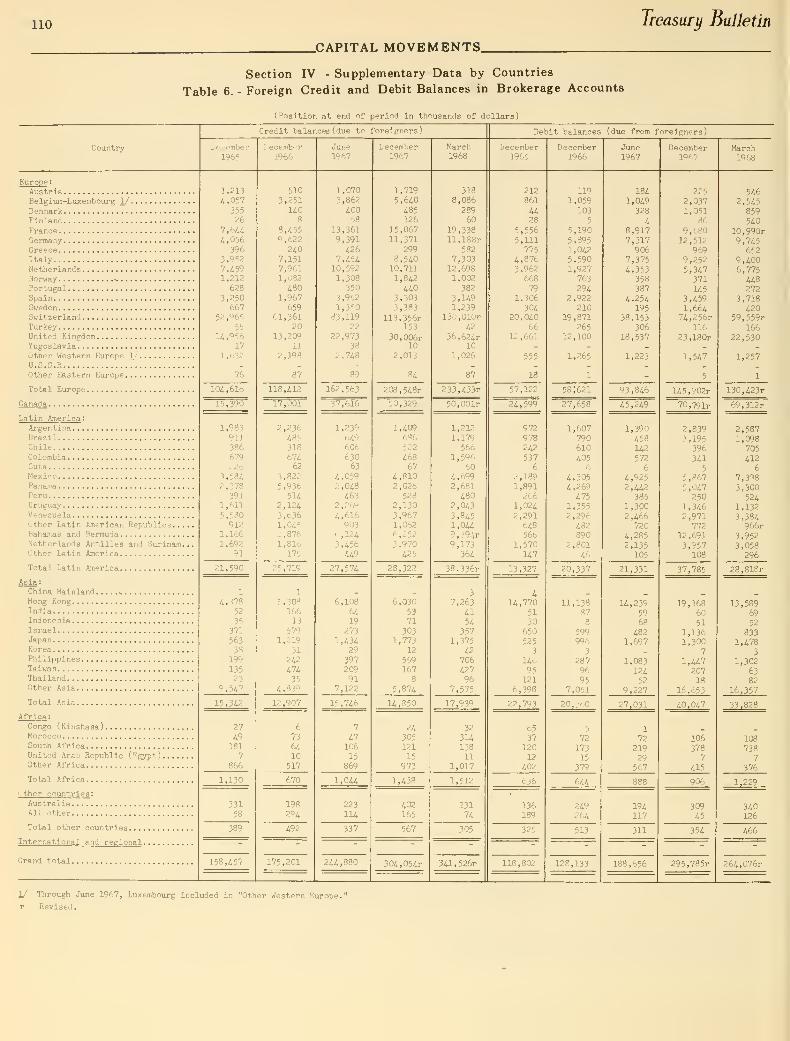
110 Treasury Bulletin
.CAPITAL MOVEMENTS,
Section IV - Supplementary Data by Countries
Table 6. - Foreign Credit and Debit Balances in Brokerage Accounts
(Position at end of period in thousands of dollars)
Country
Credit balances {due tn foreigners)
Liereinber
1965
Lecembor1966
June1967
December1967
Marc!"i
1968
Debit balances (due from foreignc-rs)
December1965
December1966
June
1967December
1967
Europe :
AustriaBelgium-Luxembourg 1/
DenmarkFinlandFranceGermanyGreeceItalyNetherlandsNorway ^
PortugalSpainSwedenSwitzerlandTurkeyUnited KingdomYugoslaviaOther Western Europe 1/
U.S.S.R Tother Eastern Europe
Total Europe
Canada
Latin America :
ArgentinaBrazilChileColombiaCubaMexinoPanamaPeruUruguayVenezuelaOther Latin American Republics..Bahamas and BermudaNetherlands Antilles and SurinamOther Latin America
Total Latin America
Asia :
China MainlandHong KongIndiaIndonesiaIsraelJapanKoreaPhilippines
,
Taiwan,
Thailand,
Other Asia,
Total Asia,
Africa :
Congo { Kinshasa
)
,
Morocco,
South Africa,
United Arab Republic (Egypt)Other Africa
,
Total Africa
Other countries:Australia
,
All other ,
Total other countries
International and regional ,
Grand total,
1,213^,057
35526
7,6Ui,056
3963,9527,4591,212628
3,250667
52,96555
U,Q5617
1.632
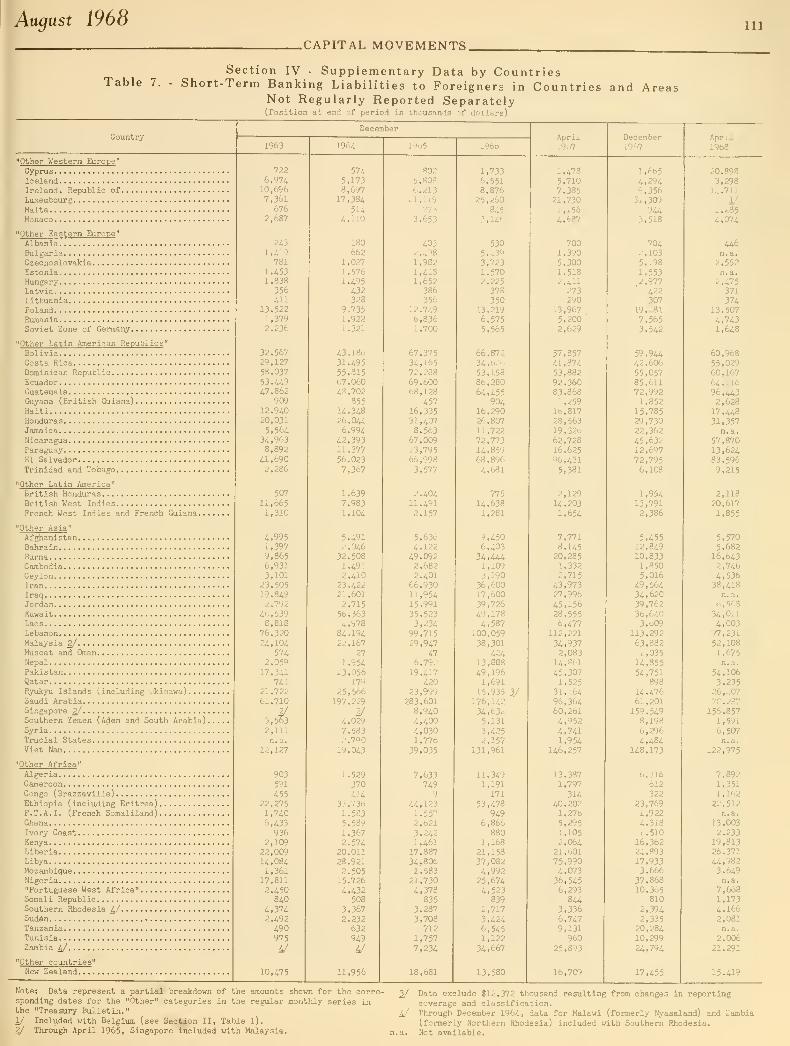
August 1968 HI.CAPITAL MOVEMENTS.
Section IV - Supplementary Data by CountriesTable 7. - Short-Term Banking Liabilities to Foreigners in Countries and Areas
Not Regularly Reported Separately(Position at end of period in thousands of dollars)
Country
"Other Western Europe "
CyprusIcelandIreland, Republic ofLuxembourgMaltaMonaco
" Other Eastern Europe "
AlbaniaBulgariaCsechoslovakiaEstoniaHungaryLatviaLithuaniaPolandRumaniaSoviet Zone of Germany
"Other Latin American Republics "
BoliviaCosta RicaDominican RepublicEcuadorGuatemalaGuyana (British Guiana)
,
HaitiHondurasJamaicaNicaraguaParaguayEl SalvadorTrinidad and Tobago
"Other Latin America "
British HondurasBritish West IndiesFrench West Indies and French Guiana.
"Other Asia "
AfghanistanBahrainBurmaCambodiaCeylonIranIraqJordanKuwaitLaosLebanonMalaysia 2/Muscat and OmanNepalPakistanQatarRyukyu Islands (including Okinawa)...Saudi ArabiaSingapore 2/Southern Yemen (Aden and South ArabiaSyriaTrucial StatesViet Nam
"Other Africa "
AlgeriaCameroonCongo (Brazzaville)Ethiopia ( Including Eritrea)F. T.A.I. (French Somaliland)GhanaIvory CoastKenyaLiberiaLibyaMozambiqueNigeria"Portuguese West Africa"Somali RepublicSouthern Rhodesia ^SuddnTanzaniaTunisiaZambia ^
"Other countries "
New Zealand
1963
722
6,97i10,6967,361
6762,687
2431,4-1-9
781
1,4531,838
356ai
13,5221,3792,236
32,56729,12758,037
53,W947,862
90912,94020,031
5,56434,9638,892
41,6902,286
507
11,6651,310
4,9951,3979,8656,9313,101
23,50519,8492,792
46,5398,81876,32024,104
5742,059
17,3U741
21,72261,710
2/3,5632,111n, a.
12,127
903591
45522,2751,7406,433936
2,10922,00914,0841,361
17,8112,450840
4,3742,492490975
V
10,475
1964
5745,1738,69717,384
5144,110
180662
1,0271,5761,495
432328
9,7351,9221,321
43,18631,49555,81567,06048,702
85514,34826,0446,994
42,39311,37756,0237,367
1,6397,9831,104
5,4912,046
32,5081,4912,410
23,42221,6012,71556,3634,978
84,19422,167
27
1,95423,056
179
25,566197,229
2/4,0297,5832,790
19,043
1,529370414
33,7361,5835,5891,3672,574
20,01128,9212,50515,7264,432
508
3,3672,232
632949
iy'-'5
11,956
802
5,8086,21321,119
7733,653
4032,4981,9821,4181,652
386356
12,7496,8361,700
67,37534,16572,28869,60068,128
45716,33531,4078,563
67,00913,79566,9983,577
2,40411,4912,157
5,6364,12249,0922,6822,401
66,93011,95415,99135,5233,234
99,71529,947
476,792
19,a?420
23,999283,6018,9404,4004,0301,776
39,035
7,633749
9
U,1231,5572,621
3,2421,461
17,88734,8061,58321,7304,378
8353,2873,708712
1,7577,234
18,681
1,7336,5518,87625,260
8453,146
530
5,4393,7231,5702,225
378350
-13,219
6,5755,565
66,87234,62653,15886,28064,155
90416,29026,80711,72272,77314,85968,8964,681
77514,6381,281
9,4506,403
34,4441,1093,190
36,60017,60039,72649,1784,587
100,05938,301
42413,88849,1961,691
15,935 1/176,14234,6325,131
3,4252,157
131,961
11,3491,191
171
53,478949
6,866880
1,16821,15837,0824,99225,6744,523
8392,7173,4246,5451,12234,667
13,580
April
1967
1,4785,7107,38521,7301,1564,687
7001,3905,3001,5182,4-11
273290
13,9675,2002,629
57,85741,87453,88292,36083,8681,259
16,81728,56319,32662,72816,62596,4315,381
2,12914,2031,654
7,7718,145
20,2851,3322,715
43,97327,99645,15628,5556,477
112,221
34,9372,08314,861
45,3071,525
31,16496,36460,2614,9524,7411,954
146,257
13,3871,797
31440,2021,2765,2951,1052,064
21,60175,9904,07336,5456,293
8443,3366,7479,131
960
25,893
16,709
December1967
l,6b5
4,2949,35631,309
9443,518
7042,1035,1981,5532,977
422307
19,1817,5653,542
59,94442,60655,05785,61172,9921,852
15,78529,73022,36245,63212,69772,7956,108
1,95413,7912,386
5,45512,84910,8331,8505,016
49,56434,62039,76236,6403,609
113,29263,8821,035
14,85554,751
898
14,47661,201159,5498,1986,2964,484
148,173
6,916612322
23,7691,9224,3181,510
16,36224,89317,9333,666
37,86810,365
810
2,3942,335
20,28410,29924,794
17,455
April1968
20,8983,298
14,7111/
1,2854,074
446n.a.
2,552n.a.
2,475371374
13,507
4,743l,-648
60,96855,02960,16764,11696,4432,62817,44831,357
n.a.
57,87013,62483,5969,215
2,11820,6171,855
5,5705,682
16,6432,7464,53638,418
n.a.
6,56834,0114,003
97,23152,1081,675n.a.
54,1063,23526,40770,287156,857
1,5916,507n.a.
122,975
7,8921,3511,16222,512
n.a.
13,0032,233
19,81326,37144,9823,649n.a.
7,6681,1734,1662,081n.a.
2,00621,291
15,419
Note: Data represent a partial breakdown of the amounts shovm for the corre-sponding dates for the "Other" categories in the regular monthly series inthe "Treasury Bulletin."1/ Included with Belgium (see Section II, Table l).
2/ Through April 1965, Singapore included with Malaysia.
^ Data exclude $12,372 thousand resulting from changes in reportingcoverage and classification.
^/ Through December 1964, data for Malawi (formerly Nyasaland) and Zambia(formerly Northern Rhodesia) included with Southern Rhodesia,
.a. Not available.

112 Treasury Bulletin
.CAPITAL MOVEMENTS.
Table 8.
Section IV - Supplementary Data by Countries
Purchases and Sales of Long-Term Securities by Foreigners During Calendar Year 1967
(In thousands of dollars)
Coimtry
Purchases by foreigners
Totalpurchases
Domestic securities Foreign securitie:
U. S.
Governmentbonds andnotes
Corporate andother
Stocks
Bonds Stocks
ales by foreigners
Totalsales
Q. S.
Governmentbonds andnotes
Domestic securities Foreign securities
Corporate andother
Bonds Stocks
Europe :
AustriaBelgiumDenmarkFinlandFranceGermanyGreeceItalyNetherlandsN orwayPortugalSpainSwedenSwitzerlandTurkeyUnited KingdomYugoslaviaOther Western Europe.U.S.S.ROther Eastern Europe.
Total Europe.
Canada
.
Latin America :
ArgentinaBrazilChileColombiaCubaMexicoPanamaPeruUruguayVenezuelaOther Latin American Republics...Bahamas and BermudaNetherlands Antilles and Sxirinam.
Other Latin America
Total Latin America
Asia :
China MainlandHong Kong
IndiaIndonesiaIsraelJapanKoreaPhilippinesTaiwanThailandOther Asia
Total Asia.
Africa :
Congo ( Kinshasa
)
MoroccoSouth AfricaUnited Arab Republic (Egypt)Other Africa
Total Africa..
Other countries :
AustraliaAll other
Total other countries.
International and regional :
InternationalEuropean regionalLatin American regional..Asian regional
Total international and regional..
Grand total
35,67i179,21835,9535,310
690,710as, 750
8,9^7283,627367,410i2,25418,50071,046102,970
3,520,292
3,9441,838,628
1,302193,224
213
1,387
.849,359
537,631
43,70928,44612,13812,912
269
Ul,64599,63612,02033,80289,55817,888
286,487197,3218,017
983 , 848
125
287,6403,476418
69,93556,2421,134
26,1445,356
15,163241,391
707,024
721
1,0405,834
11374,080
81,788
63,4679,.*27
72,394
514,6893,1704,6168,548
531,02
13,763,567
4316
639
1,025
1,240
7,98243947
231
20,00613,617
2
223,597
221
543
51
10582012
31186
452800122
2,759
94
11
850
17,711
18,6c.'
17,186
17,186
4,567502
535,400
678
23,1946,067
49135,046
53,596,316
27,74929,78112,914
396727
44,264
325,727294
687,2335
13,061
65
28,80490,2112,759
11
465,779
291,0966,240
151,631237,74711,22714,47260,71410,859
2,633,1873,494
631, 578
297
147,703213706
5,99057,51826,2715,246
64,347
39,0142,317
88,84827,10717,8593,0815,629
25,980477,309
57
178,1481,000
26,535
73
159
8,279217
4
24,513
13,80474
7,41772,336
207
551
3,7451,861
70,45297
68,072
5,704
40,798120,22449,94517,080531,340
327,3415,473
196,902291,91252,77130,52680,57292,962
3,057,3925,495
2,305,9871,069
217,775
1,361,162 4,838,728 1,102,329 ;77,i.4;
409, 1,966,192 350,163 33,50>

August 1968 113
.CORPORATIONS AND CERTAIN OTHER BUSINESS-TYPE ACTIVITIES.
Section IV - Par ticipation Certificates
(In millions of dollars - face ajnoxmts)
Fiscal yearor month
Totalparticipationcertificates
Sales Retire-ments
Out-standing
Export-Import Bankof the United States
SalesRetire-ments
Out-standing
Participation certificates issued by FNMA acting as trustee
Total
Retire-ments
fjut-
standing
Farmers HomeAdministration ^'
SalesRetire-ments
out-standing
Health, Education,and WelfareDepartment 2/
Retire-ments
Cut-standing
1962
1963
196i1965
19661967
1968p
1967- JulyAugust. . .
.
September.October. . .
November.
.
December. .
1968-January..
.
February.
.
MarchAprilMay
June p . . .
.
July
300250373750
2,601^1,311
3,820
10
1,010
1,25050
1,000
500
3066
255
AZ8831
664
38
396712
11525
8
161
U331670
129
300520827
1,322
3,4956,97610,083
6,9386,9106,8436,8316,7167,701
8,9438,8328,6899,6589,652
10,083
9,954
300250
373450761
1,411 J/570
10
10
50
500
3066
255398650 2/535
3
39
6712
85
161143116
94
300520827
1,022
1,3852,1462,183
2,X43
2,1U2,0472,0361,9511,961
1,9531,8421,6991,6881,6822,183
2,089
3001,8402,9003,250
1,000
1,250
1,000
30180180
35
3025
20
70
35
3002,1104,8307,900
4,7954,7954,7954,7954,7655,740
6,9906,9906,9907,9707,970
7,900
7,865
600
525
175
225
125
600
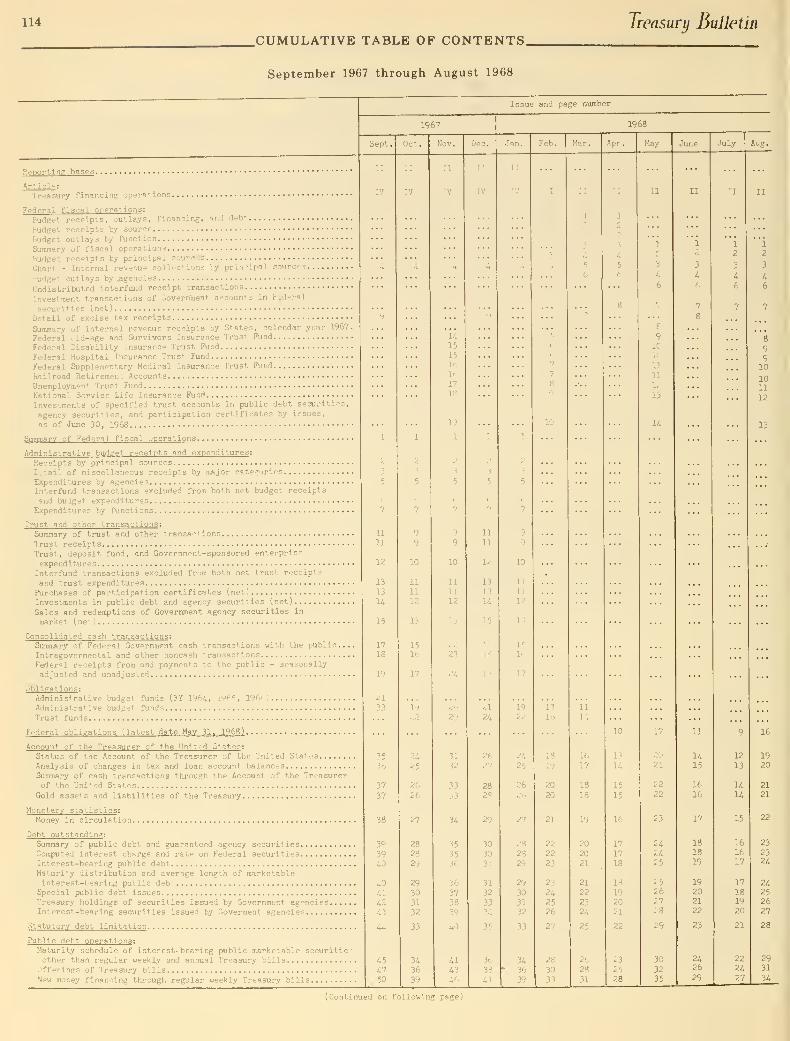
114
CUMULATIVE TABLE OF CONTENTS.Treasury Bulletin
September 1967 through August 1968
Reporting bases
Article :
Treasury financing operations
Federal fiscal operations :
Budget receipts, outlays, financing, and debt
Budget receipts by source
Budget outlays by function
Summary of fiscal operations
Budget receipts by principal sources
Chart - Internal revenue collections by principal sources
Budget outlays by ^agencies.
Undistributed interfujid receipt transactions
Investment transactions of Government accounts in Federal
securities (net)
Detail of excise tax receipts
Summary of internal revenue receipts by Slates, calendar year 1967.
Federal Old-age and Survivors Insurance Trust Fund
Federal Disability Insurance Trust Fund
Federal Hospital Insurance Trust Fund
Federal Supplementary Medical Insurance Trust Fund
Railroad Retirement AccountsUnemployment Trust F\ind
National Service Life Insurance Fund
Investments of specified trust accounts in public debt securities,
agency securities, and participation certificates by issues,
as of June 30, 1968
Summary of Federal fiscal operations
Administrative budget receipts and expenditures :
Receipts by principal sources
Detail of miscellaneous receipts by major categories
Expenditures by agenciesInterfund transactions excluded from both net budget receipts
and budget expend! turesExpenditures by functions
Trust and other transactions :
Summary of trust and other transactionsTrust receiptsTrust, deposit fund, and Government-sponsored enterprise
expendituresInterfund transactions excluded from both net trust receipts
and trust expendituresPurchases of participation certificates (net)
Investments in public debt and agency securities (net)
Sales and redemptions of Government agency securities in
market (net)
Consolidated cash transactions :
Summary of Federal Government cash transactions with the public.Intragovermental and other noncash transactionsFederal receipts from and payments to the public - seasonally
adjusted and unadjusted
Issue and page nximber
1967
Sept. Oct.
Obligations :
Administrative budget funds (FY 196^, 1965, 1966).Administrative budget fundsTrust funds
Federal obligations (latest date May 31. 1968)
Account of the Treasurer of the United States :
Status of the Account of the Treasurer of the United StatesAnalysis of changes in tax and loan account balancesSummary of cash transactions through the Account of the Treasurerof the United States
Gold assets and liabilities of the Treasury
Monetai-y statistics :
Money in circulation
Debt outstanding :
Summary of public debt and guaranteed agency securitiesComputed interest charge and rate on Federal securitiesInterest-bearing public debtMaturity distribution and average length of marketableinterest-bearing public deb^
Special public debt issuesTreasury holdings of securities issued by Government agenciesInterest-bearing securities issued by Goverment agencies
Statutory debt limitation
Public debt operations :
Maturity schedule of interest-bearing public marketable securitiesother than regular weekly and annual Treasury bills
Offerings of Treasury billsNew money financing through regular weekly Treasury bills
II
IV
11
II
13
13
15
17
18
21
33
3536
37
37
39
39
40
40
41
45
4750
11
11
12
13
15
16
19
22
24
25
26
26
27
2828
29
29
3031
32
33
34
36
39
11
11
12
31
32
33
33
34
353536
3637
38
41
4346
I'
'V
1968
^n. Feb. ?i^i-. ^ip". May
1
1
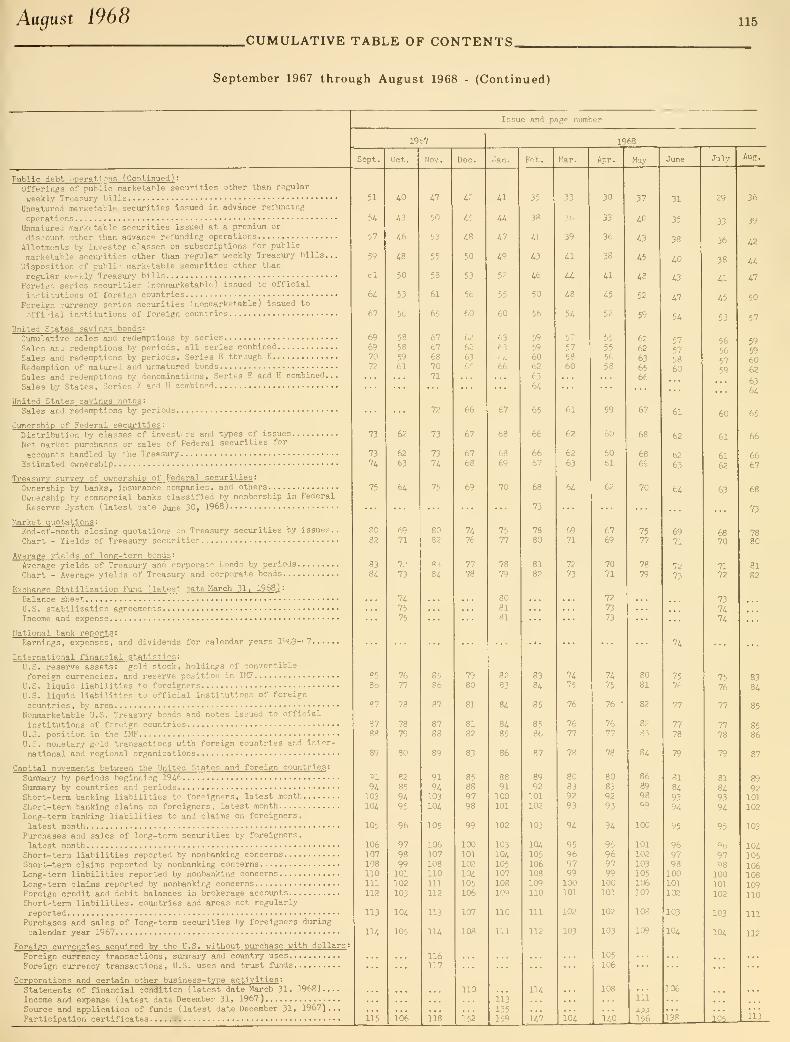
Aacjust 1968.CUMULATIVE TABLE OF CONTENTS
115
September 1967 through August 1968 - (Continued)
Public debt operations (Continued) :
Offerings of public marketable securities other than regular
weekly Treasury bills
Unmatured marketable securities issued in advance refunding
operationsUnmatured marketable securities issued at a premium or
dis::ount other than advance refunding operations
Allotments by investor classes on subscriptions for public
marketable securities other than regular weekly Treasury bills...
Disposition of public marketable securities other than
regular weekly Treasxiry bills
Foreign series securities (nonmarketable) issued to official
institutions of foreign countries
Foreign currency series securities (nonmarketable) issued to
offi jial institutions of foreign countries
United States savings bonds :
Cumulative sales and redemptions by series
Sales and redemptions by periods, all series combined
Sales and redemptions by periods, Series E through K
Redemption of matured and unmatured bonds
Sales and redemptions by denominations. Series E and H combined...
Sales by States , Series E and H combined
United States savings notes :
Sales and redemptions by periods
Ownership of Federal securities :
Distribution by classes of investors and types of issues
Net market purchases or sales of Federal securities for
accounts handled by the Treasury
Estimated ownership
Treasury survey of ownership of Federal securities :
Ownership by banks, insurance companies, and others
Ownership by commercial banks classified by membership in Federal
Reserve System (latest date June 30, 1968)
Market quotations :
End-of-month closing quotations on Treasury securities by issues .
.
Chart - Yields of Treasury securities
Average yields of long-term bonds :
Average yields of Treasury and corporate bonds by periods
Chart - Average yields of Treasury and corporate bonds
Exchange Stabilization Fund (latest date March 31. 1968) :
Balance sheetU.S. stabilization agreementsIncome and expense
National bank reports :
Earnings, expenses, and dividends for calendar years 1963-^7
International financial statistics :
U.S. reserve assets: gold stock, holdings of convertible
foreign currencies, and reserve position in IMF
U.S. liquid liabilities to foreigners
U.S. liquid liabilities to official institutions of foreign
countries, by areaNonmarketable U.S. Treasury bonds and notes issued to official
institutions of foreign countriesU.S. position in the IMFU.S. monetary gold transactions with foreign countries and inter-
national and regional organizations
Capital movements between the United States and foreign countries :
Summary by periods beginning 19A6Slimmary by countries and periodsShort-term banking liabilities to foreigners, latest month
Short-term banking claims on foreigners , latest month
Long-term banking liabilities to and claims on foreigners,
latest monthPurchases and sales of long-term seciurities by foreigners,
latest monthShort-terra liabilities reported by nonbanking concernsShoi-L-term claims reported by nonbanking concernsLong-term liabilities reported by nonbanking concerns
Long-term claims reported by nonbanking concernsForeign credit and debit balances in brokerage accounts
Short-term liabilities, countries and areas not regularly
reportedPurchases and sales of long-term securities by foreigners during
calendar year 1967
Foreign currencies acquired by the U.S. without purchase with dollars
Foreign ciurrency transactions, summary and country uses
Foreign currency transactions, U.S. uses and trust funds
Corporations and certain other business-type activities :
Statements of financial condition (latest date March 31. 1968)
Income and expense (latest date December 31, 1967)Source and application of funds (latest date December 31, 1967)...
Participation certificates
Issue and page number
1967
S6pt.
51
54
57
59
61
U67
69
697072
73
73
74
75
8082
83
84
85
86
87
8788
89
9194103104
105
106107108110
111112
113
114
40
43
46
48
50
53
56
58
58
59:i
62
63
64
69
71
''4
75
75
7677
78
78
79
82
85
9495
96
979899101102
103
104
105
47
50
53
67687071
73
74
75
8082
81
84
115 106
8586
8788
89
91
94103
104
105
106107
108110111112
113
114
116117
118
42
45
48
50
53
56
1,0
62
62
6365
67
67
69
7476
7778
7980
81
8182
83
8588
9793
99
100101102
104105106
107
108
1968
152
41
44
47
4^
55
hO
63
63
6466
68
68
69
70
7577
78
79
8181
82
83
84
8485
91100101
102
103104105107108109
110
113
135159
38
41
43
4n
50
59
5960
64
65
6667
73
78
80
81
83
84
85
8586
8992
101102
103
104105106108
109110
111
112
114
H7
33
36
39
41
4A
48
54
57
575860
61
62
62
63
64
69
71
72
73
7475
76
76
77
78
80
839293
94
95969799100101
102
103
Apr . May
104
30
33
36
38
41
45
52
55
55
56
58
59
60
61
62
6769
7071
72
73
73
74
75
76
7677
78
83
9293
94
95969799100101
102
103
105
106
108
140
37
40
43
45
48
52
59
62
62
63
6566
67
68
69
7577
78
79
8081
82
82
83
84
86
89
9899
100
101102
103105106107
108
109
111
31
35
38
40
43
47
54
57
575860
62
62
63
69
71
72
73
75
76
77
77
78
79
81
849394
95
969798100101102
103
104
2^
33
36
38
41
45
53
56
56
5759
60
61
61
62
63
70
71
73
74
74
75
76
77
77
78
79
81
8493
94
95
969798100101102
103
104
156 L138 -lOi-


Treas.HJ10.A2
1968C.2
U.S. Treasury Dept.
Treasury Bulletin
*^ai*'

1 0004255