treasury-federal reserve study of the u.s* government ... · treasury-federal reserve study of the...
TRANSCRIPT

TREASURY-FeDEral Reserve Study of the U.S* Government Securities Market
THE FINANCIAL AND ECONOMIC ENVIRONMENT OF THE 1960'S IN RELATION TO THE U.S. GOVERNMENT SECURITIES MARKET
Staff Study prepared by Edward C. E£tin Economist, Board of Governors Appendix prepared by Carl H. Stem Economist, Board of Governors January 1967
Digitized for FRASER http://fraser.stlouisfed.org/ Federal Reserve Bank of St. Louis
THE FEDERAL
RESERVE RANK of ST. LOUIS
Research Library
Digitized for FRASER http://fraser.stlouisfed.org/ Federal Reserve Bank of St. Louis

TABLE OF CONTENTS
Page
LIST OF TABLES ii:L
LIST OF CHARTS i v
I. Introduction 1 II. Basic Characteristics of the American Economy in the 1960's . . . 5 III. Public Policy 12
Fiscal Policy • • • • • • « • • • • • • • • » • • • « • • • • * 12 Debt Management and Federal Reserve Open Market Operations. . . 16
Stance of Monetary Policy 18 Federal Reserve Open Market Operations: Size and Activity . 20 Federal Reserve Operations: Maturity Structure 23 Treasury Operations: Maturity Structure of New Issues . • . 26 Treasury Operations: Investment Accounts . . . « 30
Public Policy: Effects 33 IV. Changing Environment of Private Financial Markets 41
Federal Funds and Time Deposit Growth 42 Federal Funds Markets 42 T i m e Deposits 43
Banking Innovations and Financial Markets . . 50 Interest Rate Structure 50 Interest Rate Stability 52 Dealer Loan Rates 54 Corporate Demand for Treasury Securities 56 Bank Demands for Treasury Securities 60
Innovations in Private Markets: Effects 67 V. General Conclusions 68
APPENDIX: The Changing International Financial Environment and Foreign Demand for U.S. Treasury Issues 77
The Foreign Demand for Financial Assets in the United States. . 79 The Foreign Demand for U.S. Treasury Issues 82 Development in the International Financial Environment 91 Summary and Conclusions 94
i
Digitized for FRASER http://fraser.stlouisfed.org/ Federal Reserve Bank of St. Louis

LIST OF TABLES
Table Page
1. Average Annual Federal Reserve System Transactions in U.S. Government Securities 21
2. Maturity Distribution of Federal Reserve System Transactions . . 25 3. Change in Outstanding Marketable U.S. Government Securities,
By Maturity 27 4. Maturity of Bonds Issued by U.S. Treasury 28 5. Change in Holdings of Marketable U.S. Government Securities of
Treasury Official Accounts, By Maturity. . 32 6. Changes in Outstanding U.S. Government Marketable Securities, By
Ownership . . . . 35 7. Changes in Outstanding U.S. Government Marketable Securities, By
Ownership and Maturity 36 8. Gross Volume of Federal Funds Transactions, 46 Major Banks,
1960-65 42 9. Share of Outstanding U.S. Marketable Government Securities
Held by Commercial Banks, End of Year 66
ii
Digitized for FRASER http://fraser.stlouisfed.org/ Federal Reserve Bank of St. Louis

LIST OF CHARTS
Figure Page
1. Gross National Product, 1948-65 2 2. Output, Unemployment, Costs, and Prices, 1954-66 3 3. U.S. Balance of Payments, 1954-66 4 4. Business Investment, 1954-66 8 5. Capital Outlays: Capacity and Financing. . . . 9 6. Interest Rates, 1954-66 10 7. Credit Flows, 1954-66 11 8. U.S. Government Consolidated Cash Budget, Calendar 1954-66 . . . 14 9. Full Employment Budget Surplus, 1956-66 15 10. Annual Increase in Federal Debt, 1954-65 17 11. Member Bank Reserves and Discount Rate 19 12. Annual Change in Ownership of Direct Marketable Federal Debt . > <> 34 13. Dealer Inventories in U.S. Government Bonds, By Maturity, 1961-65 38 14. Commercial Bank Deposits, 1953-65 44 15. Commercial Bank Credit, 1954-60 and 1961-65 47 16. Financial Asset Acquisitions of Private Domestic Nonfinancial
Public 48 17. Commercial Bank Share of Selected Credit Markets 49 18. Composition of Borrowing by Nonfinancial Public 51 19. Week«*to~week Fluctuations in 3-month Treasury Bill Rate, Market
Yield, 1954-65 53 20. Yield Spreads Between Various Financial Assets, 1954-65 55 21. Bank Loan Rates to U.S. Government Security Dealers, 1955-65 . . 57 22. Bank Loan Rates to U.S. Government Security Dealers, 1955-65 . . 58 23. Liquid Asset Acquisitions of Corporate Nonfinancial Business,
1954-65 59 24. Commercial Bank Holdings of U.S. Treasury Securities as a
Percentage of Total Bank Assets, 1954-65 61 25. Maturity Composition of U.S. Government Security Holdings, All
Insured Commercial Banks, 1954-65 62 26. Maturity Composition of U.S. Government Security Holdings,
New York City Member Banks, 1954-65 63 27. Maturity Composition of U.S. Government Security Holdings,
Reserve City Member Banks other than New York and Chicago, 1954-65 64
28. Maturity Composition of U.S. Government Security Holdings, Country Member Banks 65
29. Outstanding Credit Market Debt and U.S. Government Securities Held by Public, 1954-65 73
30. Holdings of U.S. Government Securities as a Percentage of Finan-cial Asset Holdings, Various Sectors, 1954-65 74
iii
Digitized for FRASER http://fraser.stlouisfed.org/ Federal Reserve Bank of St. Louis

Page
A-l. U.S. Balance of Payments Deficit, 1954-65 81 A-2. Short-term Liabilities to Foreigners Reported by Banks in the
U.S., 1951-65 83 A-3. U.S. Short-term Liabilities to Foreigners, Percentage
Distribution, 1951-65 85 A-4. Short-term Liabilities to Foreigners, Reported by Banks in the
U.S., 1954-65 86 A-5. Official Foreign Short-term Dollar Holdings in the U.S.,
Percentage Distribution, 1954-65 . 87 A-60 Foreign Commercial Bank Short-term Dollar Holdings in U.S.,
Percentage Distribution, 1954-65 89 A-7. Foreign Non-Bank Private Short-term Dollar Holdings in the U.S.,
Percentage Distribution, 1954-65 90
iv
Digitized for FRASER http://fraser.stlouisfed.org/ Federal Reserve Bank of St. Louis

THE FINANCIAL AND ECONOMIC ENVIRONMENT OF THE 1960's IN RELATION TO THE U.S. GOVERNMENT SECURITIES MARKET
I. Introduction
The American economy since 1960 has been quite different from that
of the previous 15 y e a r s ^ In the earlier postwar years, output traced
considerably more cyclical movement (Chart 1). In the second half of the
1940,s, the economy was dominated by the heavy pent-up deferred demands of
the 1930's and World War II, culminating in the first postwar recession of
1949. The early 1950fs were dominated by the Korean conflict; the recovery
from the recession of 1954 evolved into a capital goods boom ending in the
recession of 1957-58; and a sharp but brief expansion in 1958-60 failed to
bring the economy to full employment prior to the mild economic downturn
of 1960.
Throughout most of the first half of the present decade, on the
other hand, economic growth was steady—tracing out the longest peacetime
expansion on record—and prices and costs were remarkably stable for most
of the period (Chart 2). This desirable state of affairs was marred, how-
ever, by relatively high, although irregularly declining, unemployment, £
and by a continued balance of payments deficit (Charts 2 and 3). In
addition, after mid-1965 the greater expenditures associated with the war
in Vietnam, placed on top of an expanding economy, led to increasing
prices and shortages in some areas.
1/ Because of the timing of its preparation, this paper will focus on the 1960-65 period, with only passing reference to later developments. The first half of the decade was a period of innovation in financial markets and in public policies, and encompasses the essential background for an analysis of the changing structure and performance of the U.S. Government securities market.
Digitized for FRASER http://fraser.stlouisfed.org/ Federal Reserve Bank of St. Louis
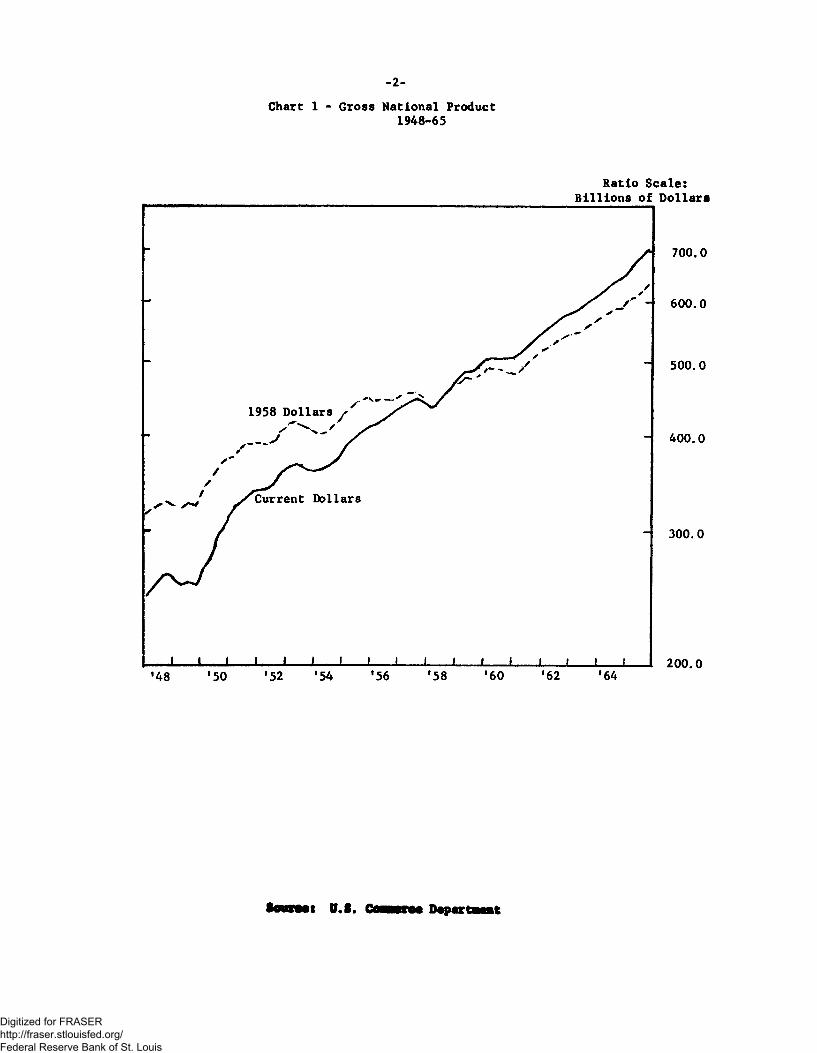
-?2-Chart 1 - Gross National Product
1948-65
Ratio Scale: Billions of Dollars
SMKMS U.S. rn—rm Department
Digitized for FRASER http://fraser.stlouisfed.org/ Federal Reserve Bank of St. Louis
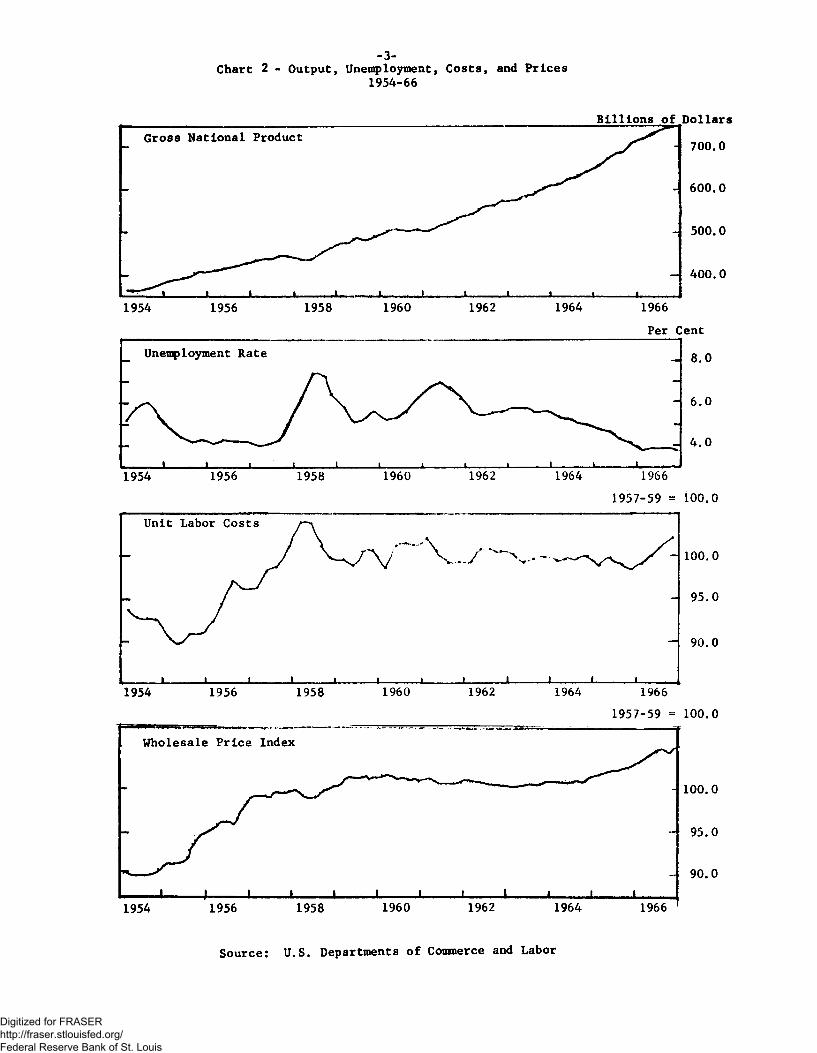
-3-Chart 2 - Output, Unemployment, Costs, and Prices
1954-66
Billions of Dollars
Per Cent
1957-59 « 100.0
1957-59 = 100.0
Source: U.S. Departments of Commerce and Labor
Digitized for FRASER http://fraser.stlouisfed.org/ Federal Reserve Bank of St. Louis

-k-Chart 3 - U.S. Balance of Payments
1954-66
Billions of Dollars Balance on Goods and Services
J I J 1 I I ' t l_ 1 I
8.0
6.0
4.0
2.0
1954 1956 1958 1960 1962 1964 1966
Billions of Dollars Net Capital Flows
8.0
6.0
4.0
2.0
[ 1954
—1 L. 1. 1956
i
- L 1958
, 1 I . 1960
1 I 1962
I 1 1 1964 1966
Billions of Surplus (+) or Deficit ( - )
Official rr-t
Dollars
1954 1956 1964 1966
Source: U.S. Departaent of Conmerce NOTE: 1966 latiaated.
Digitized for FRASER http://fraser.stlouisfed.org/ Federal Reserve Bank of St. Louis

-5-
Partially as a result of the different problems faced over the
period, and partially as a result of the lessons learned earlier in the
postwar years, public policies were altered—in some cases markedly. At
the same time, and interacting with basic economic forces and public
policies followed, the financial system itself saw a number of innovations
and evolutions.
All of these changes in the 1960's were reflected in financial
markets. This paper will attempt to relate the different economic and
financial environment of the 1960fs to developments in one financial
market: that for marketable U.S. Government securities. The basic char-
acteristics of the economy of the 1960fs will be discussed in the second
section of this paper, and will be followed by a discussion of public
policy in the next section. Then changes in the financial environment
originating basically outside of shifts in public policy will be discussed.
In the final section of the paper, all of these factors will be related
to the changing nature of the Government securities market. An appendix
will discuss in more detail international developments and their effect
on this market.
II. Basic Characteristics of the American Economy in the 1960fs
During the first six years of the 1960's, the American economy
experienced the longest peacetime period of uninterrupted expansion on
record. Growth during most of the period was accompanied by unusual
stability in financial markets and in prices. In the later part of 1965
and in 1966, however, large and rising defense expenditures related to
Digitized for FRASER http://fraser.stlouisfed.org/ Federal Reserve Bank of St. Louis

-?6-
Vietnam contributed to an erosion of price stability and to the emergence
of characteristics in the economy—such as large inventory accumulation and
plant and equipment outlays—in the past associated with the development of
cyclical instabilities in the economy.
Partly because of the unusually long period of uninterrupted
expansion, the average annual rate of growth of real GNP over the first
half of the decade was quite large—about 4.6 per cent, or almost twice
the rate shown from 1957 to 1960 and also from 1953 to 1957. While the
length and size of the upswing from 1960 to 19.65 are the hallmarks of the
period, other characteristics are also of great importance. Throughout the
period, for example, the U.S. balance of payments deficit remained quite
large (Chart 3). While American exports continued to exceed imports,
capital outflows—both private and governmental—prosperity abroad,
attractive substitute assets, and foreign policies both widened the U.S.
payments deficit and accelerated the rate of gold outflow. As a result,
U.S. policies had to cope with a payments deficit—which had presented
little difficulty in the earlier postwar period—in such a way as to
reduce outflows during a period when domestic output was below the full-
employment level.
On the domestic scene, growth in output was steady and balanced,
and prices and costs showed unusual stability from earljr 1961 until the first
half of 1965. Unemployment rates, on the other hand, remained higher than
in the mid-1950fs. After declining in 1961, they showed little change until
Digitized for FRASER http://fraser.stlouisfed.org/ Federal Reserve Bank of St. Louis

-7-
1964, when they started down again. After about mid-1965, the advance in
output began to accelerate, capital expenditures continued to rise sharply,
increasing as a share of GNP, unemployment rates declined to levels of the
mid-1950fs, and price increases became more general.
The orderliness of the expansion in the early 1960fs stands in
sharp contrast to the 1950,s when plant, equipment, and inventory expenditures
increased more rapidly than consumer demands.(Chart . At the same time,
the cost and price stability of this period was in sharp contrast to the
middle 1950fs and contributed importantly to the reversal of expectations
of continued inflation which had characterized the previous decade. With
fears of inflation sharply reduced, investors became more willing buyers
of long-term fixed return securities. In addition, with capital expenditures
restrained by excess capacity during much of the period and with profits large
and growing, businesses were able to finance most of their outlays from
internally generated funds (Chart 5).
Both the end of "inflationary psychology11 and the reduced rate of
new capital issues by businesses were important factors in maintaining the
relative stability of long-term yields prior to mid-1965--a sharp contrast
to previous periods of expansion (Chart 6). Total credit demands, of course,
increased each year, but only slightly more rapidly than output (Chart 7).
Earlier in the expansion, much of the increased demand for credit was accounted
for by the Federal Government and by foreigners, who found U.S. markets attractive
sources of funds, but as the expansion progressed, private credit requirements
provided the upward thrust to total credit demands.
Digitized for FRASER http://fraser.stlouisfed.org/ Federal Reserve Bank of St. Louis
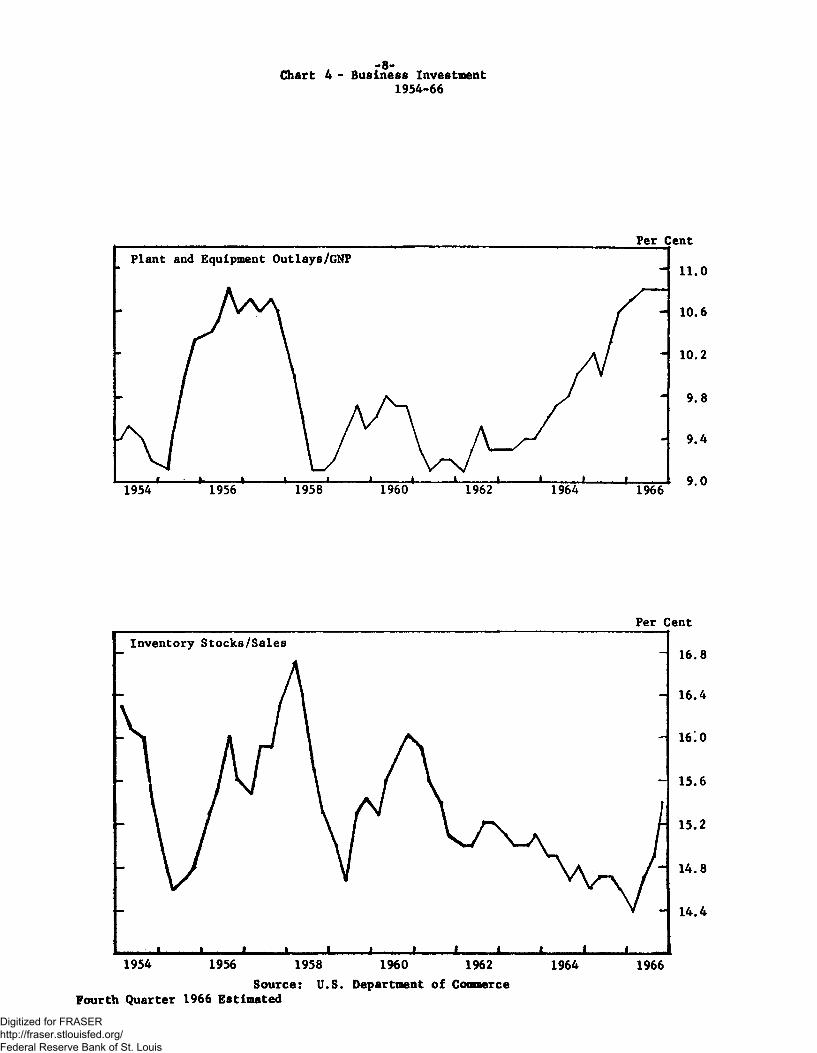
Chart 4 - Business Investment 1954-66
Per Cent
Source: U.S. Department of Commerce Fourth Quarter 1966 Estimated
Digitized for FRASER http://fraser.stlouisfed.org/ Federal Reserve Bank of St. Louis

-9-Chart 5 - Capital Outlays: Capacity and Financing
1954-66
Per cent
.90.0
. 80.0
. 70.0
Billions of Dollars Capital Outlays and Internal Fund Generation: Nonfinancial Corporations
J L
10.0
1964 1966 Billions of Dollars
.Issues of Market Securities: Nonfinancial Corporations
J 1 I I L
- 30.0
- 20.0
10.0
1954 1956 1958 1960 1962 1964 1966
Source: Federal Reserve Board and Flow-of-Funds
Digitized for FRASER http://fraser.stlouisfed.org/ Federal Reserve Bank of St. Louis

CHART 6 INTEREST RATES
cent
SHORT-TERM
1954 1956 Source: Federal Reserve Bogrd
Treasury Bills
Discount Rate
1958 1960 1962 1964 1966
Digitized for FRASER http://fraser.stlouisfed.org/ Federal Reserve Bank of St. Louis
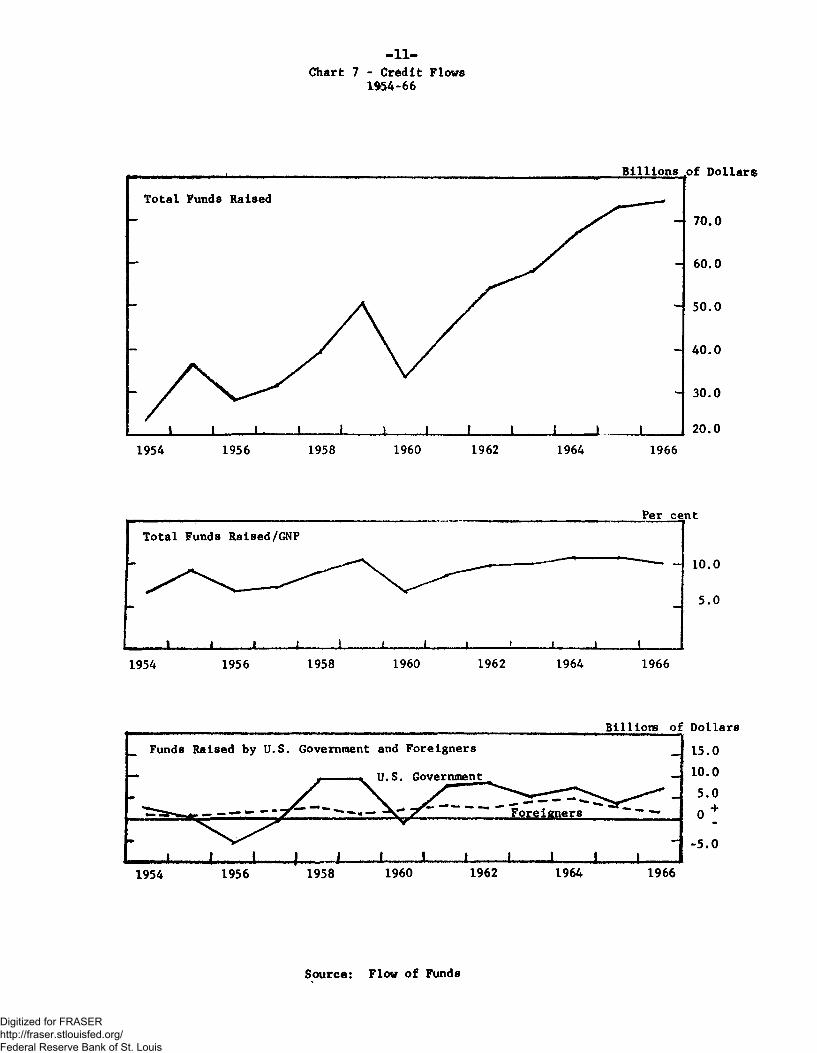
-h11-Chart 7 - Credit Flows
1*54-66
Billions .of Dollars
Total Funds Raised
Per cent Total Funds Raised/GNP
— _ 10.0
- -5.0
1 .. 1 , 1 -L 1 I 1 1 I i i 1 1954 1956 1958 1960 1962 1964 1966
Billions of Dollars 15.0 10.0
5.0 +
Funds Raised by U.S. Government and Foreigners
U.S. Government
Foreigners
i i i i 1 1 1 1 1 1 1 1 — 1954 1956 1958 i960 1962 1964 1966
0 __
-5.0
Source: Flow of Funds
Digitized for FRASER http://fraser.stlouisfed.org/ Federal Reserve Bank of St. Louis

-?12-
Other factors, such as institutional changes in the financial
mechanism, also contributed to this relative stability of long-term yields,
but the more receptive market for long-term securities and the limited demand
for funds in the capital markets until mid-1965 are crucial. After mid-1965
and in 1966, however, increasing concern about inflationary pressure, increased
demands to finance growing private capital outlays, and a marked tightening
of monetary policy were major factors in the sharp run-up in interest rates.
Not only did interest rates rise sharply but they also fluctuated more than
earlier in the decade, as financial markets became sensitive to developing
uncertainties with respect to public policies, the Vietnammese conflict,
and the stability of the economy.
III. Public Policy
In this section, the various public policies--fiscal, monetary,
and debt management--that influenced economic expansion in the 1960-65
period will be discussed in turn. Underlying mos* of the policy actions
taken was the desire to foster the growth of the economy from its low
operating rate of 1960-61--within the constraint of a persistent balance
of payments deficit.
Fiscal Policy
Throughout the early 1960's, fiscal policy was used more aggressively
as a conscious vehicle to stimulate aggregate demand than at any time in our
history. These policies to increase aggregate demand contributed importantly
to the public's expectations that the economy would continue to advance and
that the power of the Federal Government would quickly be used to counter any
economic reversal.
Digitized for FRASER http://fraser.stlouisfed.org/ Federal Reserve Bank of St. Louis

-13-
In the economic environment of the period, fiscal policy was a
particularly valuable tool for this purpose. Not only do fiscal actions
have a broadly based economic influence, but the also—unlike stimulative
monetary policies—bring no downward pressures on interest rates, and
consequently do not contribute to capital outflows that—in the 1960fs —
would have enlarged the U.S. payments deficit.
Stimulative fiscal policy actions encompassed both increased
expenditures and reductions in tax rates. Cash expenditures over the five
years 1961 through 1965 expanded by over $33 billion (Chart 8). While not
all of these increased outlays were associated with anti-cyclical policies,
three reductions in tax rates—in 1962, 1964, and 1965—were essentially
enacted in order to expand demand. Tax reductions are estimated to have
reduced tax inflows by $23.5 billion in the years the adjustments were 2/
effective.— With reduced tax rates and higher outlays, "fiscal drag"—
as indicated by the full employment surplus which estimates the amount
by which tax revenues would exceed expenditures at full employment--was
sharply reduced as in the 1960fs progressed (Chart 9).
2/ In 1962, in an effort to increase investment, depreciation guidelines were revised and on certain investments businesses could apply a credit against their tax liabilities in the year of the expenditure. It is estimated that these actions reduced tax inflows in 1962 by $12.5 billion and $1.0 billion, respectively. In 1964, in two stages, personal and corporate in-come tax rates were lowered, reducing estimated tax inflows by $7.7 billion in 1964 and $11.5 billion in 1965. In 1965 a reduction in certain excise taxes reduced tax inflow in that year by $1.9 billion. The $5.6 billion increase in social security taxes in 1966 are ignored.
Digitized for FRASER http://fraser.stlouisfed.org/ Federal Reserve Bank of St. Louis

- l i t -Chart 8 - U.S. Government Consolidated Cash Budget
Calendar 1954-66 Billions of Dollars
/ -
Cash Expenditures and Receipts
Expenditures •
/
80.0
70.0
60.0 1954 1956 1958 1960 1962 I 9b4 1966
Billions of Surplus (+) or Deficit (-)
-
\ X / \ / \
- - -
* I 1 . 1 1 . _ ! . 1 i ' 1954 1956 1958 1960 1962 1964 1966
10.0
0 *
10.0
Sources U.S. Treasury
Digitized for FRASER http://fraser.stlouisfed.org/ Federal Reserve Bank of St. Louis

-15-Chart 9 - Full Employment Budget Surplus
1956-66
t:.:
Billionsof? Dollars
Source: Federal Reserve Board
Digitized for FRASER http://fraser.stlouisfed.org/ Federal Reserve Bank of St. Louis

-?16-
With the more expansive fiscal policy of the 1960fs, the annual
cash deficit of the Federal Government averaged $5.1 billion from 1961 3/
through 1965 (Chart 8, lower panel).— For various technical reasons, the
much larger cash deficit of the 1960fs translated into an average annual
increase in the marketable debt of $5.8 billion, only slightly above the
$4.9 billion average annual increase in marketable debt from 1954 through
1960. As indicated in Chart 10, the major reason for the great increase in
marketable debt in the 1950fs was the retirement of non-marketable debt,
which was financed by increased marketable issues. Agency issues, partic-
ipation certificates, changing treasury cash balance, Treasury trust account
purchases, and special issues also influences the relationship between the
deficit and the sale of marketable securities. While this paper is concerned
primarily with marketable issues, it should be remembered that increased
reliance on agency securities and participation certificates--especially in
1966—increased the stock of financial assets that directly compete with
marketable Treasury issues for the funds of investors.
Debt Management and Federal Reserve Open Market Operations
In this section open market operations of the Federal Reserve
System and Treasury policies will be considered more or less jointly.
Both the Federal Reserve and the Treasury in the early 1960!s were guided
3/ The average annual cash deficit of $5.1 billion from 1961 through 1965 was lowered by $0,3 billion due to sales of participation certificates from 1962 through 1965 cumulating to $1.9 billion. These participation certificates are negative expenditures that reduce the cash deficit:.
Digitized for FRASER http://fraser.stlouisfed.org/ Federal Reserve Bank of St. Louis

-17-Chart 10 - Annual Increase in Federal Debt
1954-65
Direct Marketable
J L 1954
Nonmarketable
1956
1954 1956
J 1 i- L-1958 1960
1958 1960
Billions of Dollars
-J I 1 L.
+11.0
- + 9.0
+ 7.0
4- 5.0
4- 3.0
+ 1.0
0 - 1.0
1962 - 3.0
t = T
1964 Billions of Dollars
+ 2.0
0 1 = 1
2 . 0
- 4.0
1962 1964 * 6'° Billions o£ Dollars
Federal Agency and Participation Certificate Issues
I 1 T = T
JZZL
Agency JJEji issjies
:ipation Eicates
- + 2.0
» l 1954 1956
» ' ' 1958 1960 ,1 , i
1962 1964 2.0
Source: U.S. Treasury
Digitized for FRASER http://fraser.stlouisfed.org/ Federal Reserve Bank of St. Louis

-?18-
mainly by the same general objectives: to foster economic expansion while
minimizing downward pressure on short-term market rates of interest which
could contribute to accelerated capital outflows. In addition, the Treasury
also sought to lengthen and balance the structure of its outstanding debt in
order to ease the problems of refunding its maturing issues.
Stance of Monetary Policy. As the decade of the 1960fs began,
monetary policy was primarily concerned with contributing to expansion in
domestic output, which at the time was considerably below the capacity of
the economy. In furthering this objective, the Federal Reserve System
supplied reserves more rapidly than in the 1950fs (Chart 11). However, while
this increase in the stock of total reserves of member banks throughout the
first half of the decade is indicative of the generally expansive stance of
policy, a large part of the increase in the reserve base of the banking
system reflected the acceleration of time deposit inflows, to be discussed
below. As funds were shifted from other financial assets to commercial bank
time deposits, the resultant increased bank need for legal reserves was
generally supplied by the System.
In addition to fostering economic expansion, the Federal Reserve
also attempted to reduce downward pressure on short-term rates, which had
declined to very low levels in previous periods of expansive monetary policy.
Open market operations were one of the major vehicles for restraining the
downward pressure on short-term rates, but other methods were also used.
For example, in 1960 the discount rate was only reduced to 3 per cent,
whereas in 1958 it had been lowered to 1-3/4 per cent. The discount rate
Digitized for FRASER http://fraser.stlouisfed.org/ Federal Reserve Bank of St. Louis

-19-CHART 11
MEMBER BANK RESERVES AND DISCOUNT RATE 1954-65
Average Annual Growth of Total Reserves fad lusted for reserve requirement chances^
rer c
- -
- -
4.0
3.0
2.0
1.0
Millions of Briars
800.1
1954-60 1961-65 Free Reserves
1954 1955 1956 1957 1958 1959 I960 1961 1962 1963 1964 1965
Discount and Treasury Bill Rate cent
J
1 J I 1 I I I I I L
4.0
3.0
2.0
\.0
1954 1955 1956 1957 1958 1959 1960 1961 1962 1963 1964 1965 Source: Federal Reserve Board
Digitized for FRASER http://fraser.stlouisfed.org/ Federal Reserve Bank of St. Louis
-?20-
was changed relatively infrequently in the 1960 to mid-1965 period—rising
to 3-1/2 per cent in mid-1963 and to 4 per cent in late 1964. The relative
stability of the discount rate during the period reflected the steady course
of monetary policy and was taken by the market as, in part, indicative of the
likelihood for interest-rate stability.
Reflecting the expansive monetary policy, borrowings at the Federal
Reserve by member banks remained relatively small until mid-1965. Until
early 1965 excess reserves exceeded such borrowings, the longest time span
of continuous free reserves since the Accord (Chart 11). Moreover, the
level of free reserves was generally kept more stable than in earlier periods,
tending to reinforce expectations that monetary policy would not be sharply
changed. In turn, these expectations contributed to generally reduced week-
to-week fluctuations in short-term rates.
Federal Reserve Open Market Operations: Size and Activity. In the
first half of the 1960's, as compared to the 1950fs, the Federal Reserve
System was a much larger factor overall in the Government security market
(Table 1). In the 1960fs the System more than doubled its average annual
gross transactions, almost tripled its outright transactions in the market,
and almost doubled its repurchase agreements (RPfs). Moreover, and of
greater importance, the System open market account not only increased its
gross purchases and sales, but also increased its net portfolio holdings
more rapidly. Average annual net purchase increased from $200 million in
the 1950's to $2.7 billion in the first half of the 1960fs, and, as a result,
the System absorbed an amount equal to over one-half of the new issues of
marketable securities in the latter period as compared to less than 5 per cent
in the former period.
Digitized for FRASER http://fraser.stlouisfed.org/ Federal Reserve Bank of St. Louis

-?21-
Table 1
AVERAGE ANNUAL FEDERAL RESERVE SYSTEM TRANSACTIONS IN U.S. GOVERNMENT SECURITIES
(Billions of Dollars)
1954-60 1961-65
Total Transactions—^ 14.9 32.5
Outright 5.6 15.0
Repurchase Agreements 9.4 17.5
Net Purchases —^ 0.2 2.7
Net Purchases as a share of net new issues of marketable securities:
Including RP's 4.4% 52.3%
Excluding RP's 4.9% 52.7%
1/ Purchases, sales, and repurchase agreements. 2/ Change in Account Holdings.
The increased System operations in the Government security market
reflected both technical factors and a generally expansive monetary policy
which required a larger increase in the banking system's stock of legal 4/
reserves.— Part of the reason, for example, for the increase in gross
operations was a net increase in the fluctuations in factors affecting
reserves which required the System to take greater offsetting actions.
Both float and public holdings of currency moved through wider swings in
the late I9601s--due to the increased pace of transactions9 the increased demand
4/ This discussion is based on S. H. Axilrod and J. Krummack, "Federal Reserve Security Transactions," Federal Reserve Bulletin^ July 1964, pp« 822-37.
Digitized for FRASER http://fraser.stlouisfed.org/ Federal Reserve Bank of St. Louis

-?22-
for currency, and the revision in regulations permitting the use of vault
cash to satisfy legal reserve requirements--and these fluctuations were only
partially offset by the reduced variation of Treasury deposits at the Federal
Reserve following adoption of a new procedure for making calls on tax and
loan accounts. The increased net holdings of Treasury issues by the Federal
Reserve, of course, reflected the System's policy objective of fostering
expansion, but also was caused by the increased public holdings of currency
and greater gold outflows—both of which were offset by the System. In
addition, the sharper increase in bank credit that resulted from the move-
ment of funds from nonbank institutions and the market to bank time deposits
and the reduced use of changes in reserve requirements also increased the
need to supply additional reserves to the banking system.
The System also made greater use of RP's and direct transactions
with foreign accounts in the 1960-65 period, which were factors tending to
reduce interest rate fluctuations. The increased use of RPfs with dealers
to supply temporary reserve needs, it is thought, reduces fluctuations in
short-term interest rates by eliminating the downward rate pressure of out-
right System purchases and the upward pressure of System sales.—^ Transactions
5/ If it is assumed that dealers are content with their inventories at current prices, System purchases may cause dealers to bid for new inventories, and the subsequent sale may cause their inventories to rise above desired levels. With RP's the dealer knows his inventory used in the RP agreement will soon be available to satisfy customer demand. Increased use of RP fs—by making favorable financing available to dealers-may also cause dealers to hold larger inventories at each level of prices. See Axilrod and Krummack, op. cit.
Digitized for FRASER http://fraser.stlouisfed.org/ Federal Reserve Bank of St. Louis

-?23-
with foreign accounts may have less effect on market rates of interest than
similar transactions with dealers Generally, these transactions coincided
with the needs of the System to supply or absorb reserves and eliminated the
necessity of the System to, say, sell for foreign account and simultaneously
buy for its own account. According to one study, "If the market sees both
types of transactions, there is no certainty that the rate effects will
cancel out, because of the likelihood that undue weight will be given to
the System's own transactions.ff—^
Federal Reserve Operations: Maturity Structure. In addition to
increases in both the gross activity and net absorption of Treasury issues
by the System Open Market Account, Federal Reserve transactions in Government
securities were also broadened to a wider range of maturities in the early
1960!s. This action was necessitated by the need to supply reserves by
open market purchases in order to foster economic expansion, while at the
same time the System wished to avoid downward pressure on Treasury bill
rates which might accelerate the movement of short-term interest sensitive
funds abroad. In order to further these conflicting goals the Federal Open
Market Committee abandoned "bills usually11 and authorized the Manager of
JS/ Average annual System purchases from foreign accounts were $0.5 billion from 1954-60 and $2.1 billion from 1961-65; sales to foreign accounts were $0.8 billion and $1.8 billion, respectively. Increased transactions were made possible, in part, because of larger foreign holdings of Treasury issue resultant from the cumulative impact of the U.S. deficit with the rest of the world. The relatively greater increases in purchases reflected the System's need to supply relatively more reserves. The greater purchases than sales, however, tneded to shield the market from some downward pressure. V Axilrod and Krummack, 0£ . cit., p. 827.
Digitized for FRASER http://fraser.stlouisfed.org/ Federal Reserve Bank of St. Louis

-?24-
the System Open Market Account to operate in coupon issues, but still
contemplating that the bulk of operations would continue to be in bills.
As indicated in Table 2, most transactions did continue to be
carried out in bills, increasingly so each year of the 1960fs as the need
to avoid downward pressure on bill rates receeded with the general upward
movement in short-term yields. However, over the five years from 1961
through 1965, about 65 per cent of net purchases (purchases less sales)
of the System took the form of bills as compared to 87 per cent from 1954
to 1960 (third panel of Table 2). About 35 per cent of net purchases in
the 1960fs were in coupon issues with maturities of one year or greater, with
almost two-thirds of these in the 1 to 5 year maturity category (bottom
panel of Table 2). These ratios should be compard with the 1950's when less
than 1 per cent of net purchase represented coupon issues maturing in over
one year.
System net acquisitions of coupon issues were relatively larger
earlier in the 1960'd--when the need to avoid downward pressure on short-
term yields was greatest. Thus, in 1961 over three-fourths of System net
purchases were in coupon issues with maturities of one year or more, and
almost one-third of these matured in excess of 5 years. Net purchases of
over 10 year maturities were never large. However, most of the reduction
in net purchases of coupon issues as the 1960's progressed centered in the
1 to 5 year maturity range. As a result, purchases of issues maturing in
excess of 5 years became a larger proportion of System coupon acquisitions;
from 1963 to 1965 such purchases accounted for about one-half of all net
coupon acquistions by the System Account.
Digitized for FRASER http://fraser.stlouisfed.org/ Federal Reserve Bank of St. Louis

-?25-
Table 2
MATURITY DISTRIBUTION OF FEDERAL RESERVE SYSTEM TRANSACTIONS (Per Cent)
Maturity of Issues 1954-60 1961-65 1961 1962 1963 1964 1965
(Total Pui rchases) TOTAL 100.0 100.0 100.0 100.0 100.0 100.0 100.0
Bills 93.0 79.6 63.6 69.3 82.8 90.2 90.6 Coupon issues
maturing: Within 1 yr. In 1 to 5 Over 5
6.7 0.1 0.2
3.6 11.0 5.7
6.6 21.1 8.7
11.0 16.0 3.7
0.6 9.6 7.0
4.4 5.3
5.1 4.3
(T ota! . Sales) TOTAL 100.0 100.0 100.0 100.0 100.0 100.0 100.0
Bills 97.3 91.9 74.1 92.4 97.7 100.0 100.0 Coupon issues
maturing: Within 1 yr. In 1 to 5 Over 5
2.6 0.1
7.2 0.9
24.3 1.6
6.0 1.6
1.2 1.1 —
—
(Net Purchases: Purchases less sales] 1 TOTAL 100.0 100.0 100.0 100.0 100.0 100.0 100.0
Bills 87.3 64.0 42.9 19.4 67.0 79.6 83.6 Coupon issues
maturing: Within 1 yr. In 1 to 5 Over 5
12.1 * 0.5
-0.9 23.9 13.0
-28.7 59.9 25.9
22.0 47.0 11.7
*
18.6 14.4
0.1 9.3 11.0
8.8 7.6
(Net Purchases of Coupon Issues Maturing in Over 1 Year TOTAL 100.0 100.0 100.0 100.0 100.0 100.0 100.0 In 1 to 5 In 5 to 10 Over 10
5.2 46.6 48.3
64.8 29.7 5.6
69.9 25.2 4.9
80.1 17.9 2.0
56.5 38.7 4.8
45.8 43.3 10.9
53.8 36.6 9.7
NOTE: Includes purchases from and sales to dealers and foreign accounts dire* c Details may not add to totals due to rounding.
* - Less than 0.1.
Digitized for FRASER http://fraser.stlouisfed.org/ Federal Reserve Bank of St. Louis

-?26-
It should be noted that coupon transactions were not used for
day-to-day reserve adjustments purposes by the System, but rather as one
vehicle for supplying reserves. As indicated in the first and second panel
of Table 2, coupon issues maturing in more than one year, while they were
a not insignificant share of gross purchases in the 1960's, were never of
much consequence as a portion of gross sales. No securities maturing in
over 5 years were sold by the Account, and 1 to 5 year issues were never
as much as 2 per cent of sales.
Treasury Operations; Maturity Structure of New Issues. While
the Federal Reserve was absorbing a greater quantity of Government
securities, budget deficits increased the supply of marketable issues
by over $25 billion. In determining the maturity of issues to finance
these deficits, the Treasury was guided by two conflucting goals. On the
one hand, the Treasury desired to place upward pressure on short-term
yields while reducing such pressures on long-term yields, a goal that the
Federal Reserve System shared. On the other hand, in order to ease re-
financing problems, the Treasury also wanted to extend the average maturity
of the public debt.
To further the first objective, the Treasury financed about 80 per
cent of its deficit by issues of bills (Table 3). The annual increase in
bill issues during the 1961-65 period exceeded those of each post-Accord
year except 1959--when outstanding bills increased sharply as the statutory
4-1/4 per cent rate ceiling on bonds forced the Treasury to finance its
large deficit in the short-term market. Within each year of from 1961 to
Digitized for FRASER http://fraser.stlouisfed.org/ Federal Reserve Bank of St. Louis

-?27-
Table 3
CHANGE IN OUTSTANDING MARKETABLE U.S. GOVERNMENT SECURITIES BY MATURITY
Maturity of Issue Billions of Dollars Per Cent
Maturity of Issue Year! Ly Change Total 1961-65 1961-65 1954-60
Maturity of Issue 1961 1962 1963 1964 1965
Total 1961-65 1961-65 1954-60
TOTAL 7.0 6.9 4.7 4.9 2.1 25.6 100.0 100.0
Bills 4.0 4.9 3.2 5.0 3.7 20.8 81.3 57.8 Coupon issues maturing: Within 1 year 6.6 -2.0 -1.1 -5.9 1.2 -1.2 -4.7 -56.1 In 1 to 5 years -5.9 -4.8 -3.1 5.5 -3.4 -11.7 -45.7 124.7 In 5 to 10 years 1.1 14.2 1.7 0.7 -1.4 16.3 63.7 -4.7 In 10 to 20 years -1.2 -7.5 3.9 -2.3 2.3 -4.8 -18.8 -49.1 In over 20 years 2.4 2.1 0.1 1.9 -0.3 6.2 24.2 27.3
1965, the timing of Treasury bill offerings for new cash was a factor
that tended to modify tendencies for bill rates to decline. Moreover,
the reduced market stock of bills resulting from larger Federal Reserve
net purchases tended to cause the Treasury to continue to increase new bill
offerings so as to continue to add to the bill supply available for public
purchase.
The second debt management objective—extension of the average
maturity of the debt--was obviously in conflict with the increased bill
issues. To offset the effect of these larger bill sales, the Treasury
sold over $68 billion of new bonds from 1961 through 1965 (Table 4). Of
these new issues, $50 billion came out of the new advance refunding
technique and about $18.5 billion from other exchanges, cash refinancings
and new cash issues. As can be seen from Table 3, these sales of bonds
shifted 1 to 5 year coupon issues to the 5 to 10 year area, and shifted
10 to 20 year maturities to the over 20 year area. The shifting of maturities
Digitized for FRASER http://fraser.stlouisfed.org/ Federal Reserve Bank of St. Louis

28
Table 4
MATURITY OF BONDS ISSUED BY U.S. TREASURY 1961-65
(Billions of Dollars)
ADVANCE REFUNl 0INGS— OTHER!/ j. TOTAL
YEAR M< Sturity of i nwr AT . 1 Maturity f of TOTAL Maturity of TOTAL YEAR 5-10 yrs.
10-20 yrs.
20 yrs. and Over
IUJLAL J 1 5-10 yrs.
10-20 yrs .
20 yrs. and Over
TOTAL 5-10 yrs.
10-20 yrs.
20 yrs. and Over
TOTAL
1961 6.0 1.22-'
i 9.8 | 1 1.1 0.5 - - 1.6 7.1 1.7 2.6 11.4
1962 5.4 0.6 1.8*' j
7.8 ! 7.8 - - 0.4 8.2 13.2 0.6 2.2 16.0
1963 7.0 2.1 1.3 j
10.4 4.4 - - 0.6 5.0 11.4 2.1 1.9 15.4
1964 .0.4 - - 1.9 12.3 1.5 - - 1.5 10.4 1.5 1.9 13.8
1965 7.5 - - 2.2 9.7 2.1 — - - 2.1 9.6 — 2.2 11.8
Total (1961-65) 36.3 3.9 9.8 50.0 j
:
il5 .4 \ , 2.0 1.0 18.4 51.7 5.9 10.8 68.4
1/ Includes pre-refundings, junior, and senior advance refundings. Table does not include a $0.3 billion junior advance refunding and a $4.0 billion senior advance refunding, both of which occurred in 1960. All of the senior 1960 issue matured in over 20 years; all of the junior issues of 1960 matured in 5 to 10 years.
The $50 billion of advance refunding issues shown here include only bonds. An additional $9.6 billion of securities issued via advance refundings matured in less than 5 years. Of all of the $67.8 billion of securities issued under advance refunds from June 1960 through January 1965 (the last issue), $13.5 billion matured in less than five years.
2/ Senior advance refundings.
3/ Includes other exchanges9 cash refinancings, and new cash issues.
Digitized for FRASER http://fraser.stlouisfed.org/ Federal Reserve Bank of St. Louis

-?29-
outward in this fashion did serve to increase the average maturity of the
debt despite the only $5 billion net increase in new coupon issues, the
passage of time, and the greater net new bill issues.
Most of the Treasury success in shifting maturities outward
reflected the advance refunding technique, first used in 1960. Under
this procedure, the Treasury offers holders of certain outstanding issues
that will not mature for some time the option of exchanging their holdings
for new securities of longer maturity. Advance refundings do not influence
the cash position of the Treasury in the event of low exchange ratio—since
the old issue is not yet due--and gives the Treasury complete freedom of
timing.
However, the major virtue suggested for the technique is its
influence on longer-term yields. Since specific investor groups prefer
various maturities of Treasury securities, those that desire longer-term
issues tend to sell them as they pass closer to maturity, and the holders
of short-term issues do not desire to exchange their holdings for long-
term issues. Thus, the reasoning suggests, if exchanges can be offered
before outstanding obligations are shifted to short-term investors, holders
should be more willing to exchange their securities for longer-term issues.
Indeed, there is evidence that advance refundings of longer-term issues
("senior" advance refundings) are in fact carried out with small market
churning, and probably with less effect on market yields; those carried
out when the issue which can be exchanged have shorter maturities("junior
Digitized for FRASER http://fraser.stlouisfed.org/ Federal Reserve Bank of St. Louis

-?30-
advance refundings and lfpre-refundingslf) have been characterized by
relatively greater market activity and probably more additional upward • 1,1 8/ yield pressure.—
For two reasons, however, senior advance refundings were only
carried out three times in this period, the last time in early 1962.
First, those three exchanges essentially cleaned out the public holdings
of issues which would be used in senior advance refundings--i.e., public
holdings of over 5 year bonds held by groups which might be interested in
exchanging their issues for longer bonds before they passed into the
shorter-term category. Second, the core of the Treasuryfs refunding
problem has been the large amount of 1 to 5 year maturities, so that
pre-refundings and junior advance refundings have been carried out much
more frequently.
All exchanges through advance refunding have added almost $10.0
billion to the 20 year maturity area, and almost $4.0 billion to the 10 to
20 year maturity area from the end of 1960 to the end of 1965. After about
mid-1965, the statutory 4-1/4 per cent rate ceiling on bonds eliminated
the ability of the Treasury to sell longer-term issues.
Treasury Operations: Investment Accounts. In addition to
carrying out its goals by the maturity structure of new issues, the
Treasury also increased the aggressiveness with which it used its invest-
ment powers — in administering the portfolios of some Federal agencies and
trust funds—to affect the market for its own securities. These investment
8/ See Thomas R. Beard, U.S. Treasury Advance Refunding, June 1960-July 1964, (Washington: Board of Governors of the Federal Reserve System, 1965), espec. Ch. 3.
Digitized for FRASER http://fraser.stlouisfed.org/ Federal Reserve Bank of St. Louis

-?31-
accounts must allocate their funds to Government issues—either special
issues or marketable debt. In the 1960fs, trust account purchase of
marketable issues were apparently used in part to enhance the market
for Treasury debt through the subscription period of a refunding, to
assist the market's digestion of new issues, and at other times to
contribute to the smooth functioning of the market.
In the first half of the 1960fs the Treasury investment accounts
acquired $5.3 billion of marketable issues or about one-fifth of the net
new issues, as compared to less than 15 per cent of new issues from 1954
to 1960. While the amount and share of Treasury purchases did not rise
as dramatically as was the case for the Federal Reserve System, as can
be seen in Table 5 the maturity composition of Treasury acquisitions
changed considerably. Over the first half of the 1960's the Treasury
investment accounts reduced their holding of less than 1 year issues-
contributing to upward movements in short-term yields—and sharply increased
their acquisitions of long bonds. Almost 90 per cent of their net purchases
were in bonds maturing in over 5 years—as compared to somewhat over 20 per
cent in the 1950fs—and over 4 0 per cent of their net acquistion matured
in over 20 years—as compared to about 24 per cent in the 1950fs. Not only
were most of their purchases concentrated in the long bond area, but these
purchases were a large share of new issues—27 per cent of all new bonds
maturing in over 5 years and 41 per cent of all bonds maturing in over
20 years.
Digitized for FRASER http://fraser.stlouisfed.org/ Federal Reserve Bank of St. Louis

-?32-
Table 5
Change in Holdings of Marketable U.S. Government Securities of Treasury Official Accounts
By Maturity
Billions of Dollars Per Cent
Maturity of Issue Yearly Change Total 1961 1962 1963 1964 1965 1961-65 1961-65 1954-60
TOTAL 0.5 1.0 2.3 0.2 1.3 5.3 100.0 100.0
Bills - - 0.3 0.5 -0.1 -0.3 0.4 7.5 10.9
Coupon issues maturing:
Within 1 year -0.2 -0.2 -0.1 -0.5 -9.4 17.4 In 1 to 5 years -0.5 -0.5 0.5 0.5 0.8 0.8 15.1 47.8 In 5 to 10 years - - 1.1 0.3 0.1 0.3 1.8 34.0 26.1 In 10 to 20 years 0.4 -0.5 0.8 -0.5 0.4 0.6 11.3 -26.1 In over 20 years 0.8 0.6 0.3 0.4 0.1 2.2 41.5 23.9
Acquisitions as a share of net new issues (per 7.1 14.5 48.9 4.1 61.9 X 20.7 13.4 cent)
Digitized for FRASER http://fraser.stlouisfed.org/ Federal Reserve Bank of St. Louis

-?33-
These aggregate statistics clearly indicate the importance of the
Treasury's investment operations in the 1960's as a factor influencing the
long-term market. In the next section a more disaggregated analysis of
Treasury open market operations will be presented within the context of
all official operations in the 1960's.
Public Policy: Effects.
Fiscal and monetary policies contributed importantly to the economic
expansion of the first half of the 1960's. In addition, debt management and
Treasury and Federal Reserve open market operations succeed in furthering
the secondary objectives of increasing short-term rates, as well as extending
the maturity of the public debt, without bringing undue upward pressure on
long-term rates.
Despite the slightly larger average annual increase in total
marketable debt in the 1960's, the public actually absorbed considerably
less of the marketable debt, on average each year, from 1961 through 1965
than from 1954 through 1960. As indicated in Table 6, official account
purchases absorbed almost three-fourths of total new issues in the 1961-65
period--over four times the share of official account absorption in the
1950's--so that the public, on average, acquired only one-third the dollar
magnitude of marketable Treasury issues. As indicated in Chart 12, after
1962, public acquisition of marketable debt were either very small or
actually negative. With public acquisitions of marketable issues so
reduced, interest rate pressures emanating from financing requirements of
the Federal deficit were minimal.
Digitized for FRASER http://fraser.stlouisfed.org/ Federal Reserve Bank of St. Louis

-34-Chart 12 - Annual Change in Ownership of Direct Marketable Federal Debt 1954-65
Public
T Z T i — r
1955 1957 1959 1961 1963
Federal Reserve System
I \
I , I 1955 1957 1959 1961 1963
Billions of Dpllar* +12.0
» > I I I I 1 1 1 L
- +10.D
- + 8.0
- + 6.0
- + 4.0
- + 2 .0
- 2 .0
1965 Billions of Dollars
J i 1 1 1 1 i
+ 2.0
1965
U.S. Treasury Investment Accounts
r - i i . n ^ n n , — . 1 I
j 1 1 — 1955 1957 1959 1961 1963
Billions
\ I I I i I I U
of Dollars
+ 2.0
0
1965
Source: U.S. Treasury
Digitized for FRASER http://fraser.stlouisfed.org/ Federal Reserve Bank of St. Louis

-?35-
Table 6
Changes in Outstanding U.S. Government Marketable Securities By Ownership
Ownership Average Annual Change (Billions of dollars) Per Cent 1954-60 1961-65 1961-65 1954-60
TOTAL 4.9 5.1 100.0 • 100.0
Change in official Account Holdings
Federal Reserve 0.2 2.7 52.3 4.4 Treasury 0.7 1.1 20:7 13.4
Total 0.9 3.8 73.0 17.8 Change in holdings of
public 4.0 1.3 27.0 82.3
NOTE: Percentages based on actual change, not average annual change.
However, as indicated in Table 7, the much greater increase of
short-term securities led to a much larger increase in the public holdings
of Treasury issues maturing in less than one year (bills and coupon issues).
Public holdings of these securities rose by over $10 billion in this period
and contributed to upward rate pressure in the short-term markets. On the
other hand, public holdings of issues maturing in more than one year declined
by over $3 billion, and their holding of bonds due in more than 10 years
declined by almost $2 billion, tending to reduce pressure on long-term
rates. But, due mainly of the advance refunding technique, total outstandings
were shifted outward from the 1 to 5 year to the 5 to 10 year, and from
the 10 to 20 year to the over 20 year maturity categories. As a result,
Digitized for FRASER http://fraser.stlouisfed.org/ Federal Reserve Bank of St. Louis

-?36-
Table 7
Changes in Outstanding U.S. Government Marketable Securities By Ownership and Maturity
1961-65 (Billions of Dollars)
Maturity of Issue Change in
Total Outstandings
Change in Official Account
Holdings
Change in Public
Holdings Maturity of Issue Change in
Total Outstandings
Federal Reserve Treasury Total
Total 25.6 13.4 5.3 18.7 6.9
Bills 20.8 6.1 0.4 6.5 14.3
Coupon Issues Maturing:
Within 1 year -1.2 3.5 -0.5 3.0 -4.2
In 1-5 years -11.7 3.4 0.8 4.2 -15.9
In 5-10 years 16.3 0.2 1.8 2.0 14.3
In 10-20 years -4.8 -0.1 0.6 0.5 -5.2
In over 20 years 6.2 0.2 2.2 2.4 3.7
NOTE: Detail will not necessarily add due to rounding. Note that data in Table 6 were average annual changes while these data are total changes•
Digitized for FRASER http://fraser.stlouisfed.org/ Federal Reserve Bank of St. Louis

-?37-
even though the total public holdings of longer-term issues declined, the
average maturity of the debt was extended. And both official account
purchases of long-term bonds and the advance refunding technique itself,
as described earlier, tended to limit the rate impact of the shifting out-
ward in the maturity structure in the public's holdings of bonds.
The rate impact of Treasury finance, however, was not simply
due to the gross movements described above--despite their importance.
For example, the higher level of Federal Reserve transactions in Treasury
issues, was not solely a passive reaction to greater swings in the factors
affecting reserves. Given balance of payments considerations—as well as
new debt management techniques--the higher level of transactions and the
greater use of RP's and direct transactions with foreign accounts were also
directed toward stabilizing rate movements, insofar as possible without
conflicting with other Federal Reserve objectives. Short-term rate
stabilization was also generally enhanced by Treasury new issues of
additional bills when required to offset downward rate movements.
Success in longer-term rate stabilization by open market activities
of the Federal Reserve and Treasury was not merely due to jtheir gross
absorption of a not insignificant amount of coupon issues, but was related
to the timing and psychological consequences of actions. Two or three
examples are worth mentioning.
In 1963 the Treasury engaged in two advance refundings--in March
and September. As indicated in Chart 13, the March issue was associated
with very sharp increases in dealer inventories of 5 to 10 and 10 to 20
Digitized for FRASER http://fraser.stlouisfed.org/ Federal Reserve Bank of St. Louis

-38-Chart 13 - Dealer Inventories in U.S. Government Bonds By Maturity - 1961-65 (Monthly averages of Daily Figures)
Millions of Dollars
Source: Federal Reserve Board
Digitized for FRASER http://fraser.stlouisfed.org/ Federal Reserve Bank of St. Louis

-?39-
year bonds—much larger increases than had occurred in similar financings
in 1961-62, To restrain the potential upward rate movements, Treasury
purchases were stepped up. In September, when dealer holdings of 20 year
bonds rose sharply (Chart 13) Treasury activity was even more pronounced.
In September and October, the Treasury purchased $350 million of over
20 year bonds, $100 million to 10 to 20 year bonds and $150 million of
5 to 10 year bonds, assisting the dealers in sharply reducing their
inventory holdings and avoiding a possibly sharp increase in long-term
rates .
The year 1965 offers another example. In January, an advance
refunding had increased the dealer's inventory of 5 to 10 year and over
20 year securities quite sharply (Chart 13). Very little official account
purchasing in the 5 to 10 year area was made, despite which dealer
inventories moved down quickly. One large Treasury purchase($325 million)
of over 20 year bonds helped reduce dealer positions in the area. Then in
May a refinancing led to a very sharp increase in dealer holdings of 5 to
10 year bonds and dealers also began to abosrb market sales of over 20
year bonds so that dealer holdings of coupon issues became quite large over
the spring and summer at the same time that market rates began to rise from
increasing private issues and from expectations associated with the escalation
in Viet Nam. In May and June, the Federal Reserve purchased $200 million of
5 to 10 year issues and about $50 million of longer bonds which helped dealer
positions somewhat, but with inventories still quite large in the long bond
Digitized for FRASER http://fraser.stlouisfed.org/ Federal Reserve Bank of St. Louis

-?40-
area the Treasury came into the market in August and September. In those
two months the Treasury acquired $230 million of over 20 years bonds and
$150 million of other 5 to 20 year bonds in order to abosrb the market
overhang. It was exactly this kind of activity--timed hopefully to avoid
sharp rate movements--that made pfficial account activities so important
in the 1960fs, and--given the over-all calm economic and financial environ-
ment --furthered market expectations that interest rates would remain
relatively stable.
Official account activities of this intermittent sort, however,
can only offset temporary or short-run market pressures and cannot contribute
to rate stability over the long run if basic economic forces are moving
strongly in an inflationary direction. The activities of the 1960fs were
not designed to continuously counter market supply and demand, but only
to smooth the pressures. Indeed, the Treasury activities of the late
summer of 1965 were undertaken in the realization that while it was
desirable to take some overhang of securities off the market, this would
best be accomplished at a declining scale of prices in view of the fundamental
forces making for higher interest rates. The relatively sharp further
price declines subsequent to official operations was a harbinger of the
strong credit demand pressures to come later in 1965 and 1966, and signified
the impossibility of both maintaining relatively stable interest rates and
taking measures to counteract an overly expansive domestic economy.
Digitized for FRASER http://fraser.stlouisfed.org/ Federal Reserve Bank of St. Louis

-?41-
IV. Changing Environment of Private Financial Markets
Shifts in official operations and debt management techniques
were not the only changes in the financial environment that affected the
Government securities markets in the 1960fs. Financial markets in general
were sharply influenced by the growing sophistication of the banking
system—especially the more aggressive use of Federal Funds and time deposits,
the latter being fostered by more permissive regulation of rate ceilings by
the Federal Reserve. The increased use of these sources of funds affected
the portfolio policies of banks and the financing behavior of other borrowers
and lenders.
Another major change in the financial environment of the 1960fs
was the much greater international mobility of funds, related in large part
to the return to convertibility by the major European countries in the
late 1950fs. The return to convertibility, coupled with the wide and
persistent U.S. balance of payments deficit, not only contributed to a
larger gold outflow from this country, but also increased the mobility of
international capital and hence the impact of credit market conditions
abroad on U.S. markets, and vice versa. These developments, of course, were
the reason that public policies brought upward pressure on short-term
U.S. rates, but they also—along with the greater issue of attractive bank
time deposits—specifically affected foreign demand for Treasury issues.
This matter is discussed in considerably more detail in the appendix to
this paper.
Digitized for FRASER http://fraser.stlouisfed.org/ Federal Reserve Bank of St. Louis

-?42-
Federal Funds and Time Deposit Growth
Federal Funds Markets. The increased use of Federal funds in the
1960fs was a continuation of trend of the previous decade. However, over
the first six years of the present decade the gross volume of transaction
rose quite sharply; Table 8 gives a rough measure of the increasing volume
of purchases and sales by 46 major banks. Not only did the volume rise in
the 1960fs, but a greater number of banks began to take part in the market;
smaller banks, in particular, entered the market for the first time—usually
as sellers. Contributing to wider and deeper participation in the Federal
funds makret were rising levels of yields, greater sophistication in port-
folio management, and—as a result —the development of regional marekts for
the purchase and sale of Federal funds.
Table 8
Gross Volume of Federal Funds Transactions 46 Major Banks
1960-65 (Billions of Dollars)
Year Volume 1/
1960 1961 1962 1963 1964 1965
98.3 101.2 127.6 151.0 160.2 180.1
1/ Sum of weekly average of daily figures of gross purchases and gross sales.
Digitized for FRASER http://fraser.stlouisfed.org/ Federal Reserve Bank of St. Louis

-?43-
Some of the implications of these developments for financial
markets will be jointly considered below with the discussion of the effect
of increased time deposits inflows.
Time Deposits. Probably the most dramatic shift in private
financial markets in the 1960!s was the sharply increased inflow of time
and savings deposits to commercial banks. As indicated in Chart 14, the
average annual rate of time deposit inflows banks accelerated from the
6.5 per cent annual rate of 1954-60 to over 15 per cent in the 1961-65
period. This chart also indicates that, as a result, time deposits, which
were less than third of total private bank deposits in 1954, became the
dominant private deposit liability of banks by the end of 1965.
Several factors accounted for this dramatic shift in bank
liabilities. The most basic of these was to the desire of banks to regain
this competitive position relative not only to nonbank claims but also to
financial assets traded in the market. Corporations in the 1950fs had
increasingly sought to hold more of their liquid assets in earning form,
such as Treasury bills, reducing their relative holdings of demand balances.
Consumers had also shifted an increasingly larger share of their financial
asset holdings to claims on nonbank insitutions, the yield on which exceeded
the return on bank time and savings deposits by a wide margin. By offering
more attractive time deposits, banks hoped to regain some of the funds that
both groups had shifted to competing financial assets.
Banks were better able to engage in this competition because the
Federal Reserve System increased Regulation Q ceilings--which establish
the maximum rate that member banks may pay on time and savings deposits--
Digitized for FRASER http://fraser.stlouisfed.org/ Federal Reserve Bank of St. Louis

-44-Chart 14 - Commercial Bank Deposits
1953-65
Per Cent Average Annual Rate of Growth of Time Deposits
15.0
10.0
5.0
1954-60 T96T^3~
Per Cent Ratio of Time to Total Private Bank Deposit s
- -
Dec. 1953 Dec. 1960 Dec. 1965
Source: Federal Reserve Board
Digitized for FRASER http://fraser.stlouisfed.org/ Federal Reserve Bank of St. Louis

four times in the 1961-65 period, after the one previous increase since
the 19301s in 1957. The increase of 1957 and 1962 were mainly motivated
by equity reasons, since banks had been placed at a competitive disadvantage
by relatively low rate ceilings. Increasingly after 1962, however, changes
in the ceiling rate were largely carried out so that banks could remain
competitive. Prior to the 1960fs, time and savings deposit inflows had
decelerated rapidly in expansion periods when banks were unable to continue
to offer rates competitive with rates available in the market and at other 9/
institutions.— In the 1960fs, increases in Regulation Q ceilings permitted
banks to continue to attract such deposits.
Another reason for the sharp increase in time deposit growth was
that banks throughout the country aggressively used—often, were competitively
forced to use—their new rate freedom to design and offer attractively priced
deposit forms appealing to certain investor groups, such as the small
denomination certificate of deposit (CD). An even more important innovations-
which took place in early 1961—was thp decision of major New York City
banks to offer large-denomination negotiable CD's to all investor groups;
earlier these banks had refused to accept time deposits from corporate
customers. Negotiability was assured by previous agreements with Government
security dealers to make a market in the paper. With New York banks in
these markets, outstanding negotiable CD's increased from four hundred 9/ See Lyle E. Gramley and Samuel B. Chase, Jr., "Time Deposits in Monetary Analysis," Federal Reserve Bulletin, October 1965, pp. 1391-94.
Digitized for FRASER http://fraser.stlouisfed.org/ Federal Reserve Bank of St. Louis

-?46-
million dollars in early 1961 to over $16 billion in 1965. By then,
negotiable CD's were the second single largest money market instrument,
exceeded in aggregate size only by Treasury bills.
With banks increasing their deposit inflows, their rate of
increase in credit extended sharply. As indicated in Chart 15, the
average annual growth rate of bank credit was about 9 per cent from
1961 to 1965, about twice as rapid as from 1954 to 1960. In addition,
banks increased their share of total credit flows from 21 per cent in the
former period to 35 per cent in the 1960fs.
Growth in bank deposits in large part represented a diversion of
funds by the public from other financial assets—money, deposits at nonbank
institutions, and securities. The exact degree of substitution is unknown,
but as indicated in Chart 16, the public's increase in time deposit holdings
apparently came at the expense of nonbank claims and, mainly securities.
Public purchases of Treasury issues declined only modestly as a share of
total financial asset acquisitions. However, as will be discussed below,
corporate businesses sharply reduced their purchases of Treasury issues as
they acquired more time deposits. With public purchase of time deposits
sharply increased, banks acquired some of the financial assets that would
have otherwise been purchased by nonbank institutions and the public. In
particular banks acquired an enlarged share of the municipal bond and
mortgage markets (Chart 17).
Digitized for FRASER http://fraser.stlouisfed.org/ Federal Reserve Bank of St. Louis

Chart 15 - Commercial Bank Credit 1954-60 and 1961-65
ent
7.5
5.0
2.5
Share of Total Funds Supplied
- 30.0
20.0
- - 10.0
1954-60 1961-65
Source: Federal Reserve Board and Flow-of-Funds
Average Annual Growth Rate JuUEL
1961-65
Digitized for FRASER http://fraser.stlouisfed.org/ Federal Reserve Bank of St. Louis

Chart 16 - Financial Asset Acquisitions of Private Domestic Nonfinancial Public 1954-60 and 1961-65
Time Deposits
Time Deposits
Honey
Nonbank Depositary Claims Money
-
- Nonbank Depositary Claims
-Nonbank Depositary Claims
-
Other Securities
-
Other Securities
U.S. Gov't Sec. U.S. Gov11 Sec. 1954-60 1961-65
Source: Flow of Funds
Digitized for FRASER http://fraser.stlouisfed.org/ Federal Reserve Bank of St. Louis

-h9-Chart 17 - Commercial Bank Share of Selected Credit Market*
1954-60 and 1961-65
Fer .font State and Local Bonds
1954-60
- 70.0
- 50.0
- 30.0
10.0
1961-65
Mortgages Cent
20.0
10.0
1954-60 1961-65
Source: Flow of Funds
Digitized for FRASER http://fraser.stlouisfed.org/ Federal Reserve Bank of St. Louis

-?50-
Increased time deposit flows also had an effect on business
borrowing patterns. Not only did bank loans account for a greater share
the funds raised by businesses in the 1961-65 period (Chart 18), but with
an abundant supply of mortgage credit at low cost, mortgages also increased
sharply as a proportion of business credit. A larger share of these
mortgage loans were supplied by banks. With both loans and mortgages
available on easy terms, firms relied considerably less on security issues.
Banking Innovations and Financial Markets
The increased use of Federal funds and time deposits by commercial
banks were symtomatic of a more aggressive banking system. In turn, these
developments influenced private financial markets, with implications for
the demand for Treasury issues and the behavior of the Government securities
market•
Interest rate structures. From 1961 until mid-1965, short-term
rates generally rose, while long-term rates generally were unusually stable.
As indicated earlier, this was one of the goals—and results —of public
policy fostered by monetary and debt management policies. Greater time
deposit inflows of commercial banks, however, also contributed to this
so-called "Operation Twist,11 and many observers suggested that Regulation Q
changes--which permitted banks to increase their time deposits—were more
important to this development than open market operations and debt
management.
Digitized for FRASER http://fraser.stlouisfed.org/ Federal Reserve Bank of St. Louis

-51-Chartl8 - Composition of Borrowing by Nonfinancial Businesses
1954-60 and 196X-65
Vex Cent
R \ • r
i I ; i;:
i'l'l
' t' *
« I • • ; , I '
Other Securities
' / Otfier /
/ ' /
f / Other Mortgages
^Mortgages from JJa-ftkS"""
Bank Loans
: i j :. •
H.
•f'l'M
1
iiiiljUi:
- 100
1954-60 1961-65
Source: Flow of Funds
Digitized for FRASER http://fraser.stlouisfed.org/ Federal Reserve Bank of St. Louis

-?52-
Commercial banks, by increasing the supply of short-term financial
assets—particularly negotiable CDfs--added upward pressure to short-term
yields. At the same time, with less than proportional growth in business
loan demand until late 1964, with short-term yields below long-term yields,
and with increased pressure on banks to offset the higher costs of deposits,
banks stepped up their purchases of long-term assets — particularly real
estate loans, State and local bonds, and term loans to businesses. More-
over, with a greater share of credit demand—especially of businesses and
State and local governments—met at banks, the supply of long-term market
securities issued to the public was reduced. As a result of these develop-
ments, upward pressure on long-term yields; especially yields on State and
local issues and corporate bonds, were lessened considerably relative to
previous postwar expansions.
Interest rate stability. The increased use of Federal funds and
time deposits by banks was also an important factor—along with the stability
of the economy and public policies—tending to increase the stability of
market yields—particularly in the short-term markets where week-to-week
fluctuations in yields during the 1960's were considerably less than
during the 1950fs (Chart 19). During the 1960fs, not only were a greater
number of banks active in both these markets, but, in addition, the public
increased its demand for money market instruments, accelerating the trend
of the late 1950fs. With the increased number of participants and the greater
supply and variety of money market instruments, the ability of both buyers
and issuers to arbitrage between markets increased sharply. — ^
10/ See Robert W. Stone, "The Changing Structure of the Money Market," Federal Reserve Bank of New York Monthly Review» February 1965, pp. 32-38.
Digitized for FRASER http://fraser.stlouisfed.org/ Federal Reserve Bank of St. Louis

Chare 19 - Week-to-Week Fluctuation in 3-Month Treasury Bill Rate Market Yield 1954-65
Source: Federal Reserve Board
Digitized for FRASER http://fraser.stlouisfed.org/ Federal Reserve Bank of St. Louis

-?54-
Such arbitraging between an increased number of instruments which are
substitutes — in an environment where interest rate expectation were stable-
contributed importantly to reduced fluctuations in market yields. Moreover,
the new ability of banks to increase and decrease their time deposits—especially
CD's—with small shadings in rates, has significantly increased the flexibility
with which the aggregate stock of money market instruments can expand and
contract.
In addition to reduced fluctuation of short-term market yields,
developments in private financial markets growing out of bank portfolio
policies—as well as public policies and the stable growth of the 1960fs —
tended to reduce to reduce fluctuations in, and to compress the spreads
between, yields on both short- and long-term market instruments (Chart 20).
In particular, the broadening of the range of assets acquired by commercial
banks and the heightened sensitivity of all investors to rate relationships
tended to draw yields closer together. The only exception to this develop-
ment was in the municipal bond market. The very large purchases of such
securities by banks tended to reduce tax-exempt yields considerably below
other market yields. Thus, the spread between Treasury issues and municipal
bonds tended to widen in the 1960fs.
Dealer loan rates. With banks more sensitive to alternative
yields, with their greater participation in the Federal funds market, and
with their active bidding for negotiable CD's, dealer loan rates at banks
during the 1960's also tended to move more 'closely with other yields. In
turn, this closer matching by banks of opportunity costs tended to increase
the sensivity of dealer positions to market yields.
Digitized for FRASER http://fraser.stlouisfed.org/ Federal Reserve Bank of St. Louis
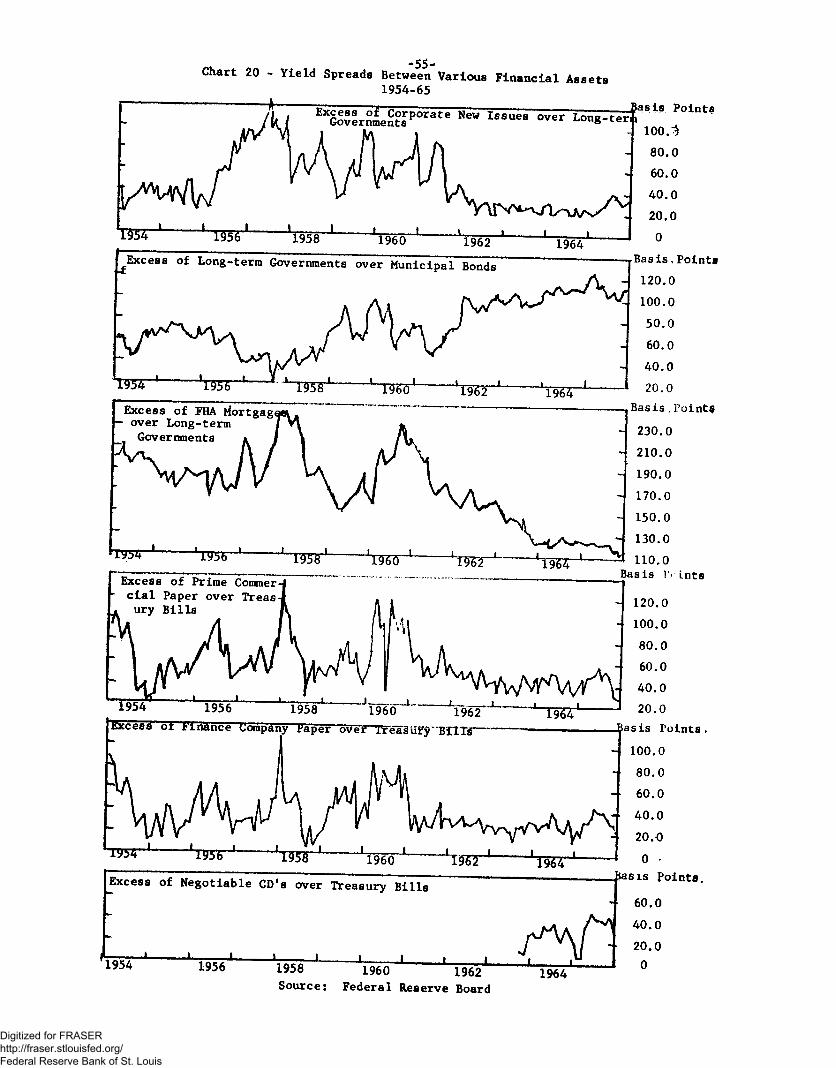
Chart 20 - Yield Spreads Between Various Financial Assets 1954-65
I960 1962 Federal Reserve Board
Digitized for FRASER http://fraser.stlouisfed.org/ Federal Reserve Bank of St. Louis

-?56-
As a result, dealer loan rates at both New York and outside banks
moved closer to the bill and Federal Funds rate, with the yield on these
alternative bank assets tending to act as a floor to dealer loan rates
(Chart 21). In addition, dealer loan rates at New York and outside banks
moved closer together in the 1960fs, and at both groups of banks also
tended to move closer to the discount rate (Chart 22). It might be noted
that in 1966 when the discount rate became out of touch with market rates,
dealer loan rates were fairly closely tied to the Federal funds rate,
with the latter rate acting as a floor under dealer loan rates for much
of the time.
Corporate demand for Treasury Securities. The major buyers of
the increased ussues of negotiable CD's are nonfinancial corporations.
The 20 to 40 basis points premium of CD yields over Treasury bills acted
as a powerful magnet on corporate holdings of liquid assets, despite the
lower level of liquidity of negotiable CD's relative to Treasury bills.
The higher CD yield, the development of a secondary market on CD's, and
the availability of specific maturities tended to increase sharply corporate
purchases of time deposits in the 1960's. With corporations also generally
more aware of alternative yields, their stepped up purchases of time deposits
and other private open market paper coincided with their reduced acquisitions
of Treasury issues (Chart 23). Indeed in 1964-65, prior to the general
shortfall of internal fund generation relative to capital outlays, corporations
reduced their Government security holdings while continuing to acquire large
volumes of time deposits.
Digitized for FRASER http://fraser.stlouisfed.org/ Federal Reserve Bank of St. Louis

Chart 21 - Bank Loan Rates to U.S. Government Security Dealers
Source: Federal Reserve Board
Digitized for FRASER http://fraser.stlouisfed.org/ Federal Reserve Bank of St. Louis
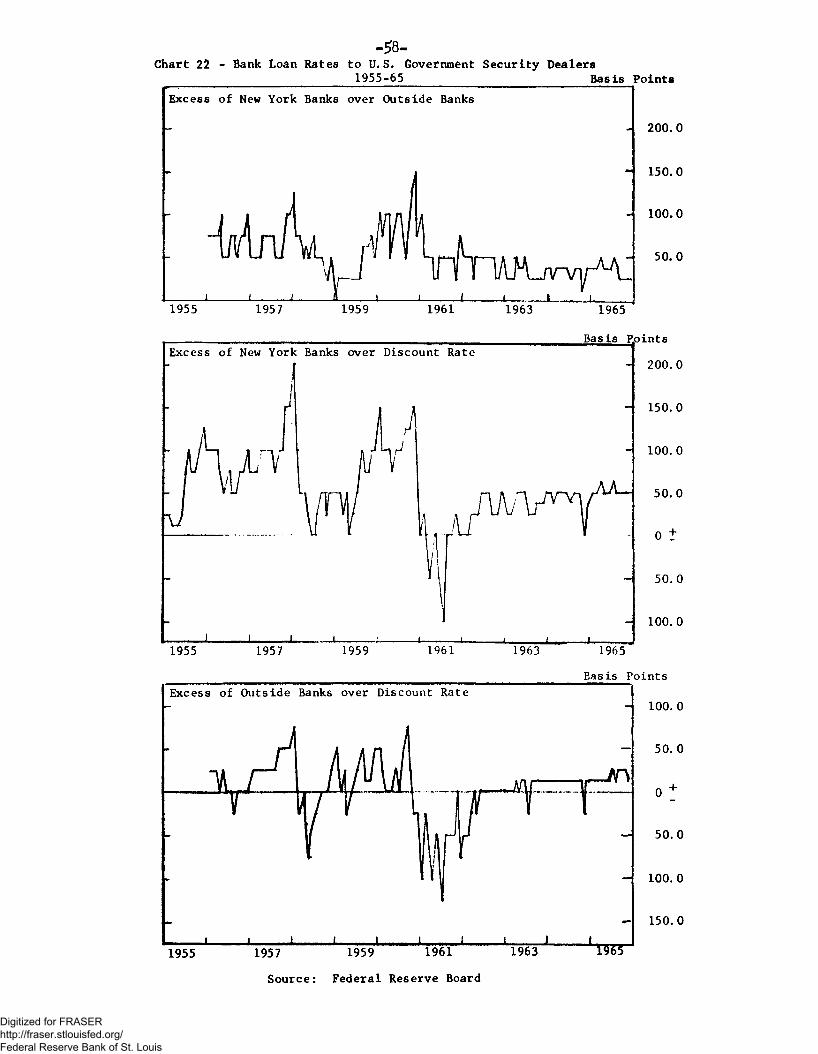
-58-Chart 22 - Bank Loan Rates to U.S. Government Security Dealers
1955-65 Basis Points Excess of New York Banks over Outside Banks
1955 1957 1959 1961 1963
1955 1957 1959 1961 1963
Excess of Outside Banks over Discount Rate
- 200.0
- 150.0
100.0
50.0
1965
Basis Roints - 200.0
- 150.0
- 100.0
50.0
50. 0
- 100.0
1965
Basis Points
T=f J N
i i i J I L 1955 1957 1959 1961 1963
Source: Federal Reserve Board
J L m r
100. 0
50.0
50.0
100.0
150.0
Digitized for FRASER http://fraser.stlouisfed.org/ Federal Reserve Bank of St. Louis

-59-Chart 23 - Liquid Asset Acquisitions of Corporate Nonfinanela1 Businesses
1954-65
Billions of Dollars Time Deposits
n
W 4 ' ' 1956 ' 1 l^r1" 1960 1962 - ^ r a — 1 -
4.0
- 2.0
Billions of Dollars Open Market Paper
.XTLJH I H I I ' l¥bb ' 1 1958* JT9S"0~i W 2 1
2.0 1.0 0 t
J lions of Dollars
U.S. Government Securities
(IX
* ' 1954 195T 1958 1 1 1 1 ' * '
6.0
4.0
2.0
2.0
4.0
1960 1962 1964
Source: Flow of Funds
Digitized for FRASER http://fraser.stlouisfed.org/ Federal Reserve Bank of St. Louis

-?60-
Bank demands for Treasury securities. It would be expected that
expanded participation of banks in the Federal funds market and their
increased use of time deposits—especially negotiable CD1 s —should have
reduced their portfolio demand for liquid assets, particularly Government
securities. This expectation is based on their increased ability and
willingness to finance reserve adjustments, deposit withdrawals, and sharp
changes in loan demand by borrowing in both the CD and Federal funds market.
However, while banks of all classes did reduce their holdings of
Treasury securities relative to assets in the 1960fs, they did so no more
rapidly than in the 1950fs (Chart 24). In addition, while their total
dollar holdings declined somewhat, the proportion of their Government
security portfolio in short-term form rose markedly at all classes of
banks (Charts 25 through 28), when it would be expected that bank demand
for the most liquid Government securities would decline. The share of
their portfolio in 1 to 5 year issues declined markedly, while there was
some increase in their holdings of over 5 year bonds--mainly in the 5 to
10 year area. The shift in maturity composition in the over 1 year area
reflects in part bank partiicpation in advance refundings during the
period.
Commercial banks continued to account for a smaller share of
all outstanding Treasury issues in the 1960fs (Table 9). In 1965,
relative to 1960, their share of all maturity categories declined except
in the under 1 year and in the 5 to 10 year maturity ranges where it
rose moderately.
Digitized for FRASER http://fraser.stlouisfed.org/ Federal Reserve Bank of St. Louis
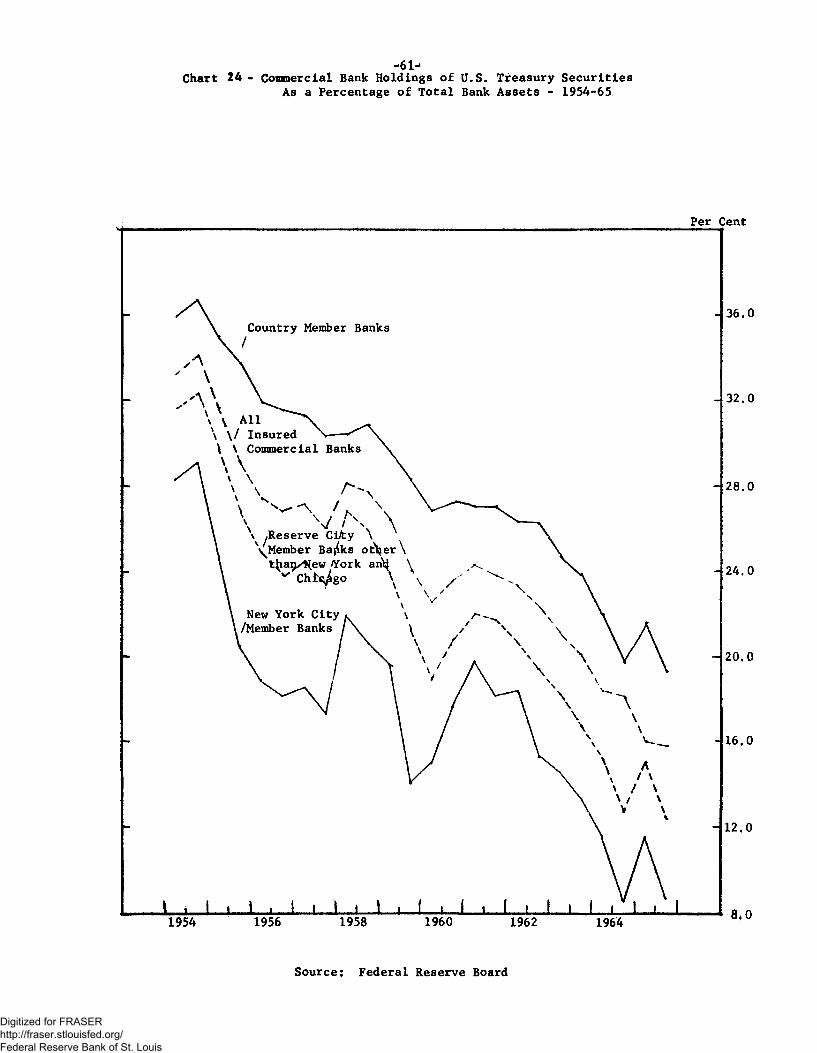
-61-Chart 24- Commercial Bank Holdings of U.S. Treasury Securities
As a Percentage of Total Bank Assets - 1954-65
Source: Federal Reserve Board
Digitized for FRASER http://fraser.stlouisfed.org/ Federal Reserve Bank of St. Louis

-62-Chart J5 - Hitmttf j^|lltlon ||^||cialV|a3c8nt S*cttrit*
Over 5 Year Maturities
1-5 Year Maturities
Under 1 Year Maturities
— Bills Other under 1 Year
U & m WM
iyA/1 v / : ' / A V:'//.-iLi
m m .
m
Ws sjLL
P m vA > * >*
Per Cent
40.0
20.0
60.0
40.0
- 20.0
- 20.0
1954 1956 1958 1960 * 1962 1964
* Break in series. Source: Federal Reserve Board
Digitized for FRASER http://fraser.stlouisfed.org/ Federal Reserve Bank of St. Louis

-63-Chart 26 - Maturity Composition of U.S. Government Security Holdings
New York City Member Banks 1954-65
* Break in series. Source: Federal Reserve Board
Digitized for FRASER http://fraser.stlouisfed.org/ Federal Reserve Bank of St. Louis

-6U-Chart 27 - Maturity Composition of U.S. Government Security Holdings
Reserve City Member Banks Other than New York and Chicago 1954-65 :
•!.':.: Hi;; tTT-T;-I' H" : Per Hit Cent
Over 5 Year katiirities
1-5 Year Maturities
Under 1 Year Maturities
— Bills — Other under 1 Year
m 777m
im
ft'/, w 1958
m 1 / / /
m /•-/ y//
w .
• 40 .0
20 .0
6Q.0
• !
- 40.1
20 .0
20.0
TO2T 1960 * 1962 1964
* Break In series. Source: Federal Reserve Board
Digitized for FRASER http://fraser.stlouisfed.org/ Federal Reserve Bank of St. Louis

Chart 28 -65-
Maturity Composition of U.S. Government Security Holdings Country Member Banks 1954-65
Over 5 Year Maturities
Per Cent
1-5 Year Maturities
i ;
i i . 20.0
Under 1 Year Maturities — Bills
Other under 1 Yezyj),.,
Wim m> ms 1956 1958
W77, W
777 // m I960 * im
w, .Vv - m
* Break in series. Source: Federal Reserve Board
Digitized for FRASER http://fraser.stlouisfed.org/ Federal Reserve Bank of St. Louis

-?66-
Table 9
Share of Outstanding U.S. Marketable Government Securities Held by Commercial Banks
End of Year
(Per Cent)
Maturity of Issue 1953 1960 1961 1962 1963 1964 1965
Total 39.6 32.6 24.4 32.6 30.5 30.0 28.3
Bills 25.6 20.8 26.7 24.6 21.9 24.4 22.1 Coupon issues maturing: Within 1 year 43.2 25.6 34.1 29.0 22.7 27.8 27.7 In 1 to 5 years 60.2 49.5 50.5 49.0 52.1 42.7 38.9 In 5 to 10 years 51.2 34.2 30.3 35.6 32.5 35.2 38.3 In 10 to 20 years 15.6 14.4 15.8 4.3 8.3 3.3 4.8 In over 20 years 12.5 5.5 3.7 3.2 3.8 3.4 4.7
In general, the evidence seems to suggest that, while banks
continued to reduce their demand for Treasury issues in the 1960fs, there
was no abrupt shift in past trends. Within their portfolio of Treasury
issues, banks apparently did expand their demand for short-term and
intermediate-term (5 to 10 year) securities.
The failure of bill holdings of banks to show the expected large
decline is perplexing. However, there are two possible explanations.
First, Treasury bills became relatively more attractive in the 1960fs as
yield spreads compressed. For example, throughout most of the 1960fs,
the premia of finance company and commercial paper over bills was consider-
ably below those of periods of rising market rates in the 1950's (Chart 20).
Digitized for FRASER http://fraser.stlouisfed.org/ Federal Reserve Bank of St. Louis
-?7-
Second, it is clear that while banks increased their use of the CD and
Federal funds market in the 1960fs for reserve adjustments, it is likely
that these same factors increased their demand for portfolio liquidity.
Bank purchases of longer term assets and the increasing amount of bank
liabilities sensitive to yield differentials may have increased bank
demands for portfolio assets, such as Treasury bills, which can be
liquidated quickly at little cost.
Innovations in Private Markets: Effects
Perhaps the most important effect of changes in private markets
during the 1960fs was the contribution of commercial bank behavior to the
public policy goal of keeping upward pressure on short-term rate while
moderating the rise in long-term rates. It is possible that the debt
management and monetary policies of this period would not have succeeded
in this objective without the "borrowing short and lending long11 activities
of banks. Not only did these actions add to the supply of short-term and
increase the demand by financial institutions for long-term financial
assets, but the supply of long-term market securities issued directly in
capital markets was reduced by the enlarged flow of credit granted by
financial insitutions.
At the same time, the behavior of commercial banks contributed to
the increasing sensitivity of financial markets to interest rate differ-
entials. As a result, bank behavior was an important factor in the stability
of rates and compression of the yields on financial assets. Expanded
arbitraging between markets and an increased elasticity to the supply of
financial assets were important in this regard.
Digitized for FRASER http://fraser.stlouisfed.org/ Federal Reserve Bank of St. Louis

-?68-
However, despite some relative increase in bank demand for bills,
on balance these innovations in private financial markets tended to reduce
the demand for short-term Treasury securities by expanding the supply of
attractive substituties. On the other hand, demand for longer-term Treasury
issues might have been increased somewhat by these developments. Bank
purchase of 5 to 10 years issues did rise in the 1960fs, along with their
purchase of other longer-term assets. In addition, the reduced yield on
municipal bonds—due in large part to increased bank purchases--tended to
make long-term Treasury issues relatively more attractive.
Finally, the innovations in financial markets tended to link
Government security dealer loan rates to the opportunity costs of bank funds.
Thus dealer financing costs were kept more in tune with money market pressures.
With dealer costs neither tending to rise nor to decline more rapidly than
other rates—as they had in the 1950fs--pressure on U.S. Government security
dealers to build-up or unload inventories because of financing costs was
reduced during the bulk of the 1960-65 period, and contributed to the relative
stability of interest rates on Government securities. After mid-1965, however,
dealer loan rates fluctuated more widely than other money market rates and at
times sharp increases in them generated substantial upward yield pressures.
V. General Conclusions
In assessing the effects of the economic environment of the 1960fs
on the Government securities market, it is difficult to separate the broad
economic and financial developments which were peculiar to the period—but
could also recur again—from the long lasting financial innovations in both
Digitized for FRASER http://fraser.stlouisfed.org/ Federal Reserve Bank of St. Louis
-69-
the private and public sectors. The stability of growth and prices, and
the relatively limited demand for funds in the private sector throughout
a good part of the first half of the decade contributed importantly to the
stability of long-term yields, while the rapid acceleration of demands and
the resultant inflationary pressures from mid-1965 to late 1966 created
the surroundings for much of the sharp upward movement in all interest rates.
There are, of course, unique historical circumstances which establish the
macroeconomic and broad expectational characteristics of any specific period
of time, but the repetition of the stable growth of the 1961- mid-1965
period could occur again, contributing to similar financial and interest
rate developments.
In this concluding section, however, it is more fruitful to summarize
the implications that center around innovations in public policy and private
financial markets. Many of these developments--while certainly not unrelated
to the general economic environment--generally did represent conscious
changes from the past, rather than merely a "concatenation of circumstances."
Thus, after 1960, public policies directly influenced the behavior
of the Government securities market to a degree not known since the Treasury-
Federal Reserve Accord of 1951. Attempts to influence the structure of
rates included more careful designing of the maturity composition of new
issues—including a flexible response of new issues to current market
conditions; advance refunding; aggressive Treasury trust account purchases
and sales; and a more flexible and dynamic open market policy at the Federal
Reserve. The net result of these official operations was to sharply increase
Digitized for FRASER http://fraser.stlouisfed.org/ Federal Reserve Bank of St. Louis

-?70-
the quantity of short-term obligations held by the public, and to shift
outward the maturity of the public's holdings of long-term securities
without a large increase in their total holdings of coupon issues. These
operations helped to increase short-term yields without bringing upward
pressure on long-term yields. Moreover, more aggressive and flexible
response to short-run rate movements by the Treasury and Federal Reserve
contributed to a greater stability of yields.
The "twist11 of the term structure of rates, as well as the greater
short-run stability of yields, however, was probably more influenced by
innovations in private financial markets. The more aggressive issuing of
time deposits by commercial banks added more to the public's holdings of
short-term assets than did debt management techniques, broadly defined.
Moreover, the increased demand by banks and other financial institutions for
long-term financial assets—and the parallel reduction in the pace of private
direct capital market financing during most of this period—also added greatly
to long-term interest rate stability. In addition, the expanded elasticity
to the supply of money market assets engendered by the growth of the negotiable
CD, the increased use of Federal funds for reserve adjustment, the broadening
of commercial bank investment, and the acceleration of the trend of interest-
rate sensitivity among most all money market participants contributed
importantly not only to the stability of money market yields, but also the
reduced spread between yields on most financial assets.
Digitized for FRASER http://fraser.stlouisfed.org/ Federal Reserve Bank of St. Louis

-71-
In the process, however, the quantity of substitutes for short-
term Government securities increased. While this increased supply of
substitues added stability to money market yields, it also tended to
reduce the demand for short-term Treasury issues in both the U.S. and in 11/
foreign markets.— While part of the reduced public's demand for such
issues was offset by some increased bank demand, net it is likely that
innovations in private financial markets--including the general increase
in rate sensitivity—reduced the total demand for short-term Government
securities. While this helped to bring upward pressures on short-term
yields in the 1960's, these shifts in demand schedule are likely to
remain rather permanently--particularly if banks continue to be aggressive
CD issuers.
On the other hand, developments in the 1960fs tended to increase
the quantity demanded of long-term Government issues. No new substitutes for
coupon issues developed in the 1960's, but increased demand by financial
institutions for long-term instruments in general reduced the spread between
long-governments and other similar financial assets, making long-governments
relatively more attractive. This increased demand by financial institutions
declined in the period of heavy credit demand and reduced deposit inflows
of 1966. However, it is likely that in future periods of rapid expansion
in deposit inflows, an increase in the quantity demanded of long Governments
will again reassert itself. 11/ See Appendix A.
Digitized for FRASER http://fraser.stlouisfed.org/ Federal Reserve Bank of St. Louis

Another factor which tended to add to the strength in long-
Governments was some reduction in the market supply. Advance refunding
techniques and increased official purchases of coupon issues reduced the
quantity of such issuers available in the market. Moreover, such operations
tended to add stability to the price of such issues, despite the thinness of
market supply, and could have, as a result, increased the demand for the now 12/
more attractive Government bonds.—
While developments in the 1960fs changed the environment in which
the Government security market operated, the declining importance of Federal
debt as a financial asset held by the public continued into the 1960's
(Chart 29). Increased issues of private financial assets, lack of pro-
portional growth in new Treasury issues, and the large official account
purchases—especially by the Federal Reserve—has even accelerated this
trend in many ways. As a result of this trend, an increasing proportion
of the liquidity of both financial insitutions and the non-financial
public has been accounted for by private securities—especially financial
intermediary debt (Chart 30). These developments present some difficult
questions about the ultimate liquidity of American financial institutions,
as well as the continued use of the Government securities market as the
major vehicle for implementing monetary policy.
1 2 r The impact:, of official operations in U.S. Government securities on dealer positions and activity is discussed in the paper, "Market Performance as Reflected in Aggregate Indicators,11 by Louise Ahearn and Janice Peskin.
Digitized for FRASER http://fraser.stlouisfed.org/ Federal Reserve Bank of St. Louis

-?73-Chart 29- Outstanding Credit Market Debt and U.S. Government Securities Held by Public
Ratio Scale: Billions of Dollars
Per Cent
Digitized for FRASER http://fraser.stlouisfed.org/ Federal Reserve Bank of St. Louis

Chart 30 - Holdings of U.S. Government Securities as a Percentage of Financial Asset Holdings Various Sectors
Commercial Banks
Nonbank Depositary Financial Institutions
Nonbank Nondepositary Financial Institutions
65 Per State and Local Governments
40.0
20.0
45' '47' —*53' s55* '•S?' Ui' ESEJGspt
Corporate Nonfinancial Businesses 30.0 20.0 10.0
5 3 " 5 5 ' 5 7 ' 5 9 ' 6 1 '63 Foreigners
m
1 1 1 1 . '*!
Cent
20.0
10.0
•45 '47 •49 '51 '53 '55 '57 Source: Flow of Funds
•59 '61 '63 •65
Digitized for FRASER http://fraser.stlouisfed.org/ Federal Reserve Bank of St. Louis

Throughout the American economy—but particularly at financial
insitutions--there is a continuing demand for riskless financial assets
to hold as a liquidity reserve. Indeed, laws, regulations, and examination
procedures place considerable pressure on institutions to hold some assets
without credit risk, generally Treasury issues. However, even to hold the
structure of financial assets to that existing in 1965 would require Federal
borrowing at a rate of $13 to $17 billion a year and private domestic
borrowing at a $35 to $40 billion rate per year, about two-thirds of the
1965 pace. Such a development implies a permanent depression in private
demand and a powerful offset by Federal deficit.
Since a reversal of present trends appears unlikely, it seems
clear that the financial structure of the American economy will continue
to shift toward private claims, that the conventional liquidity base of
financial institutions will continue to erode, and it can be expected that
vocal concern about the extended position of the financial system will
increase. Indeed, if the 1960fs are indicative of the amount of marketable
Treasury securities available to the public after official purchases, these
trends will acclerate.
If the present trend continues, developments in the Government
securities markets over the long-run are likely to be advantageous to the
Treasury while complicating Federal Reserve operations. The Treasury
should find it increasingly easier to sell its obligations as a relative
shortage of riskless financial assets develop. The Federal Reserve, on
the other hand, is likely to find itself facing an increasingly difficult
Digitized for FRASER http://fraser.stlouisfed.org/ Federal Reserve Bank of St. Louis

-?76-
market in which to carry out open market operations. For, while it should
be easier for the Federal Reserve to sell securities, it is likely to
become quite difficult to buy Treasury issues in quantity without causing
sharp price movements because holders of these instruments may be loathe
to give up their riskless liquid assets.
Digitized for FRASER http://fraser.stlouisfed.org/ Federal Reserve Bank of St. Louis

-?77-
APPENDIX*
The Changing International Financial Environment and Foreign Demand for U.S. Treasury Issues
The post-war rehabilitation of European economic and financial
systems, to which most of the Fifties was devoted, produced significant
changes in the international financial environment. The new pattern of
international payments flows and ensuing rebuilding of European monetary
reserves worked to reconstitute an international financial system where
major currencies are freely convertible and where internationally-held
balances—^ may be moved among financial centers in response to changing
market conditions. This new era was formally marked by the return in
Europe to external convertibility at the end of 1958. Since 1960 the
international financial scene has also been marked by slower foreign
acquisition of financial assets in the United States, particularly U.S.
government securities.
The overall volume of internationally-held financial assets
has increased rapidly since the late Fifties, prompted by the expansive
growth of international business and investment activity. Growing inter-
national trade has required a larger volume of internationally-held
transactions balances. The high level of economic activity in the
* This appendix was prepared by Carl H. Stem, Economist, Division of International Finance, Board of Governors of the Federal Reserve System. 1/ The term "internationally-held11 balances or assets refers to short-term or liquid financial assets held in a country by non-residents.
Digitized for FRASER http://fraser.stlouisfed.org/ Federal Reserve Bank of St. Louis

industrial world has generated a large volume of savings, and relatively stable
international monetary conditions and less restrictive international financial
arrangements have fostered investment across national borders in both real and
financial assets. The development of the European Economic Community in
particular has given special impetus to international investment.
By far the largest volume of internationally-held financial assets
is in U.S. dollar balances. Foreign central banks are the largest non-resident 2/
holders of liquid dollar assets. At the end of 1965, $14 billion— (or some
60 per cent) of the world's total official foreign exchange reserves of
$23 billion were U.S. dollar financial assets. (This 60 per cent level is
unchanged from 1960 but up from 45 per cent in 1954.) In addition, U.S.
financial markets, along with those in the United Kingdom, still provide
the private non-resident investor with his major investment outlet, particularly
in marketable assets.
Modifications in institutional and operational arrangements have
created a wider variety of international investment opportunities and a
financial system much more sensitive than earlier to changing financial
conditions in individual countries. Modified payments regulations permit
a freer flow of investment funds than in the earlier Fifties. New financial
assets have been introduced and new insitutions—such as the Euro-dollar
deposit and the international long-term capital markets—have developed.
The international investor today, both official and private, is less
dependent on financial assets in the United States. For example, roughly
2J The $14 billion figure does not include an unknown volume of U.S. dollar assets held by foreign monetary authorities in Euro-dollar deposits.
Digitized for FRASER http://fraser.stlouisfed.org/ Federal Reserve Bank of St. Louis

$16 billion in dollar-denominated assets is currently held in deposits in
the Euro-dollar market, outside the United States, and approximately $1.6
billion in dollar-denominated long-term bonds have been bought by investors
in foreign markets in recent years .
This appendix attempts to analyze briefly how the changing
international financial environment has affected the foreign demand for
securities in the United States, especially U.S. Treasury issues. It
reviews foreign financial investment in the United States and then broadly
traces out developments which have contributed to greater internationalization
of major financial markets.
The foreign demand for financial assets in the United States
Even though the scope for trading in internationally-held securities
has widened since 1957, the expanding volume of internationally-held financial
assets continues to take the form primarily of assets in the United States.
In the eight years, 1958-1965, foreign-owned liquid assets in the United 3/
States, as recorded in the U.S. balance of payments accounts,— increased
on the average df§15 billion per year.—^ In comparison, foreign sterling
assets increased during the same period only 40 per cent as much.
3/ In the U.S. balance of payments accounts changes in foreign liquid assets in the United States include net changes in the foreign stock of marketable long-term U.S. treasury bonds and notes, as well as all types of short-term securities and assets. 4/ The year 1958 is a watershed for the U.S. balance of payments. Prior to 1958, the U.S. foreign payments deficit consisted primarily of increases in U.S. liquid liabilities to foreigners. In the four years, 1954-1957, for example, foreigners actually gave up gold to acquire dollar assets in the U.S.; foreign liquid assets increased on the average $1.12 billion annually during the period while the U.S. gold stock increased an average of $323 million per year. However, beginning in 1958S the U.S. began to suffer large annual losses of gold although foreigners continued to make on the average slightly larger annual additions to their liquid financial assets in the United States than earlier.
Digitized for FRASER http://fraser.stlouisfed.org/ Federal Reserve Bank of St. Louis

-?80-
Foreign acquisition of liquid U.S. financial assets, however,
has varied widely during the past eight years. In 1959, the first full
year following the return to current account convertibility in Europe,
73 per cent or $2.70 billion of the total U.S. payments deficit of $3.7
billion^ took the form of increased foreign liquid assets in the United
States (Chart A-l). Again in 1964, 80 per cent or $2.25 billion of the
total U.S. deficit of $2.80 billion was reflected in increased foreign
holdings in the United States. However, in 1965, when a special effort was
made to reduce the U.S. foreign payments deficit and the Bank of France
undertook redemption of a large share of its dollar assets for gold, foreign
holdings of financial assets in the United States registered virtually no
increase.
During the six years since 1959, the average annual increase in
foreign dollar balances in the United States slowed down from earlier
periods and was only 7.5 per cent. For example, in the eight year period
between 1957 and 1965 the total volume of foreign assets in the United
States grew from $16.6 billion to $31.3 billion, an average increase of
11.2 per cent per year During the pre-convertibility period—1950 to
1957—foreign dollar balances averaged a 9 per cent per year increase.
5/ This figure refers to the U.S. deficit measured on a "liquidity basis." Other measures of the balance of payments would produce different deficits. 6/ These figures include foreign holdings of U.S. Treasury bills, certificates, notes, and long-term bonds; deposits with commercial banks; and bankers1 acceptances, commercial paper and certificates of deposit.
Digitized for FRASER http://fraser.stlouisfed.org/ Federal Reserve Bank of St. Louis

- 8 1 -CHART A-l
U.S. Balance of Payments Deficit 1 9 S M 5
Billions of U.S. Dollars
1954 1956 1958 1960 1962 1964
Increase in Liquid Liabilities (incl. foreign series and foreign currency series U.S. obligations)
Billions of U.S. Dollars
3.0
2.0
1.0
1954 1956 1958 1960 1962 1964
itlliftaa of U.S. Dollars
1.0
+
0
1.0
2.0
3.0
' ' ' ' » I — I ' ' L 1954 1956 1958 1960 1962 1964
Digitized for FRASER http://fraser.stlouisfed.org/ Federal Reserve Bank of St. Louis

-?82-
Since 1959 the fastest growth in assets in the United States has
been registered by those of foreign commercial banks Their assets--
which do not include any long-term Treasury issues--have increased from
$4.6 billion to $7.4 billion or an average of over 12 per cent per year.
By way of comparison, total foreign official dollar assets grew from
$13.2 billion to $19.2 billion or an average of 7.6 per cent per year
with assets of private non-bank foreigners increasing on the average only
5.6 per cent--from $3.6 billion in 1959 to $4.8 billion in 1965.
The foreign demand for U.S. Treasury issues
During 1951-1959, the overall foreign demand for both short-term
U.S. Government securities and bankers1 acceptances and commercial paper 8/
grew more strongly than the demand for deposits with commercial banks.—
Interest rates were generally rising in the United States during this period,
and because of the inflexible rate ceilings imposed on interest-bearing
deposits by the Federal Reserve System, deposit rate increases lagged behind
rising market yields. Total foreign holdings of short-term Treasury issues
rose from $2.1 billion at the end of 1951 to $7.5 billion in 1959 (Chart A-2) .
7/ Foreign commercial bank dollar balances in the United States include balances of foreign branches of U.S. banks with their parents--which have grown rapidly in line with expanding U.S. overseas banking—and the balances of foreign banks with their U.S.-based branches and agencies. 8/ Available U.S. Treasury Department data break down the published aggregate data on foreign short-term financial holdings in the United States into three different classes of ownership—foreign official, foreign com-mercial banks and all other—and three different categories of investment assets—deposits in commercial banks (both time and demand deposits), U.S. Treasury bills and certificates, and other assets which include bankers1 acceptances, commercial paper and certificates of deposit.
Digitized for FRASER http://fraser.stlouisfed.org/ Federal Reserve Bank of St. Louis

Digitized for FRASER http://fraser.stlouisfed.org/ Federal Reserve Bank of St. Louis

-?84-
The Treasury bill share of aggregate foreign short-term dollar holdings rose
from 23 per cent to 39 per cent, while the share of commercial bank deposits
fell from 58 per cent to 42 per cent (Chart A-3). (The share of commercial
paper and bankers1 acceptances rose from 5 per cent to 8 per cent.) There
was a sharp increase in the foreign demand for short-term U.S. Treasury
issues in 1959 when yields on these securities climbed to a peak of 4-1/2 per
cent, compared to 2-1/2 per cent banks were allowed to pay on three- to
six-month time deposits.
Beginning in 1960, however, this trend reviersed as higher deposit
rates at commercial banks and the increasing use of negotiable certificates
of deposit (beginning in 1963) attracted a relatively larger share of short-
term foreign investment in the United States. Although foreign holdings of
Treasury bills and certificates rose from $7.5 billion at the end of 1959
to $8.3 billion in 1965, their share of total short-term foreign assets in
the U.S. fell from 39 per cent to 29 per cent (Charts A-2 and A-3). On the
other hand, the share of bank deposits in the total rose from 42 per cent
to 47 per cent.
The greatest demand for short-term U.S. Treasury issues comes from
foreign monetary authorities, which hold dollar assets in the United States
as a part of their international reserves (Chart A-4). Foreign official
holdings of short-term Treasury issues rose from $4.9 billion (57 per cent
of total foreign official holdings) in 1954 to $8.8 billion (71 per cent of
total foreign official holdings) in 1965 (Chart A-5) . In 1959 when yields
on short-term Treasury issues rose sharply relative to other assets, foreign
Digitized for FRASER http://fraser.stlouisfed.org/ Federal Reserve Bank of St. Louis

cent
CHART A-3 - U.S. SHORT-TERM LIABILITIES TO FOREIGNERS (Major Classes of Liabilities Expressed as Percentage Share of Total Liabilities)
19S1-6S
DEPOSITS (excl* C. D. 1 s)
Source: i . . . . . I . . . . . . . . . frP** o f Commerce
1951 1953 1955 1957 1959 1961 1963 1965 Digitized for FRASER http://fraser.stlouisfed.org/ Federal Reserve Bank of St. Louis

BILLIONS U S nOTT.ARS
CHART A-ii - SHORT-TERM LIABILITIES TO FOREIGNERS REPORTED BY BANKS IN THE UNITED STATES 19&-65 "
OFFICIAL FOREIGN
I CD On I
FOREIGN BANKS
FOREIGN NON-BANK PRIVATE
Source: Dept* of Commerce
1954 I • , * I L 1956 1958 1960 1962 1964
Digitized for FRASER http://fraser.stlouisfed.org/ Federal Reserve Bank of St. Louis

Per cent.
CM6.RT A-5 - OFFICIAL FOREIGN SHORT-TERM DOLLAR HOLDINGS IN THE UNITED STATES (Major Classes of Assets Expressed as Share of Total Assets)
19&-6S
90
75
60
U.S. Treasury Issues
45!
30
DEPOSITS (excl. C.D.'s)
15
J I I 1954 1956
OTHER (excl. C.D. 's)
L- 1 1 L 1958 >960
I I I . L 1962 1964
Source: Dept. of Commerce
Digitized for FRASER http://fraser.stlouisfed.org/ Federal Reserve Bank of St. Louis

-?88-
official holders actually decreased their holdings of other types of assets
in order to acquire Treasury issues. Since the, however, their demand for
these issues has been relatively weaker than the demand for other types of
marketable assets, principally certificates of deposit which have shown
more favorable rate trends.
Foreign commercial banks are not large buyers of Treasury issues
but hold most of their assets in the U.S. in bank deposits and certificates
of deposit (Chart A-6) . In 1959, however, they did make large net purchases
of Treasury issues due to their attractive yields and raised their holdings
of these issues to roughly 16 per cent of their total assets in the United
States. In 1960 these holdings of Treasury issues fell sharply and since
then have averaged between 1 and 2 per cent of total holdings due to
preference for higher yielding assets both in the U.S. and abroad.
Private foreign non-bank investors have never held a large volume
of short-term Treasury issues. At their highest point in 1958 these assets
totaled only $306 million or roughtly 12 per cent of total dollar assets of
foreign private non-bank holdings (Chart A-7). At the end of 1965 they
had fallen to only $87 million as the need for larger working balances
and tighter credit conditions and higher interest rates abroad caused
holders to sell off Treasury issues.
In summary, since 1960 the foreign demand for short-term U.S.
Treasury issues has not been as strong as it was previously because of
more attractive yields on an increasing number of alternative investment
Digitized for FRASER http://fraser.stlouisfed.org/ Federal Reserve Bank of St. Louis

Per cent Chart A-6 - FOREIGN COMMERCIAL RANK SHORT-TERM DOLLAR HOLDINGS IN UNITED STATES
(Major Classes of Assets Expressed as Share of Total Assets) m m - 6 ?
90 L
80
70
30
DEPOSITS (excl. C.D.'s)
' i CO <5 I
20
10
0 1
' ' ' ' » I I
U.S. Treasury Issues
1954 1956 1958 1960 ' ' ' 1 ' 1962 1964
Source: Dept. of Commerce
Digitized for FRASER http://fraser.stlouisfed.org/ Federal Reserve Bank of St. Louis

CR\RT A-7 - FOREIGN NON-BANK PRIVATE SHORT-TERM DOLLAR HOLDINGS IN THE UNITED STATES (Major Classes of Assets Expressed as Share of Total Assets)
1954 1956 1958 >960 1962 1964
Digitized for FRASER http://fraser.stlouisfed.org/ Federal Reserve Bank of St. Louis

-?91-
opportunities both in the United States and abroad. All classes of foreign
investors—central bank, commercial bank and private non-bank--have shown
a decreasing demand for short-term U.S. Treasury issues since 1960.
Foreign demand for long-term U.S. Treasury issues has also declined
since 1963 due primarily to decreased holdings by foreign monetary authorities
and international organizations. Foreign holdings of marketable U.S. govern-
ment notes and long-term bonds rose sharply from $875 million in 1951 to
$2.6 billion in 1961. However, in 1962 these were reduced roughtly $550
million due mostly to heavy sales by the IMF and IBRD. Foreign monetary
authorities increased their purchases of long-term U.S. Treasury issues
in 1963, but since then all classes of owners have reduced holdings.
Developments in the international financial environment
Since the late Fifties the international financial scene has been
marked by an increasing degree of financial market integration and growing
payments freedom, although since 1963 U.K. and" U.S. balance of payments
problems have resulted in increased restrictions on capital flows. Favorable
economic conditions throughout the industrialized world contributed sub-
stantially to the trend toward greater world-wide financial integration.
The declaration of non-resident external convertibility in Europe
in 1958 is often cited as an event which suddenly energized international
financial flows that had long been dammed up and is thought to have
particular significance for foreign balances in the United States. Actually,
the liberalization of exchange controls which permitted foreign non-official
parties to build-up dollar investments began before 1958. Furthermore, the
Digitized for FRASER http://fraser.stlouisfed.org/ Federal Reserve Bank of St. Louis

-?92-
declaration of convertibility was not important to the investment actions
of foreign monetary authorities, the largest foreign investors in U.S.
financial assets. Foreign commercial banks did increase their dollar
holdings roughtly one-third in 1959, no doubt encouraged by the unusually
high interest rates in the United States that year. (Their holdings of
short-term Treasury issues increased $361 million in 1959.) But foreign
non-bank investors were not influenced either by their new-found liberties
or the high U.S. interest rates and actually decreased their short-term
dollar assets slightly. (Their holdings of short-term Treasury issues
decreased $11 million in 1959.)
The less restrictive and more integrated nature of international
finance today has implication mainly for the non-official foreign demand
for U.S. Treasury issues. Because of the key role of the dollar as an
international reserve asset, foreign monetary authorities normally turn to
assets in the United States for their foreign exchange investments. However,
the development of the Euro-dollar deposit market since 1958 has attracted
a large volume of foreign central bank funds and currently (1966) is the
most attractive alternative to assets in the United States for foreign
monetary authorities. Internally, the development of the certificate of
deposit has proved an attractive alternative to U.S. Treasury issues for
foreign official accounts.
The development of the Euro-dollar market has especially important
implications for the demand for U.S. financial assets (including U.S.
Treasury issues) by non-official foreign investors. Major commercial banks
in important financial centers around the world accept dollar-denominated
Digitized for FRASER http://fraser.stlouisfed.org/ Federal Reserve Bank of St. Louis

-?93-
deposits from non-bank customers as well as inter-bank deposits. Rates
paid on these deposits are higher than on comparable investments in the
United STates and at times the differential between Euro-dollar and U.S.
rates has reached very attractive levels. In 1966 foreign branches of
U.S. banks in London started issuing dollar-denominated certificates of
deposit in the London market. A secondary market is being developed
which will make these assets—which carry higher yields than their
counterparts in the United States—even more attractive to both U.S.
and foreign investors.
The Euro-dollar market is the most important factor making for
greater integration of the international financial system. It is the
vehicle through which the money market of the United States is linked
with money markets in other currencies. Through the Euro-dollar market,
changes in conditions in one financial center may be felt more widely
throughout the world.
Greater freedom in international finance has also encouraged
international investment in financial centers other than in New York.
Local currency money-market investments in Canada have for a long time
attracted U.S. investors and more recently Europeans. Foreigners also own
considerable amounts of local currency deposits in several Continental
countries and in Japan in the form of free yen deposits.
Also, numerous factors of a non-financial nature have encouraged
greater inter-linkage of major financial markets and less dependence on
assets in the United States, especially for the non-official investor. The
Digitized for FRASER http://fraser.stlouisfed.org/ Federal Reserve Bank of St. Louis
-?94-
growth of international business operations has encouraged the development
of foreign balances in a great number of centers, including the United States.
Improved communications have linked important financial centers into
practically one world-wide market and played an important role in creating
greater interest in foreign investment opportunities. In addition, the
rapid expansion of the overseas branch network of U.S. commercial banks
has contributed to more inter-linked international finance.
Summary and conclusions
The economic and financial rehabilitation of Europe and booming
economic activity throughout the industrialized world since has permitted
the development of a less restrictive international currency system than
existed throughout most of the Fifties. At the same time,the volume of
internationally-held financial assets has grown at a rapid rate.
Because of the prominent role the dollar plays as an international
reserve asset, foreign monetary authorities have continued to demand financial
assets in the United States, increasing their total holdings from $12.3
billion in 1959 to $18.1 billion in 1965. Foreign official holdings of
short-term U.S. Treasury issues have not grown as strongly as before 1959,
however, due in part to relatively more attractive yields on other assets
in the U.S. market and the development of the Euro-dollar deposit as an
investment alternative outside the U.S. Foreign official holdings of long-
term U.S. Treasury issues on balance increased during the first half of the
Sixties.
Digitized for FRASER http://fraser.stlouisfed.org/ Federal Reserve Bank of St. Louis

-?95-
Foreign commercial banks have increased their financial assets
in the United States roughly 60 per cent since 1959 but reduced their
Treasury securities to a negligible amount. The increased attractiveness
of investing in the Euro-dollar market and U.S. certificates of deposit and
the greater need for deposit balances in New York banks to support their
foreign operations have decreased their demand for Treasury issues.
Foreign non-banks have also decreased their holdings of short-term
Treasury issues to a negligible amount since 1959. Tight monetary conditions
abroad and higher yields have attracted foreign funds from the United States,
and more attractive yields on other types of U.S. securities have drawn
foreign non-bank funds out of short-term Treasury issues. Since 1961,
foreign private and international holdings of long-term Treasury issues
have been falling also.
Generally speaking, the high level of economic activity in the
industrial world since 1959 has increased the total demand for financial
assets and the volume of internationally-held assets. However, except
for foreign monetary authorities, foreigners have been reducing their
holdings of short-term U.S. Treasury issues. In the long-term market,
foreigners bought Treasury issues net in 1961 and 1963 but sold them net in
other years. Overall, in the whole period 1960-1965, foreigners increased
their total holdings of both short- and long-term marketable U.S. Treasury
issues only about $800 million.
In addition to marketable U.S. Treasury issues, foreign central
banks and governments also purchased special non-marketable bonds and
notes (denominated in both foreign currencies and U.S. dollars) issued
Digitized for FRASER http://fraser.stlouisfed.org/ Federal Reserve Bank of St. Louis
- 96 r
by the U.S. Treasury to relieve pressures on the U.S. gold stock. These
holdings rose from $251 million equivalent at the end of 1962—the first
year they were issued—to a peak of $1,692 million equivalent at the close
of 1965. However, during the first half of 1966, outstanding securities
in the hands of official foreign agencies were reduced to $1,101 million
equivalent.
Digitized for FRASER http://fraser.stlouisfed.org/ Federal Reserve Bank of St. Louis