treatment charges presentation
TRANSCRIPT
Treatment Charges Presentation
October 2, 2007

2
Discussion Outline
A. Treatment Surcharge Background Issues
B. Existing Treatment Surcharge
C. Rate Structure Alternatives
D. Evaluation of Rate Alternatives

A. Treatment Surcharge Background Issues

4
MWD Treatment Plants and the Imported Water Distribution System

5
Treated and Untreated Water Deliveries
-
500
1,000
1,500
2,000
2,500
1990 1991 1992 1993 1994 1995 1996 1997 1998 1999 2000 2001 2002 2003 2004 2005 2006 2007FY
thou
sand
acr
e-fe
et
TreatedUntreated

6
Water Treatment Plant Usage and Peaking
Calendar year 2005 through Sept 17, 2007
FacilityDesign
Capacity (cfs)
Average Demand
(cfs)
Peak Day* (cfs)
Capacity Factor
Peaking Factor
Diemer 803 409 778 51% 1.90Jensen 1163 601 1002 52% 1.67Mills 505 132 281 26% 2.13Skinner 930 547 835 59% 1.53Weymouth 803 371 726 46% 1.96
Total 4,204
*Peak day average flow

7
Treated Water UsageMember Agency
Average Annual
Maximum Annual
Minimum Annual
Average Day
Max Day
Peak factor Peak day
Anaheim 14,202 31,611 4,641 14 40 2.9 27-Sep-2005Beverly Hills 13,109 14,867 11,918 20 34 1.7 5-Sep-2007Burbank 14,888 22,839 8,154 22 36 1.7 23-Aug-2005Calleguas 112,084 136,565 86,263 216 264 1.2 31-May-2005Central Basin 73,802 99,814 61,033 101 131 1.3 24-Jul-2006Compton 3,962 5,620 2,892 5 8 1.5 24-Jul-2005Eastern 68,503 99,347 43,234 181 256 1.4 1-Sep-2007Foothill 10,756 14,831 8,394 17 25 1.5 1-Sep-2007Fullerton 10,937 17,795 5,713 20 37 1.9 14-Sep-2007Glendale 25,715 29,135 21,948 37 57 1.5 26-Jul-2006Inland Empire 0 0 0 0 0 0.0Las Virgenes 20,567 25,373 15,293 38 45 1.2 9-May-2007Long Beach 46,796 57,560 34,700 41 73 1.8 28-Aug-2005Los Angeles 96,806 232,272 46,390 94 186 2.0 24-Jul-2006MW DOC 236,597 289,625 157,654 368 454 1.2 25-Jul-2006Pasadena 22,036 33,603 15,508 45 67 1.5 26-Jul-2006San Diego CW A 229,833 288,911 159,961 470 587 1.2 24-Jul-2006San Fernando 451 1,049 0 5 7 1.4 10-May-2007San Marino 1,210 1,998 442 4 8 2.1 24-Jul-2006Santa Ana 16,010 22,007 7,135 20 31 1.5 31-Jul-2006Santa Monica 10,280 14,444 4,689 20 28 1.4 27-Jun-2006Three Valleys 47,965 65,424 35,155 88 134 1.5 17-Aug-2007Torrance 21,031 23,804 16,386 33 42 1.3 22-Jun-2005Upper San Gabr 12,013 27,675 5,967 25 42 1.7 18-Jul-2006W est Basin 153,292 184,679 140,064 226 276 1.2 20-Jul-2005W estern MW D 44,707 87,968 19,909 153 235 1.5 15-Jul-2006Total 2,263 3,103 1.4
Data include Replenishment deliveries. Peak flows net of Replenishment service.
CY 2005-2007 (cfs)FY 1990-2007 (acre-feet)

8
Revenue Requirements by Service Function
(FY 2007/08 in millions $)
Source of Supply $ 112.2Conveyance & Aqueduct $ 478.6Storage $ 122.3Treatment $ 214.9Distribution $ 115.8Demand Management $ 57.5Total Revenue Requirements $ 1,101.3 100%Less: Hydroelectric $ (13.7)Net Revenue Requirements $ 1,087.6

9
Treated Water Net Revenue Requirements

10
Treatment Surcharge Trend
Effective January 12003 2004 2005 2006 2007 2008
Rate per acre foot $ 82 $ 92 $112 $122 $147 $157
% Annual Change 12.2% 21.7% 8.9% 20.5% 6.8%

11
Treatment Cost Drivers
• Major Treatment Capital Investments (e.g. ozone retrofit)
• Rising O&M costs– Chemicals
– Electric Power

12
Treatment Peaks and Rate Equity
• Infrastructure must be designed to meet peak demand.
• Relying on MWD for daily peaks drives capital costs higher.
• Current rate structure recovers peaking costs uniformly through a volume charge paid by all member agencies.

Existing Treatment Surcharge

14
MWD Cost of Service and Rate Process
Revenue RequirementsFunctional CategoriesSupplyConveyance & AqueductStorageTreatmentTransmissionDemand ManagementAdministrative & GeneralHydroelectric
Customer RatesSupply Rates (T1/T2)System Access RateWater Stewardship RateSystem Power RatesFull-Service Untreated BundledReplenishment Rate, UntreatedIAWP, UntreatedTreatment SurchargeFull Service, Treated BundledTreated ReplenishmentTreated IAWPReadiness To Serve ChargeCapacity Charge
ClassificationsFixed DemandFixed CommodityVariable CommodityFixed StandbyHydroelectric

15
Features of the Current Charge
• Uniform Rate
• $157 per acre foot
• Constant charge throughout the year (peaking cost impact not assessed)
• Cost Classifications Recovered– Fixed Demand ($44M)*
– Fixed Commodity ($123.6M)*
– O&M Variable Commodity ($47.4)*
*Costs are for FY 2008

16
Recovery of Treatment Costs
Standby Costs
Average Demand Costs
Property Taxes
TreatmentSurcharge
Peak Demand Costs

C. Rate Structure Alternatives
18
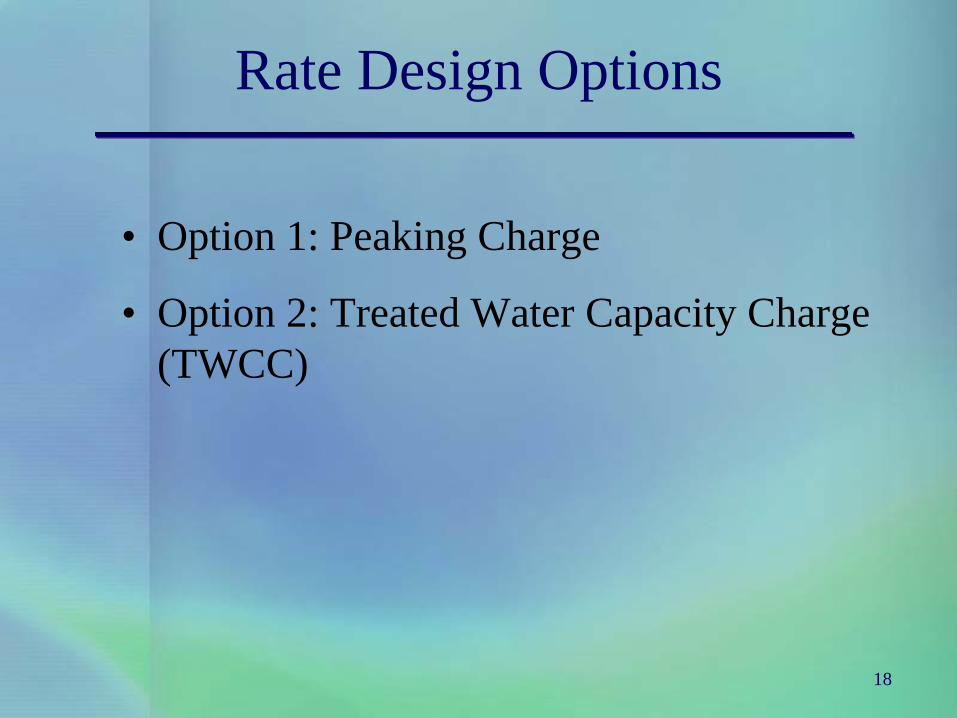
Rate Design Options
• Option 1: Peaking Charge
• Option 2: Treated Water Capacity Charge (TWCC)

19
Option 1: Peaking Charge
Standby Costs
Average Demand Costs
Property Taxes
Peaking Charge
TreatmentSurcharge
Peak Demand Costs

20
Treatment Peaking Charge Considerations
• Infrastructure must be built to accommodate peak demand.• Higher peaks result in higher costs.• These costs are currently shared by all users uniformly.• Each user contributes differently to system peaks.• A peaking charge would directly impact monthly bills.• Equity principle implies that each member agency should
pay costs of service.• Charges should encourage more efficient use of system
treatment resources.

21
Treatment Peaking Charge Design
• Analyze historical demand patterns.
• Analyze how peaking affects treatment costs.
• Calculate costs related to serving peak demand.
• Calculate system-wide volume rates for both average demand usage and peaking charge for peak demand usage.
• Estimate the impact of new charges on member agencies.
• Phase in new charges as appropriate.

22
Peaking Charge Advantages
Advantages
• Sends a strong signal to manage peaks
• Only applies to the extent that members exceed average demand
• More equitably allocates costs of service
23
Peaking Charge Disadvantages
Disadvantages
• Substantial rate impacts on some member agencies
• More volatility for charges and revenues
24
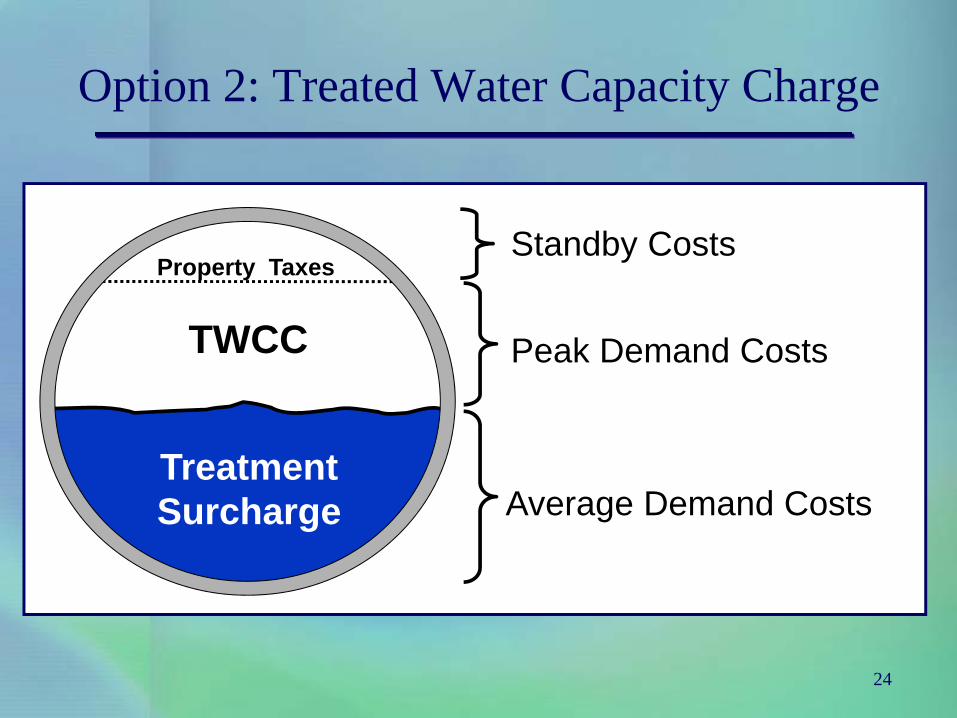
Option 2: Treated Water Capacity Charge
Standby Costs
Average Demand Costs
Property Taxes
TWCC
TreatmentSurcharge
Peak Demand Costs

25
TWCC Considerations
• Most considerations are the same as under Option 1.
• Impacts on monthly bills are determined by historical data.

26
TWCC Design
• Review historical peaking patterns for each user.
• Determine three-year average seasonal peaks.
• Calculate costs related to serving peak demand.
• Develop a fixed capacity charge that will recover peaking costs.
• Estimate the impact of new charges on member agencies.
• Phase in new charges as appropriate.

27
TWCC Advantages/Disadvantages
Advantages • Patterned after the existing capacity charge.• Better revenue stability.• Reduced rate volatility and rate shock.• More equitably allocates costs of service.
Disadvantages • Does not send as strong a signal to manage peaks.• Total treatment charge not influenced as strongly
by short-term changes in demand.
28
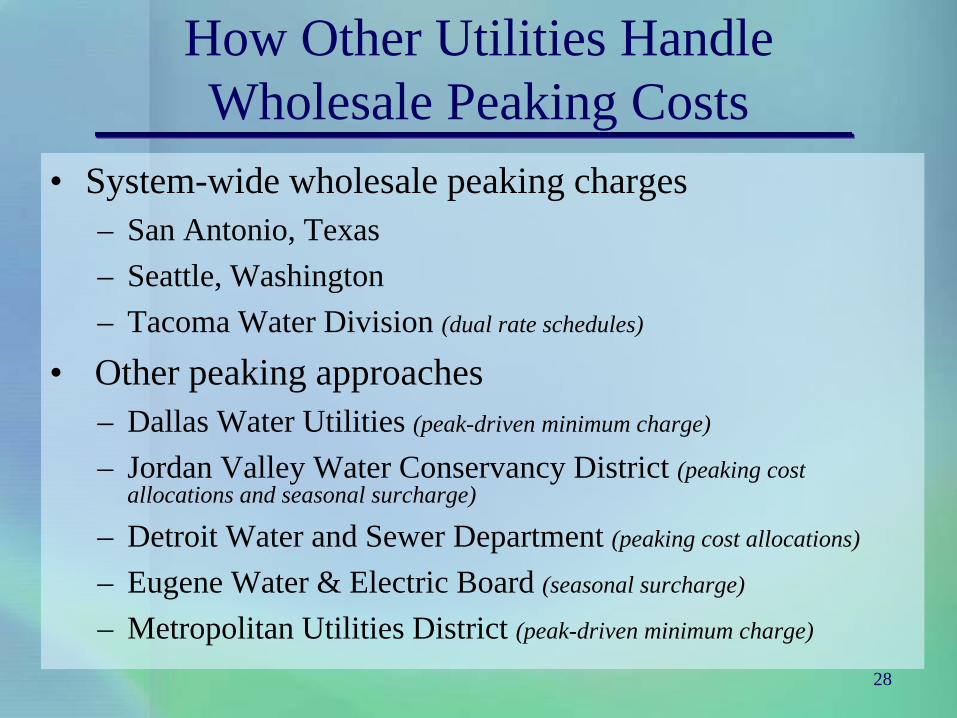
How Other Utilities Handle Wholesale Peaking Costs
• System-wide wholesale peaking charges– San Antonio, Texas– Seattle, Washington – Tacoma Water Division (dual rate schedules)
• Other peaking approaches– Dallas Water Utilities (peak-driven minimum charge)
– Jordan Valley Water Conservancy District (peaking cost allocations and seasonal surcharge)
– Detroit Water and Sewer Department (peaking cost allocations)
– Eugene Water & Electric Board (seasonal surcharge)
– Metropolitan Utilities District (peak-driven minimum charge)
29
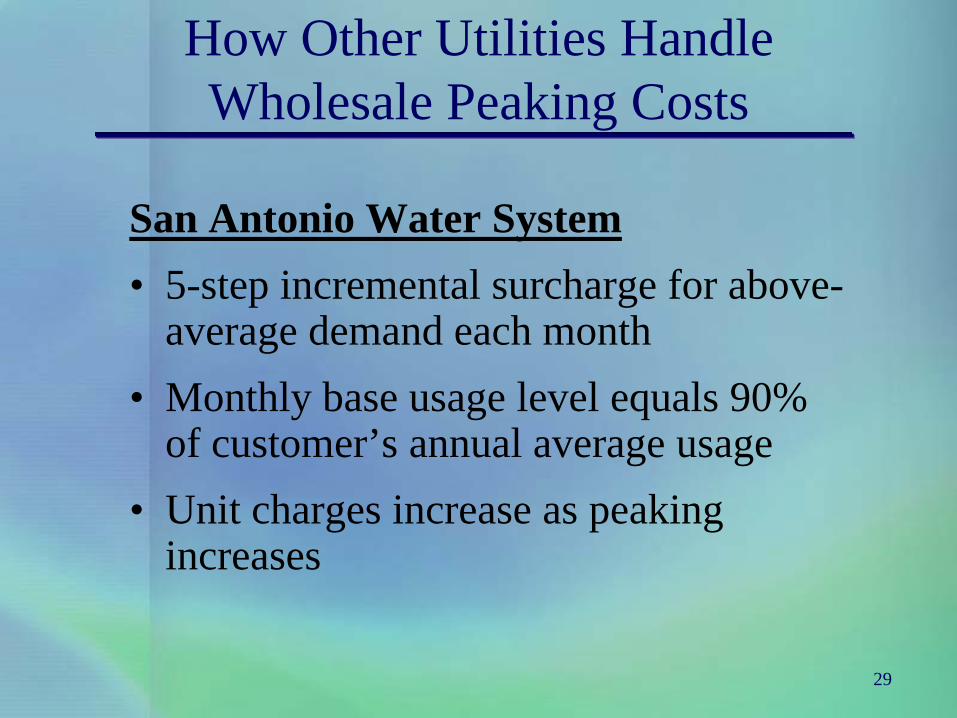
How Other Utilities Handle Wholesale Peaking Costs
San Antonio Water System• 5-step incremental surcharge for above-
average demand each month• Monthly base usage level equals 90%
of customer’s annual average usage• Unit charges increase as peaking
increases
30
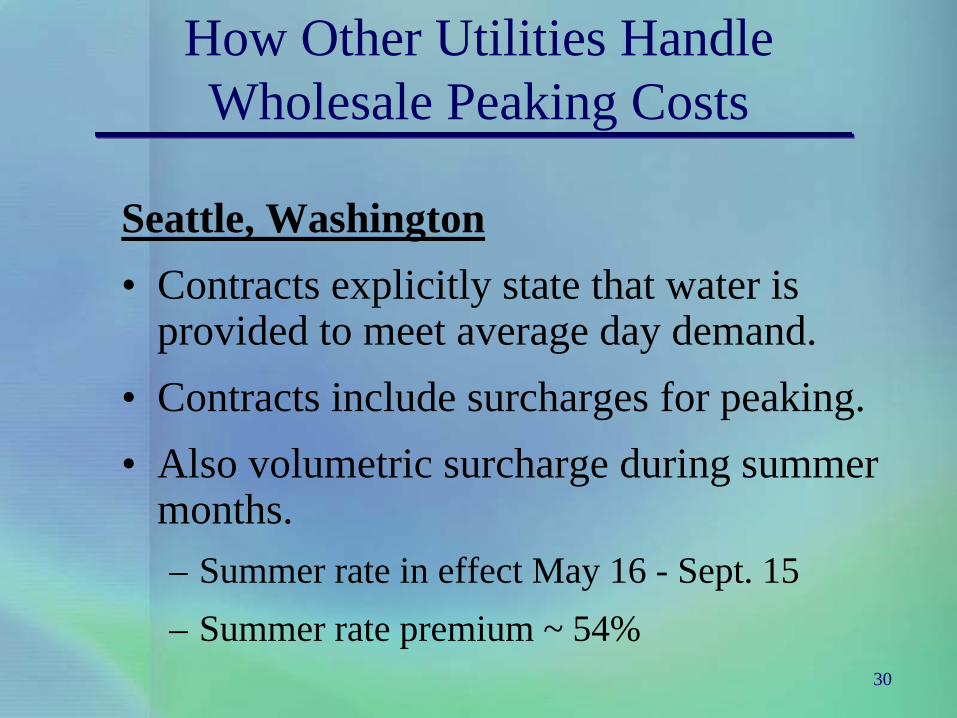
How Other Utilities Handle Wholesale Peaking Costs
Seattle, Washington• Contracts explicitly state that water is
provided to meet average day demand.• Contracts include surcharges for peaking.• Also volumetric surcharge during summer
months.– Summer rate in effect May 16 - Sept. 15– Summer rate premium ~ 54%

31
How Other Utilities Handle Wholesale Peaking Costs
Tacoma Water Division, Washington• Two wholesale rate schedules.• A customer’s rate schedule depends on their
summer/winter demand ratio.• A ratio > 2.5 results in summer rates almost
90% higher than the winter rate. • Summer rates for lower peaking customers are
only 25% higher than winter rates.

Evaluation of Rate Alternatives

33
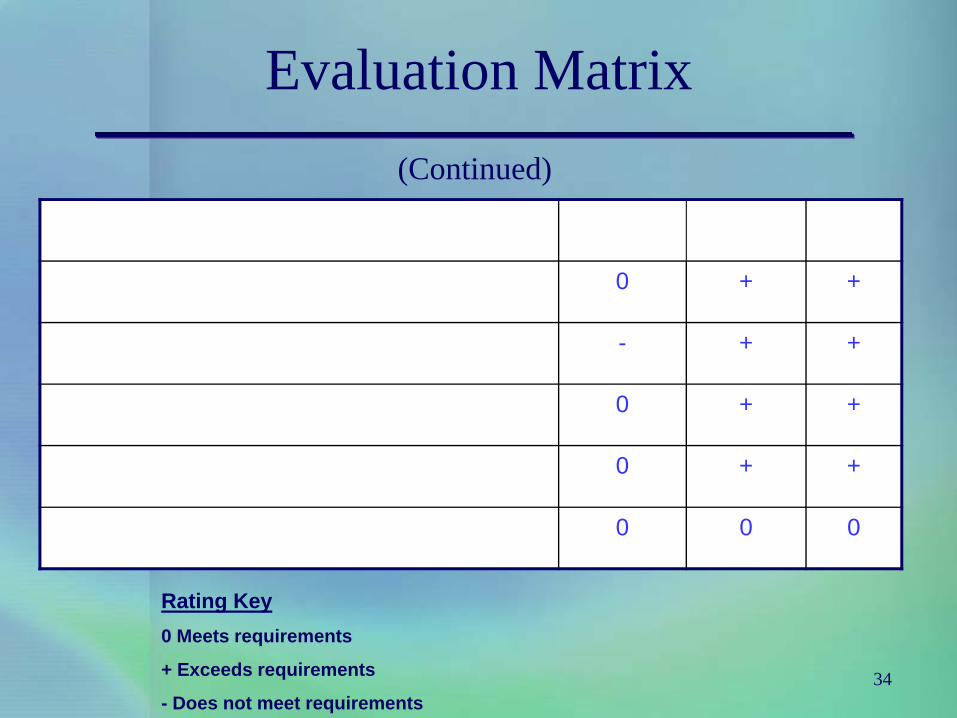
Evaluation Matrix
0 + +
0 0 +
0 0 +
0 + +
+ + +
Rating Key0 Meets requirements
+ Exceeds requirements
- Does not meet requirements
34
Evaluation Matrix(Continued)
0 + +
- + +
0 + +
0 + +
0 0 0
Rating Key0 Meets requirements
+ Exceeds requirements
- Does not meet requirements

Discussion

Appendices
Additional Survey Results

37
How Other Utilities Handle Wholesale Peaking Costs
• Dallas Water Utilities– Physical meter limitations on wholesale peaking.
– If a customer exceeds agreed-upon peaks, Dallas can change the contract to reflect higher peaks.
– New contract terms would enforce a higher minimum charge good for five years.
38
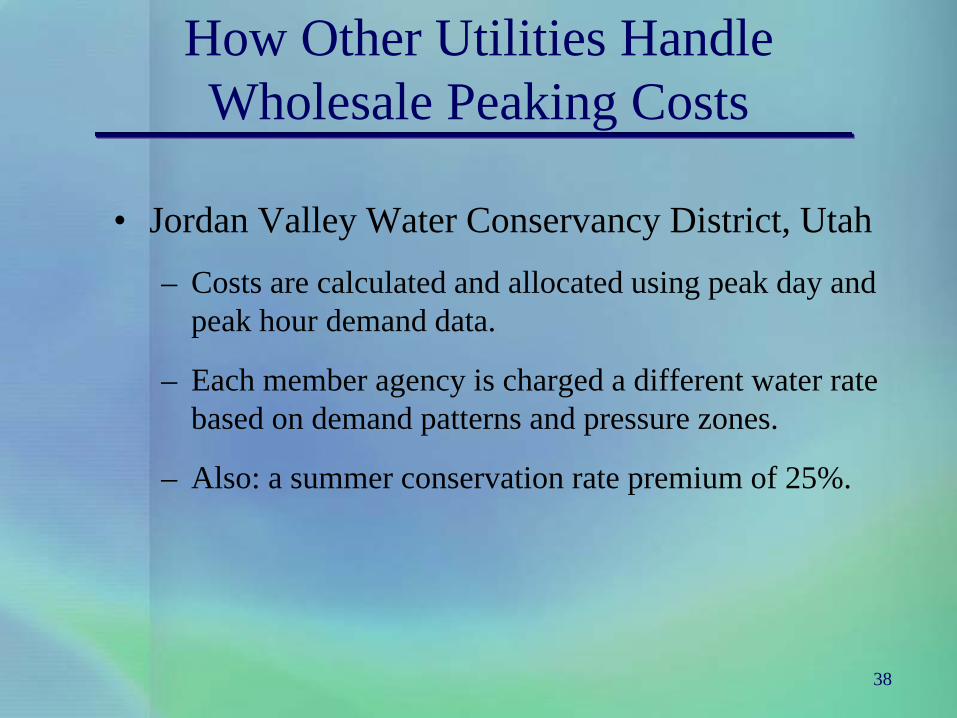
How Other Utilities Handle Wholesale Peaking Costs
• Jordan Valley Water Conservancy District, Utah– Costs are calculated and allocated using peak day and
peak hour demand data.
– Each member agency is charged a different water rate based on demand patterns and pressure zones.
– Also: a summer conservation rate premium of 25%.

39
How Other Utilities Handle Wholesale Peaking Costs
• Detroit Water and Sewer Department
– Peaking is used to allocate costs among wholesale customers.
– Customers with higher peaks get higher rates.
40
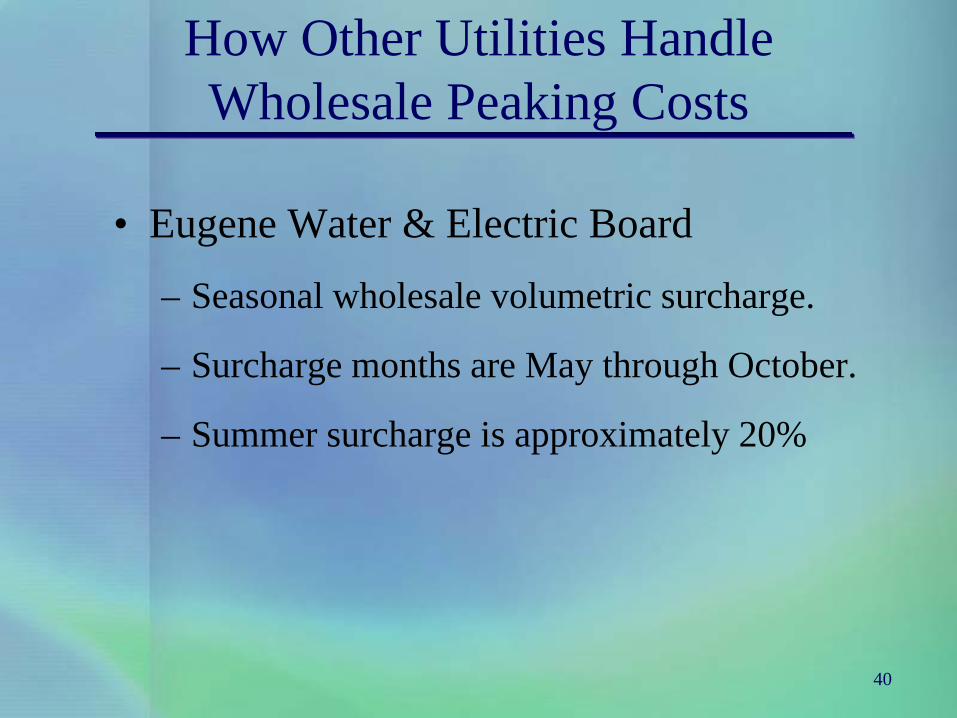
How Other Utilities Handle Wholesale Peaking Costs
• Eugene Water & Electric Board
– Seasonal wholesale volumetric surcharge.
– Surcharge months are May through October.
– Summer surcharge is approximately 20%

41
How Other Utilities Handle Wholesale Peaking Costs
• Metropolitan Utilities District, Omaha, Nebraska– Peak-driven “floating ratchet” minimum
charge.
– Billed demand is calculated as if the month’s max day was in effect the entire month.
– Each monthly bill is based on the peak day over the last 11 months, multiplied x 365/12

42
How Other Utilities Handle Wholesale Peaking Costs
• Austin Water Utility, Texas– Peaking affects allocation of costs among
wholesale customers.
– Customers with higher peaks get higher rates.
– New COS study may add conservation incentive to wholesale rates.