treatment of faecal sludge from pit latrines and septic
TRANSCRIPT
Treatment of faecal sludge from pit latrines
and septic tanks using lime and ureaPathogen die-off with respect to time of storage
Emma Lindberg
Anna Rost
Natural Resources Engineering, master's
2018
Luleå University of Technology
Department of Civil, Environmental and Natural Resources Engineering

ii
Preface
This master’s thesis has been conducted in the fifth year of the Master Programme in Natural
Resources Engineering, with focus Environment and Water, at Luleå University of Technology.
The work corresponds to 30 credits and was conducted from January to June 2018.
The master’s thesis has been carried out as a Minor Field Study, MFS, funded by the Swedish
International Development Cooperation Agency, SIDA. The MFS scholarship offers the oppor-
tunity for students who are approaching the end of their bachelor’s or master’s degree to per-
form studies in a developing country.
The study was executed as a part of the SPANS (Sanitation Planning for Alternative Nutrient-
recovery Systems) project. SPANS is a project that started 2017 and continues through 2020.
The project is a cooperation between the Swedish University of Agricultural Sciences (SLU),
Makerere University in Uganda and the Research Institutes of Sweden (RISE) and is funded by
the Swedish Research Council (Vetenskapsrådet).
The study has been divided into different areas of responsibility where Emma Lindberg has
focused on the lime treatment, different sludge treatment methods and the existing technology
at Lubigi sewage treatment plant. Anna Rost has concentrated on the urea treatment and the
pathogens of investigation. The laboratory work was carried out together as well as the sam-
pling and the writing of the other parts of the report.
We would like to dedicate many thanks to our examiner Annelie Hedström for all the advice
throughout the work with this master’s thesis. We would also like to thank our supervisor at
SLU, Jennifer McConville for the help and for giving us the opportunity to do this project in
Kampala. Many thanks to Charles Niwagaba for helping us on site in Kampala and for offering
us your expertise in the subject of this study. To Annika Nordin, Cecilia Lalander, Håkan Jöns-
son, Jenna Senecal and the rest of the SPANS group at SLU, thank you for all the advice during
our field study. Without you, Swaib Semiyaga, we would not have succeeded with the HACH
machine. Thank you so much for taking your time helping us with it. Rita and Rukea, thank
you both for the time in the laboratory helping us get to know the equipment. Many thanks to
Martin Orwiny and the personnel at Lubigi sewage treatment plant for letting us do our study
at the utility site. At last, we would like to thank our friends and family for your love and sup-
port.
Luleå, June 2018
Emma Lindberg and Anna Rost
iii
Abstract
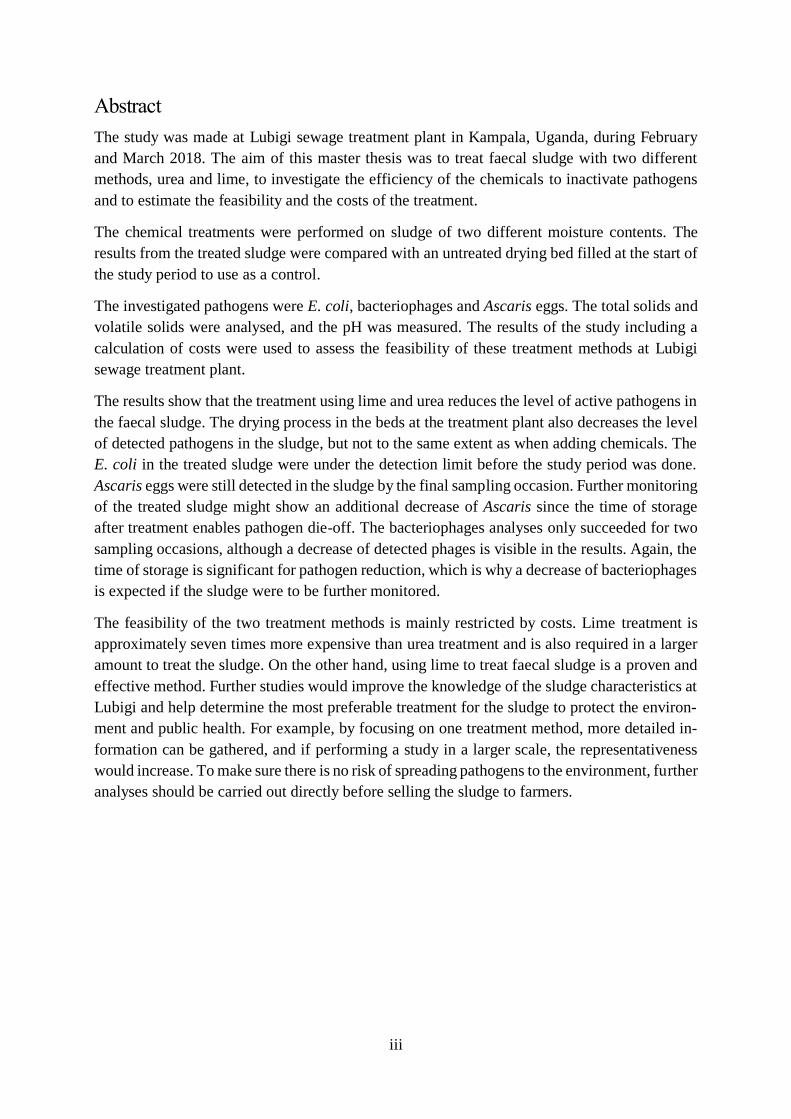
The study was made at Lubigi sewage treatment plant in Kampala, Uganda, during February
and March 2018. The aim of this master thesis was to treat faecal sludge with two different
methods, urea and lime, to investigate the efficiency of the chemicals to inactivate pathogens
and to estimate the feasibility and the costs of the treatment.
The chemical treatments were performed on sludge of two different moisture contents. The
results from the treated sludge were compared with an untreated drying bed filled at the start of
the study period to use as a control.
The investigated pathogens were E. coli, bacteriophages and Ascaris eggs. The total solids and
volatile solids were analysed, and the pH was measured. The results of the study including a
calculation of costs were used to assess the feasibility of these treatment methods at Lubigi
sewage treatment plant.
The results show that the treatment using lime and urea reduces the level of active pathogens in
the faecal sludge. The drying process in the beds at the treatment plant also decreases the level
of detected pathogens in the sludge, but not to the same extent as when adding chemicals. The
E. coli in the treated sludge were under the detection limit before the study period was done.
Ascaris eggs were still detected in the sludge by the final sampling occasion. Further monitoring
of the treated sludge might show an additional decrease of Ascaris since the time of storage
after treatment enables pathogen die-off. The bacteriophages analyses only succeeded for two
sampling occasions, although a decrease of detected phages is visible in the results. Again, the
time of storage is significant for pathogen reduction, which is why a decrease of bacteriophages
is expected if the sludge were to be further monitored.
The feasibility of the two treatment methods is mainly restricted by costs. Lime treatment is
approximately seven times more expensive than urea treatment and is also required in a larger
amount to treat the sludge. On the other hand, using lime to treat faecal sludge is a proven and
effective method. Further studies would improve the knowledge of the sludge characteristics at
Lubigi and help determine the most preferable treatment for the sludge to protect the environ-
ment and public health. For example, by focusing on one treatment method, more detailed in-
formation can be gathered, and if performing a study in a larger scale, the representativeness
would increase. To make sure there is no risk of spreading pathogens to the environment, further
analyses should be carried out directly before selling the sludge to farmers.
iv
Sammanfattning
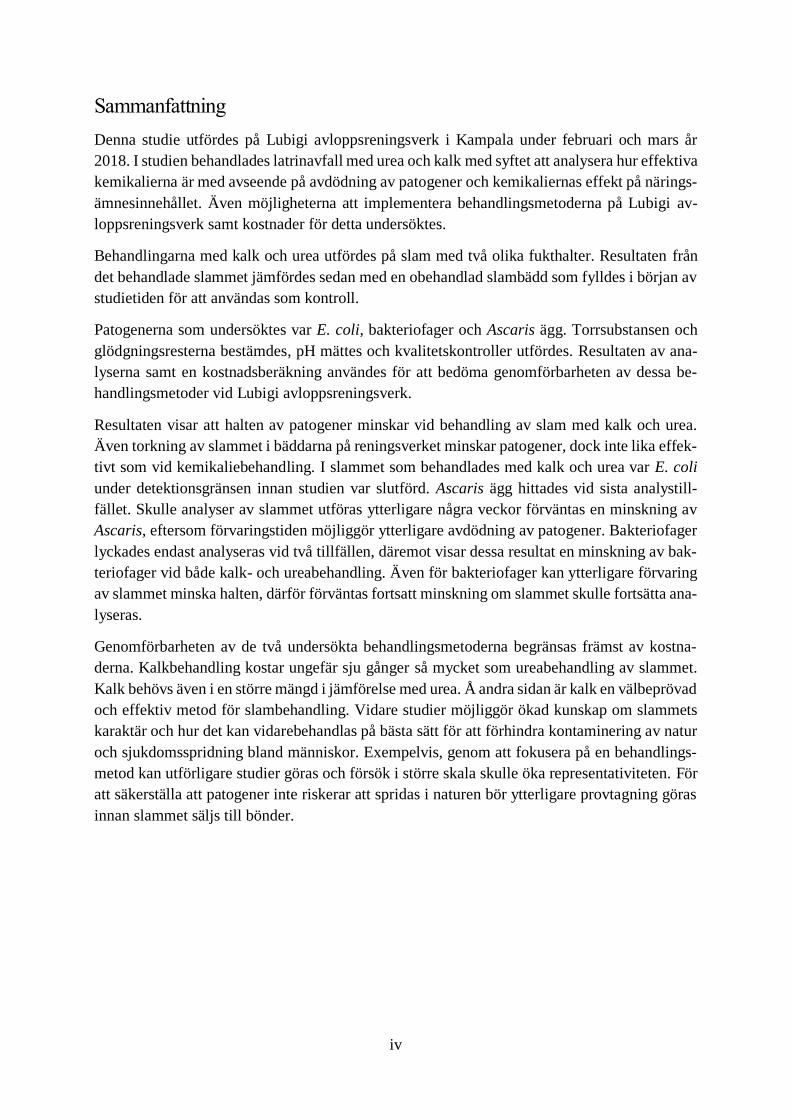
Denna studie utfördes på Lubigi avloppsreningsverk i Kampala under februari och mars år
2018. I studien behandlades latrinavfall med urea och kalk med syftet att analysera hur effektiva
kemikalierna är med avseende på avdödning av patogener och kemikaliernas effekt på närings-
ämnesinnehållet. Även möjligheterna att implementera behandlingsmetoderna på Lubigi av-
loppsreningsverk samt kostnader för detta undersöktes.
Behandlingarna med kalk och urea utfördes på slam med två olika fukthalter. Resultaten från
det behandlade slammet jämfördes sedan med en obehandlad slambädd som fylldes i början av
studietiden för att användas som kontroll.
Patogenerna som undersöktes var E. coli, bakteriofager och Ascaris ägg. Torrsubstansen och
glödgningsresterna bestämdes, pH mättes och kvalitetskontroller utfördes. Resultaten av ana-
lyserna samt en kostnadsberäkning användes för att bedöma genomförbarheten av dessa be-
handlingsmetoder vid Lubigi avloppsreningsverk.
Resultaten visar att halten av patogener minskar vid behandling av slam med kalk och urea.
Även torkning av slammet i bäddarna på reningsverket minskar patogener, dock inte lika effek-
tivt som vid kemikaliebehandling. I slammet som behandlades med kalk och urea var E. coli
under detektionsgränsen innan studien var slutförd. Ascaris ägg hittades vid sista analystill-
fället. Skulle analyser av slammet utföras ytterligare några veckor förväntas en minskning av
Ascaris, eftersom förvaringstiden möjliggör ytterligare avdödning av patogener. Bakteriofager
lyckades endast analyseras vid två tillfällen, däremot visar dessa resultat en minskning av bak-
teriofager vid både kalk- och ureabehandling. Även för bakteriofager kan ytterligare förvaring
av slammet minska halten, därför förväntas fortsatt minskning om slammet skulle fortsätta ana-
lyseras.
Genomförbarheten av de två undersökta behandlingsmetoderna begränsas främst av kostna-
derna. Kalkbehandling kostar ungefär sju gånger så mycket som ureabehandling av slammet.
Kalk behövs även i en större mängd i jämförelse med urea. Å andra sidan är kalk en välbeprövad
och effektiv metod för slambehandling. Vidare studier möjliggör ökad kunskap om slammets
karaktär och hur det kan vidarebehandlas på bästa sätt för att förhindra kontaminering av natur
och sjukdomsspridning bland människor. Exempelvis, genom att fokusera på en behandlings-
metod kan utförligare studier göras och försök i större skala skulle öka representativiteten. För
att säkerställa att patogener inte riskerar att spridas i naturen bör ytterligare provtagning göras
innan slammet säljs till bönder.

v
Table of content
1. Introduction ........................................................................................................................ 1
Aim and scope ........................................................................................................................ 2
2. Background ........................................................................................................................ 3
2.1 Faecal sludge constituents ........................................................................................... 3
2.1.1 Solids .................................................................................................................... 3
2.1.2 Nutrients ............................................................................................................... 3
2.1.3 Pathogenic microorganisms ................................................................................. 4
2.2 Sludge treatment methods ........................................................................................... 6
2.2.1 Physical sludge treatment ..................................................................................... 6
2.2.2 Biological sludge treatment .................................................................................. 6
2.2.3 Chemical sludge treatment ................................................................................... 7
2.3 Current treatment at Lubigi sewage treatment plant.................................................... 7
2.4 Treatment selection .................................................................................................... 10
2.4.1 Lime treatment of sludge .................................................................................... 10
2.4.2 Urea treatment of sludge .................................................................................... 13
3. Materials and methods ..................................................................................................... 15
3.1 Sludge used in experiments ....................................................................................... 15
3.2 Experimental setup .................................................................................................... 15
3.3 Dosage of urea and lime ............................................................................................ 16
3.4 Sampling .................................................................................................................... 17
3.5 Sample preparation .................................................................................................... 18
3.6 Analyses ..................................................................................................................... 19
3.6.1 E. coli, bacteriophages and Ascaris eggs ........................................................... 20
3.6.2 Total solids, volatile solids, pH and quality control ........................................... 21
3.7 Cost of urea and lime ................................................................................................. 21
4. Results .............................................................................................................................. 23
4.1 Total solids and volatile solids .................................................................................. 23
4.2 E. coli, bacteriophages and Ascaris eggs ................................................................... 25
4.3 Cost of urea and lime ................................................................................................. 29
5. Discussion ........................................................................................................................ 30
5.1 Total solids ................................................................................................................ 30
5.2 Volatile solids ............................................................................................................ 31
5.3 E. coli ......................................................................................................................... 31
5.4 Bacteriophages ........................................................................................................... 32
vi
5.5 Ascaris eggs ............................................................................................................... 33
5.6 Practical implementation ........................................................................................... 34
5.7 Further studies ........................................................................................................... 36
6. Conclusion ........................................................................................................................ 38
7. References ........................................................................................................................ 39

1
1. Introduction
Faecal sludge is partly digested excreta that comes from on-site sanitation systems, e.g. pit la-
trines, septic tanks and dry toilets. Faecal sludge can have high varieties in its characteristics
and consistency, and be more or less solid (Bassan et al., 2014). Management of faecal sludge
is an issue in developing countries where affordable sanitation facilities are not accessible
(Singh, Mohan, Rathi, & Raju, 2017). Worldwide, 2.3 billion people lack access to basic sani-
tation facilities, that is approximately 30% of the world population (World Health Organization,
2017). Inadequate sanitation causes infectious diseases, which contributes to malnutrition and
causes several hundred thousand deaths annually (World Health Organization, 2017). As the
urbanisation in developing countries increases, the growing population in urban areas will
increase the waste production, i.e. the faecal sludge production. Additionally, the demand for
food will increase (World Health Organization, 2006). By 2030, 5 billion people are expected
to be served by on-site sanitation systems, which contribute with a great amount of faecal sludge
in need of treatment. On-site facilities have so far not been prioritized globally, which leads to
the release of untreated faecal to the environment. Uncontrolled spread of faecal can cause ill-
ness and environmental problems due to its content of pathogens and nutrients (Bassan et al.,
2014). Access to sanitation is a human right, thus it is included in the global goals for sustain-
able development established by the UN (The Global Goals, 2018). The global goal regarding
sanitation aims at ensuring availability of adequate sanitation for everyone and increase the
proportion of treated wastewater and safe reuse.
Faecal sludge consists of high levels of organic carbon and nutrients, hence the reuse of sludge
in agriculture as a fertilizer and for soil amendment is beneficial (Singh et al., 2017). As the
population in the world grows and the demand for food increases, agriculture is an important
factor for food production to supply people with nourishment. Excreta is a low-cost fertilizer
which consists of all nutrients that are required for a crop to grow and is available where people
live (World Health Organization, 2006). Sludge contains pathogenic microorganisms at 10-100
times higher level compared to wastewater (Singh et al., 2017), which makes it environmental
and health hazards. The level of nutrients, as well as the content of pathogenic microorganisms,
may cause contamination of surrounding soil, vegetation, surface water and groundwater if ex-
creta is spread uncontrollably. Enrichment of nutrients in water bodies can cause eutrophication
that increases the growth of algae and plants, which threatens the natural ecosystems of the
waters (Vinnerås & Jönsson, 2002). Pathogens can be transferred to humans through the skin
or via consumption of water and infected food that have been in contact with faecal sludge. At
human exposure, the pathogens may cause spreading of fatal diseases such as diarrhoea and
cholera (Singh et al., 2017). This becomes a problem in developing countries when wastewater
is used for irrigation of crops and sludge for fertilizing and soil amendment, whether it is treated
or not (Singh et al., 2017). To protect public health, adequate sanitation, proper excreta disposal
and faecal sludge treatment to remove potentially harmful constituents prior to reuse, is re-
quired.
The Republic of Uganda is a developing country in Eastern Africa. In 2017, the population in
Uganda was estimated to 42 million and the annual population increase was around 3%, which
is one of the highest population growth rates in the world (United Nation’s Department of
2
Economic and Social Affairs, 2017). In Uganda, agriculture is significant for food production.
In and around the capital Kampala, most soils are very old and in their final stage of weathering
(Nkedi-Kizza, Aniku, Awuma, & Gladwin, 2002). The soils are generally acidic, and the min-
eral content of mainly quartz and kaolinite does not supply the crops with sufficient amount of
nutrients. Phosphorus in the Ugandan soils is generally in forms that are not available to crops,
nitrogen is only supplied naturally by the atmosphere and degraded organic matter while potas-
sium is limited since it is not supplied by any of the primary minerals of the soil. The addition
of a fertilizer to the soils is important for Ugandan farmers to increase crop yields (Nkedi-Kizza
et al., 2002). The rapid population growth in Uganda increases the food demand and outpaces
the agricultural productivity growth. By using treated faecal sludge as a fertilizer, up to 91%
nitrogen, 83% phosphorus and 59% potassium in the urine and faeces from households can be
recovered in a controlled and secured manner (Vinnerås & Jönsson, 2002).
Aim and scope
In this master’s thesis work, the specific research objective was to evaluate the treatment pro-
cesses of faecal sludge using lime and urea addition with respect to sanitation. The aspect that
was investigated thoroughly in this study was the pathogen die-off with respect to time of stor-
age after chemical addition. The investigated pathogens were E. coli, bacteriophages and Asca-
ris lumbricoides eggs. Additionally, the approximate cost of the two methods and the practical
implementation of the treatment processes were discussed. The study was performed during a
limited time period to investigate the possibilities to establish chemical treatment at Lubigi
sewage treatment plant.
3
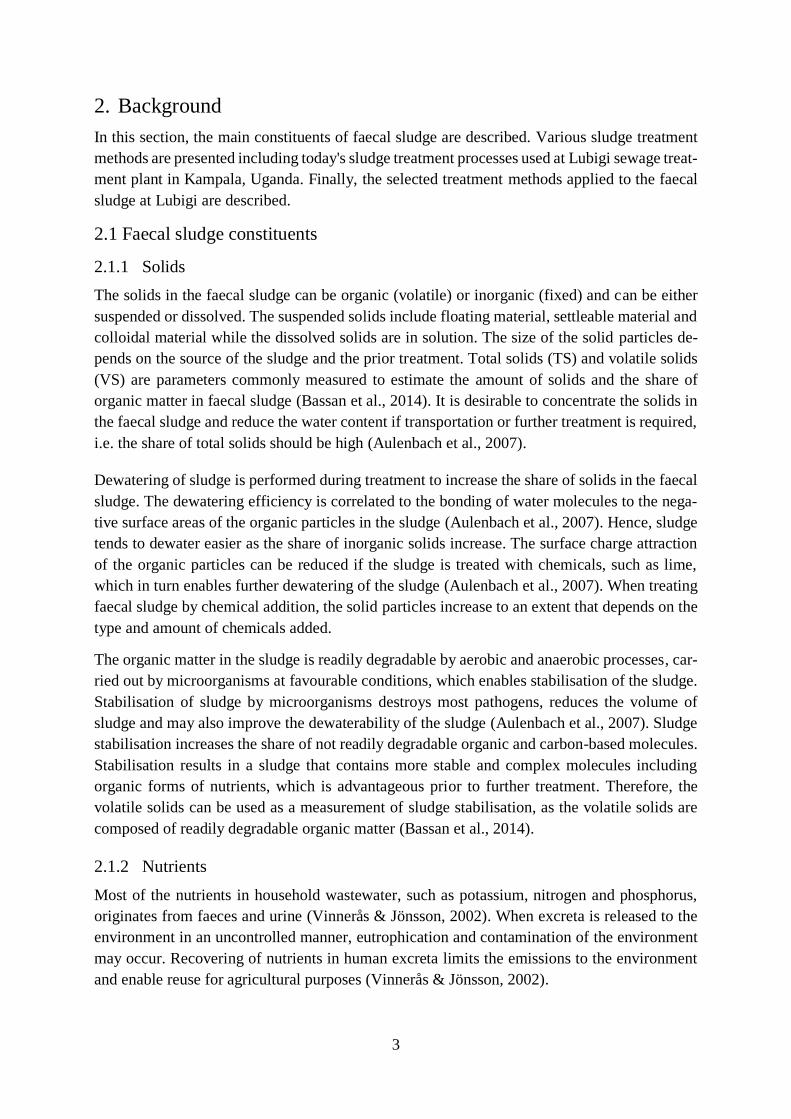
2. Background
In this section, the main constituents of faecal sludge are described. Various sludge treatment
methods are presented including today's sludge treatment processes used at Lubigi sewage treat-
ment plant in Kampala, Uganda. Finally, the selected treatment methods applied to the faecal
sludge at Lubigi are described.
2.1 Faecal sludge constituents
2.1.1 Solids
The solids in the faecal sludge can be organic (volatile) or inorganic (fixed) and can be either
suspended or dissolved. The suspended solids include floating material, settleable material and
colloidal material while the dissolved solids are in solution. The size of the solid particles de-
pends on the source of the sludge and the prior treatment. Total solids (TS) and volatile solids
(VS) are parameters commonly measured to estimate the amount of solids and the share of
organic matter in faecal sludge (Bassan et al., 2014). It is desirable to concentrate the solids in
the faecal sludge and reduce the water content if transportation or further treatment is required,
i.e. the share of total solids should be high (Aulenbach et al., 2007).
Dewatering of sludge is performed during treatment to increase the share of solids in the faecal
sludge. The dewatering efficiency is correlated to the bonding of water molecules to the nega-
tive surface areas of the organic particles in the sludge (Aulenbach et al., 2007). Hence, sludge
tends to dewater easier as the share of inorganic solids increase. The surface charge attraction
of the organic particles can be reduced if the sludge is treated with chemicals, such as lime,
which in turn enables further dewatering of the sludge (Aulenbach et al., 2007). When treating
faecal sludge by chemical addition, the solid particles increase to an extent that depends on the
type and amount of chemicals added.
The organic matter in the sludge is readily degradable by aerobic and anaerobic processes, car-
ried out by microorganisms at favourable conditions, which enables stabilisation of the sludge.
Stabilisation of sludge by microorganisms destroys most pathogens, reduces the volume of
sludge and may also improve the dewaterability of the sludge (Aulenbach et al., 2007). Sludge
stabilisation increases the share of not readily degradable organic and carbon-based molecules.
Stabilisation results in a sludge that contains more stable and complex molecules including
organic forms of nutrients, which is advantageous prior to further treatment. Therefore, the
volatile solids can be used as a measurement of sludge stabilisation, as the volatile solids are
composed of readily degradable organic matter (Bassan et al., 2014).
2.1.2 Nutrients
Most of the nutrients in household wastewater, such as potassium, nitrogen and phosphorus,
originates from faeces and urine (Vinnerås & Jönsson, 2002). When excreta is released to the
environment in an uncontrolled manner, eutrophication and contamination of the environment
may occur. Recovering of nutrients in human excreta limits the emissions to the environment
and enable reuse for agricultural purposes (Vinnerås & Jönsson, 2002).
4
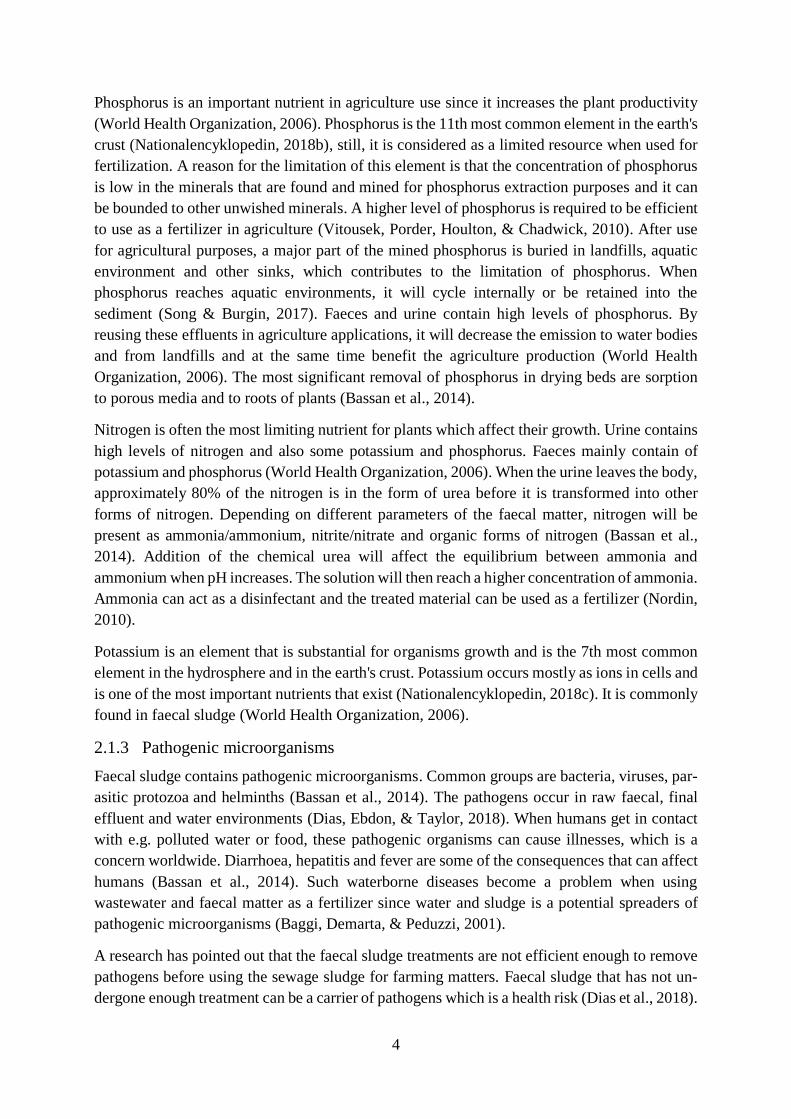
Phosphorus is an important nutrient in agriculture use since it increases the plant productivity
(World Health Organization, 2006). Phosphorus is the 11th most common element in the earth's
crust (Nationalencyklopedin, 2018b), still, it is considered as a limited resource when used for
fertilization. A reason for the limitation of this element is that the concentration of phosphorus
is low in the minerals that are found and mined for phosphorus extraction purposes and it can
be bounded to other unwished minerals. A higher level of phosphorus is required to be efficient
to use as a fertilizer in agriculture (Vitousek, Porder, Houlton, & Chadwick, 2010). After use
for agricultural purposes, a major part of the mined phosphorus is buried in landfills, aquatic
environment and other sinks, which contributes to the limitation of phosphorus. When
phosphorus reaches aquatic environments, it will cycle internally or be retained into the
sediment (Song & Burgin, 2017). Faeces and urine contain high levels of phosphorus. By
reusing these effluents in agriculture applications, it will decrease the emission to water bodies
and from landfills and at the same time benefit the agriculture production (World Health
Organization, 2006). The most significant removal of phosphorus in drying beds are sorption
to porous media and to roots of plants (Bassan et al., 2014).
Nitrogen is often the most limiting nutrient for plants which affect their growth. Urine contains
high levels of nitrogen and also some potassium and phosphorus. Faeces mainly contain of
potassium and phosphorus (World Health Organization, 2006). When the urine leaves the body,
approximately 80% of the nitrogen is in the form of urea before it is transformed into other
forms of nitrogen. Depending on different parameters of the faecal matter, nitrogen will be
present as ammonia/ammonium, nitrite/nitrate and organic forms of nitrogen (Bassan et al.,
2014). Addition of the chemical urea will affect the equilibrium between ammonia and
ammonium when pH increases. The solution will then reach a higher concentration of ammonia.
Ammonia can act as a disinfectant and the treated material can be used as a fertilizer (Nordin,
2010).
Potassium is an element that is substantial for organisms growth and is the 7th most common
element in the hydrosphere and in the earth's crust. Potassium occurs mostly as ions in cells and
is one of the most important nutrients that exist (Nationalencyklopedin, 2018c). It is commonly
found in faecal sludge (World Health Organization, 2006).
2.1.3 Pathogenic microorganisms
Faecal sludge contains pathogenic microorganisms. Common groups are bacteria, viruses, par-
asitic protozoa and helminths (Bassan et al., 2014). The pathogens occur in raw faecal, final
effluent and water environments (Dias, Ebdon, & Taylor, 2018). When humans get in contact
with e.g. polluted water or food, these pathogenic organisms can cause illnesses, which is a
concern worldwide. Diarrhoea, hepatitis and fever are some of the consequences that can affect
humans (Bassan et al., 2014). Such waterborne diseases become a problem when using
wastewater and faecal matter as a fertilizer since water and sludge is a potential spreaders of
pathogenic microorganisms (Baggi, Demarta, & Peduzzi, 2001).
A research has pointed out that the faecal sludge treatments are not efficient enough to remove
pathogens before using the sewage sludge for farming matters. Faecal sludge that has not un-
dergone enough treatment can be a carrier of pathogens which is a health risk (Dias et al., 2018).
5
Temperature, pH, dry matter content, time and competing microbiota are examples of important
factors affecting the die-off of pathogens (Ottoson, Nordin, von Rosen, & Vinnerås, 2008).
Even the ammonia available is an essential factor for the reduction of unwanted pathogens
(Bassan et al., 2014).
Indicator organisms
Some pathogens are hard to detect in faecal matter due to cost and the intensive work to find
them. Instead of measuring all the existing organisms, indicator organisms are used to represent
pathogens in the faecal matter. The indicator organisms should achieve certain criteria to be
able to give an accurate indication of the presence of pathogens. The indicator organisms
should, for example, have a longer lifetime than the pathogen of concern, be simple to find, be
reasonable due to cost and have a similar behaviour as the specific pathogens. It should also
originate from faecal matter (Bassan et al., 2014).
Helminths, parasitic worms, occur mainly in low- and middle-income countries. Helminths are
often used as an indicator since they are present in many countries and functions as a good
indicator of the inactivation of pathogens. The most commonly used indicators of the helminths
group are Ascaris lumbricoides and Ascaris suum, which are round worms (Bassan et al., 2014).
The Ascaris lumbricoides is a worm that infects humans while the Ascaris suum can be found
in pigs (Nationalencyklopedin, 2018a). Ascaris eggs are easily detected and can infect a lot of
humans and animals. It has been estimated that approximately 1.4 billion people in the world
are infected by the Ascaris lumbricoides. The Ascaris eggs are very resistant to a large variety
of treatment methods, hence it is a good indicator for revealing if the chosen treatment has been
sufficient (Nordin, Nyberg, & Vinnerås, 2009a). Helminth eggs tend to sorb or settle and are
therefore mostly found in the solid fraction of faecal sludge. In drying beds, for instance, the
helminths remain with the solids, which approximately 90% of the indicator bacteria do (Bassan
et al., 2014). The moisture content of the sludge influences the survival of the Ascaris eggs and
larvae (Gyawali, 2018). The eggs can either be viable or not viable, where the viable will later
be hatched as larvae (Nordin et al., 2009a).
To detect viruses, the bacteriophage is commonly used as an indicator since it is easily identified
compared to many human and animal viruses. The bacteriophage infects bacterial cells which
results in a lysis of the bacteria cells called plaques and some examples of bacteriophages are
Salmonella typhimurium bacteriophage 28B, enterobacteria phage MS2 and coliphage Øx174
(Bassan et al., 2014).
Bacterial pathogens exist in faecal matter all over the world and are a big source of
gastrointestinal illness. Diarrhoea is a common illness caused by bacterias in low-income
countries. Escherichia coli, E. coli, is a bacteria and occurs normally in faecal matter. It is
therefore often used as an indicator of bacterias in contaminated environments E. coli is part of
the group of faecal coliform bacterias. The faecal coliform bacterias are increasing in number
in warmer temperatures and can be associated with faecal matter from warm-blooded animals
(Bassan et al., 2014).
6
2.2 Sludge treatment methods
2.2.1 Physical sludge treatment
When treating faecal sludge, dewatering is an important physical treatment mechanism where
liquid and solid phases are separated. By dewatering the sludge, the mass of the sludge is re-
duced which is beneficial prior to transport and further treatment, such as composting for re-
source recovery. Furthermore, the reduced water content of the faecal sludge reduces the active
pathogens, since microorganisms need water for survival (Bassan et al., 2014). Therefore,
dewatering treatment mechanisms reduce the level of active pathogens.
Faecal sludge has a high content of water, which can be either free or bound to particles. The
majority of the water is free and can be rather easily removed by techniques such as settling
and filtration. The physically bound water can be removed using more advanced techniques
like centrifugation or evaporation (Bassan et al., 2014). Centrifugation separates liquids and
solids by compression and concentration of solids along the walls of a centrifuge while it rotates
at a high speed. Evaporation occurs when water changes phase from liquid to vapour due to
solar energy and is released into the air (Bassan et al., 2014). Storage is a sludge treatment
method, which enables pathogen die-off as the sludge dries. In warmer climates, one year of
storage is suggested, while 18 months is recommended in colder areas. These recommendations
should be applied when storage is used as a treatment method to prevent re-growth of pathogens
(World Health Organization, 2006).
2.2.2 Biological sludge treatment
Biological treatment of faecal sludge utilises the metabolism of microorganisms naturally oc-
curring in the faecal matter. Under controlled conditions, the microorganisms can provide the
desired outcomes such as degradation of organic matter and reduction of odour and pathogens
(Bassan et al., 2014). Important factors that affect the activity of the microorganisms are the
temperature of the sludge, as well as the level of nutrients and oxygen in the sludge.
Black Soldier flies (BSF) can be found in temperate climates worldwide. The BSF has been
investigated for the degradation of faecal sludge as the fly larvae feed on decaying organic
material (Lalander et al., 2013). The BSF feed only during the larval stage and is, therefore, a
low risk of being a vector for disease transmission. The BSF larvae can reduce organic waste
of up to 75% its volume and the larvae growth stage varies from 2 weeks to 4 months (Bassan
et al., 2014). The BSF larval activity sanitises the sludge as inactivation of bacteria such as
Salmonella spp. and E. coli has been discovered. However, the impact of BSF on other bacteria,
viruses and parasitic organisms in faecal sludge have not been thoroughly studied (Lalander et
al., 2013).
Vermicomposting is a method using earthworms to reduce the volume of organic wastes. It has
been shown that the worms can reduce coliforms and Helminth eggs in faecal sludge (Bassan
et al., 2014). Although, the vermicomposting process cannot be carried out at thermophilic tem-
peratures, which is the reason why adequate pathogen removal is not ensured. Additional treat-
ment might be necessary since the technology is not yet fully developed (Bassan et al., 2014).
7
2.2.3 Chemical sludge treatment
Alkaline stabilisation of faecal sludge can be carried out either pre- or post-dewatering. How-
ever, if performed prior to dewatering, the required amount of alkaline material increases. By
adding an alkaline material, e.g. lime, to raise the pH to greater than 12, the microbial activity
is affected (Bassan et al., 2014). In turn, this reduces the odour and the level of pathogens in
the sludge. However, to prevent the pH from being decreased again, which enables regrowth of
pathogens, excess dose of lime is required.
Ash is a readily available and cost-efficient material that can be used for alkaline stabilisation
of faecal sludge (Aulenbach et al., 2007). Studies have shown that coal fly ash can prevent
regrowth of faecal coliforms if added to faecal sludge (Alkan, Topac, Birden, & Baskaya,
2007). The method of using fly ash might require a combination of treatments to inactivate
pathogens more effectively.
Ammonia treatment of sludge is effective when it comes to inactivation of microorganisms,
although the exact mechanisms are not completely understood (Bassan et al., 2014). The am-
monia can, for instance, be in the form of aqueous ammonia, NH3 (aq), or urea, CO(NH2)2,
which rapidly transforms to ammonia. Disinfection by aqueous ammonia or urea has been
proved to be effective in urine, sewage sludge and compost treatment, but is still in research
when it comes to faecal sludge. The pH must be above 8.5 for the disinfection to be efficient
and regrowth of pathogens will not occur as long as the pH is stable (Bassan et al., 2014).
2.3 Current treatment at Lubigi sewage treatment plant
Lubigi sewage treatment plant in Kampala, Uganda, treats domestic wastewater and faecal
sludge from pit latrines and septic tanks with a capacity of 5,400 m3/day and a current flow of
3,000 m3/day. The treatment plant has 19 drying beds for the faecal sludge treatment. Each bed
is 7x34 meters and treats approximately 71,000 litres of sludge at a time. The wastewater and
the faecal sludge are treated separately in the treatment plant, therefore the drying beds contain
pure faecal sludge.
The sludge that enters the treatment plant originates mainly from pit latrines and septic tanks in
homes and other premises and is transported to the treatment plant via trucks, see Figure 1.
Figure 1. A truck arriving at the treatment plant emptying, faecal sludge from pit latrines and septic tanks.
8
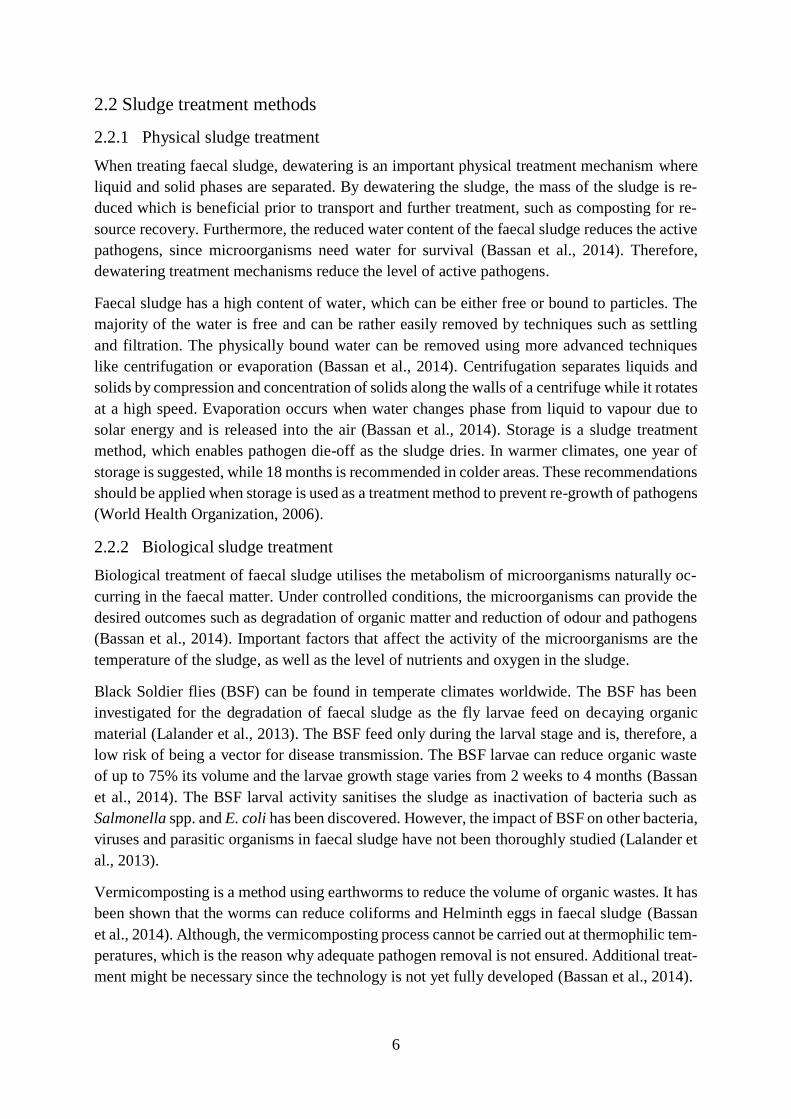
Figure 2 illustrates the different treatment steps of the sludge arriving at Lubigi. Observe that
the domestic wastewater is treated separately and is not presented in Figure 2.
Figure 2. The faecal sludge treatment line at Lubigi sewage treatment plant in Kampala, Uganda.
The primary treatment step removes solid waste as the faecal sludge is transported through
screens and a channel for settling of sand and grit. The secondary treatment step is a sedimen-
tation tank to enable further settling of solids. The faecal sludge is stored in the sedimentation
tank for maximum three months. The first month, the tank is filled with sludge. The second
month, the sludge in the tank is continuously pumped to the drying beds for further treatment.
At the same time, the tank is filled with new incoming sludge. The third month, the filled sedi-
mentation tank is left to settle the sludge. The liquid part of the faecal sludge has a retention
time of three days before it is transported to anaerobic ponds where it is co-treated together with
the wastewater. The settled sludge is pumped to the sand drying beds. Drained water from the
drying beds filled with faecal sludge is directed to the wastewater treatment line to for co-treat-
ment. It takes 4-8 weeks for the sludge to dry in the beds, the treatment time varies depending
on the amount of precipitation and the condition of the roof covering the beds since the roofs
are leaking. After drying, the sludge is stored for an additional 6 months (Orwiny, 2018, per-
sonal communication). After a total treatment of approximately 11 months, the sludge is sold
and transported to farmers to be used as soil amendment.
Screening is a physical treatment mechanism, which removes municipal solid waste and large
solid material from the influent. Municipal solid waste ends up in the pit latrines for several
reasons, for instance, lack of other solid waste management systems. By removing solids, clog-
ging and pump failures are prevented. Bar screens provide a barrier for the incoming flow, the
solids are trapped while the liquid and smaller particles can flow through. The gap between the
bars and the incoming flow velocity affects the efficiency of the screens, the smaller gap and
the lower velocity, the higher efficiency. The screens require regular maintenance to remove
the trapped solids (Bassan et al., 2014).
Grit and sand are removed from the faecal sludge to protect damaging of pipes and pumps in
the treatment line. Grit and sand are solids, too small to be removed using bar screens, they are
instead allowed to settle in a channel. The removal efficiency is affected by the length of the
channel and the flow velocity (Bassan et al., 2014).
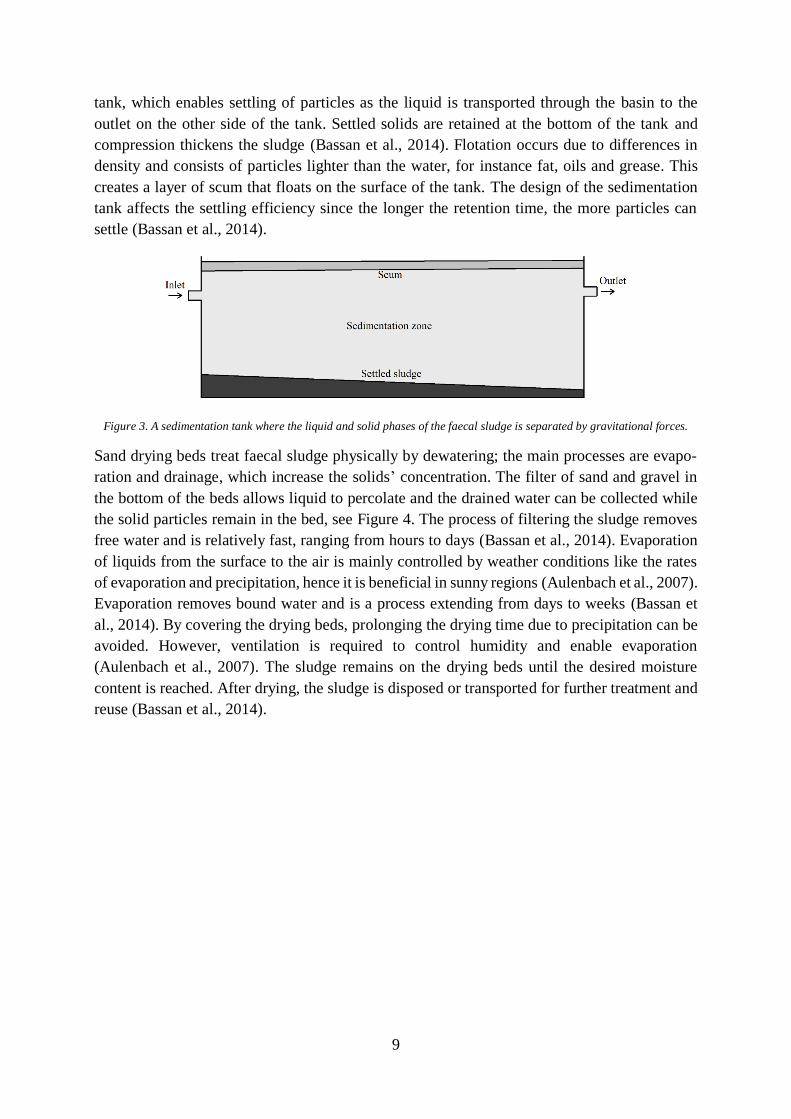
A sedimentation tank provides further separation of the liquid and solid phases of the faecal
sludge mechanically, using gravitational forces. Figure 3 is a schematic illustration of a sedi-
mentation tank in operation. The faecal sludge is discharged into an inlet on one side of the
9
tank, which enables settling of particles as the liquid is transported through the basin to the
outlet on the other side of the tank. Settled solids are retained at the bottom of the tank and
compression thickens the sludge (Bassan et al., 2014). Flotation occurs due to differences in
density and consists of particles lighter than the water, for instance fat, oils and grease. This
creates a layer of scum that floats on the surface of the tank. The design of the sedimentation
tank affects the settling efficiency since the longer the retention time, the more particles can
settle (Bassan et al., 2014).
Figure 3. A sedimentation tank where the liquid and solid phases of the faecal sludge is separated by gravitational forces.
Sand drying beds treat faecal sludge physically by dewatering; the main processes are evapo-
ration and drainage, which increase the solids’ concentration. The filter of sand and gravel in
the bottom of the beds allows liquid to percolate and the drained water can be collected while
the solid particles remain in the bed, see Figure 4. The process of filtering the sludge removes
free water and is relatively fast, ranging from hours to days (Bassan et al., 2014). Evaporation
of liquids from the surface to the air is mainly controlled by weather conditions like the rates
of evaporation and precipitation, hence it is beneficial in sunny regions (Aulenbach et al., 2007).
Evaporation removes bound water and is a process extending from days to weeks (Bassan et
al., 2014). By covering the drying beds, prolonging the drying time due to precipitation can be
avoided. However, ventilation is required to control humidity and enable evaporation
(Aulenbach et al., 2007). The sludge remains on the drying beds until the desired moisture
content is reached. After drying, the sludge is disposed or transported for further treatment and
reuse (Bassan et al., 2014).

10
Figure 4. Cross-section of a typical construction of a sand drying bed. The layers of sand and gravel allow the liquid to per-
colate and the drainage can be collected (Aulenbach et al., 2007).
There are several parameters affecting the duration and efficiency of the dewatering process in
sand drying beds. Key parameters are climate, properties of the sludge, loading rate, thickness
of the sludge layer and surface area of the drying bed (Bassan et al., 2014). Advantages using
drying beds as a treatment technique are the low cost, low energy consumption, low chemical
consumption and the low requirements of maintenance. Disadvantages include the large land
area required, the labour intensive emptying of the beds and the additional stabilisation of the
sludge to remove pathogens and odour that might be necessary (Aulenbach et al., 2007).
2.4 Treatment selection
The two treatment strategies selected to be applied to the faecal sludge at Lubigi sewage treat-
ment plant were the addition of lime and urea. The chemicals were available on the market in
Kampala and could be added to the sludge without any major difficulties.
Lime stabilised sludge added to acidic soil improves the properties of the soil, for instance, the
pH and water holding capacity (Aulenbach et al., 2007). Most soils in and around Kampala,
Uganda, are acidic, and would, therefore, benefit from an addition of lime-treated sludge to
increase the pH, which is favourable for plant growth (Nkedi-Kizza et al., 2002). Quicklime
(CaO) in a powdered form was used in this study since it was the liming material readily avail-
able in Kampala.
When using urea as a treatment method, the total ammonia concentration increases in the sludge
since urea is converted to ammonia. This increases the fertilizer value of the sludge, which is
important for the Ugandan agriculture since the soils generally are nutrient-poor (Nkedi-Kizza
et al., 2002). Similar to lime, adding urea to faecal sludge increases the pH, which is beneficial
for the pathogen die-off and the soils in and around Kampala (Nordin, 2010).
2.4.1 Lime treatment of sludge
Lime stabilisation of faecal sludge is a chemical treatment process, which is simple and cost-
efficient. According to previous studies (Mignotte-Cadiergues, Maul, Huyard, Capizzi, &
11
Schwartzbrod, 2001; Bina, Movahedian, & Kord, 2004), lime treatment of faecal sludge re-
duces harmful pathogenic microorganisms significantly and enables the sludge to function as a
soil conditioner. Lime is readily applied and provides an alkaline environment which is
unfavourable to biological activity (Bina et al., 2004; Jamal, Norieh, & Farzadkia, 2011;
Anderson et al., 2015). When the pH increases to a level greater than 12, the cell membranes
of hazardous pathogens are destroyed. Also, the high pH provides high levels of ammonia,
which functions as a biocide and contributes to the removal of harmful pathogens (Anderson et
al., 2015). Lime treatment of faecal sludge is highly effective for reduction of Salmonella and
total coliforms (Mignotte-Cadiergues et al., 2001; Bina et al., 2004; Aulenbach et al., 2007).
Several studies have shown that inactivation of Helminth eggs strongly depends on the duration
of storage of the lime-treated sludge (Eriksen, Andreasen, & Ilsoe, 1996; Mignotte-Cadiergues
et al., 2001).
It has been discovered that the effect liming has on the microorganisms is not entirely related
to the amount of added lime but also to the sludge characteristics, including concentration of
solids, the final pH, the period of liming and the moisture of the sludge (Farrell, Smith,
Hathaway, Robert, & Dean, 1974; Mignotte-Cadiergues et al., 2001; Bina et al., 2004; Jamal et
al., 2011). Other aspects affecting the treatment process is the rate of pH increase, the quality
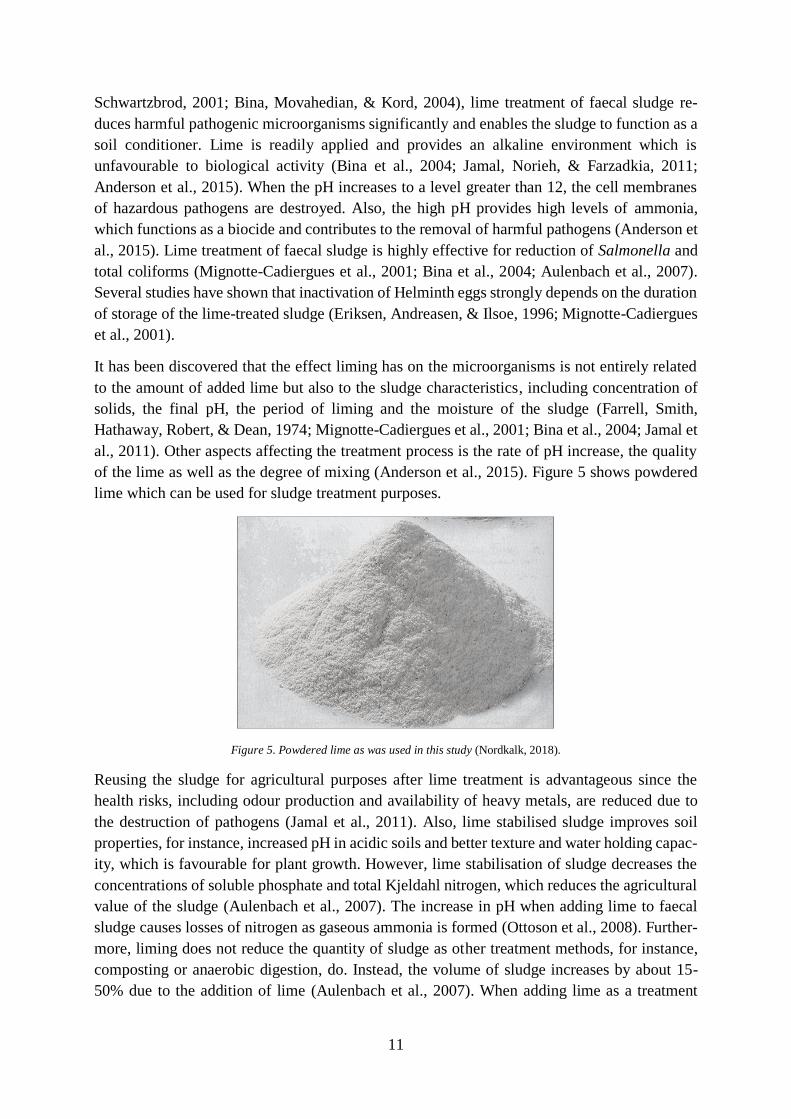
of the lime as well as the degree of mixing (Anderson et al., 2015). Figure 5 shows powdered
lime which can be used for sludge treatment purposes.
Figure 5. Powdered lime as was used in this study (Nordkalk, 2018).
Reusing the sludge for agricultural purposes after lime treatment is advantageous since the
health risks, including odour production and availability of heavy metals, are reduced due to
the destruction of pathogens (Jamal et al., 2011). Also, lime stabilised sludge improves soil
properties, for instance, increased pH in acidic soils and better texture and water holding capac-
ity, which is favourable for plant growth. However, lime stabilisation of sludge decreases the
concentrations of soluble phosphate and total Kjeldahl nitrogen, which reduces the agricultural
value of the sludge (Aulenbach et al., 2007). The increase in pH when adding lime to faecal
sludge causes losses of nitrogen as gaseous ammonia is formed (Ottoson et al., 2008). Further-
more, liming does not reduce the quantity of sludge as other treatment methods, for instance,
composting or anaerobic digestion, do. Instead, the volume of sludge increases by about 15-
50% due to the addition of lime (Aulenbach et al., 2007). When adding lime as a treatment
12
method, the sludge dries quicker which increases the total solids value of the sludge (Mignotte-
Cadiergues et al., 2001; Bina et al., 2004).
Lumps of lime can be a complicated side-effect and should be kept in mind when working with
the chemical. The gaseous ammonia formed in the high pH, as well as the dust from the lime,
can create a harmful working environment (Ottoson et al., 2008). When adding lime to faecal
sludge, personal safety is very important. Lime is corrosive to the skin, eyes and lungs, which
is why safety protection equipment is required (Bassan et al., 2014).
Since the lime dosage varies depending on several factors, some previous studies have initially
performed small experiments to determine the relationship between the dosage of lime and the
pH for the specific study conditions (Aulenbach et al., 2007; Anderson et al., 2015). Using this
relationship, the lime dosage required to achieve the target pH in each batch can be assessed.
There are examples of studies where both dry lime and lime as a slurry have been mixed with
the sewage sludge (Farrell et al., 1974; Paulsrud & Schanke Eikum, 1975; Aulenbach et al.,
2007; Bassan et al., 2014). When calcium oxide (CaO), or quicklime, reacts with water, it forms
calcium hydroxide (Ca(OH)2), or slaked lime. The reaction called slaking is exothermic, which
is why an increase in temperature can be expected (Mignotte-Cadiergues et al., 2001;
Aulenbach et al., 2007). The generated heat improves the pathogen reduction and speeds the
dewatering process due to evaporation. During slaking, the coarse quicklime particles split into
smaller particles of slaked lime, providing a bigger surface area which increases the reactivity
(Aulenbach et al., 2007). Experiments using quicklime has shown promising results of pathogen
die-off when adding 10 weight percent lime to the faecal sludge (Eriksen et al., 1996).
The United States Environmental Protection Agency (USEPA) has developed a standard re-
garding reuse or disposal of sewage sludge, the sludge needs to be stabilised before it can be
beneficially used (US EPA, 1993). According to this standard, the sludge needs to meet certain
pathogen reduction requirements to be reused in any land applications. The pathogen reduction
depends on the chosen treatment techniques of the sludge. The requirements concern the pH-
value in relation to the time of storage to make certain that the pathogen level remains low,
which prevents the risk of regrowth. Also, the vector attraction potential is reduced, i.e. the
access for insects, rats, birds etc. is limited, hence also decreasing the risk of spreading diseases.
When treating the sludge by adding an alkaline material, the pH evolution determines the qual-
ity of the sludge (US EPA, 1993).
Class A is the highest quality of sludge with no restrictions when it comes to reuse of sludge
since there is no detection of pathogens (US EPA, 1993). After an alkali has been added to the
sludge to raise the pH to greater than 12, the pH must remain greater than 12 for at least 72
hours. At the same time, the temperature of the sludge should be above 52°C for 12 hours or
more. At the end of the 72-hour period, the sludge should be air dried to reach a total solids
level of at least 50% (US EPA, 1993).
Class B is the less strict pathogen reduction requirement which needs to be fulfilled for sludge
reuse in land applications since the pathogen level is reduced (US EPA, 1993). After an alkali
has been added to the sludge to raise the pH to greater than 12, the pH should remain at 12 or
13
higher at least for 2 hours. The pH of the sludge should also remain at 11.5 or higher after an
additional 22 hours (US EPA, 1993).
2.4.2 Urea treatment of sludge
Urea, (NH2)2CO, can be used as a chemical treatment method and one of the most commonly
used nitrogen fertilizers in the world. When urea is added to soil, the fertilizer is degraded by
enzymes to ammonia. The same effect occurs when adding urea to faecal matter (Nordin,
Ottoson, & Vinnerås, 2009b).
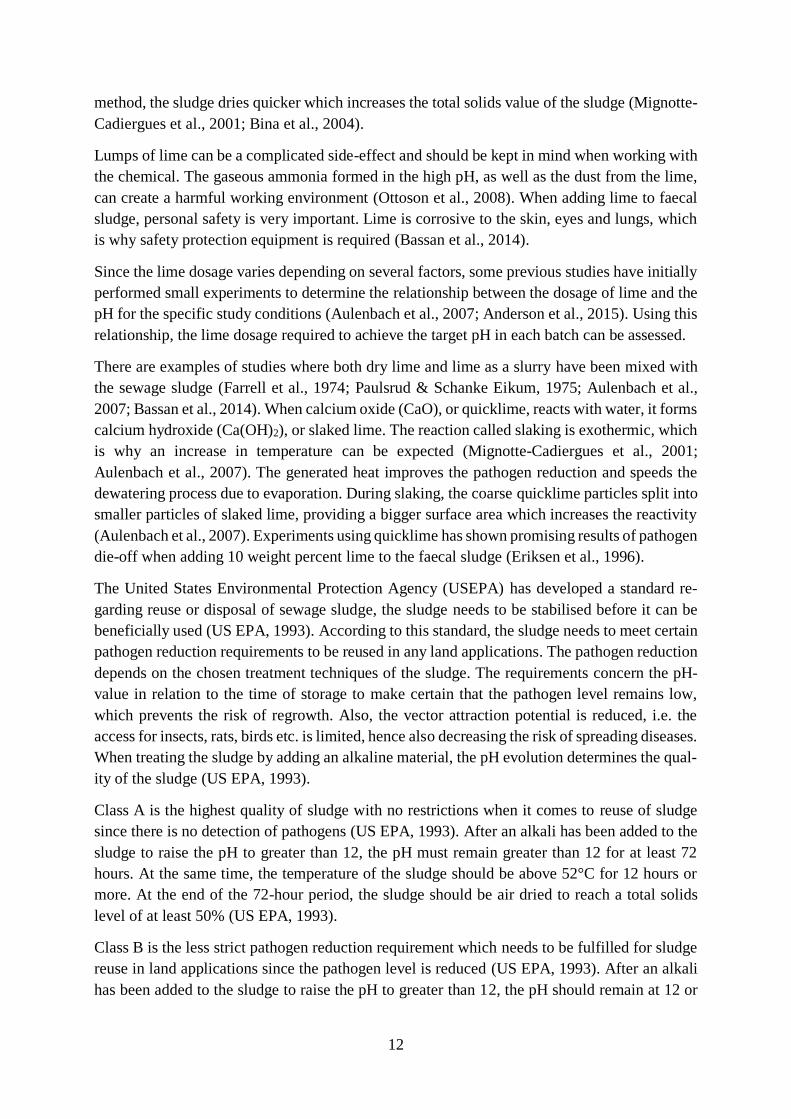
The use of urea is an ammonia treatment, which has been proven to be a useful method to
stabilise and to disinfect a material, see Figure 6 showing urea. Another alternative of ammonia
treatment is aqueous ammonia. One significant function of urea is to inactivate pathogens from,
for example, faecal sludge, manure and human urine. The sanitisation effect is considered to be
efficient when urea is used in preferable conditions and in a proper amount, for example in
stored conditions (Nordin, Olsson, & Vinnerås, 2015). Ammonia has a function to deactivate
pathogens when the ammonia is degraded by enzymes (Nordin et al., 2009b). The enzymes
exist naturally in the sewage sludge, faecal and urine (Nordin, 2010).
Figure 6. The urea granules used in this study (Essential chemistry industry, 2017).
The treatment will increase the pH and the ratio of NH3 in solution in relation to NH4+ is deter-
mined by the acid-base equilibrium of NH4+/NH3 (Nordin, 2010). As long as the material, e.g.
faecal sludge, is stored during treatment and has a small amount of air exchange, urea is an
efficient sanitation treatment and can later be used as a fertilizer. When using urea, the fertilizer
value will increase as well as the balance between the nutrients since the added ammonia will
not be consumed during the hygienisation process. In general, phosphorus is present at a higher
level in sludge or faecal matter compared to nitrogen, which can be removed as nitrogen gas.
With an addition of urea, the nitrogen/phosphorus ratio in the sludge will increase and the nu-
trients will be more balanced and the sludge will be more preferable by farmers (Nordin et al.,
2015). The concentration of ammonia in the treated material depends the total ammonia con-
centration added, the final pH and the temperature (Vinnerås, 2007).
The pH and temperature are important parameters when it comes to the efficiency of the urea
treatment. At low pH and low temperatures, the treatment to destroy certain bacteria and viruses
might not be efficient (Vinnerås, Holmqvist, Bagge, Albihn, & Jönsson, 2003). Previous studies
adding urea to faecal matter at different pH and temperatures showed diverse results concerning
sanitation (Nordin et al., 2009b). At increased doses of urea and at higher temperatures, the
treatment time of faecal matter will be reduced. There are differences in reduction rates between
14
various pathogens. Some bacterial pathogens as E. coli and Salmonella spp. might only need
1% urea and temperatures in the range 14-34°C to be reduced, while in some cases bacterio-
phages need 2% urea to have an efficient reduction. The reduction time can take just a couple
of days up to months, depending on the specific conditions for bacteria (Nordin et al., 2009b).
With an addition of urea, the pH can increase to values about 9-9.5. The dry matter of the treated
material is of significance. When the dry matter is low and a high dosage of urea is added, pH
tends to increase more compared to high dry matter and low dosage of urea (Kohn, Decrey, &
Vinnerås, 2017). Some studies have shown that the dry matter increases if adding urea to sludge
in a closed system. However, other studies have shown the opposite (Nordin et al., 2015).
It has been verified in studies that a high pH and high temperatures are needed to inactivate
bacteria (Vinnerås et al., 2003). Bacteria, e.g. E. coli, were inefficiently reduced in temperatures
below 5°C when treated with ammonia addition. Ascaris lumbricoides eggs are more persistent
than other parasites and bacteria and demand a pH higher than 12.5 and a longer treatment time
for an inactivation (Vinnerås et al., 2003).
Urea treatment has been tested on a small scale with pee-poo bags (Vinnerås, Hedenkvist,
Nordin, & Wilhelmson, 2009) and at a larger scale of 200 ton of excreta in one big set-up. This
treatment method is considered to be a cheap method since the operation cost is low and the
equipment used is often implemented already in other available processes (Nordin et al., 2015).
The addition of urea is also considered to be easy to handle. Other alternative treatment pro-
cesses, for example, composting and storage, have not been proven to be more efficient than
the urea treatment (Vinnerås, 2007).
15
3. Materials and methods
Faecal sludge with two different moisture contents was treated with lime and urea and stored
in containers for eight weeks. The dosage of chemicals added was chosen in accordance with
previous studies successfully performed. Sampling was carried out every week to monitor cer-
tain parameters. The analyses were performed using standard methods. For details, see below.
3.1 Sludge used in experiments
Faecal sludge from three drying beds at Lubigi sewage treatment plant was used in this study.
The beds were filled at different times; hence the pre-treatment of the sludge in the drying beds
varied as well as, for instance, the total solids (TS) content. Different TS values of the beds
made it possible to compare the efficiency of the sludge treatment methods in relation to dif-
ferent sludge moisture contents. The bed called 0 in this study was filled the 13th of February
2018 and contained the freshest sludge. The sludge from bed 0 was selected as a reference to
evaluate how the TS and pathogens varied over time without any treatment with lime and urea.
Bed 1 was filled the 6th of February 2018 and had been pre-treated for 13 days. Bed 2, with the
oldest sludge, was from the 20th of December 2017 and had been pre-treated for 61 days. The
sampling of sludge from beds 1 and 2 started the 19th of February 2018.
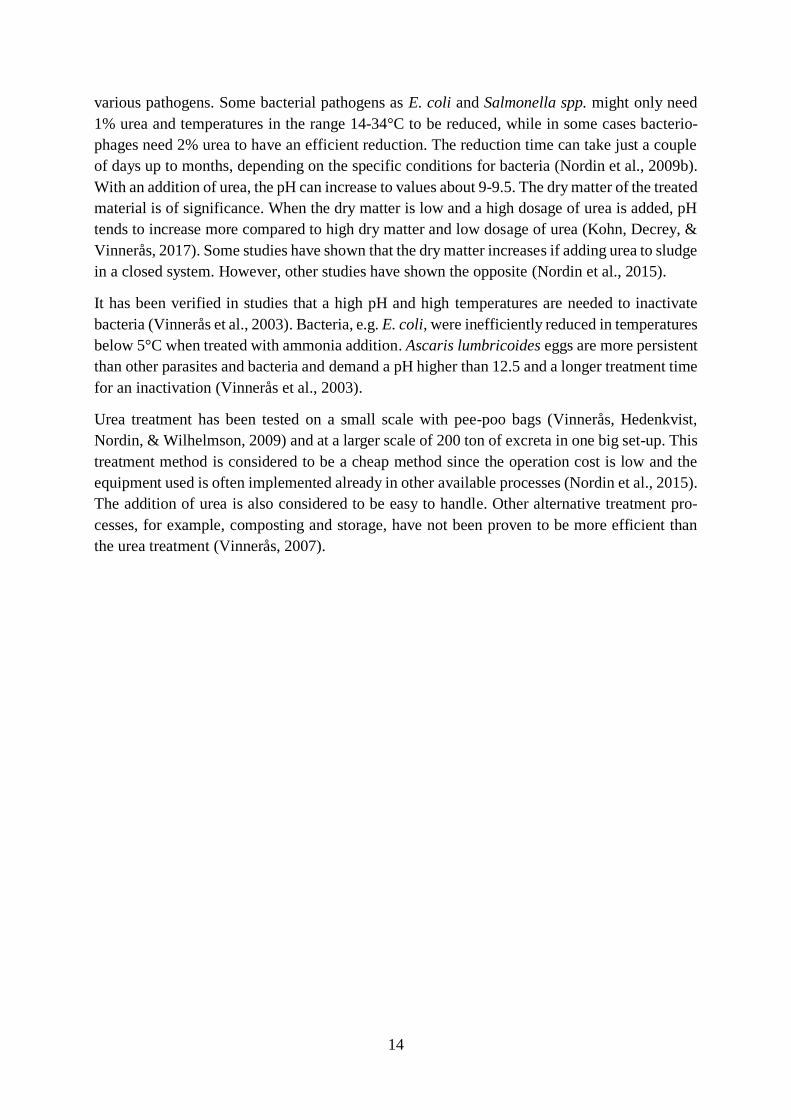
3.2 Experimental setup
Twelve containers of 50 litres each were used in the experimental setup. Six containers were
filled with sludge from bed 1 and the remaining six were filled with sludge from bed 2. To
achieve more representative results, triplicates were used when treating the sludge from each
bed with lime and urea. Hence, three of the containers with sludge from bed 1 were treated with
lime and the remaining three with urea. The same treatment was performed on the six containers
filled with sludge from bed 2, see Figure 7.
Figure 7. Illustration of the twelve containers filled with sludge. Bed 1 and 2 are drying beds where the treated sludge origi-
nates from, the beds differ in their moisture content. Triplicate treatment (A, B, C) with urea and lime.
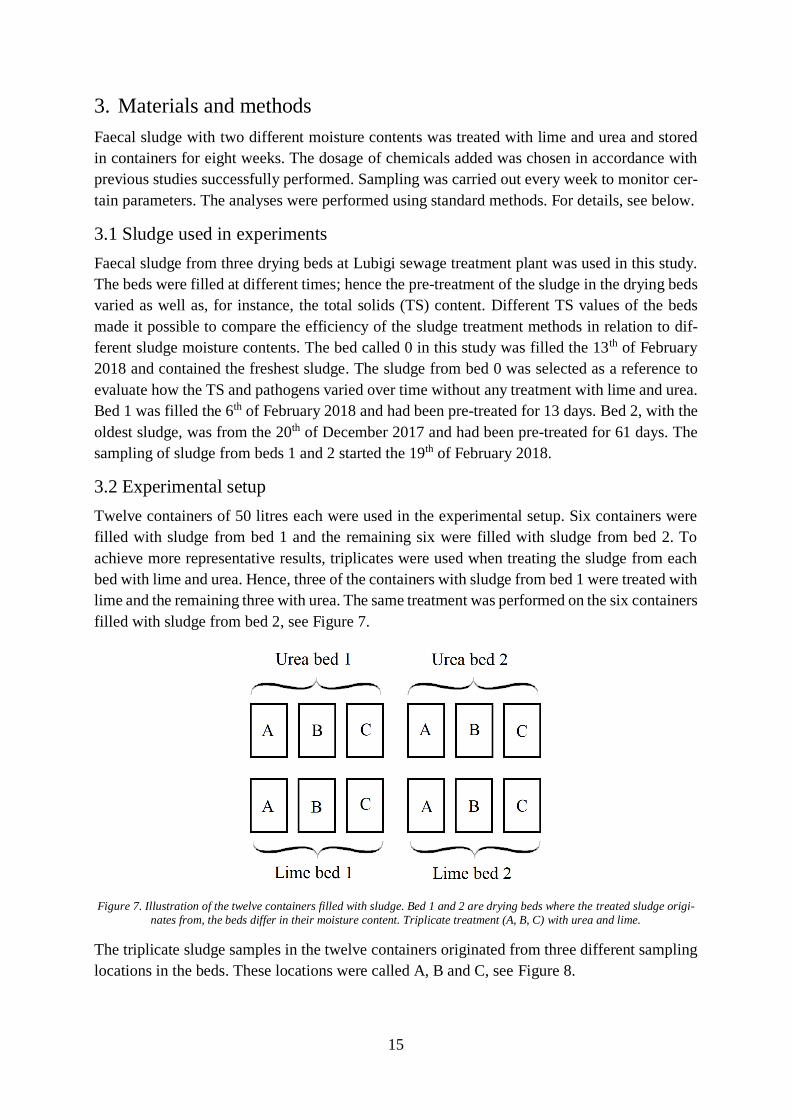
The triplicate sludge samples in the twelve containers originated from three different sampling
locations in the beds. These locations were called A, B and C, see Figure 8.
16
Figure 8. The sampling locations A, B and C in the drying beds 0, 1 and 2.
Using sludge from different locations in the drying bed made it possible to investigate differ-
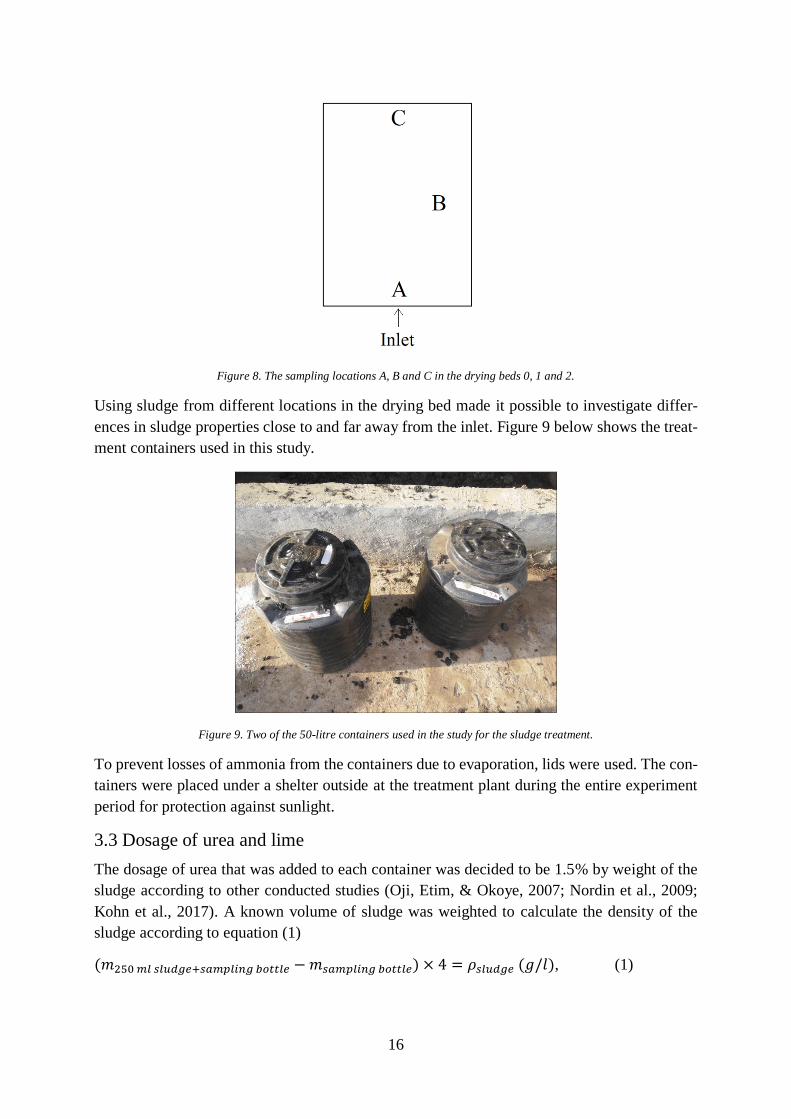
ences in sludge properties close to and far away from the inlet. Figure 9 below shows the treat-
ment containers used in this study.
Figure 9. Two of the 50-litre containers used in the study for the sludge treatment.
To prevent losses of ammonia from the containers due to evaporation, lids were used. The con-
tainers were placed under a shelter outside at the treatment plant during the entire experiment
period for protection against sunlight.
3.3 Dosage of urea and lime
The dosage of urea that was added to each container was decided to be 1.5% by weight of the
sludge according to other conducted studies (Oji, Etim, & Okoye, 2007; Nordin et al., 2009;
Kohn et al., 2017). A known volume of sludge was weighted to calculate the density of the
sludge according to equation (1)
(𝑚250 𝑚𝑙 𝑠𝑙𝑢𝑑𝑔𝑒+𝑠𝑎𝑚𝑝𝑙𝑖𝑛𝑔 𝑏𝑜𝑡𝑡𝑙𝑒 − 𝑚𝑠𝑎𝑚𝑝𝑙𝑖𝑛𝑔 𝑏𝑜𝑡𝑡𝑙𝑒) × 4 = 𝜌𝑠𝑙𝑢𝑑𝑔𝑒 (𝑔/𝑙), (1)
17
where m represents mass and ρ represents density. When the density was known, the weight of
approximately 45 liters of sludge could be calculated (equation 2)
𝜌𝑠𝑙𝑢𝑑𝑔𝑒 (𝑔/𝑙) × 45 𝑙 = 𝑚𝑠𝑙𝑢𝑑𝑔𝑒 (𝑔). (2)
The amount of urea to add to the containers filled with approximately 45 litres of sludge could
be calculated according to equation (3)
𝑚𝑠𝑙𝑢𝑑𝑔𝑒 (𝑔) × 0.015 = 𝑚𝑢𝑟𝑒𝑎 (𝑔) (3)
The urea was added to the surface of the sludge.
The type of lime used in the study was quicklime, CaO. The dosage of lime to add to the con-
tainers had to be sufficient to raise the pH to 12 or more. Small-scale tests showed that an
addition of 10% by weight lime to sludge from both bed 1 and 2 was sufficient regarding the
pH increase. This dosage is similar to what previous studies have shown (Eriksen et al., 1996).
The earlier determined density of the sludge, equation (1), was used to calculate the required
mass of dry quicklime to add to the containers. It was decided to fill the containers with 40 litres
of sludge since lime addition increases the volume of sludge, which was the volume used in
equation (2) for the lime calculations. In equation (3), 10% by weight were used. The lime was
added to the containers in batches and mixed each batch so that the entire content of the con-
tainer was relatively evenly mixed. The lime was added as a powder and not a slurry due to the
increase in temperature caused by the exothermic reaction when the dry lime is mixed with the
sludge. This improves the pathogen reduction and the dewatering process speed (Aulenbach et
al., 2007). To speed up the dewatering process was desirable at Lubigi due to the increasing
amount of sludge transported to the plant for treatment and since the farmers prefer dry sludge
which is cheaper and easier to manage.
3.4 Sampling
When filling the containers with sludge, initial samples were taken before any chemicals were
added. After adding lime and urea, samples were collected from all the twelve containers
weekly, except for two weeks when staff illness interrupted the planned sampling occasions,
during an eight-week period. See Table 2 for the sampling and analyses schedule. A hollow,
plastic pipe with the approximate length of one metre and a diameter of 1.5 centimetres was
used to reach to the bottom of the containers, and a sample could be collected from the whole
depth of the container by pressing a thumb on the end of the pipe to provide a vacuum in the
pipe. For the drier sludge from bed 2, several tries were often needed to get a proper sample.
To get a representative sample from the containers with lime and urea, a systematic randomised
sampling procedure was applied when choosing where to sample in the container, at each sam-
pling occasion. By imagining a grid on the sludge surface in the container, see Figure 10, two
numbers from 1 to 9 were chosen randomly to get a representative sample from each sampling
container, each sampling occasion.

18
Figure 10. Illustration of the selection of locations for sampling in the treatment containers, two numbers from 1 to 9 was
chosen randomly at each sampling occasion to get a representative sample.
The sampling pipe was filled with sludge from the middle of the two randomly chosen grids,
and the sludge was placed in a small sampling bottle. A sufficient amount of sludge was taken
from the small sampling bottle to perform the analyses, see Figure 12. The rest of the sludge
was discarded.
Samples were also collected from the reference drying bed, bed 0, every Monday and Thursday
using a metal scoop to avoid reaching the bottom of the bed filled with sand. The sand might
affect the results, for example, the total solid analyses. Using the scoop, the sludge at the sam-
pling point in the bed was carefully mixed before sampling to get a sample from the whole
depth of the drying bed. Figure 11 below shows the reference drying bed five weeks after filling.
The picture was taken close the sampling location A.
Figure 11. The reference bed, bed 0, at Lubigi sewage treatment plant five weeks after filling.
3.5 Sample preparation
Before performing the nutrient analyses, the samples were homogenised using a blender. To be
able to get in the detection range of the nutrient and pathogen analyses, the samples required
dilution. The dilution solution was distilled water for the E. coli analyses and buffered NaCl
peptone solution with Tween (SVA, Sweden) for the bacteriophages analyses. The sample
preparation before performing analyses is illustrated in Figure 12 below.
19
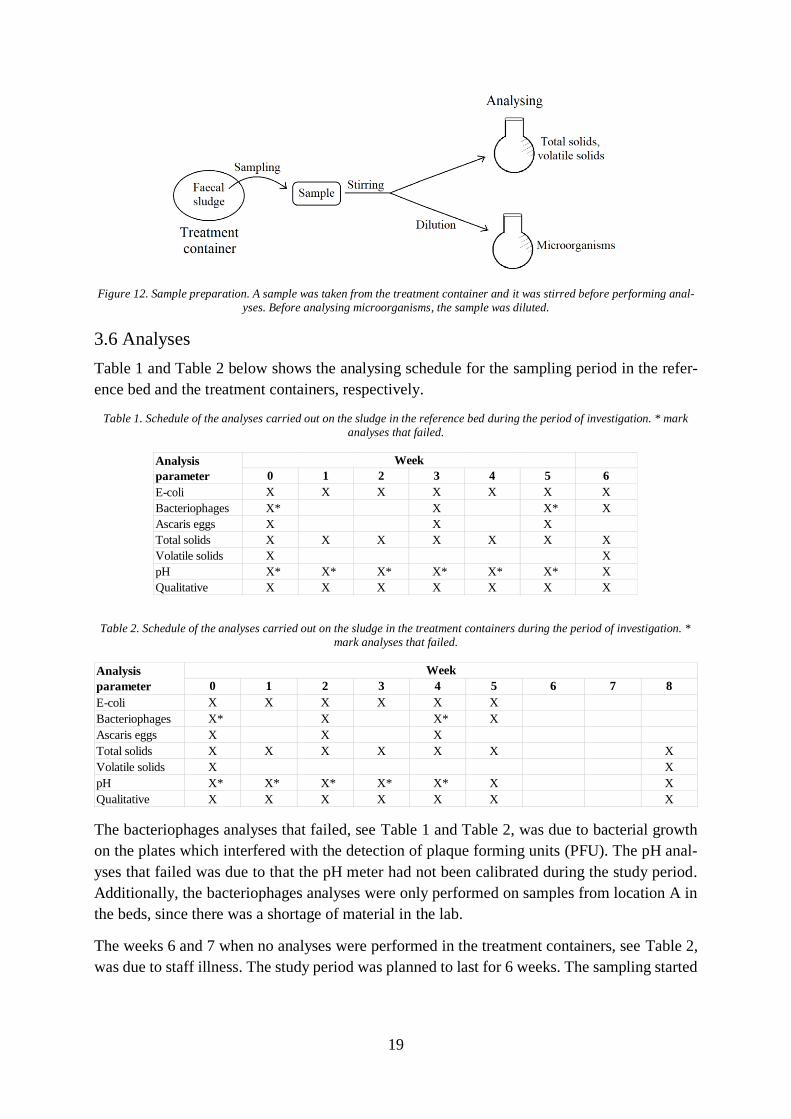
Figure 12. Sample preparation. A sample was taken from the treatment container and it was stirred before performing anal-
yses. Before analysing microorganisms, the sample was diluted.
3.6 Analyses
Table 1 and Table 2 below shows the analysing schedule for the sampling period in the refer-
ence bed and the treatment containers, respectively.
Table 1. Schedule of the analyses carried out on the sludge in the reference bed during the period of investigation. * mark
analyses that failed.
Table 2. Schedule of the analyses carried out on the sludge in the treatment containers during the period of investigation. *
mark analyses that failed.
The bacteriophages analyses that failed, see Table 1 and Table 2, was due to bacterial growth
on the plates which interfered with the detection of plaque forming units (PFU). The pH anal-
yses that failed was due to that the pH meter had not been calibrated during the study period.
Additionally, the bacteriophages analyses were only performed on samples from location A in
the beds, since there was a shortage of material in the lab.
The weeks 6 and 7 when no analyses were performed in the treatment containers, see Table 2,
was due to staff illness. The study period was planned to last for 6 weeks. The sampling started
0 1 2 3 4 5 6
E-coli X X X X X X X
Bacteriophages X* X X* X
Ascaris eggs X X X
Total solids X X X X X X X
Volatile solids X X
pH X* X* X* X* X* X* X
Qualitative X X X X X X X
Analysis
parameter
Week
0 1 2 3 4 5 6 7 8
E-coli X X X X X X
Bacteriophages X* X X* X
Ascaris eggs X X X
Total solids X X X X X X X
Volatile solids X X
pH X* X* X* X* X* X X
Qualitative X X X X X X X
Analysis
parameter
Week
20
one week earlier in the reference bed, that is the reason why the sampling could be carried out
during the planned 6 weeks in the reference bed.
3.6.1 E. coli, bacteriophages and Ascaris eggs
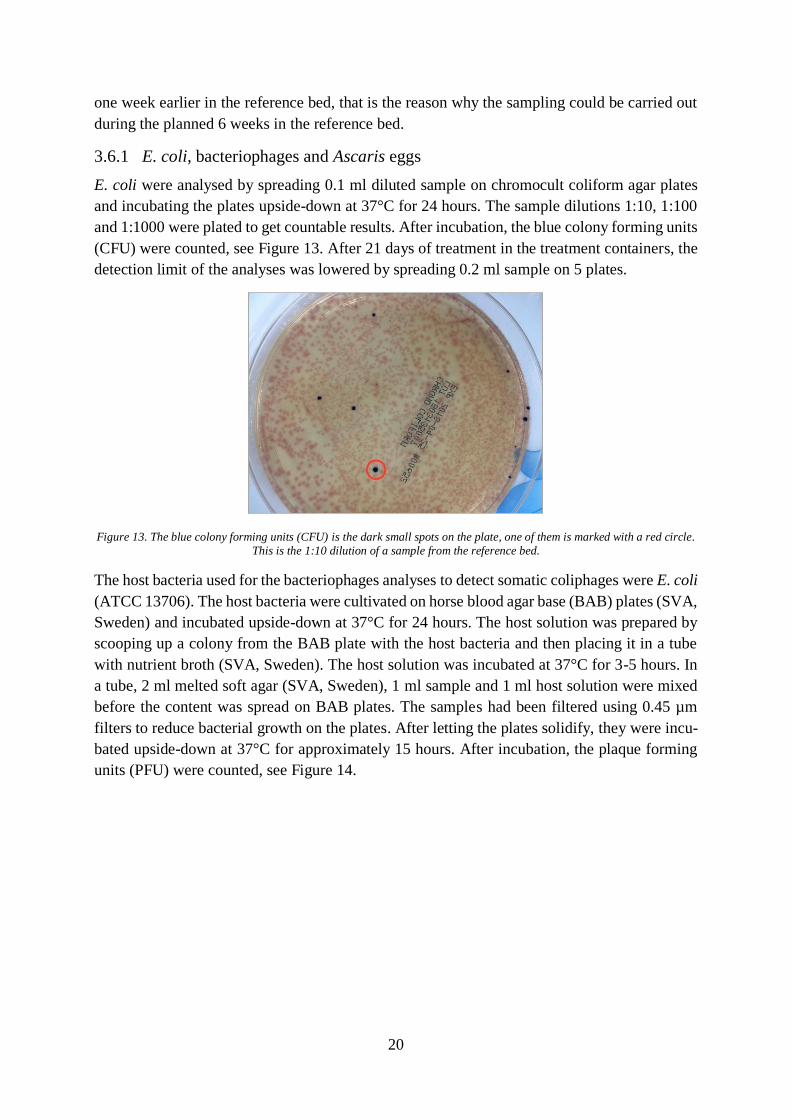
E. coli were analysed by spreading 0.1 ml diluted sample on chromocult coliform agar plates
and incubating the plates upside-down at 37°C for 24 hours. The sample dilutions 1:10, 1:100
and 1:1000 were plated to get countable results. After incubation, the blue colony forming units
(CFU) were counted, see Figure 13. After 21 days of treatment in the treatment containers, the
detection limit of the analyses was lowered by spreading 0.2 ml sample on 5 plates.
Figure 13. The blue colony forming units (CFU) is the dark small spots on the plate, one of them is marked with a red circle.
This is the 1:10 dilution of a sample from the reference bed.
The host bacteria used for the bacteriophages analyses to detect somatic coliphages were E. coli
(ATCC 13706). The host bacteria were cultivated on horse blood agar base (BAB) plates (SVA,
Sweden) and incubated upside-down at 37°C for 24 hours. The host solution was prepared by
scooping up a colony from the BAB plate with the host bacteria and then placing it in a tube
with nutrient broth (SVA, Sweden). The host solution was incubated at 37°C for 3-5 hours. In
a tube, 2 ml melted soft agar (SVA, Sweden), 1 ml sample and 1 ml host solution were mixed
before the content was spread on BAB plates. The samples had been filtered using 0.45 µm
filters to reduce bacterial growth on the plates. After letting the plates solidify, they were incu-
bated upside-down at 37°C for approximately 15 hours. After incubation, the plaque forming
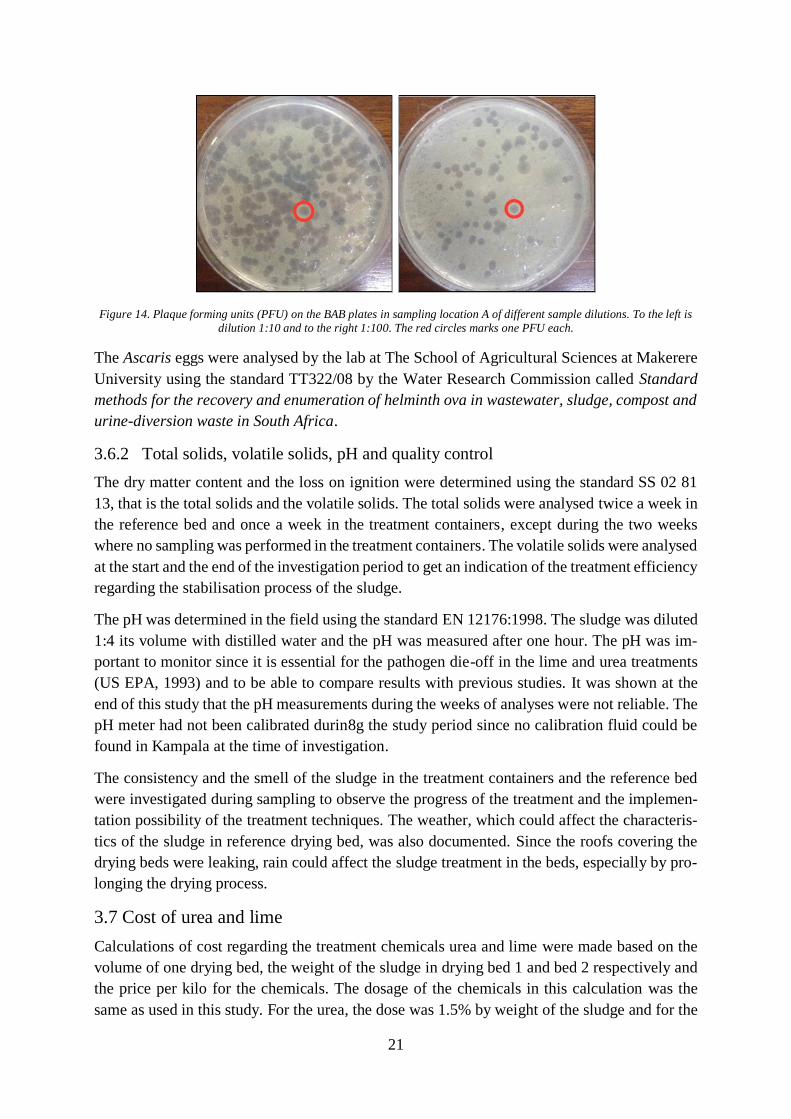
units (PFU) were counted, see Figure 14.
21
Figure 14. Plaque forming units (PFU) on the BAB plates in sampling location A of different sample dilutions. To the left is
dilution 1:10 and to the right 1:100. The red circles marks one PFU each.
The Ascaris eggs were analysed by the lab at The School of Agricultural Sciences at Makerere
University using the standard TT322/08 by the Water Research Commission called Standard
methods for the recovery and enumeration of helminth ova in wastewater, sludge, compost and
urine-diversion waste in South Africa.
3.6.2 Total solids, volatile solids, pH and quality control
The dry matter content and the loss on ignition were determined using the standard SS 02 81
13, that is the total solids and the volatile solids. The total solids were analysed twice a week in
the reference bed and once a week in the treatment containers, except during the two weeks
where no sampling was performed in the treatment containers. The volatile solids were analysed
at the start and the end of the investigation period to get an indication of the treatment efficiency
regarding the stabilisation process of the sludge.
The pH was determined in the field using the standard EN 12176:1998. The sludge was diluted
1:4 its volume with distilled water and the pH was measured after one hour. The pH was im-
portant to monitor since it is essential for the pathogen die-off in the lime and urea treatments
(US EPA, 1993) and to be able to compare results with previous studies. It was shown at the
end of this study that the pH measurements during the weeks of analyses were not reliable. The
pH meter had not been calibrated durin8g the study period since no calibration fluid could be
found in Kampala at the time of investigation.
The consistency and the smell of the sludge in the treatment containers and the reference bed
were investigated during sampling to observe the progress of the treatment and the implemen-
tation possibility of the treatment techniques. The weather, which could affect the characteris-
tics of the sludge in reference drying bed, was also documented. Since the roofs covering the
drying beds were leaking, rain could affect the sludge treatment in the beds, especially by pro-
longing the drying process.
3.7 Cost of urea and lime
Calculations of cost regarding the treatment chemicals urea and lime were made based on the
volume of one drying bed, the weight of the sludge in drying bed 1 and bed 2 respectively and
the price per kilo for the chemicals. The dosage of the chemicals in this calculation was the
same as used in this study. For the urea, the dose was 1.5% by weight of the sludge and for the

22
lime, it was 10% by weight. The chemicals were bought in Uganda and the cost is calculated
from the price on the Ugandan market.
23
4. Results
This section presents the results of the pathogen, total solids and volatile solids analyses. The
cost evaluation of applying the treatment methods using lime and urea is also presented.
4.1 Total solids and volatile solids
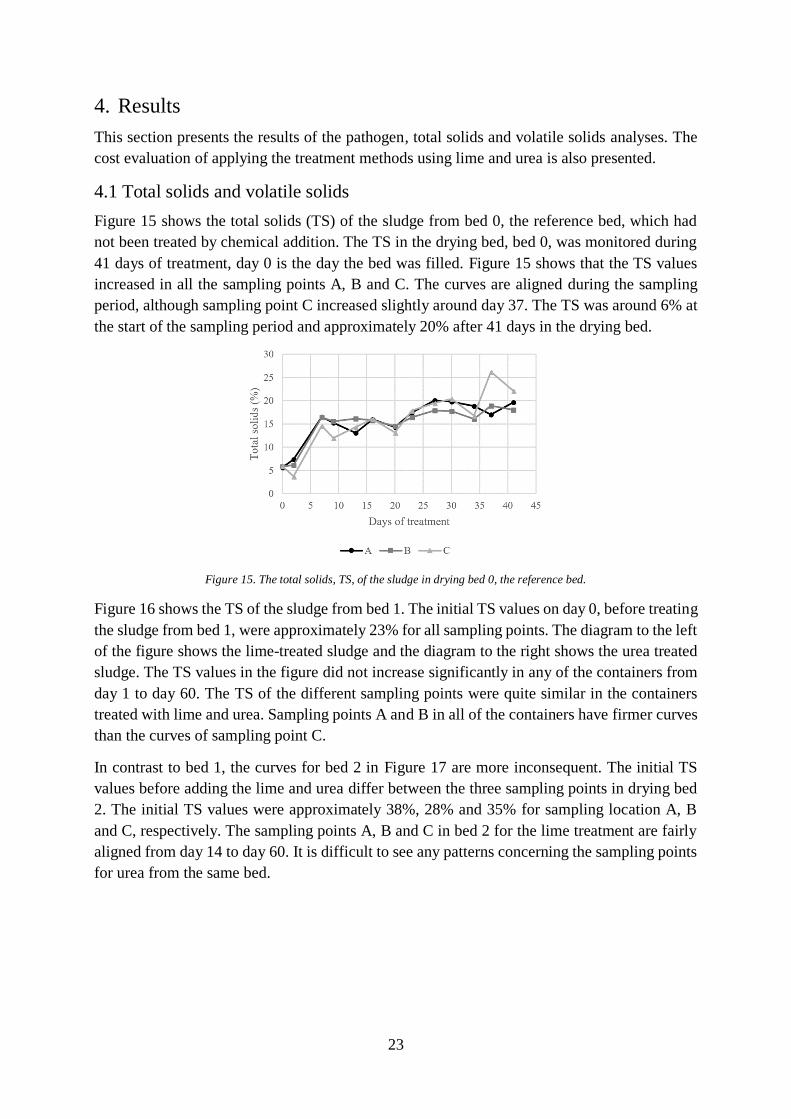
Figure 15 shows the total solids (TS) of the sludge from bed 0, the reference bed, which had
not been treated by chemical addition. The TS in the drying bed, bed 0, was monitored during
41 days of treatment, day 0 is the day the bed was filled. Figure 15 shows that the TS values
increased in all the sampling points A, B and C. The curves are aligned during the sampling
period, although sampling point C increased slightly around day 37. The TS was around 6% at
the start of the sampling period and approximately 20% after 41 days in the drying bed.
Figure 15. The total solids, TS, of the sludge in drying bed 0, the reference bed.
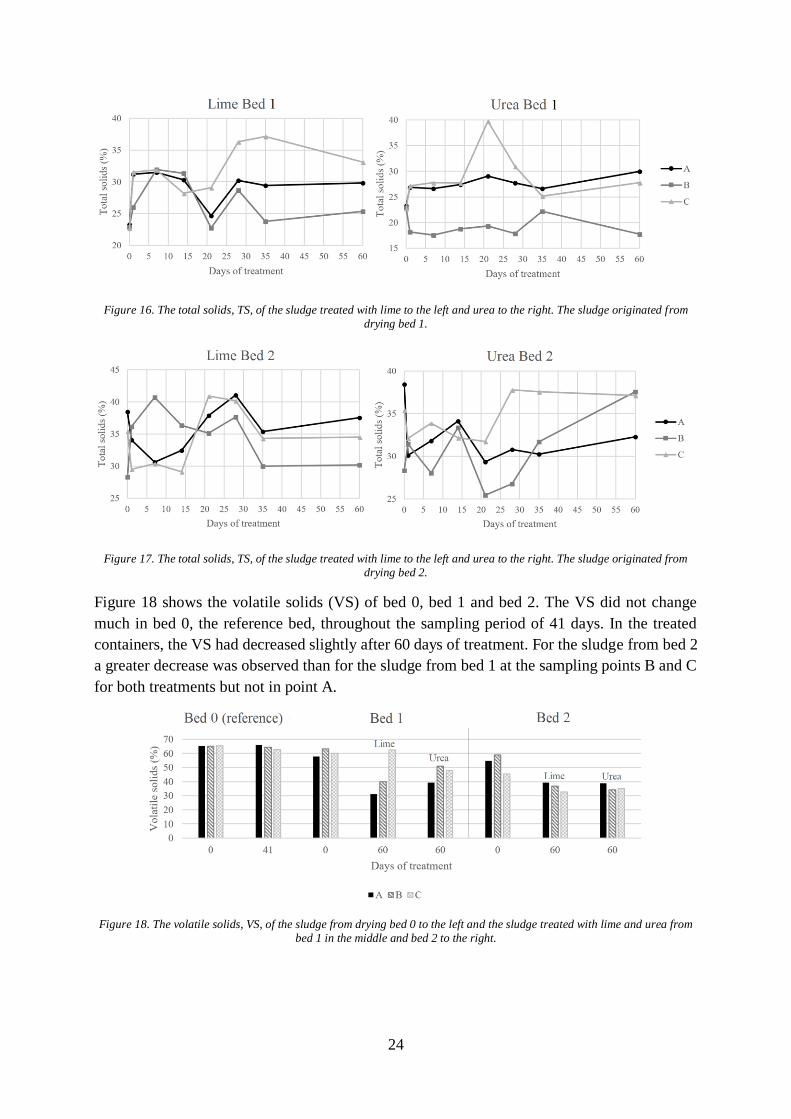
Figure 16 shows the TS of the sludge from bed 1. The initial TS values on day 0, before treating
the sludge from bed 1, were approximately 23% for all sampling points. The diagram to the left
of the figure shows the lime-treated sludge and the diagram to the right shows the urea treated
sludge. The TS values in the figure did not increase significantly in any of the containers from
day 1 to day 60. The TS of the different sampling points were quite similar in the containers
treated with lime and urea. Sampling points A and B in all of the containers have firmer curves
than the curves of sampling point C.
In contrast to bed 1, the curves for bed 2 in Figure 17 are more inconsequent. The initial TS
values before adding the lime and urea differ between the three sampling points in drying bed
2. The initial TS values were approximately 38%, 28% and 35% for sampling location A, B
and C, respectively. The sampling points A, B and C in bed 2 for the lime treatment are fairly
aligned from day 14 to day 60. It is difficult to see any patterns concerning the sampling points
for urea from the same bed.
24
Figure 16. The total solids, TS, of the sludge treated with lime to the left and urea to the right. The sludge originated from
drying bed 1.
Figure 17. The total solids, TS, of the sludge treated with lime to the left and urea to the right. The sludge originated from
drying bed 2.
Figure 18 shows the volatile solids (VS) of bed 0, bed 1 and bed 2. The VS did not change
much in bed 0, the reference bed, throughout the sampling period of 41 days. In the treated
containers, the VS had decreased slightly after 60 days of treatment. For the sludge from bed 2
a greater decrease was observed than for the sludge from bed 1 at the sampling points B and C
for both treatments but not in point A.
Figure 18. The volatile solids, VS, of the sludge from drying bed 0 to the left and the sludge treated with lime and urea from
bed 1 in the middle and bed 2 to the right.
25
4.2 E. coli, bacteriophages and Ascaris eggs
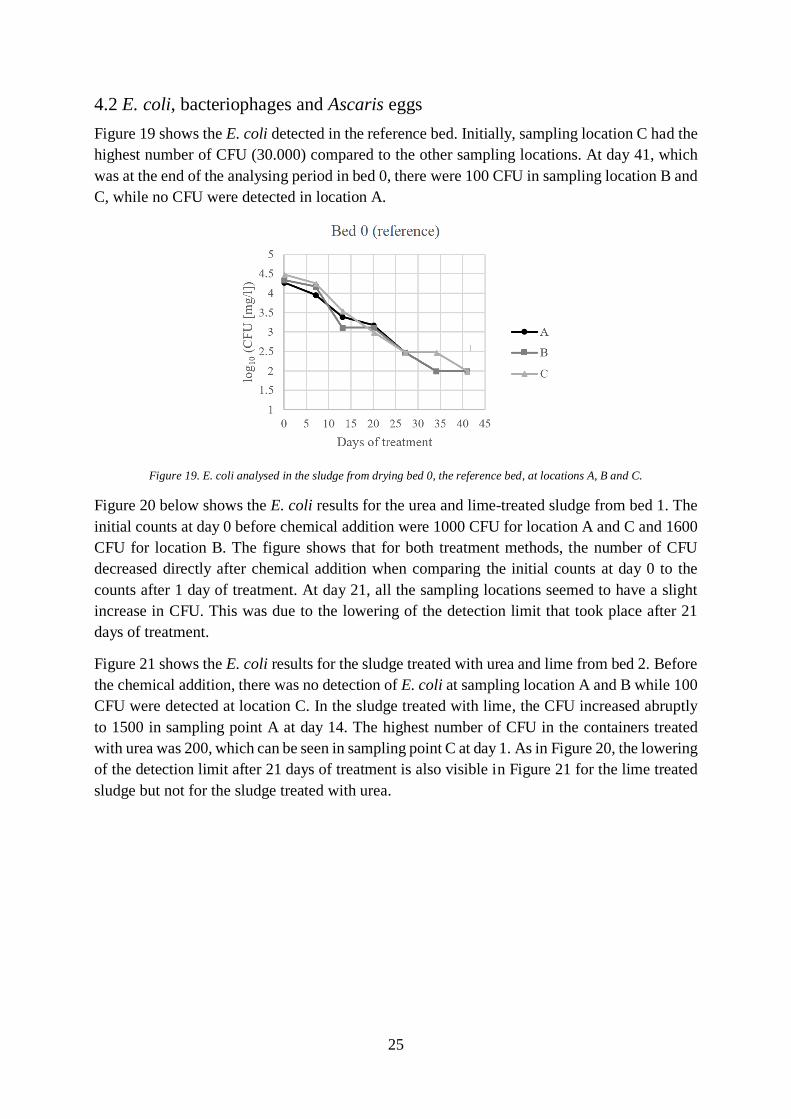
Figure 19 shows the E. coli detected in the reference bed. Initially, sampling location C had the
highest number of CFU (30.000) compared to the other sampling locations. At day 41, which
was at the end of the analysing period in bed 0, there were 100 CFU in sampling location B and
C, while no CFU were detected in location A.
Figure 19. E. coli analysed in the sludge from drying bed 0, the reference bed, at locations A, B and C.
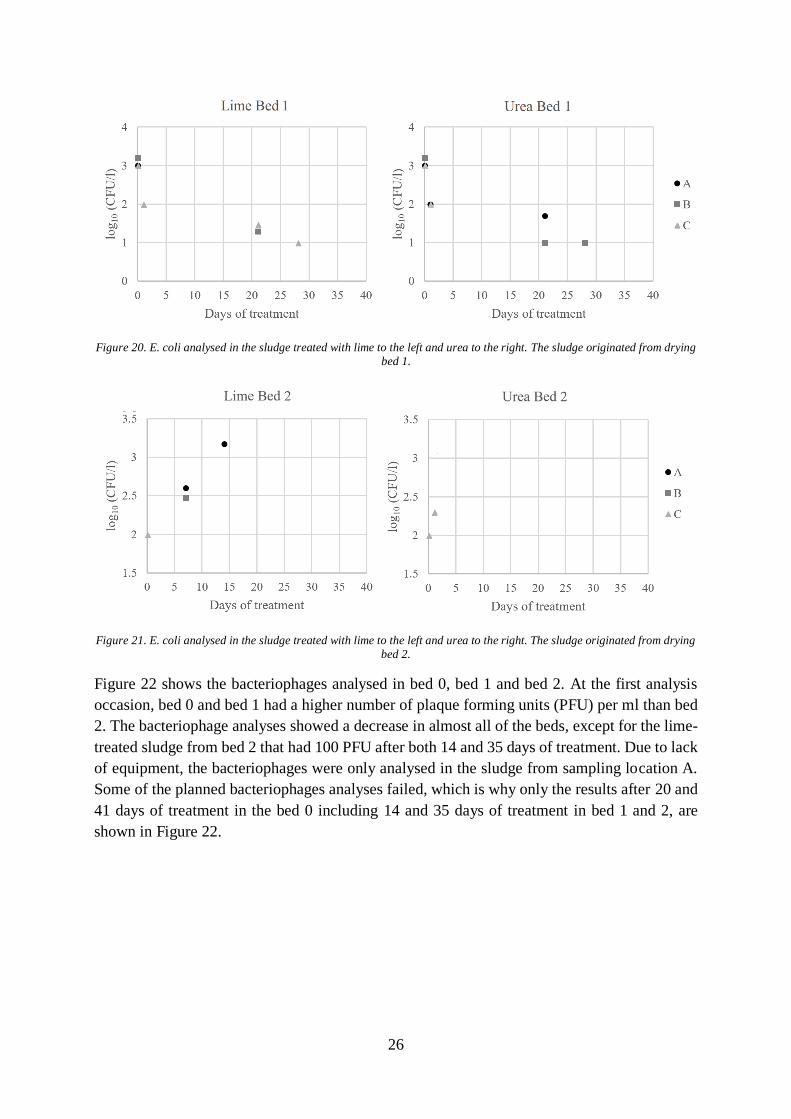
Figure 20 below shows the E. coli results for the urea and lime-treated sludge from bed 1. The
initial counts at day 0 before chemical addition were 1000 CFU for location A and C and 1600
CFU for location B. The figure shows that for both treatment methods, the number of CFU
decreased directly after chemical addition when comparing the initial counts at day 0 to the
counts after 1 day of treatment. At day 21, all the sampling locations seemed to have a slight
increase in CFU. This was due to the lowering of the detection limit that took place after 21
days of treatment.
Figure 21 shows the E. coli results for the sludge treated with urea and lime from bed 2. Before
the chemical addition, there was no detection of E. coli at sampling location A and B while 100
CFU were detected at location C. In the sludge treated with lime, the CFU increased abruptly
to 1500 in sampling point A at day 14. The highest number of CFU in the containers treated
with urea was 200, which can be seen in sampling point C at day 1. As in Figure 20, the lowering
of the detection limit after 21 days of treatment is also visible in Figure 21 for the lime treated
sludge but not for the sludge treated with urea.
26
Figure 20. E. coli analysed in the sludge treated with lime to the left and urea to the right. The sludge originated from drying
bed 1.
Figure 21. E. coli analysed in the sludge treated with lime to the left and urea to the right. The sludge originated from drying
bed 2.
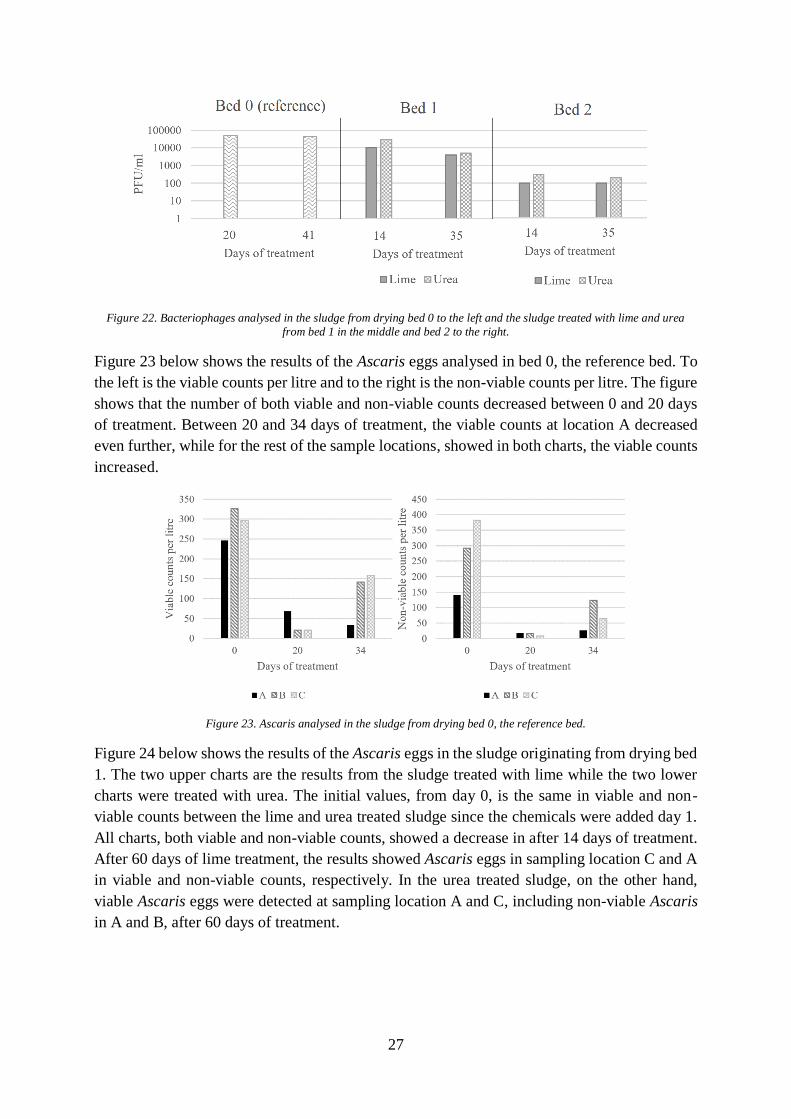
Figure 22 shows the bacteriophages analysed in bed 0, bed 1 and bed 2. At the first analysis
occasion, bed 0 and bed 1 had a higher number of plaque forming units (PFU) per ml than bed
2. The bacteriophage analyses showed a decrease in almost all of the beds, except for the lime-
treated sludge from bed 2 that had 100 PFU after both 14 and 35 days of treatment. Due to lack
of equipment, the bacteriophages were only analysed in the sludge from sampling location A.
Some of the planned bacteriophages analyses failed, which is why only the results after 20 and
41 days of treatment in the bed 0 including 14 and 35 days of treatment in bed 1 and 2, are
shown in Figure 22.
27
Figure 22. Bacteriophages analysed in the sludge from drying bed 0 to the left and the sludge treated with lime and urea
from bed 1 in the middle and bed 2 to the right.
Figure 23 below shows the results of the Ascaris eggs analysed in bed 0, the reference bed. To
the left is the viable counts per litre and to the right is the non-viable counts per litre. The figure
shows that the number of both viable and non-viable counts decreased between 0 and 20 days
of treatment. Between 20 and 34 days of treatment, the viable counts at location A decreased
even further, while for the rest of the sample locations, showed in both charts, the viable counts
increased.
Figure 23. Ascaris analysed in the sludge from drying bed 0, the reference bed.
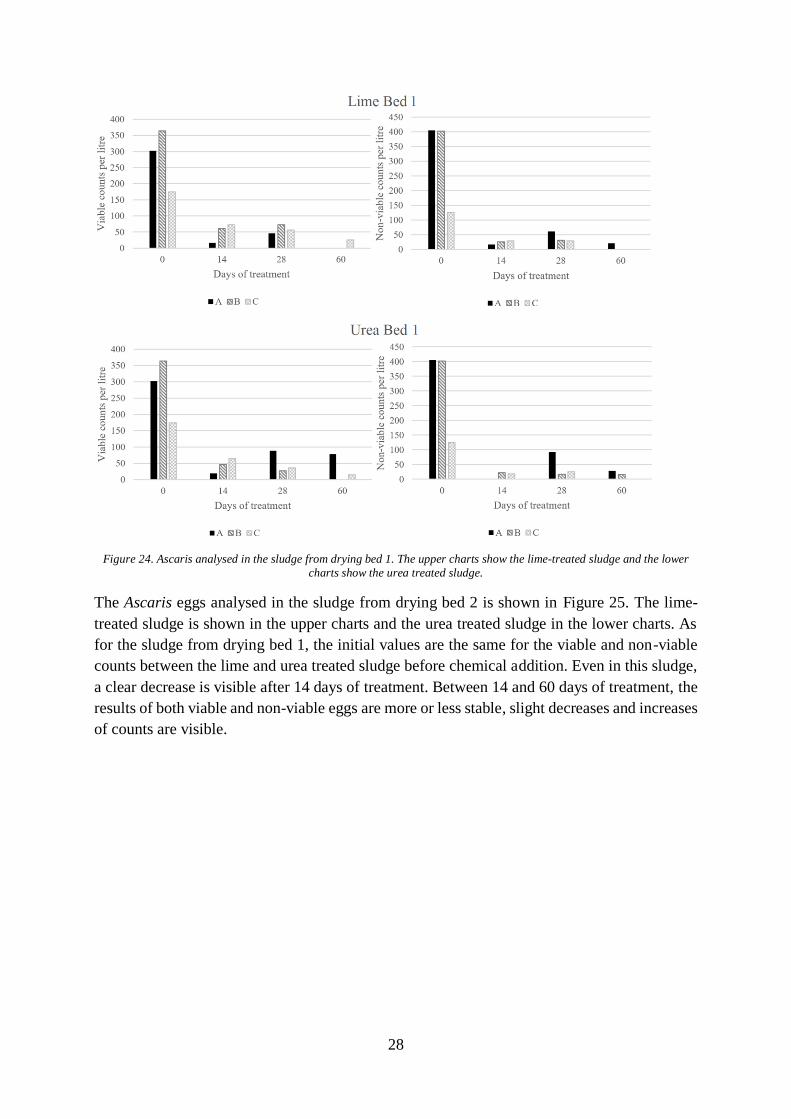
Figure 24 below shows the results of the Ascaris eggs in the sludge originating from drying bed
1. The two upper charts are the results from the sludge treated with lime while the two lower
charts were treated with urea. The initial values, from day 0, is the same in viable and non-
viable counts between the lime and urea treated sludge since the chemicals were added day 1.
All charts, both viable and non-viable counts, showed a decrease in after 14 days of treatment.
After 60 days of lime treatment, the results showed Ascaris eggs in sampling location C and A
in viable and non-viable counts, respectively. In the urea treated sludge, on the other hand,
viable Ascaris eggs were detected at sampling location A and C, including non-viable Ascaris
in A and B, after 60 days of treatment.
28
Figure 24. Ascaris analysed in the sludge from drying bed 1. The upper charts show the lime-treated sludge and the lower
charts show the urea treated sludge.
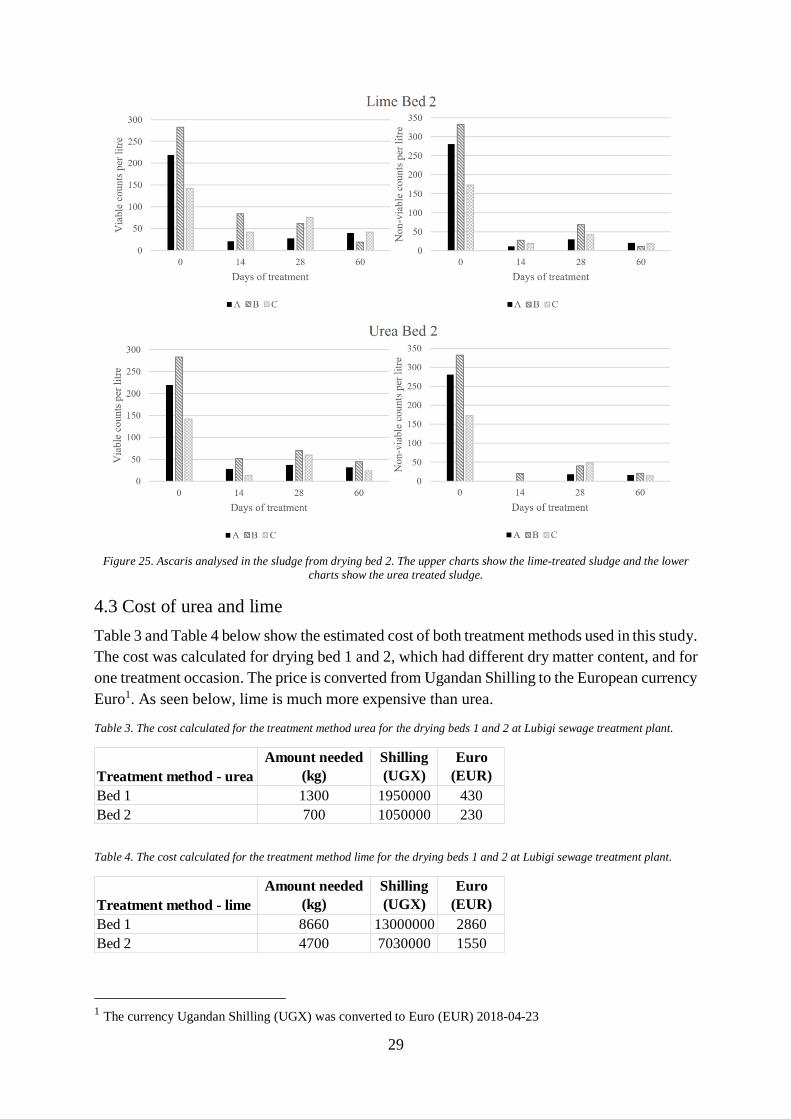
The Ascaris eggs analysed in the sludge from drying bed 2 is shown in Figure 25. The lime-
treated sludge is shown in the upper charts and the urea treated sludge in the lower charts. As
for the sludge from drying bed 1, the initial values are the same for the viable and non-viable
counts between the lime and urea treated sludge before chemical addition. Even in this sludge,
a clear decrease is visible after 14 days of treatment. Between 14 and 60 days of treatment, the
results of both viable and non-viable eggs are more or less stable, slight decreases and increases
of counts are visible.
29
Figure 25. Ascaris analysed in the sludge from drying bed 2. The upper charts show the lime-treated sludge and the lower
charts show the urea treated sludge.
4.3 Cost of urea and lime
Table 3 and Table 4 below show the estimated cost of both treatment methods used in this study.
The cost was calculated for drying bed 1 and 2, which had different dry matter content, and for
one treatment occasion. The price is converted from Ugandan Shilling to the European currency
Euro1. As seen below, lime is much more expensive than urea.
Table 3. The cost calculated for the treatment method urea for the drying beds 1 and 2 at Lubigi sewage treatment plant.
Table 4. The cost calculated for the treatment method lime for the drying beds 1 and 2 at Lubigi sewage treatment plant.
1 The currency Ugandan Shilling (UGX) was converted to Euro (EUR) 2018-04-23
Treatment method - urea
Amount needed
(kg)
Shilling
(UGX)
Euro
(EUR)
Bed 1 1300 1950000 430
Bed 2 700 1050000 230
Treatment method - lime
Amount needed
(kg)
Shilling
(UGX)
Euro
(EUR)
Bed 1 8660 13000000 2860
Bed 2 4700 7030000 1550
30
5. Discussion
In this section, the results regarding the pathogenic microorganism investigations and the meas-
urement of total and volatile solids, are discussed. The feasibility of these treatment methods at
Lubigi sewage treatment plant, when it comes to for instance costs, is assessed and further
studies are suggested.
The idea was to monitor both the reference bed, bed 0, and the treated sludge from drying bed
1 and 2 for a period of six weeks. Although, the sampling planned week 6 in Table 2 was
missed-out due to staff illness. This prolongs the treatment in the containers, which might be
good to have in mind when comparing these results with those from the reference bed.
5.1 Total solids
The total solids (TS) analyses in the reference bed, bed 0, are illustrated in Figure 15. At the
day of filling the drying bed, day 0, the TS was around 6% and the final TS was approximately
20% after 41 days of treatment. This TS increase was expected since the treatment process in
the drying beds included dewatering by evaporation and drainage. The TS in the drying beds
was affected by the leaking roofs covering the beds at Lubigi. Reduction of the TS in Figure
15, for instance between 7 and 9 days of treatment, could therefore be due to rainfalls. Further
increase of the TS is expected during the period of treatment at Lubigi, which generally is about
11 months since the sludge is stored after drying in the beds.
The TS of the sludge treated with lime and urea was generally higher for the sludge originating
from drying bed 2 compared to bed 1, see Figure 16 and Figure 17. This was expected since the
sludge from bed 2 had a higher TS value from the start due to a longer treatment period in the
drying bed before chemical addition. Additional expectations were to achieve the lowest TS
values from sampling location C since this location was furthest from the inlet point, see Figure
8. The finest particles in the sludge were transported to the far end of the drying bed when it is
filled, while the coarser particle settles quicker. However, Figure 16 and Figure 17 shows that
sampling location C often has the highest TS value. This might be due to the leaking roofs
which added rainwater to the dried sludge in the beds. If it had been raining before the contain-
ers were filled with sludge from the different sampling locations, the leaking roofs could have
added more water to sampling location A and B compared to C, which affects the TS values.
It was expected to see an increase of TS and a decrease of volatile solids (VS) after treating
sludge with lime, as shown in previous studies (Mignotte-Cadiergues et al., 2001; Bina et al.,
2004). Figure 16 and Figure 17 shows some increase of TS directly after adding lime, however,
some decrease was also shown. This could be due to several reasons, for instance, insufficient
mixing which provided different TS values between sampling locations in the containers or not
enough lime added to the sludge. As also previous studies have mentioned (Ottoson et al.,
2008), there were some problems with lumps of lime due to the difficulty of mixing the lime
with the dryer sludge, especially the sludge from bed 2.
After treating sludge with urea, the TS can increase if the treatment is performed in an open
system, a less increase have been shown in a closed system (Magri, Philippi, & Vinnerås, 2013).
Other studies have notices decreases of the TS instead (Nordin et al., 2015). In Figure 16 and
31
Figure 17 the TS of the urea-treated sludge in bed 1 and 2 can be seen. The TS in bed 1 is quite
stable for all of the sampling points while bed 2 in Figure 17 shows an increase in TS for sample
points B and C by the end of the treatment period. This slight increase may be due to evapora-
tion.
5.2 Volatile solids
As the sludge treatment proceeds and the sludge stabilises, the VS should decrease since stabi-
lisation decreases the level of readily degradable organic matter in the sludge (Aulenbach et al.,
2007). In accordance with previous studies (Mignotte-Cadiergues et al., 2001; Bina et al.,
2004), a decrease in the VS can be seen in Figure 18 for sludge treated with both lime and urea.
This indicates some stabilisation of the sludge. If comparing the treated beds 1 and 2 with the
reference bed, bed 0, the VS decreases significantly after chemical addition. Although the treat-
ment with lime and urea was monitored for 60 days while the reference bed was analysed for
41 days, the VS levels in Figure 18 confirms the improved and rapid treatment using chemical
addition. Even though the sludge from drying bed 2 had been treated in the bed for 61 days
before this study started and the chemicals were added, there is no major difference in the VS
compared to the sludge from drying bed 1 that had been treated in the bed for 13 days before
adding the chemicals. This indicates an inefficient stabilisation of the sludge in the existing
drying beds.
5.3 E. coli
Figure 19 shows the decrease of the colony forming units (CFU) in drying bed 0, the reference
bed. Time and temperature are factors that reduce the ability of E. coli bacteria to live in the
sludge. Also, the water content of the sludge is important. Reduced water content reduces the
active pathogens since microorganisms need water for survival (Bassan et al., 2014). The sludge
in bed 0 was treated in a drying bed with the main aim to reduce the water content by evapora-
tion and drainage. This is illustrated in Figure 15, which shows the TS increase in bed 0. At the
start of the sampling period, the TS was around 6% and by the end of the 41 days of analyses,
the TS is approximately 20%. The TS increase could be the reason for the reduction of detected
E. coli. By the end of the analysing period of 41 days in bed 0, there were still approximately
100 CFU detected in sampling location B and C in bed 0, which is illustrated in the right bar
chart in Figure 19. It is likely that the E. coli bacteria would continue to decrease with time as
bed 0 gets dryer. The sludge is treated in the drying beds at Lubigi for 4-8 weeks. Bed 0 was
only monitored for 6 weeks in this study. After treatment in the drying bed, the sludge is stored
under shelter for an additional 6 months which likely enables further reduction of E. coli.
E. coli, decreased as expected in the sludge treated with lime and urea, see Figure 20 and Figure
21. This was predicted since both lime and urea are effective disinfectants as shown in previous
studies (Mignotte-Cadiergues et al., 2001; Nordin et al., 2009). Longer treatment periods,
higher pH-values and higher temperatures are essential for the pathogen die-off (Mignotte-
Cadiergues et al., 2001; Ottoson et al., 2008). Drying bed 1 had a faster decrease of detected
CFU than drying bed 2, see Figure 20 and Figure 21 respectively. The lower TS value in drying
bed 1 compared to bed 2 can be an explanation for this result. Urea is more effective at lower
TS values since the buffer capacity decreases and it results in a higher pH-value (Ottoson et al.,
32
2008). Lime treatment of sludge is also affected by the TS, other studies have mentioned the
difficulty of mixing the lime with the dry sludge (Ottoson et al., 2008). More effectively mixing
of the sludge and lime from bed 1 with the lower TS, likely implied more lime in contact with
the sludge, which could be the reason for the faster decrease in CFU in the sludge from this
bed.
The sludge from both bed 1 and 2 had been treated in the drying beds without chemical addition
for some weeks and even months before the chemical treatment started. Bed 1 was filled the 6th
of February 2018 and had been treated for 13 days while bed 2 was from the 20th of December
2017 and had been treated for 61 days when this study started. The sludge treated the longest
time in a drying bed should have the lowest detected CFU and the highest TS value. Although,
the roofs covering the drying beds at Lubigi leaked, so this might not be the case. The initial
TS values of the sludge from bed 1 and bed 2 at day 0 is illustrated in Figure 16 and Figure 17.
The highest initial TS can be seen in the sludge from bed 2, the oldest sludge, as expected. The
sludge from this bed also showed the lowest initial CFU in Figure 21, where the only CFU
detection was found in location C, 100 CFU. Bed 1 on the other hand, showed initially 1000
CFU in location A and C and 1600 CFU in B. The initial results of the sludge from bed 1 and
2 before chemical addition is a clear indication of that the E. coli bacteria in bed 0 would con-
tinue to decrease as the sludge gets dryer.
Both for the lime and urea treated sludge from bed 1 and 2, Figure 20 and Figure 21, E. coli
were below the detection limit before the treatment period of eight weeks had passed. Therefore,
the analyses ceased before the study period of 41 days of treatment was over. The final E. coli
analyses of both the lime and urea treated sludge from bed 1 including the lime-treated sludge
from bed 2 took place after 35 days of treatment. The analyses of the urea-treated sludge from
bed 2 ceased after 21 days of treatment. If the chemicals had been added at the time when the
drying beds were filled, E. coli had probably been non-detectable before this study started. Re-
duction of E. coli in urea-treated sludge have shown promising results when urea was added to
1% by weight (Nordin et al., 2009b), and in this study, addition of 1.5% urea showed an efficient
reduction. Lowering the urea dosage to 1% may therefore still result in efficient treatment re-
garding E. coli reduction.
The CFU seemed to increase at day 21 in Figure 20, both for lime and urea. This can be ex-
plained by more accurate E. coli analyses that were carried out at day 21 in the laboratory, five
chromocult plates were used for every sample instead of one to lower the detection limit.
5.4 Bacteriophages
The bacteriophages analyses were very difficult to perform since they were time-consuming
and filters were needed to rinse the dilution and the laboratory lacked in this equipment. There-
fore, these tests were only performed on the containers from sample location A and at four
different sampling occasions, see Table 1. However, only two of these analyses succeeded, after
14 and 35 days of treatment in the containers and after 20 and 41 days in the reference bed, see
Figure 22. This was due to problems with interfering bacteria growing on the plates which made
it difficult to see the plaque forming units (PFU).
33
If comparing the results of the lime and urea treated sludge, there are a lower number of PFU
detected in the sludge treated with lime in both beds, but lime had a slower rate of PFU reduc-
tion between the sampling occasions. While the lime-treated sludge did not decrease in PFU at
all in bed 2 between the analysing occasions, the urea treated sludge decreased with 100 PFU
per ml. At the same time, several thousand PFU per ml were detected in both bed 0 and 1. The
low amount of PFU in the sludge from bed 2 could be explained by the longer pre-treatment
time in the drying bed and the higher TS value, see Figure 17, which could have reduced the
level of bacteriophages before the chemicals were added, as storage is an important aspect re-
garding pathogen die-off (Nordin et al., 2009b).
After 14 days of treatment, the number of PFU was less in the sludge treated with lime than
urea in both bed 1 and 2. However, due to the failed trial of the initial amount of PFU, see Table
2, there is no way of knowing the exact reduction efficiency of either the lime or urea treatment
methods. When adding lime to disinfect faecal sludge, the pH is a significant factor which in
turn was affected by the amount of lime added (Mignotte-Cadiergues et al., 2001). In this study,
it was not known if the pH reached 12 in the lime-treated sludge since the pH meter could not
be calibrated, a pH of 12 is of importance for the die-off of pathogens when using lime. Alt-
hough, it seems like the lime had an effect on the inactivation of bacteriophages. The inefficient
reduction of bacteriophages in the lime-treated sludge in bed 2, with a higher TS, could have
been due to lumps of lime, which can be a problem according to other studies (Ottoson et al.,
2008). When sampling from the containers, lumps of lime was often seen in the sludge from
bed 2. Additional storage might show a further reduction of the PFU detected in the chemical-
treated sludge.
Since two of the trials failed, there are some uncertainties regarding the level of bacteriophages
in the sludge at Lubigi due to not analysing duplicates or triplicates. It is therefore difficult to
draw any substantial conclusions of the bacteriophages analyses of this study. Other studies
performed have pointed out that it is unsure whether the addition of urea is the main factor
causing reduction of bacteriophages, or if it is other factors that are more efficient, e.g. temper-
ature and pH (Magri et al., 2013). Furthermore, previous studies have shown that bacterio-
phages in some sludges need a urea dosage of 2% by weight to have an efficient reduction
(Nordin et al., 2009b). Therefore, further studies are needed concerning bacteriophages at
Lubigi sewage treatment plant.
5.5 Ascaris eggs
Ascaris eggs are very resistant to treatment and disinfectant and are therefore a good indicator
of the inactivation of pathogens and the efficiency of the applied treatment (Nordin et al.,
2009a). The Ascaris results of this study are shown in Figure 23, Figure 24 and Figure 25. Day
0 represents the Ascaris counts before chemical addition in the sludge. The sludge from all three
beds treated with the various methods generally showed a decrease of both viable and non-
viable counts after 14 days of treatment.
The sludge in the reference bed, Figure 23, showed a decrease in both viable and non-viable
Ascaris eggs between day 0 and after 20 days of treatment. However, there was an increase
between 20 and 34 days of treatment for the majority of the samples. This increase might be
34
connected to the change in TS of the sludge in the bed, see Figure 15, as the moisture content
influences the survival of the eggs and larvae (Gyawali, 2018). Day 0, the TS was 6%, then
increased to 14% after 20 days of treatment and 17% after 34 days of treatment, approximately.
The unstable TS in Figure 15 was due to the occasional rainfalls adding water to the drying bed,
which increased the moisture content and influenced the on-going treatment process in the bed
negatively.
The relation between the detected Ascaris eggs and the TS is not valid for the treatment con-
tainers as they were stored with lids, which disturbed the drying process and the TS increase.
In location B in the lime-treated sludge from bed 1, Figure 24, no Ascaris eggs were detected
after 60 days, either viable or non-viable, which was the location of the sludge with the lowest
TS value, Figure 16. The same goes for the viable counts, see Figure 24, in the sludge collected
at sampling location B treated with urea, no eggs were detected while B has the lowest TS, i.e.
the highest moisture content. This might be due to fact that Ascaris eggs are mostly found in
the more solid fractions of the faecal sludge (Bassan et al., 2014).
By only looking at the viable and non-viable counts in the beds day 0 before adding chemicals,
the highest detected counts were found in the sludge from bed 1, Figure 24. It was expected to
find the highest number of Ascaris counts in the sludge from bed 0, that had been through least
treatment, both regarding treatment time and that no chemicals had been added. Additionally,
it was expected that the lowest counts would be found in bed 2, Figure 25. Bed 2 was treated
for 60 days in the drying bed before the chemicals had been added, compared to the sludge from
bed 1 that were treated for 13 days in the drying bed. The higher TS of the sludge from bed 2
could be the reason why Ascaris were still detected in the sludge.
Generally, the Ascaris results showed a decrease as the treatment proceeds. Previous studies on
both lime and urea addition to faecal sludge show inactivation of Ascaris eggs when storing the
sludge (Eriksen et al., 1996; Nordin et al., 2009a). Therefore, it is convenient to assume that
further analyses would have shown a decrease in counts if the sludge would have continued to
be stored and monitored. This might however not be the case in the sludge treated with lime
since it was uncertain if the pH reached 12, which is essential for pathogen die-off in lime-
treated sludge. It was not assured that the 10% by weight of lime used in this study was enough
to raise the pH to 12 or above for the sludge at Lubigi sewage treatment plant. Also, no classi-
fication of the sludge in accordance with the USEPA standard regarding reuse or disposal of
sewage sludge can be done. According to this standard, the sludge needs to meet certain path-
ogen reduction requirements to be reused in any land applications. The requirements concern
the pH-value in relation to the time of storage to prevent pathogen re-growth.
5.6 Practical implementation
The results of this study showed that the sludge at Lubigi sewage treatment plant contains bac-
teria, viruses and helminths. It may, therefore, be necessary to implement further treatment of
faecal sludge since there is a risk of pathogen spreading when the sludge is sold to use in farms
as fertilizer and soil amendment. However, no analyses were performed on the sludge directly
before selling it to farmers. There is, therefore, no way of knowing the level of pathogens after
the 11 months of storage. However, the easily accessible storage area and the leaking roofs may
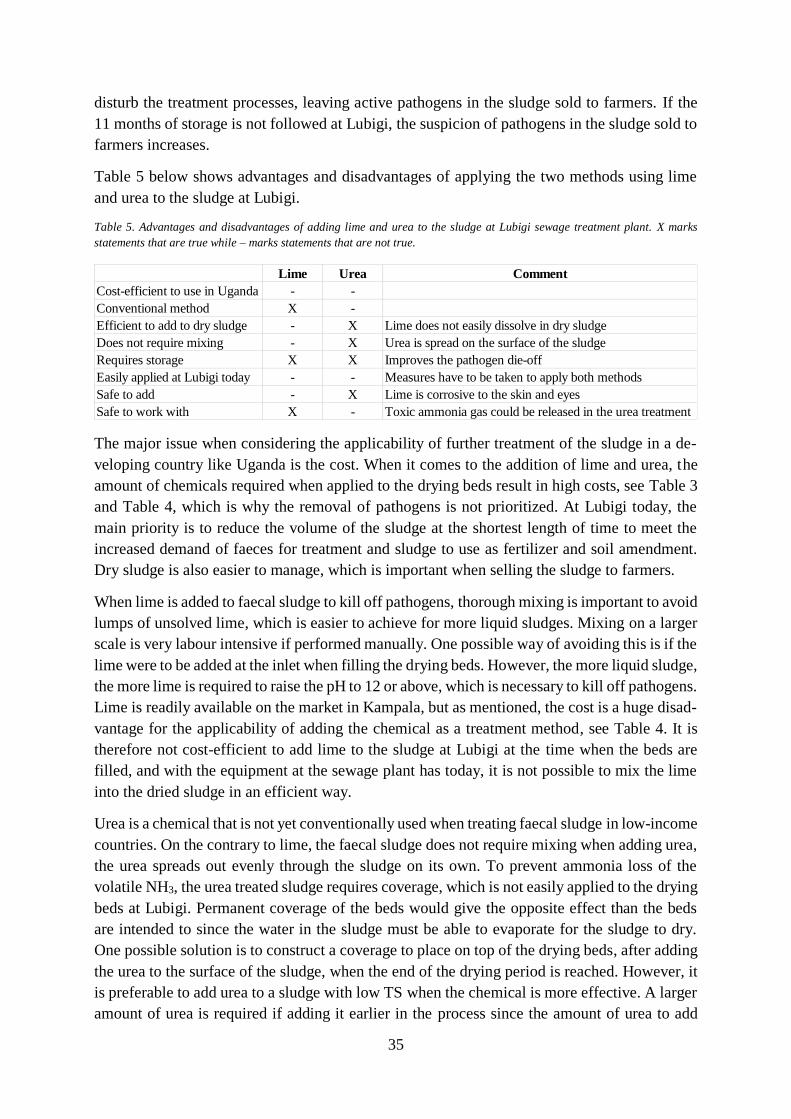
35
disturb the treatment processes, leaving active pathogens in the sludge sold to farmers. If the
11 months of storage is not followed at Lubigi, the suspicion of pathogens in the sludge sold to
farmers increases.
Table 5 below shows advantages and disadvantages of applying the two methods using lime
and urea to the sludge at Lubigi.
Table 5. Advantages and disadvantages of adding lime and urea to the sludge at Lubigi sewage treatment plant. X marks
statements that are true while – marks statements that are not true.
The major issue when considering the applicability of further treatment of the sludge in a de-
veloping country like Uganda is the cost. When it comes to the addition of lime and urea, the
amount of chemicals required when applied to the drying beds result in high costs, see Table 3
and Table 4, which is why the removal of pathogens is not prioritized. At Lubigi today, the
main priority is to reduce the volume of the sludge at the shortest length of time to meet the
increased demand of faeces for treatment and sludge to use as fertilizer and soil amendment.
Dry sludge is also easier to manage, which is important when selling the sludge to farmers.
When lime is added to faecal sludge to kill off pathogens, thorough mixing is important to avoid
lumps of unsolved lime, which is easier to achieve for more liquid sludges. Mixing on a larger
scale is very labour intensive if performed manually. One possible way of avoiding this is if the
lime were to be added at the inlet when filling the drying beds. However, the more liquid sludge,
the more lime is required to raise the pH to 12 or above, which is necessary to kill off pathogens.
Lime is readily available on the market in Kampala, but as mentioned, the cost is a huge disad-
vantage for the applicability of adding the chemical as a treatment method, see Table 4. It is
therefore not cost-efficient to add lime to the sludge at Lubigi at the time when the beds are
filled, and with the equipment at the sewage plant has today, it is not possible to mix the lime
into the dried sludge in an efficient way.
Urea is a chemical that is not yet conventionally used when treating faecal sludge in low-income
countries. On the contrary to lime, the faecal sludge does not require mixing when adding urea,
the urea spreads out evenly through the sludge on its own. To prevent ammonia loss of the
volatile NH3, the urea treated sludge requires coverage, which is not easily applied to the drying
beds at Lubigi. Permanent coverage of the beds would give the opposite effect than the beds
are intended to since the water in the sludge must be able to evaporate for the sludge to dry.
One possible solution is to construct a coverage to place on top of the drying beds, after adding
the urea to the surface of the sludge, when the end of the drying period is reached. However, it
is preferable to add urea to a sludge with low TS when the chemical is more effective. A larger
amount of urea is required if adding it earlier in the process since the amount of urea to add
Lime Urea Comment
Cost-efficient to use in Uganda - -
Conventional method X -
Efficient to add to dry sludge - X Lime does not easily dissolve in dry sludge
Does not require mixing - X Urea is spread on the surface of the sludge
Requires storage X X Improves the pathogen die-off
Easily applied at Lubigi today - - Measures have to be taken to apply both methods
Safe to add - X Lime is corrosive to the skin and eyes
Safe to work with X - Toxic ammonia gas could be released in the urea treatment
36
depends on the weight of the sludge. Urea is a cheaper treatment method compared to lime in
this study, see Table 3, also a less amount of urea by weight is required when treating sludge.
An important aspect when using chemicals like lime and urea is the safety of the workers at the
sewage treatment plant. Quicklime comes in the form of a dry powder that is very corrosive to
skin, eyes and lungs. Therefore, proper safety equipment is required to ensure personal safety.
Protective clothes, gloves, goggles and gas masks are important to use. The toxic ammonia gas
that is formed when adding urea to sludge should not be inhaled. During the treatment period,
an intense chemical smell of the urea-treated sludge was discovered, especially in the sludge
originating from drying bed 1 due to the higher moisture content of this bed.
5.7 Further studies
When performing this study, the investigation methodology had to be adapted since the re-
sources were limited. Therefore, further studies are important to get a better knowledge of the
sludge characteristics at Lubigi sewage treatment plant. Further investigations could include
lime treatment of the sludge since an uncalibrated pH meter was used in this study, meaning
that the pH might never have reached 12 which is significant for lime treatment. At pH 12, the
cell membranes of pathogens are destroyed. However, the practical implementation of adding
lime is questionable due to the difficulty of mixing lime with dry sludge.
To change the chemicals to other reactants is a suggestion of a further study. Another thought
is to focus on just one chemical and investigate its efficiency more comprehensive. It would
also be interesting to investigate pathogen die-off on a larger scale than in 50 litres containers.
Trials on a larger scale would be more representative since one drying bed at Lubigi treats
approximately 70,000 litres of sludge. If the treatment chemicals were added to a drying bed
and the results were compared to a reference bed, the samples would be treated more similar
which improves the comparability. If no lids were used when performing the experiment, the
representativeness would increase further. Although, not using lids comes with the disad-
vantage of releasing toxic ammonia gas.
Improving the roofs covering the drying beds that are now leaking would also add to the relia-
bility of the results. Today, rainwater pours onto the drying beds which affects the total solids
value and the length of the drying period in the bed especially. Figure 15 illustrates the varying
rate of total solids in the reference drying bed of this experiment, the curve decreases when it
is raining, which also decreases the total solids value. The sludge treated with lime and urea in
the containers were not affected by the heavy rains since they were covered with lids and stored
under shelter.
The faecal sludge at Lubigi is treated for approximately 11 months in which 6 months the sludge
is stored (Orwiny, 2018, personal communication). Although, one year of storage is recom-
mended in areas with a warmer climate (World Health Organization, 2006) to enable pathogen
die-off. These are recommendations that should be applied to prevent re-growth of pathogens.
Therefore, the level of active pathogens should be analysed in the sludge at Lubigi by the end
of the present treatment period to make sure it is safe for farmers to use.

37
Studies in the future could be to investigate the level of hormones and pharmaceutical residues
in the faecal sludge. It is important to be aware of the content of harmful substances since the
sludge at Lubigi is reused in agricultural applications. The population of Kampala is growing,
this increases the demand for medicines to fight diseases as well as the need for birth control to
stabilise the population growth. Access to basic sanitation facilities of the people in Kampala
is an issue that needs to be solved as the urbanisation increases. Therefore, the amount of faecal
sludge that needs treatment is presumed to increase in the years to come. The need for fertilizers
to ensure crops that can feed the population is also increasing. To have knowledge about all the
substances that the sludge contains when it is mixed in soil and spread in the environment is
important, which is why hormones and pharmaceutical residues should be analysed in the fu-
ture.
38
6. Conclusion
The results showed that the lime and urea treatment of faecal sludge at Lubigi sewage treatment
plant reduced the detected level of E. coli, bacteriophages and Ascaris eggs throughout the time
of storage. Even the reference drying bed, that was used as a control, showed a reduction of
pathogens, although not as efficiently as when adding chemicals. The chemical addition speeds
up the treatment process. The results prove that the time of treatment in the drying beds
influences the initial levels of pathogens before chemical addition, the longer pre-treatment in
the beds, the lower level of detected pathogens. There was still detection of bacteriophages and
Ascaris at the last analyses occasion for all treatment containers, including the reference bed.
Additional storage of the treated sludge expects to show a further decrease. Generally, the re-
sults of the two treatment methods appear to be reliable, even though there is no way of knowing
if the pH ever reached 12 in the containers with lime-treated sludge. A pH of 12 or higher is
significant to kill off pathogens in sludge treated with lime.
The moisture content of the sludge in the drying beds decreases with time as the liquids
evaporate and the sludge dries. At Lubigi, the drying process was disturbed by leaking roofs
that added water to the beds which prolonged the period of treatment. In this study, lids were
used on the experimental containers to prevent loss of nutrients due to evaporation. This
affected the level of total solids, as the sludge could not dry properly. The added chemicals
influenced the total solids, although, this study showed both increases and decreases of total
solids during the treatment period for both lime and urea.
Implementation of any of the two tested treatment methods at Lubigi sewage treatment plant in
Kampala, Uganda, is mainly restricted by the costs of the chemicals. For Lubigi, it would be of
more value from an economical point of view to use urea instead of lime. Urea also increases
the fertilizer value of the sludge due to the ammonia addition, which is advantageous for reuse
in agricultural applications. Urea is required in a less amount for treatment of sludge compared
to lime. Lime-treated sludge would, however, be beneficial to add to the acidic soils in and
around Kampala to increase the pH. Lime treatment is also a proven effective method for sludge
treatment. The priority at Lubigi today is to dry the sludge, as dry sludge is easier to transport
to farmers and is more manageable. When adding lime for sludge treatment, thorough mixing
is important which is difficult in dry sludge if performed manually. Mixing more liquid sludges
is easier but they require a larger amount of lime to raise the pH to 12 or higher, since the dosage
is related to the weight of the sludge. To add lime to the liquid sludge at Lubigi is therefore not
cost-efficient, and the plant do not have the equipment to mix the lime into the dried sludge.
Further studies are important to get a better knowledge of the sludge characteristics at Lubigi
sewage treatment plant and to assess which treatment method that is most preferable to use at
Lubigi. To make sure the sludge is safe for farmers to use, the level of active pathogens should
be analysed in the sludge at Lubigi by the end of the treatment period before selling the sludge,
regardless of which treatment method applied. By focusing on one treatment method,
performing trials on a larger scale and not using lids, more representative results could be at-
tained. Further research would give more information on the effectiveness and feasibility of
implementing additional sludge treatment at Lubigi.

39
7. References
Alkan, U., Topac, F. O., Birden, B., & Baskaya, H. S. (2007). Bacterial regrowth potential in
alkaline sludges from open-sun and covered sludge drying beds. Environmental
Technology, 28(10), 1111–1118. https://doi.org/10.1080/09593332808618872
Anderson, C., Hanjalika Malambo, D., Eliette Perez Gonzalez, M., Ngwanamoseka Nobela, H., De Pooter, L., Spit, J., … Brdjanovic, D. (2015). Lactic Acid Fermentation, Urea and
Lime Addition: Promising Faecal Sludge Sanitizing Methods for Emergency Sanitation.
International Journal of Environmental Research and Public Health, 12, 13871–13885.
https://doi.org/10.3390/ijerph121113871
Aulenbach, D. B., Chang, S.-Y., Chauhan, S. P., Chen, J. P., Chen, W.-Y., Guild, J., … Zou,
S.-W. (2007). Biosolid Treatment Process. (L. K. Wang, N. K. Shammas, & Y.-Y. Hung,
Eds.) (Vol. 6). New Jersey: Humana Press Inc.
https://doi.org/10.1017/CBO9781107415324.004
Baggi, F., Demarta, A., & Peduzzi, R. (2001). Persistence of viral pathogenes and
bacteriophages during sewage treatment: Lack of correlation with indicator bacteria.
Research in Microbiology, 152, 743–751.
Bassan, M., Brdjanovic, D., Dangol, B., Dodane, P.-H., Hooijmans, C. M., Lopez-Vazquez,
C. M., … Tilley, E. (2014). Faecal Sludge Management: Systems Approach for
Implementation and Operation. (L. Strande, M. Ronteltap, & D. Brdjanovic, Eds.).
London: IWA Publishing.
Bina, B., Movahedian, H., & Kord, I. (2004). The Effect of Lime Stabilization on the
Microbiological Quality of Sewage Sludge. Iranian Journal of Environmental Health
Science & Engineering, 1(1), 34–38.
Dias, E., Ebdon, J., & Taylor, H. (2018). The application of bacteriophages as novel
indicators of viral pathogens in wastewater treatment systems. Water Research, 129,
172–179. https://doi.org/10.1016/j.watres.2017.11.022
Eriksen, L., Andreasen, P., & Ilsoe, B. (1996). Inactivation of Ascaris suum eggs during
storage in lime treated sewage sludge, 30(4), 1026–1029.
Essential chemistry industry. (2017). Retrieved April 30, 2018, from
http://www.essentialchemicalindustry.org/chemicals/urea.html
Farrell, J. B., Smith, J. E., Hathaway, S. W., Robert, B., & Dean, R. B. (1974). Lime
stabilization of primary sludges, 46(1), 113–122.
Gyawali, P. (2018). Infectious helminth ova in wastewater and sludge: A review on public
health issues and current quantification practices. Water Science and Technology, 77(4),
1048–1061. https://doi.org/10.2166/wst.2017.619
Jamal, A., Norieh, N., & Farzadkia, M. (2011). Comparison of Aerobic and Lime
Stabilization Methods for Evaluation of Sewage Sludge Reuse. Journal of Environmental
Science and Technology, 4(2), 182–190. https://doi.org/10.3923/jest.2011.182.190
Kohn, T., Decrey, L., & Vinnerås, B. (2017). Part Four. Management of Risk From Excreta
and Wastewater Anaerobic Sludge Blanket Reactors.
Lalander, C., Diener, S., Magri, M. E., Zurbrügg, C., Lindström, A., & Vinnerås, B. (2013).
Faecal sludge management with the larvae of the black soldier fly (Hermetia illucens) -
40
From a hygiene aspect. Science of the Total Environment, 458–460, 312–318.
https://doi.org/10.1016/j.scitotenv.2013.04.033
Magri, M. E., Philippi, L. S., & Vinnerås, B. (2013). Inactivation of pathogens in feces by
desiccation and urea treatment for application in urine-diverting dry toilets. Applied and
Environmental Microbiology, 79(7), 2156–2163. https://doi.org/10.1128/AEM.03920-12
Mignotte-Cadiergues, B., Maul, A., Huyard, A., Capizzi, S., & Schwartzbrod, L. (2001). The
effect of liming on the microbiological quality of urban sludge. Water Science and
Technology, 43(12), 195–200.
Nationalencyklopedin. (2018a). Ascaris. Retrieved May 7, 2018, from https://www-ne-
se.proxy.lib.ltu.se/uppslagsverk/encyklopedi/lång/ascaris
Nationalencyklopedin. (2018b). Fosfor. Retrieved April 23, 2018, from https://www-ne-
se.proxy.lib.ltu.se/uppslagsverk/encyklopedi/lång/fosfor#förekomst-och-produktion
Nationalencyklopedin. (2018c). Kalium. Retrieved May 21, 2018, from https://www-ne-
se.proxy.lib.ltu.se/uppslagsverk/encyklopedi/lång/kalium
Nkedi-Kizza, P., Aniku, J., Awuma, K., & Gladwin, C. H. (2002). Gender and soil fertility in
Uganda: A comparison of soil fertility indicators for women and men’s agricultural plots.
African Studies Quarterly, 6(1–2).
Nordin, A. (2010). Ammonia sanitisation of human excreta, Treatment Technology for
Production of Fertiliser. Uppsala.
Nordin, A. C., Olsson, J., & Vinnerås, B. (2015). Urea for Sanitization of Anaerobically
Digested Dewatered Sewage Sludge. Environmental Engineering Science, 32(2), 86–94.
https://doi.org/10.1089/ees.2013.0230
Nordin, A., Nyberg, K., & Vinnerås, B. (2009). Inactivation of ascaris eggs in source-
separated urine and feces by ammonia at ambient temperatures. Applied and
Environmental Microbiology, 75(3), 662–667. https://doi.org/10.1128/AEM.01250-08
Nordin, A., Ottoson, J. R., & Vinnerås, B. (2009). Sanitation of faeces from source-separating
dry toilets using urea. Journal of Applied Microbiology, 107(5), 1579–1587.
https://doi.org/10.1111/j.1365-2672.2009.04339.x
Nordkalk. (2018). Kalkstensmjöl. Retrieved April 30, 2018, from
http://www.nordkalk.se/produkter/kalkstensmjol/
Oji, U. I., Etim, H. E., & Okoye, F. C. (2007). Effects of urea and aqueous ammonia treatment
on the composition and nutritive value of maize residues. Small Ruminant Research,
69(1–3), 232–236. https://doi.org/10.1016/j.smallrumres.2006.01.015
Ottoson, J., Nordin, A., von Rosen, D., & Vinnerås, B. (2008). Salmonella reduction in
manure by the addition of urea and ammonia. Bioresource Technology, 99(6), 1610–
1615. https://doi.org/10.1016/j.biortech.2007.04.009
Paulsrud, B., & Schanke Eikum, A. (1975). Lime stabilization of sewage sludges. Water
Research, 9(3), 297–305. https://doi.org/10.1016/0043-1354(75)90051-2
Singh, S., Mohan, R. R., Rathi, S., & Raju, N. J. (2017). Technology options for faecal sludge
management in developing countries: Benefits and revenue from reuse. Environmental
Technology & Innovation, 7, 203–218. https://doi.org/10.1016/j.eti.2017.02.004
41
Song, K., & Burgin, A. J. (2017). Perpetual Phosphorus Cycling: Eutrophication Amplifies
Biological Control on Internal Phosphorus Loading in Agricultural Reservoirs.
Ecosystems, 20(8), 1483–1493. https://doi.org/10.1007/s10021-017-0126-z
The Global Goals. (2018). Retrieved February 11, 2018, from https://www.globalgoals.org/6-
clean-water-and-sanitation
United Nation’s Department of Economic and Social Affairs. (2017). World Population
Prospects: The 2017 Revision, Key Findings and Advance Tables. No. ESA/P/WP/248.
https://doi.org/10.1017/CBO9781107415324.004
US EPA. Standards for the Use or Disposal of Sewage Sludge; Final Rules, 40 CFR Part 503
(1993). United States Environmental Protection Agency.
Vinnerås, B. (2007). Comparison of composting, storage and urea treatment for sanitising of
faecal matter and manure. Bioresource Technology, 98(17), 3317–3321.
https://doi.org/10.1016/j.biortech.2006.07.011
Vinnerås, B., Hedenkvist, M., Nordin, A., & Wilhelmson, A. (2009). Peepoo bag: Self-
sanitising single use biodegradable toilet. Water Science and Technology, 59(9), 1743–
1749. https://doi.org/10.2166/wst.2009.184
Vinnerås, B., Holmqvist, A., Bagge, E., Albihn, A., & Jönsson, H. (2003). The potential for
disinfection of separated faecal matter by urea and by peracetic acid for hygienic nutrient
recycling. Bioresource Technology, 89(2), 155–161. https://doi.org/10.1016/S0960-
8524(03)00044-0
Vinnerås, B., & Jönsson, H. (2002). The performance and potential of faecal separation and
urine diversion to recycle plant nutrients in household wastewater. Bioresource
Technology, 84(3), 275–282. https://doi.org/10.1016/S0960-8524(02)00054-8
Vitousek, P. M., Porder, S., Houlton, B. Z., & Chadwick, O. A. (2010). Terrestrial
phosphorus limitation : mechanisms , implications , and nitrogen – phosphorus
interactions. Ecological Applications, 20(1), 5–15. https://doi.org/10.1890/08-0127.1
World Health Organization. (2006). WHO Guidelines for the safe use of wastewater, excreta
and greywater (Vol. IV). https://doi.org/10.1007/s13398-014-0173-7.2
World Health Organization. (2017). Retrieved January 21, 2018, from
http://www.who.int/mediacentre/factsheets/fs392/en/
Personal communication
Orwiny, M. (2018). Engineer, Lubigi sewage treatment plant. Personal communication.