treatment of perfluorinated compounds … of perfluorinated compounds and nitroaromatics by...
TRANSCRIPT
TREATMENT OF PERFLUORINATED COMPOUNDS AND NITROAROMATICS BY PHOTOCATALYSIS IN THE PRESENCE OF
ULTRAVIOLET AND SOLAR LIGHT
THESIS
Mario H. Tellez, Captain, USAF
AFIT-ENV-14-M-64
DEPARTMENT OF THE AIR FORCE
AIR UNIVERSITY
AIR FORCE INSTITUTE OF TECHNOLOGY
Wright-Patterson Air Force Base, Ohio
DISTRIBUTION STATEMENT A. APPROVED FOR PUBLIC RELEASE; DISTRIBUTION UNLIMITED.

The views expressed in this thesis are those of the author and do not reflect the official policy or position of the United States Air Force, Department of Defense, or the United States Government.

AFIT-ENV-14-M-64
TREATMENT OF PERFLUORINATED COMPOUNDS AND NITROAROMATICS BY PHOTOCATALYSIS IN THE PRESENCE OF
ULTRAVIOLET AND SOLAR LIGHT
THESIS
Presented to the Faculty
Department of Systems Engineering and Management
Graduate School of Engineering and Management
Air Force Institute of Technology
Air University
Air Education and Training Command
In Partial Fulfillment of the Requirements for the
Degree of Master of Science in Engineering Management
Mario H. Tellez, BS
Captain, USAF
March 2014
DISTRIBUTION STATEMENT A. APPROVED FOR PUBLIC RELEASE; DISTRIBUTION UNLIMITED.

AFIT-ENV-14-M-64
TREATMENT OF PERFLUORINATED COMPOUNDS AND NITROAROMATICS BY PHOTOCATALYSIS IN THE PRESENCE OF
ULTRAVIOLET AND SOLAR LIGHT
Mario H. Tellez, BS Captain, USAF
Approved:
___________//signed//_________________ _14-Mar-14_ Dr. Mark N. Goltz (Chairman) Date ___________//signed//_________________ _14-Mar-14_ Dr. Sushil R. Kanel (Member) Date ___________//signed//_________________ _14-Mar-14_ Dr. Alfred E. Thal, Jr. (Member) Date

AFIT-ENV-14-M-64
iv
Abstract
Nitroaromatic compounds (NACs) and perfluorinated compounds (PFCs) are two
classes of water contaminants of DoD concern due to their risk to the environment,
personnel, and mission. NACs are primarily used in modern explosives and are widely
found throughout military ranges and training sites. PFCs are emerging contaminants
used in many industrial and commercial processes and products to include aqueous film-
forming foams which were used extensively by the military during firefighting and
training operations from 1970 to late 1990s. This study investigated the potential of an
innovative technology, photocatalytic oxidation, to effectively and energy efficiently treat
NAC and PFC-contaminated water. Heterogeneous photocatalytic oxidation using
Titanium dioxide (TiO2), which has been used as a photocatalyst to successfully treat
pollutants in numerous studies over the last 20 years, was doped with silver to extend its
photosensitivity. The silver-doped TiO2 (Ag-TiO2) was also immobilized on a glass
substrate. This eliminated the need to separate the TiO2 from the water after treatment,
which is a big improvement over treatment approaches that rely on mixing the catalyst
into the contaminated water and then having to remove the catalyst. Three model
contaminants, 2,4-DNT, PFOA, and PFOS, were degraded using TiO2 and Ag-TiO2
immobilized on glass slides under sunlight and UV light in atmospheric conditions and
neutral pH levels. Results indicate 2,4-DNT degrades at different rates depending on the
radiation source and PFOA/PFOS do not degrade. 2,4-DNT degraded 14% and 15% in
the presence of Ag-TiO2 and TiO2, respectively, under sunlight after 8 hours. After 8
hours under UV light, 2,4-DNT degraded 13% and 29% in the presence of Ag-TiO2 and
TiO2, respectively.

AFIT-ENV-14-M-64
v
To my wife and daughter

vi
Acknowledgments
I wish to thank my committee members who were provided me with their
expertise and precious time. A special thank you to my committee chairman Dr. Mark N.
Goltz for giving me the opportunity to be part of this exciting research. Thank you Dr.
Sushil Kanel for serving on my committee and mentoring and guiding throughout this
research effort. Thank you Dr. Thal for serving on my committee and providing
guidance and perspective.
I would like to acknowledge and thank the AFIT Faculty Research Council for
providing funding for this effort. Special thanks to Dr. Abinash Agrawal, Dr. Ioana
Sizemore, and Kevin Dorney at the Wright State University Department of Chemistry for
access to their facilities and analytical instruments and assisting with data collection and
analysis. Thank you to Mark Mills and his entire staff at the Environmental Protection
Agency’s National Risk Management Research Laboratory in Cincinnati, Ohio, for
access to their facility, instruments and the analytical expertise they provided.
Finally, I would like to thank Allie Meyerhoefer for all the hard work in helping
to gather and analyze the data required for this research and Dr. Daniel L. Felker for his
time and expertise in analyzing the data.
Mario H. Tellez

vii
Table of Contents
Page
Abstract .............................................................................................................................. iv
Acknowledgments.............................................................................................................. vi
Table of Contents .............................................................................................................. vii
List of Figures .................................................................................................................... ix
List of Tables .................................................................................................................... xii
List of Equations .............................................................................................................. xiii
I. Introduction .....................................................................................................................1
Background .....................................................................................................................1 Perfluorinated Compounds .............................................................................................3 Nitroaromatic Compounds ..............................................................................................5 Treatment Technologies ..................................................................................................7 Problem Statement ........................................................................................................11 Methodology .................................................................................................................12 Assumptions/Limitations ..............................................................................................12 Overview .......................................................................................................................12
II. Literature Review .........................................................................................................14
Uses of Nitroaromatic Compounds ...............................................................................14 Properties of Nitroaromatic Compounds ......................................................................15 Treatment of Nitroaromatic Compounds ......................................................................16 Uses of Perfluorinated Compounds ..............................................................................19 Properties of Perfluorinated Compounds ......................................................................20 Treatment of Perfluorinated Compounds ......................................................................24 Photocatalysis Using TiO2 ............................................................................................28 2,4-DNT Degradation Pathways in the Presence of TiO2 ............................................33 PFOA & PFOS Degradation Pathways in the Presence of TiO2 ..................................34
III. Methodology ...............................................................................................................36
Chemicals ......................................................................................................................36 Light Sources and Analytical Instruments ....................................................................36 Fabrication of uncoated and silver-coated TiO2 films on glass substrates ...................38 Experimental Procedures ..............................................................................................39 Degradation Kinetics .....................................................................................................40

viii
IV. Analysis and Results ...................................................................................................42
TiO2 and Ag-TiO2 Slide Characterization ....................................................................42 Effects of AgNO3 concentration on Ag-TiO2 slides ............................................... 45
Degradation Kinetics .....................................................................................................47 Experimental Results ....................................................................................................47
Effects of Temperature and Solar Irradiation on Photocatalytic Reactions ............ 48 Degradation of 2,4-DNT ......................................................................................... 49 Unknown Byproducts of 2,4-DNT Degradation ..................................................... 53 Degradation of PFOA and PFOS ............................................................................ 55
V. Conclusions and Recommendations ............................................................................57
Summary .......................................................................................................................57 Conclusions ...................................................................................................................57 Future Work ..................................................................................................................60
Appendix A - Experimental Results ..................................................................................62
Appendix B - Calibration Curves ......................................................................................78
References ..........................................................................................................................81
Vita. ....................................................................................................................................89

ix
List of Figures
Figure Page Figure 1 - Sources of water contamination (Department of the Interior, 1998) ................. 2 Figure 2 - Nitration of Toluene (Phillips, 2003) ............................................................... 15 Figure 3 - Decomposition path of volatile organic compounds (VOCs) in heterogeneous photocatalytic oxidation under UV light (Liang et al., 2012) ........................................... 19 Figure 4 - Structure and physico-chemical properties of selected PFCs (Rahman et al., 2013) ................................................................................................................................. 22 Figure 5 - Primary process involved in photomineralization of organic compounds by TiO2 (Gaya & Abdullah, 2008) ........................................................................................ 29 Figure 6 - Schematic diagram of the photocatalytic mechanism of Ag doped TiO2 film (Swarnakar et al., 2013) .................................................................................................... 31 Figure 7 - Proposed 2,4-DNT degradation pathway in the presence of TiO2 (Chen & Liang, 2008) ...................................................................................................................... 34 Figure 8 - Alternate proposed intermediate products of 2, 4 -DNT degradation .............. 34 Figure 9 - SEM micrographs showing (a) unmodified glass slides; (b) undoped TiO2 film on glass slide; (c) Ag-TiO2 film on glass slide ................................................................. 43 Figure 10 - Optical images of TiO2 slide obtained prior to spectrum acquisition. Total slide dimensions: 7.6 cm x 2.5 cm. Uncoated dimensions (one side): 4.6 cm x 2.5 cm. Coating dimensions (one side): 3.0 cm x 2.5 cm .............................................................. 44 Figure 11 - Raman spectra of the TiO2 on fabricated slides ............................................. 44 Figure 12 - Reference Raman spectra of TiO2 bulk reference compounds: anatase and Rutile (Hardcastle, 2011) .................................................................................................. 45 Figure 13 - UV-Vis degradation results of 2,4-DNT by Ag-TiO2 films on glass substrate using different concentrations of AgNO3 during slide fabrication. Experimental conditions: degradation of 2,4-DNT (10 mg L-1) under sunlight in the presence of Ag-TiO2 slides. The area of the films was 15 sq. cm in each test. ........................................ 46

x
Figure 14 - UV-Vis measured degradation results of 2,4-DNT by TiO2 and Ag-TiO2 films on glass substrates under sunlight. Experimental conditions: degradation of 2,4-DNT (10 mg L-1) under sunlight in the presence of TiO2 and Ag-TiO2 slides. 5 mg of AgNO3 used to fabricate Ag-TiO2 slides. The area of the films used was 15 sq. cm in each test. ............................................................................................................................ 50 Figure 15 - UV-Vis measured degradation results of 2,4-DNT by TiO2 and Ag-TiO2 films on glass substrates under UV light. Experimental conditions: degradation of 2,4-DNT (10 mg L-1) under UV light in the presence of TiO2 and Ag-TiO2 slides. The area of the films used was 15 sq. cm in each test. .................................................................... 51 Figure 16 - GCMS measured degradation results of 2,4-DNT by TiO2 films on glass substrates. Experimental conditions: degradation of 2,4-DNT (10 mg L-1) under UV light with TiO2. The area of the films used was 15 sq. cm. in each test. ................................. 52 Figure 17 - GCMS results for 2,4-DNT degradation at time 0 hr. [(A0) to 8 hr. (A8)]. Experimental conditions: degradation of 2,4-DNT (10 mg L-1) under UV light with pristine TiO2. The area of the films used was 15 sq. cm. in each test ............................. 52 Figure 18 - GCMS and UV-Vis measured degradation results of 2,4-DNT by TiO2 films on glass substrates. Experimental conditions: degradation of 2,4-DNT (10 mg L-1) under UV light with pristine TiO2. The area of the films used was 15 sq. cm. in each test. ..... 53 Figure 19 - GCMS results for unknown byproduct at time 0 hr. (A0) to 12 hr. (A12). Experimental conditions: degradation of 2,4-DNT (10 mg L-1) under UV light with pristine TiO2. The area of the films used was 15 sq. cm. in each test. ............................. 54 Figure 20 - LCMS degradation results of PFOA. Experimental conditions: degradation of PFOA (0.1 mg L-1) under UV light in the presence of TiO2 slides. The area of the films used was 15 sq. cm in each test. .............................................................................. 55 Figure 21 - LCMS degradation results of PFOS. Experimental conditions: degradation of PFOA (0.1 mg L-1) under UV light in the presence of TiO2 slides. The area of the films used was 15 sq. cm in each test......................................................................................... 56 Figure 22 - UV-Vis experiment results (A) and (B) - 2,4-DNT (10 mg L-1), Ag-TiO2/solar light ................................................................................................................. 63 Figure 23 - UV-Vis experiment results (A) and (B) - 2,4-DNT (10 mg L-1), TiO2/solar light ................................................................................................................................... 64 Figure 24 - UV-Vis experiment results (A) and (B) - 2,4-DNT (10 mg L-1), Control/solar light ................................................................................................................................... 65

xi
Figure 25 - UV-Vis experiment results (A) and (B) - 2,4-DNT (10 mg L-1), Ag-TiO2/UV light ................................................................................................................................... 66 Figure 26 - UV-Vis experiment results (A) and (B) - 2,4-DNT (10 mg L-1), TiO2/UV light ................................................................................................................................... 67 Figure 27 - UV-Vis experiment results (A) and (B) - 2,4-DNT (10 mg L-1), Control/UV light ................................................................................................................................... 68 Figure 28 - GCMS experiment results (A) and (B) - 2,4-DNT (10 mg L-1), TiO2/UV light........................................................................................................................................... 69 Figure 29 - GCMS experiment results (C) - 2,4-DNT (10 mg L-1), Control/UV light ..... 70 Figure 30 - GCMS experiment A results - 2,4-DNT (10 mg L-1), TiO2/UV light. (Ao) Abundance profile at time 0 hrs, (A4) Abundance profile at time 4 hrs. .......................... 71 Figure 31 - GCMS experiment A results - 2,4-DNT (10 mg L-1), TiO2/UV light. (A8) Abundance profile at time 8 hrs, (A12) Abundance profile at time 12 hrs. ...................... 72 Figure 32 - GCMS experiment B results - 2,4-DNT (10 mg L-1), TiO2/UV light. (Bo) Abundance profile at time 0 hrs, (B4) Abundance profile at time 4 hrs. .......................... 73 Figure 33 - GCMS experiment B results - 2,4-DNT (10 mg L-1), TiO2/UV light. (B8) Abundance profile at time 8 hrs, (B12) Abundance profile at time 12 hrs. ....................... 74 Figure 34 - LCMS experiment results (A) and (B) - PFOA (0.1 mg L-1), TiO2/UV light 75 Figure 35 - LCMS experiment results (A) and (B) - PFOS (0.1 mg L-1), TiO2/UV light 76 Figure 36 - LCMS experiment results - PFOA (0.1 mg L-1), Control/UV light ............... 77 Figure 37 - LCMS experiment results - PFOS (0.1 mg L-1), Control/UV light ................ 77 Figure 38 - UV-Vis 2,4-DNT Calibration Curve .............................................................. 79 Figure 39 - GCMS 2,4-DNT Calibration Curve ............................................................... 79 Figure 40 - LCMS PFOA Calibration Curve .................................................................... 80

xii
List of Tables
Table Page Table 1 - Previously reported rate constants under various conditions .............................. 9 Table 2 - Physical and chemical properties of 2,4-DNT (Environmental Protection Agency, 2012) ................................................................................................................... 16 Table 3 - Physico-chemical properties of PFOA and PFOS (Environmental Protection Agency, 2009) ................................................................................................................... 24 Table 4 - Primary processes and characteristic reaction times for mineralization of organic pollutants by TiO2 (Gaya & Abdullah, 2008) ..................................................... 30 Table 5 - Gradient mobile phase program ........................................................................ 38 Table 6 - Summary of photocatalytic UV-Vis and GCMS results by treatment for 2,4-DNT .................................................................................................................................. 48

xiii
List of Equations
Equation Page Equation 1.................. ....................................................................................................... 18
Equation 2.............. ............................................................................................................ 18
Equation 3............... ........................................................................................................... 18
Equation 4................. ......................................................................................................... 18
Equation 5............. ............................................................................................................. 27
Equation 6............. ............................................................................................................. 27
Equation 7.............. ............................................................................................................ 35
Equation 8............... ..................................................................................................................... 35
Equation 9............................... ............................................................................................ 40
Equation 10........... ............................................................................................................. 40
1
TREATMENT OF PERFLUORINATED COMPOUNDS AND NITROAROMATICS
BY PHOTOCATALYSIS IN THE PRESENCE OF ULTRAVIOLET AND SOLAR
LIGHT
I. Introduction
Background
Department of Defense (DoD) sites requiring environmental cleanup are
contaminated by numerous types of compounds and contaminated in more than one
medium. Surface and groundwater contamination affects many DoD sites.
Contaminated surface and groundwater at DoD sites can enter the nation’s aquifers,
streams, rivers, and lakes which feed municipal, domestic, and agricultural water
supplies, endangering public health and threatening the environment (Government
Accounting Office, 2005). Additionally, the Government Accountability Office (2005)
warns that contaminated water on DoD facilities “can pose a threat to military personnel,
the public, and the sustainability of DoD’s training and testing ranges.” Water
contamination primarily occurs through the direct discharge of hazardous substances
from industrial, commercial, and residential sources directly into bodies of water, the
transport of pollutants in storm water runoff, and the leaching of contaminated soil into
the water table or bodies of water (see Figure 1) (Department of the Interior, 1998).

2
Figure 1 - Sources of water contamination (Department of the Interior, 1998)
This study focuses on effectively and energy efficiently treating Nitroaromatic
Compounds (NACs) and Perfluorinated Compounds (PFCs), two classes of contaminants
of DoD concern widely found at military ranges and training sites. According to the
FY10 Defense Environmental Programs Annual Report to Congress, there are over
34,000 hazardous sites in DoD, with the Air Force having the greatest number of sites
with groundwater contamination followed by the Navy and the Army (Government
Accounting Office, 2005). Of these hazardous sites, approximately 2,300 are
contaminated with munitions and contain NACs as a result of ammunition or explosive
production, ammunition manufacturing, unexploded ordinance storage, and discarded
military munitions (Department of Defense, 2010). Due to the emergent nature of PFCs,
the DoD has only begun to systematically evaluate areas where possible sources of PFCs
could be present, such as fire training areas that were operating between 1970 and 2000
(U.S. Air Force, 2012).

3
From 1995 to 2005, DoD invested approximately $20 billion for environmental
restoration of contaminated sites, including remediation of contaminated water on
military installations (Government Accounting Office, 2005). Overall, DoD estimates
the cost to restore all remaining sites to be $28 billion (Department of Defense, 2010).
An effective and energy efficient treatment method will save DoD restoration funds and
expedite remediation efforts at its contaminated sites.
Perfluorinated Compounds
PFCs are emerging contaminants that pose a potential risk to human health, DoD
military operations, and the environment (Department of Defense, 2010). PFCs are a
class of synthetic fluorinated chemicals whose unique physico-chemical characteristics
make them very useful for a wide range of industrial and commercial application, such as
non-stick polymers, water and stain proof coatings for paper and textiles, oxidative
protective coatings on metals, inert surfactants for semi-conductor etching, aqueous film
forming foams, and thermally stable lubricants (Lindstrom et al., 2011; Vecitis et al.,
2009). PFCs’ unique chemical properties make them persistent organic pollutants
(Vecitis et al., 2009). Their persistent nature raises environmental and public health
concerns as these compounds are toxic, extremely resistant to degradation, bioaccumulate
in food chains, and can have long half-lives in humans (Richardson, 2007; Lindstrom et
al., 2011). According to Appleman et al. (2013), certain PFCs are found in the serum of
virtually all U.S. residents and have also been detected in the blood of wildlife in remote
regions of the world. Additionally, PFCs are water soluble and have been detected in
U.S. surface waters; including lakes, rivers, and tributaries, in the part per trillion (ng L-1)
4
range or lower and have also been detected in surface and ground waters at similar
concentrations (Appleman et al., 2013).
Two important classes of PFCs are perfluoroalkyl carboxylic acids (PFCAs) and
perfluoroalkyl sulfonic acids (PFSAs) (Rahman et al., 2013). This study will specifically
focus on one PFCA and one PFSA compound, perfluorooctanoic acid (PFOA) and
perfluorooctane sulfonate (PFOS), respectively. The U.S. Environmental Protection
Agency (EPA) classifies PFOA and PFOS, as “likely environmental carcinogens”
(Environmental Protection Agency, 2009). In 2009, the EPA established Provisionary
Health Advisory values for PFOA and PFOS of 0.4 and 0.2 μg L-1, respectively (Rahman
et al., 2013). U.S. Air Force guidance classifies PFCs as emerging environmental
contaminants based on “increasing regulatory interest, potential risk to human health, the
environment, and evolving regulatory standards” (U.S. Air Force, 2012). In the 1970s,
the Air Force began using Aqueous Film Forming Foam (AFFF) in fire-fighting training
and operations, which contains PFOA and PFOS. Consequently, these contaminants
have been found at DoD fire training sites where AFFF was used such as in in
Wurtsmith Air Force Base in northeastern Michigan where PFC-based AFFF was used
from 1950 until 1993. (Moody et al.,2003; Place & Field, 2012; Rak & Vogel, 2009).
DoD policy regarding emerging contaminants states that, “risks to people, the
environment, and DoD missions, programs, and resources shall be assessed and, when
appropriate, actions shall be taken to reduce risks related to emerging contaminants
development, use, or release” (Department of Defense, 2009). Current Air Force interim
policy is to “respond to validated human exposure to PFOS and PFOA with appropriate

5
interim action to mitigate exposures.” In 2011, the Air Force Center for Engineering and
the Environment (now a component of the Air Force Civil Engineer Center) stated that
there is a need to “develop innovative remedial strategies” to treat PFOS and PFOA (U.S.
Air Force, 2012).
Nitroaromatic Compounds
Nitroaromatic compounds (NACs) and their byproducts found at contaminated
military sites present a potential hazard due to their explosive safety risks and potential
toxicological effects (Stevens, 2004). The two most prevalent secondary explosives used
by the U.S. military over the past 70 years are, hexahydro-1,3,5-trinitro-1,3,5-triazine (RDX)
and 2,4,6-trinitrotoluene (TNT). With their manufacturing impurities and environmental
transformation products, RDX and TNT and their byproducts account for the majority of the
explosives contamination at active military installations (U.S. Air Force, 2011).
NACs are a class of industrial chemicals found in numerous products, such as
explosives, dyes, polyurethane foams, herbicides, pesticides and solvents (Phillips, 2003;
Snellinx et al., 2002). Of the 2,300 DoD sites contaminated with NACs, a high
percentage has groundwater contamination that is above permissible levels (Rodgers &
Bunce, 2001). NACs’ susceptibility to leaching, due to their moderate water solubility,
low volatility and extremely slow natural degradation makes them “among the most
common groundwater and soil contaminants in the U.S., second only to the
organochlorine functional group” (Environmental Protection Agency, 2012; Phillips,
2003; Reddy et al., 2011; Stevens, 2004). NACs, as well as their degradation byproducts,
pose a significant danger to humans and the environment because of their toxicity,

6
mutagenicity and potential carcinogenicity. In fact, NACs’ environmental transformation
products, such as amines, are equally or more toxic than the parent nitroaromatic
(Rodgers & Bunce, 2001). Due to their physico-chemical properties, NACs are
recalcitrant to chemical and biological oxidation and to hydrolysis and can persist for
many years in soil or groundwater (Phillips, 2003). Consequently, remediation of NAC-
contaminated water is difficult (Rodgers & Bunce, 2001).
At many of the DoD munitions-contaminated sites, NACs such as TNT, RDX,
and octahydro-1,3,5,7-tetranitro-1,3,5,7-tetrasocine (HMX), 2,4-Dinitrotoluene (2,4-drin)
and others are the main contributors to water contamination (Stevens, 2004; Phillips,
2003). Due to laboratory safety issues associated with high energetics (i.e. TNT, HMX
and RDX), this paper will use 2,4-DNT, a precursor to TNT, as the target NAC
contaminant. According to Phillips (2003), under similar conditions, the transformation
of 2,4-DNT is thought to be analogous to TNT, HMX and RDX degradation (Phillips,
2003).
The EPA identifies 2,4-DNT as a priority pollutant and is on its Drinking Water
Contaminant Candidate List 2 for possible regulation under the Safe Drinking Water Act
(Environmental Protection Agency, 2012). Among NACs, 2,4-DNT is the most toxic
explosive compound as evidenced by its extremely low drinking water (0.11 μg L-1) and
effluent discharge (0.7 μg L-1) limits set by the EPA (Mihas et al., 2007; Celin et al.,
2003; Environmental Protection Agency, 2012). In 2006, the U.S. Air Force’s
Operational Range Assessment Plan identified operational ranges as essential to the
mission of defending the United States and protecting its interests through air and space

7
power and listed 2,4-DNT and numerous other NACs as key contaminants at munition
ranges that threaten human health and the environment (U.S. Air Force, 2011).
Consequently, in order to meet the Air Force commitment to sustaining its operational test
and training ranges, innovative remedial strategies are needed to treat 2,4-DNT and other
NACs.
Treatment Technologies
Current methods to treat NAC-contaminated water sites involve the use of
absorption, advanced oxidation processes (AOP), chemical reduction, and bioremediation
(Snellinx et al., 2002). Methods to treat PFC-contaminated groundwater, however, are
limited because of their unique physico-chemical properties and their only recent
recognition as contaminants of concern (Vecitis et al., 2009).
Among the different treatment methods, AOP, and specifically heterogeneous
photocatalytic oxidation utilizing modified nano-titanium dioxide (TiO2), is a promising
method to effectively treat PFC- and NAC-contaminated water (Schmelling & Gray,
1995; Vecitis, et al.,2009). TiO2 is the most researched photocatalytic material “because
it provides the most efficient photocatalytic activity, the highest stability, the lowest cost
and the lowest toxicity” (Grabowska et al., 2012). TiO2, however, requires ultraviolet
(UV) radiation to activate its photocatalytic properties and since less than 5% of solar
energy5% of solar energy is emitted as UV radiation, using TiO2 on a large-scale
application is limited (Swarnakar et al., 2013). A potential solution to this limitation is to
extend TiO2 activation into the visible light region using catalyst doping agents. Based
on previous research, metallic cation doping agents, specifically noble metals (e.g. silver,

8
gold) are effective in widening the TiO2 light absorption range and promoting electrical
conductivity (Daghrir et al., 2013).
Photocatalysis using TiO2 has been applied to treat water contaminated with a
variety of compounds (e.g., phenolics, chlorinated organics, herbicides, dyes,
pharmaceuticals, etc.) (Gaya & Abdullah, 2008). Studies have also been accomplished
using direct photolysis (solar and UV light) and photocatalysis (aqueous suspension of
TiO2 nanoparticles in UV light) to degrade PFOA, PFOS, 2,4-DNT and other NACs and
PFCs. Mihas (2007) achieved full degradation of 2,4-DNT (1 mg L-1) when exposed to
sunlight for 40 hours and achieved 57.8 % removal of 2,4-DNT when exposed to UV
light for 4 hours (Mihas et al., 2007). The U.S. Navy reported 89% degradation of 2,6-
DNT (154 mg L-1), a DNT isomer, dissolved in seawater under simulated solar radiation
within 24 hours and full degradation after 72 hours (U.S. Navy, 2003). Dillert et al.
(1995) reported 20% degradation of 2,6-DNT (18.2 mg L-1) in water under UV light
using TiO2 dispersed in aqueous solution in acidic conditions (pH = 3) after 10 minutes
(Dillert et al., 1995). Nahen et al. (1997) reported greater than 99% TNT (54.6 mg L-1)
removal within 60 minutes using TiO2 dispersed in aqueous solution under UV light
(Nahen et al., 1997). Schmelling et al. (1996) degraded TNT (50 mg L-1) more than 90%
within 60 minutes in a TiO2 slurry under near UV Light (>340 nm) (Schmelling & Gray,
1995). Finally, Wen et al. (2011) achieved 71% degradation of 2,4-DNT (50 mg L-1) in
60 hours under UV light alone and 77% degradation using a TiO2 catalyst attached to a
porous ceramic carrier in 60 hours (Wen et al., 2011). Table 1 shows previously reported
rate constants for NACs under various conditions.

9
Table 1 - Previously reported rate constants under various conditions
Compound Technique ConditionsDegradation Rate (hr-1)
Reference
54.6 mg L-1
UV (254 nm)pH = 9O2, N2
50.0 mg L-1
UV (340 nm)O2
154.0 mg L-1
(290-600 nm)Seawater
18.2 mg L-1
UV (320 nm)pH = 3
1.0 mg L-1
(290-600 nm)pH = 7
1.0 mg L-1
(350-400 nm)pH = 7
50.0 mg L-1
UV (254 nm)pH = 7
41.1 mg L-1
(290-600 nm)pH = 7
41.1 mg L-1
(254 nm)pH = 3.7
25.0 mg L-1
(254 nm)pH = 7
O2
414.1 mg L-1
UV (310-400 nm)pH = 2-3
41.4 mg L-1
UV (254 nm)pH = 3.8
50.0 mg L-1
(290-600 nm)pH = 7
20.0 mg L-1
(254 nm)pH = 7
N2
PFOA Dispersed TiO2 0.06 Li et al. (2012)
UV light 0.06 Wang and Zhang (2011)PFOA
PFOS Yamamoto et al. (2007)UV light 0.0002
PFOS Simulated sunlightNo
degradation Vecitus et al. (2009)
PFOA Dispersed TiO2 0.06 Kutsuna et al. (2006)
Dispersed TiO21,3,5-TNT Nahen et al. (1997)6.3
2,4-DNT Immobilized TiO2
2,6-DNT Dispersed TiO2 1.5 Dillert et al. (1995)
Wen et al. (2011) 0.24
2,4-DNT UV light 0.185 Mihas et al. (2007)
PFOA Simulated sunlightNo
degradation Vecitus et al. (2009)
PFOA UV light 0.01 Chen et al. (2007)
Schmelling et al. (1995)4.7Dispersed TiO21,3,5-TNT
0.09 U.S. Navy (2003)Sunlight2,6-DNT
2,4-DNT Sunlight 0.132 Mihas et al. (2007)

10
Vecitis et al. (2009) point out that direct photolysis in sunlight of PFOS and
PFOA will be negligible in environmental conditions, reporting that PFOA (41.4 mg L-1)
and PFOS (50.0 mg L-1) in aqueous solutions did not degrade in simulated sunlight for 30
days (Vecitis et al., 2009). However, PFOA in aqueous solution (41.4 mg L-1) showed
degradation under UV light resulting in a photolysis half-life of 24 hours, while PFOS, in
similar conditions, has a slower degradation rate (half-life of 5.3 days) (Vecitis et al.,
2009). Yuan et al. (2001) reported TiO2 photocatalytic degradation of PFOA resulted in
50% mineralization after 60 hours under UV light (Yuan et al., 2001). Wang et al. (2011)
degraded PFOA using dispersed TiO2 in UV light in a oxygen atmosphere resulting in
12.4% degradation in 180 minutes (Wang et al., 2011). Chen et al. (2007) degraded
PFOA (25 mg L-1) under UV light (254 nm) resulting in 5% degradation after 120
minutes; however, when exposed to 184 nm UV light, PFOA degraded 60% within that
time (Chen et al., 2007). Kutsuna et al. (2006) degraded PFOA (414 mg L-1) by
dispersed TiO2 under UV light and in acidic conditions (pH 2-3) resulting in a half-life of
1440 minutes (Kutsuna et al., 2006). Previously reported PFC rate constants under
various conditions are shown in Table 1.
A review of the current literature indicates that studies using silver-doped TiO2 on
solid glass substrates have not been used to treat 2,4-DNT, PFOA, or PFOS (Dillert et al.,
2007; Gaya & Abdullah, 2008; Zhao & Zhang, 2009; Benotti et al., 2009; Estrellan et al.,
2010; Grabowska et al., 2010; Swarnakar et al., 2013). While immobilization of the
catalyst significantly lowers its efficiency compared to dispersion or slurries due to a
reduction in catalyst surface area and poor mass transfer of reactants to the photocatalytic

11
surface, adhering the catalyst to a solid support enables industrial application by
eliminating the majority of problems encountered with slurries and dispersion in aqueous
solutions: (a) the need for separation or filtration steps, (b) the problematic use in
continuous flow systems and (c) the particles aggregation, especially at high
concentrations (Arabatzis et al., 2003; Byrne et al., 2011; Swarnakar et al., 2013).
Problem Statement
The objective of this research is to explore the potential for TiO2 and Ag-doped
TiO2 photocatalyst immobilized on glass substrates to effectively treat PFC-contaminated
water and NAC-contaminated water under UV light and natural sunlight. The research
questions to be answered in pursuit of this understanding are:
• What are the photocatalytic degradation rates for PFOS, PFOA and 2,4-DNT using
undoped TiO2 as a catalyst, compared to using TiO2 doped with silver (Ag-TiO2) as a
catalyst?
• What is the difference between using UV light and natural solar light as energy sources
for the photocatalytic treatment of PFOA, PFOS, and 2,4-DNT-contaminated water?
• What are the daughter products of PFOS, PFOA, and 2,4-DNT photodegradation?
• How does the composition of PFC and NAC degradation daughter products change
over time during photodegradation?
• How may the kinetics of PFOS, PFOA, and 2,4-DNT degradation be modeled?

12
Methodology
This research was conducted is using batch-scale laboratory experiments. PFOS,
PFOA and 2,4-DNT concentrations was measured over time under sunlight or UV light,
and in the presence of undoped and Ag-doped TiO2. Experimental controls (i.e.
contaminants exposed to solar or UV light only without the presence of TiO2 or Ag-TiO2
slides) will run concurrently to all experiments to assess the methods’ effectiveness.
Experimental results were also compared with the results of prior investigations using
TiO2 dispersed in a slurry solution and using UV light. Sample analysis was performed
using gas chromatography-mass spectrometry, liquid chromatography-mass
spectrometry, and ultraviolet-visible spectrophotometry techniques.
Assumptions/Limitations
This study focused solely on PFC and NAC-contaminated water. External factors
such as solution acidity and the laboratory environment were controlled, however
uncontrolled external factors (i.e. temperature and solar radiation) affecting solar
experiments that were run outside were statistically analyzed to determine their effect, if
any, on experimental results.
Overview
Chapter II will review existing literature on the photocatalysis of PFCs and NACs
with a particular emphasis on the uses, properties and treatments of the target
contaminants, details of the photocatalytic oxidation technology, and the potential
photocatalytic degradation pathways of the target contaminants in the presence of TiO2

13
and Ag-TiO2. Chapter III will detail the laboratory procedures and equipment used to
gather the required quantitative data to explore the effectiveness of the proposed
contaminated water treatment method. Chapter IV will present and analyze the
experimental results. Finally, chapter V will present the conclusions of this study and
propose areas for further investigation.

14
II. Literature Review
This chapter discusses literature relevant to this study: to explore the potential for
modified TiO2 coated films on glass substrates doped with silver, to be used to treat PFC-
contaminated water and NAC-contaminated water by photocatalysis in the presence of
UV light and natural sunlight. The literature review researches PFC and NAC uses,
properties, treatment technologies and degradation pathways.
Uses of Nitroaromatic Compounds
NACs are a group of compounds widely found in commercial products (e.g.,
insecticides, herbicides, pharmaceuticals, dyes, plastics) and used extensively in
industrial processes (Phillips, 2003). NACs, to include 2,4,6-trinitrotoluene (TNT),
1,3,5-trinitrobenzene (TNB), dinitrotoluene (2,4-DNT and 2,6-DNT), dinitrobenzene
(DNB), methyl-N,2,4,6-tetranitroaniline (Tetryl), and 2,4,6-trinitrophenol (picric acid),
are principally used in the modern explosives industry (Rodgers & Bunce, 2001).
According to Dutta et al. (2003), manufacturers in the U.S. generate millions of tons of
TNT, DNT and toluene, a precursor to poly nitroaromatic compounds, annually (Dutta et
al., 2003). TNT, in particular, was once the world’s most widely used explosive, with 2
million pounds produced annually as of 1985 (Stevens, 2004).
Due to the extensive manufacture, use, improper handling and disposal of TNT,
DNT, a primary intermediate product, has being found extensively in soil and
groundwater contamination (Snellinx et al., 2002; Wen et al., 2011). Mohanty and Wei

15
(1993) report that in 1982 over 500 million pounds of DNT were produced (Mohanty &
Wei, 1993). DNT is a poly-nitroaromatic compound not found naturally in the
environment. DNT consists of six isomers (2,4-DNT, 2,6-DNT, 2,3-DNT, 2,5-DNT, 3,4-
DNT, and 3,5-DNT) of which 2,4-DNT and 2,6-DNT make up 95 percent of technical
grade DNT (Department of Health and Human Services, 2013).
Properties of Nitroaromatic Compounds
As noted earlier, NACs are primarily used in modern explosives and thus found as
contaminants throughout the DoD (Phillips, 2003). Within this group of NACs, of
interest are (poly) nitrotoluenes that consist of a toluene molecule with several nitro
(NO2-) groups (Stevens, 2004). Figure 2 illustrates the nitration of toluene to form TNT
as well as the immediate precursors (i.e. 2,4-DNT and 2,6-DNT).
Figure 2 - Nitration of Toluene (Phillips, 2003)
The stability of explosive NACs is attributed to the electron-withdrawing nitro
groups which become more stable as the number of nitro groups surrounding the benzene

16
ring increases (Rodgers & Bunce, 2001). 2,4-DNT, a pale yellow solid, has relatively
low volatility (Henry’s law constant = 8.79 X10⁻⁸ atm m3 mol-1) and is moderately
soluble in water (270 mg L-1) allowing it to be easily transported in surface or
groundwater and to persist in the environment (See Table 2). Additionally, based on its
relatively low organic-carbon partition coefficient (log KOC = 1.65) and low
octanol/water partition coefficient (log KOW = 1.98), 2,4-DNT only has a slight tendency
to adsorb to sediments or suspended solids. A case study investigated an old effluent
lagoon that still contained detectable quantities of 2,4-DNT 12 years after it was retired
(Department of Health and Human Services, 1998). Consequently, unless 2,4-DNT is
broken down by light, oxygen or biota, it is expected to remain in the hydrological
environment for long periods of time (Environmental Protection Agency, 2012).
Table 2 - Physical and chemical properties of 2,4-DNT (Environmental Protection Agency, 2012)
Treatment of Nitroaromatic Compounds
Numerous remediation techniques exist to treat NAC-contaminated water. The
most relevant remediation techniques are adsorption, advanced oxidation processes
17
(AOPs), chemical reduction and bioremediation (Rodgers & Bunce, 2001). While the
application of remediation techniques are highly dependent on the quantities and toxicity
of the target NACs, adsorption on granular activated carbon (GAC) has been the most
common treatment due to its simplicity and effectiveness (Phillips, 2003). This method,
however, only transfers NACs from one medium to another and does not neutralize the
pollutants. As such, the spent GAC must be treated or disposed of as hazardous waste,
resulting in secondary environmental impacts (Government Accounting Office, 2005).
The Department of Health and Human Services prescribes controlled incineration in an
incinerator unit equipped with alkaline scrubbers as the ultimate disposal method of 2,4-
DNT (Department of Health and Human Services, 2013).
AOP remediation is proving to be a good alternative for removing xenobiotic
recalcitrant compounds, such as NACs, from polluted water (Mboula et al., 2013). AOPs
principally work through the formation of hydroxyl radicals (•OH), a very reactive
species, in water to quickly and non-selectively oxidize a wide range of organic
compounds (Konstantinou & Albanis, 2004). Among AOPs, the most promising are
heterogeneous photocatalytic reactions with semiconductors, which, are initiated when a
semiconductor (SC) is irradiated by photons, hv, that equal or exceed the semiconductor’s
band gap to promote electrons from the valence band to the conduction band and
concurrently producing positively charged holes (Gaya & Abdullah, 2008; Konstantinou
& Albanis, 2004; Prieto-Rodriguez et al., 2012). The following reactions (Equations 1-4)
have been widely postulated (Gaya & Abdullah, 2008):

18
Equation 1 Photexcitation: SC + hv → e- + h+
Equation 2 Oxygen ionosorption: (O2)ads + e- → O2•-
Equation 3 Ionization of water: H2O + h+→ •OH + H+
Equation 4 Protonation of superoxides: O2•- + H+ → HOO•
Both oxidative and reductive reactions can occur on the surface of the semiconductor,
where the organic pollutants are adsorbed (Liang et al., 2012).
Heterogeneous photocatalysis, unlike GAC, breaks down organic pollutants from
complex molecules to simple and non-hazardous substances without producing waste
needing secondary treatment or disposal (see Figure 3) (Kaan et al., 2012). However,
despite the promise of AOPs, there are two major drawbacks that must be addressed to
make them a competitive alternative to GAC. First, AOPs are energy intensive requiring
an artificial ultraviolet (UV) light source to produce the required energy to exceed the
semiconductors’ band gap energy and produce the electron (e-) and electron holes (h+)
that begin to generate the photocatalytic reaction. Second, and perhaps most significant,
is the tendency for the fast recombination of the newly generated electron/holes to
recombine before reacting with the organic contaminants and their intermediates products
(Daghrir et al., 2013). These drawbacks will be addressed in the subsequent section.

19
Figure 3 - Decomposition path of volatile organic compounds (VOCs) in heterogeneous
photocatalytic oxidation under UV light (Liang et al., 2012)
Uses of Perfluorinated Compounds
PFCs are a group of chemicals used extensively in the manufacturing of a wide
variety of industrial (e.g. protective sprays, waxes, semiconductors, fire-fighting foams)
and consumer products (e.g. non-stick cookware, masking tape, food packaging, treated
carpets, upholstery, and clothing) due to their unique physico-chemical properties such as
extremely high thermal and chemical stability (Appleman et al., 2013; Rahman et al.,
2013). Introduced in the 1950s, PFCs have become ubiquitous as their use in industrial
and consumer products has expanded. Perfluoroalkyl carboxylic acids (PFCAs) and
perfluoroalkyl sulfonic acids (PFSAs), both consisting of a fluorinated carbon backbone
and either a carboxyl group or a sulfonic group, respectively, are the most
environmentally relevant PFCs (Department of Health and Human Services, 2009; Place
& Field, 2012). According to the Department of Health and Human Services, PFOA and
PFOS are the most significant compounds within these groups as they are made in the
20
largest amounts in the United States; between 15,000 and 500,000 pounds of PFOA and
PFOS were produced during 2002 (Department of Health and Human Services, 2009).
Due to their ubiquity and their health and environmental effects, PFOA and PFOS
are being voluntarily phased out by eight major U.S. manufacturers with a goal of
eliminating emissions and product content by 2015 (Place & Field, 2012). This phase-
out has led to the increasing use of shorter chain length PFCs which are less ecologically
toxic (Post et al., 2012). In spite of the voluntary phase-out of PFOA and PFOS, large
stockpiles of materials containing PFOA and PFOS still exist. One specific stockpiled
material is aqueous film-forming foams (AFFF), whose repeated use during fire training
operations has been correlated to higher concentrations to PFOA and PFOS levels in
surface water and groundwater in the surrounding environment (Place & Field, 2012).
According to Place and Field (2012), in 2004 the U.S. maintained a stockpile of
approximately 38 million liters of AFFF with no restrictions or regulations in place
regulating its use or disposal (Place & Field, 2012). PFOA and PFOS are of particular
interest to the Air Force and Department of Defense, who possess the largest stockpile
(approximately 11 million liters) of AFFF and have used PFC-based AFFF since the
1970s, releasing directly into the environment after use (Place & Field, 2012; U.S. Air
Force, 2012).
Properties of Perfluorinated Compounds
As previously noted, PFCs are found in a wide-ranging number of commercial
and industrial products, from non-stick cookware to protective coatings on metals and in
AFFF (Vecitis et al., 2009). PFCs’ chemical properties allow their use in varying and

21
sometimes harsh conditions requiring high thermal and chemical stability (Estrellan et al.,
2010). These chemical properties, however, also makes them particularly recalcitrant,
environmentally persistent and resistant to conventional treatment methods. The
chemical structure of PFCs includes a completely fluorinated carbon chain (ranging from
4 to 13 carbons), which is both hydrophobic and oleophobic, and a hydrophilic charged
functional group (carboxylic or sulfonic acid) (Estrellan et al., 2010; Post et al., 2012).
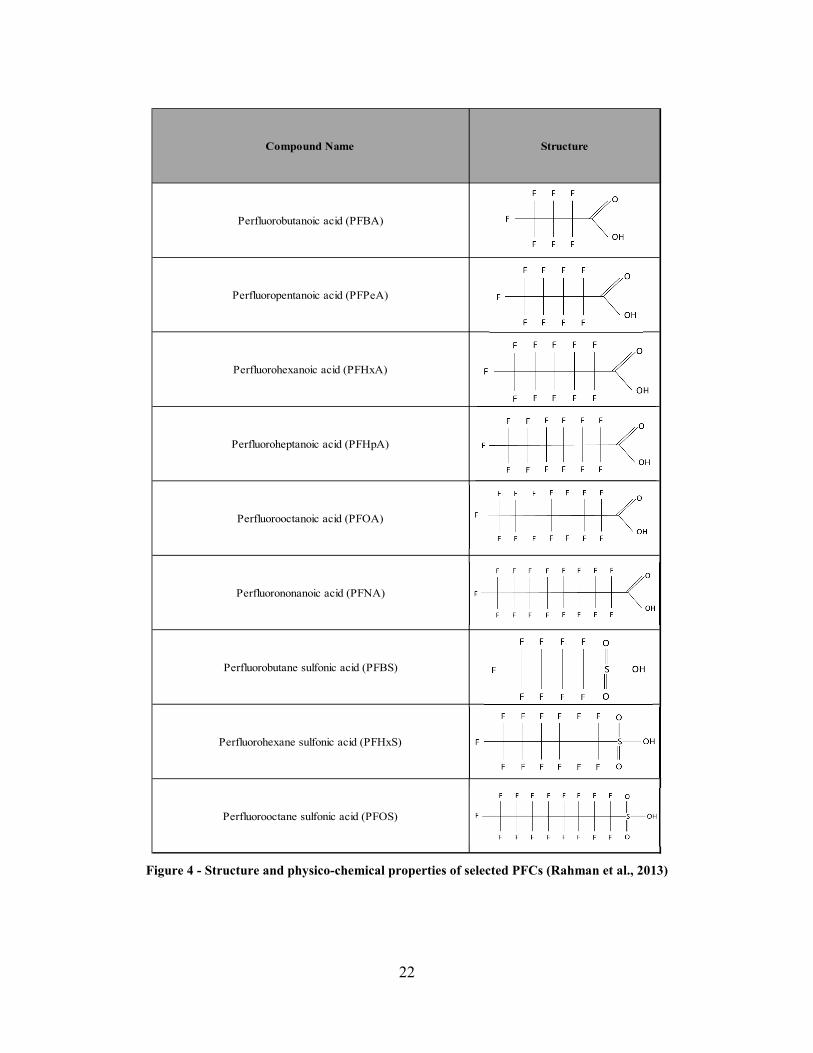
Figure 4 shows the structure and chemical properties of selected PFCs (Rahman et al.,
2013). The substitution of Hydrogen with Fluorine atoms gives PFCs their high thermal
and chemical stability, as C-F bonds are one of the strongest bonds found in nature
(Richardson, 2007). According to Vecitis et al. (2009), fluorine’s high reduction
potential (E0 = 3.6 V) makes it thermodynamically unfavorable to create a bond with any
other one-electron oxidant (Vecitis et al., 2009). Additionally, the perfluorinated tail,
when properly oriented, make PFCs ideal surfactants and dispersants such as firefighting
foams (Lindstrom et al., 2011)
22
Figure 4 - Structure and physico-chemical properties of selected PFCs (Rahman et al., 2013)
Compound Name Structure
Perfluorobutanoic acid (PFBA)
Perfluoropentanoic acid (PFPeA)
Perfluorohexanoic acid (PFHxA)
Perfluoroheptanoic acid (PFHpA)
Perfluorooctanoic acid (PFOA)
Perfluorononanoic acid (PFNA)
Perfluorobutane sulfonic acid (PFBS)
Perfluorohexane sulfonic acid (PFHxS)
Perfluorooctane sulfonic acid (PFOS)
23
PFOA and PFOS are of particular concern due to their high production volumes,
and pervasiveness in the environment (Estrellan et al., 2010; Rahman et al., 2013).
PFOA consists of a fully fluorinated seven carbon chain with a carboxylic headgroup and
PFOS consists of a fully fluorinated eight carbon chain with a sulfonic headgroup.
According to Liu et al. (2004), increasing the fluorinated carbon chain length makes the
PFC compound more inert by reducing the oxidizability of the ionic headgroup (SO3- for
PFOS and CO2- for PFOA) since it inductively reduces headgroup electron density (Liu
et al., 2004). Table 3 shows the physical and chemical properties of PFOA and PFOS
(Environmental Protection Agency, 2009). The acidic nature (i.e. low acid dissociation
constants (pKa = -3 to 4) of PFOS and PFOA indicate that they predominantly exist in
anionic form in the environment. The anionic form indicates that they are chemically
stable and have low volatility allowing them to readily migrate from soil to water.
Additionally, due to their longer chain length, PFOA and PFOS, have a high tendency to
bind to organic matter and thus bioaccumulate (Environmental Protection Agency, 2009).

24
Table 3 - Physico-chemical properties of PFOA and PFOS (Environmental Protection Agency, 2009)
Treatment of Perfluorinated Compounds
Despite their long use, PFCs have only in the last 25 years become a concern to
the environment and human health. PFCs emergence as a significant ecological pollutant
stems from recent advances in chromatographic technology in the late-1990s allowing for
the first time to determine, analyze and characterize very low concentration background
levels (ng mL-1 range) (Lindstrom et al., 2011; Pobozy et al., 2011). Due to the only
recent recognition of PFCs as contaminants of concern, their very low environmental
concentrations, and their unique physio-chemical properties, as discussed previously,
limited effective treatment technologies exist (Vecitis et al., 2009). Studies indicate that
natural environmental degradation processes and conventional treatment methods have
little to no effect on PFC degradation. A study of PFOS levels at a former fire-training
site at Wurtsmith Air Force Base in northeastern Michigan by Moody et al (2003) found
PFOS and PFOA-contaminated groundwater at levels 20 to 500 times higher than the
EPA Provisionary Health Advisory levels ten years after the end of fire training activities,
Property PFOA PFOS (Potassium SaltChemical Abstracts Service (CAS) Number 335-67-1 2795-39-3Physical Description (physical state at room temperature and atmospheric pressure)
White powder/waxy white solid White powder
Molecular weight (g/mol) 414 538 (potassium salt)
Water solubility (mg/L at 22oC) 9.5 X 10³(purified)570 (purified), 370 (freshwater), 25
(filtered seawater)Melting Point (oC) 45 to 50 > 400
Boiling point (oC) 188 Not measurable
Vapor pressure at 22 oC (mm Hg) 0.017 2.48 X10⁻⁶
Air water partition coefficient (Pa.m3/mol) Not available < 2 X10⁻⁶
Octanol-water partition coefficient (log Kow) Not measurable Not measurableOrganic-carbon partition coefficient (log Koc) 2.06 2.57
Henry’s law constant (atm m3/mol) Not measurable 3.05 × 10⁻⁹
Half-LifeAtmospheric: 90 days; Water: > 92
years (at 25oC)Atmospheric: 114 days; Water: > 41
years (at 25º C)
Notes: g/mol – grams per mole; mg/L – milligrams per liter; oC – degree Celsius; mm Hg – millimeters of mercury; atm m3/mol – atmosphere-cubic meters per mole.

25
indicating the compounds’ resistance to environmental degradation (Moody et al., 2003;
Environmental Protection Agency, 2009). Similarly, Rahman et al. (2013) indicate that
PFOA and PFOS are not susceptible to microbial degradation as these compounds do not
seem to be used as carbon sources (Rahman et al., 2013).
While optimal PFC treatment techniques are highly dependent on contaminant
initial concentration, available degradation time, background organic and metal
concentration, and other site-specific conditions, currently the most effective and utilized
treatment technique for removing PFCs, and specifically PFOA and PFOS, is granular
activated carbon (GAC). However, an inherent drawback with GAC is the need to
dispose of the secondary waste (i.e. spent GAC) through costly controlled incineration
(Environmental Protection Agency, 2009). Other treatment technologies for PFC-
contaminated water include sonochemical degradation, chemical reduction, and advanced
oxidation process (AOPs) (Vecitis et al., 2009).
It has been reported that sonochemical methods can efficiently degrade PFCs
(Appleman et al., 2013; Li et al., 2012). The effectiveness of sonochemical degradation
is attributed to the cavitation bubbles created by the ultrasound waves. Moriwaki et al.
(2005) indicate that organic pollutants degrade via reactions with hydroxyl radicals
formed by the cavitation bubbles and via direct pyrolysis reaction inside and in the
vicinity of the collapsing bubble (Moriwaki et al., 2005). Moriwaki et al. (2005) reported
a half-life of 43 and 22 minutes for PFOS and PFOA, respectively, using sonochemical
degradation (Moriwaki et al., 2005). Cheng et al. (2010) investigated sonochemical
degradation of PFOA and PFOS in groundwater samples and reported a 97% and 80%

26
decrease in concentration at 120 minutes, respectively (Cheng et al., 2010).
Sonochemical degradation is the only technique that can quickly degrade PFOS and
PFOA; however the method requires energy to produce the ultrasound waves, is limited
to batch systems due to the relatively high residence time needed for substantial
degradation, and degradation rates are reduced in organic-rich water (Vecitis et al., 2009;
Cheng et al., 2010).
An alternative remediation technique of interest is AOP, and more specifically
heterogeneous photocatalytic reactions with semiconductors. An overview of the
literature indicates low effectiveness of AOPs in the destruction of PFCs, particularly
long chained compounds such as PFOA and PFOS due to their high thermal and chemical
stability (Estrellan et al., 2010; Department of Health and Human Services, 2009; Dillert
et al., 2007; Li et al., 2012; Liu et al., 2004; Vecitis et al., 2009; Zhao & Zhang, 2009).
The relative ineffectiveness of heterogeneous photocatalysts in degrading PFCs is mainly
attributed to the inability of hydroxyl radicals (•OH) to withdraw hydrogen atoms from
PFCs, specifically the PFCs PFOA and PFOS, to form water since all the hydrogen atoms
in PFCs have been replaced with fluorine atoms (Rahman et al., 2013). Hydroxyl
radicals are also prevented from abstracting hydrogen atoms from the relatively neutral
pH levels in the environment (Liu et al., 2004). Dillert et al. (2006) reported the
degradation of numerous PFCs under UV light in the presence of dispersed TiO2 only
under highly acidic conditions (pH = 1) (Dillert et al., 2007). Consequently, the hydroxyl
radical must act through direct electron transfer to form the less reactive species,
hydroxyl ion (See Equations 5 & 6) (Vecitis et al., 2009).

27
Equation 5 •HO + e → H2O (E0 = 2.7 V)
Equation 6 •HO + e → HO- (E0 = 1.9 V)
Despite the widely reported ineffectiveness of heterogeneous photocatalysts to
degrade PFCs, several reports indicate the possibility of degrading PFCs using this
method. Li et al. (2012) investigated the heterogeneous photocatalytic decomposition of
PFOA by dispersed indium oxide (In2O3) and dispersed TiO2 under UV light (254 nm)
and reported 80% and 15.9% decrease, respectively, within 4 hours (Li et al., 2012).
Additionally, Wang & Zhang (2011) investigated the decomposition of PFOA in aqueous
solution by dispersed TiO2 under UV light at varying pH levels and atmospheres (i.e.
nitrogen and oxygen) and reported PFOA (at pH = 7) decomposing 10.5% and 12.4%
under an oxygen and nitrogen atmosphere, respectively, within 180 minutes. Of note is
the reported 86.7% decomposition of PFOA (at pH = 2.47) after 180 minutes (Wang &
Zhang, 2011).
These results indicate the possibility of successfully degrading PFCs, specifically
PFOA and PFOS, using heterogeneous photocatalytic decomposition with a cheap, safe
and abundant semiconductor (i.e. TiO2) at an environmentally relevant pH. Ideally, it
would be possible to achieve degradation rates comparable to those achieved above at
low pH, by treatment with a low energy source such as solar light, and using an
immobilized catalyst which would not need to be separated from the water after
treatment. immobilized catalyst which would not need to be separated from the water
after treatment.

28
Photocatalysis Using TiO2
Heterogeneous photocatalysis using TiO2 as a catalyst is emerging as one of the
most effective and efficient technologies to photo-mineralize organic pollutants into
simple molecules such as CO2, H2O, NO3-, PO4
3- and halide ions (Gaya & Abdullah,
2008; Konstantinou & Albanis, 2004). It has been reported that of the various
semiconductors used in environmental applications, such as WO3, Fe2O3, SrTiO3 ZnO,
CeO2, CdS, and ZnS, TiO2 has the best photocatalytic performance with maximum
quantum yields (Herrmann, 1999; Tseng et al., 2010). The use of TiO2 as a
semiconductor in heterogeneous photocatalytic reactions has several other advantages:
TiO2 is abundant, relatively inexpensive, environmentally benign during degradation,
operates at ambient temperature and pressure, resists photo-corrosion and has a favorable
band-gap energy (Kwon et al., 2008; Liang et al., 2012). Estimated worldwide reserves
of TiO2 are in excess of 600 million tons and the annual production of TiO2 is
approximately 4.3 million tons (Daghrir et al., 2013). TiO2’s low energy band gap,
which ranges from 3.0-3.2 eV depending on the crystalline structure, makes it more
attractive than other leading semiconductors, such as ZnO (3.35 eV) and SnO2 (3.6 eV)
(Teh & Mohamed, 2011).
There are three different types of TiO2 (anatase, rutile and brookite) each with
their unique crystal structures (Teh & Mohamed, 2011). While rutile is the most
common form of TiO2, it has been reported that the open crystalline structure of anatase
allows for the best photocatalytic activity and thus the most practical for widespread
environmental applications (Kaan et al., 2012; Kwon et al., 2008). Figure 5 shows the
primary processes involved in photomineralizing organic compounds. Table 4 lists the

29
elementary mechanisms of photocatalytic degradation of organic compounds by TiO2
catalysis and the characteristic times for each reaction (Gaya & Abdullah, 2008).
Figure 5 - Primary process involved in photomineralization of organic compounds by TiO2 (Gaya &
Abdullah, 2008)
30
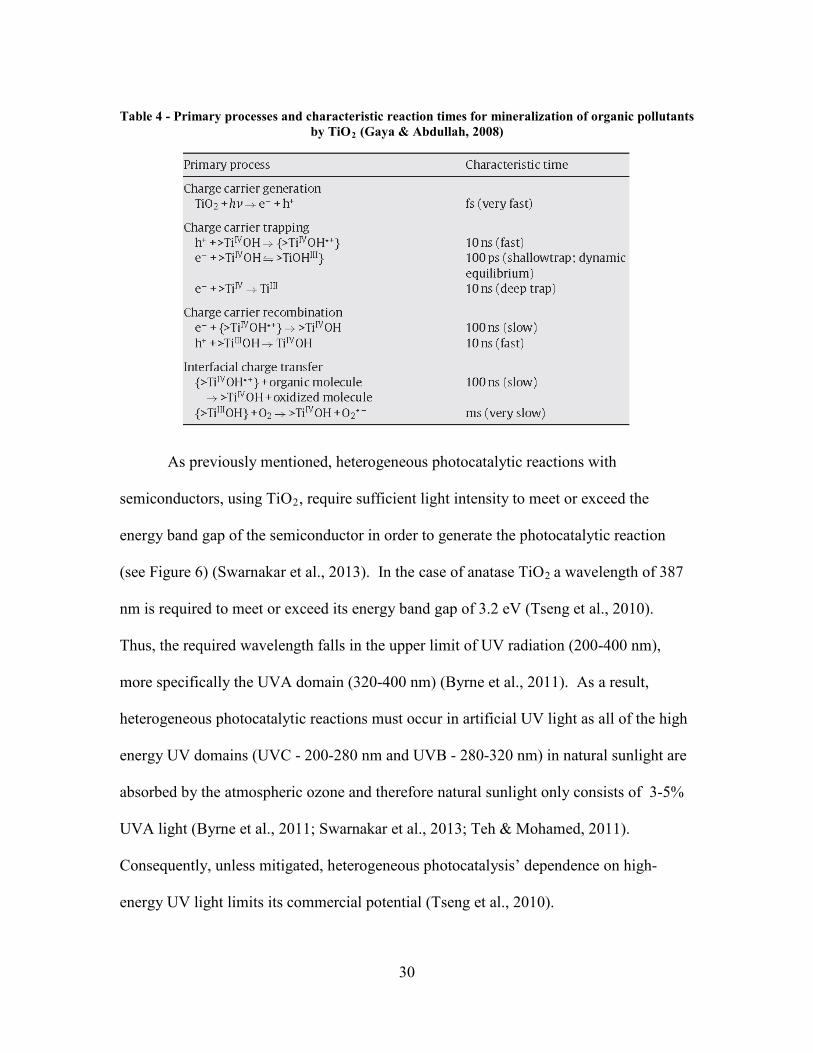
Table 4 - Primary processes and characteristic reaction times for mineralization of organic pollutants by TiO2 (Gaya & Abdullah, 2008)
As previously mentioned, heterogeneous photocatalytic reactions with
semiconductors, using TiO2, require sufficient light intensity to meet or exceed the
energy band gap of the semiconductor in order to generate the photocatalytic reaction
(see Figure 6) (Swarnakar et al., 2013). In the case of anatase TiO2 a wavelength of 387
nm is required to meet or exceed its energy band gap of 3.2 eV (Tseng et al., 2010).
Thus, the required wavelength falls in the upper limit of UV radiation (200-400 nm),
more specifically the UVA domain (320-400 nm) (Byrne et al., 2011). As a result,
heterogeneous photocatalytic reactions must occur in artificial UV light as all of the high
energy UV domains (UVC - 200-280 nm and UVB - 280-320 nm) in natural sunlight are
absorbed by the atmospheric ozone and therefore natural sunlight only consists of 3-5%
UVA light (Byrne et al., 2011; Swarnakar et al., 2013; Teh & Mohamed, 2011).
Consequently, unless mitigated, heterogeneous photocatalysis’ dependence on high-
energy UV light limits its commercial potential (Tseng et al., 2010).

31
Figure 6 - Schematic diagram of the photocatalytic mechanism of Ag doped TiO2 film (Swarnakar et
al., 2013)
In order to ensure heterogeneous photocatalysis, and photocatalysis with TiO2
specifically, is a viable alternative to GAC and other remediation techniques, sensitizing
the semiconductor to visible light is of great importance in order to mitigate its
dependence on UV radiation and be able to effectively use natural sun light as an energy
source to generate the photocatalytic reactions (Teh & Mohamed, 2011). Numerous
studies have focused on elevating the photocatalytic activity of TiO2 using metals and
nonmetals as doping agents.
Doping of TiO2 with nonmetals, such as C, N, S, P, B, P, I and F has shown to
significantly improve the photosensitivity of TiO2 (Tseng et al., 2010). Asahi et al.
(2001) assessed the capability of several nonmetal doping agents (i.e. C, N, F, P and S) to
produce states in the band gap that absorb visible light. They reported that N doping was

32
the most effective due to the mixing of its p orbitals with the oxygen 2p orbitals (Asahi et
al., 2012). Daghrir et al. (2013) similarly assessed several nonmetals as doping agents to
extend TiO2’s sensitivity into the visible spectrum and reported nitrogen and carbon as
being the most effective in ensuring higher photocatalytic activity of TiO2 under visible
light (Daghrir et al., 2013). Despite the promise of doping TiO2 with nonmetals, several
disadvantages have been reported such as a decrease of dopant during the annealing
process and, ultimately, that the photocatalytic activity under visible light of nonmetal-
doped TiO2 is much lower than under UV light (Han et al., 2011; Teh & Mohamed,
2011; Zaleska, 2008).
Doping of TiO2 with metals (transition, rare earth and noble metals) has generally
widened the light absorption range of TiO2 into the visible light spectrum (Teh &
Mohamed, 2011). Daghrir et al. (2013) cautions that doping with metal may cause
defects that can decrease the photocatalytic activity due to the creation of recombination
centers for the electrons/holes; however, he states that the defects can be avoided by re-
annealing the doped TiO2 (Daghrir et al., 2013). Recently noble metals, such as Ag, Pt,
Au, Pd, Os, Ir, Ru, and Rh have gained interest due to their high resistance to oxidation in
aqueous environments as compared to other metals. These noble metals have been
reported to serve as light absorbing sensitizers and as centers of charge separation, thus
increasing the photocatalytic effectiveness of TiO2 (Daghrir et al., 2013; Grabowska et
al., 2010; Teh & Mohamed, 2011).
Silver-doped TiO2 (Ag-TiO2), in particular, has been of considerable interest due
to its effectiveness in extending TiO2 absorption into the visible spectrum, aiding

33
electron-hole separation through oxygen adsorption and increasing the TiO2’s specific
surface area, thus providing more sites for photoreactions (Arabatzis et al., 2003; Mboula
et al., 2013; Teh & Mohamed, 2011). While it has been reported that platinum’s
photocatalytic activity is greater than silver’s, silver’s low cost and easier preparation
makes it the most suitable photocatalyst for commercial applications (Liu et al., 2004).
Additionally, Grabowska et al. (2010) reported that silver enables the increase of
photocatalytic activity both under UV light and visible light, and Castro et al. (2011)
reported that silver-doped TiO2 extends the absorption to wavelengths up to 600 nm
(Castro et al., 2012; Grabowska et al., 2010). Under UV irradiation, silver deposits act as
electron traps, thus leading to the enhancement of Ag-TiO2 photocatalytic activity
(Sobana et al., 2006). Numerous studies have reported increased rates of degradation for
a wide range of pollutants, to include rhodamine 6G dye, methylene blue, methyl orange,
phenol, Cr (IV), direct diazo dyes, short chain carboxylic acids, and toluene when using
Ag-TiO2 as a photocatalyst (Daghrir et al., 2013; Liang et al., 2012; Liga et al., 2011; Liu
et al., 2004; Sobana et al., 2006).
2,4-DNT Degradation Pathways in the Presence of TiO2
According to Chen & Liang (2008) and Dillert et al. (1995), photocatalytic
degradation of 2,4-DNT in the presence of TiO2 begins with the cleaving of a nitro group
by hydroxyl radicals, resulting in 3-Nitrotoulene (3-NT) (see Figure 7). According to
Dillert et al. (1995), the decrease in nitro groups on the aromatic ring increases the
reactivity of the aromatic compound leading to the easier cleavage of the second nitro
group and forming toluene. Toluene would then be oxidized to benzaldehyde, which

34
would then result in benzoic acid and finally mineralized products of carbon dioxide,
nitrate ion and water through decarboxylation of the carbons in the benzene ring (Chen &
Liang, 2008; Dillert et al., 1995).
Figure 7 - Proposed 2,4-DNT degradation pathway in the presence of TiO2 (Chen & Liang, 2008)
An alternative degradation pathway proposed by Wen et al. (2011) results in
intermediate products of methyl nitroanilines, dinitrobenzene, and diaminotoluene before
mineralization into carbon, nitrate ions and water (see Figure 8) (Wen et al., 2011).
Figure 8 - Alternate proposed intermediate products of 2, 4 -DNT degradation
PFOA & PFOS Degradation Pathways in the Presence of TiO2
According to Vecitis et al. (2009), TiO2 photocatalytic degradation at
environmentally relevant pH (pH = 6-8) proved very slow, but ultimately effective, for

35
decomposing PFOA. The degradation pathway involves the adsorption of PFOA onto
the TiO2 which is then directly oxidized by a valence hole (hvb+) produced by the
excitation of the TiO2 electrons into the conduction band when the energy band gap is
met or exceeded (Vecitis et al., 2009; Department of Health and Human Services, 2009).
Equation 7 and Equation 8 indicate the cleaving of the carboxylic headgroup initially
occurs followed by numerous intermediate reactions leading to the comparatively
recalcitrant perfluoroheptanoate, a PFCA containing one less fluorinated carbon than
PFOA in its chain. Subsequent reactions would continue similarly until the
perfluorinated tail is completely unzipped (See Equations 7 & 8)(Vecitis et al., 2009;
Department of Health and Human Services, 2009).
Equation 7 > TiOH•+ (hvb+) + > CF3(CF2)6COO- → > TiOH + CF3(CF2)5CF2• + CO2
Equation 8 CF3(CF2)5CF2• + CO2 → Intermediate Reactions → CF3(CF2)5COO
Vecitis et al. (2009) pointed out that TiO2 photocatalytic degradation at
environmentally relevant pH was not effective in decomposing PFOS (Vecitis et al.,
2009). This assessment is consistent with numerous investigations that used PFOS as an
inert and reusable TiO2 surface coating to enhance the adsorption of hydrophobic
contaminants (e.g. PCBs and chlorinated aromatics) onto the TiO2 surface to enhance its
photocatalytic reactivity (Vecitis et al., 2009; Liu et al., 2004).

36
III. Methodology
This chapter discusses the methodology used to investigate and answered the
research questions posed for this research effort. The methodology identifies the
materials, light sources and instruments used in the experiments. This section also
describes slide fabrication methods and degradation experimental procedures.
Chemicals
High purity chemicals (> 99%, unless otherwise noted) were obtained and used as
received from the supplier: Acetic acid (Sigma-Aldrich, St Louis, MO); Tween 80
(Sigma-Aldrich, St Louis, MO); Isopropyl alcohol (Sigma-Aldrich, St Louis, MO);
Titanium (IV) Isopropoxide (Sigma-Aldrich, St Luis, MO); 2,4-Dinitrotoluene (Sigma-
Aldrich, St Louis, MO); Silver nitrate (Wellington Labs, Merriam, KS);
Perfluorooctanoic acid (Wellington Labs, Merriam, KS); (Na) Perfluorooctane sulfonate
(Wellington Labs, Merriam, KS); Native Perfluorinated Acid/Sulfonate Mix (Wellington
Labs, Merriam, KS).
Light Sources and Analytical Instruments
Experiments were conducted in natural sunlight and under UV light in Dayton,
Ohio, coordinates 39.8 N, 84.2 W during the months of October-January. Natural
sunlight experiments (conducted October-December) were placed outside in direct
sunlight on clear days between 0900 and 1600. All Petri dishes were covered during the
experiments to eliminate the effect of evaporation on the reactions. Temperature and
solar irradiation levels were gathered and a statistical analysis of data was used to

37
evaluate their impact on degradation constants (see Chapter IV). UV light experiments
(conducted under controlled laboratory conditions) were illuminated by a TripleBright II
UV lamp (UV Systems, Inc., Renton, WA) at a distance of 2 cm from the reactors with a
peak wavelength output of 254 nm and a 73.6 W power output. All aqueous solutions
were prepared with ultra-pure deionized water (Millipore, 18.2 M -cm) prepared with a
WaterPro PS Polishing Station (Labonco, Inc.).
A UV-Vis Spectrophotometry system (Agilent, Cary60) was used to measure 2,4-
DNT concentration over time. The instrument has a 1.5 nm fixed spectral bandwidth and
a wavelength range of 190-1100 nm. Wavelength accuracy is ±0.06 at 250 nm and
photometric accuracy is ±0.0007. A Gas Chromatography Mass Spectrometry system
(GC-MS) (Agilent, GC 7890A) was also used to measure 2,4-DNT concentration over
time and identify daughter products formed by the degradation reactions of 2,4-DNT.
In collaboration with the U.S. Environmental Protection Agency’s National Risk
Management Research Laboratory in Cincinnati, Ohio, a Liquid Chromatography-Mass
Spectrometry system (LCMS) (ThermoFinnigan, LCQ Classic) and an EPA-developed
analytical method were used to determine the concentration of PFOA and PFOS over
time, along with the identification of products resulting from the photocatalytic reactions.
A ZORBAX Eclipse XDB C-18 (Agilent Technologies) Rapid Resolution HT 600bar
column with dimensions 4.6mm×50mm, 1.8 μm was used for the chromatographic
separation of sample components. Column temperature was set at 50oC. The binary
mobile phase was a solution of 10mM Formic acid (Solvent A) and 10mM Formic acid
(Solvent B) in MeOH. See Table 5 for the gradient mobile phase program.

38
Table 5 - Gradient mobile phase program
A Raman Spectroscopy system (LabRAM HR 800, Horiba Jobin Yvon, Inc.) with
a 532.134 diode-pumped solid-state (DPSS) frequency-doubled Nd:YAG (Laser
Quantum) excitation source and a spectral range of 100 - 4,000 cm-1 was used to record
and characterize the Raman spectra of the different areas of newly prepared TiO2 slides
prior to use. A Scanning Electron Microscope (SEM) (Quanta 450, FEI, Inc.) was used
to take images of pristine, TiO2, and Ag-TiO2 slides prior to use in order to characterize
the film morphology at an accelerating voltage of 5kV.
Fabrication of uncoated and silver-coated TiO2 films on glass substrates
Uncoated and silver-coated TiO2 thin films on glass substrates were fabricated
using a modified sol-gel method in order to ensure high crystallinity of TiO2 (Han et al.,
2011). Plain blank microscope slides (3 in X 1 in and 1 mm thick) were supplied by
Fisher Scientific. To prepare uncoated TiO2 films on glass substrates, undoped TiO2
colloidal solution was prepared by combining 4.55 mL pure Tween 80 and 40.15 mL
isopropanol in a 100 mL beaker. The solution was stirred using a magnetic stirrer at
room temperature and after 5 minutes 0.67 mL acetic acid (17.4 M) and 3.4 mL of
titanium (IV) Isopropoxide were added and stirred for an additional 20 minutes. Silver-
Time Flow Rate Solvent A Solvent B(min) (µL min-1) % %Initial 400 70 300.5 400 70 303 400 40 608 400 0 1009 400 70 3011 400 70 30

39
doped TiO2 slides were prepared as above with the additional steps of adding appropriate
amounts of AgNO3 (99.9%) to the resulting solution (three concentrations of AgNO3
were initially evaluated for effectiveness of 2,4-DNT degradation - see Chapter IV) and
stirring for 12 hours to ensure homogenous dispersion of Ag+ ions.
Before coating the pristine microscopic slides were rinsed with ethanol and dried
in an oven at temperatures 80-100oC for 15 minutes. Undoped TiO2 and Ag-TiO2 films
on glass substrates were manually dipped in their respective solutions for 18 seconds and
dried in the open for 10 minutes. After the dip coating procedure, the slides were placed
in a conventional oven for calcination. Slides were calcined at 500oC for 20 minutes and
then cooled at room temperature for 10 minutes. All slides were dipped and calcined four
additional times (i.e. a total of five treatment cycles).
Experimental Procedures
Batch NAC experiments using 2,4-DNT were conducted under natural sunlight
(outside) and UV light (in a laboratory environment) from October until January under
atmospheric pressure. Batch PFC degradation experiments using PFOA and PFOS were
conducted under UV light in a laboratory environment under atmospheric pressure.
Three conditions were tested: (1) target contaminants in the presence of slides coated
with TiO2 film, (2) target contaminants in the presence of slides coated with Ag-TiO2
film and (3) target contaminants only as controls. Separate Pyrex glass-covered Petri
dishes (Sigma-Aldrich, St Louis, MO) with 20 ml of 2,4-DNT (10 mg L-1), PFOA (0.1
mg L-1), and PFOS (0.1 mg L-1) solution in water were placed in direct sunlight on clear
days between 0900 and 1700 and in UV light in a controlled environment. During all

40
experiments, Petri dishes without slides were used as controls. Every two hours a 1 mL
sample was removed from each Petri dish and the concentration of the target contaminant
was measured, along with an analysis to identify daughter products formed by the
degradation of the target contaminants. Experiments were performed in duplicate and
concentrations measured as a function of time.
Degradation Kinetics
Results of past studies indicate first-order kinetics can be used to model the
photocatalytic degradation of the target contaminants (Cao et al., 2010; Celin et al., 2003;
Department of Health and Human Services, 2013; Herrmann, 1999; Wen et al., 2011;
Zhao & Zhang, 2009). First-order kinetics indicates that target contaminants decrease
exponentially over time (Equation 9) and their degradation rates are proportional to their
concentration (Equation 10).
Equation 9 𝑪 = 𝑪𝟎𝒆−𝒌𝒕
Equation 10 𝒓𝒂𝒕𝒆 = 𝒅𝑪𝒅𝒕
= −𝒌𝑪
C - Model contaminant concentration at time t C0 - Initial model contaminant concentration at time 0 k - First-order rate constant (obtained by plotting ln(C/Co) vs. time data and calculating the slope of the line) t - Time (min)
An analysis of variance was performed to determine statistical differences
between results. Results were also compared with previous studies that looked at the

41
similar contaminants. Finally, an analysis and discussion of results is presented in in
Chapter IV.

42
IV. Analysis and Results
This chapter presents an analysis of the results from the batch experiments
conducted for this research to assess the photocatalytic effectiveness of the treatments
used to degrade 2,4-DNT, PFOA, and PFOS. Photocatalyst morphology, contaminant
degradation rates and daughter product formation results are presented and analyzed.
TiO2 and Ag-TiO2 Slide Characterization
Undoped and silver-doped TiO2 films on glass substrates were fabricated using a
modified sol-gel method (Han et al., 2011). Scanning electron microscopy (SEM) was
used to characterize the slides and the shape of the titanium dioxide and silver particles
(Figure 9). Dispersed particles appeared on the glass surface when coated with TiO2
nanoparticles (Figure 9b). Ag-TiO2 appeared on the glass film as nanoparticle clusters
(Figure 9c). Clustering appears in both TiO2 and Ag-TiO2 slides which may be
responsible for lower than expected TiO2 degradation rates of the target contaminants due
to possibly reduced surface area.
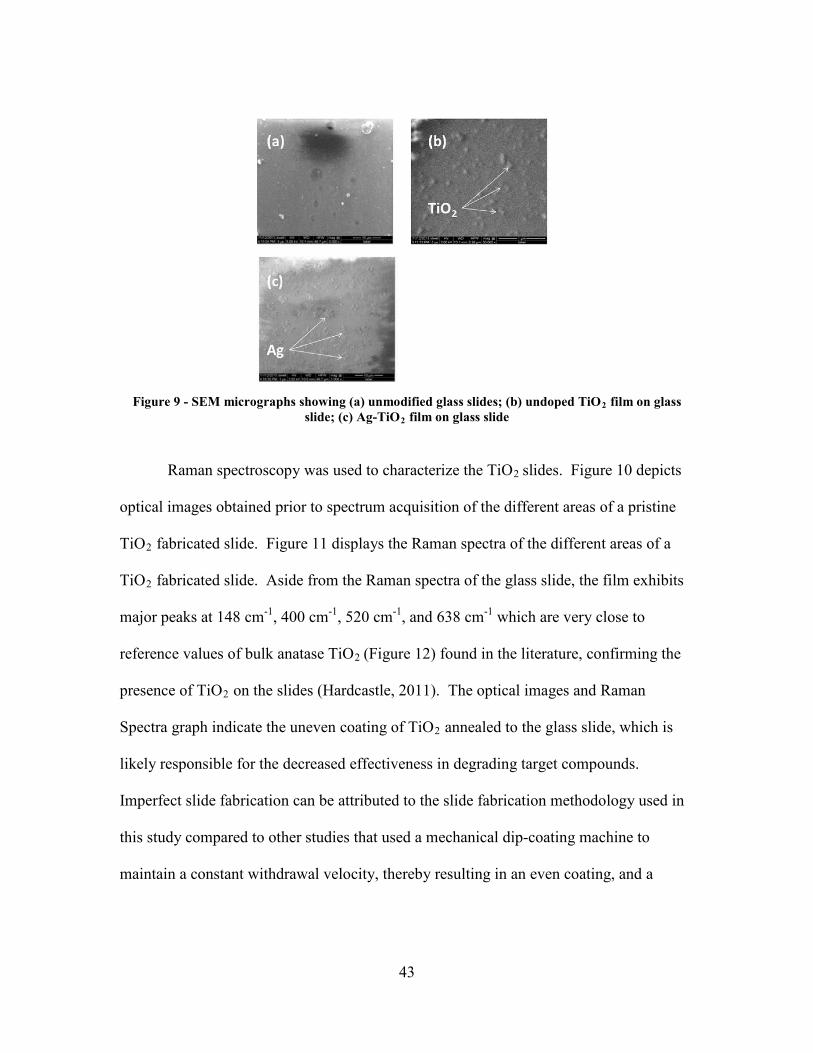
43
Figure 9 - SEM micrographs showing (a) unmodified glass slides; (b) undoped TiO2 film on glass
slide; (c) Ag-TiO2 film on glass slide
Raman spectroscopy was used to characterize the TiO2 slides. Figure 10 depicts
optical images obtained prior to spectrum acquisition of the different areas of a pristine
TiO2 fabricated slide. Figure 11 displays the Raman spectra of the different areas of a
TiO2 fabricated slide. Aside from the Raman spectra of the glass slide, the film exhibits
major peaks at 148 cm-1, 400 cm-1, 520 cm-1, and 638 cm-1 which are very close to
reference values of bulk anatase TiO2 (Figure 12) found in the literature, confirming the
presence of TiO2 on the slides (Hardcastle, 2011). The optical images and Raman
Spectra graph indicate the uneven coating of TiO2 annealed to the glass slide, which is
likely responsible for the decreased effectiveness in degrading target compounds.
Imperfect slide fabrication can be attributed to the slide fabrication methodology used in
this study compared to other studies that used a mechanical dip-coating machine to
maintain a constant withdrawal velocity, thereby resulting in an even coating, and a

44
programmable oven which allows for a more controlled annealing process (Han et al.,
2011).
Figure 10 - Optical images of TiO2 slide obtained prior to spectrum acquisition. Total slide
dimensions: 7.6 cm x 2.5 cm. Uncoated dimensions (one side): 4.6 cm x 2.5 cm. Coating dimensions (one side): 3.0 cm x 2.5 cm
Figure 11 - Raman spectra of the TiO2 on fabricated slides

45
Figure 12 - Reference Raman spectra of TiO2 bulk reference compounds: anatase and Rutile
(Hardcastle, 2011)
Effects of AgNO3 concentration on Ag-TiO2 slides
A review of the literature indicates that there is an optimal Ag+ concentration that
will maximize the efficiency of the Ag-TiO2 slides. Daghrir et al. (2013) asserts that an
optimum mole fraction of Ag+ doping (2-4 mol % moles Ag per mole TiO2) could
effectively increase the photocatalytic activity of TiO2 by increasing the surface area of
the catalyst while a further increase in Ag+ concentration could increase recombination of
electrons/holes and thus lower its photocatalytic activity (Daghrir et al., 2013; Sobana et
al., 2006). Sobana et al. (2006) indicated that silver doping of TiO2 increases its
absorption in visible light as the content of Ag increases to an optimal level and reported
that 1.5 wt. % Ag content was the optimal amount to achieve the most effective rate of
Direct diazo dye red 23 photodegradation and 2.0 wt. % for Direct blue 53 (Sobana et al.,
2006). Arabatzis et al. (2003) reported maximum photocatalytic degradation of methyl

46
orange when exposed to dispersed TiO2 modified in 10-3 M AgNO3 solution (Arabatzis
et al., 2003).
In this study three different concentrations of AgNO3 were tested during Ag-TiO2
slide fabrication. UV-Vis analysis results of 2,4-DNT degradation in sunlight using Ag-
TiO2 slides dipped in solutions containing 5 mg (0.005% mol), 50 mg (0.05% mol) and
100 mg (0.107% mol) of AgNO3 are shown in Figure 13. The results indicated no
difference between AgNO3 concentrations at the 95% confidence level. Thus, Ag-TiO2
slides fabricated with 5 mg AgNO3 were used throughout this study.
Figure 13 - UV-Vis degradation results of 2,4-DNT by Ag-TiO2 films on glass substrate using
different concentrations of AgNO3 during slide fabrication. Experimental conditions: degradation of 2,4-DNT (10 mg L-1) under sunlight in the presence of Ag-TiO2 slides. The area of the films was 15
sq. cm in each test.

47
Degradation Kinetics
As found in earlier studies (Mihas et al., 2007; Wen et al., 2011; Dillert et al.,
1995), the degradation data of 2,4-DNT corresponds well to a first-order kinetic model.
Degradation results for PFOA and PFOS, discussed below, do not indicate that
decomposition occurred and, as such, modeling of their degradation kinetics was not
possible.
Experimental Results
Photocatalytic degradation experiments using 2,4-DNT, PFOA, and PFOS were
performed to study the effect different treatments had on the contaminants’ concentration
over time and daughter product formation. All 2,4-DNT experiments were conducted in
an aqueous solution at a concentration of 10 mg L-1 and all PFOA and PFOS experiments
were conducted at a concentration of 0.1 mg L-1. External factors (i.e., pH levels,
temperature, irradiation intensities, and solution volumes) for all batch experiments under
UV light were controlled. For batch experiments in sunlight certain external factors (i.e.,
pH levels and solution volumes) were controlled. Although the experiments under
sunlight were conducted outdoors under similar clear and sunny conditions, some factors
(i.e., solar irradiation intensities and temperature), which couldn’t be controlled, were
statistically analyzed to determine their effect, if any, on experimental results. See Table
6 for summary of results.

48
Table 6 - Summary of photocatalytic UV-Vis and GCMS results by treatment for 2,4-DNT
Effects of Temperature and Solar Irradiation on Photocatalytic Reactions
To determine the effects of temperature on experiments conducted outside, the
mean air temperature was collected during all experiments. An analysis of variance
between the degradation rates over time of similar experiments was done to determine the
effect of temperature variations on the photocatalytic reactions. The statistical analysis
indicated the degradation rates between batches did not differ at the 95% confidence
level.
To determine the effects of varying solar irradiation levels, historical weather data
were gathered and analyzed in conjunction with the experimental results to determine the
effect of solar irradiation on the photocatalytic reaction rates. Historical solar radiation
data for Wright Patterson Air Force Base, Ohio from October - December were obtained
from the National Renewable Energy Laboratory (Department of Energy, 2012). The
data shows extraterrestrial radiation (ETR), a point on top of the Earth’s atmosphere
Measured by Measured by UV-Vis GCMS
0.020 -0.022 -
0.045 0.0510.030 -
0.003 0.0120.007 -
AgTiO2 (in UV)
Treatment
Control (in Solar)
AgTiO2 (in Solar)
TiO2 (in UV)TiO2 (in Solar)
Control (in UV)
1st Order degradation rate (hr -1 )

49
normal to the Sun’s rays, only fluctuating between 1,369 - 1,431 W-h m-2 during the days
outdoor experiments were conducted (Paulescu et al., 2013). As all the outdoor
experiments were conducted under similar cloudless weather conditions, we can assume
that the variability in solar radiation for these experiments was minimal. Ultimately, an
analysis of variance between similar experiments conducted in natural sunlight did not
differ at the 95% confidence level.
Degradation of 2,4-DNT
UV-Vis analysis results indicate that the removal of 2,4-DNT under solar
radiation in the presence of Ag-TiO2 slides was found to be 14% after 8 hours (Figure
14) and compared to the control (i.e., sunlight only) the results were significant at the
95% confidence level. UV-Vis analysis results indicate that the removal of 2,4-DNT
under solar radiation in the presence of TiO2 slides was found to be 15% after 8 hours
(Figure 14) and compared to the control the results were significant at the 95%
confidence level. However, a statistical analysis of the degradation results of TiO2 and
Ag-TiO2 treatments under solar light shows that the treatments do not differ at the 95%
confidence level. These results indicate that doping TiO2 with Ag did not enhance the
catalyst’s performance under sunlight, signifying that undoped TiO2 is just as effective
without the addition of silver. Additionally, the degradation rates observed are
considerably lower than expected. The degradation constant achieved of 0.022 h-1 (2,4-
DNT - 10 mg L-1) in the presence of Ag-TiO2 under sunlight was lower than the rate

50
constant of 0.132 h-1 achieved by Mihas et al (2007) in degrading 2,4-DNT (1 mg L-1)
under sunlight only (Mihas et al., 2007).
Figure 14 - UV-Vis measured degradation results of 2,4-DNT by TiO2 and Ag-TiO2 films on glass substrates under sunlight. Experimental conditions: degradation of 2,4-DNT (10 mg L-1) under sunlight in the presence of TiO2 and Ag-TiO2 slides. 5 mg of AgNO3 used to fabricate Ag-TiO2
slides. The area of the films used was 15 sq. cm in each test.
UV-Vis analysis results indicate that the removal of 2,4-DNT under UV light in
the presence of Ag-TiO2 slides was found to be 13% after 8 hours (Figure 15). However,
compared to the control, the results were not significantly different at the 95% confidence
level. A comparison of these results with results obtained from Ag-TiO2 under solar
light shows that there is no difference in degradation rate at the 95% confidence level.
These results indicate that doping TiO2 with Ag did not enhance the photocatalytic
effectiveness of TiO2 suggesting that the Ag+ concentration used was not effective as an
electron trap under UV light as would be expected (Sobana et al., 2006).

51
Figure 15 - UV-Vis measured degradation results of 2,4-DNT by TiO2 and Ag-TiO2 films on glass substrates under UV light. Experimental conditions: degradation of 2,4-DNT (10 mg L-1) under UV light in the presence of TiO2 and Ag-TiO2 slides. The area of the films used was 15 sq. cm in each
test.
Finally, UV-Vis analysis results indicate that the removal of 2,4-DNT under UV
radiation in the presence of TiO2 slides was found to be 29% after 8 hours (Figure 15)
and compared to the control (i.e., UV radiation only) the results differ at the 95%
confidence level. 2,4-DNT degradation rates under UV light in the presence of TiO2
slides were also measured with a GCMS analysis. GCMS results indicated that 2,4-DNT
decomposed 30% after 8 hours (Figure 16 and Figure 17) and compared to the control the
results differ at the 95% confidence level. The results of the UV-Vis and GCMS analyses
(Figure 18) are similar at the 95% confidence level indicating the accuracy of previous
results from UV-Vis analysis. The degradation rate constant (k = 0.045 h-1) achieved for
degrading 2,4-DNT (10 mg L-1) in the presence of TiO2 and under UV light is lower than
the degradation rate constant (k = 0.24 h-1) achieved by Wen et al. (2011) in degrading
2,4-DNT (50 mg L-1) in the presence of immobilized TiO2 under UV light.

52
Figure 16 - GCMS measured degradation results of 2,4-DNT by TiO2 films on glass substrates. Experimental conditions: degradation of 2,4-DNT (10 mg L-1) under UV light with TiO2. The area of the films used was 15 sq. cm. in each test.
Figure 17 - GCMS results for 2,4-DNT degradation at time 0 hr. [(A0) to 8 hr. (A8)]. Experimental conditions: degradation of 2,4-DNT (10 mg L-1) under UV light with pristine TiO2. The area of the
films used was 15 sq. cm. in each test

53
Figure 18 - GCMS and UV-Vis measured degradation results of 2,4-DNT by TiO2 films on glass substrates. Experimental conditions: degradation of 2,4-DNT (10 mg L-1) under UV light with pristine TiO2. The area of the films used was 15 sq. cm. in each test.
Unknown Byproducts of 2,4-DNT Degradation
The 2,4-DNT batch experiments that were conducted using TiO2 slides under UV
light for 12 hours were analyzed by GCMS to identify degradation byproducts. The data
clearly indicated the degradation of 2,4-DNT over time (Figure 16 & Figure 17); however
the expected byproducts of amino nitrotoluenes (methyl nitroanilines), dinitrobenzene,
diaminotoluene, o-mononitrotoluene, toluene, benzaldehyde, and benzoic acid could not
be identified (Chen & Liang, 2008; Dillert et al., 2007; Wen et al., 2011). GCMS
retention time (RT) data indicated unknown compounds between the RT = 2 minutes and
RT = 5 minutes that apparently are not associated or correlated with 2,4-DNT
degradation. However an unknown byproduct was seen at RT = 4.8 minutes that
correlated with the degradation of 2,4-DNT. Figure 19 shows the abundance profile of

54
this unknown byproduct over time [0 hour (A0) to 12 hour (A12)], showing zero
abundance at time 0 which corresponds to an initial concentration of 2,4-DNT (C/Co =
1.00). At time 4 hours the abundance increases and then at 8 hours returns to its original
abundance followed by an increase at time 12 hour. This abundance profile over time
indicates that the unknown compound is possibly a byproduct of 2,4-DNT degradation;
however since 2,4-DNT is degrading at a constant rate it appears to be complex
interactions with the photocatalytic reactions and the other unknown compounds.
Consequently, the correlation between the 2,4-DNT degradation and this unknown
compound is inconclusive.
Figure 19 - GCMS results for unknown byproduct at time 0 hr. (A0) to 12 hr. (A12). Experimental conditions: degradation of 2,4-DNT (10 mg L-1) under UV light with pristine TiO2. The area of the
films used was 15 sq. cm. in each test.
0.0E+00
5.0E+04
1.0E+05
1.5E+05
2.0E+05
2.5E+05
4.8 4.82 4.84 4.86 4.88 4.9
Abun
danc
e
Time (min)
A0 A4 A8 A12
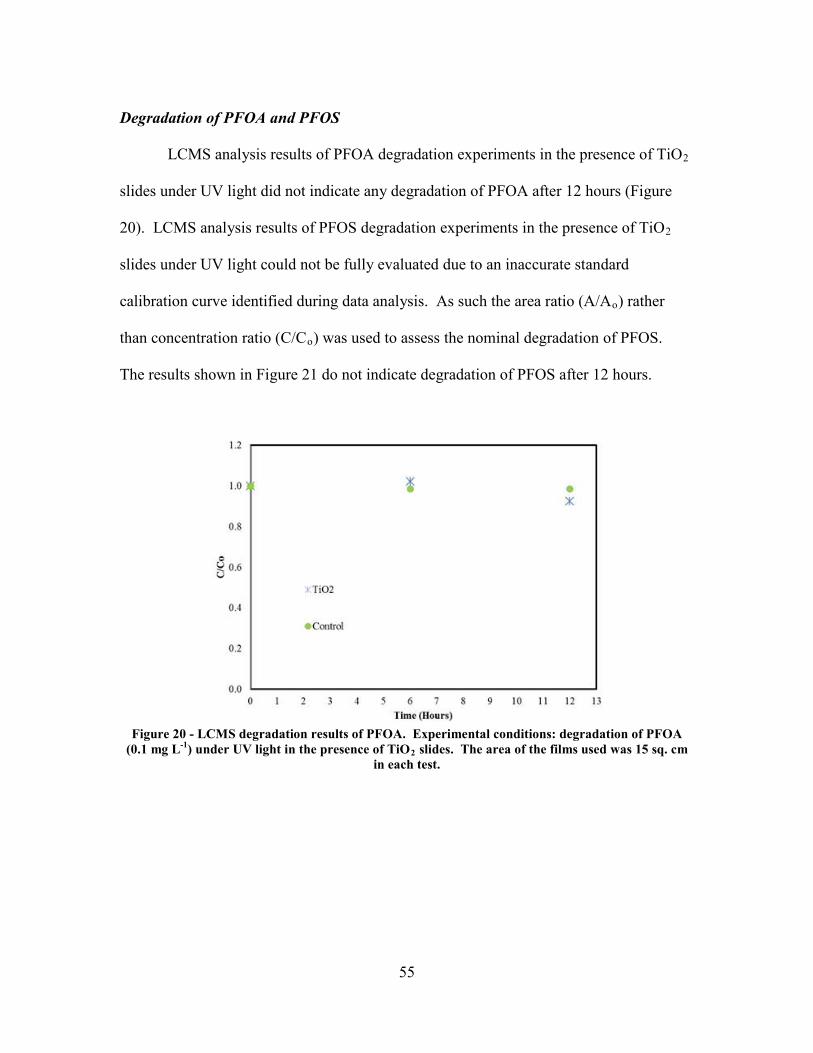
55
Degradation of PFOA and PFOS
LCMS analysis results of PFOA degradation experiments in the presence of TiO2
slides under UV light did not indicate any degradation of PFOA after 12 hours (Figure
20). LCMS analysis results of PFOS degradation experiments in the presence of TiO2
slides under UV light could not be fully evaluated due to an inaccurate standard
calibration curve identified during data analysis. As such the area ratio (A/Ao) rather
than concentration ratio (C/Co) was used to assess the nominal degradation of PFOS.
The results shown in Figure 21 do not indicate degradation of PFOS after 12 hours.
Figure 20 - LCMS degradation results of PFOA. Experimental conditions: degradation of PFOA
(0.1 mg L-1) under UV light in the presence of TiO2 slides. The area of the films used was 15 sq. cm in each test.
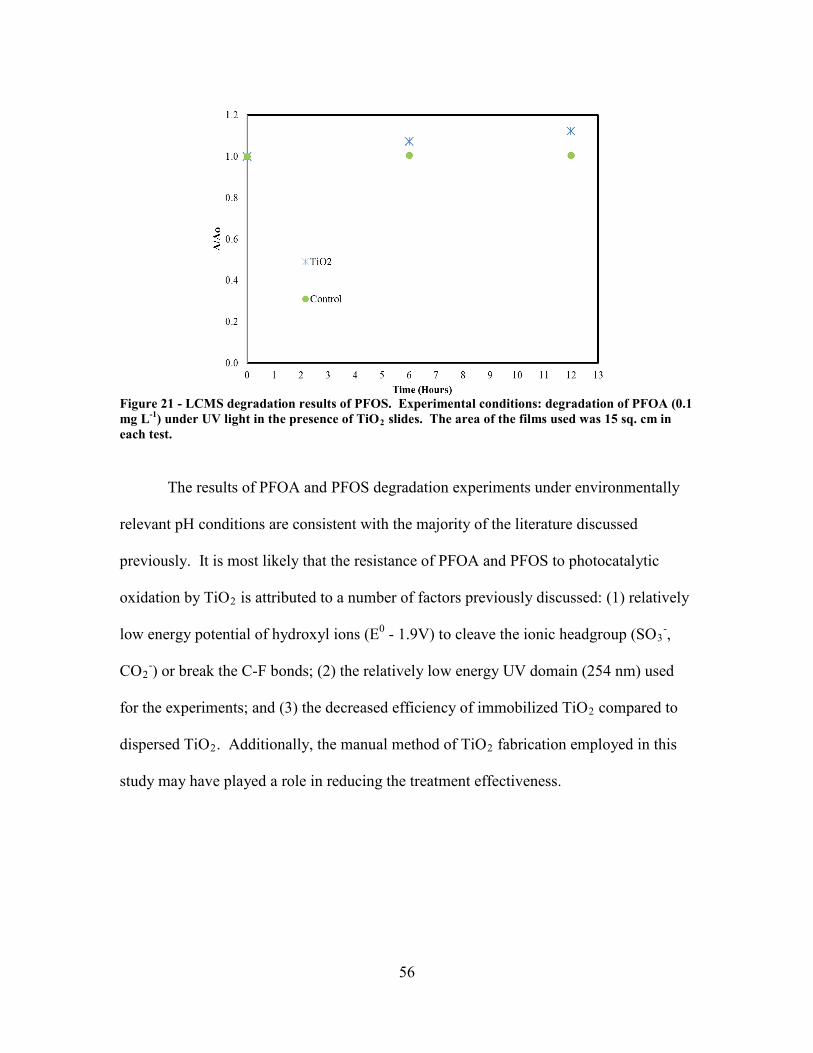
56
Figure 21 - LCMS degradation results of PFOS. Experimental conditions: degradation of PFOA (0.1 mg L-1) under UV light in the presence of TiO2 slides. The area of the films used was 15 sq. cm in each test.
The results of PFOA and PFOS degradation experiments under environmentally
relevant pH conditions are consistent with the majority of the literature discussed
previously. It is most likely that the resistance of PFOA and PFOS to photocatalytic
oxidation by TiO2 is attributed to a number of factors previously discussed: (1) relatively
low energy potential of hydroxyl ions (E0 - 1.9V) to cleave the ionic headgroup (SO3-,
CO2-) or break the C-F bonds; (2) the relatively low energy UV domain (254 nm) used
for the experiments; and (3) the decreased efficiency of immobilized TiO2 compared to
dispersed TiO2. Additionally, the manual method of TiO2 fabrication employed in this
study may have played a role in reducing the treatment effectiveness.

57
V. Conclusions and Recommendations
Summary
This thesis explored different photocatalysts immobilized on glass slides and
different types of irradiation with the goal of finding a simple, effective and energy
efficient treatment using sunlight. In this study, the use of TiO2 and Ag-TiO2 as
photocatalysts for the destruction of NACs and PFCs was investigated. TiO2 and Ag-
TiO2 thin films were immobilized on microscope glass slides by the sol-gel method.
Slides were characterized. Batch-scale experiments were then conducted to determine
photocatalytic degradation rates of 2,4-DNT, PFOS and PFOA under different
treatments, identify and characterize degradation daughter products, and model
degradation kinetics. Degradation of 2,4-DNT in aqueous solution (10 mg L-1) in the
presence of TiO2 and Ag-TiO2 under sunlight and UV light was evaluated. Degradation
of PFOA and PFOS in aqueous solution (0.1 mg L-1) in the presence of TiO2 slides under
UV light was also evaluated. Results were modeled using first-order kinetics to obtain
degradation rate constants.
Conclusions
What are the photocatalytic degradation rates for PFOS, PFOA and 2,4-DNT using
undoped TiO2 as a catalyst, compared to using Ag-TiO2 as a catalyst? -
Experimental results (see Table 6) showed greater degradation of 2,4-DNT in the
presence of Ag-TiO2 under sunlight compared to degradation by sunlight only. However
compared with degradation by undoped-TiO2 there was no statistical difference,

58
indicating that doping with silver is not an effective method to improve performance of
the catalyst under the conditions of this study (10 mg L-1 2,4-DNT in sunlight).
Experimental results showed the degradation of 2,4-DNT for TiO2 and Ag-TiO2 under
UV light to be statistically different than UV light only. These results also indicated that
2,4-DNT degraded more than twice as fast in the presence of TiO2 than Ag-TiO2, which
is contrary to what is expected based on the literature. Finally, a comparison of the
degradation of 2,4-DNT in the presence of TiO2 under UV light to previous similar
studies indicate the that the degradation rate are lower than would be expected.
Experimental results showed no degradation of PFOA and PFOS in the presence
of TiO2 under UV light. These results, considered in combination with the 2,4-DNT
results which showed Ag-doping did not improve 2,4-DNT degradation, suggest that
treatment in the presence of Ag-TiO2 under solar light and UV light will also not degrade
PFOA and PFOS. This conclusion is due to silver’s apparent ineffectiveness in extending
the sensitivity of TiO2 into the visual spectrum under sunlight.
What is the difference between using UV light and natural solar light as energy
sources for the photocatalytic treatment of PFOA, PFOS, and 2,4-DNT-
contaminated water? - Experimental results (see Table 6) show that in the presence of
TiO2 2,4-DNT degrades faster under UV light compared to sunlight. These results are
expected as the literature indicates that TiO2 requires light waves in the UVA domain
(387 nm) to meet or exceed its band energy gap. Experimental results show that in the
presence of Ag-TiO2 2,4-DNT degrades at the same rate under UV light and sunlight.
59
These results are expected as the literature indicates that under UV light Ag partially
enhances TiO2’s photocatalyst efficiency by only acting as an electron trap and under
sunlight Ag acts as both an electron trap and photosensitizes TiO2, so it can be suggested
that both treatments produce comparable photocatalytic reaction rates. Overall, however,
these results are lower than expected when compared to the degradation rate of 2,4-DNT
in the presence of TiO2 under UV light.
What are the daughter products of PFOS, PFOA, and 2,4-DNT photodegradation? -
2,4-DNT degradation products could not be identified. GCMS data indicate an unknown
byproduct that may be associated with the degradation of 2,4-DNT, however this could
not be verified. Since LCMS data indicated no degradation of PFOA or PFOS, daughter
product characterization was not possible.
How does the composition of PFC and NAC degradation daughter products change
over time during photodegradation? - Since results were inconclusive in identifying
2,4-DNT degradation daughter products, it was not possible to characterize daughter
product change over time was not possible. Since LCMS data indicated no degradation
of PFOA or PFOS, daughter product characterization was not possible.
How may the kinetics of PFOS, PFOA, and 2,4-DNT degradation be modeled? -
Experimental results for 2,4-DNT indicate that first-order kinetics can be used to model
2,4-DNT degradation. LCMS data indicated no degradation of PFOA or PFOS.
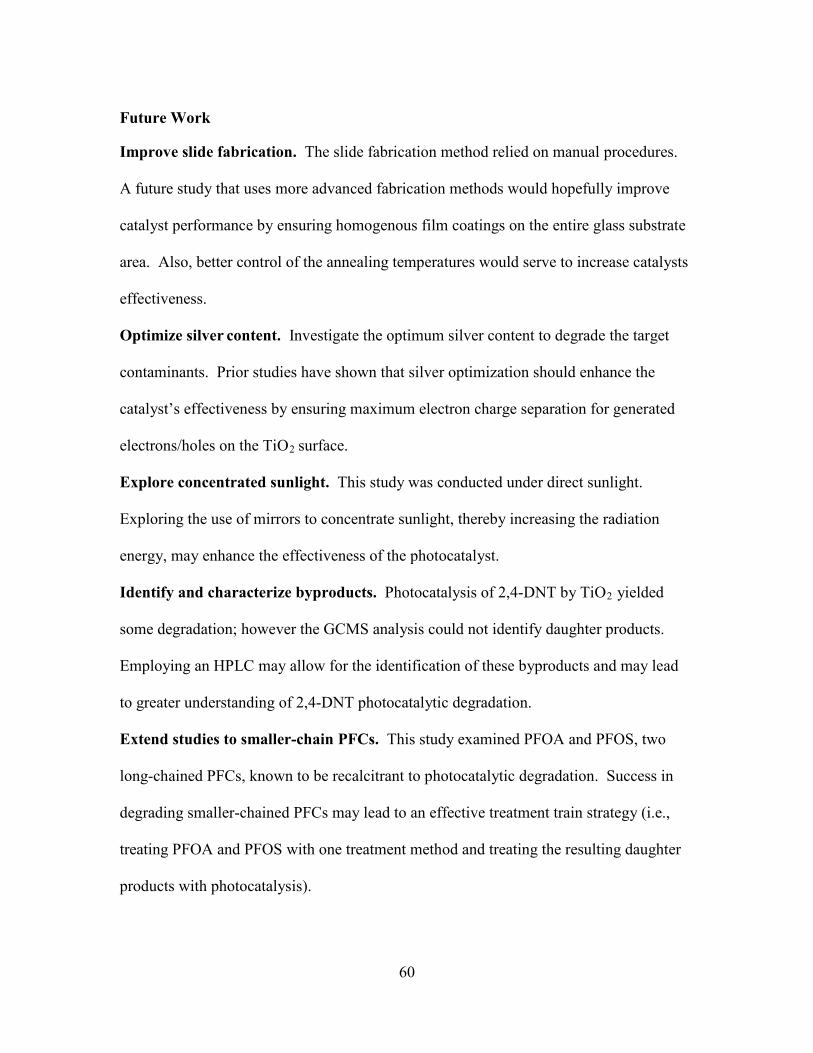
60
Future Work
Improve slide fabrication. The slide fabrication method relied on manual procedures.
A future study that uses more advanced fabrication methods would hopefully improve
catalyst performance by ensuring homogenous film coatings on the entire glass substrate
area. Also, better control of the annealing temperatures would serve to increase catalysts
effectiveness.
Optimize silver content. Investigate the optimum silver content to degrade the target
contaminants. Prior studies have shown that silver optimization should enhance the
catalyst’s effectiveness by ensuring maximum electron charge separation for generated
electrons/holes on the TiO2 surface.
Explore concentrated sunlight. This study was conducted under direct sunlight.
Exploring the use of mirrors to concentrate sunlight, thereby increasing the radiation
energy, may enhance the effectiveness of the photocatalyst.
Identify and characterize byproducts. Photocatalysis of 2,4-DNT by TiO2 yielded
some degradation; however the GCMS analysis could not identify daughter products.
Employing an HPLC may allow for the identification of these byproducts and may lead
to greater understanding of 2,4-DNT photocatalytic degradation.
Extend studies to smaller-chain PFCs. This study examined PFOA and PFOS, two
long-chained PFCs, known to be recalcitrant to photocatalytic degradation. Success in
degrading smaller-chained PFCs may lead to an effective treatment train strategy (i.e.,
treating PFOA and PFOS with one treatment method and treating the resulting daughter
products with photocatalysis).
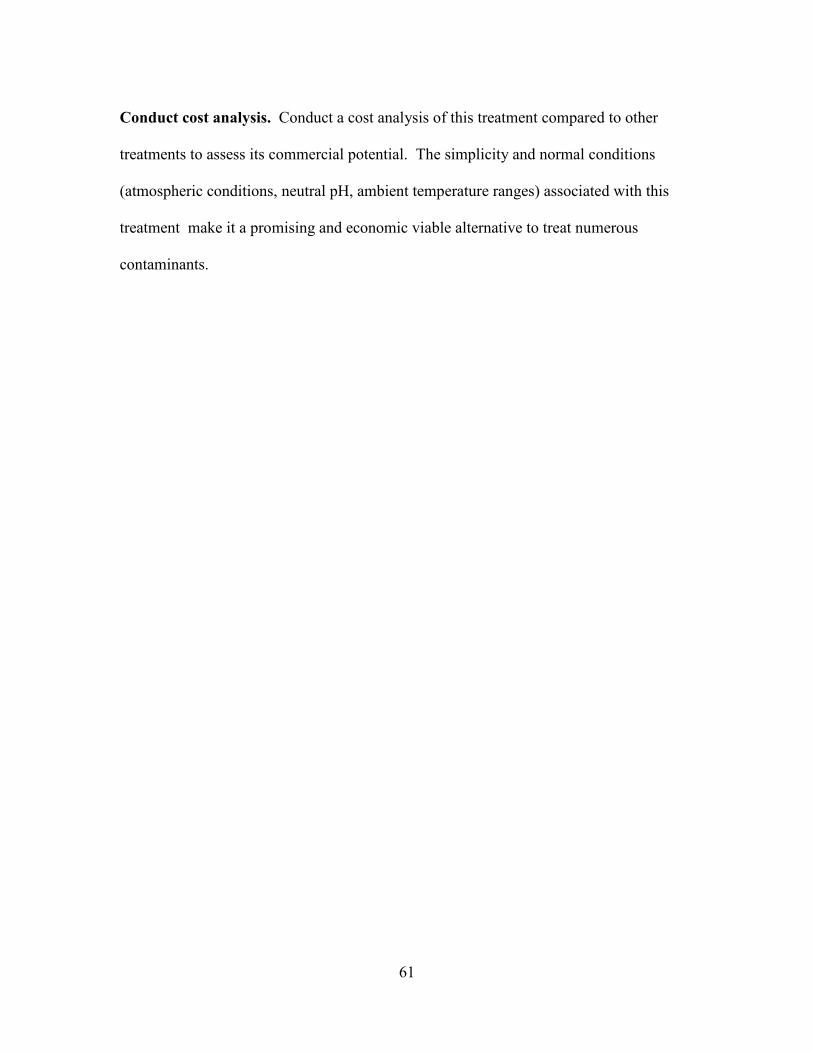
61
Conduct cost analysis. Conduct a cost analysis of this treatment compared to other
treatments to assess its commercial potential. The simplicity and normal conditions
(atmospheric conditions, neutral pH, ambient temperature ranges) associated with this
treatment make it a promising and economic viable alternative to treat numerous
contaminants.

62
Appendix A - Experimental Results

63
Figure 22 - UV-Vis experiment results (A) and (B) - 2,4-DNT (10 mg L-1), Ag-TiO2/solar light
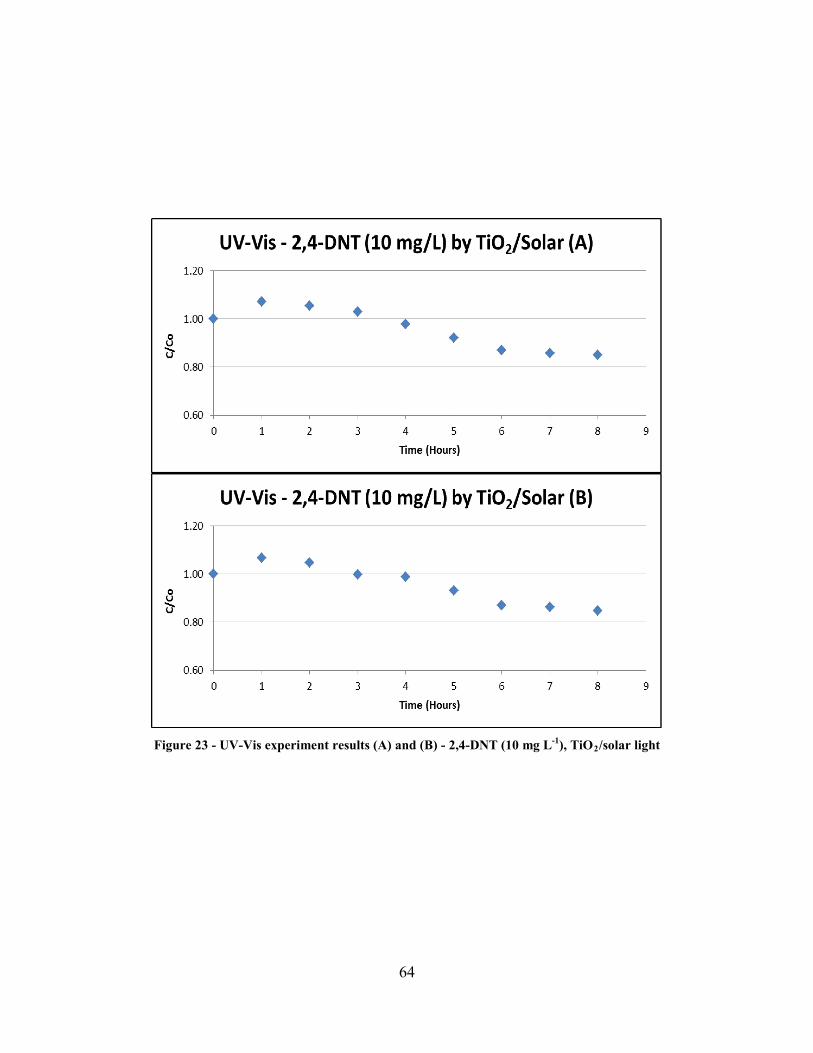
64
Figure 23 - UV-Vis experiment results (A) and (B) - 2,4-DNT (10 mg L-1), TiO2/solar light

65
Figure 24 - UV-Vis experiment results (A) and (B) - 2,4-DNT (10 mg L-1), Control/solar light

66
Figure 25 - UV-Vis experiment results (A) and (B) - 2,4-DNT (10 mg L-1), Ag-TiO2/UV light

67
Figure 26 - UV-Vis experiment results (A) and (B) - 2,4-DNT (10 mg L-1), TiO2/UV light
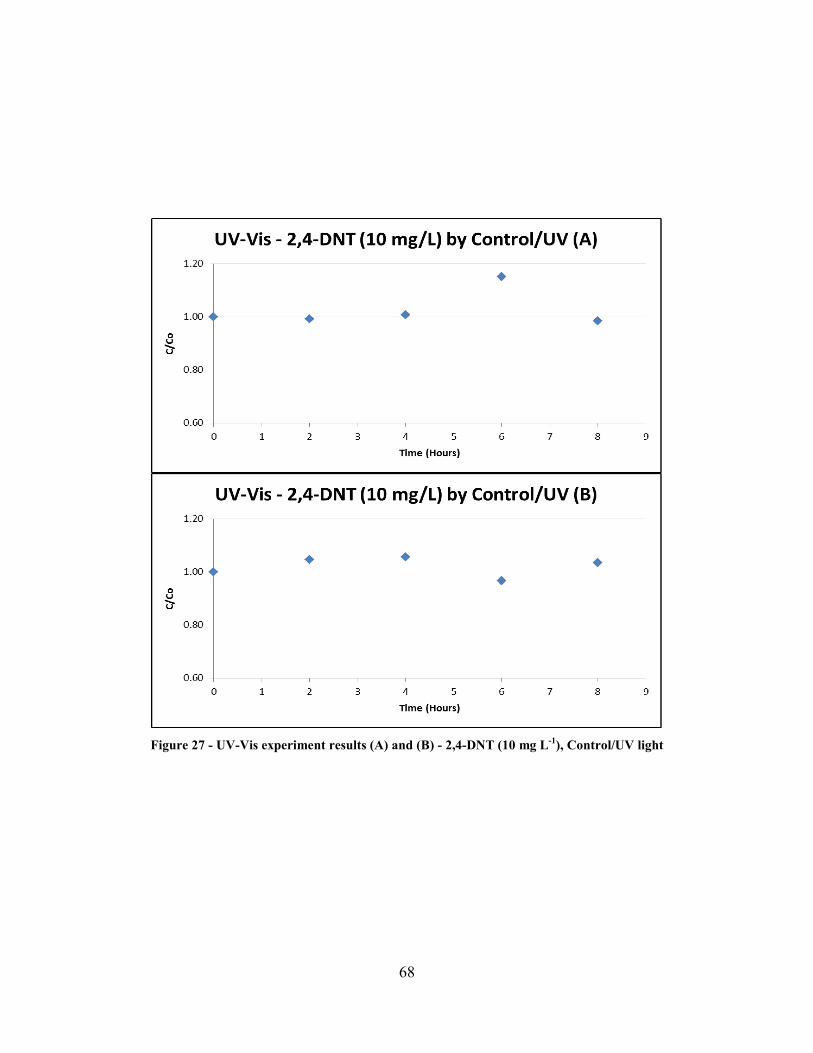
68
Figure 27 - UV-Vis experiment results (A) and (B) - 2,4-DNT (10 mg L-1), Control/UV light

69
Figure 28 - GCMS experiment results (A) and (B) - 2,4-DNT (10 mg L-1), TiO2/UV light
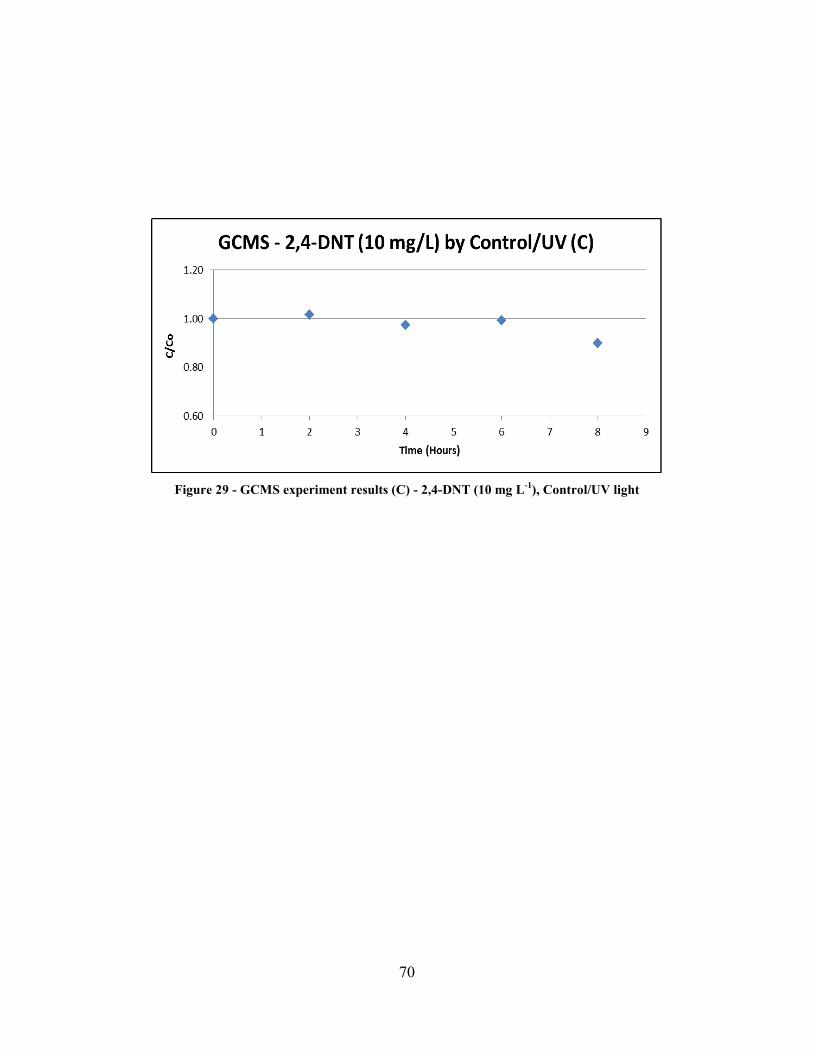
70
Figure 29 - GCMS experiment results (C) - 2,4-DNT (10 mg L-1), Control/UV light

71
Figure 30 - GCMS experiment A results - 2,4-DNT (10 mg L-1), TiO2/UV light. (Ao) Abundance
profile at time 0 hrs, (A4) Abundance profile at time 4 hrs.

72
Figure 31 - GCMS experiment A results - 2,4-DNT (10 mg L-1), TiO2/UV light. (A8) Abundance
profile at time 8 hrs, (A12) Abundance profile at time 12 hrs.

73
Figure 32 - GCMS experiment B results - 2,4-DNT (10 mg L-1), TiO2/UV light. (Bo) Abundance
profile at time 0 hrs, (B4) Abundance profile at time 4 hrs.

74
Figure 33 - GCMS experiment B results - 2,4-DNT (10 mg L-1), TiO2/UV light. (B8) Abundance
profile at time 8 hrs, (B12) Abundance profile at time 12 hrs.
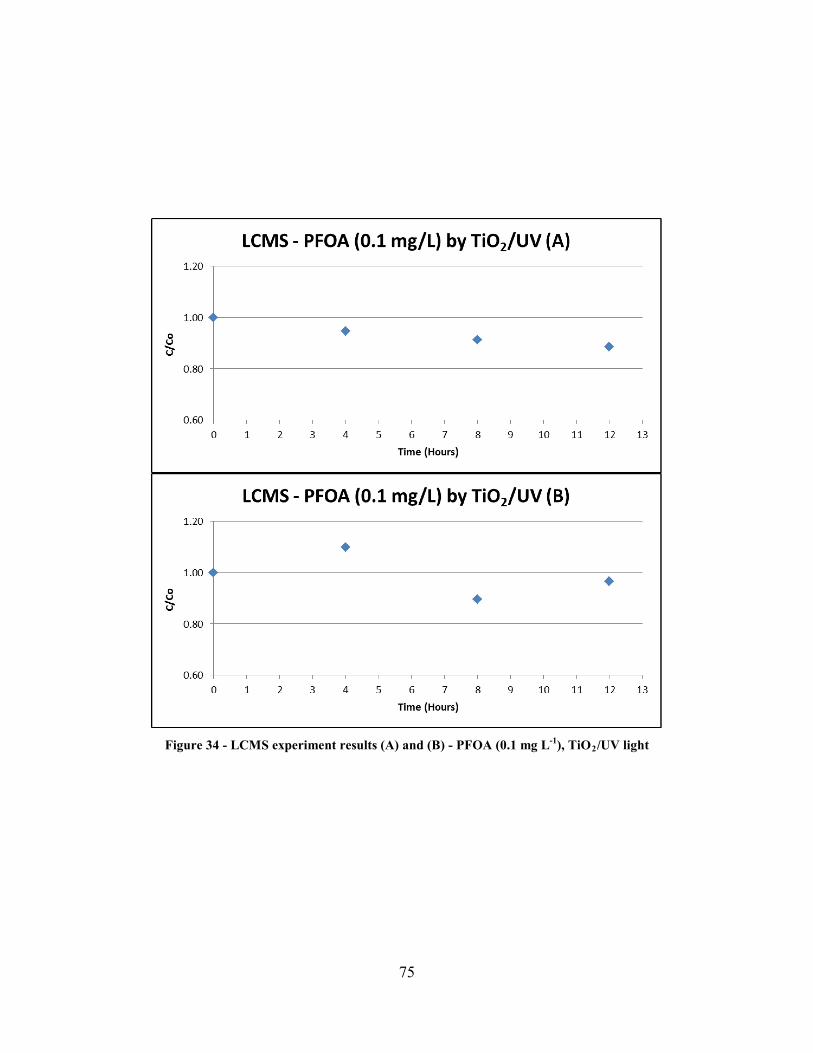
75
Figure 34 - LCMS experiment results (A) and (B) - PFOA (0.1 mg L-1), TiO2/UV light
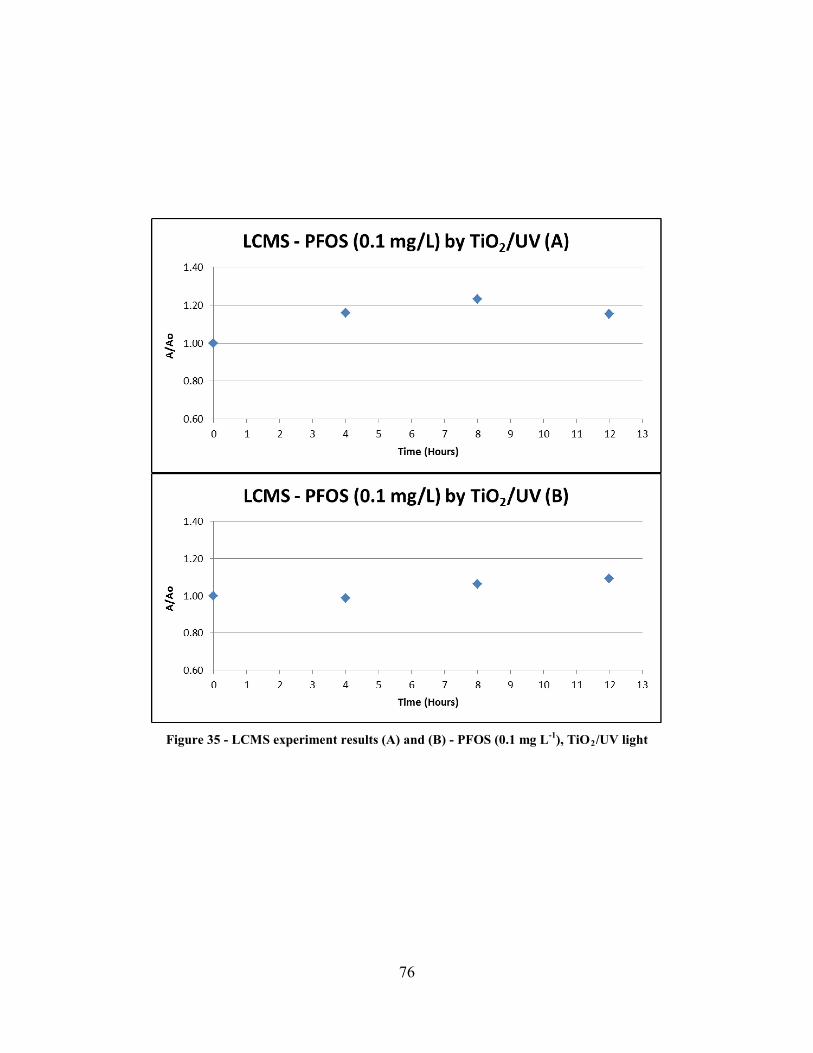
76
Figure 35 - LCMS experiment results (A) and (B) - PFOS (0.1 mg L-1), TiO2/UV light

77
Figure 36 - LCMS experiment results - PFOA (0.1 mg L-1), Control/UV light
Figure 37 - LCMS experiment results - PFOS (0.1 mg L-1), Control/UV light

78
Appendix B - Calibration Curves
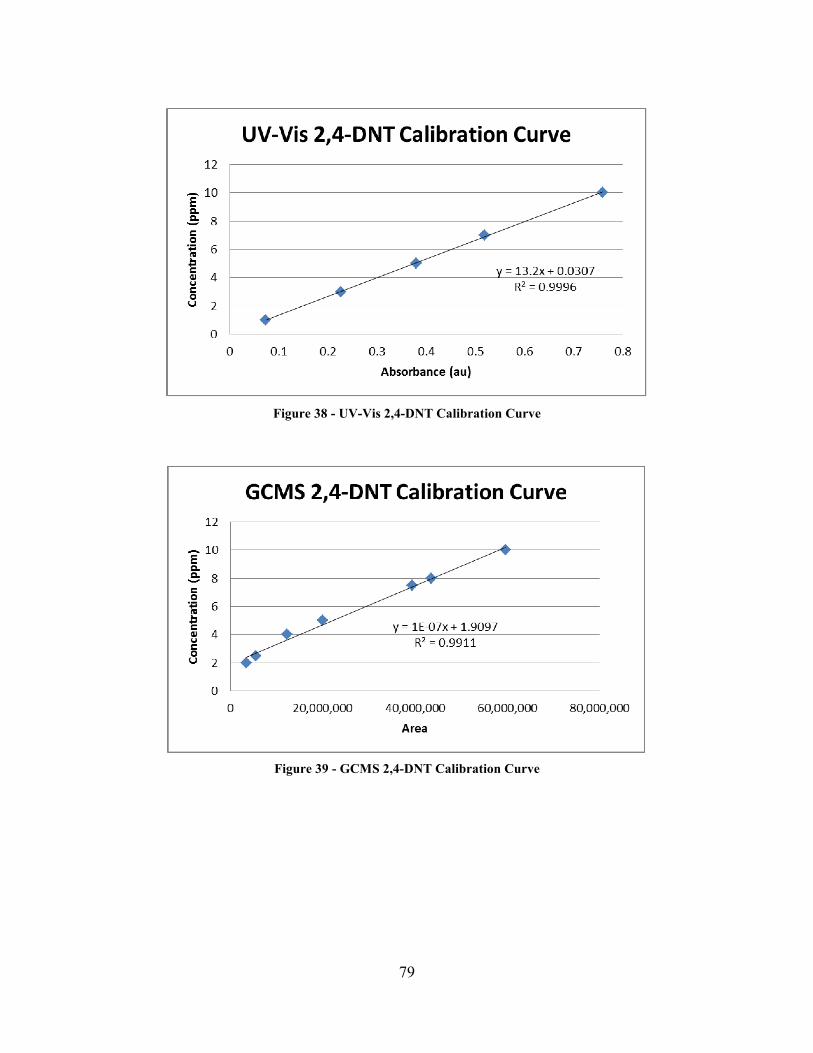
79
Figure 38 - UV-Vis 2,4-DNT Calibration Curve
Figure 39 - GCMS 2,4-DNT Calibration Curve

80
Figure 40 - LCMS PFOA Calibration Curve

81
References
Appleman, T. D., Higgins, C. P., Quinones, O., Vanderford, B. J., Kolstad, C., Zeigler-Holady, J. C., & Dickenson, E. R. (2013). Treatment of Poly- and Perfluoroalkyl Substances in U.S. Full-Scale Water Treatment Systems. Water Research, 1-10.
Arabatzis, I., Stergiopoulos, T., Bernard, M., Labou, D., Neophytides, S., & Falaras, P. (2003). Silver-Modified Titanium Dioxide Thin Films for Efficient Photodegradation of Methyl Orange. Applied Catalysis B: Environmental, 187-201.
Asahi, R., Morikawa, T., Ohwaki, T., Aoki, K., & Taga, Y. (2012). Visible-Light Photocatalysis in Nitrogen-Doped Titanium Oxides. Science, 269-271.
Benotti, M., Stanford, B., Wert, E., & Snyder, S. (2009). Evaluation of a Photocatalytic Reactor Membrane Pilot System for the Removal of Pharmaceuticals and Endocrine Disrupting Compounds from Water. Water Research, 1513-1522.
Byrne, J. A., Fernandez-Ibanez, P. A., Dunlop, P. S., Alrousan, D. M., & Hamilton, J. W. (2011). Photocatalytic Enhancement for Solar Disinfection of Water: A Review. International Journal of Photoenergy, 1-12.
Cao, M. H., Wang, L. L., Yu, H. S., Wang, B. B., Yuan, S. H., & Chen, J. (2010). Photochemical decomposition of perfluorooctanoic acid in aqueous periodate with VUV and UV light irradiation. Journal of Hazardous Materials, 1143-1143.
Castro, C. A., Osorio, P., Sienkiewicz, A., Pulgarin, C., & Centeno, A. (2012). Photocatalytic production of 1O2 and •OH mediated by silver oxidation during the photoinactivation of Escherichia coli with TiO2. Journal of Hazardous Materials, 172-181.
Celin, S. M., Pandit, M., Kapoor, J. C., & Sharma, R. K. (2003). Studies on photo-degradation of 2,4-dinitrotoluene in aqueous phase. Chemosphere, 63-69.
Chen, J., Zhang, P.-y., & Liu, J. (2007). Photodegradation of perfluorooctanoic acid by 185 nm vacuum ultraviolet light. Journal of Environmental Sciences, 387-390.
Chen, W.-S., & Liang, J.-S. (2008). Decomposition of nitrotoluenes from trinitrotoluene manufacturing process by Electron-Fenton oxidation. Chemosphere, 601-607.

82
Cheng, J., Vecitis, C. D., Park, H., Mader, B. T., & Hoffmann, M. R. (2010). Sonochemical Degradation of Perfluorooctane Sulfonate (PFOS) and Perfluorooctanoate (PFOA) in Groundwater: Kinetic Effects of Matrix Inorganics. Enviornmental Science & Technology, 445-450.
Daghrir, R., Drogui, P., & Robert, D. (2013). Modified TiO2 for Environmental Photocatalytic Applications: A Review. Industrial & Engineering Chemistry Research, 3581-3599.
Department of Defense. (2009, June 11). Emergent Contaminants. Retrieved 2013, from A Department of Defense Web Site: Anal. Chem. 2007, 79, 4295-4324
Department of Defense. (2010). FY10 Defense Environmental Program Annual Report to Congress. Washington DC: Department of Defense.
Department of Energy. (2012). National Solar Radiation Database 1991–2010 Update. Washington, D.C.: National Renewable Energy Laboratory.
Department of Health and Human Services. (1998). Toxicological Profile for 2,4- and 2,6 Dinitrotoluene. Washington, D.C.: Department of Health and Human Services.
Department of Health and Human Services. (2009). Toxicological Profile for Perfluoroalkyls. Washignton, DC: U.S. Department of Health and Human Services.
Department of Health and Human Services. (2013). Toxilogical Profile for Dinitrotoluenes. Washignton, DC: U.S. Department of Health and Human Services.
Department of the Interior. (1998). Ground Waterand Surface Water: A Single Source. Denver: U.S. Geological Survey.
Dillert, R., Bahnemann, D., & Hidaka, H. (2007). Light-Induced Degradation of Perfluorocarboxylic Acids in the Presence of Titanium Dioxide. Chemosphere, 785-792.
Dillert, R., Brandt, M., Fornefett, I., Siebers, U., & Bahnemann, D. (1995). Photocatalytic Degradation of Trinitrotoluene and other Nitroaromatic Compounds. Chemosphere, 2333-2341.

83
Dutta, S. K., Hollowell, G. P., Hashem, F. M., & Kuykendall, D. (2003). Enhanced bioremediation of soil containing 2,4-dinitrotoluene by a genetically modified Sinorhizobium meliloti. Soil Biology and Biochemistry, 667-675.
Environmental Protection Agency. (2009). Provisional Health Advisories for Perfluorooctanoic Acid (PFOA) and Perfluorooctane Sulfonate (PFOS).
Environmental Protection Agency. (2012). Tachnical Fact Sheet - Dinitrtoluene (DNT). Washington, D.C.: U.S. Environmental Protection Agency.
Estrellan, C., Salim, C., & Hinode, H. (2010). Photocatalytic Decomposition of Perfluorooctanoic Acid by Iron and Niobium Co-doped Titanium Dioxide. Journal of Hazardous Materials, 79-83.
Gaya, U., & Abdullah, A. (2008). Heterogeneous Photocatalytic Degradation of Organic Contaminants Over Titanium Dioxide: A Review of Fundamentals, Progress and Problems. Journal of Photochemistry and Photobiology C: Photochemistry Reviews, 1-12.
Government Accounting Office. (2005). Groundwater Contamination, DOD Uses and Develops a Range of Remediation Technologies to Clean up Military Sites. Washington, DC: GAO.
Grabowska, E., Remita, H., & Zaleska, A. (2010). Photocatalytic Activity of TiO2 Loaded with Metal Clusters. Physicochemical Problems of Mineral Processing, 29-38.
Grabowska, E., Reszczy, J., & Zaleska, A. (2012). Mechanism of Phenol Photodegradation in the Presence of Pure and Modified-TiO2: A Review. Water Research, 5453-5471.
Han, C., Pelaez, M., Likodimos, V., Kontos, A. G., Falaras, P., O'Shea, K., & Dionysiou, D. D. (2011). Innovative visible light-activated sulfur doped TiO2 films for water treatment. Applied Catalysis B: Environmental.
Hardcastle, F. D. (2011). Raman Spectroscopy of Titania (TiO2) Nanotubular Water-Splitting Catalysts. Journal of the Arkansas Academy of Science, 43-48.
Herrmann, J.-M. (1999). Heterogeneous photocatalysis: fundamentals and applications to the removal of various types of aqueous pollutants. Catalysis Today, 115-129.

84
Kaan, C. C., Aziz, A. A., Ibrahim, S., Matheswaran, M., & Saravanan, P. (2012). Heterogeneous Photocatalytic Oxidation an Effective Tool for Wastewater Treatment – A Review. In M. Kumarasamy, Studies on Water Management Issues (pp. 219-236). Shanghai: InTech.
Konstantinou, I., & Albanis, T. A. (2004). TiO2-assisted photocatalytic degradation of azo dyes inaqueous solution: kinetic and mechanistic investigations: A Review. Applied Catalysis B: Environmental, 1-14.
Kutsuna, S., Nagaoka, Y., Takeuchi, K., & Hori, H. (2006). TiO2-induced heterogeneous photofegradation of a fluorotelormer alcohol in air. Environmental Science & Technology, 6824-6829.
Kwon, S., Fan, M., Cooper, A. T., & Yang, H. (2008). Photocatalytic Applications of Micro- and Nano-TiO2 in Environmental Engineering. Critical Reviews in Environmental Science and Technology, 197-226.
Li, X., Zhang, P., Jin, L., Shao, T., Li, Z., & Cao, J. (2012). Efficient Photocatalytic Decomposition of Perfluorooctanoic Acid by Indium Oxide and Its Mechanism. Environmental Science & Technology, 5528-5534.
Liang, W., Li, J., & He, H. (2012). Photo-Catalytic Degradation of Volatile Organic Compounds (VOCs) over Titanium Dioxide Thin Film. In M. A. Farrukh, Adcanced Aspects of Spectroscopy (pp. 341-372). Shanghai: Intech.
Liga, M. V., Bryant, E. L., Colvin, V. L., & Li, Q. (2011). Virus inactivation by silver doped titanium dioxide nanoparticles for drinking water treatment. Water Research, 535-544.
Lindstrom, A. B., Strynar, M. J., & Libelo, E. L. (2011). Polyfluorinated Compounds: Past, Present, and Future. Environmental Science & Technology, 7954-7961.
Liu, S. X., Qu, P. Z., Han, X. W., & Sun, C. L. (2004). A mechanism for enhanced photocatalytic activity of silver-loaded titanium dioxide. Catalysis Today, 877-884.
Mboula, V. M., Hequet, V., Andres, Y., Pastrana-Martinez, L. M., Dona-Rodriguez, J. M., Silva, A. M., & Falaras, P. (2013). Photocatalytic degradation of endocrine disruptor compounds under simulated solar light. Water Research, 3997-4005.

85
Mihas, O., Kalogerakis, N., & Psillakis, E. (2007). Photolysis of 2,4-dinitrotoluene in various water solutions:effect of dissolved species. Journal of Hazardous Materials, 535-539.
Mohanty, N. R., & Wei, I. W. (1993). Oxidation of 2, 4-Dinitrotoluene using Fenton's reagent: reaction mechanisms and their practical applications. Hazardous Waste & Hazardous Materials, 171-183.
Moody, C. A., Hebert, G. N., Strauss, S. H., & Field, J. A. (2003). Occurrence and persistence of perfluorooctanesulfonate and other perfluorinated surfactants in groundwater at a fire-training area at Wurtsmith Air Force Base, Michigan, USA. Journal of Environmental Monitoring, 341-345.
Moriwaki, H., Takagi, Y., Tanaka, M., Tsuruho, K., Okitsu, K., & Maeda, Y. (2005). Sonochemical Decomposition of Perfluorooctane Sulfonate and Perfluorooctanoic Acid. Environmental Science & Technology, 3388-3392.
Nahen, M., Bahnemann, D., Dillert, R., & Fels, G. (1997). Photocatalytic Degradation of Trinitrotoluene: Reductive and Oxidative Pathways. Journal of Photochemistry and Photobiology, 191-199.
Paulescu, M., Paulescu, E., Gravila, P., & Badescu, V. (2013). Weather Modeling and Forecasting of PV Systems Operation. Springer.
Phillips, D. L. (2003). Palladium- Catalyzed Destruction of Nitro Aromatic-Contaminated Groundwater. MS, Air Force Institute of Technology.
Place, B., & Field, J. (2012). Identification of Novel Fluorochemicals in aqueous Film Forming Foams Used by the US Military. Environmental Science Technology, 7120-7127.
Pobozy, E., Krol, E., Wojcik, L., Wachowicz, M., & Trojanowicz, M. (2011). HPLC determination of perfluorinated carboxylic acids with fluorescence detection. Microchim Acta, 409-417.
Post, G. B., Cohn, P. D., & Cooper, K. R. (2012). Perfluorooctanoicacid(PFOA),anemergingdrinkingwatercontaminant: criticalreviewofrecentliterature. Environmental Research, 93-117.
Prieto-Rodriguez, L., Miralles-Cuevas, S., Oller, I., Aguera, A., Puma, G. L., & Malato, S. (2012). Treatment of emerging contaminants in wastewater treatment plants

86
(WWTP) effluents by solar photocatalysis using low TiO2 concentrations. Journal of Hazardous Materials, 131-137.
Rahman, M. F., Peldszus, S., & Anderson, W. B. (2013). Behaviour and fate of perfluoroalkyl and polyfluoroalkyl substances (PFASs) in drinking water treatment: A review. Water Research.
Rak, A., & Vogel, C. (2009). Increasing Regulation of Perfluorinated Compounds and the Potential Impacts at Air Force Installations. AFCEE Environmental Monitoring and Data Quality (EMDQ) Workshop.
Reddy, K. R., Darko-Kagya, K., & Cameselle, C. (2011). Electrokinetic-enhanced transport of lactate-modified nanoscale iron particles for degradation of dinitrotoluene in clayey soils. Separation and Purification Technology, 203-237.
Richardson, S. D. (2007). Water Analysis: Emerging Contaminants and Current Issues. Analytical Chemistry, 4295-4324.
Rodgers, J. D., & Bunce, N. J. (2001). Treatment Methods for the Remediation of Nitroaromatic Explosives, Review Paper. Water Resources, 2101-2111.
Schmelling, D., & Gray, K. (1995). Photocatalytic Transformation and Mineralization of 2, 4, 6-Trinitrotoluene (TNT) in TiO2 Slurries. Water Resources, 2651-2662.
Snellinx, Z., Taghavi, S., Vangronsveld, J., Vanek, T., & van der Lelie, D. (2002). Biological Remediation of Explosives and Related Nitroaromatic Compounds. Environ. Sci. Poll. Res. Int., 48-61.
Sobana, N., Muruganadham, M., & Swaminathan, M. (2006). Nano-Ag particles doped TiO2 for efficient photodegradation of Direct azo dyes. Journal of Molecular Catalysis A: Chemical, 124-132.
Stevens, M. R. (2004). An Evaluation of Formic Acid as an Electron Donor for Palladium (PD) Catalyzed Destruction of Nitroaromatic Compounds. MS Thesis, Air Force Institue of Technology.
Swarnakar, P., Kanel, S., Nepal, D., Jiang, Y., Jia, H., Kerr, L., . . . Rakovan, J. (2013). Silver deposited titanium Dioxide Thin Film for Photocatalysis of Organic Compounds Using Natural Light. Solar Energy, 242-249.

87
Teh, C. M., & Mohamed, A. R. (2011). Roles of titanium dioxide and ion-doped titanium dioxide on photocatalytic degradation of organic pollutants (phenolic compounds and dyes) in aqueous solutions: A review. Journal of Alloys and Compounds, 1648-1660.
Tseng, T. K., Lin, Y. S., Chen, Y. J., & Chu, H. (2010). A Review of Photocatalysts Prepared by Sol-Gel Method for. International Journal of Molecular Science, 2336-2361.
U.S. Air Force. (2011). Operational Range Assessment Program. Washington, D.C.: HQ USAF.
U.S. Air Force. (2012). Interim Air Force Guidance on Sampling and Response Actions for Perfluorinated Compounds at Active and BRAC Installations. Washington D.C.: Headquarters Air Force.
U.S. Navy. (2003). Assessment of Environmental Effects of Ordnance compounds and their transformation products in coastal ecosystems. Port Hueneme: Engineering Services Center.
Vecitis, C. D., Park, H., Cheng, J., Mader, B. T., & Hoffman, M. R. (2009). Treatment Technologies for Aqueous Perfluorooctanesulfonate (PFOS) and perfluorooctanoate (PFOA). Front. Environ. Sci. Engin. China, 129-151.
Wang, Y., & Zhang, P. (2011). Photocatalytic decomposition of perfluorooctanoic acid (PFOA) by TiO2 in the presence of oxalic acid. Journal of Hazardous Materials, 1869-1875.
Wen, D., Li, G., Xing, R., Park, S., & Rittman, B. E. (2011). 2, 4-DNT removal in intimately coupled photobiocatalysis: the roles of adsorption, photolysis, photocatalysis, and biotransformation. Applied Microbiology & Biotechnology, 263-272.
Yuan, Q., Ravikkrishna, R., & Valsaraj, K. T. (2001). Photodegradation of organic compounds in surfactant-modified titania. Separation and Purification Technology, 309-318.
Zaleska, A. (2008). Doped-TiO2: A Review. Recent Patents on Engineering, 157-164.

88
Zhao, B., & Zhang, P. (2009). Photocatalytic Decomposition of Perfluorooctanoic Acid with β-Ga2O3 Wide Bandgap Photocatalyst. Catalysis Communication, 1184-1187.

89
Vita.
Capt Mario H. Tellez was born in Guadalajara, Jalisco, Mexico. He graduated
from Santaluces High School in 1999. He then entered the University of Florida in
Gainesville, Florida. He graduated with a Bachelor of Science degree in Civil and
Coastal Engineering and a minor in Aerospace Studies and was commissioned as an Air
Force officer in May 2004. In August 2012, he entered the in the Graduate Engineering
Management program of the Graduate School of Engineering and Management, Air
Force Institute of Technology.
90
REPORT DOCUMENTATION PAGE Form Approved OMB No. 074-0188
The public reporting burden for this collection of information is estimated to average 1 hour per response, including the time for reviewing instructions, searching existing data sources, gathering and maintaining the data needed, and completing and reviewing the collection of information. Send comments regarding this burden estimate or any other aspect of the collection of information, including suggestions for reducing this burden to Department of Defense, Washington Headquarters Services, Directorate for Information Operations and Reports (0704-0188), 1215 Jefferson Davis Highway, Suite 1204, Arlington, VA 22202-4302. Respondents should be aware that notwithstanding any other provision of law, no person shall be subject to any penalty for failing to comply with a collection of information if it does not display a currently valid OMB control number. PLEASE DO NOT RETURN YOUR FORM TO THE ABOVE ADDRESS. 1. REPORT DATE (DD-MM-YYYY)
27-03-2014 2. REPORT TYPE Master’s Thesis
3. DATES COVERED (From – To) 08-23-2012 - 27-03-2014
4. TITLE AND SUBTITLE Treatment of Perfluorinated Compounds and Nitroaromatics by Photocatalysis in the Presence of Ultraviolet and Solar Light
5a. CONTRACT NUMBER
5b. GRANT NUMBER 5c. PROGRAM ELEMENT NUMBER
6. AUTHOR(S)
Tellez, Mario H., Captain, USAF
5d. PROJECT NUMBER
5e. TASK NUMBER
5f. WORK UNIT NUMBER
7. PERFORMING ORGANIZATION NAMES(S) AND ADDRESS(S) Air Force Institute of Technology Graduate School of Engineering and Management (AFIT/ENV) 2950 Hobson Way, Building 640 Wright-Patterson AFB OH 45433-7765
8. PERFORMING ORGANIZATION REPORT NUMBER AFIT-ENV-14-M-64
9. SPONSORING/MONITORING AGENCY NAME(S) AND ADDRESS(ES) AFCEC/CZTQ Water Quality Larry K. Isaacs, PhD, PE Lackland, TX 78236-9853 210-395-8422, DSN 969-8422; [email protected]
10. SPONSOR/MONITOR’S ACRONYM(S) AFIT-ENV-14-M-64 11. SPONSOR/MONITOR’S REPORT NUMBER(S)
12. DISTRIBUTION/AVAILABILITY STATEMENT Distribution Statement A. Approved for Public Release; Distribution Unlimited.
13. SUPPLEMENTARY NOTES The material is declared a work of the U.S. Government and is not subject to copyright protection in the United States.
14. ABSTRACT Nitroaromatic compounds (NACs) and perfluorinated compounds (PFCs) are two classes of water contaminants of DoD concern due to their risk to the environment, personnel, and mission. This study investigated the potential of an innovative technology, oxidation using titanium dioxide (TiO2) and TiO2 doped with silver (Ag-TiO2) as photocatalysts, to effectively and energy efficiently treat NAC and PFC-contaminated water. Three model contaminants, 2,4-DNT (NAC), and PFOA and PFOS (PFCs), were degraded using TiO2 and Ag-TiO2 immobilized on glass slides under sunlight and UV light in atmospheric conditions and at neutral pH. 2,4-DNT degraded 14% and 15% in the presence of Ag-TiO2 and TiO2, respectively, under sunlight after 8 hours. After 8 hours under UV light, 2,4-DNT degraded 13% and 29% in the presence of Ag-TiO2 and TiO2, respectively. Results indicate that PFOA and PFOS do not degrade under the conditions of the experiment. Further study is needed to investigate the viability of the technology to treat NAC- and PFC-contaminated water.
15. SUBJECT TERMS
Nitroaromatics, Perfluorinated Compounds, Photocatalysis, Titanium Dioxide, Thin Films, Water Treatment, Water Contamination
16. SECURITY CLASSIFICATION OF: 17. LIMITATION OF ABSTRACT
UU
18. NUMBER OF PAGES
104
19a. NAME OF RESPONSIBLE PERSON Dr. Mark N. Goltz, AFIT/ENV
a. REPORT
U b. ABSTRACT
U c. THIS PAGE
U 19b. TELEPHONE NUMBER (Include area code) (937) 255-3636 x4638 [email protected]
Standard Form 298 (Rev. 8/98) Prescribed by ANSI Std. Z39-18