treatment process intensification for sustainable ... · treatment process intensification for...
TRANSCRIPT

Treatment Process Intensification for Sustainable Biological Nutrient Removal
Pusker RegmiVail Operator Training Seminar
13 October, 2016

Sustainability Goals
Energy reduction
Effluent quality goals
Reduction in chemical input
Treatment intensification
Sustainable
Wastewater
Treatment

Process Intensification
Brown and Caldwell 3
Reduction of:• Physical footprint
• Chemical use
• Energy demand
• Carbon footprint
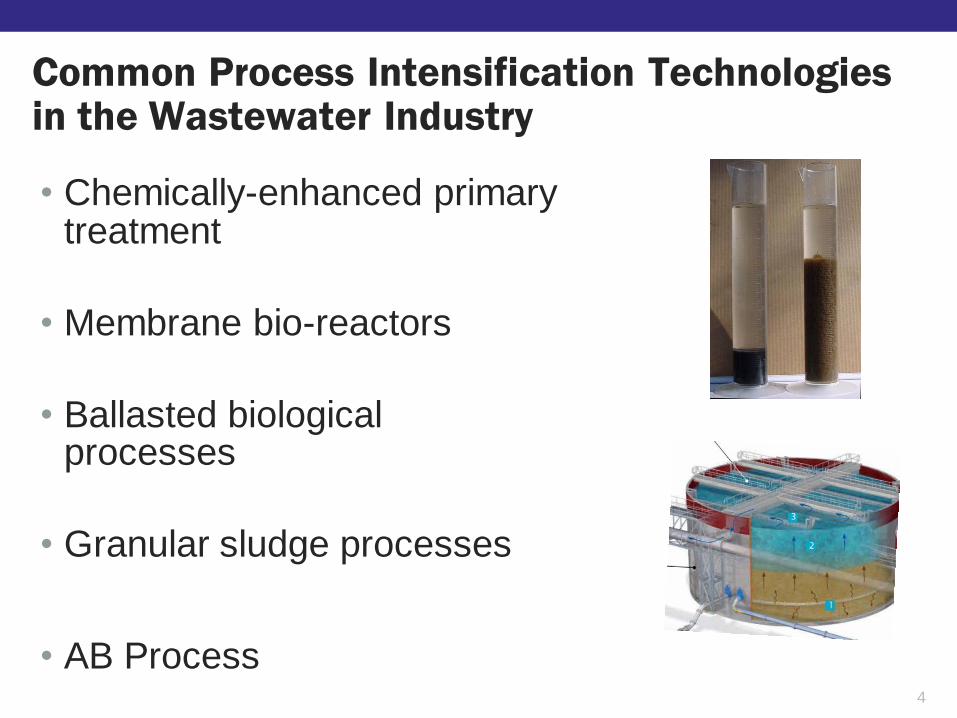
• Chemically-enhanced primary treatment
• Membrane bio-reactors
• Ballasted biological processes
• Granular sludge processes
• AB Process
Common Process Intensification Technologies in the Wastewater Industry
4
• Chemically-enhanced primary treatment
• Membrane bio-reactors
• AB process
• Ballasted biological processes
• Granular sludge processes
Common Process Intensification Technologies in the Wastewater Industry
5

AB process Advanced aeration control and shortcut nitrogen removal
6

Carbon Management
Brown and Caldwell 7
Carbon re-direction N removal
Inf. Carbon
Anaerobic Digestion
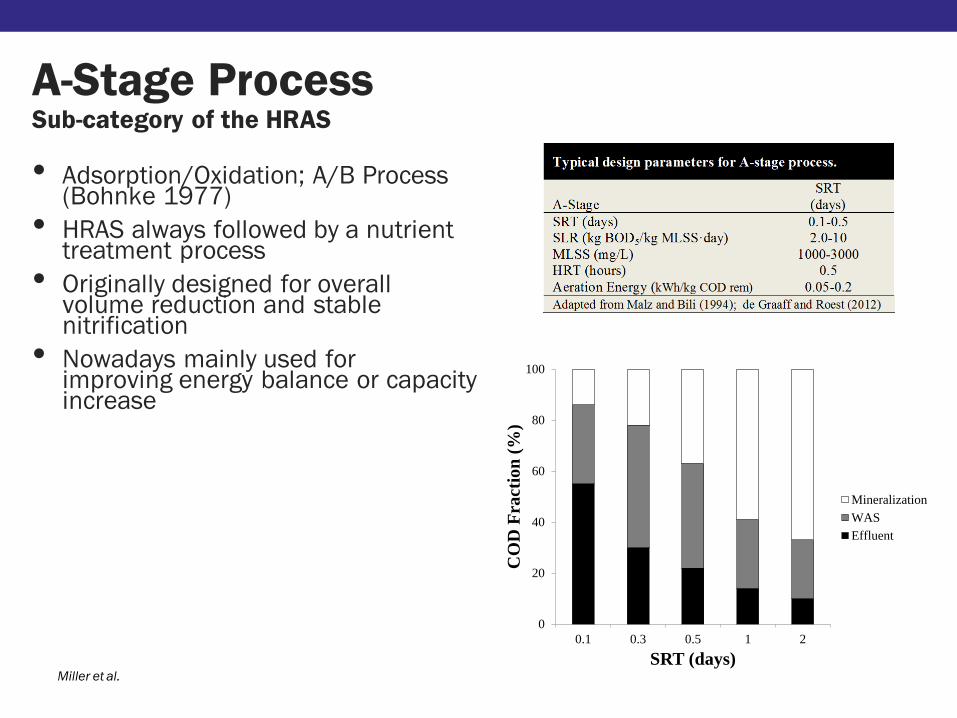
• Adsorption/Oxidation; A/B Process (Bohnke 1977)
• HRAS always followed by a nutrient treatment process
• Originally designed for overall volume reduction and stable nitrification
• Nowadays mainly used for improving energy balance or capacity increase
A-Stage Process Sub-category of the HRAS
0
20
40
60
80
100
0.1 0.3 0.5 1 2
CO
D F
ract
ion
(%
)
SRT (days)
Mineralization
WAS
Effluent
Miller et al.

A/B Configuration Captures More Organics
9
Conventional scheme PT+AS
A/B scheme + side stream treatment
Modified from Wett et al.
100% PT AS
0%
CO
D3
3%
CO
D
8%
N15
% N
67% COD; 107% N
40
% C
OD
69
% N
24
% C
OD
18
% N
3% COD; 20% N
COD:N = 12 COD:N = 7
100% A-stage B-stage
6%
CO
D5
4%
CO
D
22
% N2
% N
40% COD; 80% N
20
% C
OD
48
% N
17
% C
OD
12
% N
3% COD; 20% N
COD:N = 12 COD:N = 6

The Way
Brown and Caldwell 10
C-redirectionShortcut Nitrogen Removal
Anaerobic
Digestion
Maximum energy
recovery from
concentrated organics
Minimum energy and chemical
consumption of remaining C and N
polishing
Biogas
Sludge

A/B Process
11
RAS WAS
AERPCL ANX AER SCL
MLR
RAS
B-stage
WAS
A-stage
TN 15-18 mg/L
Advantages Disadvantages
Increased sludge production Chemical addition for P removal
Redirect carbon for energy recovery B-stage is C limited
Low aeration energy requirement A-stage lacks process control
Lower overall volume (or increased removal
capacity)
B-stage needs carbon-efficient nitrogen removal!
Advanced aeration control with short-cut nitrogen
removal?

Ammonium-based Aeration Control (ABAC)
12
Controller
NH4-N
Control Algorithm
Blower
DO

Nitrification Kinetics
0 0.5 1 1.5 2 2.5 3 3.5 4
Nit
rifi
ca
tion
ra
te
Dissolved Oxygen (mg/L)

Ammonia based aeration control
7:40 AM 11:16 AM 2:52 PM 6:28 PM 10:04 PM 1:40 AM 5:16 AM
Air
flo
w r
ate
Am
mo
nia
Lo
ad
Ammonia Load Airflow rate

Limiting aeration
Reducing effluent ammonia peaks
Objectives of ABAC
15

Ammonia vs Nox (AvN) Control
Regmi et al., 2014 16
Aer
ob
ic F
ract
ion
0.0
0.1
0.2
0.3
0.4
0.5
0.6
0.7
0.8
0.9
1.0
Nit
rog
en (
mg
/L)
0
2
4
6
8
10
Aerobic Fraction
NH4-N
NOx-N
24-hour
Dis
solv
ed O
xyg
en (
mg
/L)
0.0
0.5
1.0
1.5
2.0
2.5
3.0
3.5
4.0
DO
1-hour
Dis
soved
Ox
ygen
(m
g/L
)
0.0
0.5
1.0
1.5
2.0
D.O.NO2-NNO3-N
NH4-N
Aerobic Duration
Controller/PLC
DOController/
PLC
DO = set point
NH4-N - NOx-N = setpoint
MAirS

Inflection Point:
Lowest TN @ Lowest
Energy
Optimum Nitrogen Removal
AEROBIC ANOXIC/ANAEROBIC
Grady et al (2011) Biological Wastewater Treatment, 3rd Edition
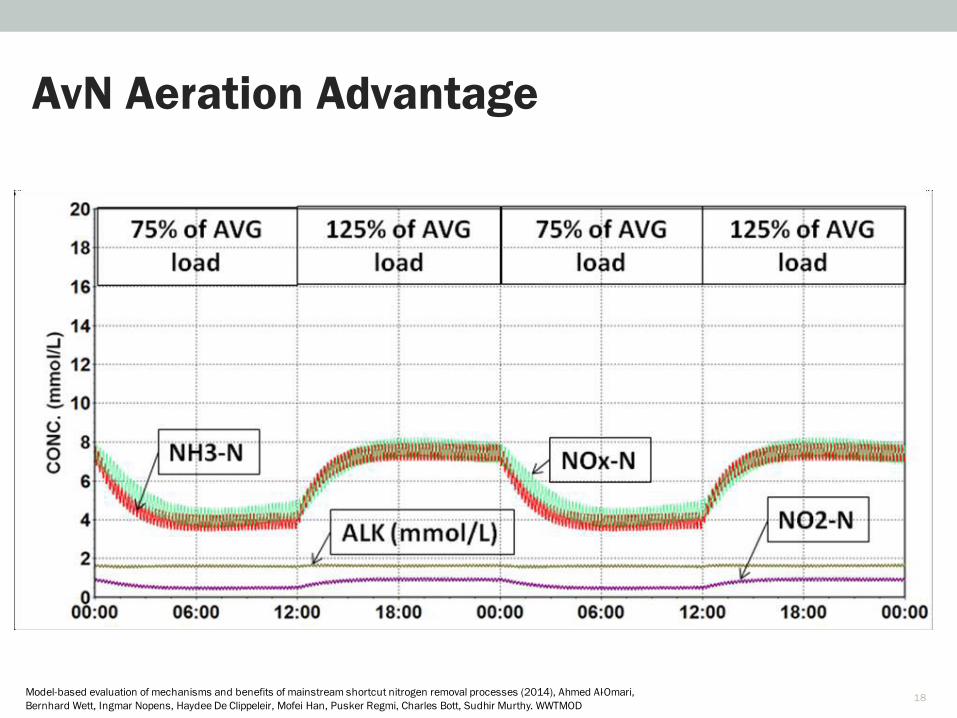
AvN Aeration Advantage
18Model-based evaluation of mechanisms and benefits of mainstream shortcut nitrogen removal processes (2014), Ahmed Al-Omari,
Bernhard Wett, Ingmar Nopens, Haydee De Clippeleir, Mofei Han, Pusker Regmi, Charles Bott, Sudhir Murthy. WWTMOD
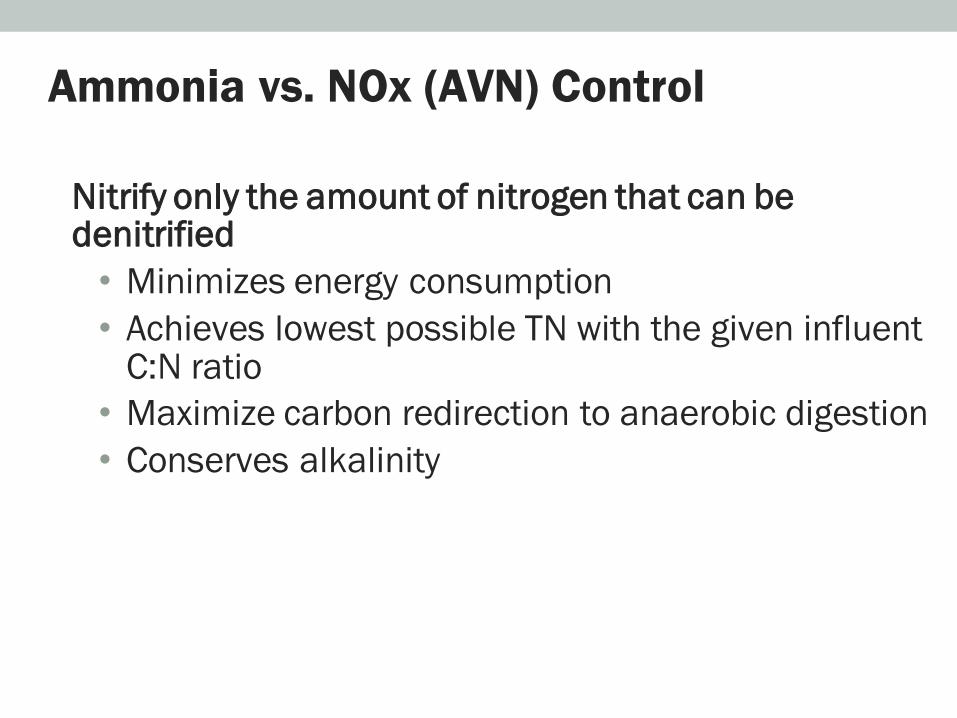
Ammonia vs. NOx (AVN) Control
Nitrify only the amount of nitrogen that can be denitrified
• Minimizes energy consumption
• Achieves lowest possible TN with the given influent C:N ratio
• Maximize carbon redirection to anaerobic digestion
• Conserves alkalinity
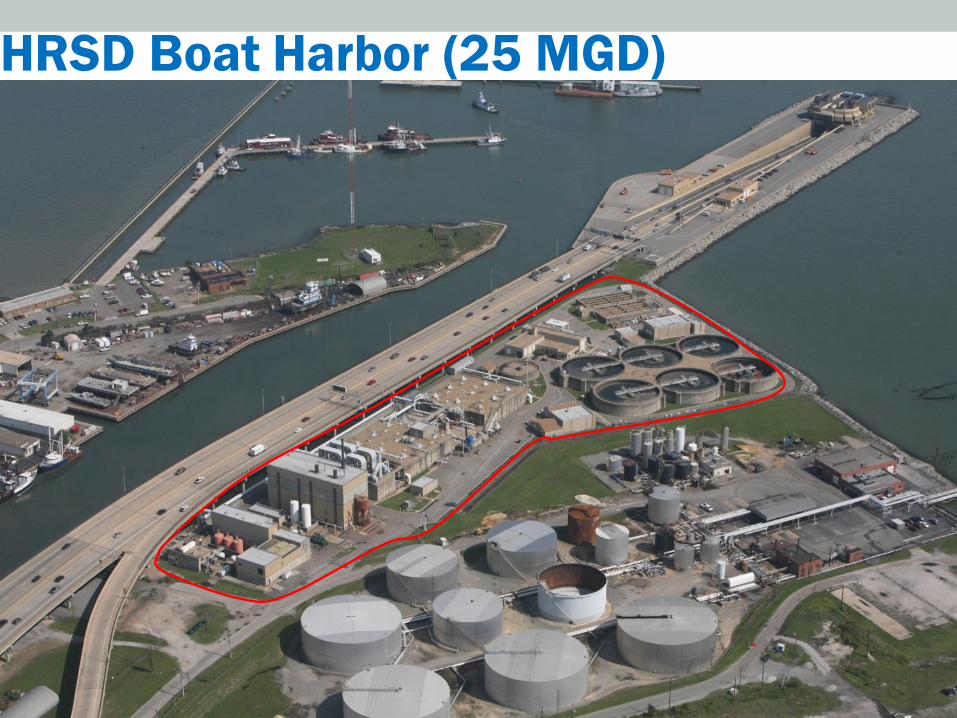
HRSD Boat Harbor (25 MGD)
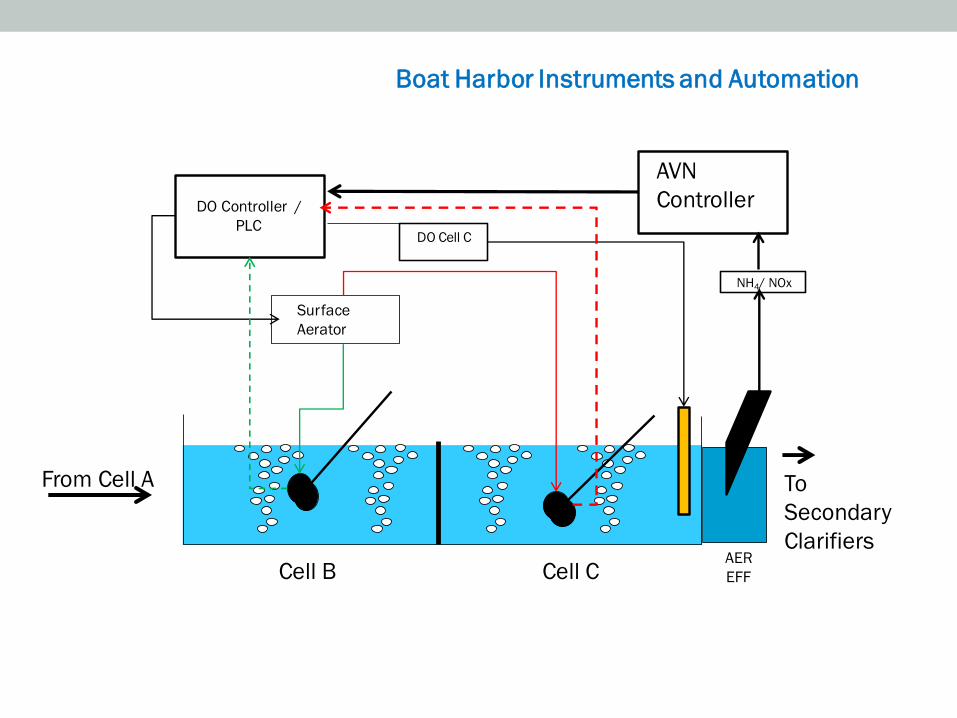
To
Secondary
Clarifiers
From Cell A
AVN
ControllerDO Controller /
PLC
NH4/ NOx
DO Cell C
Boat Harbor Instruments and Automation
Cell B Cell CAER
EFF
Surface
Aerator
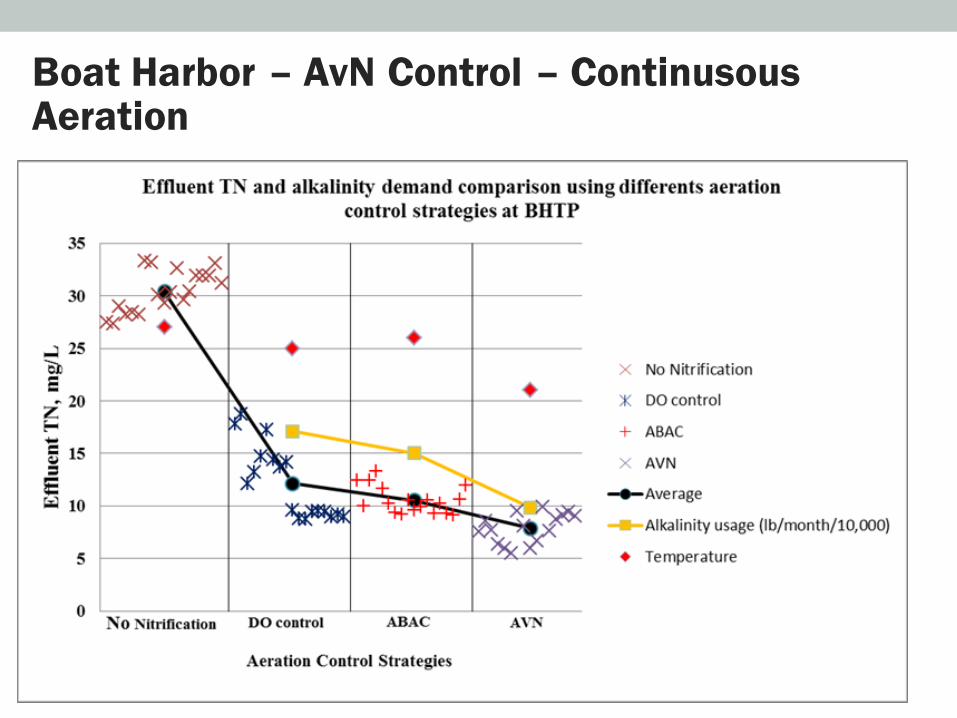
Boat Harbor – AvN Control – ContinusousAeration

Mainstream shortcut nitrogen removal approaches and control strategies
23
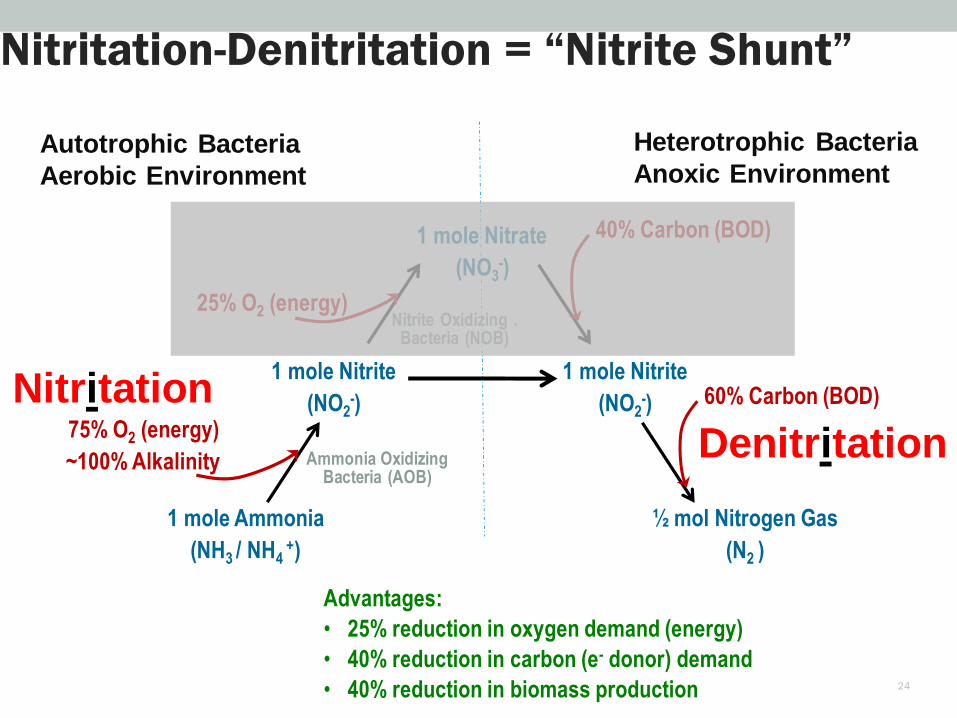
Nitritation-Denitritation = “Nitrite Shunt”
1 mole Ammonia
(NH3 / NH4 +)
½ mol Nitrogen Gas
(N2 )
1 mole Nitrite
(NO2-)
1 mole Nitrite
(NO2-)
1 mole Nitrate
(NO3-)
Autotrophic Bacteria
Aerobic Environment
Heterotrophic Bacteria
Anoxic Environment
75% O2 (energy)
~100% Alkalinity
25% O2 (energy)
40% Carbon (BOD)
60% Carbon (BOD)
Ammonia Oxidizing Bacteria (AOB)
Nitrite Oxidizing .Bacteria (NOB)
Advantages:
• 25% reduction in oxygen demand (energy)
• 40% reduction in carbon (e- donor) demand
• 40% reduction in biomass production 24
Nitritation
Denitritation

Partial Nitritation-Anammox = “Deammonification”
1 mole Ammonia
(NH3 / NH4 +)
½ mol Nitrogen Gas (N2 ) +
a little bit of nitrate (NO3-)
0.5 mole Nitrite
(NO2-)
Autotrophic Bacteria
Aerobic Environment
Autotrophic Anoxic
Environment37% O2 (energy)
~50% Alkalinity Ammonia Oxidizing Bacteria (AOB)
Advantages:
• 63% reduction in oxygen demand (energy)
• Nearly 100% reduction in carbon demand
• 80% reduction in biomass production
• No additional alkalinity required
ANAMMOX“Anaerobic” Ammonia Oxidation - (New Planctomycete - Strous et al, 1999)
NH4+ + 1.32 NO2
- + 0.066 HCO3- + 0.13 H+
0.26 NO3- + 1.02N2 + 0.066 CH2O0.5N0.15 + 2.03 H2O
25
AnAOB = Anammox
Nitrite Oxidizing Bacteria (NOB)
AOB and NOB 1)share a synergistic relationship2) Are adapted in similar conditions Nitrite
rarely accumulates in the environment (Nature is with NOB)
BNR plants thus far are operated to avoid nitrite accumulation No knowledge on deliberate out-selection of NOB in a mainstream process
Nitrobacter ssp. was thought to be the dominant NOB in BNR plants Very little is known about NOB especially the more prevalent Nitrospira spp.
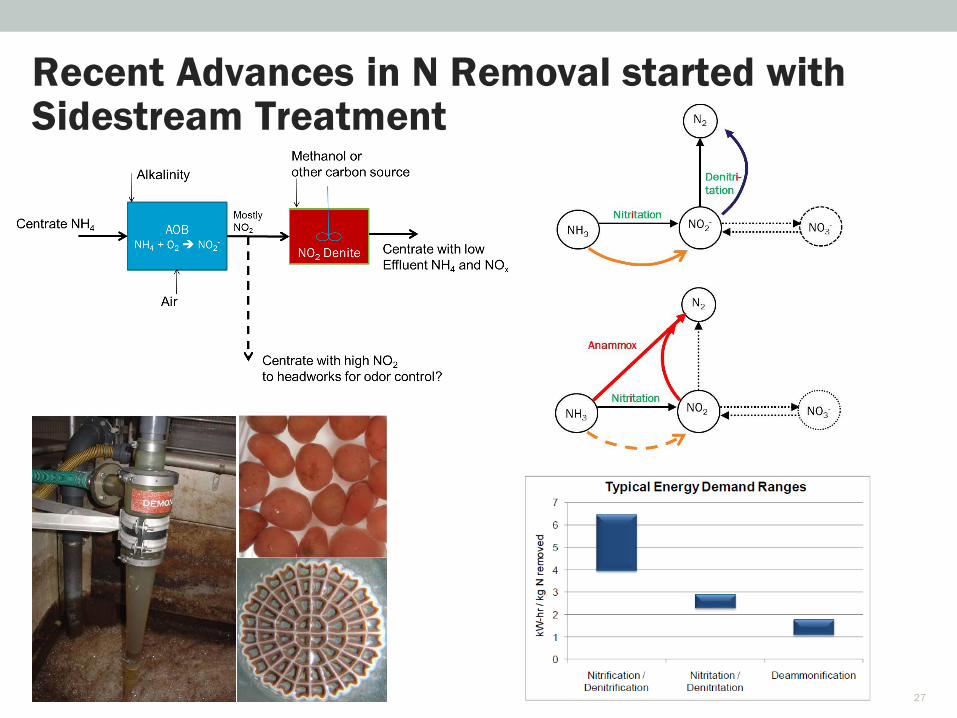
Recent Advances in N Removal started with Sidestream Treatment
27

Drivers for Mainstream Shortcut N Removal
• Eliminate External Carbon
• Energy• decreases aeration demand for N removal
• decreases aerobic COD oxidation
• diverts wastewater carbon for energy production
• Intensification• carbon diversion = much smaller aeration tank volume
required

Mainstream Short-cut Nitrogen Removal: Case Study
29

HRSD’s Approach
RAS
WAS
AER PCL
A-stage
HRAS
SCL
RAS
AER AER AER
IMLR
ANX
B-stage(AvN+)
AER
WAS
AvN Anammox MBBR
AER AER
Regmi et al. (2014)
Carbon redirection Nitrite-shunt Nitrogen
Polishing
Pilot Plant is Located in Hampton Roads Sanitation District’s
Chesapeake Elizabeth Treatment Plant, Virginia Beach.

A/B Process Pilot
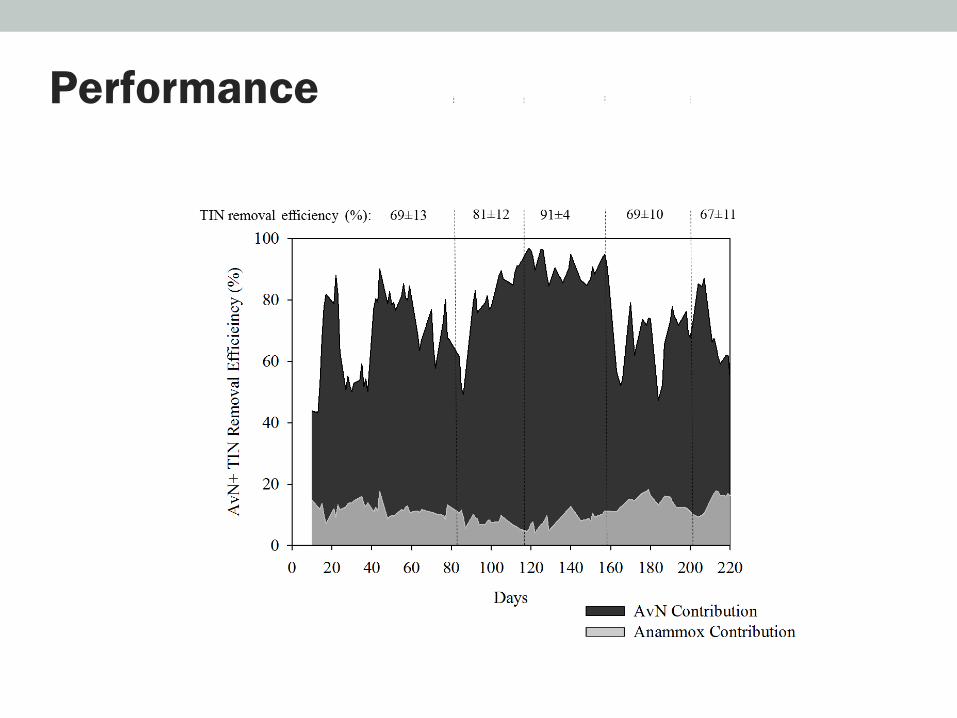
Performance
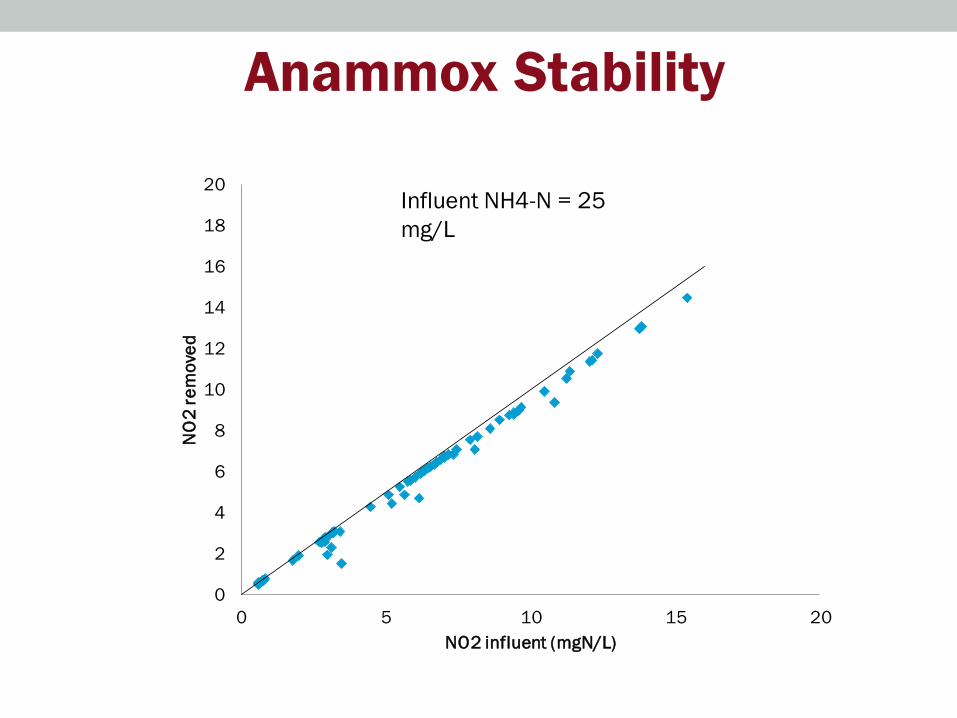
Anammox Stability
0
2
4
6
8
10
12
14
16
18
20
0 5 10 15 20
NO
2 r
em
ove
d
NO2 influent (mgN/L)
Influent NH4-N = 25
mg/L
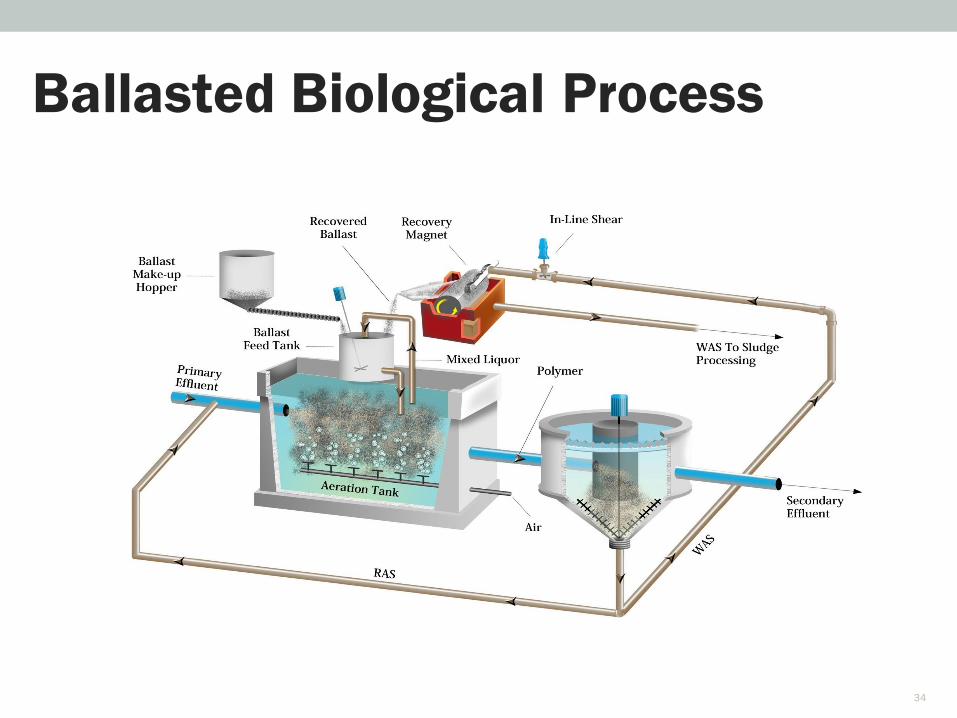
Ballasted Biological Process
34
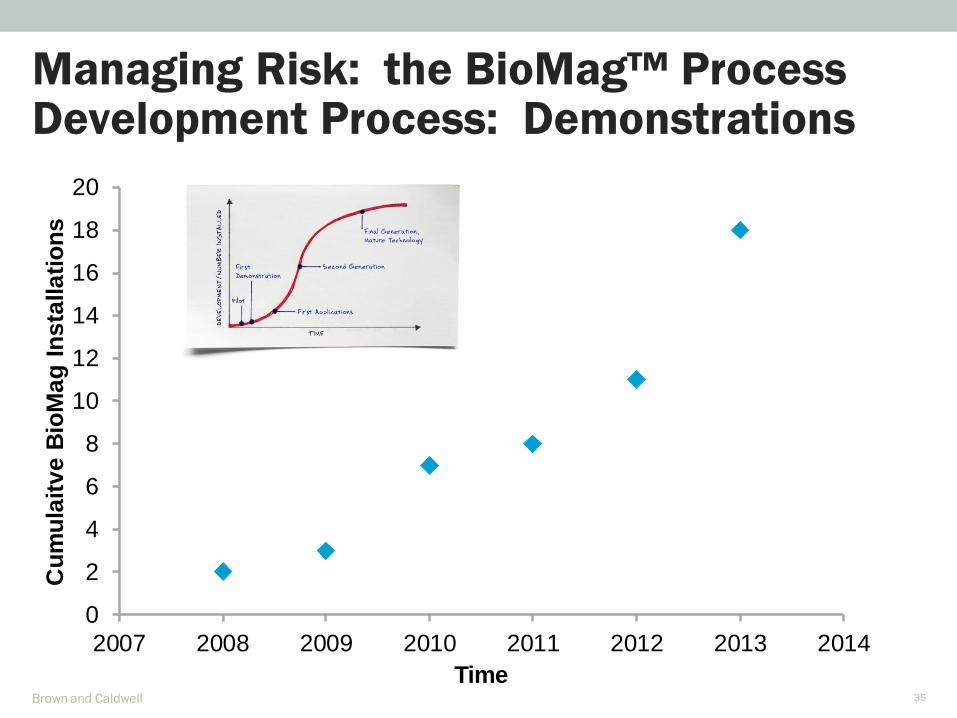
Managing Risk: the BioMag™ Process Development Process: Demonstrations
Brown and Caldwell 35
0
2
4
6
8
10
12
14
16
18
20
2007 2008 2009 2010 2011 2012 2013 2014
Cu
mu
lait
ve
Bio
Ma
g I
ns
talla
tio
ns
Time
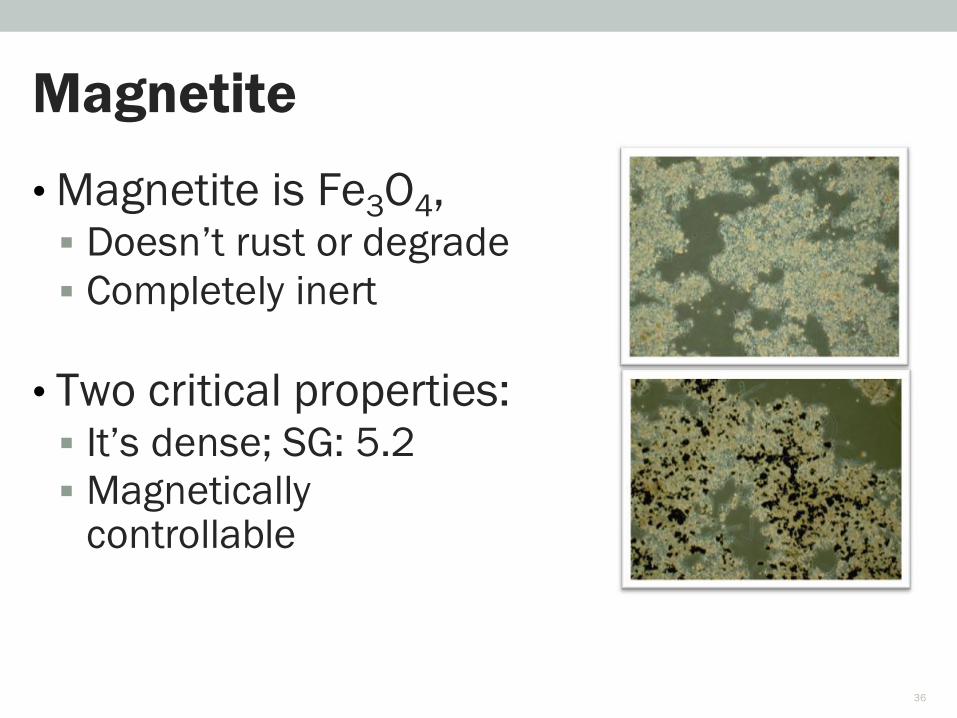
• Magnetite is Fe3O4, Doesn’t rust or degrade
Completely inert
• Two critical properties: It’s dense; SG: 5.2
Magnetically controllable
Magnetite
36

BioMag ProcessProcess Equipment
37
Recovery Drum
Make-up Tank & Return Pump
Magnetite Silo

BioMag Floc
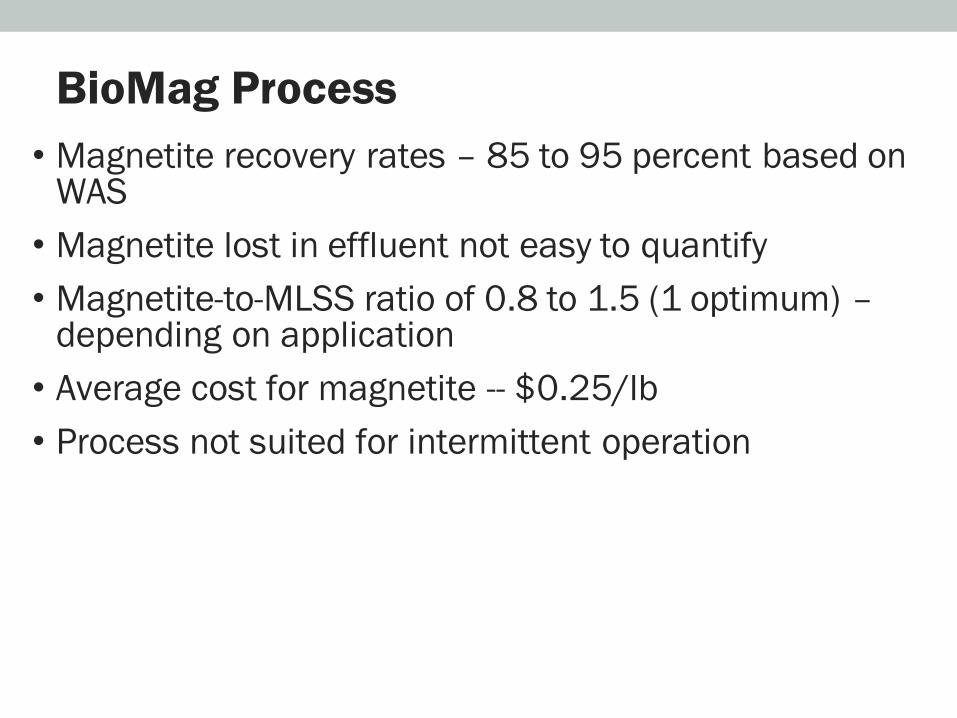
BioMag Process
• Magnetite recovery rates – 85 to 95 percent based on WAS
• Magnetite lost in effluent not easy to quantify
• Magnetite-to-MLSS ratio of 0.8 to 1.5 (1 optimum) –depending on application
• Average cost for magnetite -- $0.25/lb
• Process not suited for intermittent operation

Things to Monitor/Application Issues
• Conveyance of sludge
• Mixing requirements
• Mixed liquor stratification
• Alpha values
• Wear of equipment
• Alkalinity/pH response
• Role and dose of coagulants
• Foaming
• Biosolids

BioMag Performance – Sturbridge, MA
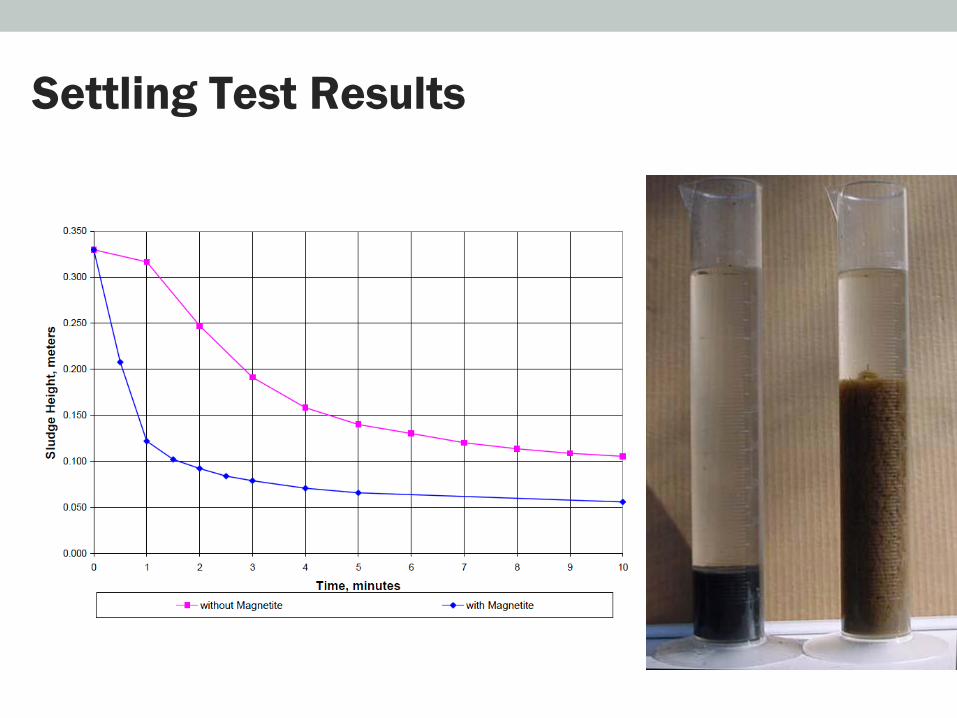
Settling Test Results

MLSS and Magnetite Concentration
0
20
40
60
80
100
120
12/24/07 1/13/08 2/2/08 2/22/08 3/13/08 4/2/08 4/22/08
Cla
rifi
er
SL
R,
lb/d
ay-s
f
Date
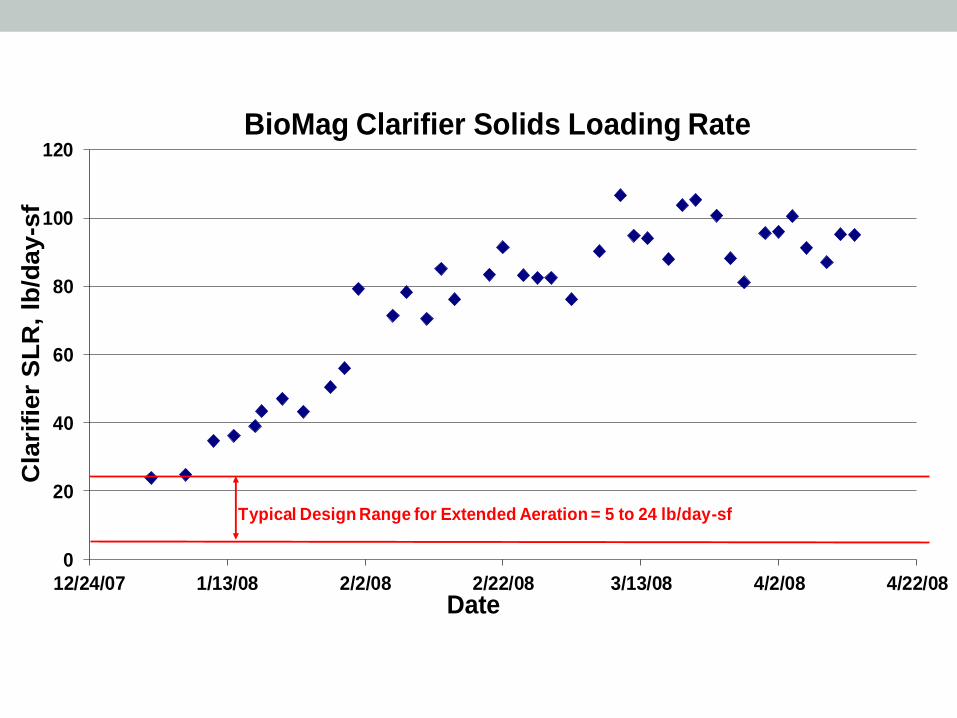
BioMag Clarifier Solids Loading Rate
Typical Design Range for Extended Aeration = 5 to 24 lb/day-sf

Nitrogen Removal Performance
0.01
0.10
1.00
10.00Ef
flu
en
t N
itro
gen
Sp
eci
es
(mg/
L)
NH4 NO2 NO3
0
0.2
0.4
0.6
0.8
1
1.2
1.4
12/24/07 1/13/08 2/2/08 2/22/08 3/13/08 4/2/08 4/22/08
Eff
luen
t T
P, m
g/L
Date
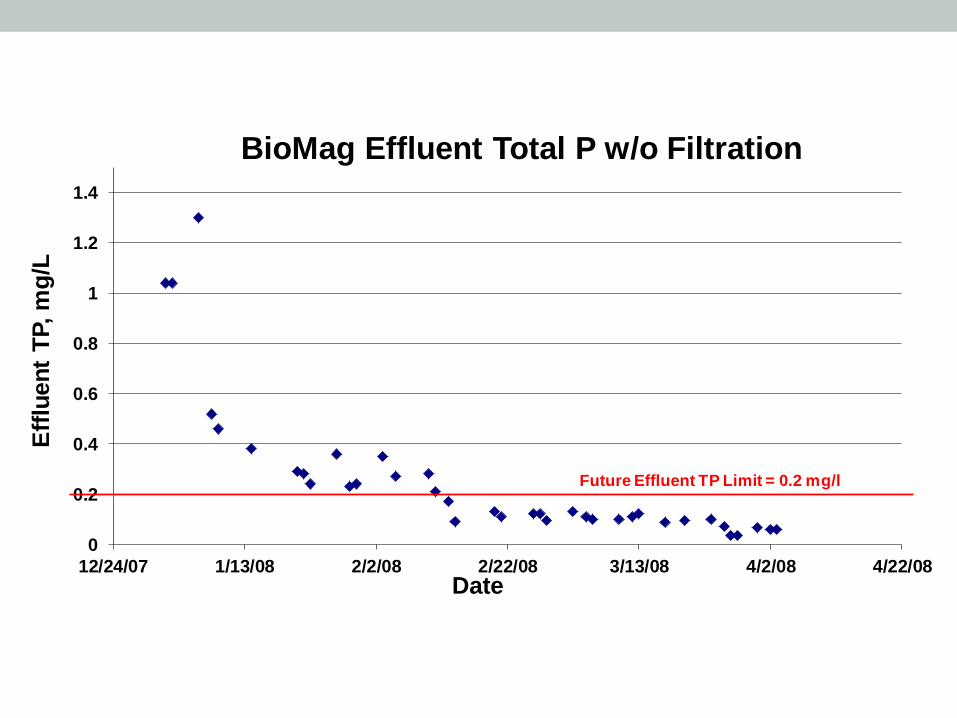
BioMag Effluent Total P w/o Filtration
Future Effluent TP Limit = 0.2 mg/l

• St. Mary’s County Metropolitan Commission
• Currently meets BNR requirements for TN of less than 10 mg/L
• It has a rated capacity of 6 MGD AADF
• In August 2015, plant needs to meet ENR requirements
• ENR limit TN and TP goals of 73,093 lb/year and 5,483 lb/year
Marlay Taylor WRF
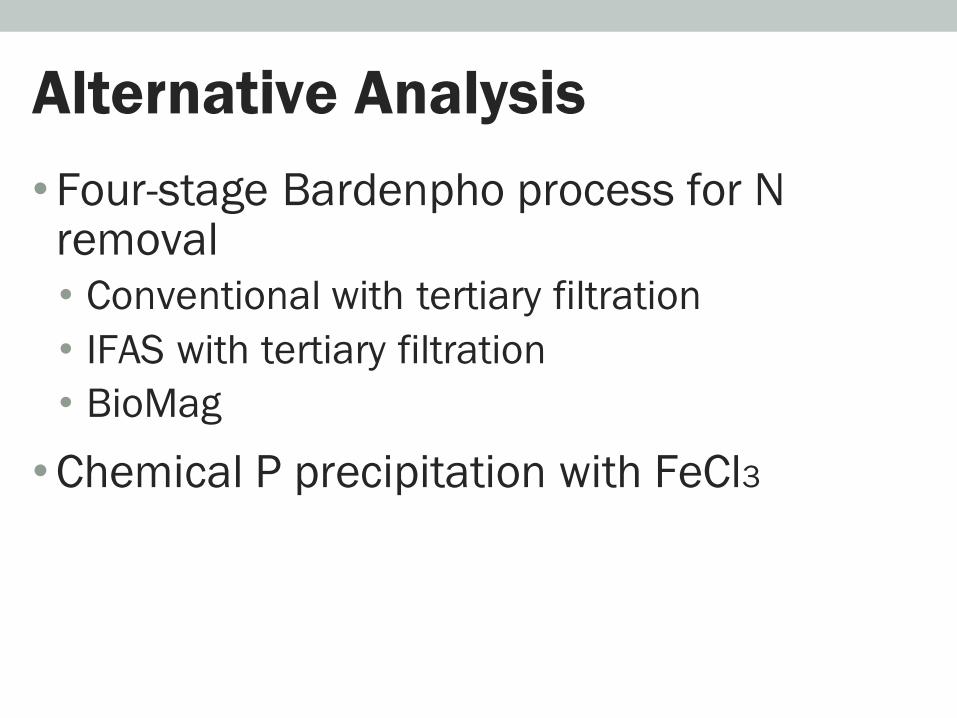
•Four-stage Bardenpho process for N removal
• Conventional with tertiary filtration
• IFAS with tertiary filtration
• BioMag
•Chemical P precipitation with FeCl3
Alternative Analysis
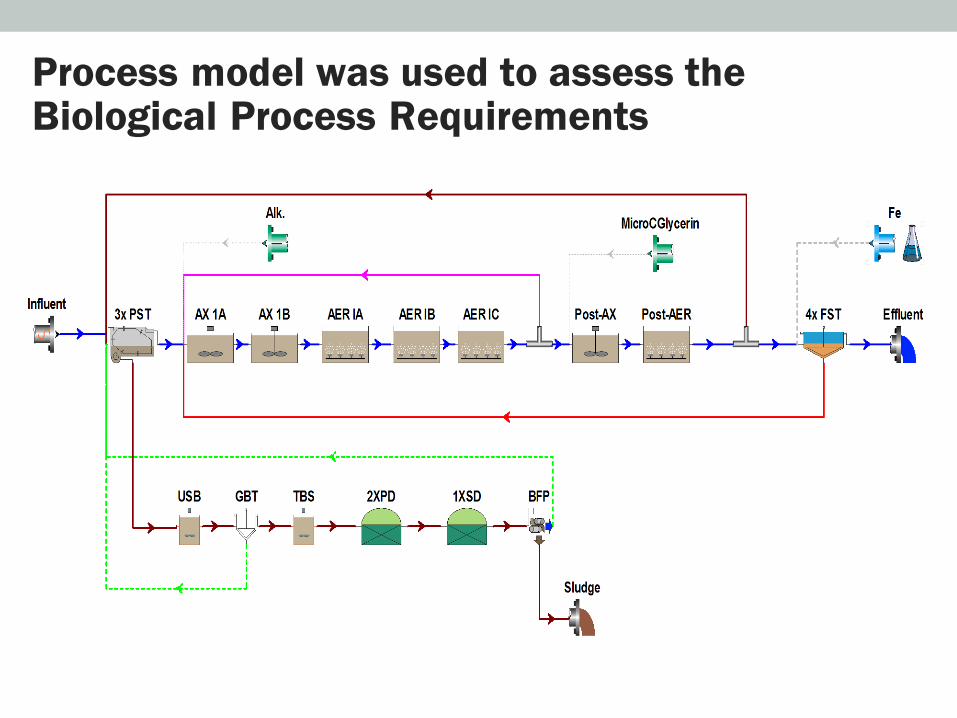
Process model was used to assess the Biological Process Requirements

Marlay Taylor – Differential NPV Comparison

Aerobic Granular Sludge

Aerobic Granulation
• A biological process in which slow-growing populations (nitrifiers, polyphosphate-accumulating organisms, and anaerobic ammonia oxidizers) can be maintained within a fast-settling particles
• Established by applying high substrate gradients, a certain degree of shear stress, and selection of fast-settling particles.
• Most importantly: natural (bio-)physical phenomenonNot triggered by gene expressions / quorum sensing / etc… of
bacteria to grow in granules.

Barriers for wide-scale adoption?
• Internal settling selection requires continuous washout of slow-settling biomass to maintain granular sludge elevated effluent suspended solids levels purposefully built, post-treatment unit.
• Minimum critical settling velocity (vmin) > 10 m hr-1 (to select and retain only fast-settling particles)
• Unique reactor design (tall SBRs)
•restricts existing plant retrofits
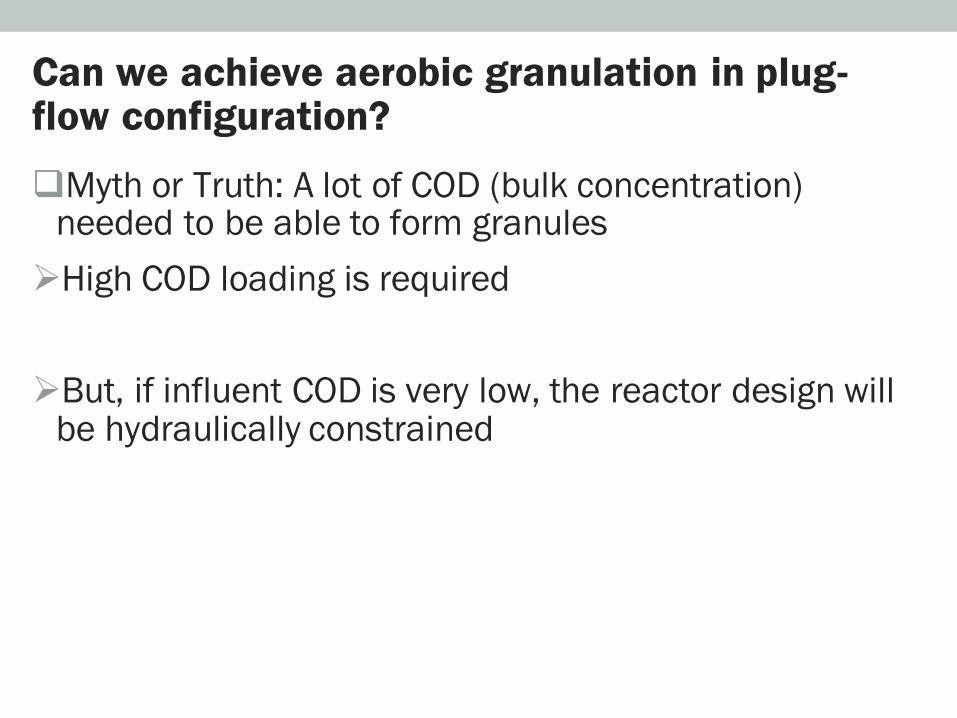
Can we achieve aerobic granulation in plug-flow configuration?
Myth or Truth: A lot of COD (bulk concentration) needed to be able to form granules
High COD loading is required
But, if influent COD is very low, the reactor design will be hydraulically constrained

WERF Project
Balancing Flocs and Granules For Activated Sludge Process Intensification in Plug Flow Configurations
55
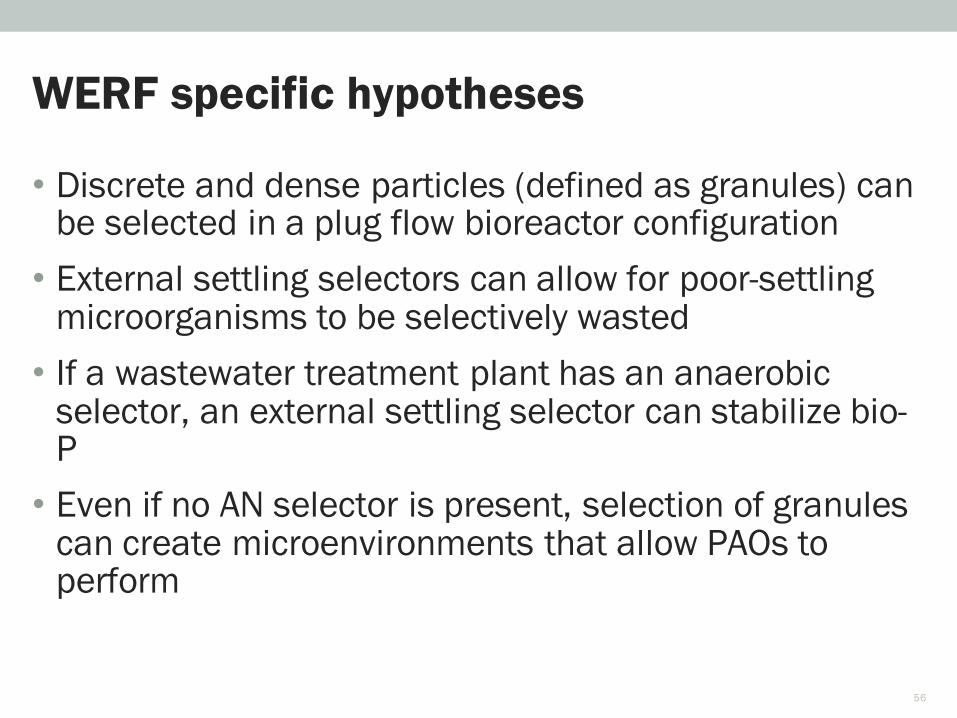
• Discrete and dense particles (defined as granules) can be selected in a plug flow bioreactor configuration
• External settling selectors can allow for poor-settling microorganisms to be selectively wasted
• If a wastewater treatment plant has an anaerobic selector, an external settling selector can stabilize bio-P
• Even if no AN selector is present, selection of granules can create microenvironments that allow PAOs to perform
WERF specific hypotheses
56
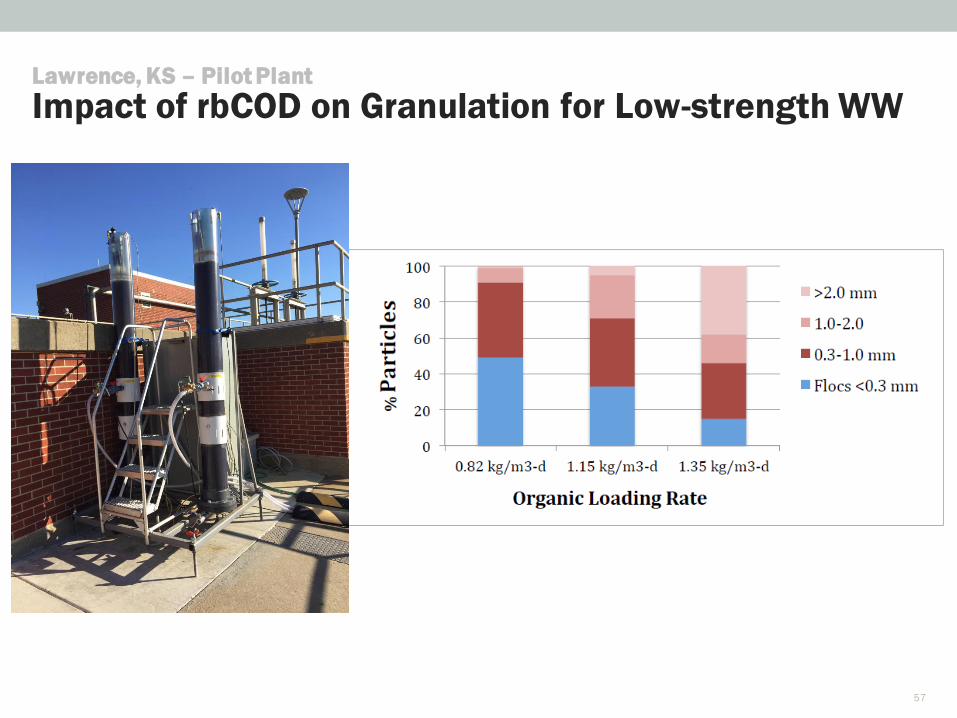
Lawrence, KS – Pilot Plant
Impact of rbCOD on Granulation for Low-strength WW
57
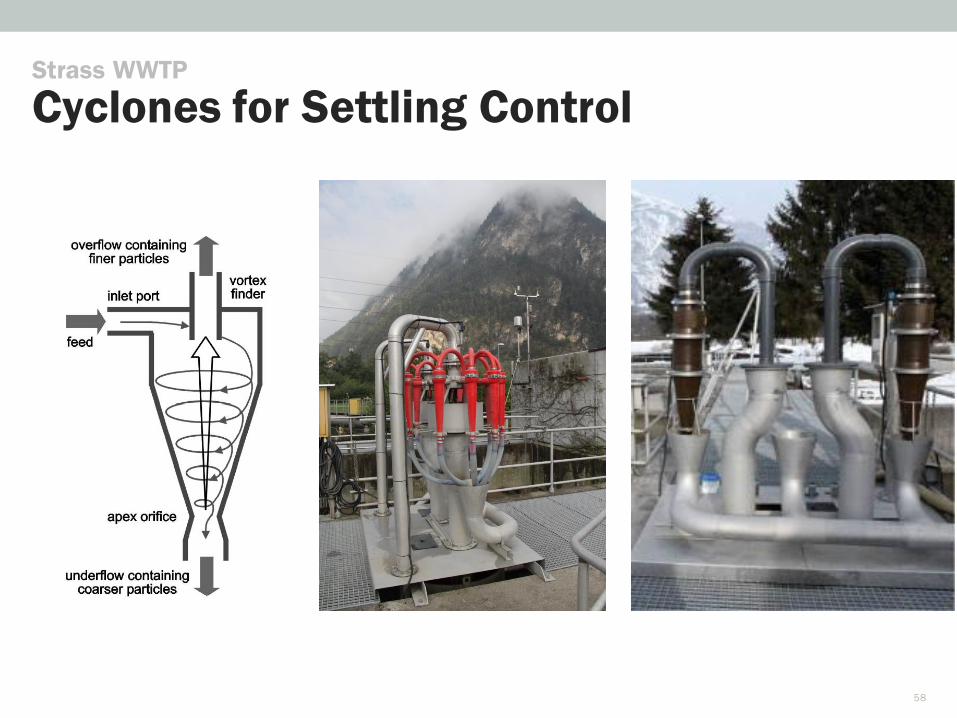
Strass WWTP
Cyclones for Settling Control
58

Strass WWTP – 10 Year SVI Profile
0
50
100
150
200
250Jan-96
Jul-96
Jan-97
Jul-97
Jan-98
Jul-98
Jan-99
Jul-99
Jan-00
Jul-00
Jan-01
Jul-01
Jan-02
Jul-02
Jan-03
Jul-03
Jan-04
Jul-04
Jan-05
Jul-05
SVI B-stage
SVI (
ml/
g)
Wett, et al.
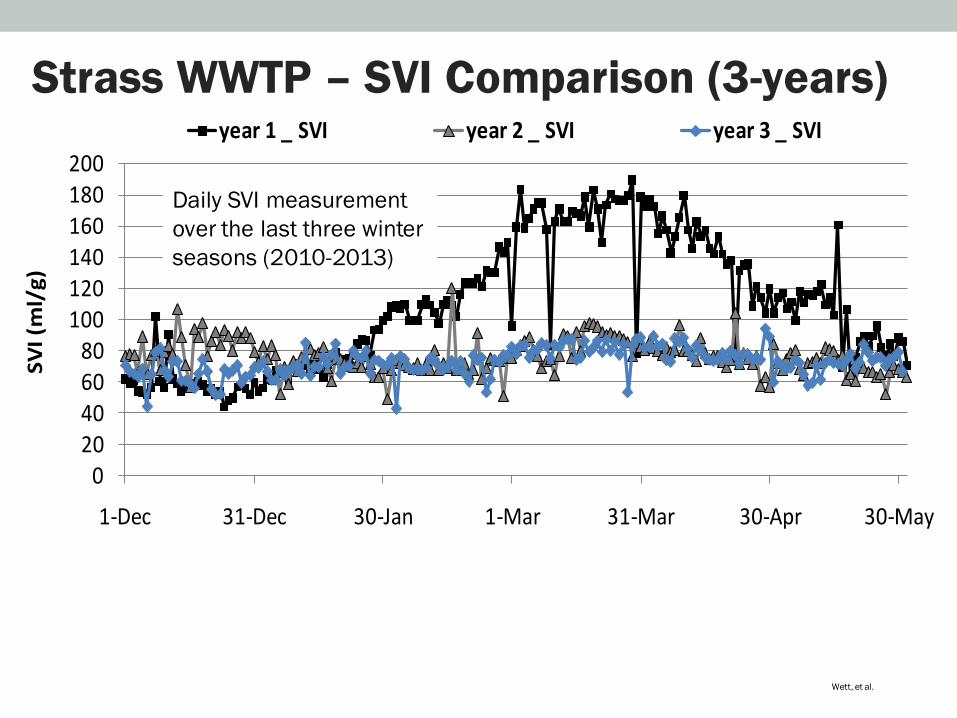
Strass WWTP – SVI Comparison (3-years)
020406080
100120140160180200
1-Dec 31-Dec 30-Jan 1-Mar 31-Mar 30-Apr 30-May
year 1 _ SVI year 2 _ SVI year 3 _ SVI
SV
I (m
l/g
)
Daily SVI measurement
over the last three winter
seasons (2010-2013)
Wett, et al.
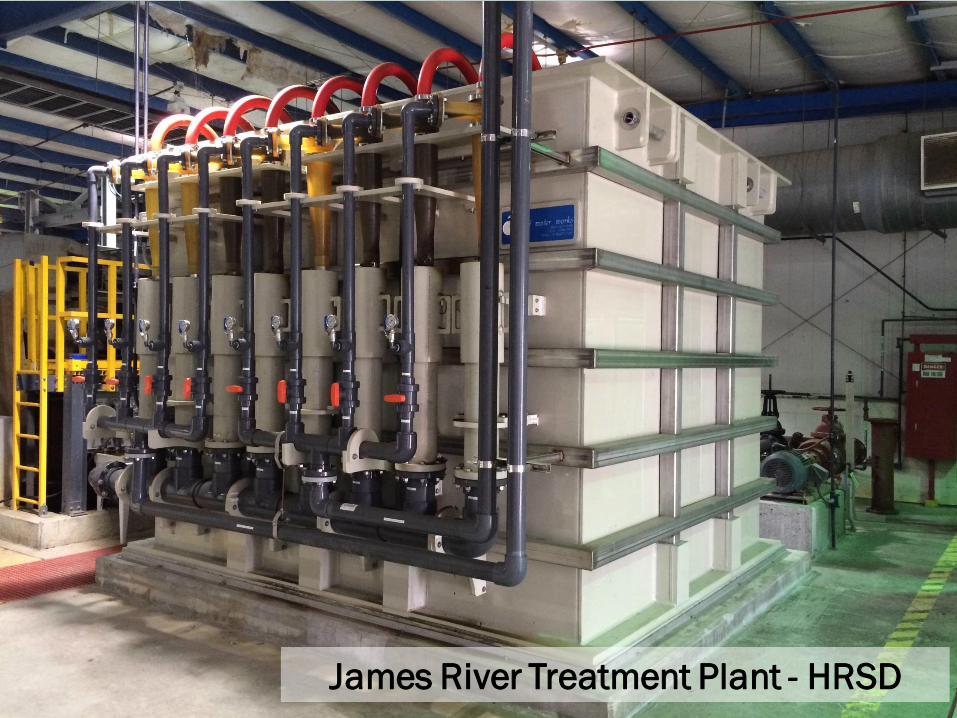
James River Treatment Plant - HRSD

Strass WWTP – Settleability Comparison (3 min)
FEED
OVERFLOW
UNDERFLOW
OVERFLOWFEED UNDERFLOW
Wett, et al.

Strass WWTP – Settleability Comparison (3 min)
0
100
200
300
400
500
600
700
800
900
1000
0 5 10 15 20 25 30
H(feed) H(OF) H(UF)
time (min)
slu
dge
volu
me
(ml)
FEED
OVERFLOW
UNDERFLOW
Wett, et al.
• AB process is an intensification technology• It requires advanced aeration control and/or shortcut nitrogen
removal to meet low TN limits
• Ballasted floc technology increases the capacity of treatment within the existing footprint.• Intensive O&M is required in the long-term
• Granular sludge presents a possibility of combined N and P removal in small footprint• Granulation within the existing infrastructure and low influent
carbon still remains a challenge
Take Home
Brown and Caldwell 64
