treatment time / mu calculation in...
TRANSCRIPT

Maria Rosa Malisan
School on Medical Physics for Radiation Therapy: Dosimetry and Treatment Planning for Basic and Advanced Applications
Trieste - Italy, 27 March-7 April 2017
Maria Rosa Malisan
Treatment Time / MU calculation in RT

Clinical Dose Calculations
Computing absorbed doses in a patient using data measured in a phantom has been the standard of practice in radiotherapy (RT).
This is because direct measurement of absorbed doses in a patient is impractical and often impossible.
Therefore, the treatment planning has to be based on calculation models.
Even if direct measurements were possible, it would still be much more practical and convenient to perform planning based on calculation models.
The dose predicted by a calculation method should correspond to the real absorbed dose in the patient as accurately as possible.
2

RT Planning
In RT treatment planning, the purpose is to devise a
treatment, which produces as uniform dose distribution as
possible to the target volume and minimizes the dose
outside this volume.
3

RT Planning
In RT planning, the beam qualities, field sizes, positions,
orientations and relative weights between the fields are typically
modified.
It is also possible to add certain accessories (e.g. wedge filters or
blocks) to the fields to account for oblique patient surface or to
shield critical structures from radiation exposure.
4

Historical Background
• Practising of treatment planning started in
1940’s when the developments in radiation
dosimetry enabled each clinic to measure
the isodose charts for any type of treatment
field, thus enabling manual 2D planning.
• To avoid laborious isodose measurements,
empirical methods for the calculation of
dose distribution were developed later.
• e.g. the percent depth dose (PDD) was introduced to calculate doses for treatments delivered using fixed treatment distance machines.
5

Historical Background
• Computer-based treatment planning systems (TPSs), first
introduced in the ‘70’s of last century, allowed the planner to
see the effect of the beam modifications immediately on the
predicted dose distribution.
• This resulted in better quality plans, since it became easier to
experiment with a larger set of treatment parameters.
6

Factor vs Model-based algorithms
• Each factor accounts for one or several different effects:
– beam size, beam shape, depth, distance, wedges, etc.
• These factors are typically measured or calculated through simple modelling and stored in tables.
• The method is intuitive and robust, but lacks general applicability.
• It is in principle impossible to account for all different treatment design possibilities which are a part of modern radiotherapy.
7
• First TPS’s made use of factor based models, where the dose per MU is typically expressed as the dose to a reference point under reference conditions, corrected with a set of factors.
Modern Treatment Planning Systems
• Therefore the model-based calculation methods were introduced
within TPS’s, where the commissioning measurements are used to
determine a set of more fundamental physical parameters which
characterize the radiation from the treatment unit.
• Model based algorithms can be made fully general without the
need for a large set of characterization measurements.
• Recently, 3D TPS’s have become common in RT departments
offering improved accuracy and enhanced visualization in the RT
treatment planning process.
• With recent improvement in computing technology, the newer TPS
now correctly model the radiation transport properties three
dimensionally and estimate the dose deposition precisely. 8

Modern Treatment Planning Systems
A modern TPS intended for routine treatment planning should address the
following challenges:
1. The calculation model should be applicable to generalized beam setups, including irregularly shaped beams and varying SSDs.
2. The effects of oblique patient skin and heterogeneous tissue on primary
and scattered radiation components should be accurately modelled.
3. The radiation beam produced by the linac should be characterized using
only a limited set of technical information.
4. The beam model should be adaptable to an individual treatment
machine.
5. The computation time should be short enough to facilitate interactive
plan L. Korhonen, 2009

MU calculation
• In external beam RT, monitor units (MU) or beam-on time for a given treatment plan allows the RT technologists to deliver the actual dose to a patient.
• MU are calculated by the TPS by means of sophisticated algorithms from the calculated dose distribution and dose prescription.
• It is essential for the user of a TPS to understand the principles of the MU calculation algorithm!
• However, in “simple” cases MU can be computed by means of several dosimetric functions introduced to relate absorbed doses measured in a phantom to absorbed doses in a patient:
Manual calculation
10

Why Manual MU Calculation ?
Traditionally manual calculation is carried out by means of factor- based models.
It can sound utterly out of fashion in the era of physics-based models or Monte Carlo TPS !
However, it can result useful as a powerful QA tool during TPS commissioning.
In fact, modern model-based TPS’s dose calculations, make use of characterization measurements to determine more basic parameters: errors in characterization measurements can result in unexpected and systematic calculation errors.
Moreover, software errors can go undetected during commissioning and manifest subsequently in clinical planning
11

Why Manual MU Calculation ?
• ICRP Report 86 has categorised
accidents reported in ext RT: 28% in
treatment planning and dose
calculation.
• The human factor is the cause for a large majority of the incidents and accidents. In routine clinical practice, more likely sources of systematic dose error for individual patients result from misuse of the system:
– inadequate understanding of normalization protocols,
– misinterpretation of the system output
– data transfer errors
46 accidents/incidents reported for external radiotherapy as categorized by ICRP 86
T. Nyholm, 2008 12

List of reported bugs from the TPS vendors collected from the FDA MAUDE database for the time period 2004‐2008.
• The companies are not obligated to report all problems, and different companies have different policies regarding the reporting.
• The presented list of identified bugs are therefore far from complete and is perhaps not even representative.
T. Nyholm, 2008
13
Why Manual MU Calculation ?
• The ICRP Report 86 concluded that many of these accidents
could have been prevented through independent
verification of the TPS and with systematic use of in‐vivo
dosimetry.
• Independent verification can also enhance confidence in the
accuracy of the algorithm and integrity of the beam data
used.
• It may also be a formidable didactic tool to learn the
influence on the dose of the several treatment parameters,
although this is not generally the main intention!
14

MU Calculation for TPS Commissioning
• IAEA TRS 430 Report lists some of the relevant issues that should be investigated
• It briefly describes the types of test that can help to verify the correct behaviour of the entire planning and MU/time calculation process.
• Detailed checks of the entire planning and MU/time calculation process should be performed.
15

IAEA TRS 430: MU calculation tests
• A number of important aspects of the treatment planning process affect the way one should calculate the MU’s or time (e.g. normalization)
• For these 9 test situations,
the MU/time calculation performed using the TPS should be compared to the manual MU/time calculation.
16

IAEA TRS 430: Overall Clinical Tests • Measurement or
manual dose evaluation of the final dose delivery should be performed,
• to ensure that the correct absolute dose would be delivered to the patient following the completion of the total treatment planning process.
• While it is not necessary to implement these particular examples, it is important that some typical situations be developed and tested right through to the evaluation of absolute dose. This is especially true for a new TPS.
17

• MU’s calculated using the TPS were compared with MU’s calculated from point dose calculations from TMR tables. Discrepancies in MU calculations were both significant (up to 5%) and systematic. Analysis of the dose computation software found:
• 1) a coordinate system transformation error,
• 2) mishandling of dose-spread arrays,
• 3) differences between dose calculations in the commissioning software and the planning software,
• 4) shortcomings in modeling of head scatter.
• Corrections were made in the beam calculation software or in the data sets to overcome these discrepancies. Consequently, we recommend validation of MU calculations as part of commissioning process. 18

RT Planning QA
• TPS optimized dose distributions with beam data are transferred through a computer network to the linac for automatic delivery of radiation.
• In this process there are many steps where both systematic and random errors can be introduced, but very few intrinsic possibilities for manual inspection/verification of the delivered dose.
• Hence, there is a great need for well designed and efficient quality systems and procedures to compensate for diminished human control.
Siochi et al, JACMP 2009 19

RT Planning QA
• Even if the TPS’s are commissioned and kept under QA programs to maintain their accuracy, errors may be introduced.
• Especially, the human factor is an uncontrolled parameter that may introduce errors.
• Thus, unintentional changes or incorrect handling of data may occur during clinical use of the equipment.
• Having an independent dose calculation system implemented in the daily quality assurance process may assure a high quality of treatments and avoidance of severe errors.
20

Safety Legislation
• In several European countries there are legal aspects based on EURATOM
directive 97/43 for independent QA procedures and their implementation
into national radiation protection and patient safety legislation.
• In particular, Article 8 states: “Member States shall ensure that…
appropriate quality assurance programmes including quality control
measures and patient dose assessments are implemented by the holder
of the radiological installation….”.
• This is also emphasized in Article 9 with respect to Special Practices:
“…special attention shall be given to the quality assurance programmes,
including quality control measures and patient dose or administered
activity assessment, as mentioned in Article 8.”
• In a broad sense this directive directs the holder to assure that the
delivered dose to the patient corresponds to the prescribed dose.
21

Independent Dose calculation
• Dose calculation with a TPS represents one of the most critical links in the RT treatment process, since it is the only realistic technique to estimate dose delivery in situ.
• Even though the calculation algorithms are tested during the commissioning of TPS and results are achieved with 1-2% accuracy in water phantom geometry, a good QA programme further requires that
all MU’s calculated for clinical use should be
verified using a second independent calculation method
• so that any errors due to software faults and improper use of the systems could be identified.
22

Independent MU calculation
Dose errors arising in computing the MU could potentially affect the
whole course of treatment and therefore are of particular concern.
So, independent checking of MU calculations, for each RT
treatment plan, is essential for QA.
It is considered more than desirable if the beam data set and
calculation algorithm are independent of those of the TPS.
AAPM also recommends an independent calculation of the dose at
one point in the plan, preferably at the isocenter or at a point near
the center of the PTV.
If the independent calculation differs from the treatment plan by
more than a pre-set tolerance level, the disparity should be
resolved before commencing or continuing treatment.
23
Independent dose calculation
Dose calculations can be performed through various methods utilizing fairly different approaches.
A tool for independent dose calculations, or any other kind of dose calculation device, is a compromise between the benefits and drawbacks associated with different calculation methods in relation to the demands on accuracy, speed, ease of use.
Independent dose calculations have been used for a long time as a routine QA tool in conventional RT using empirical algorithms in a manual calculation procedure, or utilizing software based on fairly simple dose calculation algorithms
(Dutreix et al., 1997; Knöös et al., 2001; van Gasteren et al., 1998).
24

MU Verification: ESTRO and AAPM docs
During the last decade recommendations for MU verification have been published by ESTRO (Booklets 3 and 6) and by the Netherlands Commission on Radiation Dosimetry, NCS .
AAPM Task Group 71 was formed in 2001 to create a consistent nomenclature and formalism (national protocol) for MU Calculations. In 2014 the Report 258 has been published: Monitor unit calculations for external photon and electron beams: Report of the AAPM Therapy Physics Committee TG No. 71, Medical Physics, Vol 41, Issue 3
In these reports it is common practice to verify the dose at a point by translating the treatment beam geometry onto a flat homogeneous semi-infinite water phantom or “slab geometry”.
Users should be aware of the limitations of this compromise that favors simplicity and calculation speed over accuracy!
25

Limits of the manual MU verification
Conventionally, MU calculation verification methods assume ‘‘water phantom geometry’’ in which the beam is presumed to be incident on a slab of material affording full scatter conditions.
It is evident that this assumption yields over- or underestimated scatter contributions, depending on the exact geometry.
ESTRO Booklet 10 26

Limits of the manual MU verification
Various methods to handle and correct for density variations (heterogeneities) in the literature
Most often these heterogeneity corrections rely on one-dimensional depth scaling along ray lines from the direct source, employing equivalent/ effective/ radiological depths that replace the geometrical depths in the dose calculations.
In general, the full 3D nature of the process can not be properly modelled.
The result is that all deviations from the ideal slab phantom geometry will cause different errors in the calculated doses. ESTRO Booklet 10 27

Heterogeneity Corrections
Using the ratio of TAR method proposed by O’Connor and more conventional parameters, the inhomogeneity correction factor may be calculated:
According the Batho’s method, later extended by Sontag and Cunningham, the correction factor can be expressed as:
However, these simple ratio methods described above do not take into account the effect of the lateral dimension of the heterogeneity !
Photon dose calculation to a point in a heterogeneous phantom. The first layer of material is assumed to be water
equivalent.
28

Manual MU Verification experiences
An independent MU calculation is created in an MS-Excel spreadsheet. The method is shown sufficiently sensitive to identify significant errors and is consistent on the magnitude of uncertainties in clinical dosimetry.
It is reported that using straightforward but detailed computer based verification calculations, it is possible to achieve a precision of 1% when compared with a 3D Helax TPS MU calculation.
29

the MU’s calculated by Pinnacle planning system were compared with hand calculations from lookup tables for nearly 13,500 treatment fields without considering the tissue inhomogeneity.
The 3D TPS MU calculation was systematically higher than the ‘‘hand’’ calculation: for simple geometries the mean difference was 1% and was as high as 3% for more complicated geometries.
Careful attention to factors such as patient contour could reduce the mean difference.
‘‘Hand’’ calculations were shown to be an accurate and useful tool for verification of TPS MU calculations. 30
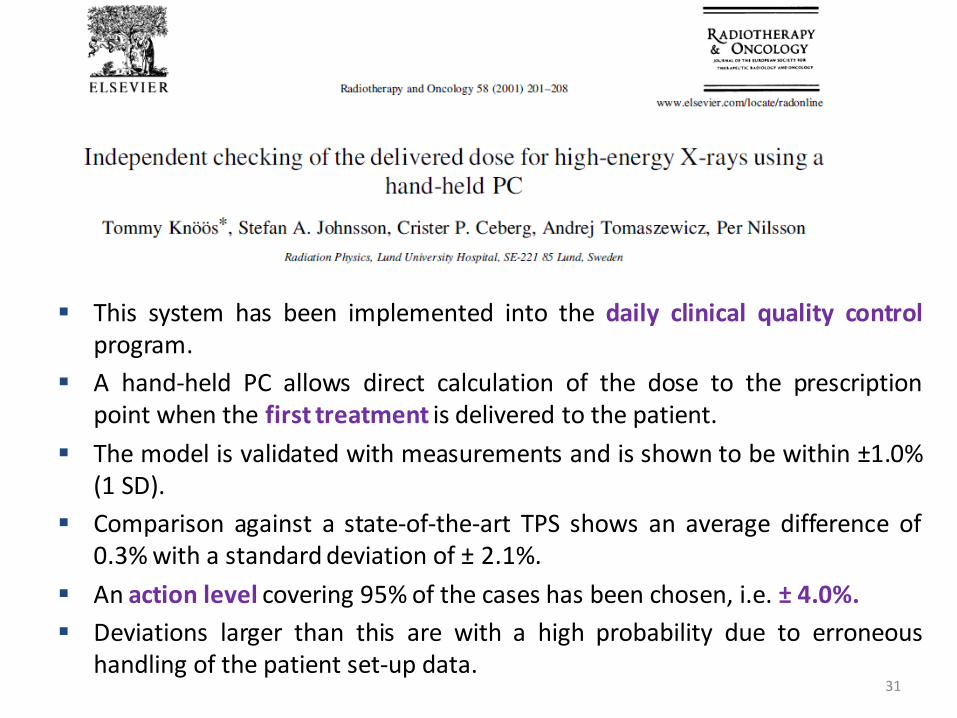
Manual Verification experience
This system has been implemented into the daily clinical quality control program.
A hand-held PC allows direct calculation of the dose to the prescription point when the first treatment is delivered to the patient.
The model is validated with measurements and is shown to be within ±1.0% (1 SD).
Comparison against a state-of-the-art TPS shows an average difference of 0.3% with a standard deviation of ± 2.1%.
An action level covering 95% of the cases has been chosen, i.e. ± 4.0%.
Deviations larger than this are with a high probability due to erroneous handling of the patient set-up data.
31

Factor-based dose calculation Traditionally the most common way of calculating the dose is through a
series of multiplicative correction factors that describe one-by-one the change in dose associated with a change of an individual treatment parameter, such as field size and depth, starting from the dose under reference conditions.
This approach is commonly referred to as factor-based calculation and has been the subject of detailed descriptions.
32

Factor-based dose calculation
The individual factors are normally structured in tables derived from measurements or described through parametrizations.
Some factors can be calculated through simple modelling, for example the inverse square law accounting for varying treatment distances.
From an implementation point of view a factor-based method may be an attractive approach due to its computational simplicity, once all the required data are available.
ESTRO Booklet 6 33

Limits of the Factor-based dose calculation
The obvious problem associated with this approach is the
required amount of commissioned beam data as this type of
method can not calculate doses when the beam setup is not
covered by the commissioned set of data.
For treatment techniques that can make use of many degrees
of freedom, such as the shape of an irregular field, it becomes
practically impossible to tabulate or parameterize all factors
needed to cover all possible cases.
Hence, the factor-based approach is best suited for point dose
calculations along the central beam axis in beams of simple
shapes and simple modifiers (wedges, blocks, MLC…).
34

Independent MU calculation: suggested steps by NCS (2005)
a. Develop a MU calculation program, either for manual calculation or using a computer program, based on the formalisms given in ESTRO Booklets 3 and 6 or NCS Report 12. See also Venselaar et al.
b. Include in the program the dependence on depth (using the percentage depth-dose, PDD, or tissue-phantom ratio, TPR), SSD, field size, and preferably taking the collimator exchange effect into account.
c. Take into account the dose variation with field size in case of the presence in the beam of a wedge or a blocking tray by using field size dependent correction factors.
d. For more complex situations involving tissue inhomogeneities, off-axis situations and MLC-shaped fields, more sophisticated algorithms are required. Several groups are currently in the process of developing these algorithms.
35

36

MU Verification Software
The manual calculations are expected to be less accurate than those performed by the TPS because factors such as patient surface convexity, tissue heterogeneity or beam obliquity are not considered.
Moreover, with the introduction of Intensity Modulation Radiation Therapy (IMRT), an independent manual calculation of MU becomes difficult due to the complex relationship between the MU and the beam shape as well as the technique used to generate the intensity modulation.
37
Currently, a variety of new MU verification software packages have been introduced in the market and are claimed to be capable of accurately calculating the monitor units even for IMRT.
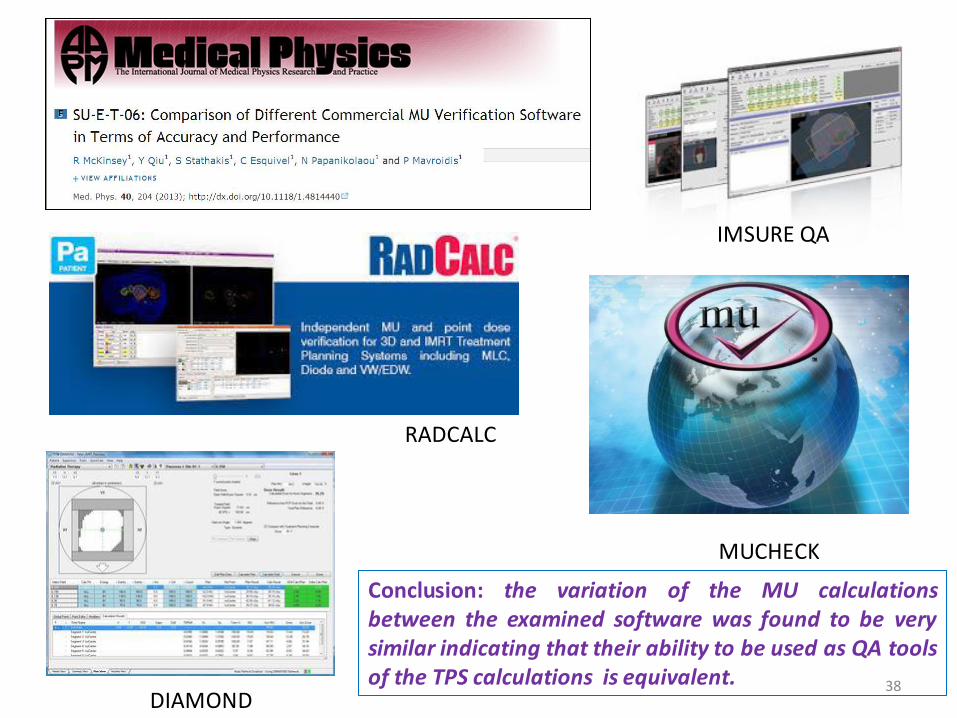
IMSURE QA
DIAMOND
MUCHECK
RADCALC
Conclusion: the variation of the MU calculations between the examined software was found to be very similar indicating that their ability to be used as QA tools of the TPS calculations is equivalent. 38

AAPM TG114: Computer-based MU verification programs
Most computer-based MU verification programs use an automated table look-up method similar to that outlined for manual calculation, e.g. in ImSure software:
Some more complex MU calculation programs use pencil beam or convolution/superposition algorithms based on the empirical data.
These computer programs require commissioning at multiple points and periodic QA to verify the continued data integrity and calculation algorithm functionality.
MU= SqCorrxCFxUFxInvFSxSPFSxTFxScTMRxOCRxWF
eIsoDoseLinRxDose
)'()(
/
39

AAPM TG114: Guidance for Action Levels
Recommendations on establishing action levels for agreement between primary calculations and verification, and guidance in addressing discrepancies outside the action levels are provided.
These recommendations shall not be interpreted as requirements.
It is important that the physicist knows the accuracy and limitations of both the primary and the verification systems in order to set reasonable and achievable action levels and to better interpret the causes of differences between the two results.
The level of agreement achievable depends on the details of the patient geometry, the primary and the verification calculation programs, and the clinical situation, in addition to whether corrections for tissue heterogeneities are used.
It is therefore reasonable to have different action levels for different situations. Each institution must determine the proper action levels for that particular clinic.
Results from planning system commissioning are useful in establishing these levels. 40

AAPM TG114: Guidance for Action Levels
The action level guidelines given the Report are based primarily on the collective experience and expectations of the TG members, due to the limited literature on the expected level of agreement between primary and verification calculations for modern image-based 3D planning systems.
A base action level of 2% was postulated for simple field geometries, consistent with the TG-53 criterion of 2% dose accuracy between calculations and measurements.
From this starting point, additional range was added to account for the increased uncertainties of complex treatment geometries.
The action level guidelines are divided into two tables, depending on whether or not tissue heterogeneities are taken into account in the primary calculation.
41

AAPM TG114: Guidance for Action Levels
42

AAPM TG114: Guidance for Action Levels
When a discrepancy is noted, the first action should be to verify that a calculation error has not been made.
If this basic review fails to identify the cause of a discrepancy, the next step should be to confirm that an appropriate comparison point has been chosen.
Differences in accounting for patient geometry between the primary and the verification calculations can also lead to large discrepancies between results (e.g. breast treatment).
Density corrections are required for verification of calculations which include heterogeneity effects. The verification calculation must at least take into account the radiological thickness of tissues overlying the point of calculation.
At a minimum, if a discrepancy is attributed to differences in the calculation algorithms, an assessment to confirm that the discrepancy is the correct order of magnitude and direction should be made.
43

Conclusions-1
«Manual» MU/time calculation can still have a role in modern
RT characterised by sophisticated computation algorithms and
3D complex patient models.
A measurement-based algorithm can have a good didactic
value since it enables to decompose a calculation and
consider the impact of each factor on an individual basis.
It can be of value during commissioning of clinical model-
based TPS’s , as required by the IAEA TRS 430.
44
Conclusions-2
It results an essential tool in the “independent second
check” for MU’s or time calculated to deliver the prescribed
dose to a patient, where a key aspect is the independent
nature of the calculation methodology and of the beam data
and treatment parameters.
However, its effectiveness in clinical practice relies on a
proper commissioning in order to assess its accuracy and
limitations, so to set reasonable action levels and to better
interpret the causes of differences between the two
calculations. 45

46
Manual Calculation Tools

Heterogeneity Corrections
• The heterogeneity correction is usually small in most clinical sites, such as breast or prostate, but can be substantial for chest treatments when a large volume of lung is being irradiated or when the tumor is surrounded by lung tissue.
• Typically, heterogeneity corrections will improve the dose accuracy compared to a homogeneous dose calculation.
• For a heterogeneous dose calculation, the most important parameter is the radiological depth along the ray-line to the point of calculation.
• While the radiological depth is typically the largest component for this correction, in low-density regions, such as the lung, electronic disequilibrium effects due to the lateral extent of the field and rebuild-up can also be significant
47