trend & cycle: the long view – october 2021
TRANSCRIPT

Investment and insurance products offered through RBC Wealth Management are not insured by the FDIC or any other federal government agency, are not deposits or other obligations of, or guaranteed by, a bank or any bank affiliate, and are subject to investment risks, including possible loss of the principal amount invested.
Trend & Cycle: The Long View – December 2021
December 2, 2021 / RBC Capital Markets, LLC / Portfolio Advisory GroupAll values in U.S. dollars and priced as of market close on December 1, 2021 unless otherwise noted
Robert Sluymer, CFA | Technical Strategist, Portfolio Advisory Group
For Important Disclosures, see slide 22.
Produced: December 2, 2021 09:05ET; Disseminated: December 2, 2021 09:17ET

2RBC Capital Markets, LLC / Portfolio Advisory Group | Robert Sluymer, CFA – [email protected] 2, 2021
EQUITY MARKETS
Long-term secular equity cycles
• A repetitive 17-year generational cycle that suggests the secular bull market could last into the mid 2030s.A review of market drawdowns since the early 1900s
• Corrections > 30% do occur but are relatively rare and short livedThe 4-year cycle since WWII
• An underlying cycle, too repetitive to ignore, suggests a slowing cycle moving through 2022.
• Uptrend intact but advanced with the S&P at the upper end of a 12-year channel.
• Monthly momentum, tracking 2-4 year moves, is beginning to peak after bottoming in 2020.
• Relative trend versus bonds remains positive but also advanced. Global Markets - MSCI EAFE, MSCI Emerging Markets, MSCI Europe and Toronto TSX
• 2020-2021 bull cycles showing signs of pausing.
• However, relative performance trends vs the S&P 500 remain in long-term downtrends and don’t support overweighting yet. • S&P TSX – Uptrend intact after breaking above a sideways range that was in place between 2008-2020. 22k next resistance, 18k support.
Trend & Cycle: The Long View – December 2021

3RBC Capital Markets, LLC / Portfolio Advisory Group | Robert Sluymer, CFA – [email protected] 2, 2021
INTEREST RATES
• US 10-year yield 1900-2021 – Range bound between 1.35%-1.80% after retracing 50% of the 2017-2020 decline.CURRENCIES
• US Dollar Index (DXY) – Long-term downtrend intact but with DXY index testing next key resistance near 96.
• Canadian dollar (CADUSD) – Critical retest of support near 0.77 underway.
• Euro-Yen – An important currency pair to track as a barometer of the current market cycle. 127 remains key support.COMMODITIES
• Copper – Uptrend intact with Copper consolidating between resistance at 465 and key support at 400.
• WTI Oil – November’s reversal is stress testing next key support between 62-66.
• Gold range bound between 1900-2000 resistance with 1670 important support. Monthly momentum is becoming oversold. MARKET, SECTORS and INDUSTRY GROUP CYCLES
• After an impressive surge through October, almost every equity market, sector and industry group has surged from their 2020 lows but are now pausing/pulling back to test support near rising long-term moving averages.
• While it is premature to conclude these are cycle peaks as it is not uncommon for markets to consolidate in sideways trading ranges, we would view a decline below the 2021 trading ranges to be confirmation that the current cycle is peaking.
• Expect more muted equity returns in 2022 vs 2021 and position portfolios to be more balanced across growth, cyclicals and safety stocks.
Trend & Cycle: The Long View – December 2021

4RBC Wealth Management Portfolio Advisory Group | Robert Sluymer, CFA – [email protected] 2, 2021
Deflation
Inflation
Deflation
The S&P 500 index has moved through periods of expansion and contraction every 17 years
The long-term secular trends for the US stock market have moved through periods of expansion and contraction lasting roughly 17 years.
If the past is any prologue for the future, the current secular cycle could last into the early-mid 2030s.
Of course secular bull markets have pullbacks along the way, often over a 3-4 year cycle, as illustrated on the following page.
S&P 500 Index
Source: RBC Wealth Management, Bloomberg, Optuma
US equity generational cycles lasting roughly 17-years
Current 17-year cycle likely to
peak near 2034

5RBC Wealth Management Portfolio Advisory Group | Robert Sluymer, CFA – [email protected] 2, 2021
Dow Industrial Index 1900-2021 and declines from 3 year highs
-35%-45%
Shaded red area = % decline from 3-year highs
Source: RBC Wealth Management, Bloomberg, Optuma
• Outside of the 1929 decline, drawdowns greater than -35% from 3 year highs do not remain in negative territory for very long.
• Despite investors’ understandable concerns regarding the pandemic in 2020, the secular bull market remains intact and is likely to continue to trend higher into the early-mid 2030s.

6RBC Wealth Management Portfolio Advisory Group | Robert Sluymer, CFA – [email protected] 2, 2021
S&P 500 – A repetitive 4-year cycle to consider
1987
__ 200-week sma
4 Year Cycle % Rally % Correction1949-1953 97 -151953-1957 118 -221958-1962 86 -281962-1966 80 -221982-1986 231 -361987-1990 71 -201990-1994 64 -101994-1998 173 -222011-2016 99 -162016-2020 87 -382020-2024 ? - -Average 111 -23
The table above illustrates the 4-year cycle returns during the secular bull markets since WWII.
2016 2020
US equity markets have established a cycle low roughly every 4 years. While not 100% perfect, such as in 1986-1987 and 2006-2008, the pattern repeats regularly enough to consider when investing, with average upside of +110% and average decline -23%. In theory, the next cycle low is in 2024.
The 3 bull and bear cycles during the 1970s averaged +65% and -33%
respectively and are not included in the table above
Major cycle lows have developed roughly every 4-years since WWII
Note: the red 200-week (4-year) moving average has often served as a support during secular bull markets.
The average 4-year cycle during secular bull markets is +110%, which would support a move toward 4600, which the S&P has already exceeded.
Source: RBC Wealth Management, Bloomberg, Optuma
In theory, the next cycle low is likely in 2024 based on the 4-
year cycle
2024
2024

7RBC Wealth Management Portfolio Advisory Group | Robert Sluymer, CFA – [email protected] 2, 2021
S&P 500 Index - Monthly with 4 and 13 month moving averages
Source: RBC Wealth Management, Bloomberg, Optuma
• The current trend for the S&P remains positive but well advanced testing the upper end of a 12-year trend that began in 2009 with very early signs of stalling.
• The shorter-term trend for the S&P, represented by the 4 month moving average, remains positive but well advanced above the longer-term trend, represented by the 13 month average.
• The red and green arrows indicate when these two moving averages cross each other. Although there are times when the crossovers result in whipsaws, they can be a helpful technical tool to avoid the major drawdowns that develop in bear markets, such as 2000 and 2008.
• The histogram in the bottom panel is green when the 4 month ma is above the 13 month ma, and is red when the 4 month ma is below the 13 month ma. This indicator is beginning to peak, suggesting the current uptrend is likely to slow down moving through 2022 and for investors to prepare for more subdued returns versus the past two years.
__ 4-month ma.__ 13-month ma
Histogram= Distance between 4-month and 13-month moving averages

8RBC Wealth Management Portfolio Advisory Group | Robert Sluymer, CFA – [email protected] 2, 2021
Source: RBC Wealth Management, Bloomberg, Optuma
S&P 500 monthly and relative performance vs Bonds
__ 15-month sma__ 48-month sma
S&P 500
Ratio of the S&P 500 vs Bonds
• The current cycle for the S&P remains positive, with the index trend above both the 15-month ma (blue) at 4100 and 48-month moving averages (red) at 3273.
• The relative performance of the S&P versus the Barclays All Aggregate Bond Index, one of the most widely used bond benchmarks, continues to make new cycle highs similar to the 2016 and 2012 cycles.
• If the past two 4-year cycles are any guide, then stocks are likely to outperform bonds through the balance of 2021 and begin to slow/consolidate in 2022.

9RBC Wealth Management Portfolio Advisory Group | Robert Sluymer, CFA – [email protected] 2, 2021
MSCI EAFE – Monthly with relative performance vs the S&P 500
• Cyclical sectors account for 60% of the MSCI EAFE (Europe, Asia and Far East) so an improvement in the EAFE index is a reflection of an improving global economy.
• EAFE’s uptrend remains intact but is pausing/stalling near resistance at its 2007 highs (2398) with support between 2000-2200.
• Relative performance vs the S&P 500 remains in a downtrend. To truly signal a change in global equity leadership away from the US, the relative performance line in the bottom panel will need to reverse its red downtrend.
Source: RBC Wealth Management, Bloomberg, Optuma
Relative performance of EAFE relative to the S&P 500

MSCI Emerging Market Index and relative performance vs S&P 500
10RBC Wealth Management Portfolio Advisory Group | Robert Sluymer, CFA – [email protected] 2, 2021
Relative performance of EM relative to the S&P 500
Source: RBC Wealth Management, Bloomberg, Optuma
MSCI Emerging Market Index - Monthly
• Over the past few months, the MSCI Emerging Market (EM) index has pulled back as many of the larger Chinese stocks, which dominate this index, sold off in response to changing regulations.
• Currently, the MSCI EM is trading sideways above key support near 1200 after breaking out to temporary new highs in February 2021.
• A break below 1200 would signal a failed break-out with risk to next support near the 48-month (4-year) moving average at 1120.
• Relative performance versus the S&P 500 remains in a downtrend and would need to reverse to the upside to signal a longer-term trend shift favoring EM.
Monthly momentum has peaked

MSCI EUROPE – Monthly with relative performance vs S&P 500
11RBC Wealth Management Portfolio Advisory Group | Robert Sluymer, CFA – [email protected] 2, 2021
• The MSCI Europe index is heavily influenced by cyclical stocks similar to the EAFE index.
• The MSCI Europe index has broken out of a 20-year trading range with support near the 140-145 range.
• However, similar to MSCI EAFE and MSCI EM, MSCI Europe has yet to show meaningful technical evidence of reversing its relative performance downtrend vs the S&P 500 to support overweighting the region versus the US.
Ratio of Europe relative to the S&P 500
Source: RBC Wealth Management, Bloomberg, Optuma
MSCI Europe Index - Price
Monthly momentum is overbought
12RBC Wealth Management Portfolio Advisory Group | Robert Sluymer, CFA – [email protected] 2, 2021
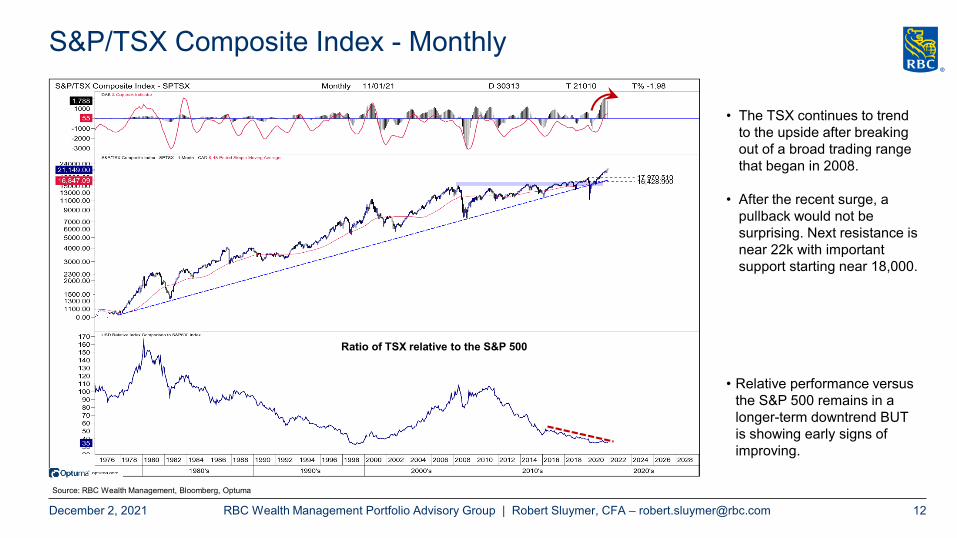
S&P/TSX Composite Index - Monthly
• The TSX continues to trend to the upside after breaking out of a broad trading range that began in 2008.
• After the recent surge, a pullback would not be surprising. Next resistance is near 22k with important support starting near 18,000.
• Relative performance versus the S&P 500 remains in a longer-term downtrend BUT is showing early signs of improving.
Ratio of TSX relative to the S&P 500
Source: RBC Wealth Management, Bloomberg, Optuma

TNX - US 10-Year Yield: 1900-2021 - Monthly
13RBC Wealth Management Portfolio Advisory Group | Robert Sluymer, CFA – [email protected] 2, 2021
Source: RBC Wealth Management, Bloomberg, Optuma
1 - After the decline in interest rates through 1920s and 1930s, rates remained in a broad bottoming range through the 1940s,1950s and 1960s before steadily rising in the late 1960s through the 1970s.
5- Bottom line: The long-term trend for US 10-year yield remains down, with a move above the 2.13-2.55% range needed to signal a secular trend reversal.
Tactically, the US 10-year yield will need to rally above 1.80% to signal it is resuming the uptrend that began in 2020.
2 - While many investors expect a dramatic rise in rates to be underway, it is also possible history will repeat and interest rates will remain in a broad trading range for many years before moving higher, which is our expectation.
3 - The downtrend that began in 1981 (red dashed trendline) remains down, lining up a 62-76% retracement band of the 2018-2020 decline between 2.13-2.55%.
4 – Currently the 10-year yield is in a
narrow range between 1.126% and
1.80%.

DXY USD Dollar Index – Monthly – Bouncing at 88-89 support
14RBC Wealth Management Portfolio Advisory Group | Robert Sluymer, CFA – [email protected] 2, 2021
• The longer-term trend for the US dollar remains down, with a recent bounce from support between 88-89 testing the downtrend line near 96.
• A break below 88 will be needed to confirm the US Dollar’s bear market is continuing, with next support at 84.5 coinciding with the 62% retracement of the 2011-2016 rebound.
Source: RBC Wealth Management, Bloomberg, Optuma

Euro / Yen – Monthly
15RBC Wealth Management Portfolio Advisory Group | Robert Sluymer, CFA – [email protected] 2, 2021
Source: RBC Wealth Management, Bloomberg, Optuma
• The Euro-Yen currency pair bears monitoring over the coming quarters as a barometer for global investors’ risk appetite.
• We view a strengthening Euro-Yen trend as being bullish for cyclical groups and stocks.
• Over the past month the Euro-Yen pulled back sharply along with most other risk assets and is challenging a key support level near 127.
• Key levels to watch: A breakout above 134 resistance would signal bullish backdrop for cyclicals, while a break back below 127 would support a more cautious outlook.

Canadian Dollar / US Dollar - Monthly
16RBC Wealth Management Portfolio Advisory Group | Robert Sluymer, CFA – [email protected] 2, 2021
• The Canadian dollar’s rebound from support near the 2016 low has pulled back from major resistance between 0.83-0.84.
• Our view has and continues to be, that further sideways consolidation will develop under 0.83-0.84 into Q4, with 0.77 likely defining the lows for the CAD rest of 2021.
• A move above 0.834 would suggest additional upside toward the 50% retracement level at 0.87, followed by next resistance at 0.91 at the 62% retracement level.
• However, a move below 0.77 would be a negative signal for risk assets in general with risk to next support at 0.7469.
Retest in 2020 was exactly at the 2016 lows
Source: RBC Wealth Management, Bloomberg, Optuma

Copper Futures – Monthly
17RBC Wealth Management Portfolio Advisory Group | Robert Sluymer, CFA – [email protected] 2, 2021
• Monthly momentum continues to peak as copper consolidates in a broad range under resistance near the 2011 highs near 465.
• Support remains between 400-422, just above the rising 200-day moving average (not shown), which Copper has bounced from.
• In contrast to Currencies, Copper has remained resilient above key support at 400.
• The ratio of Copper vs Gold in the bottom panel is testing cycle highs reinforcing Copper’s leadership.
• We view the current action as a healthy pause with a move above the recent highs likely to confirm a resumption of the longer-term uptrend. Put differently, it would likely signal a longer-term trend favoring industrial commodities over safety assets.
Ratio of Copper versus Gold
Monthly momentum
Secondary secular lows established in 2020 near the 2016 lows
Copper Price - Monthly
Source: RBC Wealth Management, Bloomberg, Optuma

18RBC Wealth Management Portfolio Advisory Group | Robert Sluymer, CFA – [email protected] 2, 2021
WTI Oil Future - Monthly
• After an impressive surge that reversed the 2008-2021 downtrend, Oil has pulled back steeply with most other risk assets to test a key support band between 62-67.
• Our expectation is for an oversold trading low to develop in the coming weeks near current levels.
• However, a decline below 62 would establish a lower low and likely signal a failing bull cycle for Oil.
• Note: We are using 10 as the low end of WTI’s long-term trading range rather than the temporary spike into negative territory at -40.
WTI Oil - Monthly
Source: RBC Wealth Management, Bloomberg, Optuma

Commodities - Gold - Monthly
19RBC Wealth Management Portfolio Advisory Group | Robert Sluymer, CFA – [email protected] 2, 2021
• Monthly momentum peaked in early 2020 as Gold stalled near 2000 but is moving into oversold territory heading into late Q4/early Q1.
• Gold remains range bound after bouncing from 1670 support back to resistance just above 1900.
• Some investors have questioned whether Gold is tracking the pattern of the top that developed in 2011-2012. While that is a possibility, we would highlight that the run up during this cycle has been much shorter than the 2000-2011 bull market. A break below 1670 would be needed to signal a bearish reversal.
Gold Price - Monthly
Gold relative to Copper
Momentum
Source: RBC Wealth Management, Bloomberg, Optuma

20RBC Capital Markets, LLC / Portfolio Advisory Group | Robert Sluymer, CFA – [email protected] 2, 2021
Major markets and S&P sector cycles+
Stalling and Early Downtrends
Bottoming and Early Uptrends
Established to Late Downtrends
Established to LateUptrends
- Energy- S&P
-Transports
- Financials
- Industrials
- Small-caps
- CAD Dollar
- Oil - Europe
- DJIA
- Materials Emerging Markets
- Healthcare
- Nasdaq- TechnologyThis slide illustrates where the major markets and
sectors are within their individual cycles.
Not all markets cycle through each quadrant evenly. Some have short, volatile bull and bear markets, others are much longer in duration.
Historically, the US equity market has moved through bull-bear phases roughly every 3-4 years.
Utilities
- World ex- U.S.
Source: RBC Wealth Management, Bloomberg, Optuma
After an impressive surge through October most markets and sectors pulled back through November. Long-term monthly cycle momentum is beginning to peak for most markets after strong gains from the 2020 cycle lows. This change is reflected by most markets being near a possible turning point in the middle of their cycles.
While it is premature to conclude that the broader market cycle is in a downturn, most markets are at pause points near their rising 15-month moving average, which need to hold to keep their up cycles intact.
Staples
- Midcaps- Discretionary
- US 10-year yields
‘+’ and ‘-’ signs indicate change from the prior month.

21RBC Capital Markets, LLC / Portfolio Advisory Group | Robert Sluymer, CFA – [email protected] 2, 2021
Industry Group Cycles
Stalling and Early Downtrends
Bottoming and Early Uptrends
Established to Late Downtrends
Established to LateUptrends
- HC Equipment
Pharma
Semiconductors
- Materials
Commercial Svcs
- Consumer Durables
Autos- Consumer Svcs
- Internet Media - Capital Goods
- Transports
Tech Hardware
- Utilities
- DiversifiedFinancials
Source: RBC Wealth Management, Bloomberg, Optuma
- Food & Tobacco
- Insurance
- Software
- Biotech
- Banks
REITs
- Energy
- TelcosGold
- Retail
This slide illustrates where the major markets and sectors are within their individual cycles.
Not all markets cycle through each quadrant evenly. Some have short, volatile bull and bear markets, others are much longer in duration.
Historically, the US equity market has moved through bull-bear phases roughly every 3-4 years.
‘+’ and ‘-’ signs indicate change from the prior month.
- Payment/Processors
After an impressive surge through October most markets and sectors pulled back through November. Long-term monthly cycle momentum is beginning to peak for most markets after strong gains from the 2020 cycle lows. This change is reflected by most markets being near a possible turning point in the middle of their cycles.
While it is premature to conclude that the broader market cycle is in a downturn, most markets are at pause points near their rising 15-month moving average, which need to hold to keep their up cycles intact.

Disclosures
22RBC Capital Markets, LLC / Portfolio Advisory Group | Robert Sluymer, CFA – [email protected] 2, 2021
This comment is prepared by the Technical Research team at RBC Wealth Management. All views expressed are the opinions of Technical Research based solely on the historical technical behavior (price and volume) and their expectations of the most likely direction of a market or security. Technical Research opinions and recommendations may differ from the opinions, recommendations and / or ratings of RBC Capital Markets' fundamental equity and other research products. Fundamental equity research is available from your RBC Capital Markets salesperson. Opinions and recommendations in Technical Research could result in short-term price movements that are contrary to the recommendations and/or ratings in fundamental equity research.All of the views expressed in this report accurately reflect the personal views of the responsible analyst(s) about any and all of the subject securities or issuers. No part of the compensation of the responsible analyst(s) named herein is, or will be, directly or indirectly, related to the specific recommendations or views expressed by the responsible analyst(s) in this report.
Important disclosuresIn the U.S., RBC Wealth Management operates as a division of RBC Capital Markets, LLC. In Canada, RBC Wealth Management includes, without limitation, RBC Dominion Securities Inc., which is a foreign affiliate of RBC Capital Markets, LLC. This report has been prepared by RBC Capital Markets, LLC. which is an indirect wholly-owned subsidiary of the Royal Bank of Canada and, as such, is a related issuer of Royal Bank of Canada.In the event that this is a compendium report (covers six or more companies), RBC Wealth Management may choose to provide important disclosure information by reference. To access current disclosures, clients should refer to https://www.rbccm.com/GLDisclosure/PublicWeb/DisclosureLookup.aspx?EntityID=2 to view disclosures regarding RBC Wealth Management and its affiliated firms. Such information is also available upon request to RBC Wealth Management Publishing, 60 South Sixth St, Minneapolis, MN 55402. References to a Recommended List in the recommendation history chart may include one or more recommended lists or model portfolios maintained by RBC Wealth Management or one of its affiliates. RBC Wealth Management recommended lists include the Guided Portfolio: Prime Income (RL 6), the Guided Portfolio: Dividend Growth (RL 8), the Guided Portfolio: ADR (RL 10), and the Guided Portfolio: All Cap Growth (RL 12). RBC Capital Markets recommended lists include the Strategy Focus List and the Fundamental Equity Weightings (FEW) portfolios. The abbreviation 'RL On' means the date a security was placed on a Recommended List. The abbreviation 'RL Off' means the date a security was removed from a Recommended List.
Distribution of ratingsFor the purpose of ratings distributions, regulatory rules require member firms to assign ratings to one of three rating categories - Buy, Hold/Neutral, or Sell -regardless of a firm's own rating categories. Although RBC Capital Markets' ratings of Outperform (O), Sector Perform (SP), and Underperform (U) most closely correspond to Buy, Hold/Neutral and Sell, respectively, the meanings are not the same because our ratings are determined on a relative basis.

Disclosures
23RBC Capital Markets, LLC / Portfolio Advisory Group | Robert Sluymer, CFA – [email protected] 2, 2021
Explanation of RBC Capital Markets, LLC Equity Rating SystemAn analyst's "sector" is the universe of companies for which the analyst provides research coverage. Accordingly, the rating assigned to a particular stock represents solely the analyst's view of how that stock will perform over the next 12 months relative to the analyst's sector average.RatingsOutperform (O): Expected to materially outperform sector average over 12 months. Sector Perform (SP): Returns expected to be in line with sector average over 12 months. Underperform (U): Returns expected to be materially below sector average over 12 months. Restricted (R): RBC policy precludes certain types of communications, including an investment recommendation, when RBC is acting as an advisor in certain merger or other strategic transactions and in certain other circumstances. Not Rated (NR): The rating, price targets and estimates have been removed due to applicable legal, regulatory or policy constraints which may include when RBC Capital Markets is acting in an advisory capacity involving the company.
As of March 31, 2021, RBC Capital Markets discontinued its Top Pick rating. Top Pick rated securities represented an analyst’s best idea in the sector; expected to provide significant absolute returns over 12 months with a favorable risk-reward ratio. Top Pick rated securities have been reassigned to our Outperform rated securities category, which are securities expected to materially outperform sector average over 12 months.
Risk ratingThe Speculative risk rating reflects a security's lower level of financial or operating predictability, illiquid share trading volumes, high balance sheet leverage, or limited operating history that result in a higher expectation of financial and/or stock price volatility.
Valuation and Risks to rating and price targetWhen RBC Capital Markets, LLC assigns a value to a company in a research report, FINRA Rules and NYSE Rules (as incorporated into the FINRA Rulebook) require that the basis for the valuation and the impediments to obtaining that valuation be described. Where applicable, this information is included in the text of our research in the sections entitled “Valuation” and “Risks to rating and price target”, respectively.
As of September 30, 2021
Rating Count Percent Count PercentBuy [Outperform] 800 56.58 341 42.62Hold [Sector Perform] 562 39.75 172 30.60Sell [Underperform] 52 3.68 3 5.77
Investment Banking Serv ices Prov ided During Past 12 Months
Distribution of Ratings - RBC Capital Markets, LLC Equity Research

Disclosures
24RBC Capital Markets, LLC / Portfolio Advisory Group | Robert Sluymer, CFA – [email protected] 2, 2021
The analyst(s) responsible for preparing this research report have received (or will receive) compensation that is based upon various factors, including total revenues of RBC Capital Markets, LLC, and its affiliates, a portion of which are or have been generated by investment banking activities of RBC Capital Markets, LLC and its affiliates.
Other disclosuresPrepared with the assistance of our national research sources. RBC Wealth Management prepared this report and takes sole responsibility for its content and distribution. The content may have been based, at least in part, on material provided by our third-party correspondent research services. Our third-party correspondent has given RBC Wealth Management general permission to use its research reports as source materials, but has not reviewed or approved this report, nor has it been informed of its publication. Our third-party correspondent may from time to time have long or short positions in, effect transactions in, and make markets in securities referred to herein. Our third-party correspondent may from time to time perform investment banking or other services for, or solicit investment banking or other business from, any company mentioned in this report.
RBC Wealth Management endeavors to make all reasonable efforts to provide research simultaneously to all eligible clients, having regard to local time zones in overseas jurisdictions. In certain investment advisory accounts, RBC Wealth Management or a designated third party will act as overlay manager for our clients and will initiate transactions in the securities referenced herein for those accounts upon receipt of this report. These transactions may occur before or after your receipt of this report and may have a short-term impact on the market price of the securities in which transactions occur. RBC Wealth Management research is posted to our proprietary Web sites to ensure eligible clients receive coverage initiations and changes in rating, targets, and opinions in a timely manner. Additional distribution may be done by sales personnel via e-mail, fax, or regular mail. Clients may also receive our research via third-party vendors. Please contact your RBC Wealth Management Financial Advisor for more information regarding RBC Wealth Management research.
Conflicts disclosure: RBC Wealth Management is registered with the Securities and Exchange Commission as a broker/dealer and an investment adviser,offering both brokerage and investment advisory services. RBC Wealth Management’s Policy for Managing Conflicts of Interest in Relation to Investment Research is available from us on our website at https://www.rbccm.com/GLDisclosure/PublicWeb/DisclosureLookup.aspx?EntityID=2. Conflicts of interests related to our investment advisory business can be found in Part 2A Appendix 1 of the Firm’s Form ADV or the RBC Advisory Programs Disclosure Document. Copies of any of these documents are available upon request through your Financial Advisor. We reserve the right to amend or supplement this policy, Part 2A Appendix 1 of the Form ADV, or the RBC Advisory Programs Disclosure Document at any time.

Disclosures and Disclaimer
25RBC Capital Markets, LLC / Portfolio Advisory Group | Robert Sluymer, CFA – [email protected] 2, 2021
The author is employed by RBC Wealth Management, a division of RBC Capital Markets, LLC, a securities broker-dealer with principal offices located in Minnesota and New York, USA.
Third-party-disclaimersThe Global Industry Classification Standard (“GICS”) was developed by and is the exclusive property and a service mark of MSCI Inc. (“MSCI”) and Standard & Poor’s FinancialServices LLC (“S&P”) and is licensed for use by RBC. Neither MSCI, S&P, nor any other party involved in making or compiling the GICS or any GICS classifications makes anyexpress or implied warranties or representations with respect to such standard or classification (or the results to be obtained by the use thereof), and all such parties herebyexpressly disclaim all warranties of originality, accuracy, completeness, merchantability and fitness for a particular purpose with respect to any of such standard or classification.Without limiting any of the foregoing, in no event shall MSCI, S&P, any of their affiliates or any third party involved in making or compiling the GICS or any GICS classificationshave any liability for any direct, indirect, special, punitive, consequential or any other damages (including lost profits) even if notified of the possibility of such damages.
References herein to “LIBOR”, “LIBO Rate”, “L” or other LIBOR abbreviations means the London interbank offered rate as administered by ICE Benchmark Administration (or anyother person that takes over the administration of such rate).
DisclaimerThe information contained in this report has been compiled by RBC Wealth Management, a division of RBC Capital Markets, LLC, from sources believed to be reliable, but norepresentation or warranty, express or implied, is made by Royal Bank of Canada, RBC Wealth Management, its affiliates or any other person as to its accuracy, completeness orcorrectness. All opinions and estimates contained in this report constitute RBC Wealth Management's judgment as of the date of this report, are subject to change without noticeand are provided in good faith but without legal responsibility. Past performance is not a guide to future performance, future returns are not guaranteed, and a loss of originalcapital may occur. Every province in Canada, state in the U.S., and most countries throughout the world have their own laws regulating the types of securities and otherinvestment products which may be offered to their residents, as well as the process for doing so. As a result, the securities discussed in this report may not be eligible for sale insome jurisdictions. This report is not, and under no circumstances should be construed as, a solicitation to act as securities broker or dealer in any jurisdiction by any person orcompany that is not legally permitted to carry on the business of a securities broker or dealer in that jurisdiction. Nothing in this report constitutes legal, accounting or tax adviceor individually tailored investment advice. This material is prepared for general circulation to clients, including clients who are affiliates of RBC Wealth Management, and does nothave regard to the particular circumstances or needs of any specific person who may read it. The investments or services contained in this report may not be suitable for you andit is recommended that you consult an independent investment advisor if you are in doubt about the suitability of such investments or services. To the full extent permitted by lawneither RBC Wealth Management nor any of its affiliates, nor any other person, accepts any liability whatsoever for any direct, indirect or consequential loss arising from, or inconnection with, any use of this report or the information contained herein. No matter contained in this document may be reproduced or copied by any means without the priorwritten consent of RBC Wealth Management in each instance. In the U.S., RBC Wealth Management operates as a division of RBC Capital Markets, LLC. In Canada, RBCWealth Management includes, without limitation, RBC Dominion Securities Inc., which is a foreign affiliate of RBC Capital Markets, LLC. This report has been prepared by RBCCapital Markets, LLC. Additional information available upon request.© 2021 RBC Capital Markets, LLC - Member NYSE/FINRA/SIPC. All rights reserved.