trend june 2020
TRANSCRIPT
1
1 • Markit Economics reports indicate that the downturn in the global manufacturing sector
eased sharply in June 2020 with the J.P.Morgan Global Manufacturing PMI going up by a record 5.4 points to 47.8, up from 42.4 in May 2020.
• The survey data indicates expansions in output for 15 out of the 32 countries for which June data were available with growth reported for China, France, Italy, the UK and Brazil, while downturns eased in the US, Japan, Germany, South Korea and India.
• The reports indicate that the level of new orders fell for the fifth successive month in June 2020 and that trends in global trade declined for the twenty-second straight month in June 2020.
• Manufacturing employment declined for the seventh consecutive month in June 2020 albeit at a decreasing pace. June 2020 also saw average input prices rise for the first time in three months while average output charges continued to fall, as per the reports.
Key Economic Figures Country GDP 2019:
%change* Manufacturing PMI
May 2020 June 2020 India 4.8 30.8 47.2 China 6.1 50.7 51.2 Japan 1.0 38.4 40.1 USA 2.3 39.8 49.8 EU 28 1.2 39.4 47.4 Brazil 1.1 38.3 51.6 Russia 1.3 36.2 49.4 South Korea 2.0 41.3 43.4 Germany 0.6 36.6 45.2 Turkey 0.9 40.9 53.9 Italy 0.3 45.4 47.5 Source: GDP: official releases; PMI- Markit Economics, *provisional
WORLD ECONOMY AT A GLANCE
Q1 FY 20 continued to reel under the severe impact of COVID-19, be it globally or domestic. Some silver lining was the release of SRO by worldsteel during the month which went on to establish India as the 2nd largest steel consumer globally in 2019.
Trends ….. June 2020
2
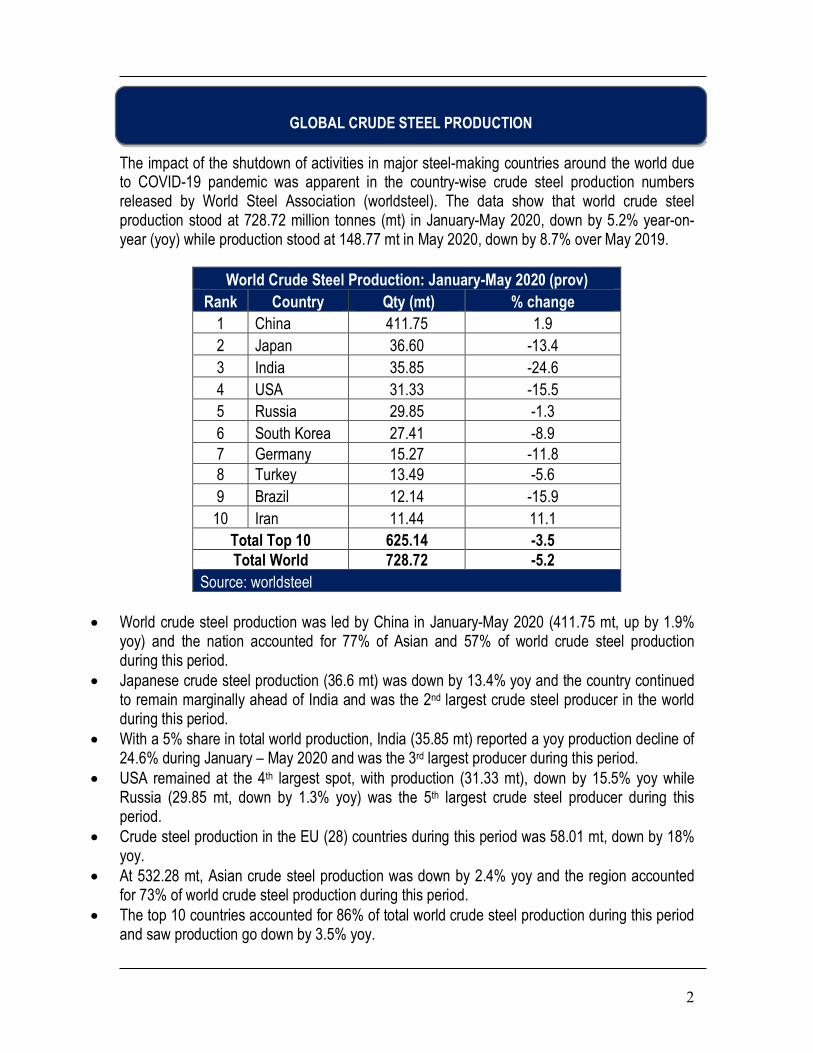
The impact of the shutdown of activities in major steel-making countries around the world due to COVID-19 pandemic was apparent in the country-wise crude steel production numbers released by World Steel Association (worldsteel). The data show that world crude steel production stood at 728.72 million tonnes (mt) in January-May 2020, down by 5.2% year-on-year (yoy) while production stood at 148.77 mt in May 2020, down by 8.7% over May 2019.
World Crude Steel Production: January-May 2020 (prov) Rank Country Qty (mt) % change
1 China 411.75 1.9 2 Japan 36.60 -13.4 3 India 35.85 -24.6 4 USA 31.33 -15.5 5 Russia 29.85 -1.3 6 South Korea 27.41 -8.9 7 Germany 15.27 -11.8 8 Turkey 13.49 -5.6 9 Brazil 12.14 -15.9
10 Iran 11.44 11.1 Total Top 10 625.14 -3.5 Total World 728.72 -5.2
Source: worldsteel
• World crude steel production was led by China in January-May 2020 (411.75 mt, up by 1.9% yoy) and the nation accounted for 77% of Asian and 57% of world crude steel production during this period.
• Japanese crude steel production (36.6 mt) was down by 13.4% yoy and the country continued to remain marginally ahead of India and was the 2nd largest crude steel producer in the world during this period.
• With a 5% share in total world production, India (35.85 mt) reported a yoy production decline of 24.6% during January – May 2020 and was the 3rd largest producer during this period.
• USA remained at the 4th largest spot, with production (31.33 mt), down by 15.5% yoy while Russia (29.85 mt, down by 1.3% yoy) was the 5th largest crude steel producer during this period.
• Crude steel production in the EU (28) countries during this period was 58.01 mt, down by 18% yoy.
• At 532.28 mt, Asian crude steel production was down by 2.4% yoy and the region accounted for 73% of world crude steel production during this period.
• The top 10 countries accounted for 86% of total world crude steel production during this period and saw production go down by 3.5% yoy.
GLOBAL CRUDE STEEL PRODUCTION
3
THE AMERICAS • Steel industry leaders have been quick to applaud efforts by the United States' Congress
and the White House to advance legislation to authorize a major infrastructure authorization bill. Media reports have highlighted that President Donald Trump was considering introducing a proposal for spending $1 trillion on infrastructure in an effort to boost the economy.
• The US ITC has decided to keep anti-dumping and countervailing duties against imports of light-walled rectangular pipe and tube from China, South Korea, Mexico and Turkey.
• Gerdau will restart its No. 2 blast furnace (BF) at the Ouro Branco mill, located in the south-eastern state of Minas Gerais on July 1, 2020.
• Mexican steelmaker Ahmsa has signed a non-binding framework agreement with steelmaker Villacero to structure an association that adds operational synergies and consolidates their capacity in steel production and processing.
ASIA • China’s rebar production returned to positive territory for the first time in 2020 as January-
May 2020 output reached 98.47 million tonnes (mt), up 1.3% yoy as per data from the National Bureau of Statistics.
• India has recommended antidumping duties of $222-$334/t on coated/plated tin mill flat rolled steel products from the European Union, Japan, South Korea and the US for five years. The recommendation are results of an investigation from local steelmakers, alleging dumping of the concerned products.
• India extended antidumping duties on hot-rolled stainless sheet from China, Malaysia and South Korea until December 4, 2020, as per the Ministry of Commerce and Industry release. The duties – ranging from $180/mt to $316/mt – on “Hot Rolled Flat Products of Stainless Steel-304 Grade” were first imposed on June 5, 2015, for a duration of five years.
• India’s JSW Steel expects the Dolvi Steel Works’ expansion to 10 mtpa to come on stream over H2 FY 2021, after the project’s startup was initially postponed from September 2019 to March 2020, and thereafter due to the COVID-19 pandemic.
• Japan’s Nippon Steel intends to reline the No. 3 blast furnace at its Nagoya Works over the first half of 2022, boosting its capacity to 4,425 cu m from 4,300 cu m, at a cost of around Yen 49 billion ($448.6 million).
• South Korea’s Hyundai Steel has shut an EAF indefinitely at its Dangjin steel complex in South Chungcheong province due to poor steel demand. The company’s EAF in Dangjin, notwithstanding its three blast furnaces in the same complex, was melting scrap to produce flat steel, with an estimated 1 mtpa of production capacity.
• Malaysia’s Lion Industries Corp. and its 99% subsidiary Amsteel Mills plans to sell the hot-briquetted iron plant at Labuan via a 100% stake sale in Antara Steel Mills to Singapore’s Esteel Enterprise.
• Indonesia’s Krakatau Steel will supply 53,600 tonnes of HRC to Pertamina Gas, or Pertagas, before the end of 2021 to produce pipe for the construction of the 370 km Rokan block pipeline in Riau, which is expected to be completed over the second half of 2021. It
NEWS AROUND THE WORLD

4
also expects to complete the construction of a new blast furnace in Cilegon, Banten by the end of June, but has no plans to fire it up immediately.
RUSSIA, MID-EAST, AFRICA, AUSTRALIA • MMK is completing the long-term re-construction of the 2,500 mm HSM at its Uralsbased
Magnitogorsk Iron and Steel Works. The upgraded mill will roll more products in terms of gauges, steel grade variety and total quantity, with overall capacity increased by 18%.
• Saudi Arabia has decided to increase import duties on various semi-finished and finished iron and steel products to between 10% and 20% of product value, from earlier levels of 5% to 10%, depending on product specifications. The country has excluded Gulf producers from the new tariffs list and the increased duties are valid only on non-GCC producers effective June 20.
• GFG Alliance has announced a revamped plan for its Whyalla steel mill in Australia, including the addition of an EAF and a DRI facility in order to achieve its plan “to become the world’s largest carbon-neutral steel producer by 2030.”
EU AND OTHER EUROPE • Eurofer has asked the EU steel trade policy to shift into “a crisis mode” in response to the
50% drop in steel demand since the start of the COVID-19 pandemic. The statement was Eurofer’s response to the changes in the European steel import safeguard system, proposed by the European Commission. The new solutions by the EC are insufficient and “unhelpful” in tackling the sharp decline in steel demand, as per a release from the Eurofer.
• Eurofer has filed a complaint with the European Commission requesting a countervailing duty (CVD) investigation against HRC imports from Turkey, claiming that Turkish flat steel producers are benefiting from government incentives like Eximbank programs, tax and investment supports and electricity, natural gas and water cost discounts.
• Flat steel product shipments from EU steel service centers fell by 18.5% yoy in January-April 2020, in response to the COVID-19 pandemic effect.
• UK steel producers are seeking government support as the industry has been hit hard by the coronavirus pandemic. So far requests from all major UK steel producers are approaching a total of GBP 1 billion ($1.23 billion) in government-supported loans.
• Turkey has informed the WTO that custom duties could be imposed on steel imports from the EU, in response to the EU’s imposition of additional measures against imports of Turkish steel.
• Turkey is continuing to take measures to restrict import volumes to ease the impact of the COVID-19 pandemic and has now raised the unit customs value on some welded steel pipe qualities within the scope of import surveillance implementation.
• Turkey’s largest integrated steel producer, Erdemir could reach full capacity in the coming weeks, depending upon market conditions, as the company’s Iskenderunbased mill, Isdemir, restarted production at one of its blast furnaces following maintenance work, as per a company press release.
[Source Credit: Metal Bulletin, Platts, leading news papers (India news)]
5
H1 2020 continued to reel under the depressing effect of the COVID-19 pandemic as it raged across all the major steel markets around the world, causing an overall weakening of the entire economic framework. As nations struggled to combat the fast-spreading deadly menace with no cure so far and as steel makers, shaking off its gloom, tried to balance a stringent supply with near-dry demand, the severe state of affairs went on to affect steel prices as well. Like always, China remained a sole spot of exception, where some semblance of normalcy in market operations noted earlier, continued to be in place during June 2020 also. But elsewhere, the situation remained dismal with industry-economy in tight combat mode to control the fast-spreading pandemic.
Long Product • June 2020 rebar prices in the USA remained steady, dampened by low volume of
transactions due to low demand conditions in view of the pandemic. Transactions, as per Metal Bulletin reports, were quoted around $575/s.t.
• China’s June 2020 rebar prices showed a marginal softening in view of slow demand conditions as Tangshan announced a new round of restrictions for July. Transactions, as per Metal Bulletin reports, were quoted around 3,510-3,540 yuan/t ($496-500) in Shanghai.
• June 2020 rebar prices in the EU remained stable but largely static, dampened like everywhere by low demand levels. Transactions, as per Metal Bulletin reports, were quoted around €410-425/t ($463-480) in Southern Europe and €440-460/t in Northern Europe.
• With demand shooting past supply, June 2020 saw Russian rebar prices head north. Transactions, as per Metal Bulletin reports, were quoted around 34,000 roubles/t cpt Moscow, including 20% VAT.
Flat Product • June 2020 HRC prices in the USA moved south, falling to their lowest point in previous
two months, impacted by dampened market sentiments due to the large-scale effect of the pandemic. Transactions, as per Metal Bulletin reports, were quoted around $470/t.
• HRC prices in the EU sank to new lows in June 2020 as demand continued to elude markets. Transactions, as per Metal Bulletin reports, were quoted around €397/t ($446) in Northern Europe and around €375-380/t in Southern Europe.
• Chinese HRC prices slipped in June 2020 due largely to slow trading, affected by floods in various parts of the country. Transactions, as per Metal Bulletin reports were quoted around 3,710-3,730 yuan/t ($524-527) in Shanghai at month-end.
• Russian HRC prices remained largely static in June 2020, passing through what analysts point as a slow recovery. Transactions, as per Metal Bulletin reports, were quoted around 39,000-40,500 roubles/t ($562-584) for HR sheet, cpt Moscow, including 20% VAT.
[Source Credit: Metal Bulletin]
WORLD STEEL PRICE TRENDS
6
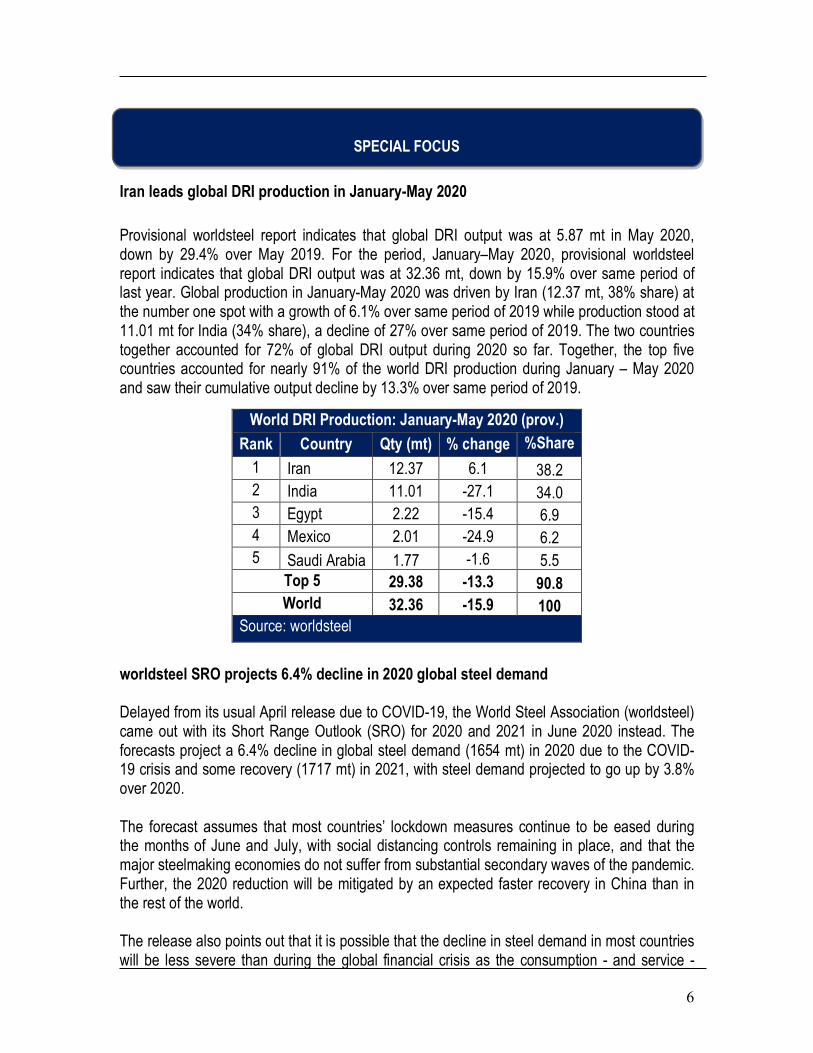
Iran leads global DRI production in January-May 2020 Provisional worldsteel report indicates that global DRI output was at 5.87 mt in May 2020, down by 29.4% over May 2019. For the period, January–May 2020, provisional worldsteel report indicates that global DRI output was at 32.36 mt, down by 15.9% over same period of last year. Global production in January-May 2020 was driven by Iran (12.37 mt, 38% share) at the number one spot with a growth of 6.1% over same period of 2019 while production stood at 11.01 mt for India (34% share), a decline of 27% over same period of 2019. The two countries together accounted for 72% of global DRI output during 2020 so far. Together, the top five countries accounted for nearly 91% of the world DRI production during January – May 2020 and saw their cumulative output decline by 13.3% over same period of 2019. worldsteel SRO projects 6.4% decline in 2020 global steel demand Delayed from its usual April release due to COVID-19, the World Steel Association (worldsteel) came out with its Short Range Outlook (SRO) for 2020 and 2021 in June 2020 instead. The forecasts project a 6.4% decline in global steel demand (1654 mt) in 2020 due to the COVID-19 crisis and some recovery (1717 mt) in 2021, with steel demand projected to go up by 3.8% over 2020. The forecast assumes that most countries’ lockdown measures continue to be eased during the months of June and July, with social distancing controls remaining in place, and that the major steelmaking economies do not suffer from substantial secondary waves of the pandemic. Further, the 2020 reduction will be mitigated by an expected faster recovery in China than in the rest of the world. The release also points out that it is possible that the decline in steel demand in most countries will be less severe than during the global financial crisis as the consumption - and service -
World DRI Production: January-May 2020 (prov.) Rank Country Qty (mt) % change %Share
1 Iran 12.37 6.1 38.2 2 India 11.01 -27.1 34.0 3 Egypt 2.22 -15.4 6.9 4 Mexico 2.01 -24.9 6.2 5 Saudi Arabia 1.77 -1.6 5.5
Top 5 29.38 -13.3 90.8 World 32.36 -15.9 100
Source: worldsteel
SPECIAL FOCUS
7
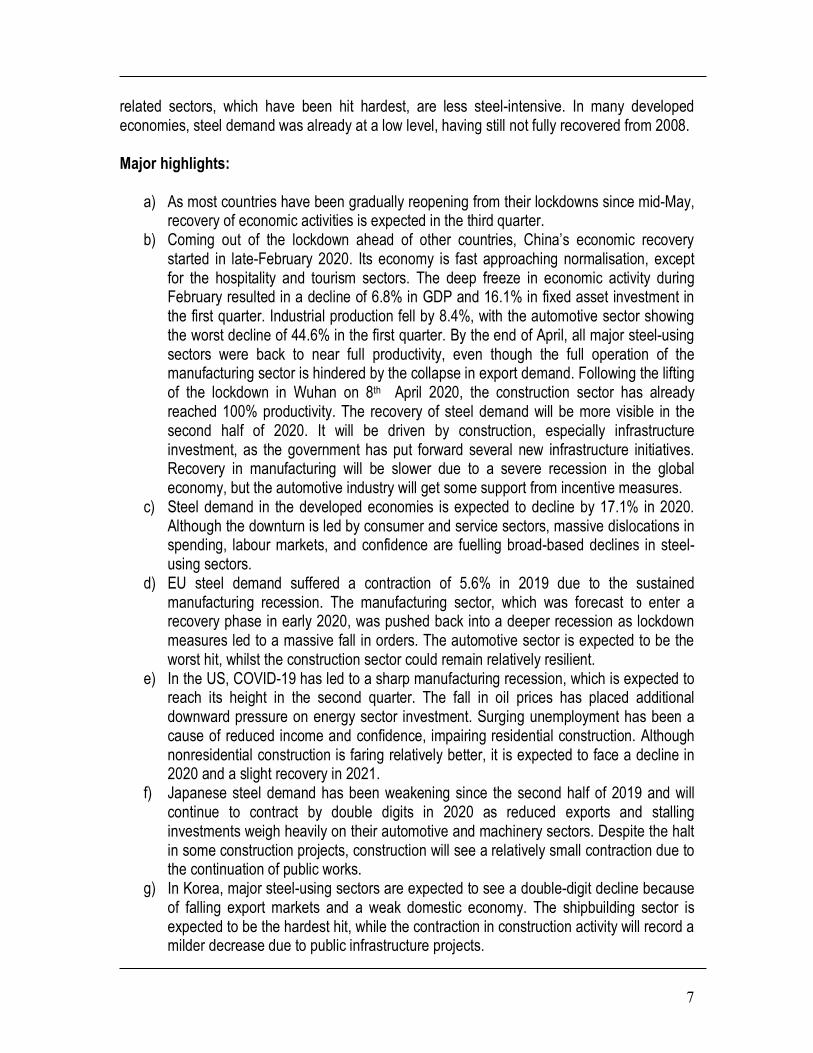
related sectors, which have been hit hardest, are less steel-intensive. In many developed economies, steel demand was already at a low level, having still not fully recovered from 2008. Major highlights:
a) As most countries have been gradually reopening from their lockdowns since mid-May, recovery of economic activities is expected in the third quarter.
b) Coming out of the lockdown ahead of other countries, China’s economic recovery started in late-February 2020. Its economy is fast approaching normalisation, except for the hospitality and tourism sectors. The deep freeze in economic activity during February resulted in a decline of 6.8% in GDP and 16.1% in fixed asset investment in the first quarter. Industrial production fell by 8.4%, with the automotive sector showing the worst decline of 44.6% in the first quarter. By the end of April, all major steel-using sectors were back to near full productivity, even though the full operation of the manufacturing sector is hindered by the collapse in export demand. Following the lifting of the lockdown in Wuhan on 8th April 2020, the construction sector has already reached 100% productivity. The recovery of steel demand will be more visible in the second half of 2020. It will be driven by construction, especially infrastructure investment, as the government has put forward several new infrastructure initiatives. Recovery in manufacturing will be slower due to a severe recession in the global economy, but the automotive industry will get some support from incentive measures.
c) Steel demand in the developed economies is expected to decline by 17.1% in 2020. Although the downturn is led by consumer and service sectors, massive dislocations in spending, labour markets, and confidence are fuelling broad-based declines in steel-using sectors.
d) EU steel demand suffered a contraction of 5.6% in 2019 due to the sustained manufacturing recession. The manufacturing sector, which was forecast to enter a recovery phase in early 2020, was pushed back into a deeper recession as lockdown measures led to a massive fall in orders. The automotive sector is expected to be the worst hit, whilst the construction sector could remain relatively resilient.
e) In the US, COVID-19 has led to a sharp manufacturing recession, which is expected to reach its height in the second quarter. The fall in oil prices has placed additional downward pressure on energy sector investment. Surging unemployment has been a cause of reduced income and confidence, impairing residential construction. Although nonresidential construction is faring relatively better, it is expected to face a decline in 2020 and a slight recovery in 2021.
f) Japanese steel demand has been weakening since the second half of 2019 and will continue to contract by double digits in 2020 as reduced exports and stalling investments weigh heavily on their automotive and machinery sectors. Despite the halt in some construction projects, construction will see a relatively small contraction due to the continuation of public works.
g) In Korea, major steel-using sectors are expected to see a double-digit decline because of falling export markets and a weak domestic economy. The shipbuilding sector is expected to be the hardest hit, while the contraction in construction activity will record a milder decrease due to public infrastructure projects.

8
h) The developing economies are less well equipped to tackle COVID-19 than the developed economies, with inadequate health capacity leading to stricter lockdown measures in some countries. Limited fiscal space to support the economy, a fall in commodity prices, capital flight and currency depreciation render the decline of steel demand in some developing countries as severe as that in developed economies. Steel demand in the developing economies excluding China is expected to fall by 11.6% in 2020, but will see a substantial recovery of 9.2% in 2021.
i) India has implemented the most stringent nationwide lockdown measures in the world, bringing industrial operations to a standstill. Construction activity was halted entirely at the end of March, and recovery is expected to remain slow due to the slow return of labour. Supply chain disruption coupled with slower demand recovery will hit the automotive sector hard. The machinery sector is expected to see a continued decline, with weak private investment and supply chain disruption. Supported by government stimulus, recovery in construction will be led by infrastructure investment such as railways. The government’s support to rural income, as well as expected consumption related to the upcoming festive season, will help a substantial recovery of demand for consumption-driven manufacturing goods in the second half. As a result, India is likely to face an 18.0% decline in steel demand in 2020, which will rebound by 15.0% in 2021.
World Apparent Steel Use
Zones Qty (mt) % year-on-year change 2019 2020 (f) 2021 (f) 2019 2020 (f) 2021 (f)
EU (28) 158.1 133.1 147.0 -5.6 -15.8 10.4 Other Europe 33.8 33.3 36.5 -10.0 -1.6 9.7 CIS 58.8 52.7 56.5 5.6 -10.3 7.1 NAFTA 135.0 108.0 114.7 -4.0 -20.0 6.2 Central / South America 42.4 35.1 39.3 -3.6 -17.3 12.2 Africa 36.4 33.0 34.9 0.4 -9.4 5.9 Middle East 48.7 40.2 45.4 -2.3 -17.4 12.9 Asia and Oceania 1253.3 1218.6 1243.2 6.5 -2.8 2.0 World 1766.5 1653.9 1717.4 3.4 -6.4 3.8 Source: Short Range Outlook, June 2020, World Steel Association; f=forecast
The following is a status report on the performance of Indian steel industry during April-May 2020-21, based on provisional data released by Joint Plant Committee (JPC) in its MIS Report for April-May 2020-21. It is to be noted that total finished steel includes both non-alloy and alloy (including stainless steel) and all comparisons are made with regard to same period of last year.
INDIAN STEEL MARKET ROUND-UP

9
Item Performance of Indian steel industry April-May
2020-21* (mt) April-May
2019-20 (mt) %
change* Crude Steel Production 9.011 18.489 -51.3 Hot Metal Production 7.745 12.434 -37.7 Pig Iron Production 0.372 1.041 -64.3 Sponge Iron Production 1.946 6.333 -69.3
Total Finished Steel (alloy/stainless + non-alloy) Production 6.138 17.718 -65.4 Import 0.946 1.174 -19.4 Export 1.714 0.974 75.9 Consumption 5.091 16.184 -68.5 Source: JPC; *provisional; mt=million tonnes
Overall Production • Crude Steel: Production at 9.011 million tonnes (mt), down by 51.3%. • Hot Metal: Production at 7.745 mt, down by 37.7%. • Pig Iron: Production at 0.372 mt, down by 64.3%. • Sponge Iron: Production at 1.946 mt, down by 69.3%, led by coal-based route
(73% share). • Total Finished Steel: Production at 6.138 mt, down by 65.4%.
Contribution of Other Producers
• Crude Steel: SAIL, RINL, TSL Group, AM/NS (erstwhile Essar Steel), JSWL & JSPL together produced 7.188 mt (80% share) during this period, down by 36.1%. The rest (1.823 mt) came from the Other Producers, down by 74.8%.
• Hot Metal: SAIL, RINL, TSL Group, AM/NS, JSWL & JSPL together produced 7.148 mt (92% share) down by 35.2%. The rest (0.597 mt) came from the Other Producers, down by 57.7%.
• Pig Iron: SAIL, RINL, TSL Group, AM/NS, JSWL & JSPL together produced 0.263 mt (71% share) up by 10.4%. The rest (0.109 mt) came from the Other Producers, down by 86.4%.
• Total Finished Steel: SAIL, RINL, TSL Group, AM/NS, JSWL & JSPL together produced 4.698 mt (77% share) down by 54.1%. The rest (1.441 mt) came from the Other Producers, down by 80.7%.
Contribution of Public Sector Units (PSU)
• Crude Steel: With 78% share, the Private Sector (7.024 mt, down by 53.3%) led crude steel production compared to the 22% contribution of the PSUs.
• Hot Metal: With 72% share, the Private Sector (5.593 mt, down by 35.2%) led hot metal production, compared to the 28% contribution of the PSUs.
• Pig Iron: With 76% share, the Private Sector (0.283 mt, down by 68.5%) led pig iron production, compared to the 24% contribution of the PSUs.
10
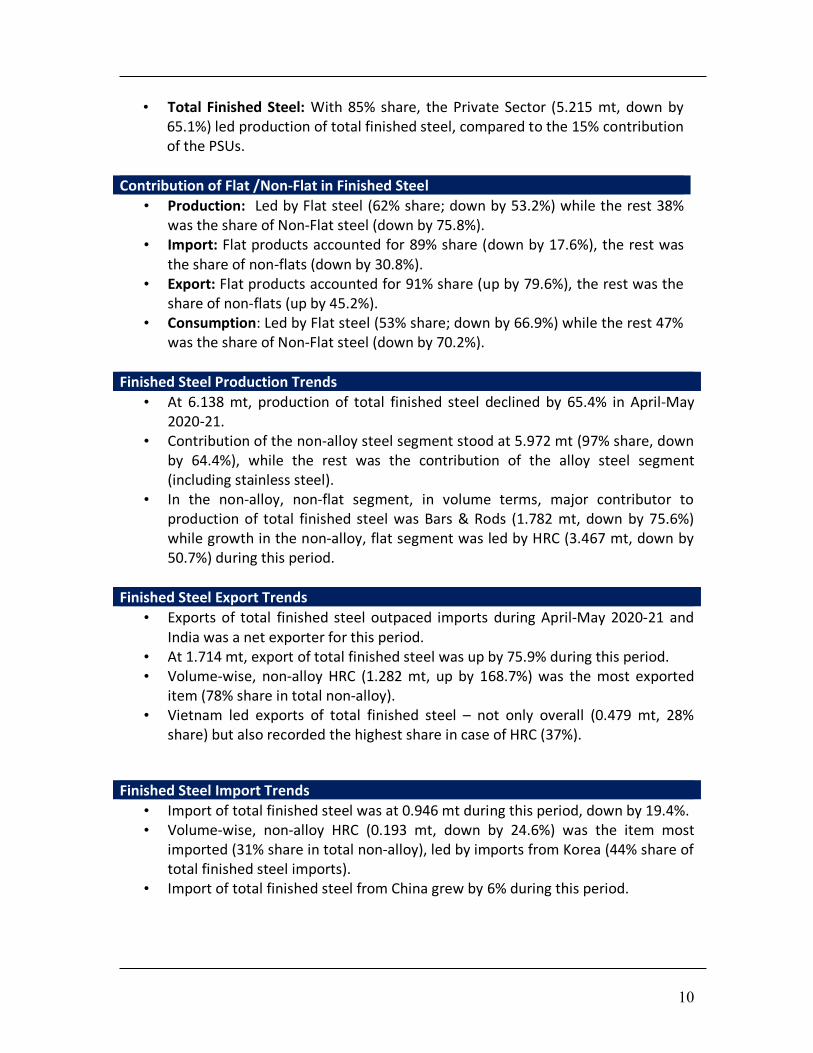
• Total Finished Steel: With 85% share, the Private Sector (5.215 mt, down by 65.1%) led production of total finished steel, compared to the 15% contribution of the PSUs.
Contribution of Flat /Non-Flat in Finished Steel • Production: Led by Flat steel (62% share; down by 53.2%) while the rest 38%
was the share of Non-Flat steel (down by 75.8%). • Import: Flat products accounted for 89% share (down by 17.6%), the rest was
the share of non-flats (down by 30.8%). • Export: Flat products accounted for 91% share (up by 79.6%), the rest was the
share of non-flats (up by 45.2%). • Consumption: Led by Flat steel (53% share; down by 66.9%) while the rest 47%
was the share of Non-Flat steel (down by 70.2%).
Finished Steel Production Trends • At 6.138 mt, production of total finished steel declined by 65.4% in April-May
2020-21. • Contribution of the non-alloy steel segment stood at 5.972 mt (97% share, down
by 64.4%), while the rest was the contribution of the alloy steel segment (including stainless steel).
• In the non-alloy, non-flat segment, in volume terms, major contributor to production of total finished steel was Bars & Rods (1.782 mt, down by 75.6%) while growth in the non-alloy, flat segment was led by HRC (3.467 mt, down by 50.7%) during this period.
Finished Steel Export Trends • Exports of total finished steel outpaced imports during April-May 2020-21 and
India was a net exporter for this period. • At 1.714 mt, export of total finished steel was up by 75.9% during this period. • Volume-wise, non-alloy HRC (1.282 mt, up by 168.7%) was the most exported
item (78% share in total non-alloy). • Vietnam led exports of total finished steel – not only overall (0.479 mt, 28%
share) but also recorded the highest share in case of HRC (37%).
Finished Steel Import Trends • Import of total finished steel was at 0.946 mt during this period, down by 19.4%. • Volume-wise, non-alloy HRC (0.193 mt, down by 24.6%) was the item most
imported (31% share in total non-alloy), led by imports from Korea (44% share of total finished steel imports).
• Import of total finished steel from China grew by 6% during this period.
11
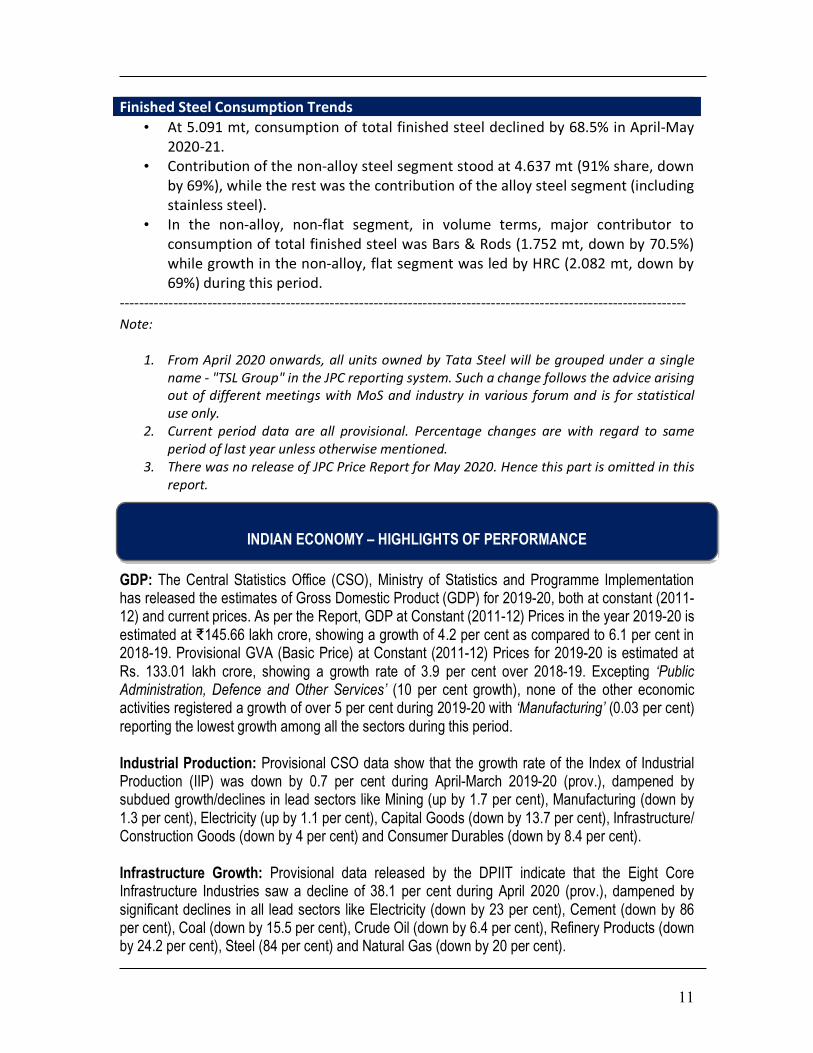
Finished Steel Consumption Trends • At 5.091 mt, consumption of total finished steel declined by 68.5% in April-May
2020-21. • Contribution of the non-alloy steel segment stood at 4.637 mt (91% share, down
by 69%), while the rest was the contribution of the alloy steel segment (including stainless steel).
• In the non-alloy, non-flat segment, in volume terms, major contributor to consumption of total finished steel was Bars & Rods (1.752 mt, down by 70.5%) while growth in the non-alloy, flat segment was led by HRC (2.082 mt, down by 69%) during this period.
-------------------------------------------------------------------------------------------------------------------- Note:
1. From April 2020 onwards, all units owned by Tata Steel will be grouped under a single name - "TSL Group" in the JPC reporting system. Such a change follows the advice arising out of different meetings with MoS and industry in various forum and is for statistical use only.
2. Current period data are all provisional. Percentage changes are with regard to same period of last year unless otherwise mentioned.
3. There was no release of JPC Price Report for May 2020. Hence this part is omitted in this report.
GDP: The Central Statistics Office (CSO), Ministry of Statistics and Programme Implementation has released the estimates of Gross Domestic Product (GDP) for 2019-20, both at constant (2011-12) and current prices. As per the Report, GDP at Constant (2011-12) Prices in the year 2019-20 is estimated at ₹145.66 lakh crore, showing a growth of 4.2 per cent as compared to 6.1 per cent in 2018-19. Provisional GVA (Basic Price) at Constant (2011-12) Prices for 2019-20 is estimated at Rs. 133.01 lakh crore, showing a growth rate of 3.9 per cent over 2018-19. Excepting ‘Public Administration, Defence and Other Services’ (10 per cent growth), none of the other economic activities registered a growth of over 5 per cent during 2019-20 with ‘Manufacturing’ (0.03 per cent) reporting the lowest growth among all the sectors during this period. Industrial Production: Provisional CSO data show that the growth rate of the Index of Industrial Production (IIP) was down by 0.7 per cent during April-March 2019-20 (prov.), dampened by subdued growth/declines in lead sectors like Mining (up by 1.7 per cent), Manufacturing (down by 1.3 per cent), Electricity (up by 1.1 per cent), Capital Goods (down by 13.7 per cent), Infrastructure/ Construction Goods (down by 4 per cent) and Consumer Durables (down by 8.4 per cent). Infrastructure Growth: Provisional data released by the DPIIT indicate that the Eight Core Infrastructure Industries saw a decline of 38.1 per cent during April 2020 (prov.), dampened by significant declines in all lead sectors like Electricity (down by 23 per cent), Cement (down by 86 per cent), Coal (down by 15.5 per cent), Crude Oil (down by 6.4 per cent), Refinery Products (down by 24.2 per cent), Steel (84 per cent) and Natural Gas (down by 20 per cent).
INDIAN ECONOMY – HIGHLIGHTS OF PERFORMANCE
12
Inflation: In March 2020 (prov.), the annual rate of inflation, based on monthly WPI, stood at 1 per cent while the all India CPI inflation rate (combined) stood at 5.91 per cent and compared to March 2019, the former registered a decline, and the latter, a rise. Trade: Provisional figures from DGCI&S show that during April-May 2020, in dollar terms, overall exports were down by 47.54 per cent while overall imports were down by 54.67 per cent, both on yoy basis. During the same period, oil imports were valued at USD 8.15 billion, 65.79 per cent lower yoy while non-oil imports were valued at USD 31.17 billion, 50.46 per cent lower yoy. Overall trade deficit for April-May 2020 is estimated at USD 4.37 billion as compared to USD 17.84 billion in same period of 2019. Prepared by: Joint Plant Committee